Embed Size (px)
Citation preview

NEW MARYLAND LAW HB 1045 – MBR IS SHAPING THE FUTURE OF LARGE SYSTEM
SUBSURFACE DISPOSAL
Ms. Amy M. Parrish, L.E.H.S., P.G.
www.alwi.com410-795-4626

February 2, 2017 Google Earth Aerial
October 23, 2014 Google Earth Aerial
HB 1045 - MOTIVATION

March 12, 2017 Google Earth Aerial
September 23, 2007 Google Earth Aerial
HB 1045 - MOTIVATION

HB 1045 – LEGISLATIVE PROCESS
• Introduced to House of Delegates on February 8, 2017
• Environment and Transportation Committee
• Stakeholders – Delegate Cassilly, Kershner Environmental Technologies, ALWI, Chesapeake Bay Foundation
• No Opposition. MDE Sought Amendments.
• Amendments Adopted. House and Senate Passed with Zero “No” Votes.
• Law Takes Effect July 1, 2017


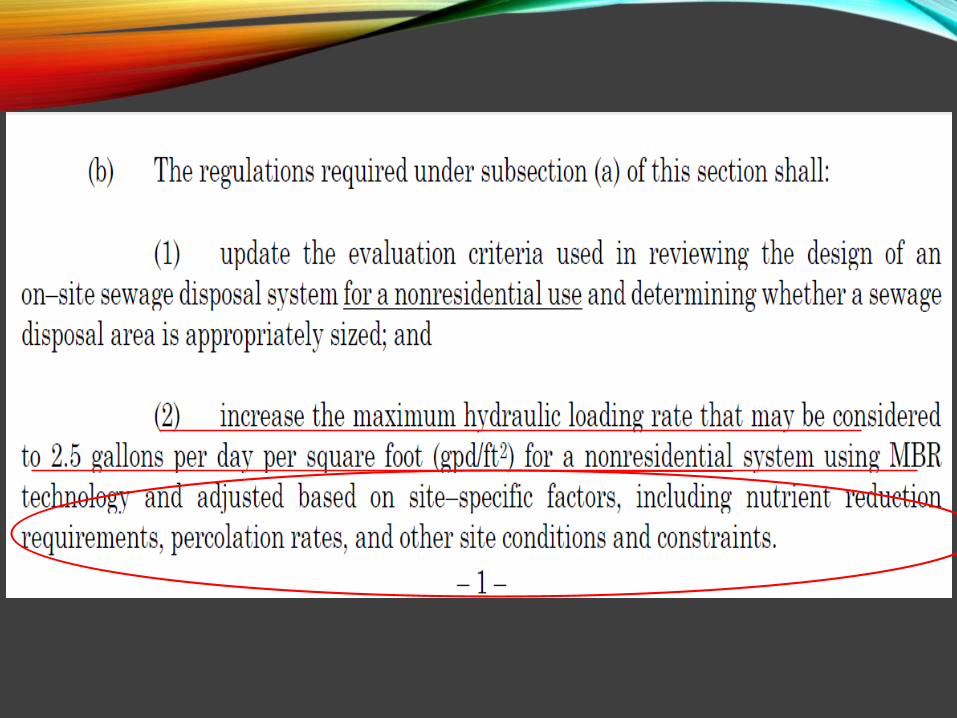

OUTLINE 1. Overview of the MBR Law – HB 1045
2. Treatment Technology Discussion – Compare and Contrast MBR to Other Conventional Technologies
3. On-site Sewage Disposal System - Site Evaluation Criteria
4. Percolation Test and Evolution of Hydraulic Loading Rate
5. Effluent Clogging and the Influence on Hydraulic Loading
6. Other Factors to Consider – Groundwater Mounding
7. Conclusions

MBR FILTRATION TECHNOLOGY• Activated Sludge Process
• Membranes for Liquid-Solid Separation
• No Settlement Process
• Size of Filters Varies
• Micro-Filtration (4-log)
• Ultra-Filtration (6-log)
• Disinfection - Reuse

From directindustry.com
From mottmac.com
MBR MEDIA EXAMPLES
From membraneprocess.com
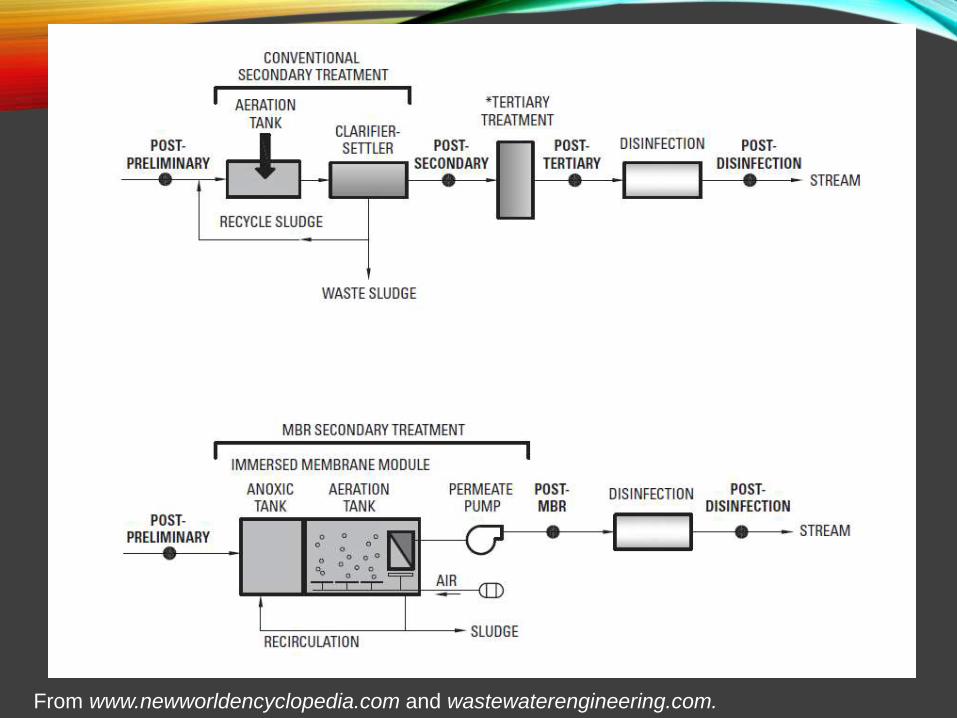
From www.newworldencyclopedia.com and wastewaterengineering.com.

https://innovatreat.com/wp-
content/uploads/2016/10/miniMBR_
Brochure_9_24_2016.pdf.
www.researchgate.net
MINI MBR – OSDS APPLICATIONS

Parameter
Wastewater Strength
Septic Tank Effluent[a][b][c] BAT[b][c] MBR[a][b][d]
Biological Oxygen Demand
150 - 300 30 1 - 2
Total Suspended Solids
170 - 250 30 1 - 3
Total Nitrogen 60 50% reduction >90% reduction
Fecal 106 to 109 103 to 104 4-log (99.99%) 6-log (99.9999%)
a. EPA. 2007. Wastewater Management Fact Sheet Membrane Bioreactors.
b.MDE. 2015. Best Available Technology Classification Definitions; MDE Discharge Permit Limits.
c.http://www.chesapeake.org/stac/presentations/224_3BRubin_Overview%20of%20Best%20Available%20Technologies%20for%20Onsite%20Septic.pdf.
d. http://halosil.com/blog/what-are-logs-and-why-do-they-matter-in-preventing-infections.
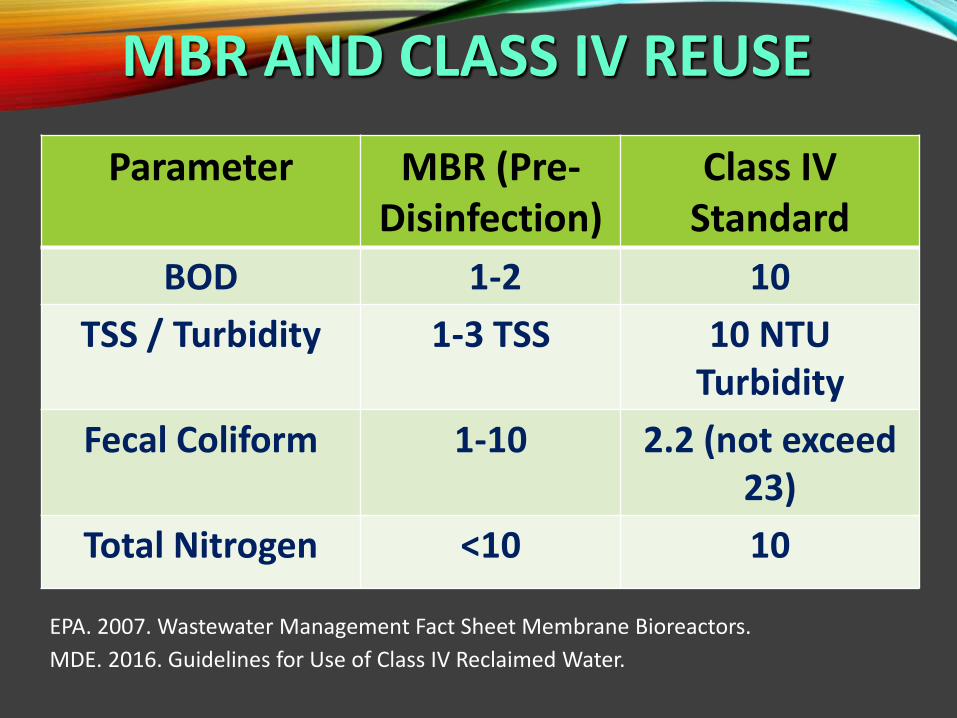
MBR AND CLASS IV REUSE
Parameter MBR (Pre-Disinfection)
Class IV Standard
BOD 1-2 10
TSS / Turbidity 1-3 TSS 10 NTU Turbidity
Fecal Coliform 1-10 2.2 (not exceed 23)
Total Nitrogen <10 10
EPA. 2007. Wastewater Management Fact Sheet Membrane Bioreactors.
MDE. 2016. Guidelines for Use of Class IV Reclaimed Water.
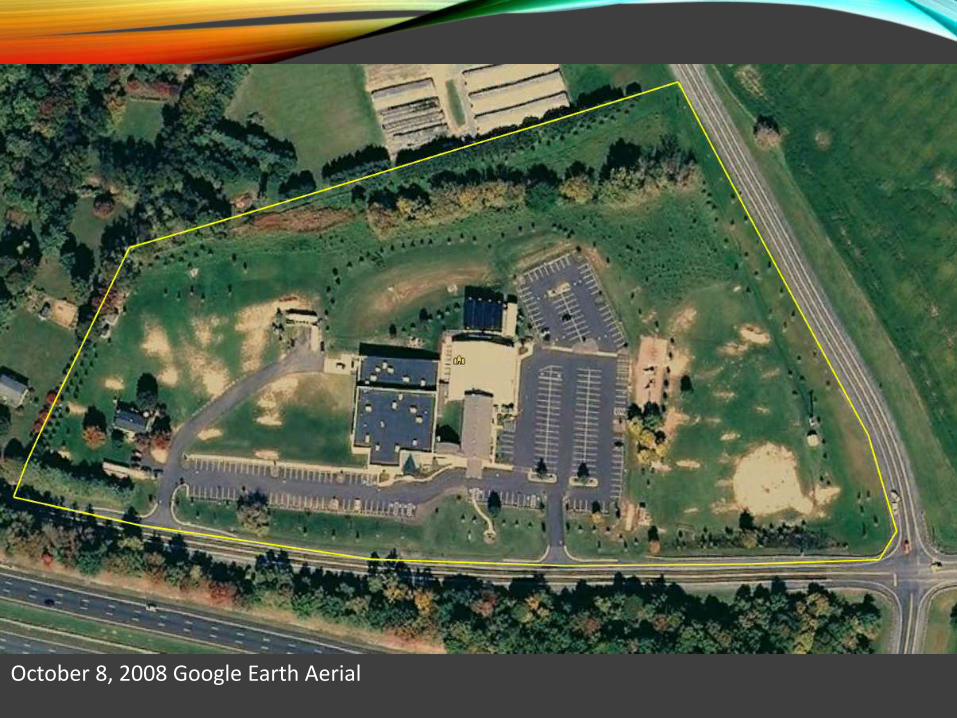
October 8, 2008 Google Earth Aerial

SITE EVALUATION CRITERIA• COMAR 26.04.02
• Site Evaluation – landscape position; setbacks to features
• Soil Description / Morphology
• Identify Limiting Conditions
• 4-Foot Treatment (or less)
• Percolation Test – for better or for worse

IMPERMEABLE ROCK

ROCK W/ OPEN JOINTS
http://www.progressivevit.com/evaluating-
vineyard-soils-in-trenches/

SEASONAL SATURATION - PERCHING

PERENNIAL GROUNDWATER

SLOWLY PERMEABLE SOILS

By EdwinAmi - Own work, Public Domain, https://commons.wikimedia.org/w/index.php?curid=10678901https://commons.wikimedia.org/w/index.php?curid=10678952
Origin of Term “Tile Field"
http://www.gisagmaps.com/about-tile-mapping/

Source: McGauhey, P.H., G.T. Orlob, and J.H. Winneberger. (1958).
Tile Field Load Versus Percolation Rate

RYON PERCOLATION TEST• Emphasized adequate presoak
and saturation
• 6” of water and 1 ft square hole
min of 18 inches deep
• Falling head test
• Adopted by NY DOH
and later throughout the US

Percolation Rate[a]Loading Rate at Which
Wastewater Enters Soil[b]
2 – 5 mpi – Coarse to Medium Sand 1.2 (gpd/ft2)
6 – 15 mpi – Fine to Loamy Sand 0.8 (gpd/ft2)
16 – 30 mpi - Sandy Loam to Loam 0.6 (gpd/ft2)
RESIDENTIAL SYSTEM FLOWS <5000
a. EPA (2000) Decentralized Systems Technology Fact Sheet. Pub. 832-F-00-079.
b. COMAR 26.04.02.05K – Loading Rates for On-Site Sewage Disposal Systems.

Percolation Rate
Loading Rate at Which Wastewater
Enters Soil[a]
BAT / ATU
MBR /CLASS IV
2 – 5 mpi 0.8 1.2
Maximum is2.5 gpd/sf
6 – 15 mpi 0.6 0.9
16 – 30 mpi 0.4 0.6
LARGE SYSTEM FLOWS >5000
1.2
0.8
0.6
a. COMAR 26.04.02.05K – Loading Rates for On-Site Sewage Disposal Systems.

Tyler, Converse. 1994.
INITIAL CLOG LONG-TERM ACCEPTANCE FAIL
RestaurantSTE
DomesticSTE
Grey Water
Tap water
STEADY-STATE HYDRAULIC LOADING

TRENCH / TILE FIELD ANATOMY
EPA.1980. Design Manual Onsite Wastewater
Treatment and Disposal Systems.
1
EPA. 1980. Design Manual Onsite Wastewater Treatment And Disposal Systems. EPA 625/1-80-012.

SIDEWALL AND BOTTOM AREA FLOW
Finch, S.D, Radcliffe,D.E., West, L.T., 2008.Modeling TrenchSidewall and BottomFlow in On-SiteWastewater Systems.

CL SIDEWALL AND BOTTOM AREA FLOW
Finch, S.D, Radcliffe, D.E., West, L.T., 2008. Modeling Trench Sidewall and Bottom Flow in On-Site Wastewater Systems.

The standard unit for hydraulic conductivity is cubic foot
per day per square foot of aquifer cross-sectional area
(ft3/d)/ft2. The reduced form is feet per day (ft/d). Dividing
by 7.481 gallons per cubic foot gets us to a loading rate –
expressed in gpd/sf.
DARCY’S LAW
http://www.globalsecurity.org/military/library/policy/army/fm/5-484/fig2-9.gif.
Q = KiA
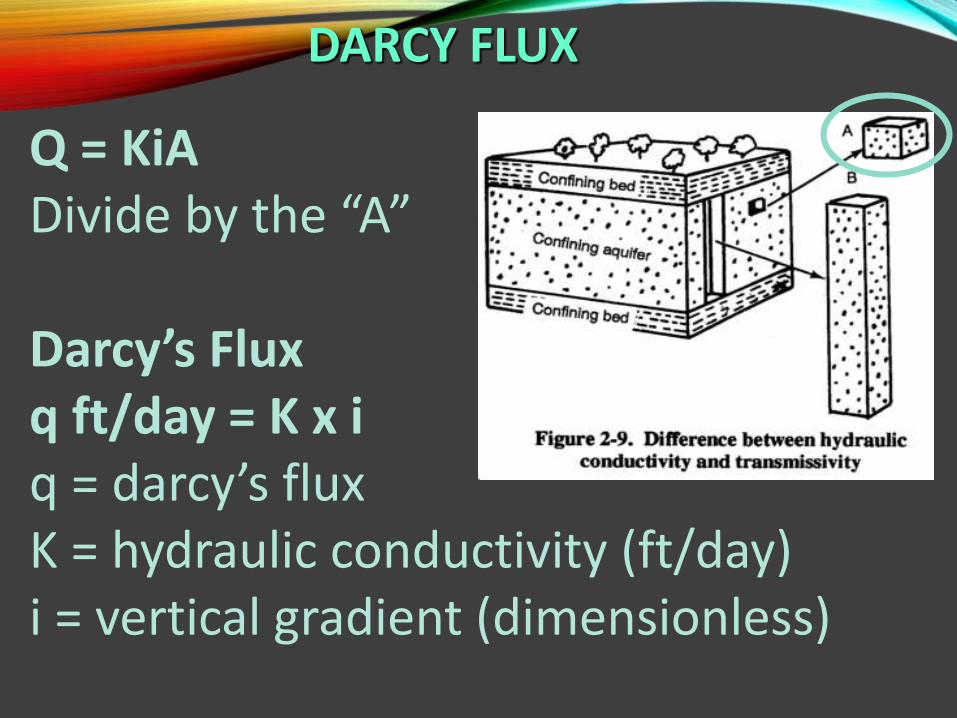
Q = KiADivide by the “A”
Darcy’s Fluxq ft/day = K x iq = darcy’s fluxK = hydraulic conductivity (ft/day)i = vertical gradient (dimensionless)
DARCY FLUX

qs = qc = Ks (ψm) = Kc Ho + ψm + ZcZc
qs = flux through the soilqc = flux through the clogging layerKs (ψm) = hydraulic conductivity of soil at the unsaturated soil moisture potential below the clogging layerKc = hydraulic conductivity of the clogging layerHo = Height of ponding in the aggregateψm = Matric potential of soil next to the clogging Zc = Thickness of the clogging layer
Source: Tyler and Converse. 1994. Soil Acceptance of Onsite Wastewater Affected by Soil Morphology and Wastewater Quality.
DARCY FLUX

CLOGGING INFLUENCES SOIL LOADING
Bouma, 1975 infiltration or flux through a clogging layer (qc) depends upon:
• Kc of clogging layer• height of ponding in the aggregate above clogging (Ho)
• thickness of clogging layer (Zc) • moisture potential in soil below the clogging layer (ψm).
qc = Kc Ho + ψm + Zc
Zc
* Increasing Kc allows an increase in soil loading** Decreasing Zc allows an increase in the soil loading

K AND SOIL MOISTURE PRESSURE (ψm)
Saturated soils have zero(or positive) soilmoisture pressures. Driersoils have greater(negative) pressurevalues and require moresuction to extract water.
The absence of a clogging layer allows the wastewater loading rate to be close to or equal to the Ks of the natural soil.
SATURATED UNSAT
Tyler and Converse. 1994. Soil Acceptance of Onsite Wastewater Affected by Soil Morphology and Wastewater Quality.

Tyler et al. (1991); Siegrist (1978b); Tyler and Converse (1994); U.S. EPA (1991).
SOIL DESCRIPTION
STEPTIC EFFLUENT(TYLER ET. AL. 1991)
SAND FILTER
(SIEGRIST, 1978)
SAND FILTER(TYLER, 1994)
SAT K (U.S. EPA,
1991)
Gravelly / Coarse Sand
0 0 0 >200
Moderate –Strong Platy
0 0 0 <1.2Firm or
Cemented
Clayey - Silty Massive or
Weak
COMPARING SOIL LOADING RATES

Tyler et al. (1991); Siegrist (1978b), Tyler and Converse (1994); U.S. EPA (1991).
SOIL DESCRIPTION
SEPTICEFFLUENT(TYLER ET. AL. 1991)
SAND FILTER
(SIEGRIST,1978)
SAND FILTER(TYLER, 1994)
SAT K (U.S. EPA
1991)
Loam - Massive
0.2 1.5 0.5 1.2Structured
Clays
Clay Loams –Weak Structure
COMPARING SOIL LOADING RATES

SOIL DESCRIPTION
SEPTIC (TYLER ET. AL. 1991)
SAND FILTER(SIEGRIST,
1978)
SAND FILTER(TYLER,1994)
SAT K (U.S. EPA,
1991)
Clay Loams-Mod or Strong
0.4 3.2 1.5 12 (24)Loam, Sandy or Silty – Weak
Fine Sands
Loam, Sandy or Silty – Mod
or Strong0.6 4.7 4.9 12
Sands 0.8 6 13 >200
COMPARING SOIL LOADING RATES
Tyler et al. (1991); Siegrist (1978b), Tyler and Converse (1994); U.S. EPA (1991).
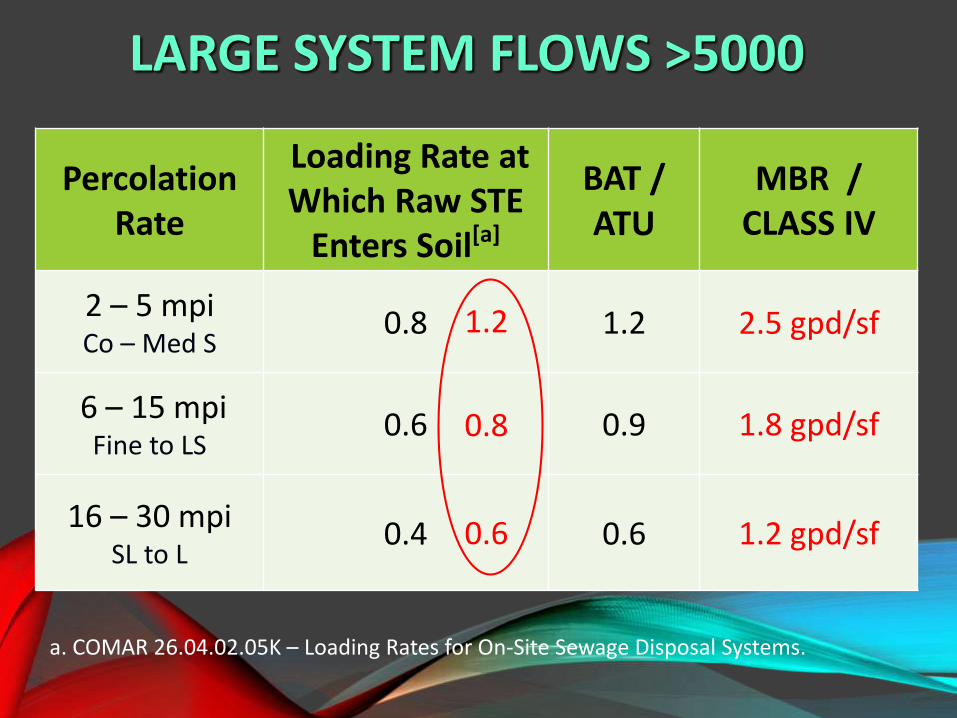
Percolation Rate
Loading Rate at Which Raw STE
Enters Soil[a]
BAT / ATU
MBR /CLASS IV
2 – 5 mpiCo – Med S
0.8 1.2 2.5 gpd/sf
6 – 15 mpiFine to LS
0.6 0.9 1.8 gpd/sf
16 – 30 mpiSL to L
0.4 0.6 1.2 gpd/sf
LARGE SYSTEM FLOWS >5000
1.2
0.8
0.6
a. COMAR 26.04.02.05K – Loading Rates for On-Site Sewage Disposal Systems.

GROUNDWATER

SUBSURFACE BORINGS / WELLS
• Aquifer Characterization
• Stratigraphic / Geologic Characterization
• Groundwater Elevation Monitoring
• Groundwater Quality Sampling

Well Design

The Pizza Pie

POST-DRILLING

HYDROGEOLOGIST BEST FRIEND

Maintain Adequate Treatment Zone
Groundwater Mounding

CONCLUSIONS• Adjust the loading rates for COMAR such that septic tank effluent
5,000 gpd systems rates are the same as their residential counterpart.
• MBR or Class IV allows for doubling of the BAT / ATU loading rates for given perc ranges.
• The drainfield area (and reserve area requirements) can be reduced by as much as half.
• Use of sidewall absorption is debatable, but more research may be needed to discredit the use of sidewall even in absence of clog layer.
• Vertical treatment zone separation standards remain as-is (no reduction afforded).
• Groundwater mounding evaluation is required.
REFERENCES
.
Code of Maryland Regulations 26.04.02.05K Loading Rates for On-Site SewageDisposal Systems.
Finch, S.D, Radcliffe, D.E., and West, L.T., 2008. Modeling Trench Sidewall andBottom Flow in On-Site Wastewater Systems. United States Department ofAgriculture Agricultural Research Service / University of Nebraska Lincoln
Maryland Department of the Environment. 2016. Guidelines for Use of Class IVReclaimed Water.
Maryland Department of the Environment. 2015. Best Available TechnologyClassification Definitions.
McGaughey, P.H., Orlob, G.T., and Winebrenner, J.H. 1958. A Study of theBiological Aspects of Failure of Septic Tank Percolation Fields – First ProgressReport. Report to F.H.A. Sanitation Engineering Research Laboratory, Universityof California Berkeley.
Siegrist, R.L. 1987. Hydraulic Loading Rates for Soil Absorption Systems Basedon Wastewater Quality. In: On-site Wastewater Treatment, Proceedings of theFifth National Symposium on Individual and Small Community SewageSystems. ASAE, St. Joseph, Michigan p 232-241.

REFERENCES
.
Tyler, E.J., Milner, M., and Converse, J.C. 1991. Wastewater Infiltration fromChamber and Gravel Systems. In: On-Site Wastewater Treatment, Proceedingsof the Sixth National Symposium on Individual and Small Community SewageSystems. ASAE, St. Joseph, Michigan p 214-222.
Tyler, E.J. and Converse, J.C. 1994. Soil Acceptance of Onsite Wastewater asAffected by Soil Morphology and Wastewater Quality. Small Scale WasteManagement Project #4.38.
United States Environmental Protection Agency. 2007. WastewaterManagement Fact Sheet Membrane Bioreactors.
United States Environmental Protection Agency. 2000. Decentralized SystemsTechnology Fact Sheet. Pub. 832-F-00-079.
United States Environmental Protection Agency. 1991. Description andSampling of Contaminated Soils. Rep. EPA/625/12-91/002.
United States Environmental Protection Agency. 1980. Design Manual OnsiteWastewater Treatment And Disposal Systems. EPA 625/1-80-012.

Phone: 410-795-4626
Fax: 410-795-4611
Online: www.alwi.com