Embed Size (px)
Citation preview

The “Better Business” Publication Serving the Exploration / Drilling / Production Industry
NOVEMBER 2010
By Dale Julander, Larry Knauer,
Jeffrey Little, Jason Aultman
and Jim Hemingway
BAKERSFIELD, CA.–A new petrophysical measurement is
casting new light on residual oil, especially in heavy crude
deposits in such areas as the San Joaquin Basin in
California. One might reasonably conclude that the San
Joaquin Basin was reaching the end of its productive life,
and few would have argued the point, because while the
basin is California’s most prolific oil producer, it was
discovered more than a century ago and heavy crude
deposits have largely been off the industry’s radar screen
for much of the past decade.
However, with strong crude oil prices relative to natural
gas on a Btu equivalent basis, operators are taking a fresh
look at mature oil provinces from the San Joaquin to the
Permian Basin. It is a new day for these mature assets, and
thanks to the ability to precisely measure the dielectric
permittivity parameter, the industry is getting a whole new
perspective on mature and heavy oil fields.
New Logging Technology
Brings New Perspective
To Mature Oil Fields
Reproduced for Schlumberger with permission from The American Oil & Gas Reporter www.aogr.com
Defined as the ability of an electromagnetic field to perme-ate geological formations, dielectric permittivity has been meas-ured by various logging devices for 30 years. The measurement’sbig advantage was its ability to discriminate hydrocarbons inthe presence of fresh water, and that single factor made the meas-urement ideal for San Joaquin Basin sands, many of which hadlow-gravity crude interspersed with waters of less than 20,000parts per million total dissolved solids.Early-generation dielectric tools had limitations. The prin-
ciple problem was that the tools were unable to produce accu-rate information in washed-out or rugose bore holes. Many California reservoirs consist of unconsolidated sand-
stones that have a tendency to wash out when they are drilled.In addition, many of the heavy oil fields in the region have beenproduced using steamflood techniques. This has created a dou-ble problem: The steam condensate had a different salinity thanthe native formation waters, and the steam injection causednonlinear geothermal gradients. The early mandrel tools haddifficulty in providing sufficient accuracy to produce quantifi-able interpretations.A second, more perplexing, problem was a parameter known
as dispersion. This refers to the nonlinear relationship of resis-tivity measurements depending on the frequency of the emit-ted measurement signal. Legacy electromagnetic permittivitydevices such as the electromagnetic propagation tool emitted asingle frequency of 1.1 gigahertz, which made it impossible toaccurately characterize dielectric dispersion. And since the ra-dial depth of investigation of the tool is frequency-dependentas well, it could not be determined how deep the measured sig-nal was looking if resistivity was unknown.Notwithstanding these limitations, the dielectric permittivi-
ty tool became a standard part of the logging suite used by mostSan Joaquin operators for many years.
New Measurement
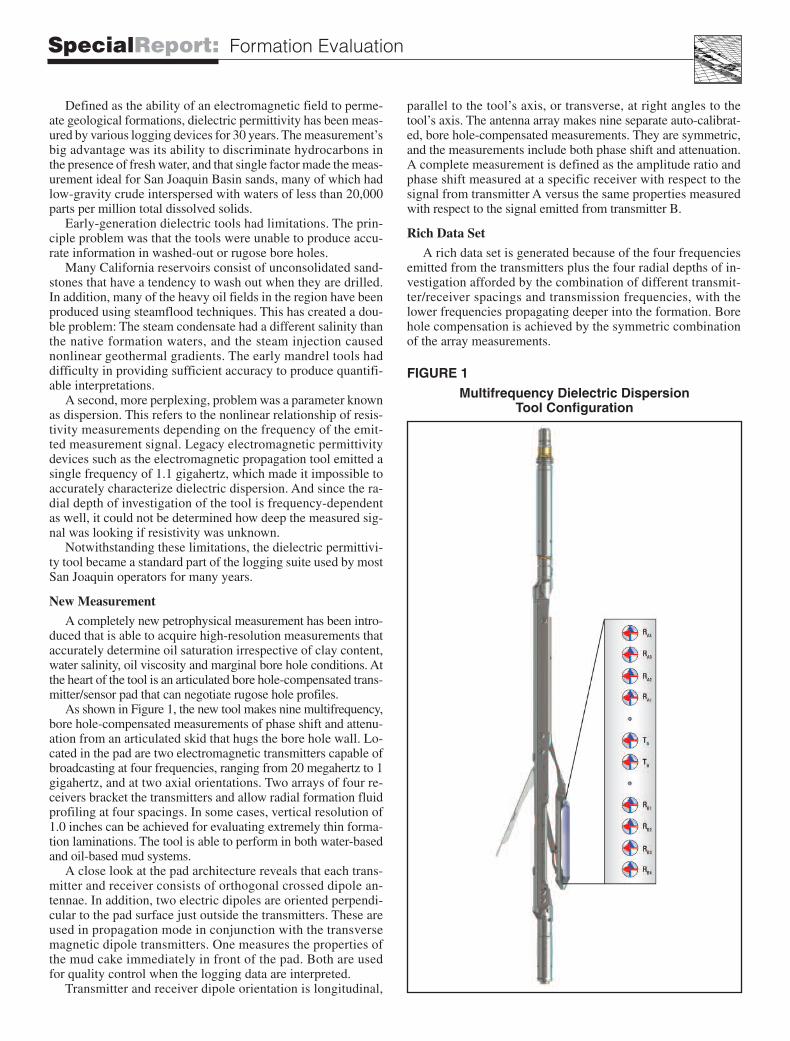
A completely new petrophysical measurement has been intro-duced that is able to acquire high-resolution measurements thataccurately determine oil saturation irrespective of clay content,water salinity, oil viscosity and marginal bore hole conditions. Atthe heart of the tool is an articulated bore hole-compensated trans-mitter/sensor pad that can negotiate rugose hole profiles.As shown in Figure 1, the new tool makes nine multifrequency,
bore hole-compensated measurements of phase shift and attenu-ation from an articulated skid that hugs the bore hole wall. Lo-cated in the pad are two electromagnetic transmitters capable ofbroadcasting at four frequencies, ranging from 20 megahertz to 1gigahertz, and at two axial orientations. Two arrays of four re-ceivers bracket the transmitters and allow radial formation fluidprofiling at four spacings. In some cases, vertical resolution of1.0 inches can be achieved for evaluating extremely thin forma-tion laminations. The tool is able to perform in both water-basedand oil-based mud systems.A close look at the pad architecture reveals that each trans-
mitter and receiver consists of orthogonal crossed dipole an-tennae. In addition, two electric dipoles are oriented perpendi-cular to the pad surface just outside the transmitters. These areused in propagation mode in conjunction with the transversemagnetic dipole transmitters. One measures the properties ofthe mud cake immediately in front of the pad. Both are usedfor quality control when the logging data are interpreted.Transmitter and receiver dipole orientation is longitudinal,
parallel to the tool’s axis, or transverse, at right angles to thetool’s axis. The antenna array makes nine separate auto-calibrat-ed, bore hole-compensated measurements. They are symmetric,and the measurements include both phase shift and attenuation.A complete measurement is defined as the amplitude ratio andphase shift measured at a specific receiver with respect to thesignal from transmitter A versus the same properties measuredwith respect to the signal emitted from transmitter B.
Rich Data Set
A rich data set is generated because of the four frequenciesemitted from the transmitters plus the four radial depths of in-vestigation afforded by the combination of different transmit-ter/receiver spacings and transmission frequencies, with thelower frequencies propagating deeper into the formation. Borehole compensation is achieved by the symmetric combinationof the array measurements.
FIGURE 1
Multifrequency Dielectric Dispersion Tool Configuration
SpecialReport: Formation Evaluation

In the petrophysical world, there exist four classic “zones aboutthe bore hole:” the mud cake, the flushed zone, the transition zoneand the virgin formation. One advantage of varying radial depthsof investigation is the ability to develop a radial resistivity profilethat can be related to fluid mobility. In heavy oil, the depth of inva-sion is frequently shallow and the measurement easily reaches thevirgin zone. On the other hand, in water zones, mud filtrate can in-vade more deeply because of the higher mobility of the water com-pared with that of the heavy oil. As a result, the electromagneticand geometric parameters can be related, allowing invasion pro-files to be derived irrespective of fluid salinity (resistivity).Since the multifrequency dielectric dispersion tool makes its
measurements at four frequencies, the dispersion pattern can becharacterized using a curve-fitting technique. In carbonates, theshape of dispersion is a function of two key factors: the cemen-tation factor and the saturation exponent. These factors are un-knowns in the Archie saturation relationship, and for more thanhalf a century, have affected the accuracy of saturation determi-nations. These characteristics are referred to as rock textural pa-rameters, and heretofore have not been possible to measure ex-cept in a laboratory. Similarly, in shaly sand, the dispersionmeasured is a function of the shale volume, which is a key inputin shaly sand saturation equations.
Lots Of Remaining Oil
In the heavy oil sands of the San Joaquin Basin, typical re-
covery ranges from 20 to 40 percent. This means that despiteyears of aggressive steamflooding, over half of the original oilin place remains to be produced. The problem is that the oilzones are concealed by freshwater zones. A standard triple com-bo log had been used, and because of the extremely low con-trast between the resistivity of oil-filled pores and those satu-rated with fresh water, it was difficult to differentiate betweenpay zones and wet zones, and consequently, to decide whichzones to complete.Typically, Kern River sands are unconsolidated fluvial de-
posits interrupted by silts and clays. Production has been foundas shallow as 50 feet and as deep as 1,600 feet. Average poros-ity is 31 percent and permeability ranges from 500 to 10,000milliDarcies. Oil with an API gravity of 12-13 degrees occursin a saturation range of 20 to 50 percent. Steamflooding com-menced in the 1960s to enhance production of the heavy crude.Today, about 9,600 Kern River wells produce a total of 77,000barrels of oil a day. Kern River cumulative production reachedthe 2 billion barrel mark in 2007.In the Kern River oil field, Chevron has been challenged pri-
marily to differentiate oil sands from freshwater sands, and sec-ondarily to find bypassed oil in steamflooded zones. Originalformation water salinity was less than 2,000 parts per million,but because of a half century of steamflooding, it is now con-siderably fresher. As a result, techniques for determining watersaturation using resistivity are unreliable.The company acquired conventional cores as well as side-
wall cores, and attempted to resolve the issue of fluid contactsand mobility using laboratory core analysis. Although accu-rate, this technique was both costly and time consuming. Car-bon-oxygen (CO) logging performed after casing was set did areasonable job of determining oil saturation, but was limitedto beds more than 18 inches thick at best.When the new Dielectric Scanner™ multifrequency dielec-
tric dispersion logging tool was added, the hydrocarbon-bearingzones were clearly indicated, making it easy to select intervalperforations. As shown in Figure 2, the multifrequency dielec-tric dispersion measurement clearly enables interpretation of thehydrocarbon zones from X,260-X,280 feet and X,410-X,440 feetin Track 5. The standard triple-combo log was overly optimistic,showing freshwater zones as potentially productive.
Cymric Field
The Cymric Field lies to the west of the Kern River Field inthe foothills of the coastal range. It is also a heavy oil produc-er enhanced by steamflooding. The new dielectric tool was runto evaluate the Tulare formation, which is a poorly consolidat-ed fluvio-deltaic sandstone bounded by shale. Reservoir depthsrange from 700 to 1,200 feet. Porosity averages 34 percent, andpermeability ranges between 2,000 and 3,000 milliDarcies. Oilsaturations run from 55 to 65 percent and API oil gravities arebetween nine and 14 degrees.The challenge was to profile the heavy oil response in spite
of the presence of fresh formation water and steamflood con-densate. The basic logging suite included a triple combo. In ad-dition, the legacy electromagnetic propagation tool had beenrun to determine water saturation and to compare with the newmultifrequency dielectric dispersion tool. At the Cymric Field,Chevron had acquired several sidewall cores (indicated by blackdots on the log tracks in Figure 3).The saturation profiling in the Cymric Field illustrates the
FIGURE 2Hydrocarbon Zones Identified with Multifrequency
Dielectric Dispersion Logging Tool
SpecialReport: Formation Evaluation
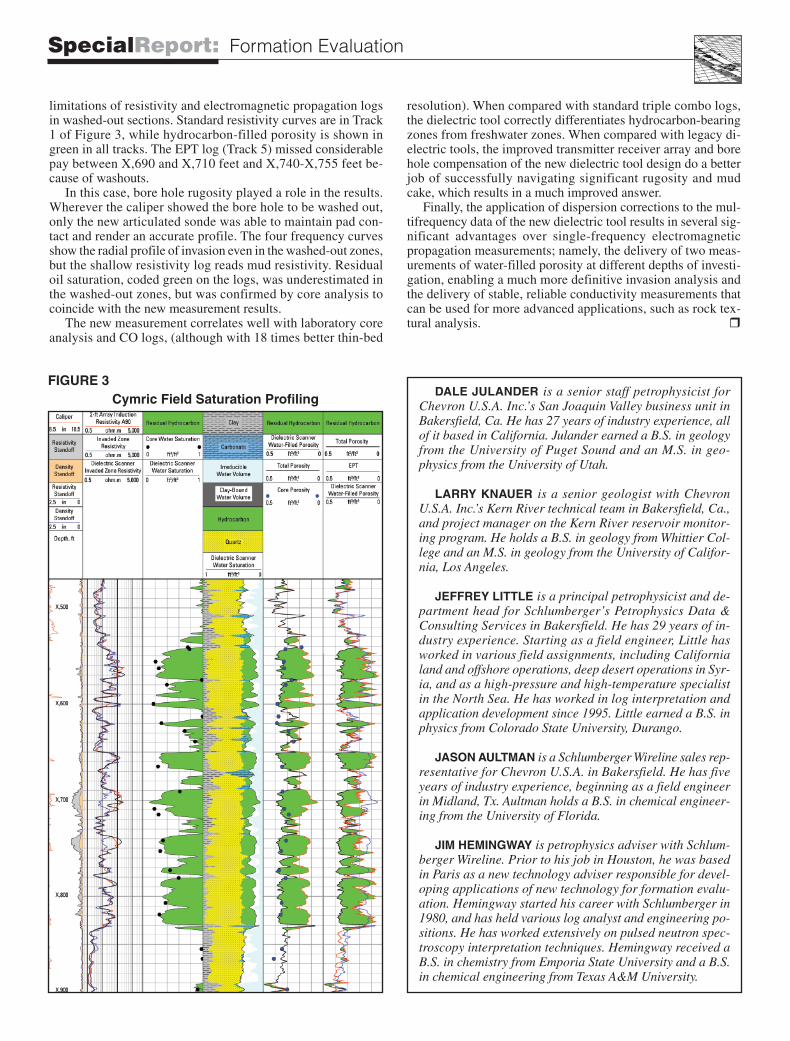
limitations of resistivity and electromagnetic propagation logsin washed-out sections. Standard resistivity curves are in Track1 of Figure 3, while hydrocarbon-filled porosity is shown ingreen in all tracks. The EPT log (Track 5) missed considerablepay between X,690 and X,710 feet and X,740-X,755 feet be-cause of washouts.In this case, bore hole rugosity played a role in the results.
Wherever the caliper showed the bore hole to be washed out,only the new articulated sonde was able to maintain pad con-tact and render an accurate profile. The four frequency curvesshow the radial profile of invasion even in the washed-out zones,but the shallow resistivity log reads mud resistivity. Residualoil saturation, coded green on the logs, was underestimated inthe washed-out zones, but was confirmed by core analysis tocoincide with the new measurement results.The new measurement correlates well with laboratory core
analysis and CO logs, (although with 18 times better thin-bed
resolution). When compared with standard triple combo logs,the dielectric tool correctly differentiates hydrocarbon-bearingzones from freshwater zones. When compared with legacy di-electric tools, the improved transmitter receiver array and borehole compensation of the new dielectric tool design do a betterjob of successfully navigating significant rugosity and mudcake, which results in a much improved answer.Finally, the application of dispersion corrections to the mul-
tifrequency data of the new dielectric tool results in several sig-nificant advantages over single-frequency electromagneticpropagation measurements; namely, the delivery of two meas-urements of water-filled porosity at different depths of investi-gation, enabling a much more definitive invasion analysis andthe delivery of stable, reliable conductivity measurements thatcan be used for more advanced applications, such as rock tex-tural analysis. r
Cymric Field Saturation ProfilingFIGURE 3
DALE JULANDER is a senior staff petrophysicist forChevron U.S.A. Inc.’s San Joaquin Valley business unit inBakersfield, Ca. He has 27 years of industry experience, allof it based in California. Julander earned a B.S. in geologyfrom the University of Puget Sound and an M.S. in geo-physics from the University of Utah.
LARRY KNAUER is a senior geologist with ChevronU.S.A. Inc.’s Kern River technical team in Bakersfield, Ca.,and project manager on the Kern River reservoir monitor-ing program. He holds a B.S. in geology from Whittier Col-lege and an M.S. in geology from the University of Califor-nia, Los Angeles.
JEFFREY LITTLE is a principal petrophysicist and de-partment head for Schlumberger’s Petrophysics Data &Consulting Services in Bakersfield. He has 29 years of in-dustry experience. Starting as a field engineer, Little hasworked in various field assignments, including Californialand and offshore operations, deep desert operations in Syr-ia, and as a high-pressure and high-temperature specialistin the North Sea. He has worked in log interpretation andapplication development since 1995. Little earned a B.S. inphysics from Colorado State University, Durango.
JASON AULTMAN is a Schlumberger Wireline sales rep-resentative for Chevron U.S.A. in Bakersfield. He has fiveyears of industry experience, beginning as a field engineerin Midland, Tx. Aultman holds a B.S. in chemical engineer-ing from the University of Florida.
JIM HEMINGWAY is petrophysics adviser with Schlum-berger Wireline. Prior to his job in Houston, he was basedin Paris as a new technology adviser responsible for devel-oping applications of new technology for formation evalu-ation. Hemingway started his career with Schlumberger in1980, and has held various log analyst and engineering po-sitions. He has worked extensively on pulsed neutron spec-troscopy interpretation techniques. Hemingway received aB.S. in chemistry from Emporia State University and a B.S.in chemical engineering from Texas A&M University.
SpecialReport: Formation Evaluation