Embed Size (px)
Citation preview
NEW LENSES ON
FUTURE CITIESA NEW LENS SCENARIOS SUPPLEMENT

Forewords 02
Introduction 04
Global Urban Population Growth 06
Cities and the Panorama Lenses 08
City Development and Energy Use 10
A tale of two 'Dams 14
City Archetypes 18
Energy in City Archetypes 26
City Pathways 29
Focusing Lenses on Cities 33
Room to Manoeuvre and Trapped Transition 34
Resetting City Challenges 43
CLC Framework for Liveable and Sustainable Cities 44
How Should Cities Be Developed? 46
Case Study: The China Opportunity 51
Reflections 53
Appendices 55
CONTENTS
Despite our humble beginnings, Singapore is today one of the most liveable cities in the world. However, just 50 years ago, we had slums, droughts, floods, congestion, crime and disease. With limited land and almost no natural resources, our pioneering leaders had to plan long-term to achieve a sustainable environment, a competitive economy and a good quality of life for the city-state.
The Centre for Liveable Cities (CLC) was established in 2008 by Singapore’s Ministry of National Development and Ministry of Environment and Water Resources, with the mission to distill, create and share knowledge on liveable and sustainable cities. Drawing on Singapore’s experiences, CLC has developed the CLC Framework for Liveable and Sustainable Cities, a practical framework to developing high-density, highly liveable cities. Through initiatives like the World Cities Summit, Lee Kuan Yew World Cities Prize and Temasek Foundation Leaders in Urban Governance Programme, CLC is also active in the international discourse on liveable and sustainable cities, often sharing Singapore’s experiences, expertise and emerging challenges with other cities, experts and partners, like Shell.
KHOO TENG CHYEExecutive Director, Centre for Liveable Cities, Singapore
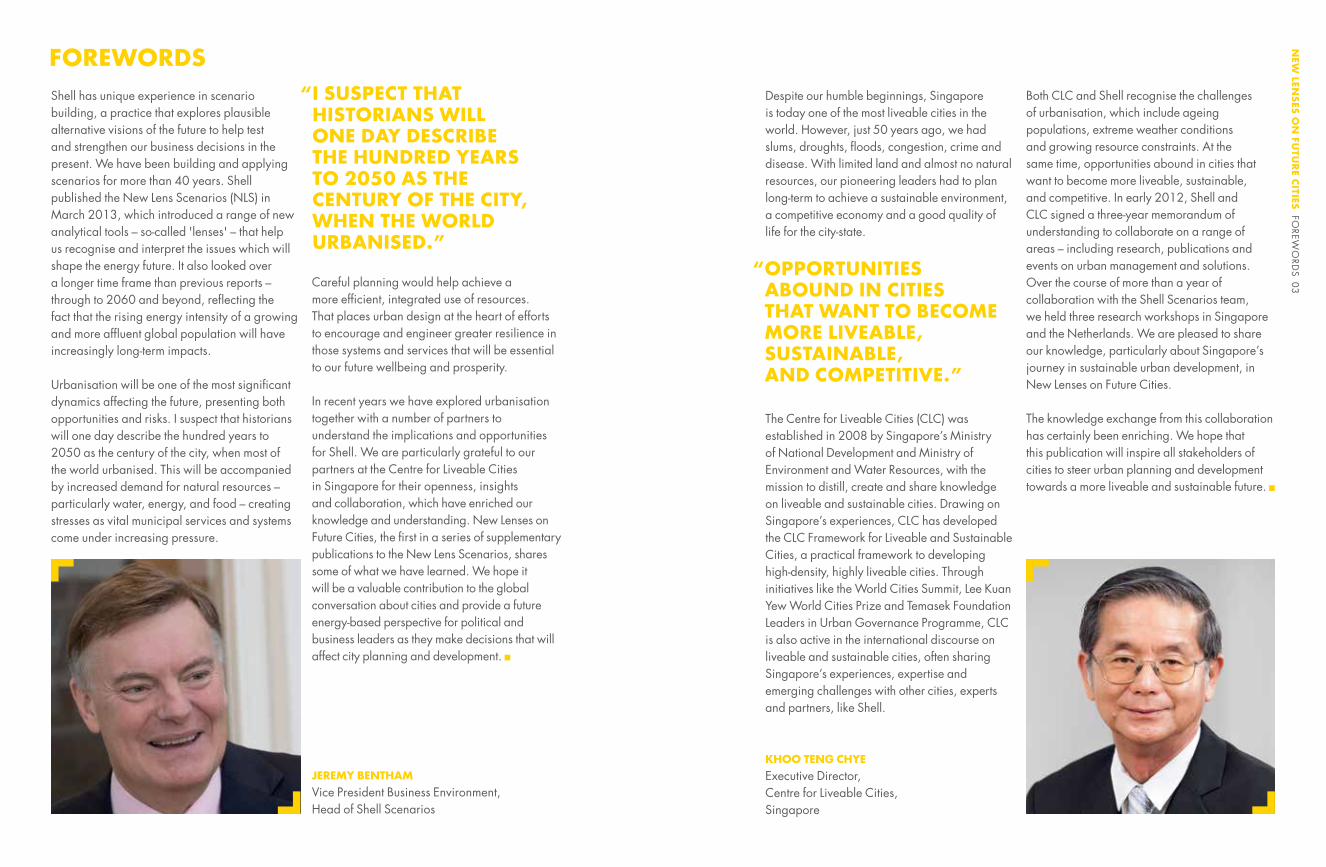
Shell has unique experience in scenario building, a practice that explores plausible alternative visions of the future to help test and strengthen our business decisions in the present. We have been building and applying scenarios for more than 40 years. Shell published the New Lens Scenarios (NLS) in March 2013, which introduced a range of new analytical tools – so-called 'lenses' – that help us recognise and interpret the issues which will shape the energy future. It also looked over a longer time frame than previous reports – through to 2060 and beyond, reflecting the fact that the rising energy intensity of a growing and more affluent global population will have increasingly long-term impacts.
Urbanisation will be one of the most significant dynamics affecting the future, presenting both opportunities and risks. I suspect that historians will one day describe the hundred years to 2050 as the century of the city, when most of the world urbanised. This will be accompanied by increased demand for natural resources – particularly water, energy, and food – creating stresses as vital municipal services and systems come under increasing pressure.
Both CLC and Shell recognise the challenges of urbanisation, which include ageing populations, extreme weather conditions and growing resource constraints. At the same time, opportunities abound in cities that want to become more liveable, sustainable, and competitive. In early 2012, Shell and CLC signed a three-year memorandum of understanding to collaborate on a range of areas – including research, publications and events on urban management and solutions. Over the course of more than a year of collaboration with the Shell Scenarios team, we held three research workshops in Singapore and the Netherlands. We are pleased to share our knowledge, particularly about Singapore’s journey in sustainable urban development, in New Lenses on Future Cities.
The knowledge exchange from this collaboration has certainly been enriching. We hope that this publication will inspire all stakeholders of cities to steer urban planning and development towards a more liveable and sustainable future.
Careful planning would help achieve a more efficient, integrated use of resources. That places urban design at the heart of efforts to encourage and engineer greater resilience in those systems and services that will be essential to our future wellbeing and prosperity.
In recent years we have explored urbanisation together with a number of partners to understand the implications and opportunities for Shell. We are particularly grateful to our partners at the Centre for Liveable Cities in Singapore for their openness, insights and collaboration, which have enriched our knowledge and understanding. New Lenses on Future Cities, the first in a series of supplementary publications to the New Lens Scenarios, shares some of what we have learned. We hope it will be a valuable contribution to the global conversation about cities and provide a future energy-based perspective for political and business leaders as they make decisions that will affect city planning and development.
JEREMY BENTHAMVice President Business Environment, Head of Shell Scenarios
“ I SUSPECT THAT HISTORIANS WILL ONE DAY DESCRIBE THE HUNDRED YEARS TO 2050 AS THE CENTURY OF THE CITY, WHEN THE WORLD URBANISED.”
“ OPPORTUNITIES ABOUND IN CITIES THAT WANT TO BECOME MORE LIVEABLE, SUSTAINABLE, AND COMPETITIVE.”
FOREWORDSN
EW LEN
SES
ON
FUTU
RE C
ITIES FO
REWO
RDS 03
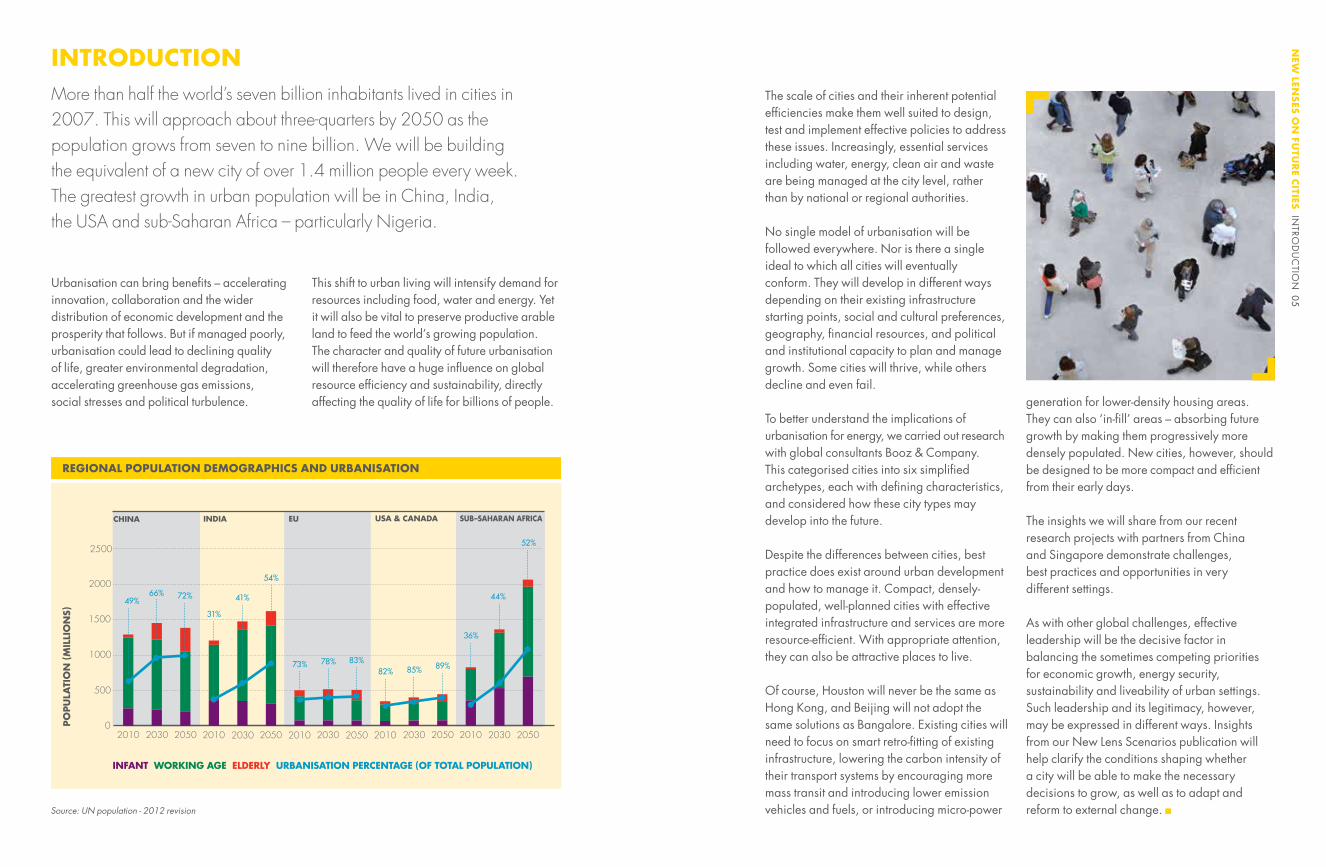
REGIONAL POPULATION DEMOGRAPHICS AND URBANISATION
PO
PU
LATI
ON
(M
ILLI
ON
S)
INFANT WORKING AGE ELDERLY URBANISATION PERCENTAGE (OF TOTAL POPULATION)
0
500
1000
1500
2000
2500
205020302010205020302010205020302010205020302010205020302010
CHINA INDIA EU USA & CANADA SUB–SAHARAN AFRICA
Note: percentage values for Urbanisation arehard figures derived from column totals.
66% 72%
36%
44%
52%
31%
41%
73% 83%82%
89%
49%
54%
78%85%
Urbanisation can bring benefits – accelerating innovation, collaboration and the wider distribution of economic development and the prosperity that follows. But if managed poorly, urbanisation could lead to declining quality of life, greater environmental degradation, accelerating greenhouse gas emissions, social stresses and political turbulence.
This shift to urban living will intensify demand for resources including food, water and energy. Yet it will also be vital to preserve productive arable land to feed the world’s growing population. The character and quality of future urbanisation will therefore have a huge influence on global resource efficiency and sustainability, directly affecting the quality of life for billions of people.
The scale of cities and their inherent potential efficiencies make them well suited to design, test and implement effective policies to address these issues. Increasingly, essential services including water, energy, clean air and waste are being managed at the city level, rather than by national or regional authorities.
No single model of urbanisation will be followed everywhere. Nor is there a single ideal to which all cities will eventually conform. They will develop in different ways depending on their existing infrastructure starting points, social and cultural preferences, geography, financial resources, and political and institutional capacity to plan and manage growth. Some cities will thrive, while others decline and even fail.
To better understand the implications of urbanisation for energy, we carried out research with global consultants Booz & Company. This categorised cities into six simplified archetypes, each with defining characteristics, and considered how these city types may develop into the future.
Despite the differences between cities, best practice does exist around urban development and how to manage it. Compact, densely-populated, well-planned cities with effective integrated infrastructure and services are more resource-efficient. With appropriate attention, they can also be attractive places to live.
Of course, Houston will never be the same as Hong Kong, and Beijing will not adopt the same solutions as Bangalore. Existing cities will need to focus on smart retro-fitting of existing infrastructure, lowering the carbon intensity of their transport systems by encouraging more mass transit and introducing lower emission vehicles and fuels, or introducing micro-power
INTRODUCTIONMore than half the world’s seven billion inhabitants lived in cities in 2007. This will approach about three-quarters by 2050 as the population grows from seven to nine billion. We will be building the equivalent of a new city of over 1.4 million people every week. The greatest growth in urban population will be in China, India, the USA and sub-Saharan Africa – particularly Nigeria.
generation for lower-density housing areas. They can also ‘in-fill’ areas – absorbing future growth by making them progressively more densely populated. New cities, however, should be designed to be more compact and efficient from their early days.
The insights we will share from our recent research projects with partners from China and Singapore demonstrate challenges, best practices and opportunities in very different settings.
As with other global challenges, effective leadership will be the decisive factor in balancing the sometimes competing priorities for economic growth, energy security, sustainability and liveability of urban settings. Such leadership and its legitimacy, however, may be expressed in different ways. Insights from our New Lens Scenarios publication will help clarify the conditions shaping whether a city will be able to make the necessary decisions to grow, as well as to adapt and reform to external change. Source: UN population - 2012 revision
NEW
LENSES
ON
FUTU
RE C
ITIES IN
TROD
UC
TION
05
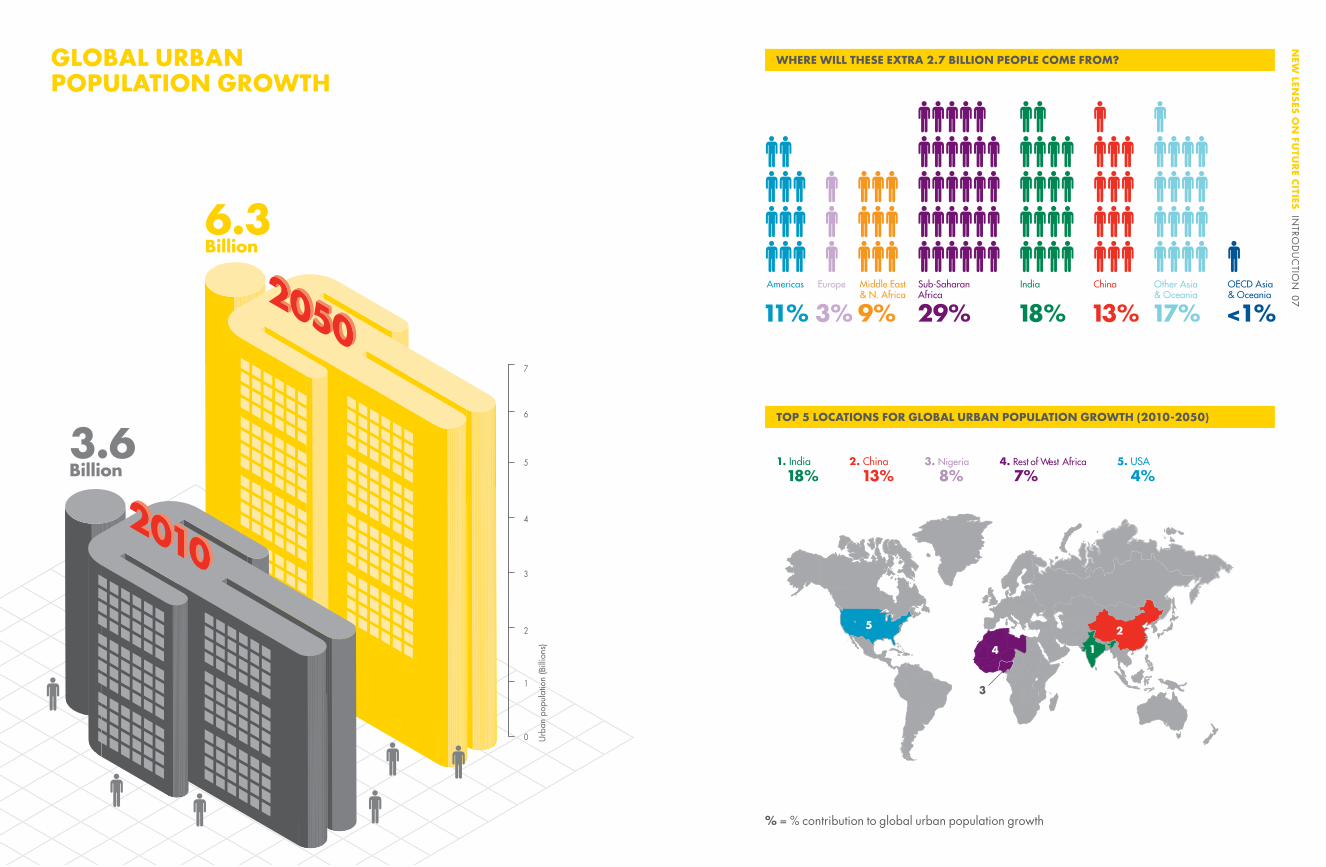
WHERE WILL THESE EXTRA 2.7 BILLION PEOPLE COME FROM?
TOP 5 LOCATIONS FOR GLOBAL URBAN POPULATION GROWTH (2010-2050)
Americas Europe Middle East& N. Africa
Sub-SaharanAfrica
India China Other Asia& Oceania
OECD Asia& Oceania
6.3Billion
GLOBAL URBANPOPULATION GROWTH
WHERE WILL THESE EXTRA 2.7 BILLION PEOPLE COME FROM?
0
1
2
3
4
5
6
7
Urb
an p
opul
atio
n (B
illio
ns)
3.6Billion
5. USA 4%
3. Nigeria
8%4. Rest of West Africa
7%1. India 18%
2. China 13%
TOP 5 URBAN POPULATION GROWTH COUNTRIES (2010-2050)
1
2
3
4
5
<1%17%13%18%29%9%3%11%
% = % contribution to global urban population growth
GLOBAL URBAN POPULATION GROWTH
NEW
LENSES
ON
FUTU
RE C
ITIES IN
TROD
UC
TION
07
In the New Lens Scenarios report, we described two plausible alternative visions of the future. In Mountains, status quo power is locked in and held tightly by the currently influential. Stability is the highest prize: those at the top align their interests to unlock resources steadily and cautiously, not solely dictated by immediate market forces. The resulting rigidity in the system can dampen economic dynamism and stifle social mobility, although the capacity to plan can facilitate some secondary policy developments. In Oceans, influence stretches far and wide in the world. Power is devolved, competing interests are accommodated and compromise is king. Economic productivity surges on a huge wave of reforms, yet social cohesion is sometimes eroded and politics destabilised. This causes much secondary policy development to stagnate, giving immediate market forces greater prominence.
These different stories play out in cities. In a Mountains world, city solutions are implemented from the top down and data is controlled by the major power-brokers to manage the city directly. This facilitates large infrastructure projects such as major public transport schemes or reconfiguring city energy systems as government and large companies coordinate the massive investments they require and make radical solutions actually happen. In an Oceans world, there’s likely to be more creativity but less orchestration and control. Cities make data freely available. Crowdsourcing and collaboration spurs the spread of innovative city-scale market solutions such as schemes to use local waste for small neighbourhood power generation.
Of course, the scale, resources and governance models of cities offer an inherent, perhaps unique, capacity to shape their own paths. It may be possible to foster the best of both worlds rather than drift towards the worst. Voters put intense pressure on leaders to improve city living, and success or failure is highly visible. City-scale trials demonstrate policies to be effective, leading others to replicate their success. This gives some cities, particularly innovative and creative ones with inspiring leaders and active constituents, the potential to act as the crucibles of change that later extends beyond cities and around the world.
CITIES AND THE PANORAMA LENSES
“ CITY-SCALE TRIALS DEMONSTRATE POLICIES TO BE EFFECTIVE, LEADING OTHERS TO REPLICATE THEIR SUCCESS.”
NEW
LENSES
ON
FUTU
RE C
ITIES IN
TROD
UC
TION
09
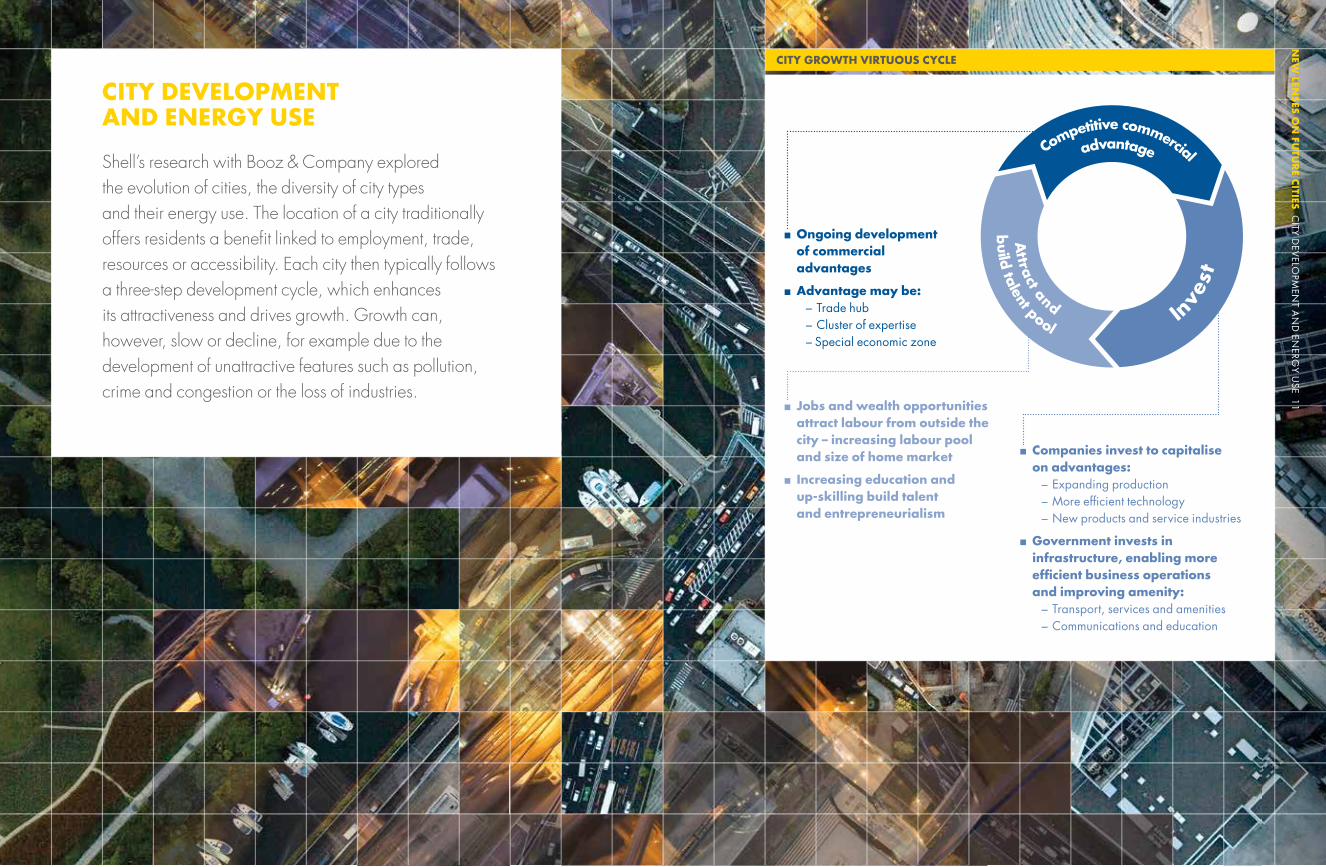
CITY GROWTH VIRTUOUS CYCLE
Ongoing development of commercial advantages
Advantage may be: – Trade hub – Cluster of expertise – Special economic zone
Jobs and wealth opportunities attract labour from outside the city – increasing labour pool and size of home market
Increasing education and up-skilling build talent and entrepreneurialism
Companies invest to capitalise on advantages: – Expanding production – More efficient technology – New products and service industries
Government invests in infrastructure, enabling more efficient business operations and improving amenity:
– Transport, services and amenities – Communications and education
Shell’s research with Booz & Company explored the evolution of cities, the diversity of city types and their energy use. The location of a city traditionally offers residents a benefit linked to employment, trade, resources or accessibility. Each city then typically follows a three-step development cycle, which enhances its attractiveness and drives growth. Growth can, however, slow or decline, for example due to the development of unattractive features such as pollution, crime and congestion or the loss of industries.
CITY DEVELOPMENT AND ENERGY USE
NEW
LENSES
ON
FUTU
RE C
ITIES C
ITY DEV
ELOPM
ENT A
ND
ENERG
Y USE 11
0 2 4 6 8 10 12 14 16 18 20
2040
2010
BILLION TONNES OF OIL EQUIVALENT (BTOE/YEAR)
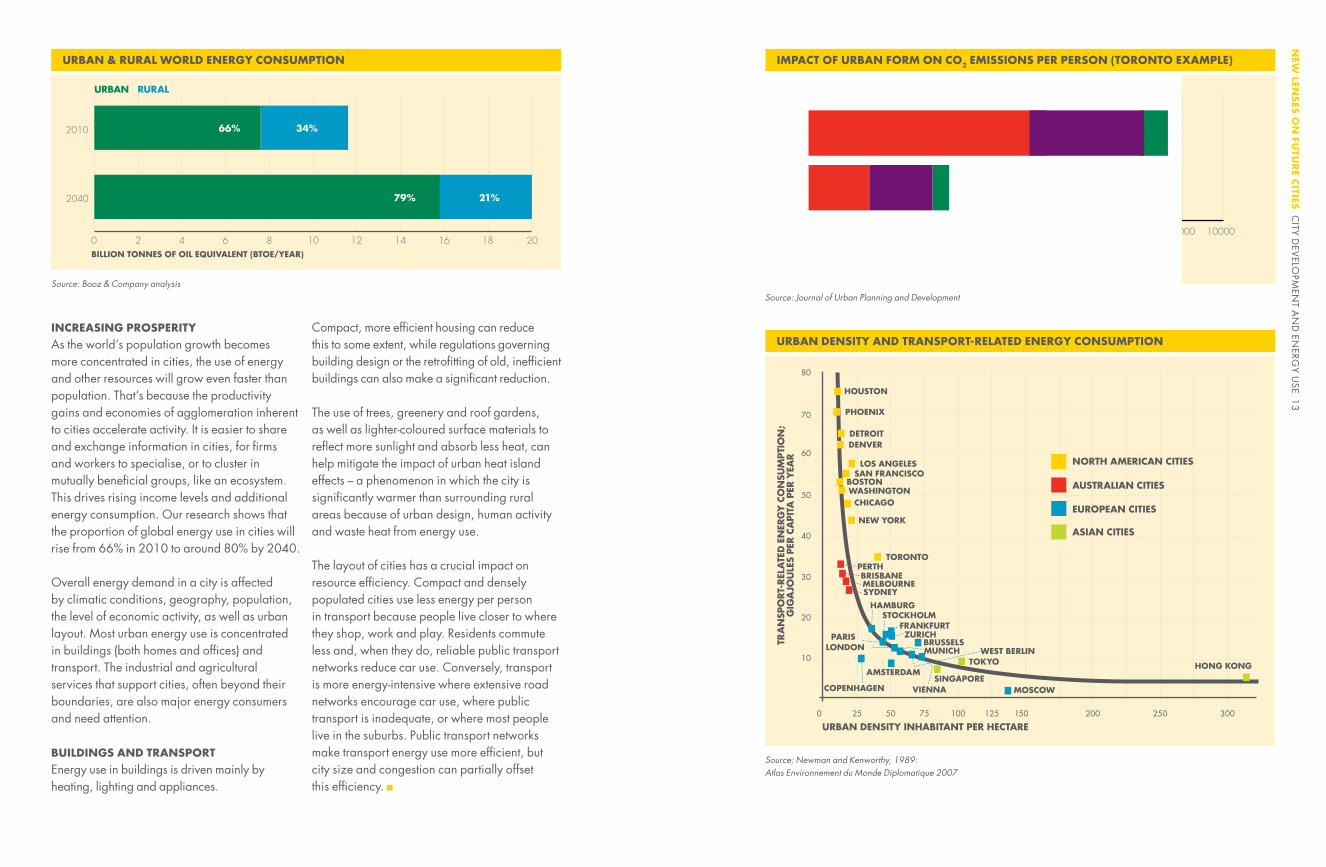
URBAN RURAL
34%66%
79% 21%
TRANSPORTATION BUILDING OPERATIONS MATERIALS
High DensityAreas
KG CO2 EQUIVALENTS/YEAR
Low Density Areas
IMPACT OF URBAN FORM ON CO2 EMISSIONS PER PERSON (TORONTO EXAMPLE)URBAN & RURAL WORLD ENERGY CONSUMPTION
INCREASING PROSPERITYAs the world’s population growth becomes more concentrated in cities, the use of energy and other resources will grow even faster than population. That’s because the productivity gains and economies of agglomeration inherent to cities accelerate activity. It is easier to share and exchange information in cities, for firms and workers to specialise, or to cluster in mutually beneficial groups, like an ecosystem. This drives rising income levels and additional energy consumption. Our research shows that the proportion of global energy use in cities will rise from 66% in 2010 to around 80% by 2040. Overall energy demand in a city is affected by climatic conditions, geography, population, the level of economic activity, as well as urban layout. Most urban energy use is concentrated in buildings (both homes and offices) and transport. The industrial and agricultural services that support cities, often beyond their boundaries, are also major energy consumers and need attention.
BUILDINGS AND TRANSPORTEnergy use in buildings is driven mainly by heating, lighting and appliances.
Compact, more efficient housing can reduce this to some extent, while regulations governing building design or the retrofitting of old, inefficient buildings can also make a significant reduction.
The use of trees, greenery and roof gardens, as well as lighter-coloured surface materials to reflect more sunlight and absorb less heat, can help mitigate the impact of urban heat island effects – a phenomenon in which the city is significantly warmer than surrounding rural areas because of urban design, human activity and waste heat from energy use.
The layout of cities has a crucial impact on resource efficiency. Compact and densely populated cities use less energy per person in transport because people live closer to where they shop, work and play. Residents commute less and, when they do, reliable public transport networks reduce car use. Conversely, transport is more energy-intensive where extensive road networks encourage car use, where public transport is inadequate, or where most people live in the suburbs. Public transport networks make transport energy use more efficient, but city size and congestion can partially offset this efficiency.
URBAN DENSITY AND TRANSPORT-RELATED ENERGY CONSUMPTION
HOUSTON
0
10
20
30
40
50
60
70
80
25 50 75 100 125 150 200 250 300
URBAN DENSITY INHABITANT PER HECTARE
TRA
NSP
ORT-
REL
ATE
D E
NER
GY
CO
NSU
MPTI
ON
; G
IGA
JOU
LES
PER C
API
TA P
ER Y
EAR
PHOENIX
DETROITDENVER
LOS ANGELESSAN FRANCISCO
BOSTONWASHINGTON
CHICAGO
NEW YORK
TORONTO
SYDNEY
HAMBURG
PARISLONDON
COPENHAGEN
AMSTERDAM
STOCKHOLMFRANKFURTZURICH
BRUSSELSMUNICH WEST BERLIN
VIENNA MOSCOWSINGAPORE
TOKYO HONG KONG
NORTH AMERICAN CITIES
AUSTRALIAN CITIES
EUROPEAN CITIES
ASIAN CITIES
MELBOURNEBRISBANE
PERTH
Source: Booz & Company analysis
Source; Newman and Kenworthy, 1989: Atlas Environnement du Monde Diplomatique 2007
Source: Journal of Urban Planning and Development
NEW
LENSES
ON
FUTU
RE C
ITIES C
ITY DEV
ELOPM
ENT A
ND
ENERG
Y USE 13

A TALE OF TWO 'DAMS
The city of Amsterdam is recognised as one of the world’s most sustainable and liveable compact urban environments. In recent years it has ranked in the top five of the Siemens Green City Index and Forbes magazine’s study of the world’s smartest cities. The city has the ambition to cut carbon dioxide (CO2) emissions 40% by 2025 compared to 1990.
Nearly 80% of the land in Rotterdam is located below sea level, some by as much as six metres. Its port is the largest of Europe and fuels the economy of the Netherlands. As a delta city vulnerable to flooding, it has initiated a detailed climate adaptation strategy and aims to be 100% climate proof by 2025 as well as achieving a 50% reduction in its CO2 emissions by 2025 compared to 1990.
CLIMATE AND ENERGYAmsterdam’s Waste and Energy Company (AEB) is a world leader in producing electricity, heat and products from industrial, municipal and water waste. AEB converts biogas provided by the Amsterdam water company (Waternet) into electricity, heat and transport fuels. The first 'green' service station supplying only sustainable fuels opened in 2012. That year AEB generated nearly one million MWh of electricity. Together with Vattenfall-Nuon, an energy company, it also provided district heating generated from waste to 55,000 of the
city’s 500,000 homes. By 2040 Amsterdam plans to have 200,000 homes connected to its district heating scheme.
The city and port of Rotterdam are implementing a range of measures to reduce their emissions including the construction of new steam and heat networks. Construction began in 2012 on a new pipeline network that will transport excess steam from the AVR Rozenburg power plant to local businesses – cutting their use of fossil fuels to generate steam on site and reducing their emissions by an estimated 400,000 tonnes of CO2 a year. The steam will also provide sustainable heating to 50,000 businesses and houses. The city has invested 36 million euros in the 24MW Hartelbrug II wind farm and is home to the National LNG Platform established in 2012 to co-ordinate companies and government authorities to encourage the introduction of liquefied natural gas as an alternative transport fuel in the Netherlands.
CLIMATE ADAPTATIONAs a compact city below sea level, Rotterdam has undertaken a variety of projects to protect itself against the risk of flooding. Most of the 12,000 hectares of the port area has been developed on elevated land at an average height of 3 to 5 metres above mean sea level and is protected by the Maeslant Storm Surge Barrier, while protective dykes are designed
The two main cities in the Netherlands – Amsterdam and Rotterdam – have put climate adaptation high on their agendas. Though different by nature, Amsterdam the commercial and tourist capital and Rotterdam an industrial port city, they both have bold ambitions for 2025.
NEW
LENSES
ON
FUTU
RE C
ITIES C
ITY DEV
ELOPM
ENT A
ND
ENERG
Y USE 15
NEW
LENSES
ON
FUTU
RE C
ITIES C
ITY DEV
ELOPM
ENT A
ND
ENERG
Y USE 15

Amsterdam is oncourse to halve CO2
emissions by 2025
-40%
Rotterdam has developed over
of gardenroofs
m2
A third of people in the Netherlands use bikes as their main mode of transport
The first ‘green’ service stationsupplying only sustainable fuels opened in Amsterdam in 2012
Amsterdam has the highest density of electric vehicle charging stations inthe world
13 ,
Over of Amsterdam homes receive heating generated from waste
Rotterdam has the highest global ratioof electricto gasoline-fuelled vehicles
10%
1 inevery187
650in total
including the1,000m2 Dakakker, the largest urban rooftop farm in Europe
of Amsterdaminhabitantscycle daily
57%
80%
of the land in Rotterdamis located below sea level
as part of recreational areas – serving as cycle routes for example. The city plans to construct 75,000 cubic metres of additional water storage capacity by 2015, in part by building water plazas: playgrounds, city squares or sports fields that will act as urban ponds during heavy rain, managed by a system of pumps and filters. To support this 'sponge function', Rotterdam has developed over 130,000 m2 of garden roofs including the groundbreaking 1,000 m2 Dakakker, the largest urban rooftop farm in Europe, located on top of an office. Smaller scale projects such as 'tile out, green in’ campaigns – asking citizens to replace paving with plants and grass – aim to create awareness of the need to improve resilience.
SUSTAINABLE MOBILITY AND AIR QUALITYThe Netherlands has the highest incidence of bicycle use in Europe, with about a third of people using bikes as their main mode of transport. Amsterdam is one of the world’s most prolific cycling cities, with almost 900,000 bikes and 57% of its inhabitants cycling daily. The widespread 30 km/h zones are instrumental in slowing motor vehicles and keeping people safe. Amsterdam is further strengthening sustainable transport and air quality through the roll-out of infrastructure to support electric cars. By autumn 2013, it had the highest density of charging stations in the world (650 in total) and a privately operated electric car-sharing scheme, car2go, with over 16,000 members. Rotterdam is the most successful city for electric cars in Europe, with 1,100 electric vehicles on the road and plans for 1,000 charging stations in the city by 2014. It also has the highest global ratio of electric to gasoline-fuelled vehicles – 532 EVs for every 100,000 registered vehicles. Both Amsterdam and Rotterdam plan to increase their electric vehicle fleets even further over the coming years.
INNOVATIVE COLLABORATIONSThe Amsterdam Smart City initiative is a partnership between businesses, government, academics and citizens to develop Amsterdam as an urban living laboratory for smart city technologies, allowing businesses the opportunity to test and demonstrate innovative products and services. In September 2013 the City of Amsterdam announced plans to create a world-leading public-private institute that will encourage talent and explore new advanced city solutions.
Like Amsterdam, Rotterdam shares its knowledge with other cities. It is also an active member of the C40, a group of major cities committed to reducing greenhouse gas emissions and climate risks. It was the founder of the Connecting Delta Cities network to share knowledge and best practice adaptation strategies for those vulnerable to rising sea levels and has directly assisted various cities including New Orleans and Ho Chi Minh City. In doing so it draws on the cluster of knowledge institutes and consultancies around Rotterdam within the framework of Rotterdam Climate Proof, the adaptation programme of the Rotterdam Climate Initiative. In 2012, the European Commission appointed Rotterdam as an EU Peer City, a designation giving it a leading role in the EC training programme to help other cities adapt to climate change.
NEW
LENSES
ON
FUTU
RE C
ITIES C
ITY DEV
ELOPM
ENT A
ND
ENERG
Y USE 17

DEVELOPING MEGA-HUBS
SPRAWLING METROPOLISES
ARCHETYPE CHARACTERISTICS KEY
ECONOMY
HOUSING
POPULATION DENSITY
ENERGY USE
CITY LAY-OUT
GDP/CAPITA
MOBILITY
GLOBAL LOCATION
POPULATION SIZE
Our joint research with Booz & Company studied more than 500 cities with over 750,000 inhabitants and 21 megacities with over 10 million inhabitants from which we identified six illustrative archetypes to help frame our understanding of energy use in cities. Each is a simplification and, in reality, a single city can exhibit the characteristics of multiple archetypes.
CITY ARCHETYPES
0.22
1.66
TOTAL ENERGYUSED
TOTALENERGYUSED
Billion tonnes of oil equivalent/year
Billion tonnes of oil equivalent/year
26
41
EXAMPLES INCLUDING:
EXAMPLES INCLUDING:
UNDERDEVELOPED URBAN CENTRES
0.49TOTAL ENERGYUSEDBillion tonnes of oil equivalent/year
267 EXAMPLES INCLUDING: Nanchong Kathmandu Algiers
PROSPEROUS COMMUNITIES
1.13TOTAL ENERGYUSEDBillion tonnes of oil equivalent/year
127 EXAMPLES INCLUDING: Stockholm Calgary Dubai
Chongqing Nairobi Hyderabad
Houston Rio de Janeiro Tokyo
UNDERPRIVILEGED CROWDED CITIES
0.36TOTAL ENERGYUSEDBillion tonnes of oil equivalent/year
42 EXAMPLES INCLUDING: Bangalore Manila Kinshasa
URBAN POWERHOUSES
0.46TOTAL ENERGYUSEDBillion tonnes of oil equivalent/year
8EXAMPLES INCLUDING: Hong Kong Singapore New York
NEW
LENSES
ON
FUTU
RE C
ITIES C
ITY ARC
HETYPES 19
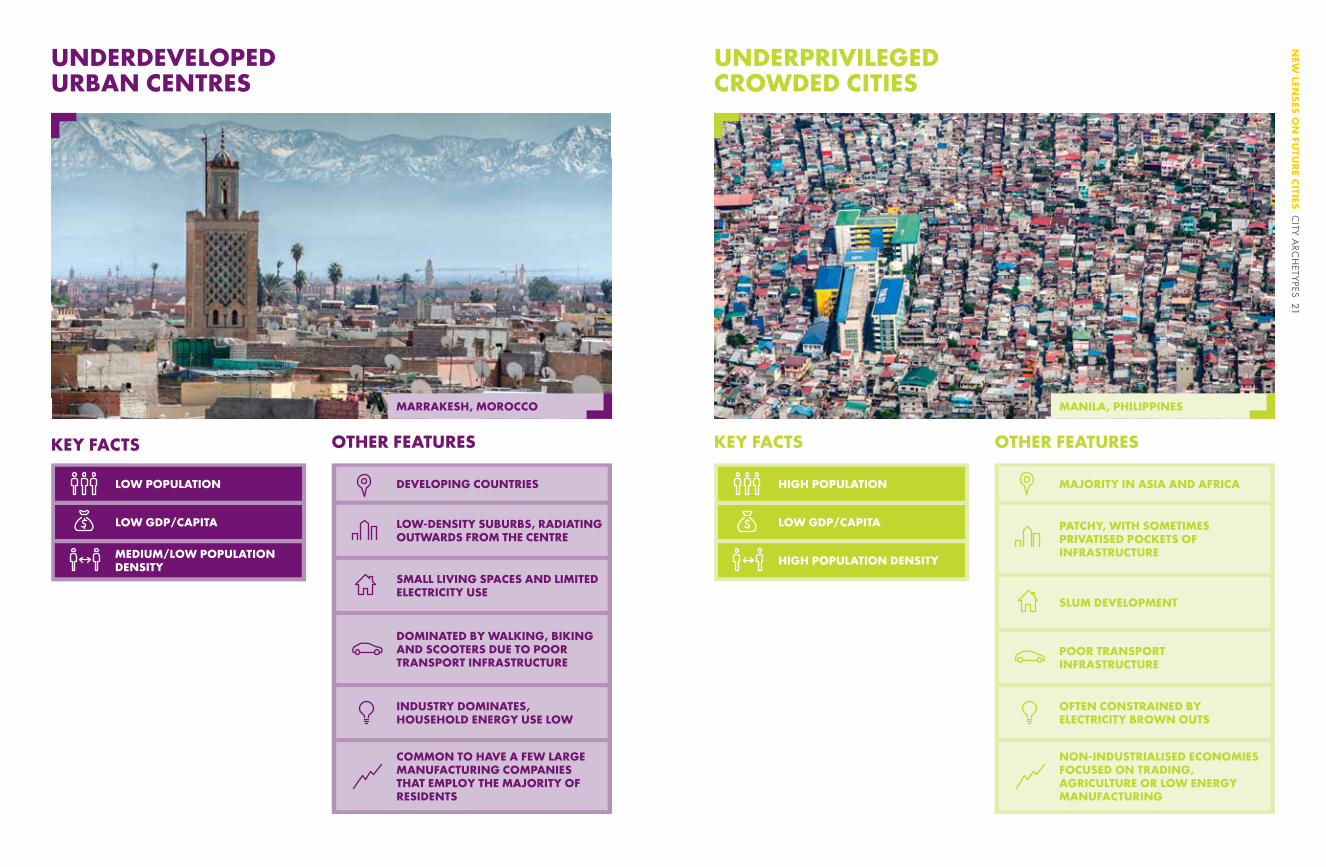
HIGH POPULATION DENSITY
LOW GDP/CAPITA
HIGH POPULATION
UNDERDEVELOPED URBAN CENTRES
UNDERPRIVILEGED CROWDED CITIES
COMMON TO HAVE A FEW LARGE MANUFACTURING COMPANIES THAT EMPLOY THE MAJORITY OF RESIDENTS
LOW-DENSITY SUBURBS, RADIATING OUTWARDS FROM THE CENTRE
DEVELOPING COUNTRIES
SMALL LIVING SPACES AND LIMITED ELECTRICITY USE
DOMINATED BY WALKING, BIKING AND SCOOTERS DUE TO POOR TRANSPORT INFRASTRUCTURE
INDUSTRY DOMINATES, HOUSEHOLD ENERGY USE LOW
NON-INDUSTRIALISED ECONOMIES FOCUSED ON TRADING, AGRICULTURE OR LOW ENERGY MANUFACTURING
PATCHY, WITH SOMETIMES PRIVATISED POCKETS OF INFRASTRUCTURE
MAJORITY IN ASIA AND AFRICA
SLUM DEVELOPMENT
POOR TRANSPORT INFRASTRUCTURE
OFTEN CONSTRAINED BY ELECTRICITY BROWN OUTS
MEDIUM/LOW POPULATION DENSITY
LOW GDP/CAPITA
LOW POPULATION
KEY FACTS KEY FACTSOTHER FEATURES OTHER FEATURES
MARRAKESH, MOROCCO MANILA, PHILIPPINES
NEW
LENSES
ON
FUTU
RE C
ITIES C
ITY ARC
HETYPES 21
DEVELOPING MEGA-HUBS
SPRAWLING METROPOLISES
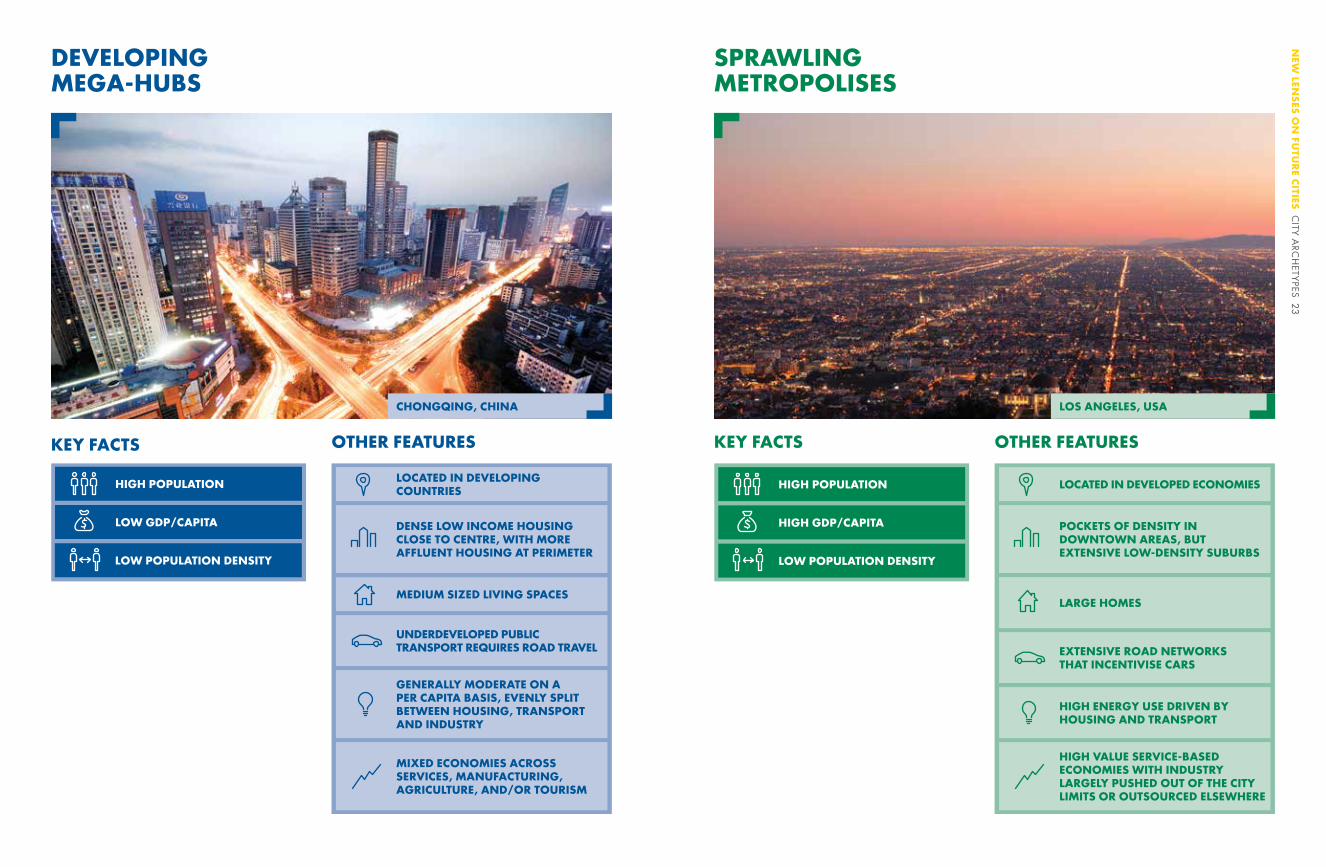
HIGH VALUE SERVICE-BASED ECONOMIES WITH INDUSTRY LARGELY PUSHED OUT OF THE CITY LIMITS OR OUTSOURCED ELSEWHERE
POCKETS OF DENSITY IN DOWNTOWN AREAS, BUT EXTENSIVE LOW-DENSITY SUBURBS
LOCATED IN DEVELOPED ECONOMIES
LARGE HOMES
EXTENSIVE ROAD NETWORKS THAT INCENTIVISE CARS
HIGH ENERGY USE DRIVEN BY HOUSING AND TRANSPORT
MIXED ECONOMIES ACROSS SERVICES, MANUFACTURING, AGRICULTURE, AND/OR TOURISM
DENSE LOW INCOME HOUSING CLOSE TO CENTRE, WITH MORE AFFLUENT HOUSING AT PERIMETER
LOCATED IN DEVELOPING COUNTRIES
MEDIUM SIZED LIVING SPACES
UNDERDEVELOPED PUBLIC TRANSPORT REQUIRES ROAD TRAVEL
GENERALLY MODERATE ON A PER CAPITA BASIS, EVENLY SPLIT BETWEEN HOUSING, TRANSPORT AND INDUSTRY
LOW POPULATION DENSITY
HIGH GDP/CAPITA
HIGH POPULATION
KEY FACTS OTHER FEATURES
LOW POPULATION DENSITY
LOW GDP/CAPITA
HIGH POPULATION
KEY FACTS OTHER FEATURES
CHONGQING, CHINA LOS ANGELES, USA
NEW
LENSES
ON
FUTU
RE C
ITIES C
ITY ARC
HETYPES 23
URBAN POWERHOUSES
PROSPEROUS COMMUNITIES
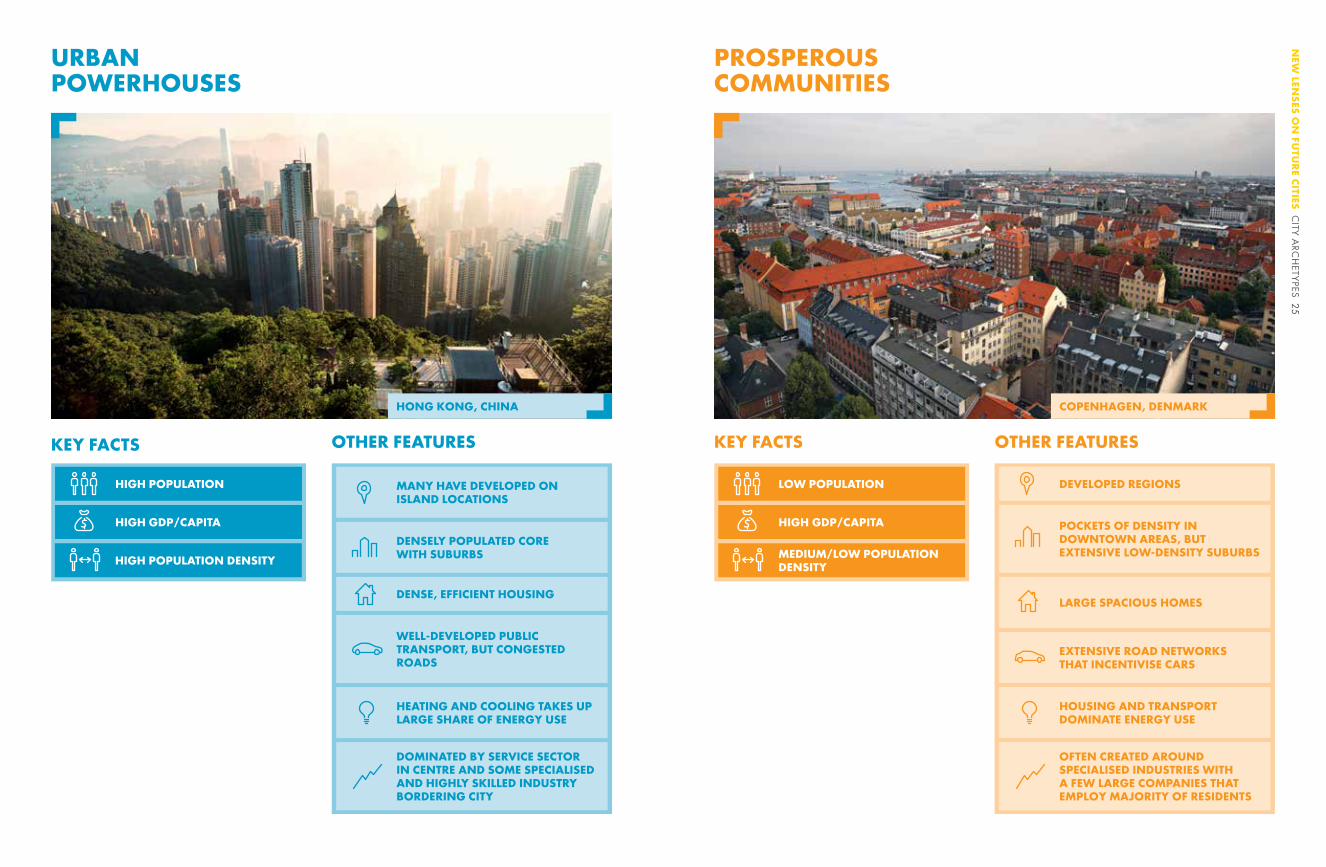
HIGH POPULATION DENSITY
HIGH GDP/CAPITA
HIGH POPULATION
DOMINATED BY SERVICE SECTOR IN CENTRE AND SOME SPECIALISED AND HIGHLY SKILLED INDUSTRY BORDERING CITY
DENSELY POPULATED CORE WITH SUBURBS
MANY HAVE DEVELOPED ON ISLAND LOCATIONS
DENSE, EFFICIENT HOUSING
WELL-DEVELOPED PUBLIC TRANSPORT, BUT CONGESTED ROADS
HEATING AND COOLING TAKES UP LARGE SHARE OF ENERGY USE
KEY FACTS OTHER FEATURES
OFTEN CREATED AROUND SPECIALISED INDUSTRIES WITH A FEW LARGE COMPANIES THAT EMPLOY MAJORITY OF RESIDENTS
POCKETS OF DENSITY IN DOWNTOWN AREAS, BUT EXTENSIVE LOW-DENSITY SUBURBS
DEVELOPED REGIONS
LARGE SPACIOUS HOMES
EXTENSIVE ROAD NETWORKS THAT INCENTIVISE CARS
HOUSING AND TRANSPORT DOMINATE ENERGY USE
MEDIUM/LOW POPULATION DENSITY
HIGH GDP/CAPITA
LOW POPULATION
KEY FACTS OTHER FEATURES
HONG KONG, CHINA COPENHAGEN, DENMARK
NEW
LENSES
ON
FUTU
RE C
ITIES C
ITY ARC
HETYPES 25

CO
NSU
MPTI
ON
/CA
PIT
A
Buildingsper capita
Low
High
Transport Industry Total energyconsumptionper capita
ENERGY USE BY ARCHETYPE (2010)
Sprawling Metropolises Prosperous Communities Urban Powerhouses Developing Mega-hubs Underprivileged Crowded Cities Underdeveloped Urban Centres
ENERGY USE BY ARCHETYPE (2010)
Units: Billion tonnes of oil equivalent* = number of city archetypes worldwide
SPRAWLINGMETROPOLISES (41*)
PROSPEROUS COMMUNITIES (127*)
URBANPOWERHOUSES (8*)
UNDERDEVELOPEDURBAN CENTRES (267*)
UNDERPRIVILEGEDCROWDED CITIES (42*)
DEVELOPINGMEGA–HUBS (26*)
0.22
0.36 0.49
1.66 0.46
1.13
SPRAWLING METROPOLISES Sprawling metropolises are primarily in developed economies with populations of 3-5 million. They have dense downtown areas, but low average densities in their extensive suburbs where the majority of the population lives. Today these cities are considered the American model, but they exist in many developed countries. Sprawling metropolises typically have high-value, service-based economies with industry largely pushed outside the city limits and mobility built primarily around the car.
Energy use is very high, driven by high per capita incomes, larger homes and sprawling suburban areas, and is concentrated in housing and transport. In 2010, sprawling metropolises accounted for more than 38% of total energy used in cities with more than 750,000 residents.
PROSPEROUS COMMUNITIES Prosperous communities are smaller versions of sprawling metropolises with populations between 750,000 and 3 million and are generally wealthy and relatively sparsely populated. They are often created around specialised industries, and it is common to have a few large companies that employ the majority of residents. These cities exist mainly in developed regions of the world, with high concentrations in the United States and western Europe, as well as in South Korea and Japan.
Per capita energy use in these cities is comparatively high as a direct result of higher personal incomes, compounded by some urban sprawl and larger homes. In part because of large, spacious homes and extensive road networks that encourage car use, energy consumption in prosperous communities is concentrated in housing and transport. In 2010, prosperous communities accounted for 26% of the total energy used in cities with populations greater than 750,000 people.
Energy use is currently concentrated in two of these city archetypes: sprawling metropolises and prosperous communities, as would be expected from their relative wealth. Although energy use is also high in urban powerhouses, their total share of consumption is relatively modest since they are few in number. Sprawling metropolises and prosperous communities include relatively low density cities with high GDP/capita, typically in the USA and Europe.
ENERGY IN CITY ARCHETYPES
Source: Booz & Company analysis
NEW
LENSES
ON
FUTU
RE C
ITIES C
ITY ARC
HETYPES 27
0
0.1
0.2
0.3
0.4
0.5
0.6
0.7
0.8
0.9
1.0
1.1
Transition toMegacity
2*
Slum Proliferation
66*
Industrialisation& Modernisation
77*
ControlledUrbanisation
39*
Late StageDevelopment
66*
BIL
LIO
NS
OF
TON
NES
OF
OIL
EQ
UIV
ALE
NT
(201
0–2
025
)
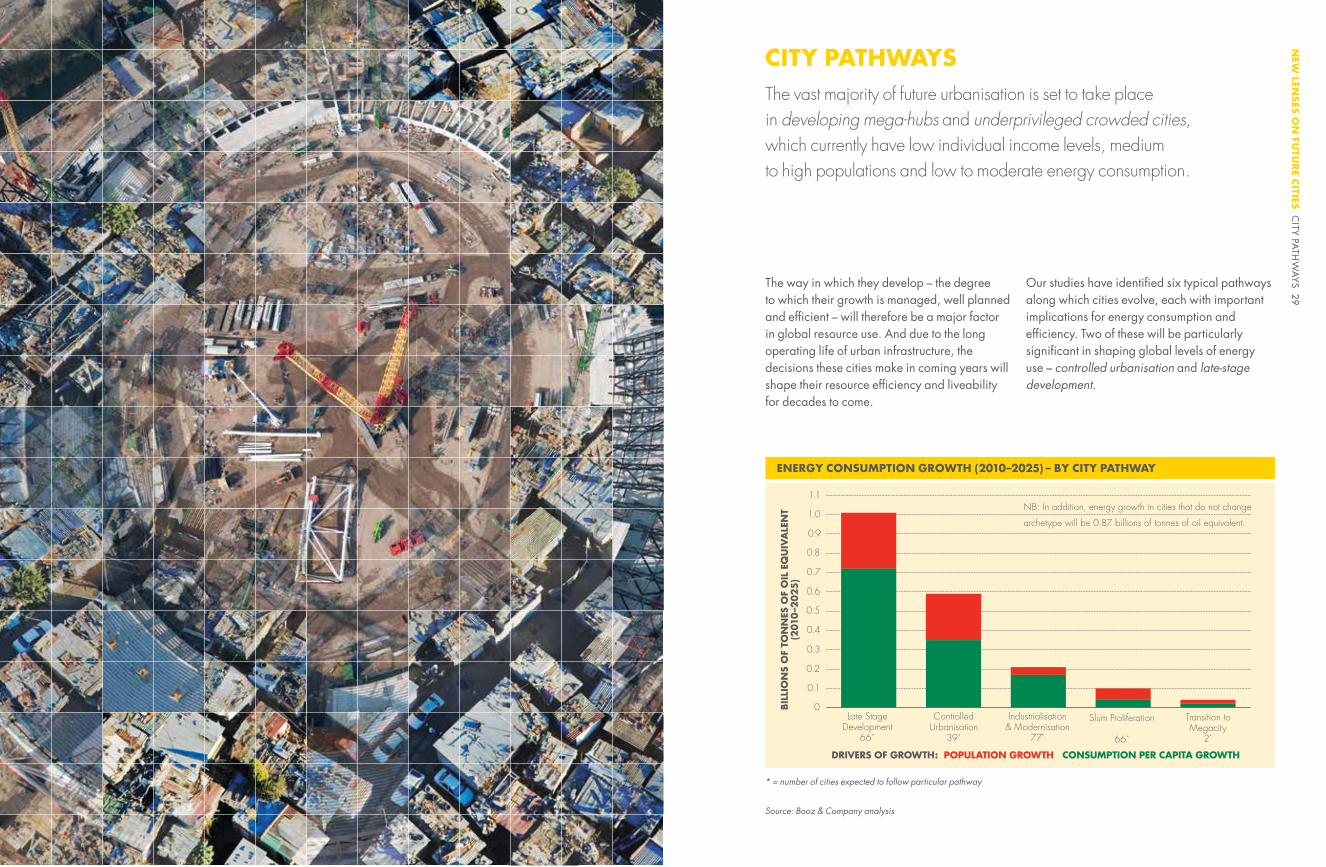
DRIVERS OF GROWTH: POPULATION GROWTH CONSUMPTION PER CAPITA GROWTH
NB: In addition, energy growth in cities that do not change
archetype will be 0.87 billions of tonnes of oil equivalent.
ENERGY CONSUMPTION GROWTH (2010–2025) – BY CITY PATHWAY
CITY PATHWAYSThe vast majority of future urbanisation is set to take place in developing mega-hubs and underprivileged crowded cities, which currently have low individual income levels, medium to high populations and low to moderate energy consumption.
The way in which they develop – the degree to which their growth is managed, well planned and efficient – will therefore be a major factor in global resource use. And due to the long operating life of urban infrastructure, the decisions these cities make in coming years will shape their resource efficiency and liveability for decades to come.
Our studies have identified six typical pathways along which cities evolve, each with important implications for energy consumption and efficiency. Two of these will be particularly significant in shaping global levels of energy use – controlled urbanisation and late-stage development.
Source: Booz & Company analysis
* = number of cities expected to follow particular pathway
NEW
LENSES
ON
FUTU
RE C
ITIES C
ITY PATH
WAYS 29
GDP/CALOW
LOW
GDP/CAHIGH
POPULATION POPULATIONHIGH
PROSPEROUSCOMMUNITIES
SPRAWLINGMETROPOLISES
UNDERDEVELOPEDURBAN CENTRES
UNDERPRIVILEGEDCROWDED CITIES
Urban DeclineTransition toMegacity
Slum Proliferation
DEVELOPINGMEGA-HUBS
Industrialisation& Modernisation
ControlledUrbanisation
Late StageDevelopment
URBANPOWERHOUSES
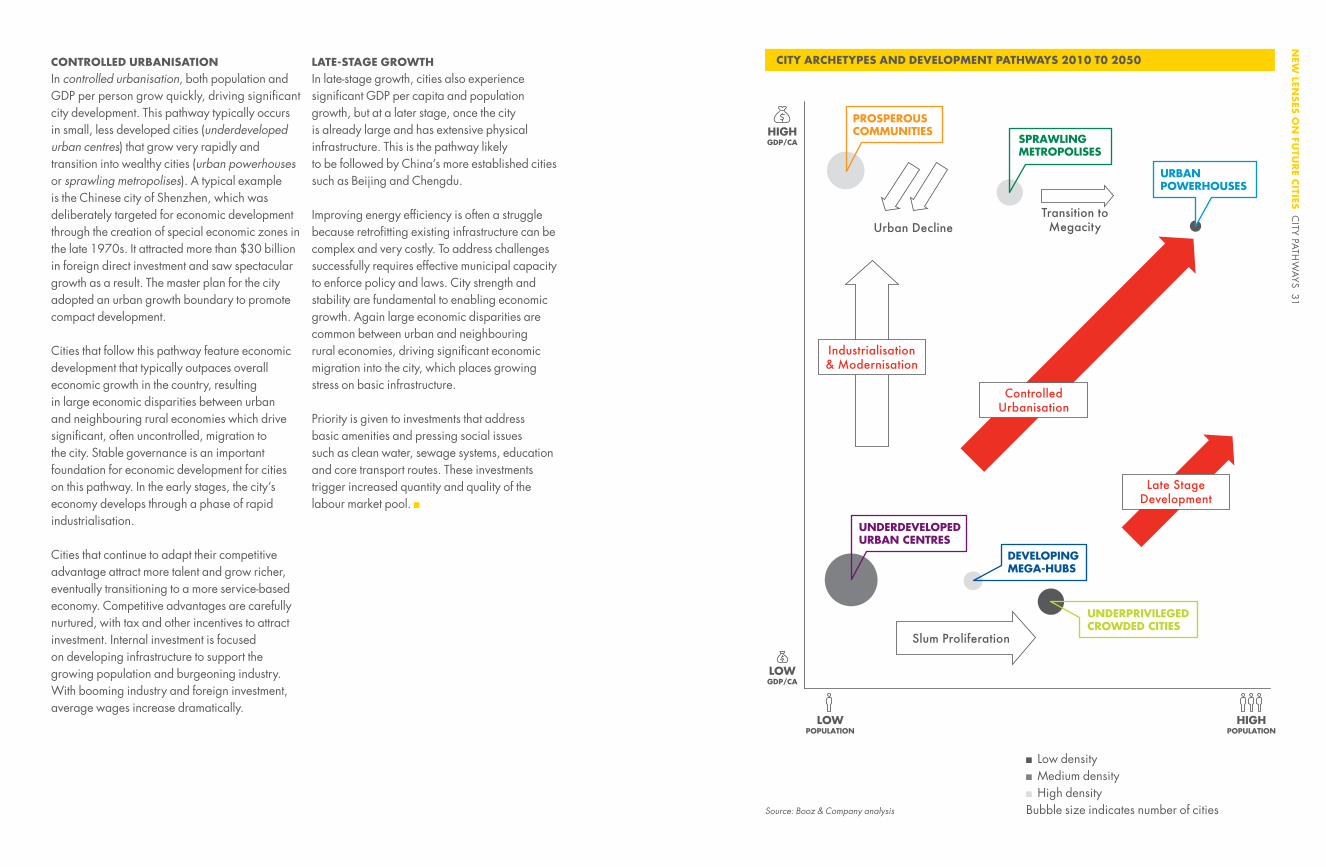
CITY ARCHETYPES AND DEVELOPMENT PATHWAYS 2010 T0 2050
Low density Medium density High density
Bubble size indicates number of cities
CONTROLLED URBANISATION In controlled urbanisation, both population and GDP per person grow quickly, driving significant city development. This pathway typically occurs in small, less developed cities (underdeveloped urban centres) that grow very rapidly and transition into wealthy cities (urban powerhouses or sprawling metropolises). A typical example is the Chinese city of Shenzhen, which was deliberately targeted for economic development through the creation of special economic zones in the late 1970s. It attracted more than $30 billion in foreign direct investment and saw spectacular growth as a result. The master plan for the city adopted an urban growth boundary to promote compact development.
Cities that follow this pathway feature economic development that typically outpaces overall economic growth in the country, resulting in large economic disparities between urban and neighbouring rural economies which drive significant, often uncontrolled, migration to the city. Stable governance is an important foundation for economic development for cities on this pathway. In the early stages, the city’s economy develops through a phase of rapid industrialisation.
Cities that continue to adapt their competitive advantage attract more talent and grow richer, eventually transitioning to a more service-based economy. Competitive advantages are carefully nurtured, with tax and other incentives to attract investment. Internal investment is focused on developing infrastructure to support the growing population and burgeoning industry. With booming industry and foreign investment, average wages increase dramatically.
LATE-STAGE GROWTH In late-stage growth, cities also experience significant GDP per capita and population growth, but at a later stage, once the city is already large and has extensive physical infrastructure. This is the pathway likely to be followed by China’s more established cities such as Beijing and Chengdu.
Improving energy efficiency is often a struggle because retrofitting existing infrastructure can be complex and very costly. To address challenges successfully requires effective municipal capacity to enforce policy and laws. City strength and stability are fundamental to enabling economic growth. Again large economic disparities are common between urban and neighbouring rural economies, driving significant economic migration into the city, which places growing stress on basic infrastructure.
Priority is given to investments that address basic amenities and pressing social issues such as clean water, sewage systems, education and core transport routes. These investments trigger increased quantity and quality of the labour market pool.
Source: Booz & Company analysis
NEW
LENSES
ON
FUTU
RE C
ITIES C
ITY PATH
WAYS 31
PATHWAY LENSES
FOCUSING LENSES ON CITIES
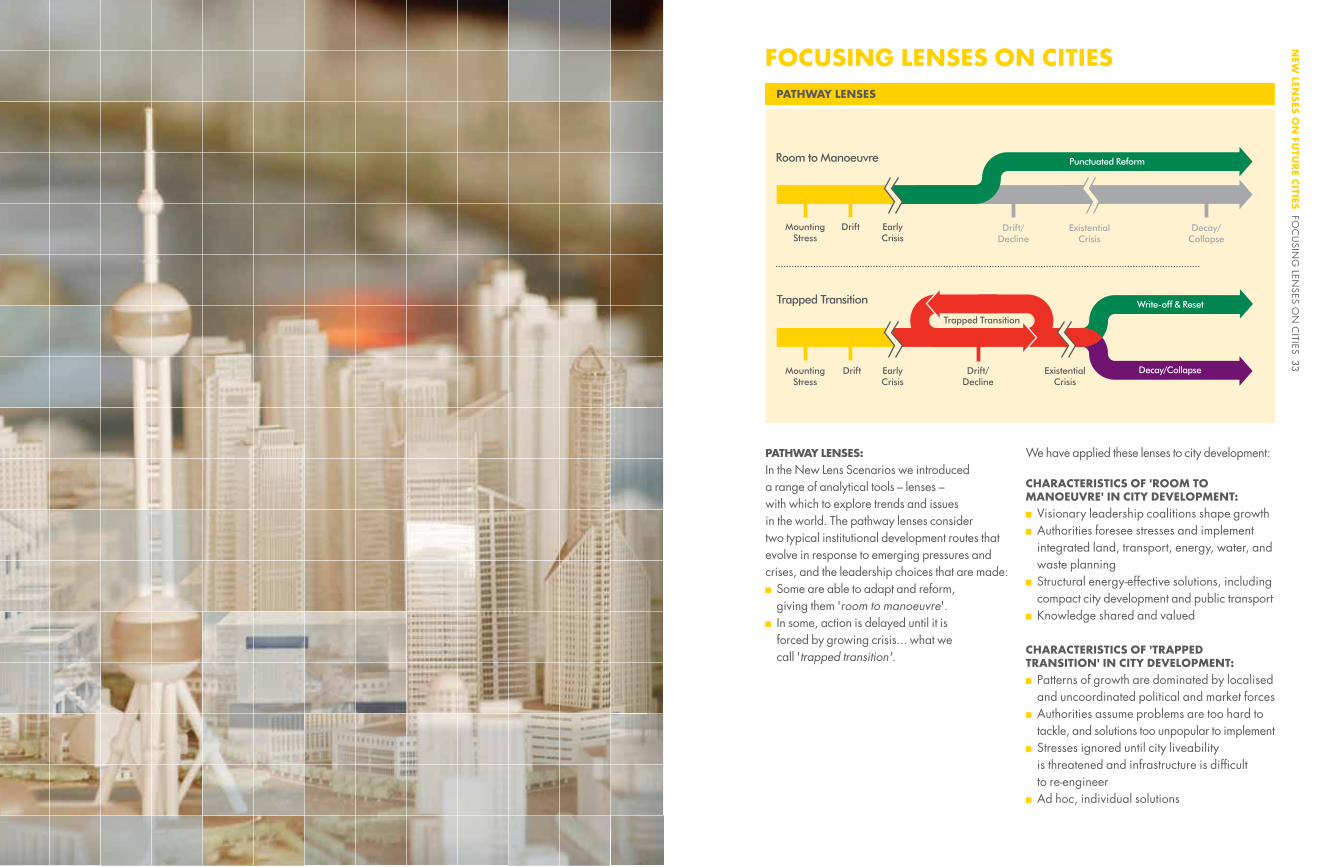
PATHWAY LENSES:In the New Lens Scenarios we introduced a range of analytical tools – lenses – with which to explore trends and issues in the world. The pathway lenses consider two typical institutional development routes that evolve in response to emerging pressures and crises, and the leadership choices that are made: Some are able to adapt and reform, giving them 'room to manoeuvre'.
In some, action is delayed until it is forced by growing crisis... what we call 'trapped transition'.
We have applied these lenses to city development:
CHARACTERISTICS OF 'ROOM TO MANOEUVRE' IN CITY DEVELOPMENT: Visionary leadership coalitions shape growth Authorities foresee stresses and implement integrated land, transport, energy, water, and waste planning
Structural energy-effective solutions, including compact city development and public transport
Knowledge shared and valued
CHARACTERISTICS OF 'TRAPPED TRANSITION' IN CITY DEVELOPMENT: Patterns of growth are dominated by localised and uncoordinated political and market forces
Authorities assume problems are too hard to tackle, and solutions too unpopular to implement
Stresses ignored until city liveability is threatened and infrastructure is difficult to re-engineer
Ad hoc, individual solutions
NEW
LENSES
ON
FUTU
RE C
ITIES FO
CU
SING
LENSES O
N C
ITIES 33

Fifty years ago, Singapore was falling into a trapped transition. A quarter of the 1.6 million population lived below the poverty line. Unemployment rates rose from 5% in 1957 to 14% in 1959. 250,000 people lived in slums in the city centre and another 300,000 in squatter areas. Public hygiene was poor and diseases like malaria and tuberculosis were widespread.
As Singapore gained political independence in 1965, it took decisive steps in the area of urban planning, housing and transportation which created room to manoeuvre for its long-term physical development.
ROOM TO MANOEUVRE IN URBAN PLANNINGSingapore’s development around the time of its independence was guided by the first Master Plan dated 1958. This plan attempted to build on past achievements and deliver change through existing institutions. But it underestimated some key factors, including the rate of urban growth and changes in economic and social needs. It soon proved unable to deliver the progress required for the new nation, and Singapore turned to the United Nations (UN) for technical assistance in 1965.
The 1971 Concept Plan, developed by UN experts with a team of Singaporeans, mapped out a bold vision for Singapore’s physical
development with proposals for new towns, integrated with transport infrastructure, and recreational spaces across the island.
Direct outcomes of the strategies in the Concept Plan 1971 included: the construction of Changi Airport, key corridors of the Mass Rapid Transit system (MRT), the island-wide system of expressways, as well as the development of a ring of high-density satellite towns around the central water catchment area. By the late 1980s, following effective execution of the plan by various agencies, most of the pressing issues that plagued the city at independence had been addressed. However, the planning system was still not transparent enough to mobilise the private sector in urban development.
In 1989, the newly-created Urban Redevelopment Authority took over responsibility to coordinate all facets of planning, regulation of development and the research and statistics activities that were previously split amongst various public bodies. As Singapore continued to evolve, work started on a new concept plan – launched in 1991 – that would reflect the changing circumstances and needs of the city. More informative development guide plans were issued to provide the public and investors with greater certainty and clarity on the type of developments that were allowed. This approach to urban planning has created room to manoeuvre for Singapore.
ROOM TO MANOEUVRE: HOW SINGAPORE ESCAPED TRAPPED TRANSITION
NEW
LENSES
ON
FUTU
RE C
ITIES FO
CU
SING
LENSES O
N C
ITIES 35
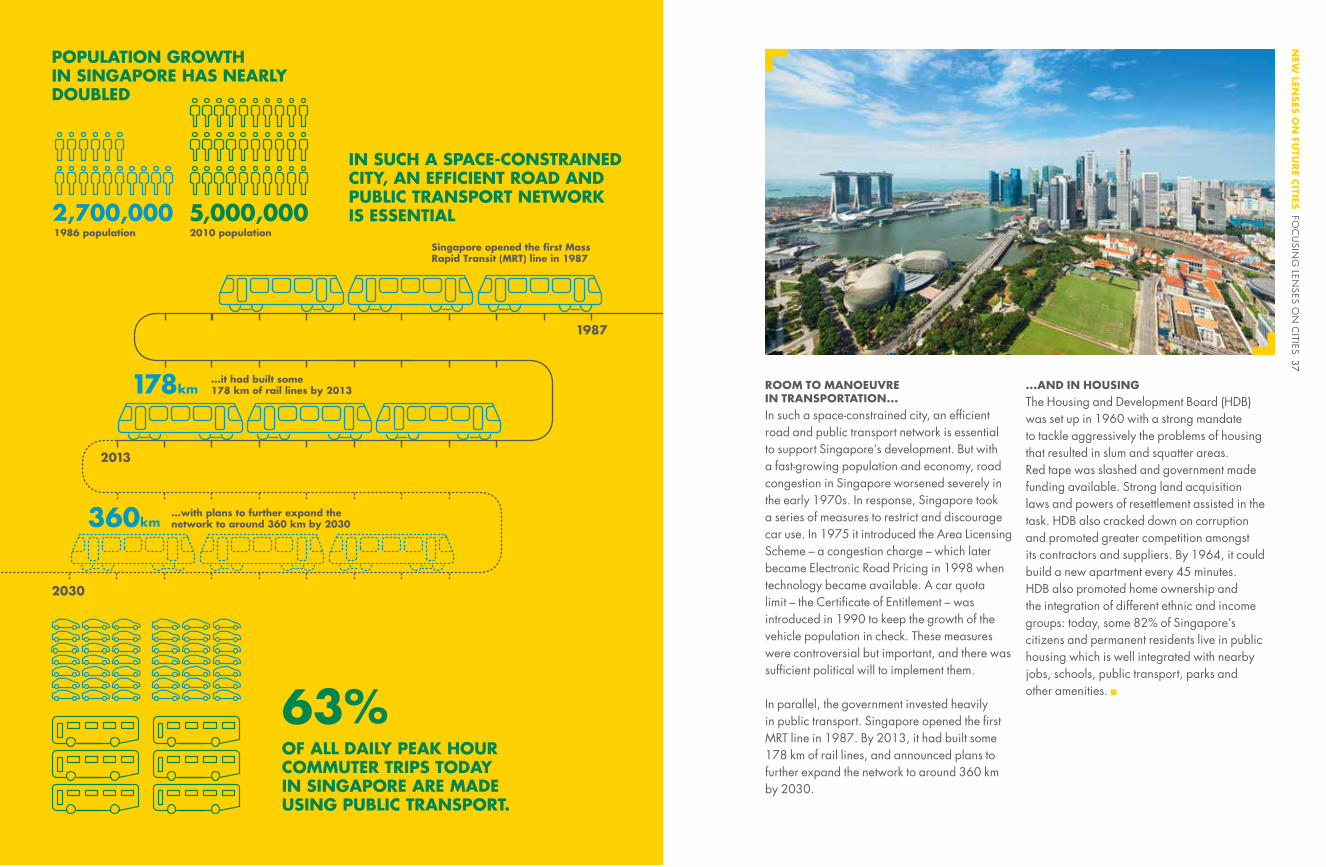
Singapore opened the first Mass Rapid Transit (MRT) line in 1987
OF ALL DAILY PEAK HOUR COMMUTER TRIPS TODAY IN SINGAPORE ARE MADE USING PUBLIC TRANSPORT.
IN SUCH A SPACE-CONSTRAINED CITY, AN EFFICIENT ROAD AND PUBLIC TRANSPORT NETWORK IS ESSENTIAL
1987
2013
2030
360km
178km
63%
...it had built some178 km of rail lines by 2013
...with plans to further expand thenetwork to around 360 km by 2030
POPULATION GROWTH IN SINGAPORE HAS NEARLYDOUBLED
2010 population1986 population
2,700,000 5,000,000
ROOM TO MANOEUVRE IN TRANSPORTATION...In such a space-constrained city, an efficient road and public transport network is essential to support Singapore’s development. But with a fast-growing population and economy, road congestion in Singapore worsened severely in the early 1970s. In response, Singapore took a series of measures to restrict and discourage car use. In 1975 it introduced the Area Licensing Scheme – a congestion charge – which later became Electronic Road Pricing in 1998 when technology became available. A car quota limit – the Certificate of Entitlement – was introduced in 1990 to keep the growth of the vehicle population in check. These measures were controversial but important, and there was sufficient political will to implement them.
In parallel, the government invested heavily in public transport. Singapore opened the first MRT line in 1987. By 2013, it had built some 178 km of rail lines, and announced plans to further expand the network to around 360 km by 2030.
...AND IN HOUSINGThe Housing and Development Board (HDB) was set up in 1960 with a strong mandate to tackle aggressively the problems of housing that resulted in slum and squatter areas. Red tape was slashed and government made funding available. Strong land acquisition laws and powers of resettlement assisted in the task. HDB also cracked down on corruption and promoted greater competition amongst its contractors and suppliers. By 1964, it could build a new apartment every 45 minutes. HDB also promoted home ownership and the integration of different ethnic and income groups: today, some 82% of Singapore’s citizens and permanent residents live in public housing which is well integrated with nearby jobs, schools, public transport, parks and other amenities.
NEW
LENSES
ON
FUTU
RE C
ITIES FO
CU
SING
LENSES O
N C
ITIES 37

FLEXIBLE LONG-TERM PLANNINGCircumstances change and urban planning decisions taken in the present need to build in sufficient capacity to adapt and evolve to reflect future realities, technology trends and stresses. A clear vision helps build support for or acceptance of long-term and sometimes unpopular policies. When London set a target to reduce its emissions by 60% from 1990 levels by 2025, this set a direction of travel but left enough room to design incremental
policy. Introducing cycles for rent and daily charging for driving through the congestion-charging zone and for vehicles with high emissions are among subsequent schemes to cut emissions in London. Planning should allow for changes to occur on a micro-level. Leaving a strip of land empty in areas with growing population, for example, would make it easier to build new transport links if and when required, rather than having to retrofit a more expensive line.
Shell and the Singapore Centre for Liveable Cities conducted a series of workshops to explore what conditions lead cities to respond to an emerging crisis with early reform instead of further drift. Our discussions revealed the following five factors that create room to manoeuvre:
INVEST IN THE FUTUREHand-in-hand with a long-term vision comes the recognition that investments in the future need to be made continuously. Just like good companies continue hiring in an economic downturn to ensure a pipeline of future talent, cities that want to keep ahead will continue to invest in education, capacity and innovation hubs. Anticipating skills needed to drive future economic growth will lead to an integrated programme of education, and incentives to retain and attract skilled citizens and migrants in ways that do not create social tensions. Investment in the future also applies to infrastructure and technologies. Under a 1997 agreement between the Berlin Senate and the city’s business community, 75% of all new buildings constructed in any given year had to include solar thermal strategies in their design. Berlin also has an ongoing scheme to retrofit its housing stock; to date it has nearly halved the amount of energy used by 273,000 concrete pre-fabricated buildings in the eastern part of the city.
CAPACITY TO IMPLEMENTSuccessful cities are not only able to design the proper policies or planning systems, but are highly effective in implementing these measures. This stems from a combination of having the right people involved and finding common goals between stakeholders – including the general public – creating support for the execution of plans. Having professional project management, technical and commercial experts to implement them is crucial. Effective execution is reinforced by transparent measurement. Quick and visible wins on the pathway to a longer-term objective increase the credibility of the vision. A vision of 'Copenhagen climate neutral by 2025' led to a wide range of initiatives such as cycle schemes in the city, green rooftops and more electric vehicles. Studies from Copenhagen show that the green technology sector (such as wind, solar and energy efficiency technology companies) in the capital region has increased by 55% over the course of five years.
BUILDING TRUSTCities that attract businesses and citizens to settle provide a stable environment for them: consistency in rules and regulation, no sudden changes to these and a sense of fairness for all involved. This includes punishing any form of corruption visibly and providing justice to all inhabitants by treating everyone – including minorities – equally. Trust is also built by involving everyone and connecting with them on an emotional level. People can also be encouraged to be involved through promoting transparency. Cities like Helsinki have been pioneers in putting data online on topics like population, transport and education allowing developers to create useful applications. This involves citizens and creates the transparency required for trust in the city and its government. An application that was possible because Helsinki enabled ‘API’ (automatic programming interface – allowing the city to receive feedback from external services) is ‘fixmystreet’, where citizens can report non-emergency issues such as potholes on the streets to be fixed.
COLLABORATIONAll sections of society have to work together relatively well if the problems associated with cities’ growth are to be addressed. Government has to offer better incentives and sanctions for smart growth; civil society must be encouraged to moderate demand for immediate goods in favour of infrastructure for the whole; and businesses need to offer smarter and more integrated solutions to infrastructure, housing and traffic demands. The public and private sectors must partner together and innovate, finding financing models that work, particularly in cash-constrained environments. To prosper, all groups must operate in a co-ordinated way to some degree, yet this is a hard challenge to master. Connected and collaborative institutions can help share resources and allow free transfer of people and skills between them. Co-ordinating bodies with overall responsibility can help overcome disagreements and avoid paralysis.
FACTORS THAT CREATE ROOM TO MANOEUVRE
NEW
LENSES
ON
FUTU
RE C
ITIES FO
CU
SING
LENSES O
N C
ITIES 39
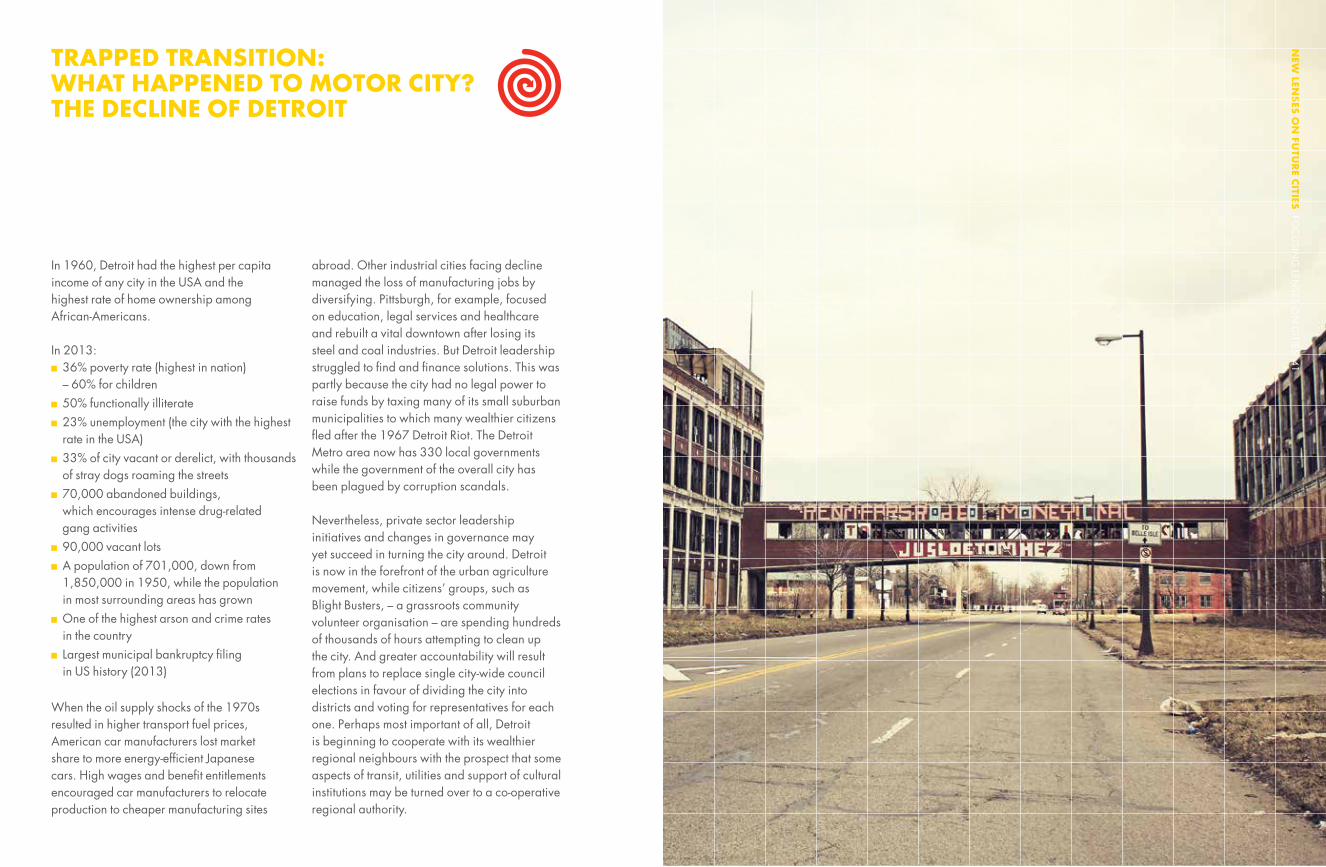
In 1960, Detroit had the highest per capita income of any city in the USA and the highest rate of home ownership among African-Americans. In 2013: 36% poverty rate (highest in nation) – 60% for children
50% functionally illiterate 23% unemployment (the city with the highest rate in the USA)
33% of city vacant or derelict, with thousands of stray dogs roaming the streets
70,000 abandoned buildings, which encourages intense drug-related gang activities
90,000 vacant lots A population of 701,000, down from 1,850,000 in 1950, while the population in most surrounding areas has grown
One of the highest arson and crime rates in the country
Largest municipal bankruptcy filing in US history (2013)
When the oil supply shocks of the 1970s resulted in higher transport fuel prices, American car manufacturers lost market share to more energy-efficient Japanese cars. High wages and benefit entitlements encouraged car manufacturers to relocate production to cheaper manufacturing sites
abroad. Other industrial cities facing decline managed the loss of manufacturing jobs by diversifying. Pittsburgh, for example, focused on education, legal services and healthcare and rebuilt a vital downtown after losing its steel and coal industries. But Detroit leadership struggled to find and finance solutions. This was partly because the city had no legal power to raise funds by taxing many of its small suburban municipalities to which many wealthier citizens fled after the 1967 Detroit Riot. The Detroit Metro area now has 330 local governments while the government of the overall city has been plagued by corruption scandals.
Nevertheless, private sector leadership initiatives and changes in governance may yet succeed in turning the city around. Detroit is now in the forefront of the urban agriculture movement, while citizens’ groups, such as Blight Busters, – a grassroots community volunteer organisation – are spending hundreds of thousands of hours attempting to clean up the city. And greater accountability will result from plans to replace single city-wide council elections in favour of dividing the city into districts and voting for representatives for each one. Perhaps most important of all, Detroit is beginning to cooperate with its wealthier regional neighbours with the prospect that some aspects of transit, utilities and support of cultural institutions may be turned over to a co-operative regional authority.
TRAPPED TRANSITION: WHAT HAPPENED TO MOTOR CITY? THE DECLINE OF DETROIT
NEW
LENSES
ON
FUTU
RE C
ITIES FO
CU
SING
LENSES O
N C
ITIES 41N
EW LEN
SES
ON
FUTU
RE C
ITIES FO
CU
SING
LENSES O
N C
ITIES 41

70,000
Detroit had thehighest per capitaincome of anycity in the USA
In
1960
DETROITit faced the highestpoverty rate in the USA
but by
2013
unemployment,the highest ratein the USA
of the population arefunctionally illiterate
child poverty rate
abandoned buildings
of city vacant or derelict
1950 population 2013 population
23%
33%
50 %
60 %
1,850,000 701,000
While room to manoeuvre is desirable, minor crises and a short period of trapped transition can actually shock a city into new opportunities. The 1952 Great Smog in London is an example of such a reset. Although London had long suffered from air pollution, little had been done to address it. This occasion proved to be so deadly that Parliament passed an air pollution act that led to a significant improvement in overall air quality. More recently, authorities in Christchurch, New Zealand, described the devastating 2011 earthquake as “an unprecedented opportunity to rethink, revitalise and renew the city of Christchurch.” And the US Environmental Protection Agency pledged more than half a billion dollars for New Jersey and New York to help recover from the devastation of the 2012 Hurricane Sandy and build more resilient waste water and drinking water infrastructure able to withstand the impacts of possible future storms.
Most cities probably exhibit a mixture of both trapped transition and room to manoeuvre in relation to the various challenges they face. Indeed, some cities demonstrate trapped transition characteristics in relation to some challenges, while developing room to manoeuvre in response to others. In cities with high levels of income inequality, this becomes especially visible. Gated communities prosper and have the resources to deal with changes, whereas slums are vulnerable and unable to resolve growing crises.
RESETTING CITY CHALLENGESN
EW LEN
SES
ON
FUTU
RE C
ITIES FO
CU
SING
LENSES O
N C
ITIES 43

Outcomes (Whats)
Systems (Hows)
High Quality of Life
CompetitiveEconomy
Integrated Master Planning & Development■ Think Long-term■ ‘Fight Productively’■ Build in some Flexibility■ Execute Effectively■ Innovate Systematically
Dynamic Urban Governance
SustainableEnvironment
■ Lead with Vision and Pragmatism■ Build a Culture of Integrity■ Cultivate Sound Institutions■ Involve the Community as Stakeholders■ Work with Markets
The framework describes the outcomes of a liveable city as a combination of a high quality of life, a competitive economy and a sustainable environment. It refers to the systems used to achieve this as 'integrated master planning and development' and 'dynamic urban governance'.
Integrated master planning goes beyond the making of physical plans. It addresses the need to optimise planning decisions so that the outcomes for the environment, economy and quality of life can be balanced, especially with competing demands for use of limited urban land. It must also ensure that meeting long-term outcomes as well as short-term needs are optimised.
Dynamic urban governance refers to the manner in which public leadership interacts with citizens and other stakeholders to make decisions regarding, and has oversight over, how a city plans, develops, uses and manages its physical and environmental resources to achieve national outcomes.
CLC FRAMEWORK FOR LIVEABLE AND SUSTAINABLE CITIES
Singapore’s capacity to develop room to manoeuvre was a result of various efforts and initiatives – some successful, others not. CLC has summarised lessons from effective development in Singapore in a framework of principles including long-term thinking, a structured planning process and systematic innovation.
“ WITH LIMITED LAND AND ALMOST NO NATURAL RESOURCES, SINGAPORE HAD TO PLAN LONG-TERM TO ACHIEVE A SUSTAINABLE ENVIRONMENT, A COMPETITIVE ECONOMY AND A GOOD QUALITY OF LIFE.”
NEW
LENSES
ON
FUTU
RE C
ITIES FO
CU
SING
LENSES O
N C
ITIES 45
OilCoalNatural GasNuclearHydro
ELECTRICITYSECTOR
Biomass andRenewables
USEFULENERGY
ENERGY DEMAND GROWTH MODERATION OPPORTUNITIES
*1 Comprises of refineries, LNG shipping etc.
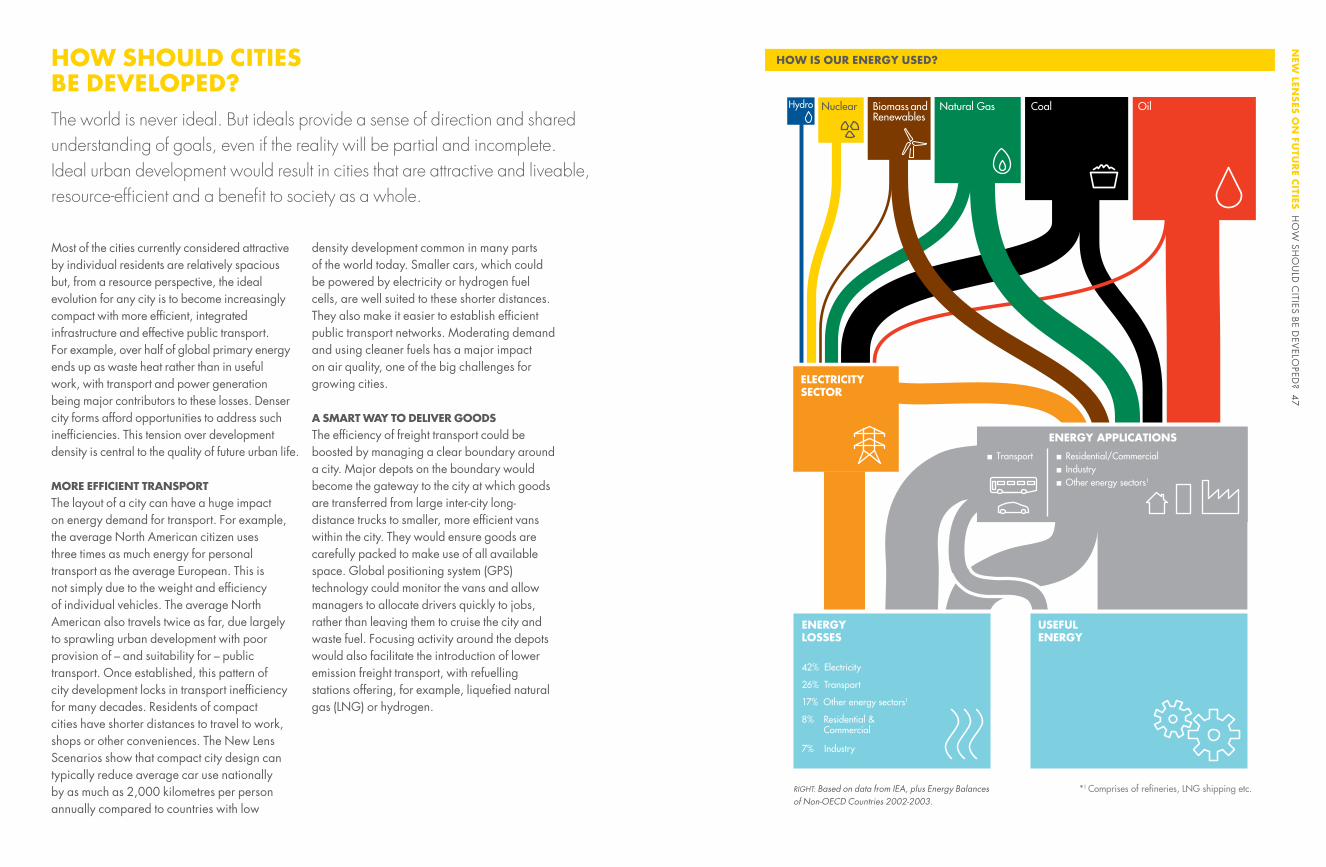
ENERGY LOSSES
8% Residential & Commercial
42% Electricity
7% Industry
26% Transport
17% Other energy sectors1
n Transport n Residential/Commercialn Industryn Other energy sectors1
ENERGY APPLICATIONS
HOW IS OUR ENERGY USED?
Most of the cities currently considered attractive by individual residents are relatively spacious but, from a resource perspective, the ideal evolution for any city is to become increasingly compact with more efficient, integrated infrastructure and effective public transport. For example, over half of global primary energy ends up as waste heat rather than in useful work, with transport and power generation being major contributors to these losses. Denser city forms afford opportunities to address such inefficiencies. This tension over development density is central to the quality of future urban life.
MORE EFFICIENT TRANSPORTThe layout of a city can have a huge impact on energy demand for transport. For example, the average North American citizen uses three times as much energy for personal transport as the average European. This is not simply due to the weight and efficiency of individual vehicles. The average North American also travels twice as far, due largely to sprawling urban development with poor provision of – and suitability for – public transport. Once established, this pattern of city development locks in transport inefficiency for many decades. Residents of compact cities have shorter distances to travel to work, shops or other conveniences. The New Lens Scenarios show that compact city design can typically reduce average car use nationally by as much as 2,000 kilometres per person annually compared to countries with low
density development common in many parts of the world today. Smaller cars, which could be powered by electricity or hydrogen fuel cells, are well suited to these shorter distances. They also make it easier to establish efficient public transport networks. Moderating demand and using cleaner fuels has a major impact on air quality, one of the big challenges for growing cities.
A SMART WAY TO DELIVER GOODSThe efficiency of freight transport could be boosted by managing a clear boundary around a city. Major depots on the boundary would become the gateway to the city at which goods are transferred from large inter-city long-distance trucks to smaller, more efficient vans within the city. They would ensure goods are carefully packed to make use of all available space. Global positioning system (GPS) technology could monitor the vans and allow managers to allocate drivers quickly to jobs, rather than leaving them to cruise the city and waste fuel. Focusing activity around the depots would also facilitate the introduction of lower emission freight transport, with refuelling stations offering, for example, liquefied natural gas (LNG) or hydrogen.
HOW SHOULD CITIES BE DEVELOPED?
RIGHT: Based on data from IEA, plus Energy Balances of Non-OECD Countries 2002-2003.
The world is never ideal. But ideals provide a sense of direction and shared understanding of goals, even if the reality will be partial and incomplete. Ideal urban development would result in cities that are attractive and liveable, resource-efficient and a benefit to society as a whole.
NEW
LENSES
ON
FUTU
RE C
ITIES H
OW
SHO
ULD
CITIES BE D
EVELO
PED? 47
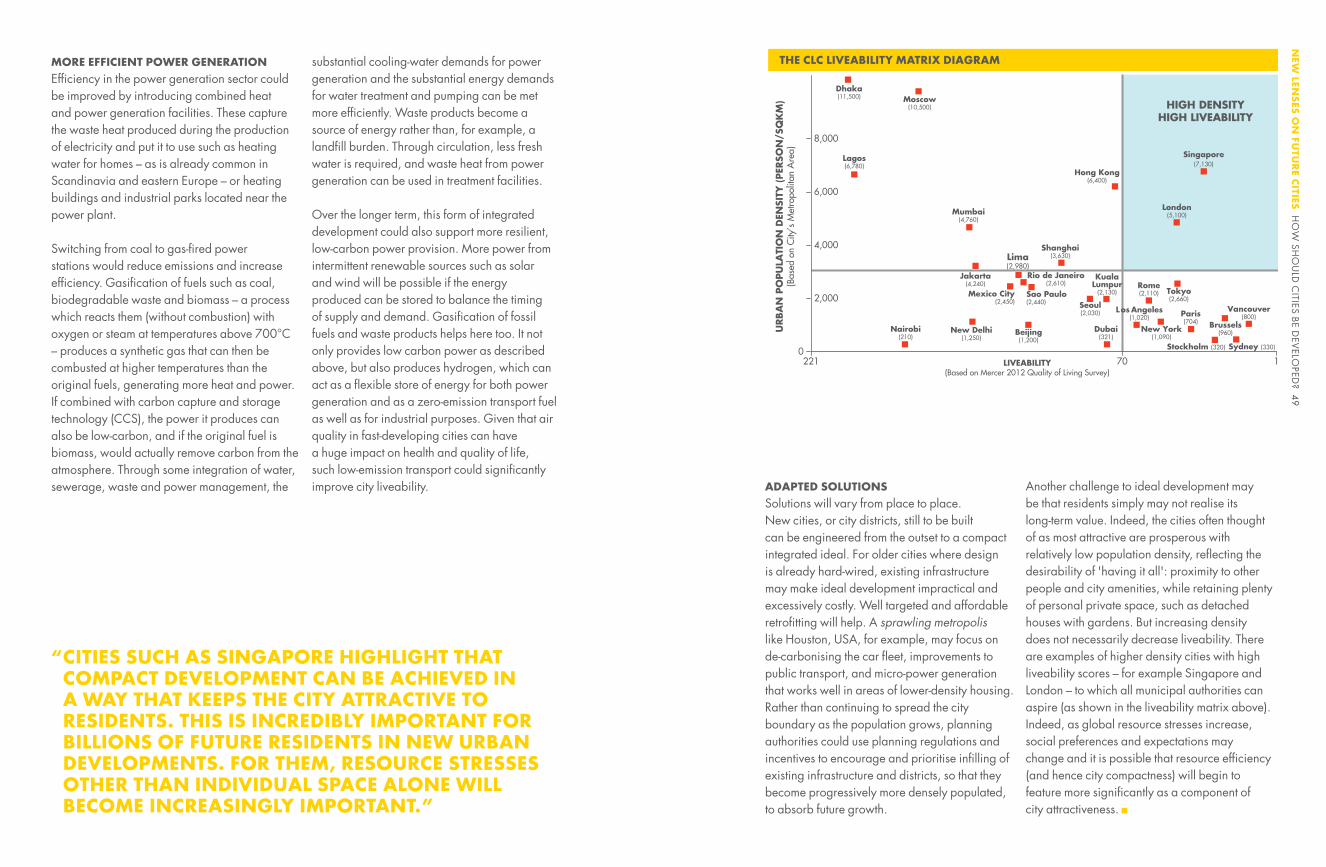
0221 70 1
2,000
4,000
6,000
8,000
URBA
N P
OPU
LATI
ON
DEN
SITY
(PER
SON
/SQ
KM
)(B
ased
on
City
’s M
etro
polit
an A
rea)
HIGH DENSITYHIGH LIVEABILITY
LIVEABILITY(Based on Mercer 2012 Quality of Living Survey)
Moscow(10,500)
Dhaka(11,500)
Lagos(6,780)
Mumbai(4,760)
Hong Kong(6,400)
Jakarta(4,240)
Mexico City(2,450)
Rio de Janeiro(2,610)
Sao Paulo(2,440)
KualaLumpur
(2,130)
Seoul(2,030)
Beijing(1,200)
New Delhi(1,250)
Nairobi(210)
Dubai(321)
Tokyo(2,660)
Rome(2,110)
Los Angeles(1,020)
New York(1,090)
Paris(704) Brussels
(960)
Stockholm (320) Sydney (330)
Vancouver(800)
Lima(2,980)
Shanghai(3,630)
Singapore(7,130)
London(5,100)
THE CLC LIVEABILITY MATRIX DIAGRAMMORE EFFICIENT POWER GENERATIONEfficiency in the power generation sector could be improved by introducing combined heat and power generation facilities. These capture the waste heat produced during the production of electricity and put it to use such as heating water for homes – as is already common in Scandinavia and eastern Europe – or heating buildings and industrial parks located near the power plant.
Switching from coal to gas-fired power stations would reduce emissions and increase efficiency. Gasification of fuels such as coal, biodegradable waste and biomass – a process which reacts them (without combustion) with oxygen or steam at temperatures above 700°C – produces a synthetic gas that can then be combusted at higher temperatures than the original fuels, generating more heat and power. If combined with carbon capture and storage technology (CCS), the power it produces can also be low-carbon, and if the original fuel is biomass, would actually remove carbon from the atmosphere. Through some integration of water, sewerage, waste and power management, the
substantial cooling-water demands for power generation and the substantial energy demands for water treatment and pumping can be met more efficiently. Waste products become a source of energy rather than, for example, a landfill burden. Through circulation, less fresh water is required, and waste heat from power generation can be used in treatment facilities.
Over the longer term, this form of integrated development could also support more resilient, low-carbon power provision. More power from intermittent renewable sources such as solar and wind will be possible if the energy produced can be stored to balance the timing of supply and demand. Gasification of fossil fuels and waste products helps here too. It not only provides low carbon power as described above, but also produces hydrogen, which can act as a flexible store of energy for both power generation and as a zero-emission transport fuel as well as for industrial purposes. Given that air quality in fast-developing cities can have a huge impact on health and quality of life, such low-emission transport could significantly improve city liveability. ADAPTED SOLUTIONS
Solutions will vary from place to place. New cities, or city districts, still to be built can be engineered from the outset to a compact integrated ideal. For older cities where design is already hard-wired, existing infrastructure may make ideal development impractical and excessively costly. Well targeted and affordable retrofitting will help. A sprawling metropolis like Houston, USA, for example, may focus on de-carbonising the car fleet, improvements to public transport, and micro-power generation that works well in areas of lower-density housing. Rather than continuing to spread the city boundary as the population grows, planning authorities could use planning regulations and incentives to encourage and prioritise infilling of existing infrastructure and districts, so that they become progressively more densely populated, to absorb future growth.
Another challenge to ideal development may be that residents simply may not realise its long-term value. Indeed, the cities often thought of as most attractive are prosperous with relatively low population density, reflecting the desirability of 'having it all': proximity to other people and city amenities, while retaining plenty of personal private space, such as detached houses with gardens. But increasing density does not necessarily decrease liveability. There are examples of higher density cities with high liveability scores – for example Singapore and London – to which all municipal authorities can aspire (as shown in the liveability matrix above). Indeed, as global resource stresses increase, social preferences and expectations may change and it is possible that resource efficiency (and hence city compactness) will begin to feature more significantly as a component of city attractiveness.
“ CITIES SUCH AS SINGAPORE HIGHLIGHT THAT COMPACT DEVELOPMENT CAN BE ACHIEVED IN A WAY THAT KEEPS THE CITY ATTRACTIVE TO RESIDENTS. THIS IS INCREDIBLY IMPORTANT FOR BILLIONS OF FUTURE RESIDENTS IN NEW URBAN DEVELOPMENTS. FOR THEM, RESOURCE STRESSES OTHER THAN INDIVIDUAL SPACE ALONE WILL BECOME INCREASINGLY IMPORTANT.”
NEW
LENSES
ON
FUTU
RE C
ITIES H
OW
SHO
ULD
CITIES BE D
EVELO
PED? 49

The scale of challenge and opportunity in China has significance on a global scale. By 2030, an additional 350 million Chinese will inhabit cities. The way in which urbanisation occurs in China will have enormous an impact on resource efficiency.
Shell and the Development Research Center of the State Council of China recently collaborated on a project assessing the future energy needs of the country. The joint study found that with the right policies, choices, regulations and frameworks of incentives in place, China can accommodate all anticipated urban population growth through to 2030 without increasing urban footprint.
Of China’s 130 largest cities, more than half are in the preliminary stages of development. These cities face the tremendous challenge of developing with both efficiency and liveability planned into their infrastructure and spatial design. Increasing the density of development in small and medium cities to resemble London, UK, and Paris, France, would help create the conditions to reduce energy use and emissions.
CASE STUDY: THE CHINA OPPORTUNITYCompact city layout is essential for resource efficiency. While existing cities may have to retrofit where possible and affordable, new developments can be designed to be compact, resource-efficient and liveable from the outset, implementing a range of well integrated transport, heat and power technologies.
NEW
LENSES
ON
FUTU
RE C
ITIES TH
E CH
INA
OPPO
RTUN
ITY 51

A 'GREEN EDGE' CITY MODEL FOR CHINAAlmost one billion people will live in Chinese cities by the end of 2030. To guide this urbanisation within the ambitious environmental goals introduced in China’s 11th and 12th five-year plans, covering 2006–2015, the country must find a scalable model for urban development that addresses long-term challenges, while supporting economic growth and improving living standards. Shell and Dynamic City Foundation, a Shanghai-based urban research and design group, have explored a 'green edge' city solution that addresses the many challenges facing China’s urban planners:
How to prevent vast urban clusters from developing in a way that continues to consume more of China’s most productive, arable land and to damage natural ecosystems.
How to ensure that rapidly urbanising areas remain connected to regional and national mass transit networks and major infrastructure developments.
How to serve the urban clusters with energy from low-carbon sources and transmit energy with minimum energy loss into clusters of consumption and production.
A 'green edge' concept addresses these interlinked challenges. It describes an urban-rural boundary that re-introduces a distinct border between city and countryside. It limits urbanisation to areas with access to public transportation and infrastructure. Creating a green edge is the first step in achieving compact and sustainable urban growth. An analysis of all Chinese cities with more than 100,000 people in 2010 showed that there are 498 potential 'green edge' sites in China. By increasing their densities within current city boundaries and allocating urban space more efficiently, these cities can accommodate China’s entire projected urban population growth to 2030.
DESIGN PRINCIPLES HIGHLIGHTED FOR EFFECTIVE DEVELOPMENT
Detailed city inventory: Ensuring a city is planned for local conditions.
Transit-oriented development: Using city design to maximise access to and use of public transport.
Flexible zoning: Relaxing stringent zoning policy to support mixed use-cities and the shift from an industrial to a service economy.
Time-oriented development: Ensuring infrastructure developments are planned to allow them to adapt to future conditions.
Reduced plot sizes: Discouraging the tendency for mega-architecture projects and aesthetically monotonous cities by encouraging smaller, diverse developments.
Dynamic density: Encouraging higher densities around transit hubs and lower densities in residential areas and providing incentives to developers to preserve and create usable green space.
Micro-grids for roads: Creating cities that encourage pedestrians and bicyclists by introducing a finer road grid.
Retrofitting the old city: Connecting and integrating new city zones as they develop, with the historic urban core and eventually the whole city.
It will require relatively stable and consistent government at municipal and national levels, along with dynamic urban governance; institutional structures enabling integrated master planning; municipal access to budget and capital; thriving educational institutions; smart social, labour and welfare policies; and commercial frameworks that bring investment and a thriving, innovative private sector.
Co-ordinating across these domains requires a systems perspective, recognising the links between numerous material and social systems and also that needs will evolve significantly over the years. Today’s successful cities will grow rapidly, bringing new opportunities and adding significant strains to existing infrastructures. Tomorrow’s success will depend on how well these are managed and how quickly government, business and civil society improve their collaboration today. The importance of the interplay between these sectors of society is a recurring lesson from our New Lens Scenario work, and details of this are once again emphasised when we place the scenario lenses on cities.
In recent years a proliferation of organisations and initiatives to address these issues has emerged, including some which we have mentioned in this report. Examples of good – sometimes excellent – practice can be found
and municipal leaders are increasingly sharing and replicating successful initiatives elsewhere. But there is a long way to go. By 2050, three-quarters of our global population will live in cities. The world will need to evolve radically new and financially sustainable models that manage the growing pressure on energy, food and water, and allow urbanisation to deliver wellbeing and prosperity to residents.
At Shell, we are finding that our new lenses are helping us to understand better the challenges and opportunities in cities. We hope they will also inspire shared perspectives among businesses, national governments, municipal authorities and civil society more broadly. Only through working together will urbanisation – one of the great social phenomena of our times – be shaped in ways that greatly enhance the quality of life for billions of people.
REFLECTIONSLooking at cities through the lenses introduced in the New Lens Scenarios gives much to reflect upon. There is huge social, environmental, commercial and political value at stake in achieving efficient urban development. But realising this widely will be a significant challenge.
“TOMORROW’S SUCCESS WILL DEPEND ON HOW QUICKLY GOVERNMENT, BUSINESS AND CIVIL SOCIETY IMPROVE THEIR COLLABORATION TODAY”
NEW
LENSES
ON
FUTU
RE C
ITIES REFLEC
TION
S 53
DISCLAIMER
This scenarios book contains forward-looking statements that may affect Shell’s financial condition, results of operations, and businesses of Royal Dutch Shell.
All statements other than statements of historical fact are, or may be deemed to be, forward-looking statements. Forward-looking statements are statements of future expectations that are based on management’s current expectations and assumptions and involve known and unknown risks and uncertainties that could cause actual results, performance or events to differ materially from those expressed or implied in these statements. Forward-looking statements include, among other things, statements concerning the potential exposure of Royal Dutch Shell to market risks and statements expressing management’s expectations, beliefs, estimates, forecasts, projections, and assumptions. These forward-looking statements are identified by their use of terms and phrases such as ‘‘anticipate’’, ‘‘believe’’, ‘‘could’’, ‘‘estimate’’, ‘‘expect’’, ‘‘goals’’, ‘‘intend’’, ‘‘may’’, ‘‘objectives’’, ‘‘outlook’’, ‘‘plan’’, ‘‘probably’’, ‘‘project’’, ‘‘risks’’, ‘‘seek’’, ‘‘should’’, ‘‘target’’, ‘‘will’’, and similar terms and phrases.
There are a number of factors that could affect the future operations of Royal Dutch Shell and could cause those results to differ materially from those expressed in the forward-looking statements included in this scenarios book, including (without limitation): (a) price fluctuations in crude oil and natural gas; (b) changes in demand for Shell’s products; (c) currency fluctuations; (d) drilling and production results; (e) reserves estimates; (f) loss of market share and industry competition; (g) environmental and physical risks; (h) risks associated with the identification of
suitable potential acquisition properties and targets, and successful negotiation and completion of such transactions;
(i) the risk of doing business in developing countries and countries subject to international sanctions;
(j) legislative, fiscal, and regulatory developments including regulatory measures addressing climate change;
(k) economic and financial market conditions in various countries and regions;
(l) political risks, including the risks of expropriation and renegotiation of the terms of contracts with governmental entities, delays or advancements in the approval of projects, and delays in the reimbursement for shared costs; and
(m) changes in trading conditions.
All forward-looking statements contained in this scenarios book are expressly qualified in their entirety by the cautionary statements contained or referred to in this section. Readers should not place undue reliance on forward-looking statements. Additional factors that may affect future results are contained in Royal Dutch Shell’s 20-F for the year ended December 31, 2012 which is available at www.shell.com/investor and www.sec.gov.
These factors also should be considered by the reader. Each forward-looking statement speaks only as of the date of this scenarios book, January 2014. Neither Royal Dutch Shell nor any of its subsidiaries undertake any obligation to publicly update or revise any forward-looking statement as a result of new information, future events or other information. In light of these risks, results could differ materially from those stated, implied or inferred from the forward-looking statements contained in this scenarios book.
ACKNOWLEDGMENTS DATA SOURCES
Shell gratefully acknowledges a number of organisations who contributed to this publication: the Development Research Center of the State Council, China; the municipalities of Amsterdam and Rotterdam, Booz & Company, Betty Sue Flowers.
The Centre for Liveable Cities gratefully acknowledges: the National Climate Change Secretariat in the Prime Minister’s Office, the Ministry of Trade and Industry, the Energy Market Authority, the Economic Development Board, the Ministry of Environment and Water Resources, the National Environment Agency, PUB (Singapore’s water agency), the Land Transport Authority, the Urban Redevelopment Authority, and the Monetary Authority of Singapore.
Our thanks go to Shell colleagues and the many external experts who have contributed to the development of New Lens Scenarios and the previously published Shell Scenarios.
Other Shell Scenario material can be found at shell.com/scenarios.
The principal date sources used in the development of Shell’s analyses and charts in this book, besides those already mentioned are:
n IEA World Energy statistics and Balances 2012 © OECD/IED 2012, as modified by Shell International
n Journal of Urban Planning and Development, March 2006
n Newman and Kenworthy 1989
n UN population division 2012 revision (Medium Fertility Scenario), as modified by Shell International
The principal data sources used in the development of charts and Booz & Company analysis in this book are:
n 2008 World Population Database
n EIA – Energy Statistics Database
n IEA – World Energy Outlook 2008
n UN State of the World Cities 2009
NEW
LENSES
ON
FUTU
RE C
ITIES A
PPEND
ICES 55

NOTESN
EW LEN
SES
ON
FUTU
RE C
ITIES A
PPEND
ICES 57

© 2014 Shell International BVAll rights reserved. No part of this publication may be reproduced, stored in a retrieval system, published or transmitted, in any form or by any means, without the prior written permission of Shell International BV.
Join the conversation #ShellScenarios
www.shell.com/scenarios
9995
24–P
CO
EL–1
2/20
13