Embed Size (px)
Citation preview
New Kid on the Block:Exploring the Google+ Social Graph
Gabriel MagnoUFMG
Belo Horizonte, [email protected]
Giovanni ComarelaUFMG
Belo Horizonte, [email protected]
Diego Saez-TrumperUniversitat Pompeu Fabra
Barcelona, [email protected]
Meeyoung ChaKAIST
Republic of [email protected]
Virgilio AlmeidaUFMG
Belo Horizonte, [email protected]
ABSTRACTThis paper presents a detailed analysis of the Google+ social net-work. We identify the key differences and similarities with otherpopular networks like Facebook and Twitter, in order to determinewhether Google+ is a new paradigm or yet another social network.This work is based on large-scale crawls of over 27 million userprofiles that represented nearly 50% of the entire network in 2011.We observe that the average path length between users is slightlyhigher than other networks, possibly because Google+ is a new sys-tem where relationships are still rapidly growing. Google+ showsa higher level of reciprocity than Twitter, which also has directedsocial links. The newly available “places lived” field could be usedto study how users are distributed around the world and how ag-gressively the service has been adopted in different countries. Wefind that Google+ is popular in countries with relatively low Inter-net penetration rate. Based on the amount and types of informationpublicly shared in user profiles, we also find that the notion of pri-vacy varies significantly across different cultures.
Categories and Subject DescriptorsJ.4 [Computer Applications]: Social and behavioral sciencesMis-cellaneous; H.3.5 [Online Information Services]: Web-based ser-vices
General TermsHuman Factors, Measurement
KeywordsGoogle+, Online Social Network, Geo-location
1. INTRODUCTIONSocial networks are a global information infrastructure, where in-dividuals bring their social relations online and share information,
Permission to make digital or hard copies of all or part of this work forpersonal or classroom use is granted without fee provided that copies arenot made or distributed for profit or commercial advantage and that copiesbear this notice and the full citation on the first page. To copy otherwise, torepublish, to post on servers or to redistribute to lists, requires prior specificpermission and/or a fee.IMC’12, November 14–16, 2012, Boston, Massachusetts, USA.Copyright 2012 ACM 978-1-4503-1705-4/12/11 ...$15.00.
photos, songs, videos, as well as ideas. Social networking sites likeFacebook now reach 82% of the world’s Internet-using populationor about 1.2 billion people in total according to comScore [11].In fact social networking became the most popular online activ-ity worldwide. Accordingly, a number of researchers have tried tounderstand user behaviors and characteristics of various online so-cial networks, where Twitter and Facebook have been the two mostpopularly examined platforms [26, 7, 39, 3].
To compete in this field, Google has launched in June2011 its own social networking service called Google+(https://plus.google.com/). The platform was announced as anew generation of social network and included several newfeatures, such as circles that allow users to share different contentwith different people and hangouts that let users to create videochatting session and invite up to nine people from their circles offriends to share the environment [22].
Since its launch, the Google+ social network has been addingnew users at a rapid pace. In fact, it is known as the fastest growingnetwork ever, reaching 20 million visitors in only 21 days [10]. Theservice has later reached 62 million registered users as of December2011 [24] and a total of 250 million registered users of whom 150million are active as of June 2012 [15].
Once Google+ has become a popular social media network, it isimportant to understand how it compares to other social networkmodels. Typical questions follow. How are people connected onGoogle+? Who are the most popular users? How are users dis-tributed worldwide? What is the impact of geography on the socialrelationships?
Furthermore, the rapid adoption rate of the service raises inter-esting questions about online privacy. One crucial question is onwhat the default privacy settings should be. Along these lines, itis worth examining how “closed” social networking sites are, com-pared to the “open” Internet. Google has positioned itself as pro-moter of the Internet openness against other social networking ser-vices that are often described “walled garden" [5] due to limitedaccess to their internal web pages. Then, is Google+ different?How open is it and how does it impact user interactions?
To answer these questions we have crawled more than27,556,390 user profiles and 575,141,097 relationship links amongusers, as well as any publicly available data about the users suchas gender, geo-location, and relationship status. A relatively largenumber of users leave personal information publicly available foranyone to see. This kind of information allows us to analyze userbehavior patterns and compare them to previous research resultsobtained for other social networks, e.g., Facebook and Twitter.
159
Based on the gathered data, we characterize the novel social net-work model provided by Google+ in depth, its user base, its ge-ographical distribution, and compare its main characteristics withother social network services. Among various findings, some of themain results are summarized as follows:
1. Our analysis on the top users based on the circles list indicatethat the majority of the top users (7 out of 20) are well-knownindividuals from information technology industry;
2. By looking into users who share their work or home con-tact information publicly (1% of all suers), we observe that alarge fraction of the users who share telephone numbers aremale and single;
3. We find that users share strikingly different amounts of infor-mation to public in their profiles depending the country theylive in;
4. By examining the social links between the users in relationto their countries, we observe that physical distance is crucialin the likelihood of forming a social link between two users;
5. The fraction of global and national links also vary accordingthe countries, indicating the different patterns of usages ofthe Google+ service across different cultures.
As another contribution of this paper, we make the collected dataavailable to the wider research community at http://gplus.camps.dcc.ufmg.br. Our Google+ data set could facilitatenew projects in social computing and computer network researchthat need actual data for their experiments.
The rest of this paper is organized as follows. We begin with adetailed description of the Google+ platform and the data collectionmethodology in Section 2. In Section 3, we study the social graphof the Google+ users and describe in detail the public attributesavailable in Google+. Next, we analyze the impact of geographicaldistance and relationships in Google+ in Section 4. We examine theeconomic indicators of a country and their relationship to the adop-tion rate of Google+ within that country. We discuss related workand implications in Section 5 and Section 6. Finally, we summarizeour findings and conclude in Section 7.
2. METHODOLOGYWe briefly describe key features of the Google+ service and theway we gathered data.
2.1 Platform DescriptionThe Google+ service was released in June of 2011 [22]. In the first90 days, the service has been on field trial and only those users whoreceived an invitation could create an account. During this time,the network grew virally through social contacts. In September20th, 2011, the service became publicly open and no invitation wasrequired for a sign up [21]. These two different mechanisms ofspreading would have attracted different kinds of users to Google+.For instance, users who joined through invitations are likely tech-savvy users who typically adopt new services early, compared tothe users who join through open sign-up.
In Google+, users can manage their contact list through circles.Circles are labeled groups of friends, which allows a user to shareor receive information with and from a specified subset of his con-tacts. For example, a user may manage “family”, “colleagues”, and“alumni” circles. When a user adds someone in one of his circles,he starts to receive updates from that person. This manual groupingof contacts alleviates some of the privacy problems that existed in
other “flat” social networks, where default privacy settings are setto maximize the visibility of users profile and only a small numberof members change it [20]. There are two types of circles, namelyin- and out-circles. While the latter represents the list of users thata given user has added to her circles, the former represents the listof other users who added that user to their circles.
Circle names and their user lists are private information that onlythe circle creator can see. A user can identify all the others who in-cluded the user in their circles (i.e., followers), because the userreceives a notification when someone adds him to a circle. Similarto Twitter, people can add other users to their circles without con-firmation. This is different from networks like Facebook, where allsocial links are reciprocal and both sides of the users should agreeto own a social link. In the user profile page two lists are shownby default: The “Have user in circles” list, like a followers list, and“In user’s circles”, similar to the followees list in Twitter. The userhas the option to set these lists as private.
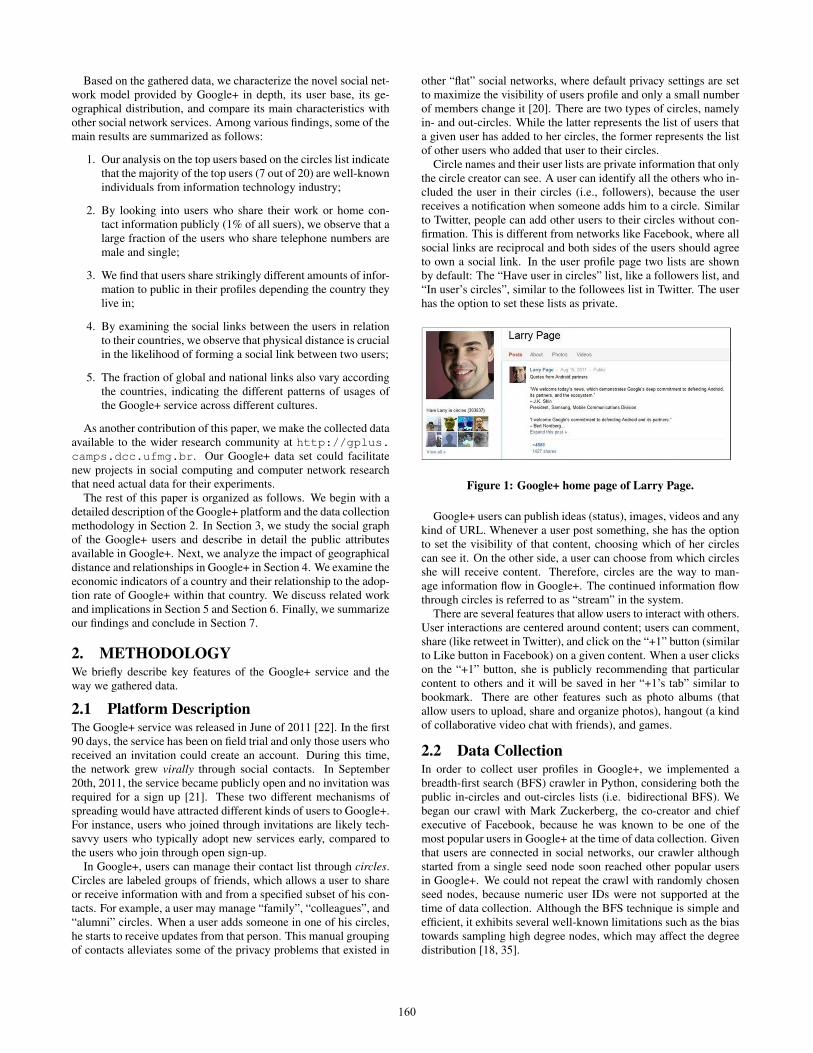
Figure 1: Google+ home page of Larry Page.
Google+ users can publish ideas (status), images, videos and anykind of URL. Whenever a user post something, she has the optionto set the visibility of that content, choosing which of her circlescan see it. On the other side, a user can choose from which circlesshe will receive content. Therefore, circles are the way to man-age information flow in Google+. The continued information flowthrough circles is referred to as “stream” in the system.
There are several features that allow users to interact with others.User interactions are centered around content; users can comment,share (like retweet in Twitter), and click on the “+1” button (similarto Like button in Facebook) on a given content. When a user clickson the “+1” button, she is publicly recommending that particularcontent to others and it will be saved in her “+1’s tab” similar tobookmark. There are other features such as photo albums (thatallow users to upload, share and organize photos), hangout (a kindof collaborative video chat with friends), and games.
2.2 Data CollectionIn order to collect user profiles in Google+, we implemented abreadth-first search (BFS) crawler in Python, considering both thepublic in-circles and out-circles lists (i.e. bidirectional BFS). Webegan our crawl with Mark Zuckerberg, the co-creator and chiefexecutive of Facebook, because he was known to be one of themost popular users in Google+ at the time of data collection. Giventhat users are connected in social networks, our crawler althoughstarted from a single seed node soon reached other popular usersin Google+. We could not repeat the crawl with randomly chosenseed nodes, because numeric user IDs were not supported at thetime of data collection. Although the BFS technique is simple andefficient, it exhibits several well-known limitations such as the biastowards sampling high degree nodes, which may affect the degreedistribution [18, 35].
160
The data collection process started on November 11th, 2011, andended on December 27th, 2011. We used a total of 11 machineswith different IP addresses to efficiently gather large amount ofdata. The profile information was retrieved by making HTTP re-quests to publicly available user profile pages. In total we crawled27,556,390 profile pages, collecting public user information and itscircles lists. With the social links of the users we have constructeda directed graph that has 35,114,957 nodes and 575,141,097 edges.As of the data collection date, we estimated that our data set repre-sented 56% of all registered Google+ users[2].
There is a limit on the maximum number of users that could ap-pear in any public circle, which is 10,000 users. Since the Google+social graph was gathered in both directions (in-circles and out-circles), we were able to recover almost all “lost edges.” In order toestimate the fraction of missed links, we compared the number ofusers shown in their profile page with the actual number of edgeswe collected. In our dataset there are 915 users with more than10,000 in-circles users, which should have 37,185,272 incomingedges according to their profile pages, while we found 27,600,503links for those users in our graph. By dividing the difference ofthese numbers by the total number of edges, we estimate that 1.6%of the edges are lost because of the 10,000 limit on the circle list.
3. GRAPH ANALYSISIn order to characterize social relationships of Google+ users, wedefine a social graph. The vertices of the social graph are Google+users present in our dataset. A user v added by user u to her circlesresults in a directed edge from u to v. Therefore the social relationsamong Google+ users make a directed graph G(V, E), where Vrepresents the set of users and E is the set of directed edges (u, v),u, v ∈ V . Given the social graph construction, we analyze twotypes of properties: first on the node characteristics and then on thegraph structure. The former capture the characteristics of Google+users, as defined by the fields of the user profile, while the latterrepresents relationships between users.
Table 1: Top 20 users ranked by in-degreeRank Name About
1 Larry Page IT (Google)2 Mark Zuckerberg IT (Facebook)3 Britney Spears Musician4 Snoop Dogg Musician5 Sergey Brin IT (Google)6 Tyra Banks Model7 Vic Gundotra IT (Google)8 Paris Hilton Socialite9 Richard Branson Businessman (Virgin Group)
10 Dane Cook Comedian11 Jessi June Model12 Trey Ratcliff Blogger13 will.i.am Musician14 Felicia Day Actor15 Thomas Hawk Blogger16 Tom Anderson IT (Myspace)17 Pete Cashmore IT (Mashable)18 Guy Kawasaki IT (Apple) & Writer19 Wil Wheaton Actor & Writer20 Ron Garan Astronaut (NASA)
3.1 Node CharacteristicsTo get a sense for what users expect from the Google+ service, wefirst examine who the most popular users are. Table 1 shows thetop 20 users based on their in-degrees (i.e., how many circles theseusers are added to by others). The top list of Google+ is a mix ofsingers, bloggers, actors, and IT professionals. When we comparethe list to that of Twitter in [26], only one user appears in both lists;singer Britney Spears ranked second as of mid 2009. The top list isparticularly different from that of Twitter in that (1) we do not seeany news media outlet like the New York Times and CNN, while(2) we see founders of large Internet-based companies like Googleand Facebook. In fact 7 out of the 20 users are IT related, which isuncommon in other social networks.
Next focusing more on the average user, we examine what kindsof interactions they perform on the network. In general, users of so-cial networking sites reveal different types of personal informationin their profile, such as basic descriptors (e.g., gender, relationshipstatus, cities lived), contact information (e.g., e-mail, phone num-ber, address, Web site), personal interests (e.g., favorite TV shows,movies, books, quotes, music), education information (e.g. field ofstudy, degree), work information (e.g., employer, position), etc.
Google+ users also publish information about themselves in theirprofiles. Some pieces of information are in “restricted fields”,where users have to choose among some options, while in “openfields” users can write anything they want. Only the fields “rela-tionship”, “looking for”, and gender are restricted fields. The restof the fields are open fields. In the field called, places lived, a usercan write the name of any place she lived and the Google+ systemautomatically tries to mark the place on the map.
For all the fields, except for the name that is public by default, auser can control the privacy setting and set visibility of that field.There are five options: (1) public, which means open to anyone inthe Internet, (2) extend circles, which means open to people that arein circles and people that are in the circles of those, (3) your circles,which means open to people in one’s circles, (4) only you, and (5)custom, which means a user can choose exactly which circles mayview that field.
We have collected information about all the fields of users thatwere publicly accessible. In Table 2, we show the number andfraction of users that have made each type of information available.
Table 2: Public attributes available in Google+Attribute Available %Name 27,556,390 100.00Gender 26,914,758 97.67Education 7,471,191 27.11Places lived 7,371,461 26.75Employment 5,917,609 21.47Phrase 4,075,132 14.79Other profiles 3,713,546 13.48Occupation 3,656,447 13.27Contributor to 3,622,627 13.15Introduction 2,149,191 7.80Other names 1,210,760 4.39Relationship 1,186,903 4.31Braggin rights 1,074,964 3.90Recommended links 1,001,349 3.63Looking for 753,704 2.74Work (contact) 60,434 0.22Home (contact) 58,876 0.21
161
3.2 Privacy concernsStudies on human behavior [38] show that individuals with profileson social networking sites may have greater risk taking attitudesthan those who do not. And sharing contact information, such tele-phone numbers, may increases risks. As far as contact details areconcerned, the work in [38] shows how many Facebook users dis-close identity information in the form of contact details. The ma-jority of the users in the sample used by the study publicly showedtheir e-mail address (64.1%). Only a few Facebook members pub-lished their mobile phone number (10.7%). Similarly, only a mi-nority (10.7%) of the participants revealed their home address onFacebook.
Google+ allows their users to publish contact information in theirprofiles. Some users publicly share their work or home contactinformation. In our data set, a total of 72,736 users share telephonenumber in Google+, which represent 0.26% of the population. Wecall these users tel-users and because they represent a class of risktaking users we look into the details of the profile of these users.
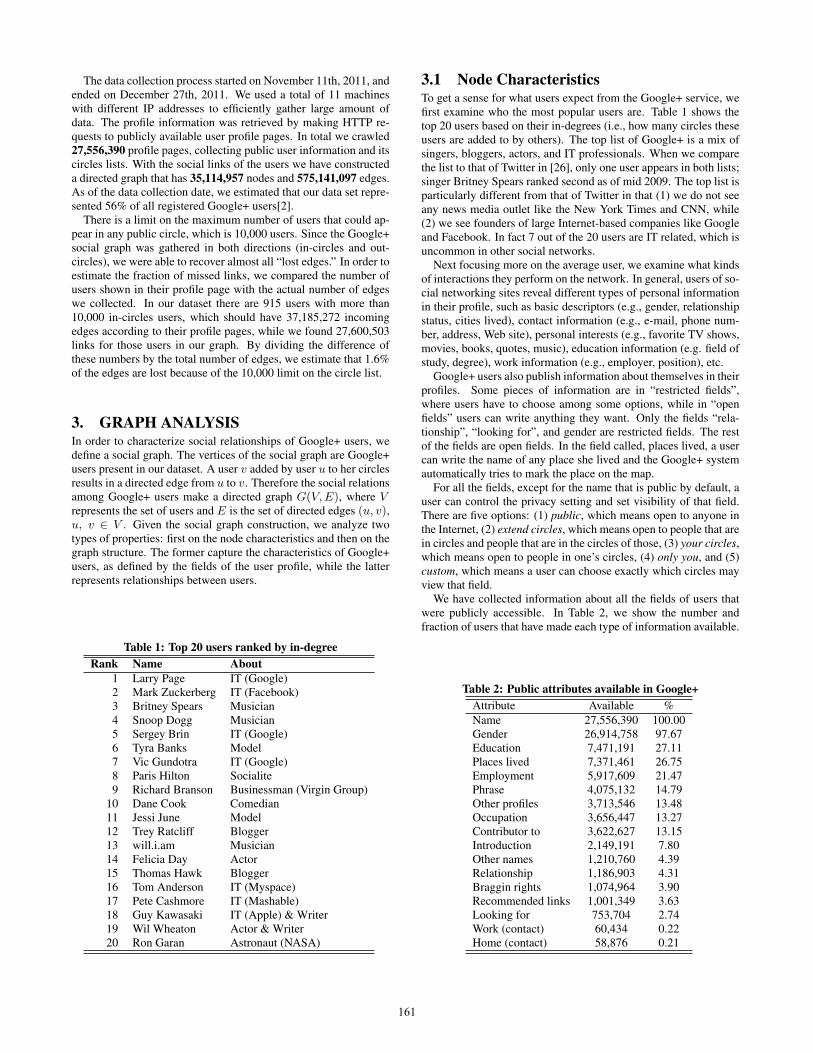
In order to examine how much information tel-users share pub-licly compared to all users, we show the CCDF (ComplementaryCumulative Distribution Function) of the number of fields in theprofile shared for each user in Figure 2, removing the fields ofHome and Work information from the contabilization. (The listof the fields available are given in Table 2.) As we can see, tel-users generally share more information in their profiles than otherGoogle+ users, which confirm their risk taking attitude. For ex-ample, 10% of all Google+ users share more than six fields, while66% of the tel-users do the same.
0 0.1 0.2 0.3 0.4 0.5 0.6 0.7 0.8 0.9
1
2 4 6 8 10 12 14 16
CC
DF
# fields available in profile
Telephone usersAll users
Figure 2: Number of fields shared by users in the profile
Concerning the information sharing behavior of Google+ users,table 3 displays the percentage of users who give information aboutgender, relationship, and location for all users and tel-users, consid-ering only those users that had the field public. Among all users ofthe dataset, 68% are male and 31% are female. However, the differ-ence is much higher when we consider tel-users; 86% are male and11% female, indicating that female Google+ users are less likelyto share phone numbers than male Google+ users. Similar to theobservations confirmed in [16], more risk taking behaviors can befound for men and greater concern from women with regard to in-formation provided on the Web.
What is particular about Google+ is that it asks users to providea very detailed level of information about their relationship statusas opposed to other social networks. The nine default options fromwhich users can choose from are listed in the table. Conducting thesame comparison of all users and tel-users over the relationship sta-tus, we find that user behaviors are similar between the two groups.
Table 3: Information shared by all users and tel-usersAll users Tel-users
Total 27,556,390 72,736Gender (N) 26,914,758 71,267
Male 67.65% 85.99%Female 31.46% 11.26%Other 0.89% 2.75%
Relationship (N) 1,186,903 29,068Single 42.82% 57.24%Married 26.59% 21.03%In a relationship 19.80% 10.23%It’s complicated 3.16% 3.98%Engaged 4.39% 2.98%In an open relationship 1.26% 2.77%Widowed 0.50% 0.58%In a domestic partnership 1.08% 0.77%In a civil union 0.39% 0.41%
Location (N) 6,621,644 45,676United States 31.38% 8.92%India 16.71% 31.90%Brazil 5.76% 4.72%United Kingdom 3.35% 2.19%Canada 2.30% 1.52%Other 40.50% 50.77%
However, those users who set their relationship status as “single”,“it’s complicated”, “in an open relationship”, “widowed”, and “in acivil union” were more likely to share their phone numbers publiclythan others. In particular, we saw a high percentage of single users(57.24%) compared to all the users (42.82%). In contrast, only halfof the users “in a relationship” shared their phone numbers.
The fraction of tel-users does not follow the rank of the top 10countries in Figure 6. While the US take up 31.38% of all users, itcounts for only 8.92% of those users who have made their phonenumbers available in Google+. In contrast, India now becomes themost populated country based on the fraction of tel-users count(31.90%). The fraction of Indian users in the tel-users group istwice as big as in all other country users group.
While the different level at which users of a given country revealtheir phone numbers is interesting, this may come as no surprisewhen we account for the fact that people’s perception of what is“private” is different. According to a report in [9], 65% of peoplein Germany find mobile phone number as personal, whereas only28% of people in Romania think the same.
3.3 Structural characteristicsWe next present characteristics of the Google+ social graph. Foreach network metric, we also show the results for the Twitter graphfrom other research [7] for comparison.
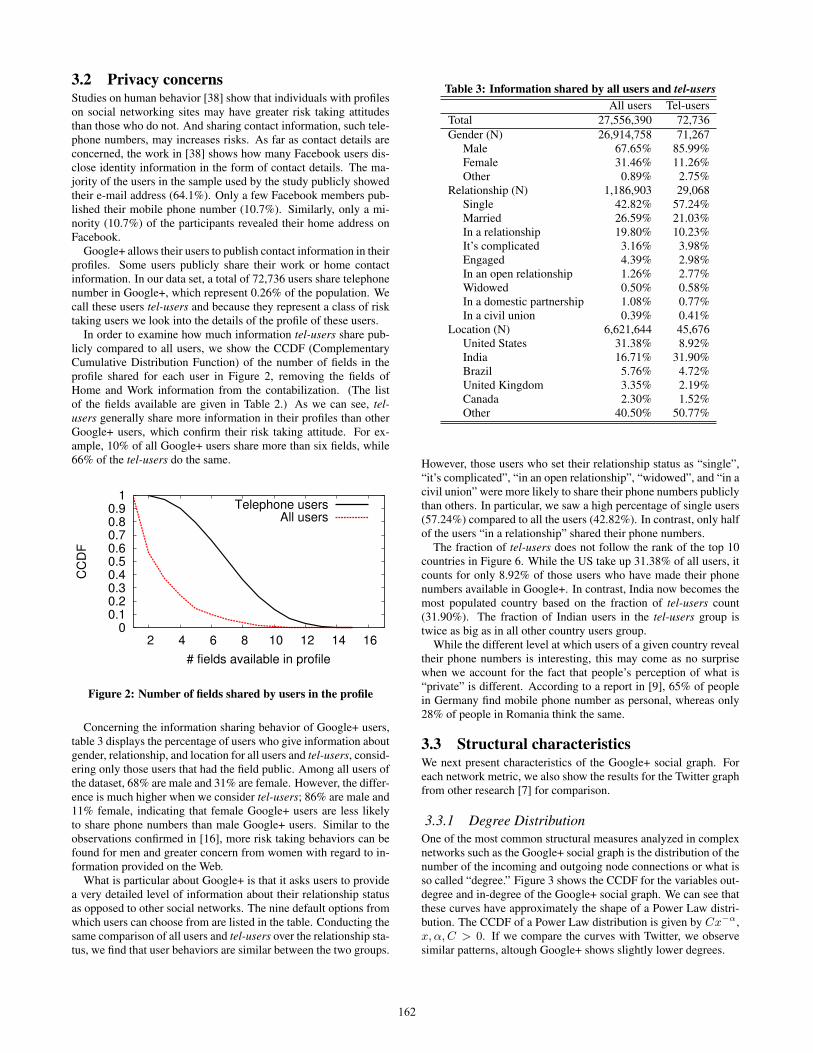
3.3.1 Degree DistributionOne of the most common structural measures analyzed in complexnetworks such as the Google+ social graph is the distribution of thenumber of the incoming and outgoing node connections or what isso called “degree.” Figure 3 shows the CCDF for the variables out-degree and in-degree of the Google+ social graph. We can see thatthese curves have approximately the shape of a Power Law distri-bution. The CCDF of a Power Law distribution is given by Cx−α,x, α, C > 0. If we compare the curves with Twitter, we observesimilar patterns, altough Google+ shows slightly lower degrees.
162
By using a simple statistical linear regression (in the log-logscale) we estimated the exponent α that best models the data. Weobtained α = 1.3 (with R2 = 0.99) for in-degree and α = 1.2(with R2 = 0.99) for out-degree. Although both curves are simi-lar, the out-degree curve drops sharply around 5000. We conjecturethis is because Google maintains a policy that allows only somespecial users to outpass a specified threshold (unknown) and addmore than 5000 friends to their circles.
Degree
CC
DF
Twitter In
Twitter Out
Google+ In
Google+ Out
100
101
102
103
104
105
106
107
10
−8
10
−6
10
−4
10
−2
10
0
Figure 3: Degree Distributions
The overall power-law trend shown in the degree distribution ischaracteristics of the human social networks. This means that asmall fraction of the individuals have disproportionately large num-ber of neighbors, while most users have a small number of neigh-bors. Examples of such hubs are listed in Table 1. For instance,Larry Page is listed in 3.7 million circles as of August 2012, whilethe majority are listed in no more than 10 circles. As studied inmany other research, hubs play a central role in information propa-gation in social networks.
3.3.2 ReciprocityIn order to evaluate discrepancies between in- and out-degrees fora given node we use a simple metric called Relation Reciprocity(RR) of a node u ∈ V as:
RR(u) =|OS(u) ∩ IS(u)|
|OS(u)| (1)
where OS(u) is the set of nodes (i.e, users) that have an incomingedge from u and IS(u) is the set of nodes with outgoing edgespointing to u.
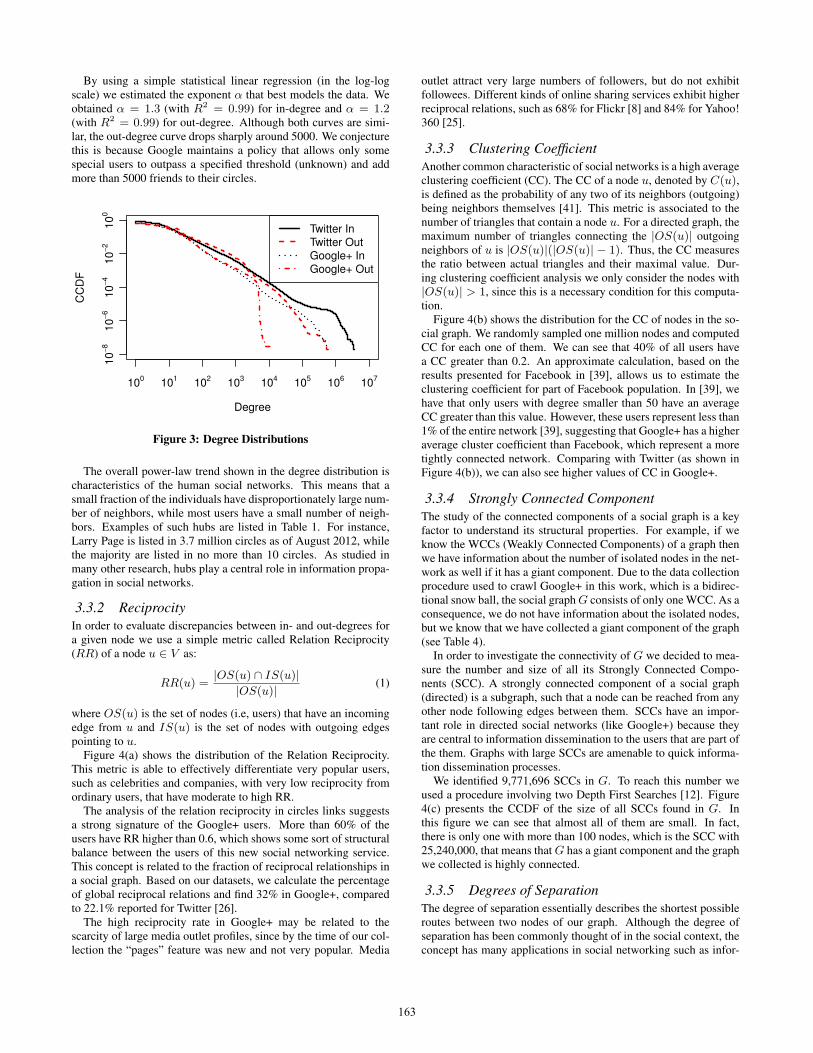
Figure 4(a) shows the distribution of the Relation Reciprocity.This metric is able to effectively differentiate very popular users,such as celebrities and companies, with very low reciprocity fromordinary users, that have moderate to high RR.
The analysis of the relation reciprocity in circles links suggestsa strong signature of the Google+ users. More than 60% of theusers have RR higher than 0.6, which shows some sort of structuralbalance between the users of this new social networking service.This concept is related to the fraction of reciprocal relationships ina social graph. Based on our datasets, we calculate the percentageof global reciprocal relations and find 32% in Google+, comparedto 22.1% reported for Twitter [26].
The high reciprocity rate in Google+ may be related to thescarcity of large media outlet profiles, since by the time of our col-lection the “pages” feature was new and not very popular. Media
outlet attract very large numbers of followers, but do not exhibitfollowees. Different kinds of online sharing services exhibit higherreciprocal relations, such as 68% for Flickr [8] and 84% for Yahoo!360 [25].
3.3.3 Clustering CoefficientAnother common characteristic of social networks is a high averageclustering coefficient (CC). The CC of a node u, denoted by C(u),is defined as the probability of any two of its neighbors (outgoing)being neighbors themselves [41]. This metric is associated to thenumber of triangles that contain a node u. For a directed graph, themaximum number of triangles connecting the |OS(u)| outgoingneighbors of u is |OS(u)|(|OS(u)| − 1). Thus, the CC measuresthe ratio between actual triangles and their maximal value. Dur-ing clustering coefficient analysis we only consider the nodes with|OS(u)| > 1, since this is a necessary condition for this computa-tion.
Figure 4(b) shows the distribution for the CC of nodes in the so-cial graph. We randomly sampled one million nodes and computedCC for each one of them. We can see that 40% of all users havea CC greater than 0.2. An approximate calculation, based on theresults presented for Facebook in [39], allows us to estimate theclustering coefficient for part of Facebook population. In [39], wehave that only users with degree smaller than 50 have an averageCC greater than this value. However, these users represent less than1% of the entire network [39], suggesting that Google+ has a higheraverage cluster coefficient than Facebook, which represent a moretightly connected network. Comparing with Twitter (as shown inFigure 4(b)), we can also see higher values of CC in Google+.
3.3.4 Strongly Connected ComponentThe study of the connected components of a social graph is a keyfactor to understand its structural properties. For example, if weknow the WCCs (Weakly Connected Components) of a graph thenwe have information about the number of isolated nodes in the net-work as well if it has a giant component. Due to the data collectionprocedure used to crawl Google+ in this work, which is a bidirec-tional snow ball, the social graph G consists of only one WCC. As aconsequence, we do not have information about the isolated nodes,but we know that we have collected a giant component of the graph(see Table 4).
In order to investigate the connectivity of G we decided to mea-sure the number and size of all its Strongly Connected Compo-nents (SCC). A strongly connected component of a social graph(directed) is a subgraph, such that a node can be reached from anyother node following edges between them. SCCs have an impor-tant role in directed social networks (like Google+) because theyare central to information dissemination to the users that are part ofthe them. Graphs with large SCCs are amenable to quick informa-tion dissemination processes.
We identified 9,771,696 SCCs in G. To reach this number weused a procedure involving two Depth First Searches [12]. Figure4(c) presents the CCDF of the size of all SCCs found in G. Inthis figure we can see that almost all of them are small. In fact,there is only one with more than 100 nodes, which is the SCC with25,240,000, that means that G has a giant component and the graphwe collected is highly connected.
3.3.5 Degrees of SeparationThe degree of separation essentially describes the shortest possibleroutes between two nodes of our graph. Although the degree ofseparation has been commonly thought of in the social context, theconcept has many applications in social networking such as infor-
163
0.0 0.2 0.4 0.6 0.8 1.0
0.0
0.2
0.4
0.6
0.8
1.0
Reciprocity
CD
F
Google+
(a) Reciprocal links
0.0 0.2 0.4 0.6 0.8 1.0
0.0
0.2
0.4
0.6
0.8
1.0
Clustering Coefficient
CD
F
Google+
(b) Clustering coefficients of nodes
Component Size
CC
DF
Google+
100
101
102
103
104
105
106
107
108
10
−7
10
−6
10
−5
10
−4
10
−3
10
−2
(c) Size of the strongly connected components
Figure 4: Distributions of various network properties in Google+
Table 4: Comparison of topological characteristics of Google+ and other online social networksNetwork Nodes Edges % Crawled Path length Reciprocity Diameter In-degree Out-degreeGoogle+ 35M 575M 56% 5.9 32% 19 16.4 16.4Facebook 721M 62G 100% 4.7 100% 41 190.2 190.2Twitter 41.7M 106M 100% 4.1 22% 18 28.19 29.34Orkut 3M 223M 11% 4.3 100% 9 - -
mation dissemination and friend recommendation [13]. We presentan analysis of how many hops there are between two users in theGoogle+ social graph. In order to have the exact distribution wewould need to compute the shortest path from all nodes to all nodesof the network. Due to the computational cost of this task we de-cided to use a random sampling procedure [1]. We sampled k dif-ferent users and for each one of them we computed the shortest pathto all others users in the network. We started with k = 2000 andincreased its until 10000, stopping in this value once there were nomore changes in the distribution.
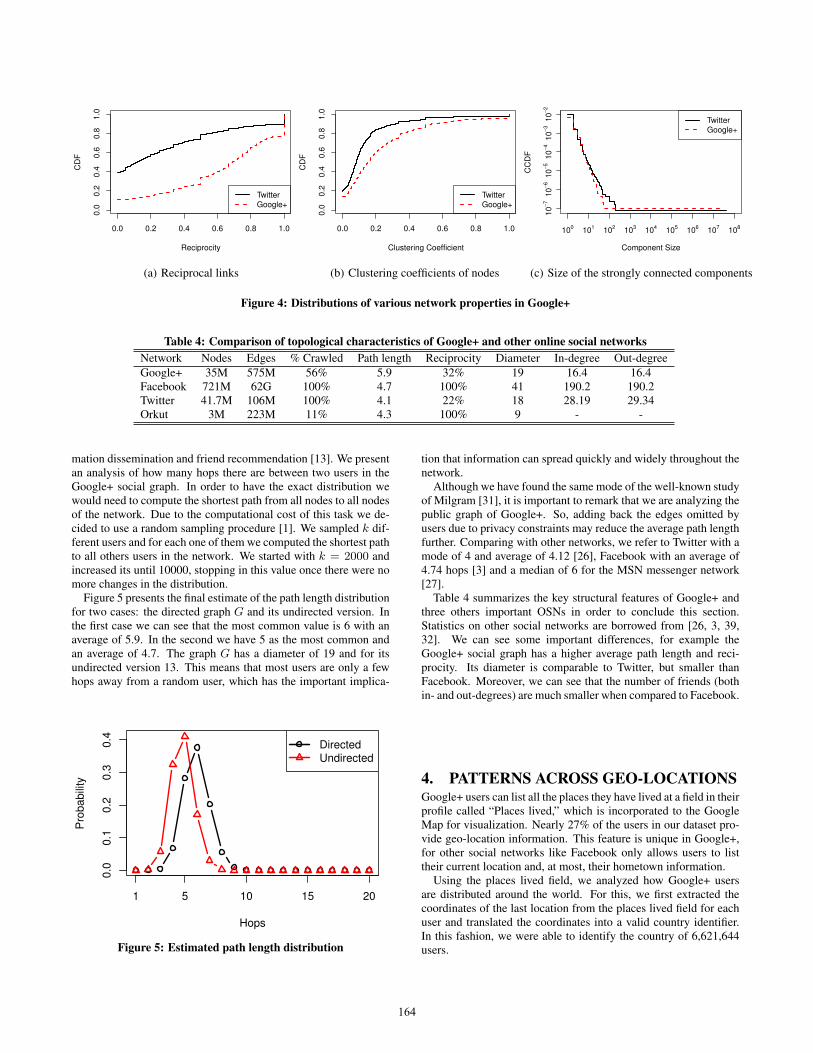
Figure 5 presents the final estimate of the path length distributionfor two cases: the directed graph G and its undirected version. Inthe first case we can see that the most common value is 6 with anaverage of 5.9. In the second we have 5 as the most common andan average of 4.7. The graph G has a diameter of 19 and for itsundirected version 13. This means that most users are only a fewhops away from a random user, which has the important implica-
Hops
Pro
ba
bili
ty
0.0
0.1
0.2
0.3
0.4
1 5 10 15 20
Directed
Undirected
Figure 5: Estimated path length distribution
tion that information can spread quickly and widely throughout thenetwork.
Although we have found the same mode of the well-known studyof Milgram [31], it is important to remark that we are analyzing thepublic graph of Google+. So, adding back the edges omitted byusers due to privacy constraints may reduce the average path lengthfurther. Comparing with other networks, we refer to Twitter with amode of 4 and average of 4.12 [26], Facebook with an average of4.74 hops [3] and a median of 6 for the MSN messenger network[27].
Table 4 summarizes the key structural features of Google+ andthree others important OSNs in order to conclude this section.Statistics on other social networks are borrowed from [26, 3, 39,32]. We can see some important differences, for example theGoogle+ social graph has a higher average path length and reci-procity. Its diameter is comparable to Twitter, but smaller thanFacebook. Moreover, we can see that the number of friends (bothin- and out-degrees) are much smaller when compared to Facebook.
4. PATTERNS ACROSS GEO-LOCATIONSGoogle+ users can list all the places they have lived at a field in theirprofile called “Places lived,” which is incorporated to the GoogleMap for visualization. Nearly 27% of the users in our dataset pro-vide geo-location information. This feature is unique in Google+,for other social networks like Facebook only allows users to listtheir current location and, at most, their hometown information.
Using the places lived field, we analyzed how Google+ usersare distributed around the world. For this, we first extracted thecoordinates of the last location from the places lived field for eachuser and translated the coordinates into a valid country identifier.In this fashion, we were able to identify the country of 6,621,644users.
164
0
0.2
0.4
0.6
0.8
1
1.2
0 10,000 20,000 30,000 40,000 50,000 60,000
Re
lative
use
of
Go
og
le+
(%
of
inte
rne
t u
se
rs)
GDP per capita (PPP)
Europe
RU
IT
FR
GB
DE
ES AsiaVN
IN
ID
CN
TH
JP
TW
Latin America
BR
MX
ARNorth America
CA
US
Oceania
AU
Middle East
IR
(a) GDP Per Capita and Use of Google+
0
10
20
30
40
50
60
70
80
90
0 10,000 20,000 30,000 40,000 50,000 60,000
Inte
rne
t p
en
etr
atio
n (
% o
f p
op
ula
tio
n)
GDP per capita (PPP)
Europe
RU
IT
ES
FR
GBDE
Asia
VN
IN
ID
CN
TH
JP
TW
Latin America
BR
MX
AR
North America
CA US
Oceania
AU
Middle East
IR
(b) GDP Per Capita and Internet Penetration
Figure 7: Usage of Internet and Google+ among countries
0.00
0.05
0.10
0.15
0.20
0.25
0.30
US IN BR GB CA DE ID MX IT ES
Fra
ctio
n
Country
Figure 6: Top 10 countries with Google+ users
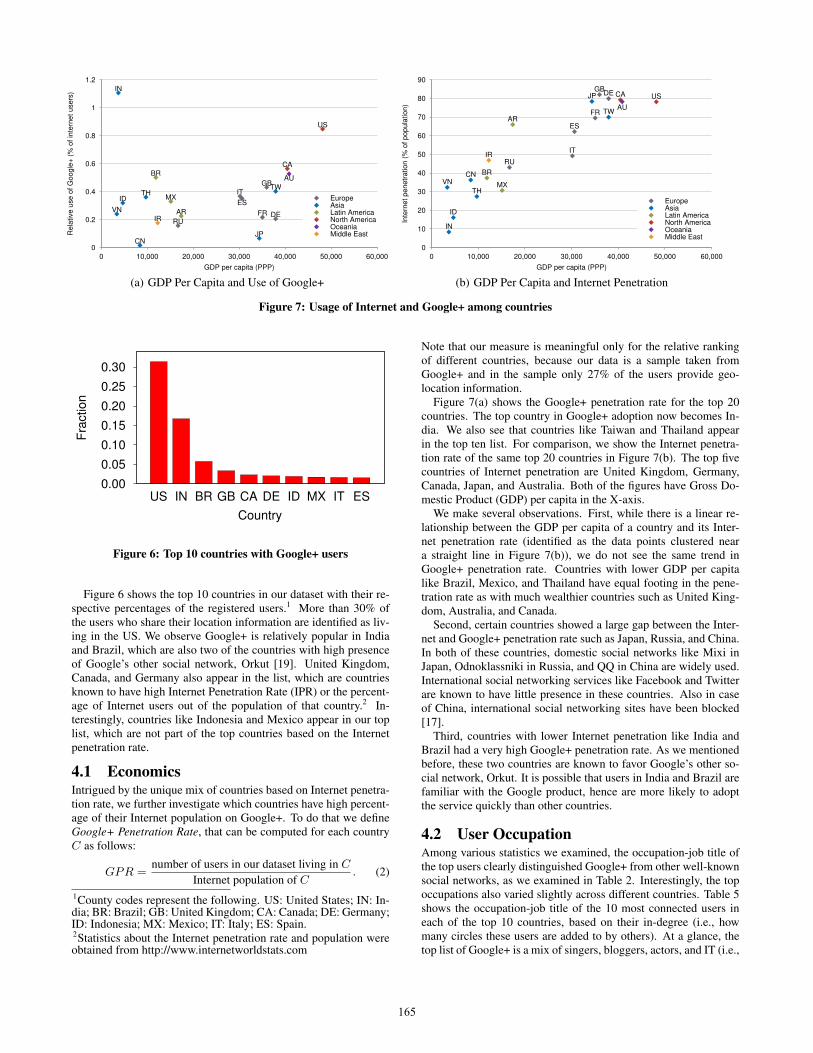
Figure 6 shows the top 10 countries in our dataset with their re-spective percentages of the registered users.1 More than 30% ofthe users who share their location information are identified as liv-ing in the US. We observe Google+ is relatively popular in Indiaand Brazil, which are also two of the countries with high presenceof Google’s other social network, Orkut [19]. United Kingdom,Canada, and Germany also appear in the list, which are countriesknown to have high Internet Penetration Rate (IPR) or the percent-age of Internet users out of the population of that country.2 In-terestingly, countries like Indonesia and Mexico appear in our toplist, which are not part of the top countries based on the Internetpenetration rate.
4.1 EconomicsIntrigued by the unique mix of countries based on Internet penetra-tion rate, we further investigate which countries have high percent-age of their Internet population on Google+. To do that we defineGoogle+ Penetration Rate, that can be computed for each countryC as follows:
GPR =number of users in our dataset living in C
Internet population of C. (2)
1County codes represent the following. US: United States; IN: In-dia; BR: Brazil; GB: United Kingdom; CA: Canada; DE: Germany;ID: Indonesia; MX: Mexico; IT: Italy; ES: Spain.2Statistics about the Internet penetration rate and population wereobtained from http://www.internetworldstats.com
Note that our measure is meaningful only for the relative rankingof different countries, because our data is a sample taken fromGoogle+ and in the sample only 27% of the users provide geo-location information.
Figure 7(a) shows the Google+ penetration rate for the top 20countries. The top country in Google+ adoption now becomes In-dia. We also see that countries like Taiwan and Thailand appearin the top ten list. For comparison, we show the Internet penetra-tion rate of the same top 20 countries in Figure 7(b). The top fivecountries of Internet penetration are United Kingdom, Germany,Canada, Japan, and Australia. Both of the figures have Gross Do-mestic Product (GDP) per capita in the X-axis.
We make several observations. First, while there is a linear re-lationship between the GDP per capita of a country and its Inter-net penetration rate (identified as the data points clustered neara straight line in Figure 7(b)), we do not see the same trend inGoogle+ penetration rate. Countries with lower GDP per capitalike Brazil, Mexico, and Thailand have equal footing in the pene-tration rate as with much wealthier countries such as United King-dom, Australia, and Canada.
Second, certain countries showed a large gap between the Inter-net and Google+ penetration rate such as Japan, Russia, and China.In both of these countries, domestic social networks like Mixi inJapan, Odnoklassniki in Russia, and QQ in China are widely used.International social networking services like Facebook and Twitterare known to have little presence in these countries. Also in caseof China, international social networking sites have been blocked[17].
Third, countries with lower Internet penetration like India andBrazil had a very high Google+ penetration rate. As we mentionedbefore, these two countries are known to favor Google’s other so-cial network, Orkut. It is possible that users in India and Brazil arefamiliar with the Google product, hence are more likely to adoptthe service quickly than other countries.
4.2 User OccupationAmong various statistics we examined, the occupation-job title ofthe top users clearly distinguished Google+ from other well-knownsocial networks, as we examined in Table 2. Interestingly, the topoccupations also varied slightly across different countries. Table 5shows the occupation-job title of the 10 most connected users ineach of the top 10 countries, based on their in-degree (i.e., howmany circles these users are added to by others). At a glance, thetop list of Google+ is a mix of singers, bloggers, actors, and IT (i.e.,
165
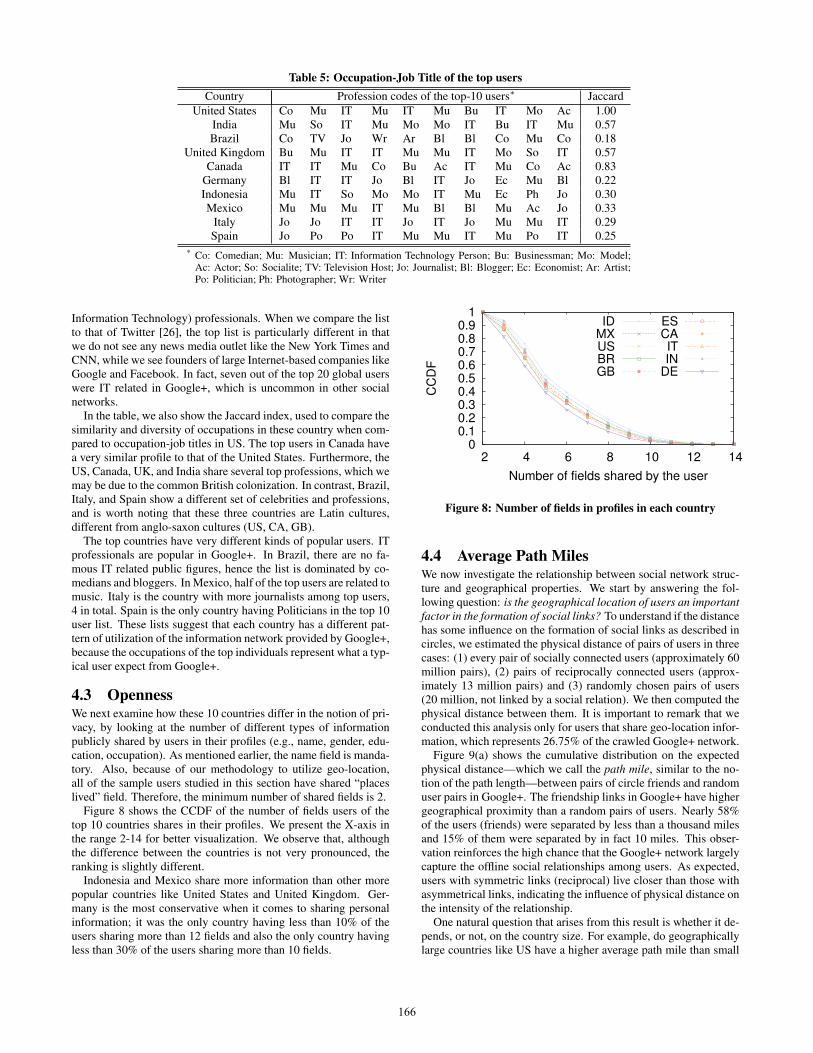
Table 5: Occupation-Job Title of the top usersCountry Profession codes of the top-10 users∗ Jaccard
United States Co Mu IT Mu IT Mu Bu IT Mo Ac 1.00India Mu So IT Mu Mo Mo IT Bu IT Mu 0.57Brazil Co TV Jo Wr Ar Bl Bl Co Mu Co 0.18
United Kingdom Bu Mu IT IT Mu Mu IT Mo So IT 0.57Canada IT IT Mu Co Bu Ac IT Mu Co Ac 0.83
Germany Bl IT IT Jo Bl IT Jo Ec Mu Bl 0.22Indonesia Mu IT So Mo Mo IT Mu Ec Ph Jo 0.30Mexico Mu Mu Mu IT Mu Bl Bl Mu Ac Jo 0.33
Italy Jo Jo IT IT Jo IT Jo Mu Mu IT 0.29Spain Jo Po Po IT Mu Mu IT Mu Po IT 0.25
* Co: Comedian; Mu: Musician; IT: Information Technology Person; Bu: Businessman; Mo: Model;Ac: Actor; So: Socialite; TV: Television Host; Jo: Journalist; Bl: Blogger; Ec: Economist; Ar: Artist;Po: Politician; Ph: Photographer; Wr: Writer
Information Technology) professionals. When we compare the listto that of Twitter [26], the top list is particularly different in thatwe do not see any news media outlet like the New York Times andCNN, while we see founders of large Internet-based companies likeGoogle and Facebook. In fact, seven out of the top 20 global userswere IT related in Google+, which is uncommon in other socialnetworks.
In the table, we also show the Jaccard index, used to compare thesimilarity and diversity of occupations in these country when com-pared to occupation-job titles in US. The top users in Canada havea very similar profile to that of the United States. Furthermore, theUS, Canada, UK, and India share several top professions, which wemay be due to the common British colonization. In contrast, Brazil,Italy, and Spain show a different set of celebrities and professions,and is worth noting that these three countries are Latin cultures,different from anglo-saxon cultures (US, CA, GB).
The top countries have very different kinds of popular users. ITprofessionals are popular in Google+. In Brazil, there are no fa-mous IT related public figures, hence the list is dominated by co-medians and bloggers. In Mexico, half of the top users are related tomusic. Italy is the country with more journalists among top users,4 in total. Spain is the only country having Politicians in the top 10user list. These lists suggest that each country has a different pat-tern of utilization of the information network provided by Google+,because the occupations of the top individuals represent what a typ-ical user expect from Google+.
4.3 OpennessWe next examine how these 10 countries differ in the notion of pri-vacy, by looking at the number of different types of informationpublicly shared by users in their profiles (e.g., name, gender, edu-cation, occupation). As mentioned earlier, the name field is manda-tory. Also, because of our methodology to utilize geo-location,all of the sample users studied in this section have shared “placeslived” field. Therefore, the minimum number of shared fields is 2.
Figure 8 shows the CCDF of the number of fields users of thetop 10 countries shares in their profiles. We present the X-axis inthe range 2-14 for better visualization. We observe that, althoughthe difference between the countries is not very pronounced, theranking is slightly different.
Indonesia and Mexico share more information than other morepopular countries like United States and United Kingdom. Ger-many is the most conservative when it comes to sharing personalinformation; it was the only country having less than 10% of theusers sharing more than 12 fields and also the only country havingless than 30% of the users sharing more than 10 fields.
0 0.1 0.2 0.3 0.4 0.5 0.6 0.7 0.8 0.9
1
2 4 6 8 10 12 14
CC
DF
Number of fields shared by the user
IDMXUSBRGB
ESCAITIN
DE
Figure 8: Number of fields in profiles in each country
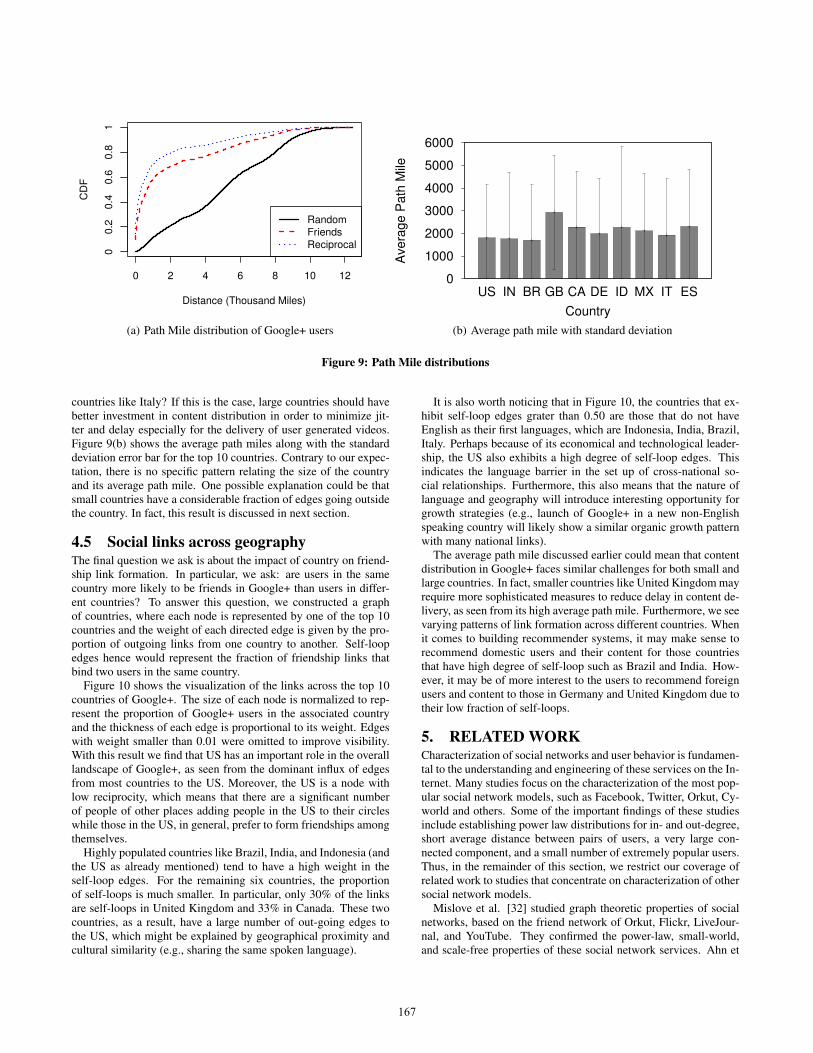
4.4 Average Path MilesWe now investigate the relationship between social network struc-ture and geographical properties. We start by answering the fol-lowing question: is the geographical location of users an importantfactor in the formation of social links? To understand if the distancehas some influence on the formation of social links as described incircles, we estimated the physical distance of pairs of users in threecases: (1) every pair of socially connected users (approximately 60million pairs), (2) pairs of reciprocally connected users (approx-imately 13 million pairs) and (3) randomly chosen pairs of users(20 million, not linked by a social relation). We then computed thephysical distance between them. It is important to remark that weconducted this analysis only for users that share geo-location infor-mation, which represents 26.75% of the crawled Google+ network.
Figure 9(a) shows the cumulative distribution on the expectedphysical distance—which we call the path mile, similar to the no-tion of the path length—between pairs of circle friends and randomuser pairs in Google+. The friendship links in Google+ have highergeographical proximity than a random pairs of users. Nearly 58%of the users (friends) were separated by less than a thousand milesand 15% of them were separated by in fact 10 miles. This obser-vation reinforces the high chance that the Google+ network largelycapture the offline social relationships among users. As expected,users with symmetric links (reciprocal) live closer than those withasymmetrical links, indicating the influence of physical distance onthe intensity of the relationship.
One natural question that arises from this result is whether it de-pends, or not, on the country size. For example, do geographicallylarge countries like US have a higher average path mile than small
166
Distance (Thousand Miles)
CD
F
Random
Friends
Reciprocal
0 2 4 6 8 10 12
00.2
0.4
0.6
0.8
1
(a) Path Mile distribution of Google+ users
0
1000
2000
3000
4000
5000
6000
US IN BR GB CA DE ID MX IT ES
Ave
rag
e P
ath
Mile
Country
(b) Average path mile with standard deviation
Figure 9: Path Mile distributions
countries like Italy? If this is the case, large countries should havebetter investment in content distribution in order to minimize jit-ter and delay especially for the delivery of user generated videos.Figure 9(b) shows the average path miles along with the standarddeviation error bar for the top 10 countries. Contrary to our expec-tation, there is no specific pattern relating the size of the countryand its average path mile. One possible explanation could be thatsmall countries have a considerable fraction of edges going outsidethe country. In fact, this result is discussed in next section.
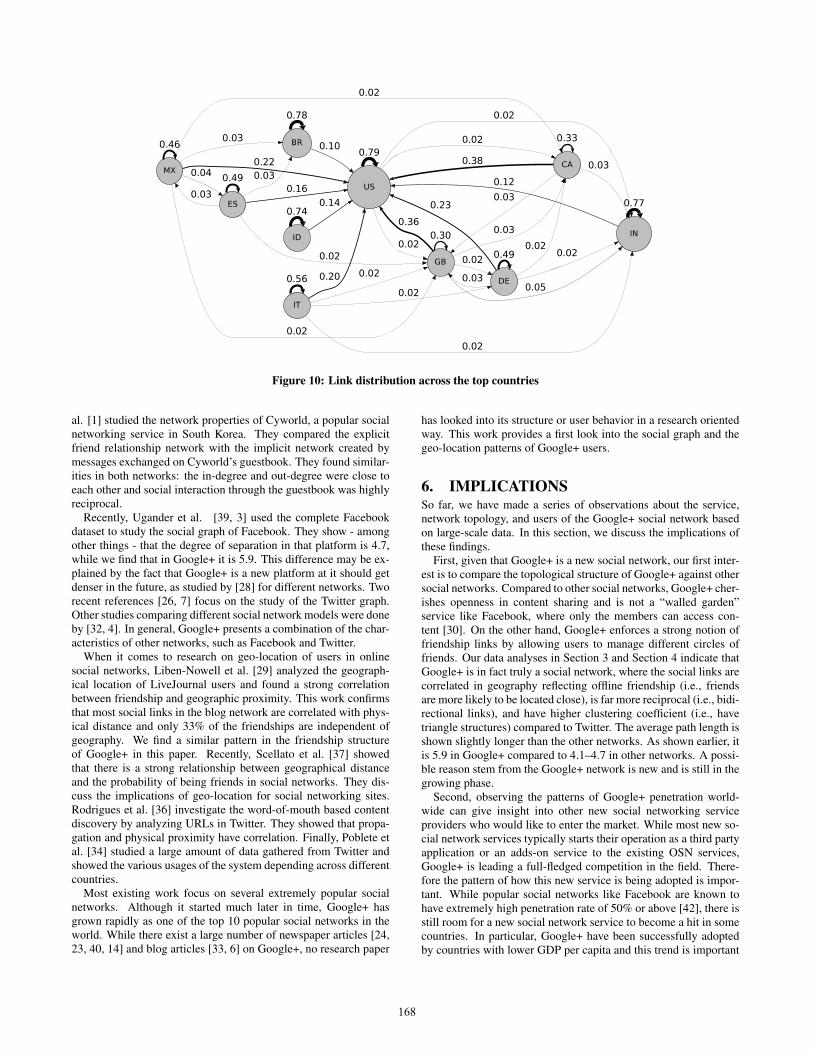
4.5 Social links across geographyThe final question we ask is about the impact of country on friend-ship link formation. In particular, we ask: are users in the samecountry more likely to be friends in Google+ than users in differ-ent countries? To answer this question, we constructed a graphof countries, where each node is represented by one of the top 10countries and the weight of each directed edge is given by the pro-portion of outgoing links from one country to another. Self-loopedges hence would represent the fraction of friendship links thatbind two users in the same country.
Figure 10 shows the visualization of the links across the top 10countries of Google+. The size of each node is normalized to rep-resent the proportion of Google+ users in the associated countryand the thickness of each edge is proportional to its weight. Edgeswith weight smaller than 0.01 were omitted to improve visibility.With this result we find that US has an important role in the overalllandscape of Google+, as seen from the dominant influx of edgesfrom most countries to the US. Moreover, the US is a node withlow reciprocity, which means that there are a significant numberof people of other places adding people in the US to their circleswhile those in the US, in general, prefer to form friendships amongthemselves.
Highly populated countries like Brazil, India, and Indonesia (andthe US as already mentioned) tend to have a high weight in theself-loop edges. For the remaining six countries, the proportionof self-loops is much smaller. In particular, only 30% of the linksare self-loops in United Kingdom and 33% in Canada. These twocountries, as a result, have a large number of out-going edges tothe US, which might be explained by geographical proximity andcultural similarity (e.g., sharing the same spoken language).
It is also worth noticing that in Figure 10, the countries that ex-hibit self-loop edges grater than 0.50 are those that do not haveEnglish as their first languages, which are Indonesia, India, Brazil,Italy. Perhaps because of its economical and technological leader-ship, the US also exhibits a high degree of self-loop edges. Thisindicates the language barrier in the set up of cross-national so-cial relationships. Furthermore, this also means that the nature oflanguage and geography will introduce interesting opportunity forgrowth strategies (e.g., launch of Google+ in a new non-Englishspeaking country will likely show a similar organic growth patternwith many national links).
The average path mile discussed earlier could mean that contentdistribution in Google+ faces similar challenges for both small andlarge countries. In fact, smaller countries like United Kingdom mayrequire more sophisticated measures to reduce delay in content de-livery, as seen from its high average path mile. Furthermore, we seevarying patterns of link formation across different countries. Whenit comes to building recommender systems, it may make sense torecommend domestic users and their content for those countriesthat have high degree of self-loop such as Brazil and India. How-ever, it may be of more interest to the users to recommend foreignusers and content to those in Germany and United Kingdom due totheir low fraction of self-loops.
5. RELATED WORKCharacterization of social networks and user behavior is fundamen-tal to the understanding and engineering of these services on the In-ternet. Many studies focus on the characterization of the most pop-ular social network models, such as Facebook, Twitter, Orkut, Cy-world and others. Some of the important findings of these studiesinclude establishing power law distributions for in- and out-degree,short average distance between pairs of users, a very large con-nected component, and a small number of extremely popular users.Thus, in the remainder of this section, we restrict our coverage ofrelated work to studies that concentrate on characterization of othersocial network models.
Mislove et al. [32] studied graph theoretic properties of socialnetworks, based on the friend network of Orkut, Flickr, LiveJour-nal, and YouTube. They confirmed the power-law, small-world,and scale-free properties of these social network services. Ahn et
167
US
0.79
IN
0.02
GB
0.02
CA
0.02
0.12
0.77
BR 0.10
0.78
0.36
0.05
0.300.03
DE
0.02
0.38 0.03
0.03
0.33
0.23
0.02
0.03
0.020.49
ID
0.140.74
MX0.22
0.03
0.02
0.02
0.46
ES
0.04
IT
0.20
0.02
0.02
0.02
0.56
0.160.03
0.02
0.03
0.49
Figure 10: Link distribution across the top countries
al. [1] studied the network properties of Cyworld, a popular socialnetworking service in South Korea. They compared the explicitfriend relationship network with the implicit network created bymessages exchanged on Cyworld’s guestbook. They found similar-ities in both networks: the in-degree and out-degree were close toeach other and social interaction through the guestbook was highlyreciprocal.
Recently, Ugander et al. [39, 3] used the complete Facebookdataset to study the social graph of Facebook. They show - amongother things - that the degree of separation in that platform is 4.7,while we find that in Google+ it is 5.9. This difference may be ex-plained by the fact that Google+ is a new platform at it should getdenser in the future, as studied by [28] for different networks. Tworecent references [26, 7] focus on the study of the Twitter graph.Other studies comparing different social network models were doneby [32, 4]. In general, Google+ presents a combination of the char-acteristics of other networks, such as Facebook and Twitter.
When it comes to research on geo-location of users in onlinesocial networks, Liben-Nowell et al. [29] analyzed the geograph-ical location of LiveJournal users and found a strong correlationbetween friendship and geographic proximity. This work confirmsthat most social links in the blog network are correlated with phys-ical distance and only 33% of the friendships are independent ofgeography. We find a similar pattern in the friendship structureof Google+ in this paper. Recently, Scellato et al. [37] showedthat there is a strong relationship between geographical distanceand the probability of being friends in social networks. They dis-cuss the implications of geo-location for social networking sites.Rodrigues et al. [36] investigate the word-of-mouth based contentdiscovery by analyzing URLs in Twitter. They showed that propa-gation and physical proximity have correlation. Finally, Poblete etal. [34] studied a large amount of data gathered from Twitter andshowed the various usages of the system depending across differentcountries.
Most existing work focus on several extremely popular socialnetworks. Although it started much later in time, Google+ hasgrown rapidly as one of the top 10 popular social networks in theworld. While there exist a large number of newspaper articles [24,23, 40, 14] and blog articles [33, 6] on Google+, no research paper
has looked into its structure or user behavior in a research orientedway. This work provides a first look into the social graph and thegeo-location patterns of Google+ users.
6. IMPLICATIONSSo far, we have made a series of observations about the service,network topology, and users of the Google+ social network basedon large-scale data. In this section, we discuss the implications ofthese findings.
First, given that Google+ is a new social network, our first inter-est is to compare the topological structure of Google+ against othersocial networks. Compared to other social networks, Google+ cher-ishes openness in content sharing and is not a “walled garden”service like Facebook, where only the members can access con-tent [30]. On the other hand, Google+ enforces a strong notion offriendship links by allowing users to manage different circles offriends. Our data analyses in Section 3 and Section 4 indicate thatGoogle+ is in fact truly a social network, where the social links arecorrelated in geography reflecting offline friendship (i.e., friendsare more likely to be located close), is far more reciprocal (i.e., bidi-rectional links), and have higher clustering coefficient (i.e., havetriangle structures) compared to Twitter. The average path length isshown slightly longer than the other networks. As shown earlier, itis 5.9 in Google+ compared to 4.1–4.7 in other networks. A possi-ble reason stem from the Google+ network is new and is still in thegrowing phase.
Second, observing the patterns of Google+ penetration world-wide can give insight into other new social networking serviceproviders who would like to enter the market. While most new so-cial network services typically starts their operation as a third partyapplication or an adds-on service to the existing OSN services,Google+ is leading a full-fledged competition in the field. There-fore the pattern of how this new service is being adopted is impor-tant. While popular social networks like Facebook are known tohave extremely high penetration rate of 50% or above [42], there isstill room for a new social network service to become a hit in somecountries. In particular, Google+ have been successfully adoptedby countries with lower GDP per capita and this trend is important
168
because the Internet penetration rate of these countries are growingfast–meaning the user base could potentially grow more rapidly forGoogle+.
Third, our findings about the privacy concern of users indi-cate that users exhibit different privacy notions and expectationsin Google+, based on geography. Such differences could be takeninto account when trying to build a recommender system or run anadvertisement campaign on top of Google+, for instance, the sys-tem could feature newly emerging musicians to users in Mexico,while recommend journalists to newly joining users in Italy. Also,running a political campaign on Google+ may not turn out success-ful for many countries, except for in Spain. Another example wouldbe that marketers could build appealing profiles for companies byfollowing the right level of privacy concerns in each country.
Third, based on the information about the circle list and the ge-ography of users, we have examined how the social links are dis-tributed across different countries. The resulting map in Figure 10shows an interpreting landscape of user interactions. We find verydifferent user behaviors in this case. Certain countries like Brazil,India, and Indonesia appear far more inward looking when form-ing social links, than those outward looking countries like UnitedKingdom and Canada. This means that based on the geographicallocation of where a user lives, her expectation towards finding astronger local community in the network is different. We believethis kind of social network analysis allows us to study the collec-tive and deviant behavior of particular demographics, which areincreasingly considered important and useful both in research andpractice.
7. CONCLUDING REMARKSIn this paper we study characteristics of the Google+ social graph.We present a comprehensive description of the platform, highlight-ing the main differences from other popular social network models.Our study is based on a large amount of data gathered encompass-ing 27 million user profiles and their connections to other users.With this dataset we analyze unique features of the Google+ demo-graphics, especially on the gender, occupation, relationship status,and geo-location of users. We construct a graph representing the so-cial relations of Google+ and analyze its structural properties, suchas reciprocity, clustering coefficient, and node degree distribution.The Google+ social graph has a giant connected component thatincluded 70% of the crawled users, which means that informationcan flow freely among all such users.
We also compute the average physical distance between two con-nected users. Exploiting the geo-location of users, we could seehow aggressively Google+ has been adopted in different countries.We investigate relationships between economic indexes of coun-tries and the adoption rate of Google+. We find that Google+ ispopular in countries with relatively low Internet penetration rate.By examining the top users based on the circle link information,seven out of the top 20 users turned out to be in the informationtechnology industry, a trend that is rather uncommon in other onlinesocial networks, where popular figures are media outlets, celebri-ties, and public figures. By looking into users who share their con-tact information publicly, we observe that a large fraction of theusers are male and single.
There are several interesting directions for future research. First,we are interested in measuring the speed at which a new socialnetwork service grows and whether we can predict the phase tran-sitions in the growth sparks (e.g., tipping point when a networksuddenly shows a rapid growth or the point where the growth sta-bilizes and turns into a dormant phase). By collecting multiplesnapshots of the Google+ topology, we hope to gain insight in
the dynamic changes in the internal structure of the social networkover various adoption phases. Second, having seen the key differ-ences of Google+ from other online social networks, we would liketo understand how different privacy settings and openness impactthe types of conversations and the patterns of content sharing inGoogle+. By gathering status updates of the most prolific users,we hope to understand what people expect to read and share fromGoogle+ as opposed to other walled-garden or media-like socialnetworks.
AcknowledgementsWe thank our shepherd Zhi-Li Zhang and the anonymous re-viewers for their valuable comments. This research was partiallyfunded by the Brazilian National Institute of Science and Technol-ogy for the Web (MCT/CNPq/INCT grant number 573871/2008-6). Gabriel Magno, Giovanni Comarela and Virgilio Almeida werepartially supported by grants from CNPq, CAPES and FAPEMIG.Diego Saez-Trumper was supported by the HIPERGRAPH project(TIN2009-14560-C03-01) from the Spanish Economy and Com-petitiveness Ministry. Meeyoung Cha was supported by Basic Sci-ence Research Program through the National Research Foundation,Korea (2011-0012988).
8. REFERENCES[1] Y.-Y. Ahn, S. Han, H. Kwak, S. Moon, and H. Jeong.
Analysis of topological characteristics of huge online socialnetworking services. In Proc. of ACM International WorldWide Web Conference, pages 835–844, 2007.
[2] P. Allen. Google+ growth accelerating. passes 62 millionusers. adding 625,000 new users per day. prediction: 400million users by end of 2012., December 2011.http://bit.ly/gp_nusers.
[3] L. Backstrom, P. Boldi, M. Rosa, J. Ugander, and S. Vigna.Four degrees of separation. CoRR, abs/1111.4570, 2011.
[4] F. Benevenuto, T. Rodrigues, M. Cha, and V. Almeida.Characterizing user behavior in online social networks. InProc. of ACM SIGCOMM Internet Measurement Conference,pages 49–62, 2009.
[5] S. Brin. Web freedom faces greatest threat ever, warnsgoogle’s sergey brin., April 2012. http://www.guardian.co.uk/technology/2012/apr/15/web-freedom-threat-google-brin.
[6] H. Carpenter. I already use facebook and twitter. why do ineed google+?, July 2011.http://tinyurl.com/7pwauo2.
[7] M. Cha, H. Haddadi, F. Benevenuto, and K. P. Gummadi.Measuring User Influence in Twitter: The Million FollowerFallacy. In Proc. of AAAI International Conference onWeblogs and Social Media, 2010.
[8] M. Cha, A. Mislove, and K. P. Gummadi. Ameasurement-driven analysis of information propagation inthe flickr social network. In Proc. of ACM InternationalWorld Wide Web Conference, pages 721–730, 2009.
[9] E. Comission. Attitudes on data protection and electronicidentity in the european union, June 2011.http://bit.ly/wkZhGR.
[10] comScore. Google+ Reaches 20 Million Visitors in 21 Days,July 2011. http://tinyurl.com/3ox3lp9.
[11] comScore. It’s a Social World: Top 10 Need-to-KnowsAbout Social Networking and Where It’s Headed, December2011. http://tinyurl.com/cfhqxke.
169
[12] T. H. Cormen, C. Stein, R. L. Rivest, and C. E. Leiserson.Introduction to Algorithms. McGraw-Hill Higher Education,2nd edition, 2001.
[13] D. Easley and J. Kleinberg. Networks, Crowds, and Markets:Reasoning About a Highly Connected World. CambridgeUniversity Press, 2010.
[14] E. Eldon. Larry page is super excited to announce thatgoogle+ has 90m users, January 2012.http://tinyurl.com/82mkntq.
[15] engadget. Google+ has 250 million users, more mobile thandesktop, June 2012. http://tinyurl.com/d3ausse.
[16] J. Fogel and E. Nehmad. Internet social networkcommunities: Risk taking, trust, and privacy concerns.Computers in Human Behavior, 25(1):153–160, 2009.
[17] Freshtrax. Top 10 most popular websites in china, March2010. http://bit.ly/xgRIAq.
[18] M. Gjoka, M. Kurant, C. T. Butts, and A. Markopoulou. Awalk in facebook: Uniform sampling of users in online socialnetworks. CoRR, abs/0906.0060, 2009.
[19] Google. Orkut demographic data, January 2012.http://www.orkut.com/MembersAll.
[20] R. Gross and A. Acquisti. Information revelation and privacyin online social networks. In Proc. of ACM CCS Workshopon Privacy in the Electronic Society, pages 71–80, 2005.
[21] V. Gundotra. Google+: 92, 93, 94, 95, 96, 97, 98, 99... 100.,September 2011. http://bit.ly/gp_noinvite.
[22] V. Gundotra. Introducing the google+ project: Real-lifesharing, rethought for the web, June 2011.http://bit.ly/gp_released.
[23] J. Halliday. Google+ saw 67m visits in november, with 2.7mfrom uk, says comscore, January 2012.http://tinyurl.com/7ydcnck.
[24] Q. Hardy. Google+ gains traction, researcher says, December2011. http://nyti.ms/wrEsOx.
[25] R. Kumar, J. Novak, and A. Tomkins. Structure andevolution of online social networks. In Proc. of ACMSIGKDD International Conference on Knowledge Discoveryand Data Mining, pages 611–617, 2006.
[26] H. Kwak, C. Lee, H. Park, and S. Moon. What is twitter, asocial network or a news media? In Proc. of ACMInternational World Wide Web Conference, pages 591–600,2010.
[27] J. Leskovec and E. Horvitz. Planetary-scale views on a largeinstant-messaging network. In Proc. of ACM InternationalWorld Wide Web Conference, pages 915–924, 2008.
[28] J. Leskovec, J. Kleinberg, and C. Faloutsos. Graphs overtime: densification laws, shrinking diameters and possibleexplanations. In Proc. of ACM SIGKDD InternationalConference on Knowledge Discovery and Data Mining,pages 177–187, 2005.
[29] D. Liben-Nowell, J. Novak, R. Kumar, P. Raghavan, andA. Tomkins. Geographic routing in social networks.Proceedings of the National Academy of Sciences of theUnited States of America, 102(33):11623–11628, 2005.
[30] R. MacManus. Tim berners-lee calls facebook a walledgarden - is that fair?, November 2010.http://www.readwriteweb.com/archives/tim_berners-lee_says_facebook_is_a_walled_garden.php.
[31] S. Milgram. The small world problem. Psychology Today,2:60–67, 1967.
[32] A. Mislove, M. Marcon, K. P. Gummadi, P. Druschel, andB. Bhattacharjee. Measurement and Analysis of OnlineSocial Networks. In Proc. of ACM SIGCOMM InternetMeasurement Conference, 2007.
[33] J. Mitchell. Google+ is going to mess up the internet,January 2012. http://tinyurl.com/84x7o3a.
[34] B. Poblete, R. Garcia, M. Mendoza, and A. Jaimes. Do AllBirds Tweet the Same? Characterizing Twitter Around theWorld. In Proc. of ACM Conference on Information andKnowledge Management, Glasgow,UK, 2011.
[35] B. F. Ribeiro and D. F. Towsley. Estimating and samplinggraphs with multidimensional random walks. CoRR,abs/1002.1751, 2010.
[36] T. Rodrigues, F. Benevenuto, M. Cha, K. P. Gummadi, andV. Almeida. On Word-of-Mouth Web Based Discovery of theWeb. In Proc. of ACM SIGCOMM Internet MeasurementConference, 2011.
[37] S. Scellato, C. Mascolo, M. Musolesi, and V. Latora.Distance matters: geo-social metrics for online socialnetworks. In Proc. of ACM SIGCOMM Workshop on SocialNetworks, Berkeley, CA, USA, 2010. USENIX Association.
[38] T. Taraszow, E. Aristodemou, G. Shitta, Y. Laouris, andA. Arsoy. Disclosure of personal and contact information byyoung people in social networking sites: An analysis usingFacebook profiles as an example. International Journal ofMedia and Cultural Politics, pages 81–101, 2010.
[39] J. Ugander, B. Karrer, L. Backstrom, and C. Marlow. Theanatomy of the facebook social graph. CoRR, abs/1111.4503,2011.
[40] T. Wasserman. Google+ most popular with male users,students, February 2012.http://tinyurl.com/7kz2k3m.
[41] D. J. Watts and S. H. Strogatz. Collective dynamics of‘small-world’ networks. Nature, 393(6684):440–442, June1998.
[42] ZDNet. Top 10 countries in Facebook adoption, January2012. http://zd.net/xmA4rt.
170