Embed Size (px)
Citation preview

New Joints: Private providers and rising demand in the English National Health Service
IFS Working Paper W16/15
Elaine Kelly George Stoye
New Joints: Private providers and rising demand in the
English National Health Service∗
Elaine Kelly and George Stoye
July 2016
Abstract
Reforms to public services have extended consumer choice by allowing for the entry of
private providers. The aim is to generate competitive pressure to improve quality when
consumers choose between providers. However, for many services new entrants could also
a�ect whether a consumer demands the service at all. We explore this issue by considering
how demand for elective surgery responds following the entry of private providers into the
market for publicly funded health care in England. For elective hip replacements, we �nd that
demand shifts account for at least 7% of public procedures conducted by private hospitals.
These results are robust to instrumenting for location using the presence of existing healthcare
facilities. Exploiting rarely used clinical audit data, we show that these additional procedures
are not substitutions from privately funded procedures, and represent new surgeries, at least
within a given year. The increase in volumes resulting from a demand shift improve consumer
welfare, but impose �scal costs, and do not contribute the original aim of the reforms to
stimulate competition.
Keywords: public service choice; healthcare demand; geographic variation
JEL Classi�cation: I11; I18; L33
∗We thank the Health and Social Care Information Centre for providing access to the Hospital Episode Statis-tics under data sharing agreement NIC-210364-Z4K2F. This paper has been screened to ensure no con�dentialinformation is revealed. We thank the Nu�eld Trust and the ESRC through The Centre for the MicroeconomicAnalysis of Public Policy (CPP) (ES/H021221/1) and Kelly's Future Leaders grant (ES/K009060/1) for �nancialsupport. We are grateful to James Banks, Walter Beckert, Anita Charlesworth, Monica Costa Dias, Richard Disney,Rachel Gri�th, Tom Hoe, Carol Propper, Imran Rasul, Jon Sussex, Gemma Tetlow, Marcos Vera Hernandez, andparticipants of the Nu�eld Trust Market Mechanisms in Health Seminar (2013) and the RES and EEA conferences(2014), and seminar participants at Oxford, Royal Holloway and City Universities. Any errors are our own. Authora�liations and contacts: Kelly (Institute for Fiscal Studies, [email protected]); Stoye (Institute for Fiscal Studiesand University College London, [email protected]).
1
1 Introduction
Governments in many countries around the world have sought to increase the role of choice in pub-
lic services such as health and education [Besley and Ghatak , 2003; Musset et al., 2012; Vrangbaek
et al., 2012]. The aim is typically to increase competition between providers, generating incentives
to improve quality [Hoxby , 2003; Gaynor , 2006]. One type of reform used to enhance choice is al-
lowing the entry of private or third sector providers, expanding the options available to consumers.
The most prominent reforms of this type are in education, through Charter schools [Angrist et al.,
2013; Imberman, 2011; Ladd , 2002], and private school vouchers [Hsieh and Urquiola, 2006; Neal ,
2002; Nechyba, 2000]. In the context of schooling, where decisions are for the most part com-
pulsory, consumers can only respond to the new options available by changing provider. This
paper considers how consumer demand responds when additional providers are introduced in an
environment where there is an outside option.
We consider the case of elective surgery, where the decisions of whether and when to have
surgery often depend on the preferences of patients and doctors in addition to clinical need [Fisher
et al., 2003a,b; Wennberg , 2011]. Reforms that increase the choices available to patients along
margins that they value - such as distance or quality - may therefore a�ect not just where patients
decide to have a procedure, but whether they have a procedure at all1. It is this second margin,
whether new entrants increase the level of demand, that we will consider. This is important as
reforms that result in additional demand for surgery (or the use of any other public service) will
have a greater impact on the public �nances, have additional e�ects on consumer welfare, and
dampen the impact of competition, compared to reforms where demand remains �xed2.
We exploit a set of reforms to the National Health Service (NHS) in England in the mid 2000s,
which enabled privately funded hospitals to treat publicly funded elective patients. Our analysis
focuses on elective hip replacements, where the reforms increased the set of hospitals available
to elective patients by more than half, from 150 in 2002/03 to 257 in 2010/113. Over the same
period, the annual number of hip replacements by more than 60%, with half of these additional
surgeries provided by privately-owned hospitals. Much of this rise is accounted for by the direct
and intended increase in aggregate supply. However, in contrast to expanding capacity in existing
1See Ho [2006]; Beckert et al. [2012]; Gaynor et al. [2016]; Capps et al. [2003] for discrete choice models ofhospital choice and Arcidiacono [2005] and Keane and Wolpin [2001] for models of tertiary education.
2In this paper, we will use patient demand as a short hand for the combination of patient and GP demand. Wedo not attempt to separate the two. However, referring GPs do not have any direct �nancial incentive to refer ornot refer patients in England. We therefore assume that GPs are acting as an agent in the best interest of thepatient.
3Throughout the paper, �NHS-funded� and �publicly-funded� hip replacements will be used synonymously. Wefocus on hip replacements as: (i) the procedure is performed in large volumes across most NHS hospitals in England;(ii) privately-owned hospitals had a substantial market share of the NHS funded market by 2010/11, accountingfor almost a �fth of procedures, and; (iii) there is information on the private pay sector via a clinical audit of jointreplacements [Kelly and Tetlow , 2012]. We include only elective hip replacement patients. We exclude patientsadmitted in an emergency, as these patients have no choice over whether they receive treatment.
2
hospitals, additional hospitals may also change the options available on dimensions that matter
to patients, including distance and potentially quality. In this paper, we exploit variation in the
introduction of providers over time and space to examine whether the entry of private providers
also created additional (and unintended) increases in hip replacement volumes through an outwards
shift in patient demand4.
The primary data source for NHS-funded procedures comes from the inpatient Hospital Episode
Statistics. These administrative data document every admission to an NHS hospital, and admis-
sions to privately-owned hospitals funded by the NHS. As we cannot observe potential patients
that did not have a hip replacement in these administrative data, we aggregate numbers of NHS-
funded hip replacements to the Middle Layer Super Output Area (MSOAs) level (similar to census
tracts)5. We then construct a (balanced) panel data set of the number of procedures in all 6,781
MSOAs in England, for each �nancial year from April 2002 through March 2011. This enables us
to examine changes in the levels or rates of procedures across the country, even though we cannot
observe the decisions of individual patients. To exploit variation in the introduction of privately
owned hospitals, we geocode each MSOA with straight-line distances to the nearest NHS and pri-
vately owned hospital in each year and augment with a series of MSOA characteristics, including
demographics, other measures of population health created using the Hospital Episode Statistics,
and economic activity.
We identify shifts in demand using changes in procedure numbers following the introduction
or new availability of a privately owned hospital. To separate changes in quantities driven by
shifts in demand from those caused by an increase in supply, we exploit variation in the relative
distance to the nearest available privately owned hospital over time within regions with common
supply, in terms of the funding available, the sets of hospitals and provider incentives6. Patients
and their referring physicians are expected to have preferences for shorter distances, which reduce
travel costs7, but proximity may also bring increased salience when referral decisions are made.
Supply, by contrast, is common across much broader geographical regions, which we de�ne as the
152 administrative areas tasked with funding health care for their residents during this period.
To identify impacts on demand, our baseline results use the enhanced panel data set to esti-
mate �xed e�ects models, which controls for time trends within the wider administrative area. We
address concerns about endogenous placement of privately owned hospitals within administrative
areas, by instrumenting with the presence of existing health care sites. We show that these in-
4In this context, demand for procedures is downwards sloping in waiting times. A shift in demand thereforeindicates an increase in the quantity of procedures demanded with waiting times held constant.
5MSOAs are small geographic areas (with an average population of 7,200) used for census and other statisticalaggregation. They have no administrative jurisdiction.
6What this reform does not allow us to identify is whether the type of provider matters, as there are very limitedchanges in the number of public hospitals.
7Discrete models of hospital choice all show a strong preference for shorter travel distances [Beckert et al., 2012;Gaynor et al., 2016; Kessler and McClellan, 2000; Ho, 2006]. For example, Ho [2006] �nds that an additional milereduces the probability that the patient will choose the hospital by 21%.
3
struments are extremely strong, as most of the hospitals that began treating NHS patients were
existing private hospitals, and we provide evidence to support the exclusion restriction that the
presence of existing hospital sites would not otherwise have a�ected the change in procedure num-
bers over this period. Extended analysis uses rarely available data on the private-pay sector from
a clinical audit to provide a further test of our exclusion restriction and to examine whether the
reforms led some patients who would have paid for their procedure through self-pay or private
insurance to substitute towards NHS funded care. Our principal results are three-fold.
First, when privately owned hospitals become the nearest provider of NHS-funded hip re-
placements, our most conservative estimate suggests that MSOA annual volumes of elective hip
replacements increase by 0.5 procedures per year. This compares to a pre-reform average of 5.8
hip replacements in 2002/03, and accounts for approximately 20% of the average rise of 2.6 pro-
cedures between 2002/3 and 2010/11. Using these estimates, we calculate that in 2010/11 shifts
in demand as a response to availability of privately owned hospitals generated an additional 810
procedures, or 6.9% of the total number of procedures conducted by privately owned hospital for
the NHS. These additional procedures cost the NHS around ¿4 million (USD 5.2 million). These
additional procedures did not enhance competition for public providers as consumers chose between
the privately owned provider and no procedure. Our results are robust to alternative de�nitions
of distance and the relevant privately owned hospitals, and remain when we instrument location
with pre-existing medical facilities. These results are consistent with both a high value placed on
distance by patients, or through higher levels of salience for both patients and referring primary
care physicians when additional hospitals become available nearby.
Second, using clinical audit data, we again �nd the same pattern of higher demand estimated
using NHS administrative records, but there is no evidence that these additional procedures repre-
sent substitutions from the private pay sector. This supports our exclusion restriction and implies
that the extra procedures are `new', at least within a given �nancial year. The absence of substitu-
tion is consistent with a 2014 UK Competition and Markets Authority Report, which used survey
evidence to conclude that the NHS-funded and privately-funded healthcare markets were separate
and imposed limited constraints on one another [Competition and Markets Authority , 2014].
Finally, we �nd that when privately owned hospitals begin treating publicly funded patients,
local NHS hospitals show a fall in waiting times but no change in elective hip replacement volumes.
The rationing of treatment via waiting lists combined with relatively plentiful public funding,
allowed public hospitals to replace patients who substituted towards privately owned hospitals with
patients from further down the waiting lists. This suggests that the additional hip replacements
we estimate represent a permanent increase in procedures and associated costs for the cohorts
a�ected, irrespective of whether the patient would otherwise have died before having the procedure,
or the procedure was brought forward allowing another patient to take their place. The additional
procedures therefore improved consumer welfare, but also generated increased costs for the publicly
funded NHS.
4
Together our results make three main contributions. First, we contribute to literature that
examines choice of provider in healthcare [Beckert et al., 2012; Gaynor et al., 2016; Ho, 2006] and
other services such as education [Arcidiacono, 2005; Keane and Wolpin, 2001]. We show that in
situations where there is an outside option, changing hospital choice sets or the characteristics
of hospitals within existing choice sets, can a�ect decisions on the extensive margin. The set of
decision makers is not necessary exogenous. Relatedly, we contribute to the literature on expanding
choice in the public sector, which has typically focused on the impacts on provider quality or
consumer outcomes.
Second, our results contribute to the growing literature on the geographic variation in health-
care utilization, by providing both some context and one potential contributing mechanism. In
terms of context, we provide evidence of geographic variation in England, where the types of physi-
cian incentives discussed as possible causes in the US context are absent [Chandra et al., 2011;
Finkelstein et al., 2016; Skinner , 2011]. In terms of mechanisms, we show that patients respond
to the characteristics and organization of the hospitals available. A patient that moves to an
area with a denser network of hospitals may have higher healthcare use, because it is easier or
quicker to access healthcare. Opening a new hospital could, to some extent, `create' new demand,
particularly in the grey area of medicine where there are less established protocols8.
Finally, although we exploit a policy change designed to increase choice, our results have wider
applicability to changes in hospital availability more generally, either through the ongoing process
of hospital consolidation [Barro and Cutler , 2000; Gaynor and Town, 2012; Gaynor , 2011] or
reforms that alter patient access to hospitals, such as managed care [Glied , 2000; Ho, 2006] or
patient choice reforms [Cooper et al., 2011; Gaynor et al., 2016]. These literatures have tended to
focus on the supply side, and the resulting impacts on prices, productivity and quality. We show
that there may also be demand-side responses, which have important implications for both patient
welfare and hospital competition.
The rest of the paper is organized as follows. Section 2 details the institutional background and
the reforms. Section 3 describes our identi�cation strategy, data and empirical method. Section 4
presents our baseline results and robustness tests using NHS administrative data. Section 5 uses
clinical audit data to consider the extent of substitution between privately and publicly funded
procedures. Section 6 provides some evidence on the impact on NHS hospitals. Section 7 concludes.
8An earlier literature on supplier induced demand sought to explain the positive association between availabilityand use through physicians exploiting their agency to `induce' demand [Fuchs, 1978; Auster and Oaxaca, 1981;Gruber and Owings, 1996]. The di�culty is in identifying whether observed quantities are high due to high supplyor high demand. Our results suggest that patient demand does respond to exogenous shifts in supply. Whileour identi�cation strategy focuses on distance, it seems plausible that patients and referring physicians would alsorespond to improvements in quality.
5
2 Background
2.1 Institutional Background and Policy Reforms
The majority of health care in England is funded by the state through general taxation, and
provided through the National Health Service (NHS) free at the point of use. Patients access
elective hospital services, such as hip replacements, through a referral from their primary care
doctor or General Practitioner (GP). There are no self-referrals. Secondary or hospital care,
including both outpatient consultations and inpatient treatment, has historically been delivered
by state owned and run NHS Acute Trusts, or hospitals, and is rationed through waiting times9.
These hospitals receive per patient payments for the treatments provided, where payments for each
type of treatment are set at a national level10. There is a small private pay sector, which accounted
for a �fth of hip replacements in 2002 [Arora et al., 2013].
This paper focuses on a set of reforms that opened up the market for NHS-funded elective
care to non-NHS providers. The NHS had purchased small volumes of care from the private or
independent sector on an ad hoc basis for many years. However, reforms introduced between 2003
and 2008 formalized and greatly increased the ability of non-NHS hospitals to compete with NHS
hospitals for patients, and the opportunities for NHS-funded patients to access treatment at non-
NHS hospitals. We will refer to these reforms as the �Independent Sector Provider� reforms and
the non-NHS hospitals as �Independent Sector Providers� (ISPs). ISPs providing hip replacements
were exclusively privately owned and run hospitals.
The reforms were introduced in two waves, which correspond to the changing focus of NHS
priorities during the 2000s. The �rst wave the ISP reforms commenced in 2003, with the principal
aims of reducing waiting times and addressing capacity constraints. This re�ected the focus of NHS
policy in the 2000s, which aimed to reduce the very long waiting times within the NHS, initially
through strict waiting time targets backed with increases in funding 11. Figure 1 shows the change
in mean and median waiting times over the 2000s, and shows sharp decreases as targets were
imposed and then tightened. The new ISPs introduced in this period were designed to concentrate
on routine patients, allowing the NHS to focus on emergency care and the more complex cases
[Naylor and Gregory , 2009]. Most ISPs that opened at this stage were privately owned but treated
9An NHS Acute Trust may be comprised of a single hospital or multiple hospitals within the same geographicarea. For ease of expression we will refer to these NHS Acute Trusts as hospitals.
10Hospital care is grouped into Healthcare Resource Groups (HRGs), which are similar to Diagnostic ResourceGroups in the US. Prices or Tari�s are then set at a national level based on the average cost of providing theassociated care. Small adjustments are made for unavoidable local di�erences in costs and length of stay.
11The �rst waiting times target was introduced in April 2001, with a maximum wait of 18 months between thedecision to admit and inpatient admission. The target was reduced by three months each year. In December 2008a new referral to treatment (RTT) target was introduced, with a maximum wait of 18 weeks between GP referraland inpatient admission. See Propper et al. [2010] for discussion and evidence on the waiting time targets that wereimplemented from 2000 onwards.
6

only NHS patients12.
The second wave of the ISP reforms was launched in 2006, with the expanded objectives of
increasing competition for NHS providers and fostering innovation [Naylor and Gregory , 2009].
At this point, the main focus of NHS policy moved away from the now much lower waiting times
and towards introducing consumer choice and competition between providers. The patient choice
reforms of 2006 established a requirement for GPs to o�er patients a choice of hospital when re-
ferring patients for almost all elective care13. The second wave of ISPs then o�ered patients a
wider choice set of hospitals for a number of elective treatments. The aim was that this would
generate more competition for NHS hospitals and provide an illustration of the potential for e�-
ciency gains. From 2006 onwards, most of the new ISPs were existing privately owned hospitals
that treated privately and NHS funded patients alongside one another14. This second reform has
more in common with private school vouchers that have operated in the US, Chile and elsewhere
[Hsieh and Urquiola, 2006; Neal , 2002; Nechyba, 2000]. By 2010/11, two thirds of patients treated
by ISPs were treated by this type of ISP.
The �Independent Sector Reforms� have received far less attention from the economics of health
care literature than the concurrent patient choice reforms. Almost all existing work work focuses
the �rst wave of the reform, and concentrates on case mix. Chard et al. [2011], Bardsley and
Dixon [2011] and Audit Commission [2008], for example, �nd that patients treated by the �rst
wave of ISPs are healthier and wealthier than those treated by NHS hospitals. Similarly, Cooper
et al. [2015] �nd that the introduction of the �rst wave of ISPs led to costlier case-mix for nearby
NHS hospitals. Some of this sorting of less complex patients towards ISPs is a consequence
of government regulations on which patients were eligible, as ISPs do not have intensive care
facilities available. However, there remains a debate as to the extent that ISPs further adjusted
their eligibility criteria to `cherry-pick' the least costly patients [Naylor and Gregory , 2009; Audit
Commission, 2008; Cooper et al., 2015].
The growth in the role of ISPs in the market for elective hip replacements is illustrated by
Figure 2, which shows the number of annual procedures by provider type. There are three points
of note. First, total elective hip replacements increased by 61% over the period. This re�ects a
general pattern in NHS elective care in the 2000s, irrespective of whether ISPs entered the market
for a particular surgery. A small share of increase (around a �fth for elective hip replacements)
is explained by demographic change, the remainder and real driving forces were a combination of
increased funding and waiting time targets [Kelly and Tetlow , 2012; Arora et al., 2013]. Second,
12These providers were known as Independent Sector Treatment Centres (ISTCs)13The limit on the number of hospitals was then removed in 2008. This replaced a system where patients could
state preferences but GPs were under no obligation to actively o�er their patients a choice. Henceforth, we willrefer to these reforms as the �patient choice reforms�. These reforms were motivated by both the belief that patientsvalued the choice over their care, and evidence that health care competition (when prices were �xed) could improvequality [Gaynor , 2006]
14To be clear, these hospitals were treating privately funded patients before the ISP reforms. The reforms addedNHS-funded patients to their patient roll.
7

ISPs provided almost no NHS-funded hip replacements in 2002/03, but after 2007/08 their market
share grew rapidly, reaching 18% in 2010/11. Third, the number of procedures conducted by NHS
hospitals increased between 2002/03 and 2007/08, but leveled o� after ISPs began to grow.
Figure 3 plots the locations of ISPs conducting at least 20 hip replacements per year in 2006/07,
2008/09 and 2010/1115. The number of ISPs grew from just nine in 2006/07, to 54 in 2008/09
and 106 in 2010/11. The map illustrates that ISPs were spread across the whole country. There
was very little change in the number of NHS hospitals, which remained at around 160 throughout
the period. By 2010/11, the ISP reform had therefore increased the number of hospitals available
to patients by two-thirds. However, the greater volume of procedures conducted by each NHS
hospital meant that NHS hospitals still delivered over 80% of all NHS-funded hip replacements by
the end of the period16.
2.2 The potential impact of ISPs on the market for hip replacements
Figure 4 provides a stylized example, which can be used to explain the change in the size and
composition of the market for elective hip replacements observed in Figure 2. The left hand panel
shows the market for NHS funded hip replacements provided by NHS hospitals, the only providers
of NHS-funded hip replacements before the ISP reforms. Demand is downward sloping in waiting
times. Supply is upward sloping until a certain level of procedures, but then becomes perfectly
inelastic once hospitals are constrained by numbers of sta� and beds. Assume that in 2001, when
policies were �rst introduced to cut waiting times and increase health care provision, supply stood
at S01NHS, and demand at DNHS, giving an equilibrium quantity of 0PA with a waiting time ofW 01.
Following the introduction of strict waiting time targets and additional funding for sta� and beds,
supply shifted out from S01NHS to SNHS. Quantity rose from 0PA to 0PB, while waiting times fell
from W 01 to W .
The introduction of ISPs generated a second segment to the market, displayed in the right
hand panel. We assume in this market that supply is upward sloping along its whole length. The
principal objectives of the ISPs reforms were to cut waiting times and increase competition for
NHS hospitals. For both these goals, the implied �supply mechanism� was that some patients
would switch from NHS hospitals to ISPs, shifting demand for NHS hospitals from DNHS to
D′NHS
17. Waiting times fall from W to W ′, with the impact on quantity depending on whether
the equilibrium moves to the upward sloping portion of the demand curve. In this example quantity
15We restrict our attention to ISPs conducting at least 20 hip replacements to avoid potential issues of disclosivityof plotting ISPs that perform more than a lower minimal threshold. Furthermore, we argue that ISPs conductinga very small number of hip replacements may not be available in the choice sets of most patients. Reducing theminimum threshold from 20 to 5 procedures increases the number of ISPs by 22%, but these smaller sites accountedfor just 2.7% of ISP patients in 2010/11.
16In 2010/11, ISPs performed an average of 90 hip replacements per hospital, compared to over 300 per NHShospital.
17We assume for simplicity that the supply curve is una�ected. This is also consistent with the pattern in Figure2, as total numbers of hip replacements conducted by NHS hospitals leveled o� after ISPs were introduced.
8
remains PB. Under the assumption that ISPs only shift patients away from NHS hospitals, the sum
of the post-reform demand for ISPs (D1ISP ) and NHS hospitals (D
′NHS) is equal to the pre-reform
demand (DNHS). The total number of NHS hip replacements is equal to 0PB hip replacements
conducted by NHS hospitals plus 0IA delivered by ISPs. Total quantity has risen by 0IA, as ISPs
have increased supply and reduced waiting times, moving patients along the demand curve for
elective hip replacements.
The impact of ISPs on supply bene�ts patients treated by NHS hospitals and by ISPs. Patients
who would have otherwise have been treated experience lower waiting times, and additional patients
receive a procedure they would not have had in that year. ISPs have receive a payment of IA
multiplied by the NHS tari� price (approximately ¿5,000 or USD 6,500). For NHS hospitals,
the impact on volumes and revenue depends upon whether demand shifts to the upwards sloping
portion of the supply curve18.
In this paper we examine whether the increase in hip replacement is explained wholly by the
�supply mechanism� described, with falls in waiting times leading to a rise in quantity and a
movement along the market demand curve. In particular we ask whether the entry of ISPs also
generates a shift in demand. The patient choice literature, at least within economics, typically
treats the set of patients requiring treatment as �xed. However, many elective procedures can be
delayed or avoided, through capacity constraints within a health system such as the NHS, lack
of insurance coverage in the US, or patient preferences. Surveys of patients show a reluctance
to undergo surgery, even when the procedure is clinically appropriate [Hawker et al., 2001], and
there are sizable variations in surgery rates by geography and socioeconomic group [Fisher et al.,
2003a,b]. When weighing up the costs and bene�ts of a procedure, patients will take waiting times
(or price) into account, but there are many other factors that may be considered, including distance
and the quality of clinical and hotel services. Patients will then choose to have the procedure if
the expected utility from it exceeds the expected utility from the outside option.
Under the assumption that ISPs and NHS hospitals are perfect substitutes, demand for ISPs is
represented by D1ISP , with D1
ISP + D′NHS equal to the pre-reform demand of DNHS. However,
when ISPs have characteristics that are preferred by some consumers, demand will shift to D2ISP ,
increasing hip replacements conducted by ISPs by an additional IAIB hip replacements. The
aggregate number of hip replacements displayed in Figure 2 is 0IB, the sum of increase in hip
replacements generated by the increase in supply (0IA) and the impact of the shift in demand
(IAIB).
Any additional hip replacements generated by a demand shift (IAIB) may come from two
sources. First, substitutions from the private pay sector, which are explored in Section 5. Second,
hip replacements that would not otherwise have taken place in that year. We will assume that any
additional procedures are clinically appropriate in the same way that we assume that the additional
18There is potentially an increase in costs due to a change in case mix, countered by a potential improvement ine�ciency generated by increased competition.
9

20,000 hip replacements conducted in 2010/11 relative to 2002/03 are clinically appropriate. The
welfare and public �nance implications of this type of expansion are discussed in Section 6.
In the context of the ISP reforms, the increase in hip replacements induced by the shift in
demand (IAIB) is important because the additional procedures do not further either the waiting
times or competition policy objectives: there is no reduction waiting times in NHS hospitals as
D′NHS is una�ected, and these are not patients that NHS hospitals could compete for, at least in a
given time period. Welfare increases for patients IAIB but falls for consumers 0IA, as waiting times
are slightly higher. ISPs receive a �xed payment for each hip replacement they conduct. Overall,
the ISP program allowed revenues of private hospital groups to grow over the period between
2005 and 2012, even though revenue from privately funded patients remained �at in real terms
[Competition and Markets Authority , 2014]19. Whether the demand shift increases ISP pro�ts
depends upon whether IAIB are new patients or substitution from the private pay sector, where
the payment received is double that paid by the NHS [Lunt et al., 2011; Department of Health,
2010].
While we consider the speci�c case of ISP reforms, the same potential mechanisms apply to
other changes in patient and consumer choice sets. Over the past two decades, there have been
substantial changes in the hospital choice sets faced by patients in many health care markets,
with mergers and HMOs constraining choice sets, and policies such as the �patient choice reforms�
and the introduction of Ambulatory Surgery Centres in the United States enabling or increasing
choice. Understanding whether and how demand responds to changes in the size and characteristics
of hospital choice sets has important implications for the costs faced by both public payers and
insurance companies.
3 Identi�cation, data and empirical method
3.1 Identi�cation Strategy
The objective of this paper is to identify whether the introduction of ISPs led to a shift in demand
for elective hip replacements, which explains part of the overall increase in hip replacements ob-
served over the period. This di�ers from the existing literature on patient choice, which focuses on
the hospitals that are chosen conditional on having a procedure, taking the set of patients as given.
[Beckert et al., 2012; Gaynor et al., 2016; Ho, 2006]. Identifying demand responses at the extensive
margin poses two challenges not present when considering the choice between hospitals. First, the
administrative hospital data contain only those who chose to receive treatment. To address this,
we aggregate hip replacements to the Medium Layer Super Output Area (MSOA)20. This allows
19By 2012, 27.3% of the revenue of private hospitals came from the NHS [Laing & Buisson, 2013]20These MSOAs are statistical aggregation units, with no administrative jurisdiction. There are 6,781 MSOAs in
England, with an average population of 7,500
10

us to consider changes in levels or rates across the country, even though we cannot observe the
choices made by individual patients. Existing work in this area has typically been theoretical,
which may in part re�ect both di�culties in obtaining a su�ciently large and measurable change
in competition, and the absence of data on patients who chose the outside option21.
The second and more important challenge to identi�cation is separating the impact of ISPs on
demand from the e�ects on supply. As noted in Section 2.2, the total quantities observed in Figure
2 shows the combination of these two mechanisms. Our estimation strategy separates demand
from supply by using variation in distance to hip replacement providers within areas that share a
common supply side.
On the demand side, responses of patients and GPs may vary by distance through either
a preference for shorter travel distances or higher salience at closer proximity22. The salience
channel may be particularly important in this context, as GPs are gatekeepers to NHS hospital
services. Even though there are no �nancial incentives to refer or not refer, GPs are aware that
referrals create waiting time externalities for other patients who might be in greater need. ISPs
treat less severe cases and have smaller waiting lists, so the expected externality is smaller.
On the supply side, during this period hospitals received payments from Primary Care Trusts,
which received funding from central government for the treatments received by all patients living
within their geographic area. Crucially, organizations have no incentives to fund patients living
within their borders di�erentially. PCT areas were established in 2002, and consolidated in number
in 2006 mostly by merging old PCT areas together. From 2006 onwards, England was divided into
152 PCT areas, covering an average of 330,000 people. Of these areas, 98 contained at least
one MSOA where the nearest elective hip replacement provider was an ISP in 2010/11, and 107
contained at least one MSOA where the nearest elective hip replacement provider was an ISP
at some point between 2002/03 and 2010/11. In other words, around two thirds of PCT areas
contribute to our baseline estimation of the impacts of the introduction of ISPs on demand 23.
Figure 5 illustrates our baseline approach using an example from the Leicester City PCT area.
Throughout the period, elective procedures for patients living within this area were all funded by
the same PCT area administration. All hospitals were paid the same tari� or fee irrespective of
where patients lived. In 2002/03, NHS-funded hip replacements were provided by the NHS hospital
Leicester General Hospital. This hospital was the nearest NHS provider for residents within areas
denoted by both the square and the circle. The ISP reforms meant that by 2010/11, patients
21Brekke et al. [2008], for example, present a theoretical model examining the relationship between competitionand waiting times in a model with a competitive segment where patients choose between hospitals, and a monopolysegment where patients choose whether to receive treatment.
22Discrete choice models of hospital choice, in many countries and types of healthcare system, suggest thatpatients have a preference for shorter travel distances [Beckert et al., 2012; Gaynor et al., 2016; Ho, 2006]. Distancehas a strong in�uence for other services, such as university [Arcidiacono, 2005; Keane and Wolpin, 2001] and school[Burgess et al., 2015].
23Robustness tests will include models where all PCT areas contribute towards identi�cation, by using measuresof absolute and relative distance to ISPs.
11

could also receive NHS-funded treatment from Nu�eld Health Leicester, which is a pre-existing
privately owned hospital. For residents in the square area, the nearest provider changed to the ISP,
whereas for residents of the circled area the nearest provider remained the NHS hospital. However,
residents in both areas face identical choice sets and the same waiting time conditional on hospital
choice. The only di�erence is in the relative distance to the new provider. A larger increase in
hip replacements for residents in the square area can therefore only operate through the e�ect of
relative distance on demand and not di�erences in supply24.
3.2 Data and empirical method
Data on NHS-funded elective hip replacements comes from the inpatient Hospital Episode Statistics
(HES) from April 2002 to March 2011. HES contain the records of all NHS-funded hospital care
in England. This includes both care provided by NHS hospitals and care received by NHS-funded
patients treated elsewhere25. The inpatient data contain information about the patient, including
their age, sex, GP practice and local area, the admission type (emergency or elective) and dates,
up to 20 diagnoses, and all procedures patients receive.26
To obtain a measure of how the rate of elective hip replacements varies across England and
over time, we aggregate individual patient level records to the MSOA level for each �nancial year
between April 2002 and March 201127. There are a total of 6,781 MSOAs in England, with an
average population of 7,200, giving a total sample of 61,029 MSOA/year observations. For each
MSOA and year, we geocode to calculate the nearest NHS hospital and ISP that performed at
least 20 hip operations28.
In our baseline �xed e�ects speci�cation, the number of (age and sex standardized) NHS-
funded hip replacements (ISP plus NHS hospital) for residents of MSOA (small statistical area)
24There may be supply side factors that drive the number of hip replacements within the PCT area, such as thetastes of physicians, or some unobserved incentives o�ered by the PCT administration, but this should be constantacross patients within the PCT. Extended results will de�ne the relevant supply constraint as the nearest NHShospital. In reality, PCT areas and the nearest NHS hospital areas overlap heavily. Results are invariant to whichde�nition of supply is used.
25An NHS hospital (Trust) provides secondary (hospital) care to NHS patients in England. It is typically com-prised of a hospital or number of hospitals run by the same hospital board, and is headquartered in the main orlargest hospital.
26Hip replacements include those operations with O�ce of Population Censuses and Surveys (OPCS) Clas-si�cation of Interventions and Procedures codes (4th Edition) beginning W37, W38, W39, W93, W94 andW95. Each operation code de�nes a di�erent type of hip replacement. For a full list of OPCS codes see here:http://www.surginet.org.uk/informatics/opcs.php.
27Financial years run April to March. Emergency hip replacements are not used, because ISPs do not treatemergency patients and patients have no choice over where they are treated
28The nearest NHS hospital is de�ned by the nearest NHS Acute Trust headquarters that conducts hip replace-ments. The restriction to exclude ISPs conducting less than 20 procedures aims to concentrate on ISPs that areavailable to patients. This restriction removes 34 of the 140 ISPs that were operating in 2010/11, which accountedfor just 3% of ISP patients. Robustness tests will estimate results with a minimal threshold of 5 ISPs, which accountfor all but 0.3% of patients.
12
m in PCT area p and year t is given by the following29:
Hipsmpt = α + βISPmpt + γm + µpt + πt +Xmpt + εmpt (1)
where ISPmpt is a measure of the (relative) distance between the nearest ISP and the centroid
of the patient's MSOA in year t. In our main speci�cations, ISPmt is an indicator that takes
the value 1 if the nearest provider of hip replacements in year t is an ISP. However, we also
consider alternative speci�cations where we use continuous measures of the absolute distance to
the nearest ISP and the distance relative to the nearest NHS hospital. The MSOA �xed e�ects,
γm, control for permanent di�erences in the number of hip replacements across MSOAs, while πt
accounts for England-wide time trends. The PCT area speci�c time trends µpt control for PCT
area wide factors that might change over time, and will include the average PCT area-wide e�ect
of the introduction of an ISP. The coe�cient of interest is β, the e�ect of introducing an ISP close
to MSOA m on number of residents admitted for NHS-funded hip replacements, relative to the
average e�ect across the patient's PCT area. This aims to capture the e�ect of ISPs on the volume
of hip replacements generated by a shift in patient demand, as supply constraints are assumed to
operate at the level of the PCT area. As we aggregate hip replacements provided by NHS hospitals
and ISPs, substitutions between the two providers will not change overall volumes. The increase in
volume generated by a rise in supply should be spread evenly across the PCT area and be captured
by PCT area time trends. In the context of our results, we will refer to impacts on demand and
impacts on volume as the result of shifts in demand interchangeably.
As with any �xed e�ects model, the principal threat to identi�cation is the presence of con-
temporaneous shocks or trends that a�ect the volume of hip replacements in an MSOA, which are
correlated with the introduction of ISP but are not captured by PCT area wide trends. We use
two principal methods to address these concerns. First, in our baseline speci�cations we control
for MSOA level characteristics that vary over time, Xmt. These include: (standardized) number of
admissions for fractured neck of femur and acute coronary syndrome to capture population need30;
nearest NHS hospital emergency readmissions to hospital within 28 days of discharge to provide a
29NHS-funded hip replacements are age and sex standardized to re�ect the England-wide population distributionin 2001. This removes the impact of di�erential changes to the demographic compositions across MSOAs on thegrowth of hip replacements. We use a direct standardization method, which calculates the age and sex-speci�c hipreplacement rates for each MSOA in each �nancial year, and multiplies this rate by the number of persons of eachage and sex in a reference population. We use the England-wide population distribution in 2001 as the referencepopulation (i.e. the mean number of persons in age and sex category in an MSOA in 2001).
30Fractured neck of femur and acute coronary syndrome are emergency conditions that typically a�ect older peo-ple. As admissions are nearly always an emergency, admission rates should re�ect patient need and be uncorrelatedwith the introduction of ISPs, which only treat elective cases. As with elective hip replacements, admissions aretypically for older people, although the average age of admission for the two emergency conditions is somewhatolder. Finally, fractured neck of femur typically results in an emergency hip replacement, which uses the same sur-geons and resources as elective hip replacements. Higher rates of fractured neck of femur admissions could thereforeindicate both higher need in the population, as conditions such as osteoporosis increase the need for both electiveand emergency hip replacements, and greater demand on local orthopedic units from emergency patients, whichcould result in longer waiting times for elective patients.
13
measure of the quality of the nearest NHS hospital; and number of house price sales and median
house price, to account for changes in economic conditions31. The identifying assumption is that
conditional on Xmpt and µpt, other unobserved and time varying determinants of hip replacements,
εmt, are uncorrelated with the introduction of ISPs. This includes responses to falling waiting
times and the introduction of increased choice in 2006. The standard error, εmpt, is robust to the
presence of heteroskedasticity and clustered at the PCT area level, to account for ISP placement
and funding decisions that take place at the administrative level.
Second, in Section 4.3.3, we address the non-random placement of ISPs using Instrumental
Variables (IV) estimation, where the location of ISPs is instrumented with the presence of existing
NHS and private health care facilities. It is however worth emphasizing that our baseline results
are estimated within PCT. Any bias would therefore require that the location of ISPs within
PCT areas was correlated with within PCT area variation in waiting lists or capacity constraints.
Furthermore, although the introduction of the initial wave of ISPs was correlated with pent up
demand, the precise timing of their introduction is likely to have been in�uenced by local contract
or construction delays.
4 Results
4.1 Descriptive evidence on ISP use and distance
In our main speci�cations, where ISPmpt is speci�ed as an indicator for whether the nearest
provider of hip replacement is an ISP, β̂ will capture an intensity of treatment e�ect on demand.
The 2008 patient choice reform allowed patients to choose between any provider registered to
provide NHS-funded care. In that sense, all areas of England were a�ected or `treated' by the
introduction of ISPs. However, existing empirical evidence suggests (relative) distance is a crucial
determinant of a patient's hospital choice on the intensive margin, and we similarly expect distance
to play a strong role on the choice on the extensive market of whether to seek treatment [Beckert
et al., 2012; Varkevisser et al., 2010; Kessler and McClellan, 2000]. Moreover, prior to the patient
choice reforms, the patient's nearest NHS hospital was typically the default treatment location,
accounting for two thirds of all elective hip replacements in 2002/03 [Kelly and Tetlow , 2012]. We
therefore de�ne MSOAs as `treated' if an ISP is introduced closer than the nearest NHS hospital.
Table 1 tests whether distance is a valid measure of intensity of treatment from ISPs. Column
1 shows the proportion of MSOAs that are treated in each year between 2002/03 and 2010/1132.
31Population need characteristics are calculated using HES. Nearest NHS hospital character-istics are available via the NHS Health and Social Care Information Centre Indicators Portal(https://indicators.ic.nhs.uk/webview/). Information on house sales and prices comes from the O�ce forNational Statistics (http://www.ons.gov.uk/ons/rel/regional-analysis/house-price-statistics-for-small-areas/1995-2013/index.html)
32There was no activity in 2002/03 and the small amount of activity in 2003/04 has been redacted due to the
14
Until 2007/08, the percentage of treated MSOAs �uctuated between 2% and 5%, re�ecting ad hoc
purchasing from the private sector. The share of treated areas rises rapidly thereafter, reaching
26% by 2010/11. For MSOAs that were treated in 2010/11, the average distance to the nearest
ISP was on average 2.6km less than the mean distance to the nearest NHS hospital (10km)33. In
these areas, the ISP reforms therefore reduced the average distance to the nearest provider of hip
replacements by a quarter. This reduction in distance could have a direct e�ect on demand if
patients and their GPs have a high preference for short travel distances, but closer proximity may
also drive higher salience of the new entrants.
The second and third columns test the assumption that distance a�ects the likelihood patients
choose an ISP by comparing the probability of treatment by the nearest provider type. In all
years, the share of patients treated by ISPs is higher when the nearest provider to the centroid of
the MSOA is an ISP. By 2010/11, 25.9% of all NHS funded hip replacements in areas with an ISP
closer were delivered by ISPs, compared to 12.7% elsewhere. This con�rms that the probability
that an individual is treated by an ISP declines with (relative) distance, but that NHS hospitals
remain the predominant provider of NHS-funded hip replacements, even in areas with a closer ISP.
The �nal column shows that in 2010/11 just over two-�fths of the patients treated by ISPs live
nearer to an ISP than their nearest NHS hospital, illustrating that although we de�ne treatment
as living closer to an ISP than an NHS hospital, patients in other areas also receive care from ISPs.
To assess whether the raw data provides any support for an e�ect of ISPs on total demand for
hip replacements, Figure 6 plots the growth in the average number of NHS-funded hip replacements
(the sum of those conducted by ISPs and NHS hospitals) per MSOA, by the nearest provider type
in 2010/11 (NHS or ISP). Given that in 2002/03, the closest provider was always an NHS hospital,
having a closer ISP in 2010/11 implies that an ISP began treating NHS-funded patients some time
in the intervening period.
The solid black line shows the growth in the average number of hip replacements for the 79%
of MSOAs where a NHS hospital remained the nearest provider in 2010/11. The gray line shows
the growth in MSOAs where an ISP that conducted at least 20 hip replacements was the closest
provider by the end of the period. There are two main points two note. First, the average number
of hip replacements in the two types of area were very similar in 2002/03 at just under 6 per
MSOA, before the ISP reforms were introduced, with slightly higher averages in areas where a
NHS hospital remained the nearest provider in 2010/11. Second, as ISP started to open, hip
replacement rates grew faster in areas where an ISP was the closest provider in 2010/11: the
average number of hip replacements in areas where the nearest provider was an ISP in 2010/11
rose to 9.3 (or 67%) by the end of the period, compared to 8.1 (or 40%) in areas where the nearest
provider was a NHS hospital. For the dashed line, we lower the procedure threshold for an ISP
small sample size.33By way of comparison, the average distance between the centroid of an MSOA and the centroid of its closest
MSOA is 2.3km.
15

from 20 to 5. As expected, the pattern is similar but somewhat weaker, as we expect that not all
patients will have access to these smaller ISPs.
4.2 Fixed E�ects
Table 2 provides the baseline estimates of (1). Column 1 includes only MSOA and year �xed
e�ects. The speci�cation therefore measures the combined e�ects on volumes of a relaxation in
capacity constraints, and a potential shift in demand. The estimated coe�cient suggests that
the introduction of an ISP adds 0.87 hip replacements to the MSOA average, an e�ect which is
statistically signi�cant at the 1% level, and compares to an average volume of 5.8 procedures in
2002/03.
Column 2 adds PCT area speci�c time trends that control for all time varying factors at the
PCT level, and controls for any impact on volumes through a PCT wide relaxation in capacity
constraints. As expected, this reduces the magnitude of the estimated impact of the introduction
of an ISP, which falls to 0.46 but remains signi�cant at the 1% level. This suggests that demand
shifts explain a sizable proportion of the overall change in hip replacement volumes. Adding our
MSOA time-varying controls in column 3, has no e�ect on our coe�cient of interest in terms of
either magnitude or statistical signi�cance.
An approximate cost to the NHS of the additional procedures can be calculated by combining
the coe�cients in Table 2 with the number of MSOAs that were treated and the NHS tari� for a
hip replacement. In 2010/11, 1,761 MSOAs had an ISP conducting at least 20 hip replacements
as their nearest provider. In the same year, the NHS tari� was approximately ¿5,000 [Department
of Health, 2010]. Our most conservative estimate of the e�ect of ISPs on demand in column 3
therefore suggests an annual increase of 810 hips across England at a cost of ¿4.1 million or USD
5.3 million.
As discussed in Section 4.1, de�ning treatment as having an ISP as the nearest provider provides
a proxy for intensity of treatment. However, intensity of treatment is not binary, and patient
demand may be a�ected even in areas which have a nearer NHS hospital. In column 4, we
divide relative distance into categories, and compare to areas where the nearest ISP is located
10km further than the nearest NHS hospital. In 2002/03 all areas fall into this category. Results
indicate that the e�ect in areas where an ISP is the nearest provider is to increase the number of
hip replacements by 0.63 hip replacements. However, there is an additional statistically signi�cant
e�ect for MSOAs where an ISP is less than 5 km further than the nearest NHS hospital of an
extra 0.30 hip replacements. This illustrates that the e�ect of ISPs does decline with distance but
remains statistically signi�cant in areas where an NHS hospital is only slightly nearer. Using these
coe�cients, we calculate that in 2010/11 the increase in demand generated by ISPs is equal to
1,841 hip replacements at a cost of ¿9.2 million (USD 12.0 million).
In Appendix A, we consider di�erent de�nitions of ISPs and alternative measures of treatment
16

(including absolute and relative distance). The e�ect is to change the magnitude of the estimated
β̂, but there remains a strong and statistically signi�cant positive impact of ISPs on the level of
demand in all speci�cations. We also re-estimate the speci�cation in column 3 separately for three
age groups: those under 60, those aged 60-79, and those aged 80 or over. The impact of an ISP
opening is positive and statistically signi�cant at the 1% level for all age groups34.
4.3 Robustness tests and extensions
We now present three sets of robustness tests that underpin the credibility of our identi�cation
strategy, which: (i) assess alternative de�nitions of common supply; (ii) consider the potential for
anticipatory e�ect or pre-trends; and, (iii) address the potentially endogenous placement of ISPs
using instrumental variables analysis.
4.3.1 Supply Constraints
Our identi�cation strategy outlined in Sections 3.1 and 3.2 assumes that we can identify a shift in
demand for hip replacements by controlling for common supply factors that operate at the PCT
area level (µpt). Our results could be biased if this assumption is incorrect. We test the validity
of our supply-constraints assumption in two ways. First, we consider the relationship between
ISP location and the waiting times of hip replacement patients. Waiting times are the principal
mechanism for allocating NHS-funded treatment. If supply constraints do operate at the broader
PCT area level, there should be no within PCT area di�erences in waiting times for NHS or ISP
services. Using individual level data, we �nd that, conditional on provider type, there are no within
PCT area di�erences in waiting times by relative distance to ISPs. In other words, the waiting
times experienced by ISP patients and NHS hospital patients do not depend on distance to the
nearest ISP35.
Second, we re-estimate (1) using alternative de�nitions of supply. In particular, we replace
PCT area time trends with nearest NHS hospital time trends, and then include both PCT and
nearest NHS hospital time trends. In both cases the estimated e�ect of the introduction of ISPs
remains statistically signi�cant at the 1%, and the small reduction in magnitude relative to column
3 of Table 2 is not statistically signi�cant36.
34For those aged 80 years or over, the introduction of an ISP as the closest provider increases elective hipoperations by 0.09 hip replacements per year. This amounts to 9.8% of the average number of hip replacements perMSOA in 2002/03 and 6.5% of the average number of hip replacements in 2010/11. By comparison, for the under60s, the estimated coe�cient of 0.182 additional hips amounts to 10.3% of the average in 2002/03 and 7.2% of thetotal in 2010/11.
35Unconditional on provider type, patients living nearer ISPs have a shorter average wait time. However, thisis entirely explained by the higher share of patients that are treated by ISPs in these area. Once we condition onprovider type the di�erences disappear.
36We also consider changes in the PCT boundaries over the period. In 2006, the number of PCT areas wasreduced from 303 to 152. We re-estimate the model using data from 2006 onwards and using the 2002 boundariesand �nd similar results.
17
As a �nal and related check, we tested whether growth in hip replacements between 2002/03
and 2007/08 varied by distance to the nearest NHS hospital and �nd no within PCT area variation.
During this period, almost all procedures were conducted by NHS hospitals and waiting times fell
rapidly. This indicates that in the absence of changes in hospital choice sets, patients do not
respond di�erentially to falls in waiting times by distance to the nearest hospital.
4.3.2 Pre-trends
A potential source of correlation between ISPmpt and εmpt is pent up demand for hip replacements
in areas closer to ISPs. This could be for two reasons. First, ISPs may placed in areas where
demand is increasing (shifting outwards) due to, for example, demographic pressures or di�erential
responses to the 2006 patient choice reforms. Second, patients and doctors may delay procedures
in the knowledge that an ISP will soon open.
In the �rst column of Table 3, we test for evidence of pent up demand by replacing ISPmpt with
a set of dummy variables for the year of entry, and 1,2,3,4 and 5 years post entry. The estimated
coe�cient on year of ISP entry is 0.40. This is statistically signi�cant at the 1% level, and is not
statistically di�erent from our baseline estimate in column 3 of Table 2. The estimated coe�cients
on the variables indicating one, two and three years after ISP entry are of a similar magnitude and
highly statistically signi�cant.37 This suggests that there was not an initial pool of patients that
were waiting for treatment around the time of entry. The pattern is also more consistent with an
e�ect of distance generated by the cost of travel, rather than informational frictions that would be
expected to lessen over time.
Column 2 includes additional dummies for the three years before entry. The coe�cients are
smaller than in the post period, but still signi�cant at least at the 10% level. This is explained
by our de�nition of ISPmpt, which only includes sites in our sample that conduct at least 20 hip
replacements. We make this restriction as we think that small ISPs might not be in patient choice
sets. However, this means that a site might start operating as a small ISP before it enters our
samples in a later year. Patients in those areas will receive a weaker treatment in those preceding
years, but this could still generate an increase in hip replacement patient numbers. In column
3, we remove MSOAs that were `treated' by an ISP that conducted more than 5 but fewer than
20 procedures in a year prior to year that they treated by an ISP (usually the same hospital)
that conducted at least 20 procedures38. When we make this restriction, the pre-entry dummies
are not statistically signi�cant, but there remains an e�ect-post entry. We also use the same
sample and interact a dummy for ever being treated by an ISP conducting at least 20 procedures
with dummies for 2002, 2003, 2004, 2005, the period before the expansion of ISPs, and �nd no
statistically signi�cant interactions.
37The estimates for four and �ve years after entry are of a similar magnitude, but are less precise given to smallersample sizes.
38This restriction excludes 657 MSOAs, leaving 1305 treated MSOAs.
18

4.3.3 Instrumental Variable Analysis
The results in Table 3 do not suggest that there were any anticipatory e�ects or pre-trends in
NHS-funded hip replacements prior to the introduction of ISPs. However, there remains a concern
that the location of ISPs was endogenous to the potential demand. This is particularly the case
in the �rst wave of the reform, as the aim was to use ISPs to cut long waiting times. Our �nal set
of robustness tests therefore attempts to address this endogeneity concern by instrumenting ISP
location.
4.3.3.1 The determinants of ISP placement
Table 4 shows the MSOA and nearest NHS hospital characteristics associated with having an ISP
closer than the nearest NHS hospital in 2010/11. In all speci�cations, the dependent variable is
an indicator that takes the value one if the closest provider of NHS funded hip replacements in
2010/11 was an ISP, and results are estimated using logit models. Column 1 includes measures
of waiting times at the nearest NHS hospital and MSOA level, plus the average number of NHS
hip replacements conducted in 2002/03 and 2003/04. These are factors that should in�uence
location, as the initial objectives of the ISP reforms aimed to address capacity constraints and
reduce waiting times. However, these determinants of location could also pose a threat to our
identifying assumption, as one might expect areas with high waiting times or under-provision to
experience greater growth in hip replacement volumes even in absence of the introduction of ISPs.
The results indicate that the odds of an ISP as the closest provider in 2010/11 are increasing in
the waiting times of the nearest NHS hospital in 2003, but there is no additional impact of waiting
times within an MSOA. This suggests that ISP location is determined by factors at the PCT area
or regional level, and not the characteristics of the much �ner local area. Adding nearest hospital
and local area characteristics in column 2 weakens the magnitude of the impact of nearest hospital
waiting time on ISP location, but the pattern of results remains the same.
Column 3 introduces our potential instruments: the presence of pre-existing health care facilities
that could be used to accommodate ISPs. Having a private `hospital site' nearer than the nearest
NHS hospital increases the odds of having an ISP closer by almost sixty-fold. An NHS `hospital
site'39 nearer than the nearest NHS hospital conducting hip replacements increases the odds of
having an ISP by 27%, although this e�ect is not statistically signi�cant. This is because many
ISPs are private hospitals operating in the NHS market, and are therefore located on the same sites
as pre-existing private sites. The impact of nearest hospital waiting times is reduced in magnitude,
indicating that existing health care facilities appear to be the dominant force in determining
location. This seems plausible, given that land in England is scarce, and there are substantial
constraints on where it is possible to build a hospital.
39Where a `hospital site' is de�ned as a site with at least 30 beds and the words `hospital' or `in�rmary' appearin the title
19

The criteria for a valid instrument are (i) that the instrument must be su�ciently correlated
with the potentially endogenous variable, ISP location (the relevance restriction), and (ii) that
the instrument only a�ects the outcome of interest (the volume of hip replacements) through its
e�ects on ISP location (the exclusion restriction). The existence of existing health care facilities
certainly ful�lls the �rst criteria, but is unlikely to ful�ll the second if the outcome of interest
is the volume of hip replacements in a given year, as the location of these facilities is in itself
non-random. However, the prospects are more promising if our outcome of interest is the change
in the volume over some period of time. The Competition and Markets Authority Report into
the private health care market in 2014 concluded that there are high barriers to both the entry
and expansion of private hospitals [Competition and Markets Authority , 2014]. The stocks and
locations of hospitals are therefore �xed in the medium term and determined by historical decisions
rather than current NHS policy or recent changes in patient need. We exploit this feature to make
the weaker assumption that the change in the volume of NHS funded hip replacements would
be una�ected by the presence of a private hospital close by in the absence of the ISP policy.
We therefore adopt a di�erence in di�erence style IV approach, instrumenting whether an ISP is
introduced as the nearest provider with the location of pre-existing health care facilities.
4.3.3.2 Second stage results
To estimate the e�ects of the introduction of ISPs we estimate the following speci�cation for the
change in elective hip replacements between 2002/03 and 2010/11:
(Hipmp,2010 −Hipmp,2002) = φ(ISPmp,2010 − ISPmp,2002) + (µp,2010 − µp,2002) + (εmp,2010 − εmp,2002)
= φISPmp,2010 + ϕp + εmp (2)
where our coe�cient of interest is φ, the e�ect of the change in whether the nearest provider is
an ISP40, ϕp is a PCT area �xed e�ect, and εmp is the error term, which is clustered by PCT area.
Table 5 provides the estimates from our instrumental variables model. In all cases, the depen-
dent variable is number of NHS-funded elective hip replacements conducted in 2010/11 minus the
number conducted in 2002/03. Columns 1-3 present our baseline OLS estimates, and indicate a
rise of 0.73 hips per MSOA just controlling for PCT area �xed e�ects and 0.70 when changes in
time varying controls are added to improve precision. These are larger than the estimates in Table
2 as these coe�cients were an average over earlier years, when new ISPs treated fewer patients.
Column 4 presents a similar speci�cation to column 2, but uses IV estimation. As motivated
above, we use two instruments for the introduction of an ISP closer than the nearest NHS hospital
by 2010/11: (i) the presence of an existing private hospital site and (ii) the presence of an existing
40This is necessarily equivalent to whether an ISP was the closest provider in 2010, as ISPmp,2002 is always equalto zero.
20

NHS `hospital site' that was previously unused for hip replacements. We create two indicators,
which take the value of one if the respective site is closer than an NHS hospital in 2010/11, and zero
otherwise. The estimated coe�cient of 0.69 is slightly smaller than in column 2 but the di�erence
is not statistically signi�cant. Controlling for time varying MSOA characteristics in column 5
makes little di�erence to our estimates. Taking the IV estimate in column 4 would imply that
ISPs generated an additional 1,215 hip replacements in 2010/11 at a cost of ¿6.0 million (USD 7.8
million). Further estimates using matching techniques provide similar results.
The validity of the results in Table 5 rest on the assumption that the change in NHS-funded
hip replacements would have been una�ected by the relative distance to a private hospital in the
absence of the ISP policy. Of particular concern is the potential bias introduced by the coincidence
of the start of the great recession and the expansion of ISPs. If potential patients responded to the
recession by substituting from privately-funded procedures, then our results may be biased, and
the expansion of ISPs be the result of an increase in demand for NHS-funded procedures, rather
than the cause. We examine whether our exclusion restriction is violated in a number of ways.
First, we test whether there is a di�erence in the growth of hip replacements by (relative) distance
to the nearest private hospital, when the private hospital does not become an ISP by 2010/11.
Results show no statistically signi�cant di�erence in growth rates, suggesting that having a private
hospital nearby is not in itself associated with di�erential trends in hip replacement use.
Second, we address the concern that the entry of private hospitals into the ISP market was non-
random with respect to potential demand for NHS-funded hip replacements. By 2010/11, 4 of the
5 largest hospital chains had entered the ISP market, but not every hospital within each hospital
chain became an ISP and began to treat NHS patients. To address this potentially endogenous
entry decision, we restrict our sample of ISPs to just one hospital chain, Ramsay Health Care,
which acquired the Capio hospital chain in 2007 and made the decision that all hospitals should
enter the ISP market [Competition and Markets Authority , 2014]41. Re-estimating �xed e�ects
and IV models with this Ramsay ISP sample, the estimates remain statistically signi�cant and are
similar to those in Tables 2 and 5. Finally, when we restrict the sample to the period up to and
including 2007, before the recession took hold, the impacts of ISP placements remain statistically
signi�cant.
These robustness tests do not suggest that substitution from the privately funded to NHS
funded sectors pre-empted the introduction of ISPs. Indeed, aggregate data suggest very little
change in the annual number of privately funded procedures (around 10,000) that would com-
pensate for the 12,000 hip replacements conducted by ISPs in 2010/11, or even the 810 that we
estimate as coming from a shift in demand. However, given the importance of potential substitu-
tion from the privately funded to NHS funded sections for both the validity and interpretation of
41As a consequence, Ramsay Healthcare accounted for 27.6% of all NHS-funded elective surgery admissions toISPs in 2011/12 [Laing & Buisson, 2013]. For the other 3 hospital chains, almost all hospitals (>90%) had enteredby 2012/13 (authors' calculations using the National Joint Registry). The main di�erence between Ramsay andthe other hospital chains is therefore in the timing of entry rather than whether the hospitals entered at all.
21
our results, we provide a formal analysis of substitution between sectors in Section 5.
5 Private Pay Substitution
As noted in Section 2.2, increase in hip replacements generated by the shift in demand following
the introduction of ISPs may represent either additional procedures or substitution from privately
funded to NHS funded procedures. The private pay sector plays a relatively important role in this
particular market, comprising 20% of procedures at the beginning of the period. This is one of the
reasons why private capacity was �rst used in the orthopedic sector.
Understanding the relationship between demand in the privately funded and NHS funded sector
is important for validity and the interpretation of our results. As noted in Section 4.3.3, our results
will be biased if an event, such as the recession, caused patients living near private hospitals to
switch to NHS-funded procedures for reasons other than the introduction of ISPs. Even if there
is no such bias, the extent of substitution matters for how we interpret what our results mean
for welfare and competition. In terms of welfare, any substitution from the private-pay sector
represents a transfer to patients who would otherwise have paid for the procedure. In terms
of competition, substantial substitution would imply that for these patients NHS hospitals were
unlikely to compete with ISPs. Additional funding for the procedures would necessarily �ow to
ISPs.
5.1 Estimating Substitution
Information on privately funded health care in England is limited. Existing work on the private
health care sector in England has focused almost entirely on the purchase of health insurance,
due to data limitations [Propper , 2000; Propper et al., 2001; Besley et al., 1999]42. However, for
elective hip replacements, we can make use of individual level data from the clinical audit of joint
replacements in the UK, the National Joint Registry (NJR). The NJR was established in England
and Wales in 2002 and requires that all providers of joint replacements submit details of each
operation. The objective is to monitor performance of di�erent implant and types of surgery, and
to improve clinical standards. The principal advantage is that these data contain records of all hip
replacements, irrespective of the provider type and how the procedure is funded. The disadvantages
are two-fold. First, there is less information on the patient, and in particular where the patient
lives. Whereas the analysis using HES in Section 4 uses the 6,781 MSOAs provided, the NJR only
records the patient's postal district. These postal districts are larger, with 1,993 across England,
and so contains more measurement error in distances between hospitals and patients. Second, the
data quality prior to 2008/09 is poor, with missing procedures and missing information on how
42It should be noted that this literature typically dates back to the 1990s and early 2000s, before a large increasein funding to the NHS and strict waiting time targets [Propper et al., 2010] that brought down waiting times.
22

procedures are funded. This means we are unable to observe the pre-reform period.
To estimate the impact of ISPs on the market for hip replacements we collapse the number
of NHS-funded (conducted at NHS hospitals and ISPs ) and privately-funded (private hospitals
and NHS private patient units) hip replacements to the postal district level for each year between
2008/09 and 2012/13. To check that these data produce similar volumes to those in HES, we
collapse HES to the postal district level and compare the number of NHS-funded hip replacements
across data sources. The �gures are presented in Table 6. From 2009/10 onwards, the average
number of NHS-funded hip replacements is almost identical across data sources. The number of
privately funded procedures remain stable at around 5 procedures per postal district throughout
the period, indicating that the recession had a limited e�ect on demand.
The �ve year NJR panel is geocoded to include indicators for whether the provider nearest to
the centroid of the postal district is an ISP or NHS trust in each year and augmented with PCT
area indicators. We then re-estimate an adapted version of (1) at the postal district level. Results
are presented in Table 7. Estimates presented in column 1 indicate that the entry of an ISP led
to one additional hip replacement, statistically signi�cant at the 10% level. The magnitude seems
plausible, given that our MSOA estimates in Table 2 are just under 0.5, and postal districts are 3
times as big. In column 2, we consider the impact on privately funded procedures. Here the e�ect
is small, positive and not statistically signi�cant, suggesting very limited substitution. Column
3 estimates the impact on the sum of NHS and privately funded hip replacements and �nds a
positive e�ect of 1.2 hip replacements, statistically signi�cant at the 5% level.
The �nal three columns present the same set of results, but raise the threshold for inclusion
of providers to 50 hip replacements. This aims to compensate for the loss of precision, generated
by the larger geographic units. Here we �nd that there are e�ects on both the number of NHS-
funded and total hip replacements that is statistically signi�cant at the 5% level. Again, the
coe�cient of interest is small and not statistically signi�cant for the number of privately funded
hip replacements. Taken together, the estimates in Table 7 provide support to the results in
Section 4, by producing a similar set of results with di�erent geographic units and a di�erent
data source. The absence of an e�ect on privately funded hip replacements helps maintain the
assumptions underlying our IV analysis, and implies that the additional hip replacements represent
new procedures rather than a substitution from the private pay sector.
These results are consistent with �ndings from an investigation of the private healthcare market
by the UK Competitions and Markets Authority [Competition and Markets Authority , 2014]. Based
on surveys of patients and hospitals, the report concluded that the markets for NHS and privately
funded health care were separate. The report also states that the private sector had a large amount
of spare capacity and ability to switch production capacity easily between treatment types43. This
43It should be noted that hip replacements may not be representative of other surgical procedures. Hip replace-ment patients are typically retired and are therefore more likely to pay out of pocket and less likely to be covered byemployer based private medical insurance. The recession therefore had a smaller impact on their insurance coverage
23
explains why it was possible for private hospitals operating as ISPs to increase the number of
NHS-funded hip replacements they delivered, while private pay patients remained unchanged and
the ability to expand hospitals is limited.
The absence of substitution implies that increases in procedures generated by the impact of
ISPs on demand, estimated in Section 4, represent new procedures that would not have taken
place in the absence of the reforms within the given year. These additional hip replacements have
two sources: (i) hip replacements that would otherwise have taken place at a later date or (ii) hip
replacements that would never otherwise have taken place, because patients die or become too frail
before they have a procedure44. It is important to note that these are exactly the same sources
that explain the much larger total increase in the number of hip replacements over the period. The
only di�erence, as highlighted in Section 2.2, is that the additional procedures arising through the
demand channel do not provide indirect bene�ts to NHS hospital patients through lower waiting
times, and do not place competitive pressure in the NHS. The principal bene�ciaries of the policy
are those who receive an additional hip replacement, which comes at a cost to the taxpayer funded
NHS.
6 The Impact on NHS hospitals
The main objective of this paper is to understand whether the introduction of ISPs led to a shift in
demand for hip replacements, rather than to consider the e�ects of ISPs upon NHS hospitals. As
Section 2.2 makes clear, shifts in demand for NHS-funded procedures can have important welfare
and public �nance implications, while leaving the market for NHS hospitals untouched. However,
the impact on NHS hospitals remains important, �rst because the reforms aimed to use ISPs to
improve waiting times and quality at NHS hospitals, and second, because the impacts on NHS
hospitals will provide a context within which to understand the implications of the demand shift
that we estimate.
6.1 Hospital Outcomes
Existing work on the impact of ISPs on NHS hospitals has focused on the �rst wave of ISPs. Cooper
et al. [2015], for example, consider the e�ects of the �rst wave of ISPs on local NHS hospital waiting
and on their already annuitized wealth.44The age distribution of additional patients treated by ISPs suggests that at least some patients would have
died without having a procedure. When the baseline speci�cation (column 3 or Table 2) is re-estimated for thoseover 80 the coe�cient is equal to 0.09 hip replacements. Combining this with the number of treated areas (1,761)gives an estimated increase in hip replacements of 158 per year. The estimated one-year mortality rate for an 80year old in England is 4% for women and 5.5% for men (rising to 7.5% and 10.3%) by age 85 [O�ce for National
Statistics, 2015]. Those over 80 who have a hip replacement might not be representative of the population over 80as a whole. However, if we take mortality rates at the bottom of the age band and apply to the increase of 158,this would mean that 6-9 of the additional hip replacement patients treated in each year would not have survivedto the next year.
24

times, case-load and clinical quality. They �nd that waiting times fell but caseloads remained
unchanged, as is consistent with Figure 4, and hospital e�ciency improved, as measured by pre-
operative length of stay. They also �nd that case-mix in NHS hospitals became more costly.
However, as noted in Section 2.1, this is in part a mechanical consequence of NHS regulations,
which speci�ed that ISPs could not treat more complex patients.
To consider the impact of both waves of ISPs on NHS hospitals and their patients, we collapse
hip replacement numbers, mean waiting times, and mean pre-operative length of stay to the NHS
hospital year level45. The 9-year hospital panel contains the 133 NHS hospitals that treat more
than 20 patients in all years46. The potential exposure of hospitals to ISPs is proxied by assigning
each MSOA to their nearest NHS hospital, and calculating the share of those MSOAs in their
catchment area that have a closer ISP than the NHS hospital. In 2002/03 the average share was
zero, as no ISPs had opened. By 2010/11, the mean share of MSOAs within an NHS catchment
area was 19.8% (median 13.7%).
Estimates presented in Table 8 consider the e�ect of changes in exposure to ISPs on the change
in our three outcomes between 2002/03 and 2010/1147. The �rst set of speci�cations are estimated
using OLS. The second set of speci�cations addresses the potentially endogenous placement of
ISPs, by instrumenting the change in our exposure measure with the percentage of MSOAs within
each hospital's catchment area that had a closer private hospital site in 2002/03 (see Section 4.3.3).
Results for waiting time and volumes are consistent with both Figure 4 and the results from Cooper
et al. [2015]. The growth of ISPs has no statistically signi�cant impact on hip replacement volumes
in NHS hospitals, either in OLS or IV, with the coe�cients presented in columns 1 and 2 both
imprecisely determined and close to zero48. This suggests that NHS hospitals are operating in the
vertical portion of their supply curve. By contrast, there is negative and statistically signi�cant
e�ect of ISPs on waiting times in both the OLS and IV estimation. The OLS estimate in column
2 indicates that moving from a zero share to the mean share of 0.2 reduced waiting times by 12
days. The IV estimates are larger, with moving to a mean share reducing waiting times by 34
days. This compares to an average reduction in waiting times of 150 days over the 8 year period
we consider49. Finally, in contrast to Cooper et al. [2015], we �nd no e�ect of ISP exposure on
pre-operative length of stay50.
45Waiting times are de�ned as the di�erence between the date of the decision to admit the patient for theprocedure by the outpatient consultant and the patient being admitted to hospital for the procedure. It does notinclude the wait for an outpatient appointment.
46This compares to 159 hospitals that conducted hip replacements over the period. Most of those excluded hadmerged over the period we consider. All ISP patients are excluded from the analysis.
47As there were no ISPs in 2002/03, the change in ISP exposure between 2002/03 and 2010/11 is equal to thelevel of exposure in 2010/11.
48The estimated coe�cients of a change of 2 hip replacements per hospital in column 1 and 4 hip replacementsin column 2 compare to an average increase over the period of 83 hips replacements per hospital.
49This pattern of results remains unchanged if we consider the period 2006/07 to 2010/11, when we reduce theprocedure threshold for ISPs to 5 procedures, and for both �rst and second wave ISPs.
50This contrast could potentially be explained by three factors. First, we examine a longer time period. Second,
25
6.2 Implications for the public �nances and hospital competition
Results in Table 8 indicate that the main e�ect of ISPs on NHS hospitals and their patients was to
reduce waiting time. The absence of a change in the quantity of procedures indicates that hospitals
are operating on the vertical portion of their supply curve, so that inwards shifts in the demand
for their services did not lead to a reduction in volumes and therefore revenues. This has at least
two important implications.
First, any short run changes in volumes of elective health care are likely to have a permanent
impact on the public �nances, which must be weighed against improvements in patient welfare.
The theoretical predictions in Section 2.2 and the empirical results show that ISPs volumes can
increase volumes through both lifting capacity constraints (or an increase in supply) and a shift in
demand. Fordham et al. [2012] �nd that elective hip replacement patients receive an additional 0.8
Quality Adjust Life Years (QALY) over the subsequent 5 years. Given that the costs of an NHS
funded hip replacement are around ¿5,000, this implies a cost per QALY of just over ¿7,000. Where
these additional patients would otherwise have died without the procedure, this is expenditure that
cannot be recouped. Where procedures would otherwise have taken place at an NHS hospital at
a later date, bringing treatment forward to this year from next year will reduce the demand for
an elective hip replacement the following year for that patient, but there will remain a queue of
patients ready to have treatment in their place. In other words, bringing forward procedures will
not lead to a compensating fall in volumes in subsequent years driven by reduced demand.
Second, for patient choice to increase competition for NHS hospitals and drive improvements in
quality, policy design must consider both the supply and demand for NHS care. The ISP reforms,
which expanded patient choice sets, were introduced during a period where NHS funding was
increasing rapidly. This enabled NHS hospitals to maintain their volumes, while the market share
of ISPs rose to 20%. The impact upon NHS hospital revenues and therefore pressures to improve
e�ciency were therefore muted. The current supply context is very di�erent with the NHS facing
much stricter funding constraints. It is therefore likely that the impact of the ISP reforms would
have had a di�erent impact on overall volumes and NHS hospitals if introduced a decade later.
7 Discussion
This paper has examined whether and how reforms that allowed private providers access to the
market for NHS funded elective care a�ected demand for elective hip replacements. We provide
three main results. First, we �nd evidence that the introduction of ISPs led to a rise in hip
replacement volumes generated by a shift in demand, in addition to increases driven by the shift
we analyse the impact of a wider set of providers. In contrast, Cooper et al. [2015] focus only on the introductionof wave 1 providers (or Independent Sector Treatment Centres). Finally, the de�nition of geographical `treatment'by an ISP di�ers across the two papers.
26
in supply. In particular, our results suggest that when an ISP is introduced closer than the nearest
NHS hospital, NHS-funded hip replacement numbers increase by 0.5 procedures per MSOA per
year. This is equal to around 9% of the average number of 5.8 hip replacements per MSOA
in pre-reform 2002/03 and a �fth of the average rise of 2.6 hip replacements between 2002/03
and 2010/11. Second, there is no evidence that the additional hip replacements generated by
the demand shift re�ect substitutions from the private pay sector. These hip replacements are
instead procedures that would not have been carried out in the given year in the absence of the
ISP program. Third, the ISP program reduced waiting times at NHS hospitals but had no e�ect
on volumes and therefore revenue. This suggests that the relatively loose funding constraints in
the 2000s allowed ISPs to expand, while placing limited competitive pressure on NHS hospitals.
Together our results have the following implications.
First, and most broadly, our results show that increasing choice for consumers of public services
when there is an outside option can a�ect the level of demand. This is important as additional
service use generates increased consumer welfare but also higher �scal costs. Moreover, shifts in
demand following private sector entry do not stimulate the competitive pressure envisaged by the
reforms. In the hospital sector, our results suggest the impacts on patient demand should be taken
into account considering whether services should be centralized in particular hospitals, or when
hospitals merge. For community health, our �ndings may have implications for the provision of
services such as vaccination clinics or community pediatric care. Outside healthcare, we would
expect very similar mechanisms to operate in the market for junior college in the US or Further
Education colleges in the UK [Currie and Moretti , 2003; Manski and Wise, 1983; Montgomery ,
2002]. What we cannot answer using our identi�cation strategy is whether the type of provide
matters. We identify shifts in demand that follow the new availability of private hospitals, but
we cannot assess whether the same shifts would have been observed if public hospitals had been
opened in the same locations in their place.
Second, we �nd no evidence that the increased demand for hip replacements represents substi-
tutions from the private pay sector. Our results therefore support the �ndings from the recent UK
Competition and Markets Authority that the NHS and private pay markets are separate [Com-
petition and Markets Authority , 2014]. The additional procedures were new, at least in the given
�nancial year. In terms of welfare, this implies that the ISP program did not result in transfers to
consumers who would otherwise have paid. This �nding also suggests that the sectors exert only
limited competitive pressure on one another.
Finally, our results have important implications for understanding how the ISP reforms a�ected
NHS hospitals and the wider NHS. In particular they highlight the importance of understanding
both supply and demand within the NHS. We �nd that the introduction of ISPs did reduce waiting
times at NHS hospitals, in line with the initial objective of the reforms, but volumes and hospital
revenues were unchanged. This highlights that under a system where healthcare is rationed through
waiting times, there is always likely to be a queue for elective conditions. Increasing supply for
27

procedures will increase volumes this year, but even if these procedures are simply brought forward,
volumes next year will not fall. Patients who were treated or were treated earlier as a result of
the ISP program experienced an increase in welfare, but this also generated a permanent increase
in costs for the public �nances. In terms of competition, the pressure felt by NHS hospitals will
depend upon the funding constraints that control supply. During the period ISPs were introduced,
there was su�cient funding to enable NHS hospitals to maintain their volumes while ISPs expanded
to 20% of the hip replacement market. This muted the competitive pressure felt by NHS hospitals,
and therefore the likely impact on quality and e�ciency. It is likely that both the change in overall
volumes and the impact on NHS hospitals would have been very di�erent had the expansion in
ISPs occurred after NHS budgets tightened after 2010.
28

References
Angrist, J. D., P. A. Pathak, and C. R. Walters, Explaining charter school e�ectiveness, American
Economic Journal: Applied Economics, 5 (4), 1�27, 2013.
Arcidiacono, P., A�rmative action in higher education: How do admission and �nancial aid rules
a�ect future earnings?, Econometrica, 73 (5), 1477�1524, doi:10.1111/j.1468-0262.2005.00627.x,
2005.
Arora, S., A. Charlesworth, E. Kelly, and G. Stoye, Public Pay and Private Provision{:} The
changing landscape of healthcare in the 2000s, Nu�eld Trust and Institute for Fiscal Studies
Research Report, 2013.
Audit Commission, Is the treatment working? progress with the nhs system reform programme,
Audit Commission, London, 2008.
Auster, R. D., and R. L. Oaxaca, Identi�cation of supplier induced demand in the health care
sector, Journal of Human Resources, 16 (3), 327�342, 1981.
Bardsley, M., and J. Dixon, Quality of care in independent sector treatment centres, British Medical
Journal 343, 2011.
Barro, J., and D. M. Cutler, Mergers and Productivity, chap. Consolidation in the Medical Care
Market Place : A Case Study from Massachusetts, pp. 9�50, University of Chicago Press, 2000.
Beckert, W., M. Christensen, and K. Collyer, Choice of NHS-Funding Hospital Services in England,
Economic Journal, 122 (560), 400�417, 2012.
Besley, T., and M. Ghatak, Incentives, choice, and accountability in the provision of public services,
Oxford Review of Economic Policy, 19 (2), 235�249, doi:10.1093/oxrep/19.2.235, 2003.
Besley, T., J. Hall, and I. Preston, The demand for private health insurance: do waiting
lists matter?, Journal of Public Economics, 72 (2), 155 � 181, doi:http://dx.doi.org/10.1016/
S0047-2727(98)00108-X, 1999.
Brekke, K. R., L. Siciliani, and O. R. Straume, Competition and waiting in hospital markets,
Journal of Public Economics, 97 (7), 1607�1628, 2008.
Burgess, S., E. Greaves, A. Vignoles, and D. Wilson, What parents want: School preferences and
school choice, The Economic Journal, 125 (587), 1262�1289, doi:10.1111/ecoj.12153, 2015.
Capps, C., D. Dranove, and M. Satterthwaite, Competition and market power in option demand
markets, The RAND Journal of Economics, 34 (4), 737�763, 2003.
29

Chandra, A., D. Cutler, and Z. Song, Who Ordered That? The Economics of Treatment Choices
in Medical Care, Handbook of Health Economics, vol. 2, chap. 6, pp. 397 � 432, Elsevier, doi:
http://dx.doi.org/10.1016/B978-0-444-53592-4.00006-2, 2011.
Chard, J., M. Kuczawski, N. Black, and J. van der Meulen, Outcomes of elective surgery undertaken
in indepdnent sector treatment centres adn nhs providers in england: audit of patient outcomes
in surgery, British Medical Journal 343, 2011.
Competition and Markets Authority, Private health care market investigation: Final report, Com-
petition and Markets Authority case report, HMSO, 2014.
Cooper, Z., S. Gibbons, S. Jones, and A. McGuire, Does Hospital Competition Save Lives? Evi-
dence From The English NHS Patient Choice Reforms, Economic Journal, 121 (554), F228�F260,
2011.
Cooper, Z., S. Gibbons, and M. Skellern, Does competition from private surgical centres improve
public hospital' performance? evidence from the english national health service, Mimeo, London
School of Economics, 2015.
Currie, J., and E. Moretti, Mother's education and the intergenerational transmission of human
capital: evidence from college openings, The Quarterly Journal of Economics, 118 (4), 1495�
1532, 2003.
Department of Health, Nhs payment by results 2010-11 national tari� information, Department of
Health, 2010.
Finkelstein, A., M. Gentzkow, and H. Williams, The sources of geographical variation in healthcare:
Evidence from patient migration, forthcoming in Quarterly Journal of Economics, 2016.
Fisher, E. S., D. E. Wennberg, T. A. Stukel, D. J. Gottlieb, F. L. Lucas, and t. L. Pinder,
The implications of regional variations in medicare spending. part 1: The content, quality, and
accessibility of care, Annals of Internal Medicine, 138 (4), 273�287, 2003a.
Fisher, E. S., D. E. Wennberg, T. A. Stukel, D. J. Gottlieb, F. L. Lucas, and t. L. Pin-
der, The implications of regional variations in medicare spending. part 2: Health out-
comes and satisfaction with care, Annals of Internal Medicine, 138 (4), 288�298, doi:10.7326/
0003-4819-138-4-200302180-00007, 2003b.
Fordham, R., J. Skinner, X. Wang, and J. Nolan, The economic bene�t of hip replacement: a
5-year follow-up of costs and outcomes in the exeter primary outcomes study, BMJ Open, doi:
10.1136/bmjopen-2011-000752, 2012.
30

Fuchs, V. R., The supply of surgeons and the demand for operations., The Journal of Human
Resources, 13 Suppl, 35�56, doi:10.2307/145247, 1978.
Gaynor, M., What Do We Know About Competition and Quality in Health Care Markets?, Foun-
dations and Trends in Microeconomics, 2 (6), 441�508, 2006.
Gaynor, M., Health care industry consolidation, Statement before the Committee on Ways and
Means Health Subcommittee U.S. House of Representatives, 2011.
Gaynor, M., and R. Town, Competition in health care markets, in Handbook of Health Economics,
vol. 2, chap. Competition in health care markets, Elsevier, 2012.
Gaynor, M., C. Propper, and S. Seiler, Free to choose? reform and demand response in the english
national health service., Forthcoming in American Economic Review, 2016.
Glied, S., Handbook of Health Economics, vol. 1, chap. Managed Care, pp. 707�753, Elsevier, 2000.
Gruber, J., and M. Owings, Physician Financial Incentives and Cesarian Section Delivery, RAND
Journal of Economics, 27 (1), 99�123, 1996.
Hawker, G. A., J. G. Wright, P. C. Coyte, J. I. Williams, B. Harvey, R. Glazier, A. Wilkins, and
E. M. Badley, Determining the need for hip and knee arthroplasty: The role of clinical severity
and patients' preferences, Medical Care, 39 (3), 206�216, 2001.
Ho, K., The welfare e�ects of restricted hospital choice in the us medical care market, Journal of
Applied Econometrics, 21, 1039�1079, 2006.
Hoxby, C. M., School Choice and School Productivity. Could School Choice Be a Tide that Lifts
All Boats?, in The Economics of School Choice, NBER Chapters, pp. 287�342, National Bureau
of Economic Research, Inc, 2003.
Hsieh, C.-T., and M. Urquiola, The e�ects of generalized school choice on achievement and strat-
i�cation: Evidence from chile's voucher program, Journal of Public Economics, 90 (8-9), 1477�
1503, doi:http://dx.doi.org/10.1016/j.jpubeco.2005.11.002, 2006.
Imberman, S. A., The e�ect of charter schools on achievement and behavior of public school
students, Journal of Public Economics, 95 (7?8), 850 � 863, doi:http://dx.doi.org/10.1016/j.
jpubeco.2011.02.003, 2011.
Keane, M. P., and K. I. Wolpin, The e�ect of parental transfers and borrowing constraints on
educational attainment, International Economic Review, 42 (4), 1051�1103, 2001.
Kelly, E., and G. Tetlow, Choosing the place of care: The e�ect of patient choice on treatment
lcoation in England, 2003-11, Nu�eld Trust and Institute for Fiscal Studies Research Report,
2012.
31

Kessler, D. P., and M. B. McClellan, Is hospital competition socially wasteful?, Quarterly Journal
of Economics, 115 (2), 577�615, 2000.
Ladd, H. F., School vouchers: A critical view, Journal of Economic Perspectives, 16 (4), 3�24,
doi:10.1257/089533002320950957, 2002.
Laing & Buisson, Private acute medical care, Laing and Buisson Market Report, 2013.
Lunt, N., R. Smith, M. Exworthy, S. T. Green, D. Horsfall, and R. Mannion, Medical Tourism:
Treatments, Markets and Health System Medical Tourism: Treatments, Markets and Health
System Implications: A scoping, OECD Commissioned Report, 2011.
Manski, C., and D. Wise, College Choice in America, Harvard University Press, 1983.
Montgomery, M., A nested logit model of the choice of a graduate business school, Economics of
Education Review, 21 (5), 471�480, 2002.
Musset, P., et al., School choice and equity: current policies in oecd countries and a literature
review, Tech. rep., OECD Publishing, 2012.
Naylor, C., and S. Gregory, Brie�ng: independent sector treatment centres, Kings Fund
http://www.kingsfund.org.uk/publications/brie�ng-independent-sector-treatment-centres,
2009.
Neal, D., How vouchers could change the market for education, The Journal of Economic Perspec-
tives, 16 (4), 25�44, 2002.
Nechyba, T. J., Mobility, targeting, and private-school vouchers, The American Economic Review,
90 (1), 130�146, 2000.
O�ce for National Statistics, Life tables: england, http://www.ons.gov.uk/peoplepopulationandcommunity/birthsdeathsandmarriages/lifeexpectancies/datasets/nationallifetablesenglandreferencetables,
2015.
Propper, C., The demand for private health care in the {UK}, Journal of Health Economics, 19 (6),
855 � 876, doi:http://dx.doi.org/10.1016/S0167-6296(00)00045-X, 2000.
Propper, C., H. Rees, and K. Green, The demand for private medical insurance in the uk: A cohort
analysis, The Economic Journal, 111 (471), 180�200, doi:10.1111/1468-0297.00627, 2001.
Propper, C., M. Sutton, C. Whitnall, and F. Windmeijer, Incentives and Targets in Hospital Care:
Evidence from a natural experiment, Journal of Public Economics, 94, 318�335, 2010.
Skinner, J., Causes and Consequences of Regional Variations in Health Care, Handbook of Health
Economics, vol. 2, chap. 2, pp. 45�93, Elsevier, 2011.
32

Varkevisser, M., S. van der Geest, and F. Schut, Assessing hospital competition when prices don't
matter to patients: the use of time-elasticities, International Journal of Health Care Finance
and Economics, 10, 43�60, 2010.
Vrangbaek, K., R. Robertson, U. Winblad, H. Van de Bovenkamp, and A. Dixon, Choice policies
in northern european health systems, Health Economics, Policy and Law, 7, 47�71, doi:10.1017/
S1744133111000302, 2012.
Wennberg, J. E., Time to tackle unwarranted variations in practice, BMJ, 342, doi:10.1136/bmj.
d1513, 2011.
33
A Alternative de�nitions of ISPs and Treatment
The �rst three columns of A.1 consider alternative de�nitions of ISPs. In the �rst column, we
reduce the thresholds for ISPs included in our sample to �ve procedures. The e�ect is cut our
coe�cient of interest in half. This is unsurprising, because smaller ISPs o�ering very few procedures
are not necessarily available to all patients. Lowering the threshold from 20 to 5 procedures
increases the number of ISP sites by 22%, but these sites only treated 2.7% of all ISP patients.
Columns 2 and 3 divide ISPs into Treatment Centres and Private Hospitals. Treatment Centres
(or Independent Sector Treatment Centres) were established solely to treat NHS patients in the
�rst wave of the reform. The e�ect of introducing a Treatment Centre is somewhat larger than
our baseline estimates, at 0.67 hip replacement. �Private Hospitals�, in column 3, which started
operating as ISPs in the second wave of the reform were existing private hospitals that treated
NHS and privately funded patients alongside one another. The estimate e�ect is very similar to
the baseline result, in large part because most ISPs were private hospitals rather than ISTCs.
The �nal two columns rede�ne treatment as a continuous measure of distance rather than a
binary indicator for relative distance. In column 4, we consider the distance from the MSOA
centroid to the nearest ISP relative to the nearest NHS hospital; in column 5 we use the absolute
distance to the nearest ISP. In both speci�cations, an additional km reduces the total number of
hip replacements by 0.02.
Taken together these results indicate that altering the de�nition of either ISPs or MSOA treat-
ment does e�ect the magnitude of our estimates. However, the main conclusion that the introduc-
tion of ISPs increases demand for elective hip replacements remains unchanged.
34
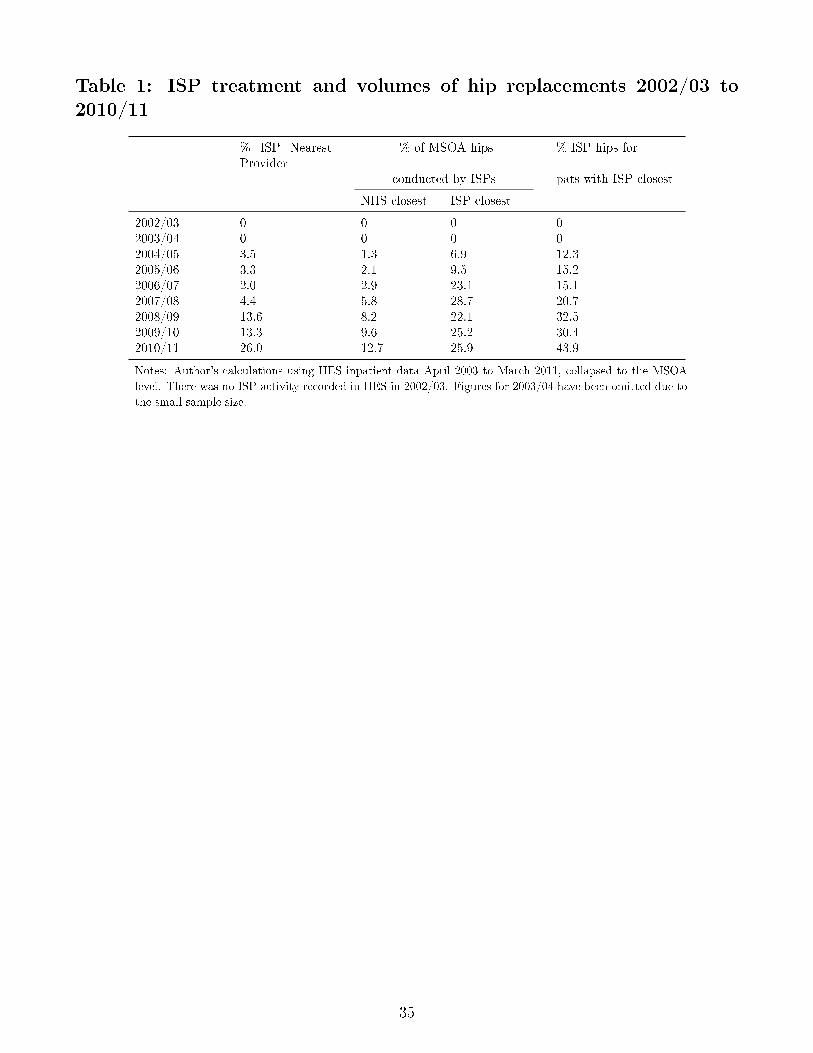
Table 1: ISP treatment and volumes of hip replacements 2002/03 to2010/11
% ISP NearestProvider
% of MSOA hips % ISP hips for
conducted by ISPs pats with ISP closest
NHS closest ISP closest
2002/03 0 0 0 02003/04 0 0 0 02004/05 3.5 1.3 6.9 12.32005/06 3.3 2.1 9.5 15.22006/07 2.0 2.9 23.1 15.12007/08 4.4 5.8 28.7 20.72008/09 13.6 8.2 22.1 32.52009/10 13.3 9.6 25.2 30.42010/11 26.0 12.7 25.9 43.9
Notes: Author's calculations using HES inpatient data April 2003 to March 2011, collapsed to the MSOA
level. There was no ISP activity recorded in HES in 2002/03. Figures for 2003/04 have been omitted due to
the small sample size.
35

Table 2: Fixed e�ects estimates of the e�ect on ISPs on standardizedelective hip replacements per MSOA
(1) (2) (3) (4)MSOA FE PCT TT +controls Rel Distance
ISP locationISP closest provider 0.868*** 0.462*** 0.457***
(0.158) (0.114) (0.113)
ISP distance relative to nearest NHShospital5-10km further -0.0215
(0.0953)0-5km further 0.304**
(0.136)ISP closer 0.626***
(0.168)MSOA characeristicsFNOF admits 0.0131* 0.0130*
(0.00690) (0.00690)Acute coronary syndrome admits 0.00475 0.00471
(0.00459) (0.00459)House sales 0.000803* 0.000797*
(0.000468) (0.000466)Median house price (¿000s) 0.00155* 0.00158**
(0.000798) (0.000797)Nearest NHS Hosp characteristics28 day emergency readmission rate (%) -0.0172 -0.0206
(0.0370) (0.0382)Standardised AMI mortality rate (%) 0.218 0.147
(1.120) (1.086)
MSOA Fixed E�ects Yes Yes Yes YesYear Fixed E�ects Yes Yes Yes YesPCT area x Year Fixed E�ects No Yes Yes Yes
Observations 61,029 61,029 61,029 61,029R-squared 0.093 0.193 0.194 0.194Number of MSOA 6,781 6,781 6,781 6,781
Notes: *** denotes signi�cance at 1%, ** at 5%, and * at 10% level. Observations are at the MSOA year level,
and the sample includes all 6,781 MSOAs in England. The dependent variable in all columns is the number of
admissions for an NHS-funded elective hip replacement amoungst MSOA residents, age/sex standardized to the
English population in 2002. Relative distances to the nearest ISP and NHS Acute hospital are measured in straight
lines from the centroid of the MSOA to the provider post (zip) code. Standard errors are robust to the presence
of heteroskedasticity and clustered at the Primary Care Trust (PCT) area level.
36

Table 3: Robustness: Trends Pre and Post ISP Entry
(1) (2) (3)ISP20 post years ISP20 including pre Excluding ISP 5
Years before and after ISP entryYear of entry 0.395*** 0.568*** 0.523***
(0.127) (0.165) (0.147)One year after entry 0.382*** 0.577*** 0.477**
(0.140) (0.165) (0.190)Two years after entry 0.475*** 0.683*** 0.483**
(0.167) (0.202) (0.196)Three years after entry 0.482** 0.725*** 0.601**
(0.225) (0.249) (0.245)Four years after entry 0.491 0.742** 0.598*
(0.351) (0.360) (0.328)Five years after entry 0.543 0.797** 0.696**
(0.355) (0.369) (0.341)
Year before entry 0.241* 0.103(0.143) (0.147)
Two years before 0.388*** 0.252*(0.121) (0.148)
Three years before 0.184* 0.170(0.104) (0.118)
MSOA Fixed E�ects Yes Yes YesYear Fixed E�ects Yes Yes YesPCT area x Year Time Trend Yes Yes Yes
Observations 61,029 61,029 51,156R-squared 0.194 0.194 0.189Number of MSOA 6,781 6,781 5,684
Notes: *** denotes signi�cance at 1%, ** at 5%, and * at 10% level. Observations are at the MSOA year level, and the
sample includes all 6,781 MSOAs in England. The dependent variable in all columns is the number of admissions for
an NHS-funded elective hip replacement amoungst MSOA residents, age/sex standardized to the English population in
2002. Distances are measured in straight lines from the centroid of the MSOA to the provider post (zip) code. The year
of entry is the �rst year that MSOA had an ISP as the closest provider conducting at least 20 elective hip replacements
within a �nancial year. In column 3, we exclude those MSOAs that had an ISP conducting more than 5 but less than
20 hip replacement procedures in any year before entry. Standard errors are robust to the presence of heteroskedasticity
and clustered at the PCT level.
37
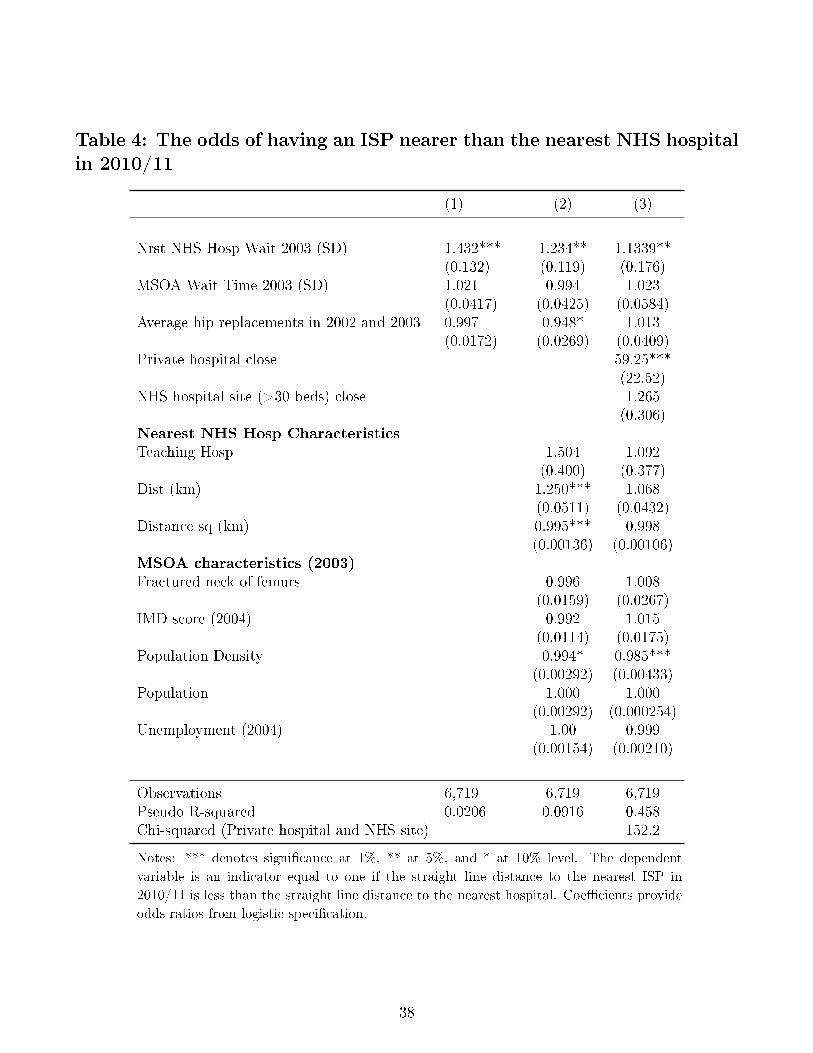
Table 4: The odds of having an ISP nearer than the nearest NHS hospitalin 2010/11
(1) (2) (3)
Nrst NHS Hosp Wait 2003 (SD) 1.432*** 1.234** 1.1339**(0.132) (0.119) (0.176)
MSOA Wait Time 2003 (SD) 1.021 0.994 1.023(0.0417) (0.0425) (0.0584)
Average hip replacements in 2002 and 2003 0.997 0.948* 1.013(0.0172) (0.0269) (0.0409)
Private hospital close 59.25***(22.52)
NHS hospital site (>30 beds) close 1.265(0.306)
Nearest NHS Hosp CharacteristicsTeaching Hosp 1.504 1.092
(0.400) (0.377)Dist (km) 1.250*** 1.068
(0.0511) (0.0432)Distance sq (km) 0.995*** 0.998
(0.00136) (0.00106)MSOA characteristics (2003)Fractured neck of femurs 0.996 1.008
(0.0159) (0.0267)IMD score (2004) 0.992 1.015
(0.0114) (0.0175)Population Density 0.994* 0.985***
(0.00292) (0.00433)Population 1.000 1.000
(0.00292) (0.000254)Unemployment (2004) 1.00 0.999
(0.00154) (0.00210)
Observations 6,719 6,719 6,719Pseudo R-squared 0.0206 0.0916 0.458Chi-squared (Private hospital and NHS site) 152.2
Notes: *** denotes signi�cance at 1%, ** at 5%, and * at 10% level. The dependent
variable is an indicator equal to one if the straight line distance to the nearest ISP in
2010/11 is less than the straight line distance to the nearest hospital. Coe�cients provide
odds ratios from logistic speci�cation.
38

Table
5:Instrumentalvariablesestimatesoftheim
pact
ofISPintroductiononnumber
ofadmit-
tancesforelectivehip
replacements
per
MSOA
(1)
(2)
(3)
(4)
(5)
OLS
OLS
OLS
IVIV
ISPlocation
Change
ISPclosestprovider
1.320***
0.730***
0.700***
0.691***
0.642***
(0.235)
(0.167)
(0.169)
(0.227)
(0.228)
Changein
MSOA
characeristics
FNOFadmits
0.0618***
0.0617***
(0.0195)
(0.0194)
Acute
coronarysyndromeadmits
-0.0128
-0.0129
(0.0135)
(0.0135)
House
sales
0.00173
0.00173*
(0.00106)
(0.00105)
Medianhouse
price
(¿000s)
0.00607***
0.00610***
(0.00178)
(0.00176)
Changein
Nrest
hosp
characteristics
28day
emergency
readmission
rate
(%)
-0.0539
-0.0545
(0.0552)
(0.0547)
Standardised
AMImortality
rate
(%)
-2.378
-2.355
(3.718)
(3.718)
PCTFE
No
Yes
Yes
Yes
Yes
Observations
6,781
6,781
6,781
6,781
6,781
R-squared
0.016
0.004
0.011
0.004
0.011
First-stage
F-stat
--
-168
167
Notes:***denotes
signi�cance
at1%
,**
at5%
,and*at
10%
level.Observationsareat
theMSOAyear
level.Thedependentvariablein
allcolumnsischange
in
thestandardized
number
ofelective
hip
replacements
between2002/03and2010/11(standardized
hip
replacements
in2010/11-standardized
hip
replacements
in2002/03).Relativedistancesto
thenearest
ISPandNHShospital
aremeasuredin
straightlines
from
thecentroidof
theMSOA
totheprovider
post(zip)
code.
WeincludeISPsitesthat
conduct
atleast20
hip
replacements
in2010/11.
Allcovariates
areexpressed
interm
sof
changesbetween2002/03and2010/11.
InColumns4and5,
whether
thenearest
provider
was
anISPin
2010/11isinstrumentedwithwhether
therewas
aprivate
orNHShospital
site
nearerthan
the
closestNHShospital
in2002/03.
Standarderrors
arerobust
tothepresence
ofheteroskedasticity
andclustered
atthePCTlevel.
39
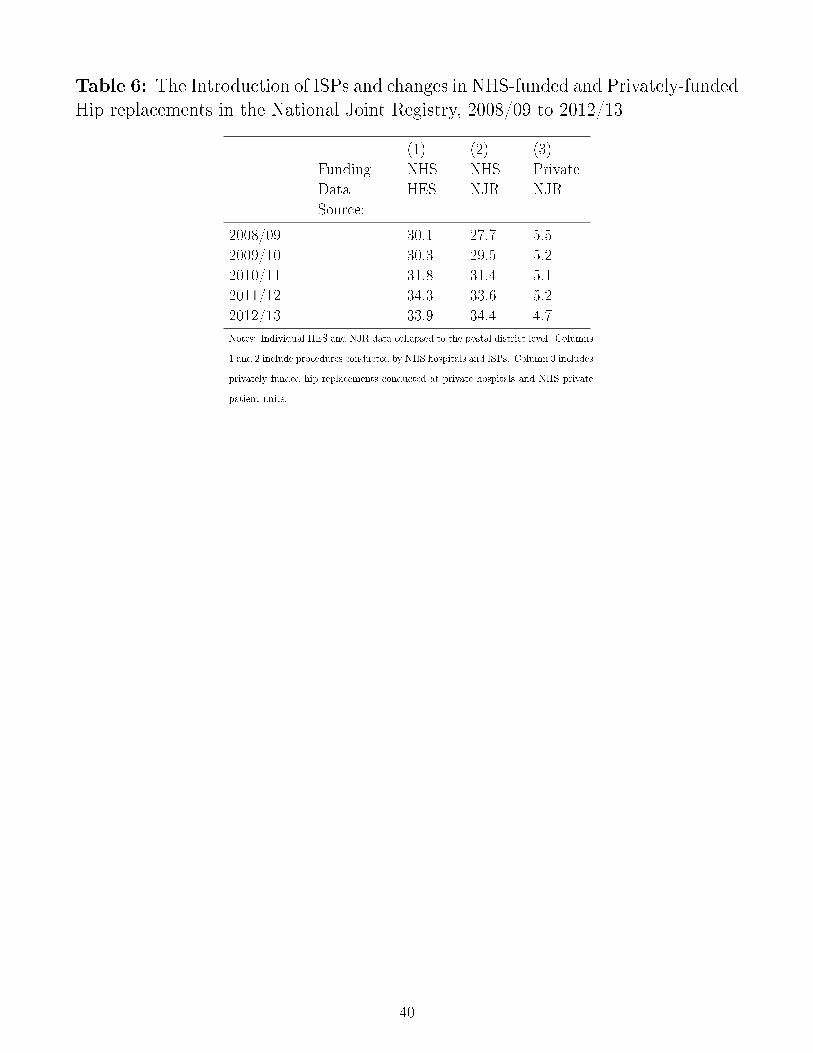
Table 6: The Introduction of ISPs and changes in NHS-funded and Privately-fundedHip replacements in the National Joint Registry, 2008/09 to 2012/13
(1) (2) (3)
Funding NHS NHS Private
Data
Source:
HES NJR NJR
2008/09 30.1 27.7 5.5
2009/10 30.3 29.5 5.2
2010/11 31.8 31.4 5.1
2011/12 34.3 33.6 5.2
2012/13 33.9 34.4 4.7
Notes: Individual HES and NJR data collapsed to the postal district level. Columns
1 and 2 include procedures conducted by NHS hospitals and ISPs. Column 3 includes
privately funded hip replacements conducted at private hospitals and NHS private
patient units.
40
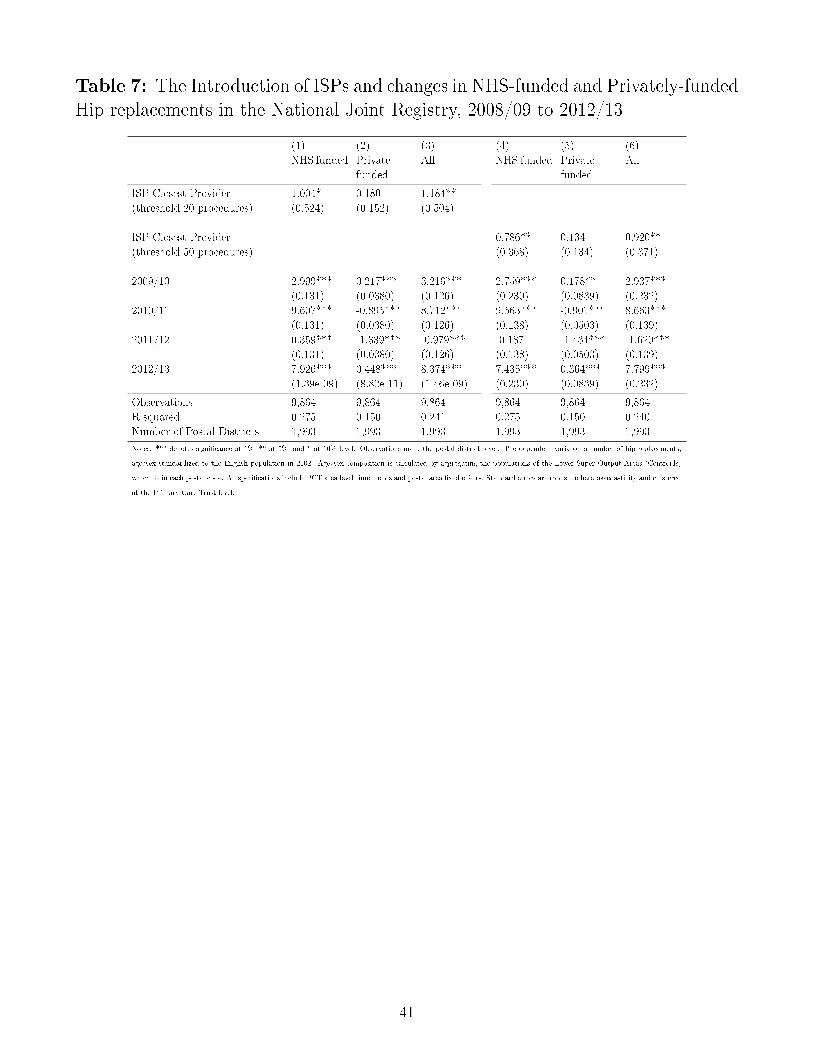
Table 7: The Introduction of ISPs and changes in NHS-funded and Privately-fundedHip replacements in the National Joint Registry, 2008/09 to 2012/13
(1) (2) (3) (4) (5) (6)
NHS funded Private
funded
All NHS funded Private
funded
All
ISP Closest Provider 1.004* 0.180 1.184**
(threshold 20 procedures) (0.524) (0.152) (0.504)
ISP Closest Provider 0.786** 0.134 0.920**
(threshold 50 procedures) (0.368) (0.134) (0.371)
2009/10 2.999*** 0.217*** 3.216*** 2.759*** 0.178** 2.937***
(0.131) (0.0380) (0.126) (0.230) (0.0839) (0.232)
2010/11 9.607*** -0.895*** 8.712*** 9.563*** -0.901*** 8.663***
(0.131) (0.0380) (0.126) (0.138) (0.0503) (0.139)
2011/12 0.359*** -1.339*** -0.979*** -0.187 -1.434*** -1.620***
(0.131) (0.0380) (0.126) (0.138) (0.0503) (0.139)
2012/13 7.926*** 0.448*** 8.374*** 7.435*** 0.364*** 7.799***
(1.39e-09) (8.82e-11) (1.46e-09) (0.230) (0.0839) (0.232)
Observations 9,864 9,864 9,864 9,864 9,864 9,864
R-squared 0.275 0.150 0.241 0.275 0.150 0.240
Number of Postal Districts 1,993 1,993 1,993 1,993 1,993 1,993
Notes: *** denotes signi�cance at 1%, ** at 5%, and * at 10% level. Observations are a the postal district level. The dependent variable is number of hip replacements,
age/sex standardized to the English population in 2002. Age/sex composition is calculated by aggregating the populations of the Lower Super Output Areas (Centroids)
which lie in each postal code. All speci�cations include PCT area level time trends and postal area �xed e�ects. Standard errors are robust to heteroskedasticity and clustered
at the Primary Care Trust level.
41

Table
8:Changein
hip
replacementpatientnumbersandmeanwaitingtimes
inNHShospitals
andtheintroductionofISPs,2002/03to
2010/11
∆Patients
∆Meanwaitingtime(days)
∆Meanpre-oplengthof
stay
(days)
(1)
(2)
(3)
(4)
(5)
(6)
OLS
IVOLS
IVOLS
IV
Change
in∆
%MSOAsISPclosestprovider
10.84
36.52
-65.71***
-130.4**
-0.00268
0.0982
(42.92)
(103.3)
(23.45)
(62.04)
(0.188)
(0.419)
First
stageF-stat
-33.52
-33.52
-33.52
(%MSOASPrivhospclosest2002/03)
Observations
133
133
133
133
133
133
R-squared
0.000
0.000
0.056
0.056
0.000
0.000
Notes:***denotes
signi�cance
at1%
,**
at5%
,and*at
1%level.
Observationsareat
thehospital
levelThesampleincludes
hospitalsthat
dataon
waitingtimes
andpatient
numbersin
both2002/03and2010/11.
Incolumns1and2,
thedependentvariableisthedi�erence
betweenthenumber
ofhip
replacements
conducted
bythehospital
in2010/11
andthenumber
ofhip
replacements
conducted
in2002/03.
Incolumns3and4,
thedependentvariableisthemeanwaitingtimeforhip
replacementpatients
in2010/11minus
meanwaitingtimes
in2002/03,
wherewaitingtimes
arethedi�erence
thedateon
whichitwas
decided
toadmitthepatientandtheactual
admission
date,in
days.
Thevariable
ofinterestin
allcolumnsisthechange
in%
MSOAswheretheISPsistheclosestprovider
between2002/03and2010/11.
ThisiscalculatedbyassigningMSOAstheirclosestNHS
hospitals,usingstraightlinedistance
measuresandcalculatingtheshareof
theseMSOAsthat
haveacloser
ISPin
each
year.Columns1and3areestimated
usingOLS.Columns
2and3areestimated
usingIV
wherethechange
in%
MSOAswheretheISPsistheclosestprovider
isinstrumentedwiththe%
ofMSOAwherewas
aprivate
hospital
site
closer
than
thenearest
NHStrust
in2002.
42
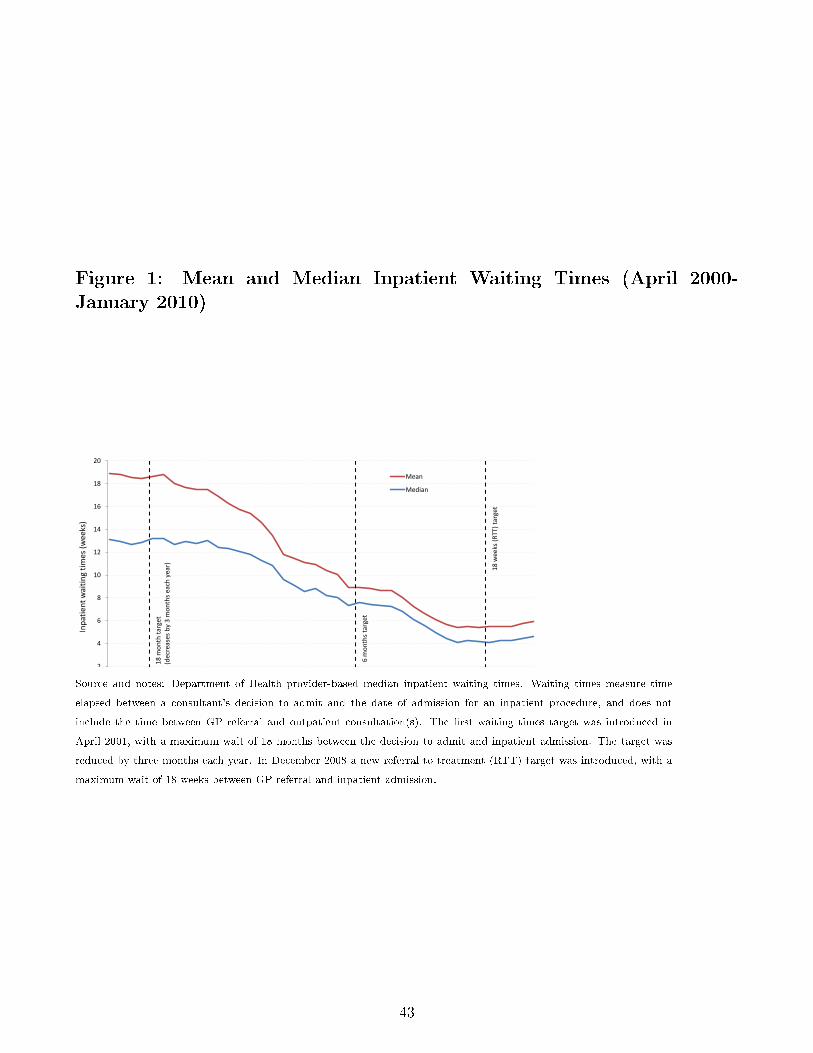
Figure 1: Mean and Median Inpatient Waiting Times (April 2000-January 2010)
0
2
4
6
8
10
12
14
16
18
20
Apr 2
000
Jul 2
000
Oct
200
0 Ja
n 20
01
Apr 2
001
Jul 2
001
Oct
200
1 Ja
n 20
02
Apr 2
002
Jul 2
002
Oct
200
2 Ja
n 20
03
Apr 2
003
Jul 2
003
Oct
200
3 Ja
n 20
04
Apr 2
004
Jul 2
004
Oct
200
4 Ja
n 20
05
Apr 2
005
Jul 2
005
Oct
200
5 Ja
n 20
06
Apr 2
006
Jul 2
006
Oct
200
6 Ja
n 20
07
Apr 2
007
Jul 2
007
Oct
200
7 Ja
n 20
08
Apr 2
008
Jul 2
008
Oct
200
8 Ja
n 20
09
Apr 2
009
Jul 2
009
Oct
200
9 Ja
n 20
10
Inpa
tient
wai
ting
times
(wee
ks)
Mean
Median
18 m
onth
targ
et
(dec
reas
es b
y 3
mon
ths e
ach
year
)
18 w
eeks
(RTT
) tar
get
6 m
onth
s tar
get
Source and notes: Department of Health provider-based median inpatient waiting times. Waiting times measure time
elapsed between a consultant's decision to admit and the date of admission for an inpatient procedure, and does not
include the time between GP referral and outpatient consultation(s). The �rst waiting times target was introduced in
April 2001, with a maximum wait of 18 months between the decision to admit and inpatient admission. The target was
reduced by three months each year. In December 2008 a new referral to treatment (RTT) target was introduced, with a
maximum wait of 18 weeks between GP referral and inpatient admission.
43
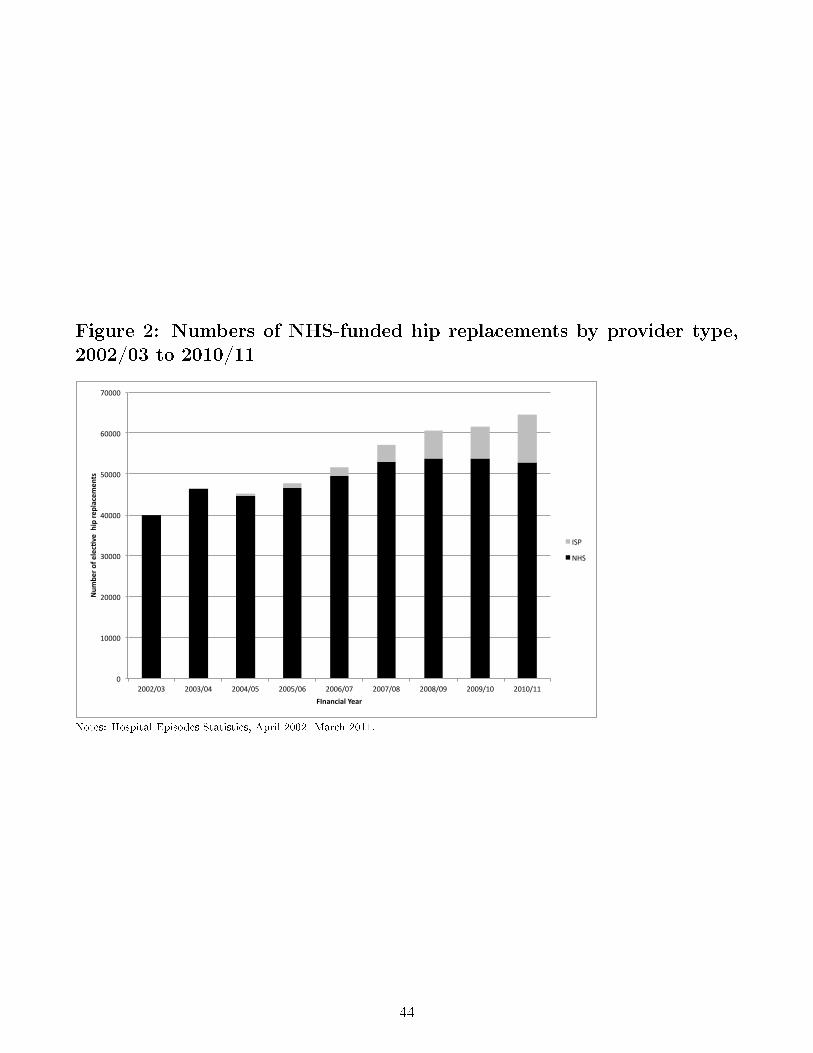
Figure 2: Numbers of NHS-funded hip replacements by provider type,2002/03 to 2010/11
0
10000
20000
30000
40000
50000
60000
70000
2002/03 2003/04 2004/05 2005/06 2006/07 2007/08 2008/09 2009/10 2010/11
Num
ber of elec,ve hip re
placem
ents
FInancial Year
ISP
NHS
Notes: Hospital Episodes Statistics, April 2002- March 2011.
44
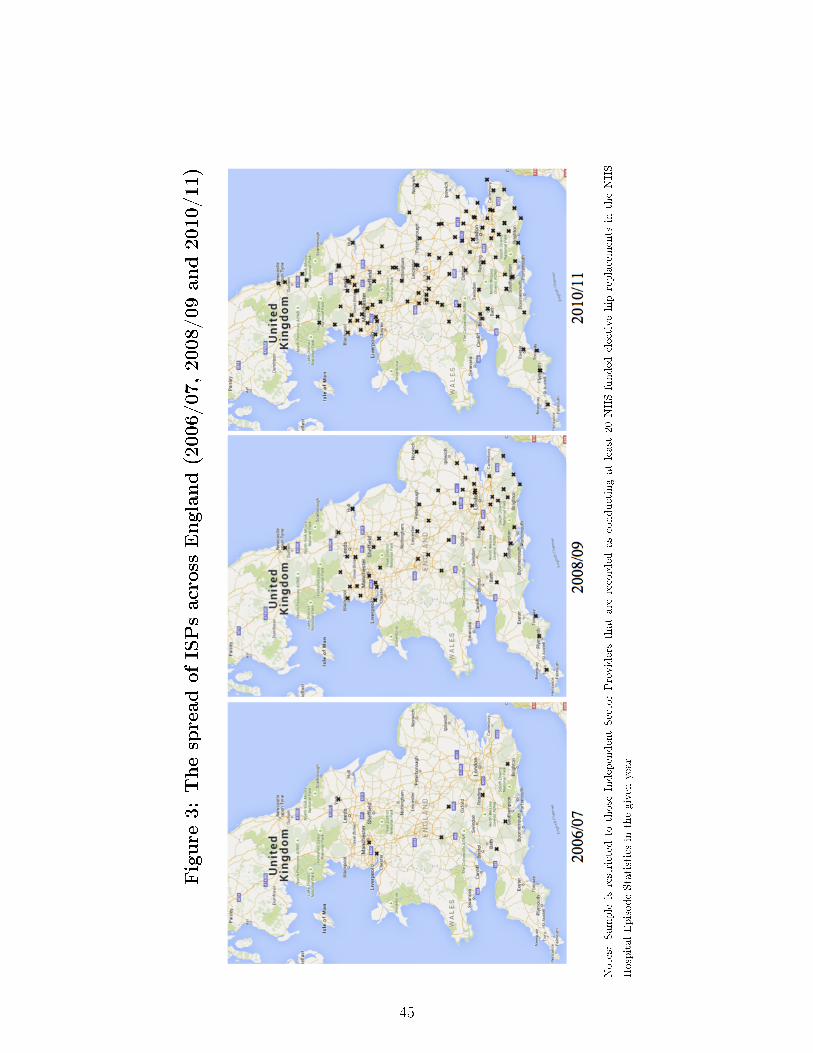
Figure
3:ThespreadofISPsacross
England(2006/07,2008/09and2010/11)
Notes:
Sample
isrestricted
tothose
IndependentSectorProvidersthatare
recorded
asconductingatleast
20NHS-funded
electivehip
replacements
intheNHS
HospitalEpisodeStatisticsin
thegiven
year
45

Figure 4: The market for elective hip replacements and the ISP reforms
b PA
NHS Hospitals ISPs
Waiting times Waiting times
Procedures Procedures
D’NHS
DNHS D1
ISP
D2ISP
SISP S01
NHS SNHS
PA PB IB IA
W01
W
W’
0 0
Figure 5: Separating demand from supply: An example from LeicesterCity Primary Care Trust
46
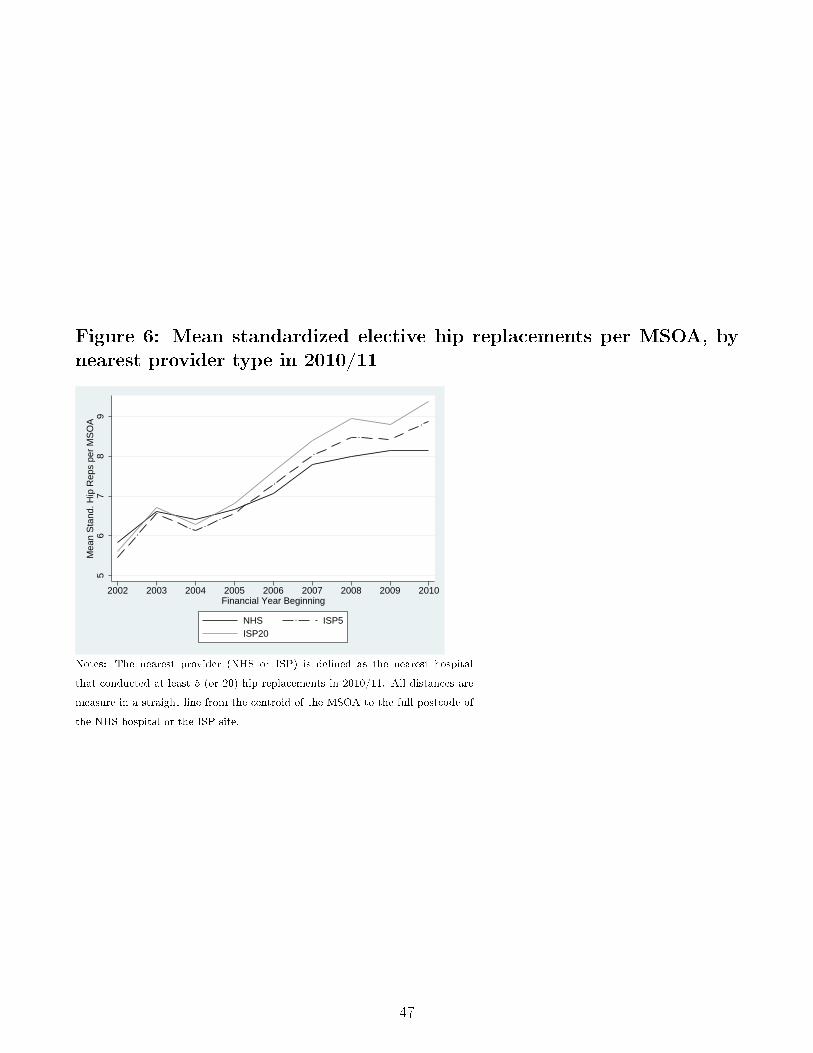
Figure 6: Mean standardized elective hip replacements per MSOA, bynearest provider type in 2010/11
56
78
9M
ean
Sta
nd. H
ip R
eps
per
MS
OA
2002 2003 2004 2005 2006 2007 2008 2009 2010Financial Year Beginning
NHS ISP5ISP20
Notes: The nearest provider (NHS or ISP) is de�ned as the nearest hospital
that conducted at least 5 (or 20) hip replacements in 2010/11. All distances are
measure in a straight line from the centroid of the MSOA to the full postcode of
the NHS hospital or the ISP site.
47
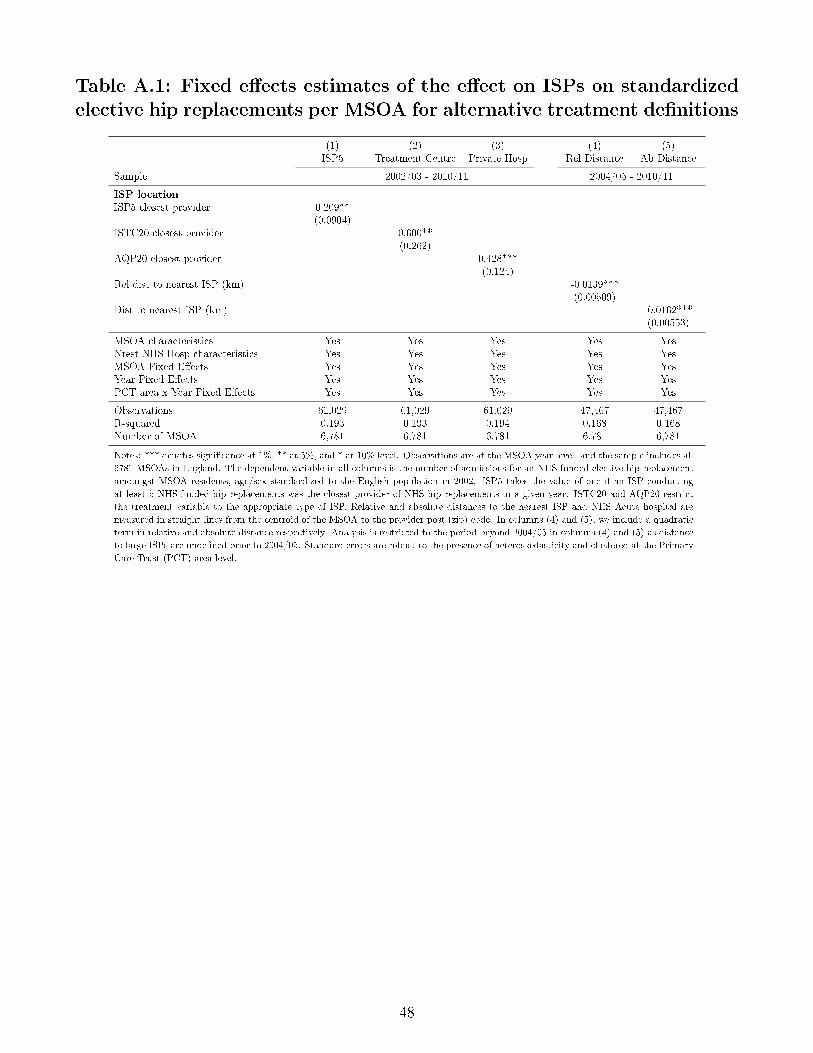
Table A.1: Fixed e�ects estimates of the e�ect on ISPs on standardizedelective hip replacements per MSOA for alternative treatment de�nitions
(1) (2) (3) (4) (5)ISP5 Treatment Centre Private Hosp Rel Distance Ab Distance
Sample 2002/03 - 2010/11 2004/05 - 2010/11
ISP locationISP5 closest provider 0.209**
(0.0904)ISTC20 closest provider 0.600**
(0.262)AQP20 closest provider 0.428***
(0.124)Rel dist to nearest ISP (km) -0.0139***
(0.00509)Dist to nearest ISP (km) -0.0162***
(0.00553)
MSOA characteristics Yes Yes Yes Yes YesNrest NHS Hosp characteristics Yes Yes Yes Yes YesMSOA Fixed E�ects Yes Yes Yes Yes YesYear Fixed E�ects Yes Yes Yes Yes YesPCT area x Year Fixed E�ects Yes Yes Yes Yes Yes
Observations 61,029 61,029 61,029 47,467 47,467R-squared 0.193 0.193 0.194 0.168 0.168Number of MSOA 6,781 6,781 6,781 6,781 6,781
Notes: *** denotes signi�cance at 1%, ** at 5%, and * at 10% level. Observations are at the MSOA year level, and the sample includes all
6781 MSOAs in England. The dependent variable in all columns is the number of admissions for an NHS-funded elective hip replacement
amoungst MSOA residents, age/sex standardized to the English population in 2002. ISP5 takes the value of one if an ISP conducting
at least 5 NHS-funded hip replacements was the closest provider of NHS hip replacements in a given year. ISTC20 and AQP20 restrict
the treatment variable to the appropriate type of ISP. Relative and absolute distances to the nearest ISP and NHS Acute hospital are
measured in straight lines from the centroid of the MSOA to the provider post (zip) code. In columns (4) and (5), we include a quadratic
term in relative and absolute distance respectively. Analysis is restricted to the period beyond 2004/05 in columns (4) and (5) as distance
to large ISPs are unde�ned prior to 2004/05. Standard errors are robust to the presence of heteroskedasticity and clustered at the Primary
Care Trust (PCT) area level.
48