Embed Size (px)
Citation preview

NEW JERSEY HOUSING AND MORTGAGE FINANCE AGENCY
Trenton, New Jersey
FINANCIAL STATEMENTS December 31, 2014
(With Comparative Information for December 31, 2013)

TABLE OF CONTENTS
PAGE INDEPENDENT AUDITORS’ REPORT .................................................................................................................... 1
REQUIRED SUPPLEMENTARY INFORMATION
Management’s Discussion and Analysis (MD&A) .......................................................................................... 4 BASIC FINANCIAL STATEMENTS ........................................................................................................................15
Statement of Net Position ...........................................................................................................................16 Statement of Revenues, Expenses and Changes in Net Position ................................................................18 Statement of Cash Flows .............................................................................................................................19 Notes to Financial Statements .....................................................................................................................21
REQUIRED SUPPLEMENTARY INFORMATION ...................................................................................................57 Schedule of Funding Progress ‐ OPEB ..........................................................................................................58
SUPPLEMENTARY INFORMATION .....................................................................................................................59 Schedule of Net Position – Single‐Family Housing Program .......................................................................60 Schedule of Revenues, Expenses and Changes in Fund Net Position –
Single‐Family Housing Program ............................................................................................................61 Schedule of Net Position – Multi‐Family Housing Program ........................................................................62 Schedule of Revenues, Expenses and Changes in Fund Net Position –
Multi‐Family Housing Program .............................................................................................................63
1
INDEPENDENT AUDITORS’ REPORT Board of Directors New Jersey Housing and Mortgage Finance Agency Trenton, New Jersey Report on the Financial Statements
We have audited the accompanying financial statements of the business‐type activities and each major fund of the New Jersey Housing and Mortgage Finance Agency (the Agency), as of and for the year ended December 31, 2014, and the related notes to the financial statements, which collectively comprise the Agency’s basic financial statements as listed in the table of contents. Management’s Responsibility for the Financial Statements
Management is responsible for the preparation and fair presentation of these financial statements in accordance with accounting principles generally accepted in the United States of America; this includes the design, implementation, and maintenance of internal control relevant to the preparation and fair presentation of financial statements that are free from material misstatement, whether due to fraud or error. Auditors’ Responsibility
Our responsibility is to express opinions on these financial statements based on our audit. We conducted our audit in accordance with auditing standards generally accepted in the United States of America and the standards applicable to financial audits contained in Government Auditing Standards, issued by the Comptroller General of the United States. Those standards require that we plan and perform the audit to obtain reasonable assurance about whether the financial statements are free from material misstatement. An audit involves performing procedures to obtain audit evidence about the amounts and disclosures in the financial statements. The procedures selected depend on the auditors’ judgment, including the assessment of the risks of material misstatement of the financial statements, whether due to fraud or error. In making those risk assessments, the auditor considers internal control relevant to the entity’s preparation and fair presentation of the financial statements in order to design audit procedures that are appropriate in the circumstances, but not for the purpose of expressing an opinion on the effectiveness of the entity’s internal control. Accordingly, we express no such opinion. An audit also includes evaluating the appropriateness of accounting policies used and the reasonableness of significant accounting estimates made by management, as well as evaluating the overall presentation of the financial statements. We believe that the audit evidence we have obtained is sufficient and appropriate to provide a basis for our audit opinions.
CliftonLarsonAllen LLP www.CLAconnect.com
An independent member of Nexia International
2
Opinions
In our opinion, the financial statements referred to above present fairly, in all material respects, the respective financial position of the business‐type activities and each major fund of the Agency as of December 31, 2014, and the respective changes in financial position and cash flows thereof for the year then ended in accordance with accounting principles generally accepted in the United States of America.
Other Matters
Required Supplementary Information
Accounting principles generally accepted in the United States of America require that the Management’s Discussion and Analysis on pages 3 – 14 and the Schedule of Funding Progress on page 58 be presented to supplement the basic financial statements. Such information, although not a part of the basic financial statements, is required by the Governmental Accounting Standards Board who considers it to be an essential part of financial reporting for placing the basic financial statements in an appropriate operational, economic, or historical context. We have applied certain limited procedures to the required supplementary information in accordance with auditing standards generally accepted in the United States of America, which consisted of inquiries of management about the methods of preparing the information and comparing the information for consistency with management’s responses to our inquiries, the basic financial statements, and other knowledge we obtained during our audit of the basic financial statements. We do not express an opinion or provide any assurance on the information because the limited procedures do not provide us with sufficient evidence to express an opinion or provide any assurance. Other Information
Our audit was conducted for the purpose of forming an opinion on the financial statements that collectively comprise the Agency’s basic financial statements. The Schedules of Net Position and Revenues, Expenses, and Changes in Fund Net Position for the Single Family and Multi‐Family Housing Programs (the Schedules) are presented for purposes of additional analysis and are not a required part of the basic financial statements. The Schedules are the responsibility of management and were derived from and relate directly to the underlying accounting and other records used to prepare the basic financial statements. Such information has been subjected to the auditing procedures applied in the audit of the basic financial statements and certain additional procedures, including comparing and reconciling such information directly to the underlying accounting and other records used to prepare the basic financial statements or to the basic financial statements themselves, and other additional procedures in accordance with auditing standards generally accepted in the United States of America. In our opinion, the Schedules are fairly stated, in all material respects, in relation to the basic financial statements as a whole.
Report on Summarized Comparative Information
We have previously audited the Agency’s 2013 basic financial statements, and we expressed unmodified audit opinions on those audited financial statements in our report dated May 28, 2014. In our opinion, the summarized comparative information presented herein as of and for the year ended December 31, 2013 is consistent in all material respects, with the audited financial statements from which it has been derived.

3
Other Reporting Required by Government Auditing Standards
In accordance with Government Auditing Standards, we have also issued our report dated March 30, 2015 on our consideration of the Agency’s internal control over financial reporting and on our tests of its compliance with certain provisions of laws, regulations, contracts and grant agreements and other matters. The purpose of that report is to describe the scope of our testing of internal control over financial reporting and compliance and the results of that testing, and not to provide an opinion on internal control over financial reporting or on compliance. That report is an integral part of an audit performed in accordance with Government Auditing Standards in considering the Agency’s internal control over financial reporting and compliance.
a CliftonLarsonAllen LLP
Baltimore, Maryland March 30, 2015

NEW JERSEY HOUSING AND MORTGAGE FINANCE AGENCY MANAGEMENT’S DISCUSSION AND ANALYSIS
December 31, 2014
4
Introduction to the Financial Report This financial report consists of five parts: Management’s Discussion and Analysis, Financial Statements, Notes to the Financial Statements, Required Supplementary Information and Supplementary Information. The New Jersey Housing and Mortgage Finance Agency (NJHMFA or Agency), as referred to throughout the Management’s Discussion and Analysis, is for financial reporting purposes, the primary government. The Financial Statements include The Statement of Net Position which provides information about the nature and amounts of investments in resources (assets), deferred outflows of resources, obligations to Agency creditors (liabilities) and deferred inflows of resources. The Statement of Revenues, Expenses and Changes in Net Position which accounts for all of the current year’s revenue and expenses, measures the success of the Agency’s operations over the past year and can be used to determine how the Agency has funded its costs. The Statement of Cash Flows which provides information about the Agency’s cash receipts, cash payments, and net changes in cash resulting from operations, investing, and financing activities. The Notes to the Financial Statements provide Information that is essential to understanding the basic financial statements, such as the Agency’s accounting methods and policies. Details of contractual obligations, future commitments and contingencies of the Agency. Information about any other events or developing situations that could materially affect the Agency’s financial position. Required Supplementary Information This presents the information regarding the Agency’s progress in funding its obligation to provide postemployment benefits other than pensions to its employees. Supplementary Information This provides presentations of the Agency’s financial information in accordance with the requirements of the various Bond Resolutions. Management’s Discussion and Analysis This section of the Agency’s financial statements, the Management’s Discussion and Analysis (MD&A), presents an overview of the Agency’s financial performance for the years ended December 31, 2014 and 2013. It provides an assessment of how the Agency’s position has improved or deteriorated and identifies the factors that, in management’s view, significantly affected the Agency’s overall financial position.
NEW JERSEY HOUSING AND MORTGAGE FINANCE AGENCY MANAGEMENT’S DISCUSSION AND ANALYSIS
December 31, 2014
5
The Agency’s Business The Agency was created to provide a strong unified advocate for housing production, financing and improvement. The Agency is established under, but is not a part of, the Department of Community Affairs, and is constituted as a body politic and corporate and an instrumentality of the State exercising public and essential governmental functions. Included in the Agency’s powers is the ability, inter alia, to provide to housing sponsors, through eligible loans or otherwise, financing, refinancing or financial assistance for fully completed, as well as partially completed projects; to issue negotiable bonds and to secure the payment thereof; and to make and enter into and enforce all contracts and agreements necessary, convenient or desirable to the performance of its duties and the execution of its powers. Overall Financial Highlights – Year Ended December 31, 2014 The Agency’s overall net position remained relatively flat with a modest 1.6% increase from 2013 to 2014. The multifamily portfolio continued to perform well with continued recoveries on bad debt and the single family portfolio benefited from an influx of cash from the general fund and lower reserves as foreclosures are steadily flowing through the court system. These factors offset the transfer out of the general fund and increased servicing costs on delinquent single family loans paid by the general fund. Single Family loan production declined as 166 loans were funded in 2014 compared to 685 in 2013. In order to offer competitive rates and increase SF loan production, the Agency is implementing an MBS platform. In March 2014, the Agency was approved by the Government National Mortgage Association (Ginnie Mae) to be an issuer of Ginnie Mae I and II single family mortgage backed securities (MBS). This MBS platform will afford the Agency with additional SF loan funding sources to complement its traditional Mortgage Revenue Bond (MRB) financing program. The Agency’s Single Family Housing Revenue Bonds (“HRB”) resolution has been negatively impacted by factors that include the prolonged economic downturn as well as the lengthy timeline associated with New Jersey mortgage foreclosure actions. In July 2014, Moody’s Investors Service (Moody’s) downgraded its rating on the HRB resolution from Aa2 (negative outlook) to Aa3 (negative outlook). After reviewing the recent financial performance of loans allocated to the HRB and in an attempt to mitigate future negative rating actions, the Agency Board members approved a transfer of $25 million of unrestricted General Fund cash to the HRB Resolution at its August 14, 2014 meeting. The funds were transferred to the HRB in September, 2014, and will be used to make new single family loans which will raise the asset parity level within the Resolution. In September of 2013, the bulk of Single Family mortgage servicing was consolidated to one servicer. The consolidation caused an initial up‐tick in delinquencies for the Agency, as well as a slow‐down in the foreclosure process. This coupled with the several foreclosure moratoriums enacted by the State of New Jersey created a back‐log of foreclosure properties. In 2013, the Agency had 232 properties go to sheriff sale. As loans progressed through the foreclosure process in 2014, 347 properties went to sheriff sale causing the Agency to realize an increase of foreclosure receivables. The claim’s process will proceed and is expected to offset part of the loss.

NEW JERSEY HOUSING AND MORTGAGE FINANCE AGENCY MANAGEMENT’S DISCUSSION AND ANALYSIS
December 31, 2014
6
REO properties have seen activity in both the acquisition as well as the disposal of the properties. As previously stated, the foreclosure activity has increased due to the servicing consolidation, and as sheriff sales have increased property acquisition has increased. The Agency has taken steps to dispose of acquired properties to reduce carrying costs and, ultimately, losses. In June 2014 the Agency issued $27.8 million of Multi‐Family Revenue Bonds, and $51.2 million of direct purchase draw down bonds to finance 18 new money rental housing developments containing a total of 1,076 multifamily units. The Agency closed eight Conduit bond issues totaling $140 million in 2014, with “carryover” transactions of more than $35 million scheduled to close in the first quarter of 2015 and a pipeline in excess of $500 million. On December 31, 2012, the Agency acquired title to Paragon Village via a deed in lieu of foreclosure, and simultaneously appointed a reputable management company to assume control of Paragon’s day to day operations. Management, under the direction of the Agency, restored Paragon to profitability in the 2nd quarter of 2013, reversing a trend of operating losses and delinquencies dating back to the project’s inception. The Agency solicited offers to purchase Paragon from qualified owner‐operators in the 4th quarter of 2013 pursuant to a Request for Offer to Purchase (RFOTP). As of December 31, 2014, the Agency had identified a buyer, negotiated the terms and conditions of sale, and received all internal approvals necessary to complete the transfer. On February 27, 2015, the Agency completed the sale of Paragon Village and received $11.5 million at closing. On December 23, 2014 the Agency entered into a Memorandum of Understanding (MOU) with the New Jersey Department of Human Services (DHS) to administer the Supportive Housing Connection. Through this initiative, the Agency will administer DHS rental subsidies. The first 16 subsidies were paid on March 1, 2015 and will proceed monthly thereafter, increasing in volume as DHS transfers subsidies to the Agency. Under the Superstorm Sandy Community Development Block Grant‐Disaster Recovery (CDBG‐DR) Action Plan, the Agency received an initial allocation of $229.0 million in CDBG‐DR funds as sub recipient to implement three state affordable housing programs designed to support the needs of renters and prospective homeowners in nine counties throughout the State which were hardest hit by Superstorm Sandy. The Fund for Restoration of Multifamily Housing (FRM) was allocated $179.0 million, the Sandy Special Needs Housing Fund (SSNHF) $25.0 million, and the Sandy Homebuyer Assistance Program (SHAP) was allocated $25.0 million. FRM As of December 31, 2014 FRM funds have been committed across thirty‐six projects, of which twenty‐four are under construction. The Agency anticipates that these projects will increase the supply of affordable housing in the nine most impacted counties, creating nearly 3000 housing units for low‐to‐moderate income working families and households on fixed incomes. HUD approved the second tranche of CDBG‐DR funds in May 2014 and the Agency was allocated an additional $200.0 million for the Fund for Restoration of Multifamily Housing (FRM). The program guidelines were developed and adopted by the Agency Board in June 2014. It is anticipated that the second tranche commitments will be awarded in the second quarter of 2015.

NEW JERSEY HOUSING AND MORTGAGE FINANCE AGENCY MANAGEMENT’S DISCUSSION AND ANALYSIS
December 31, 2014
7
SSNHF SSNHF funds have been committed across 23 projects that are expected to create approximately 250 affordable housing opportunities for individuals with special needs. The Sandy Special Needs Housing Fund (SSNHF) was awarded an additional $25 million in the second tranche of CDBG‐DR funding. SHAP Nearly 259 low and moderate income homebuyers have received SHAP assistance to purchase homes in Sandy affected communities. As of December 31, 2014 approximately $15.0 million has been expended / committed. In 2014, the Agency received $55 million in U.S. Department of Treasury Hardest Hit Funds and closed 741 loans under this program. These are recorded as program income and program expense in the Agency’s General Fund. The Agency has liquidity facilities in place with multiple providers in order to provide liquidity support for the payment of its variable rate bonds in the event that they cannot be remarketed. As of January 1, 2014, the Agency had total variable rate bonds outstanding in the amount of $549.4 million (excluding bond maturities scheduled to occur in 2014) whose related liquidity facilities were scheduled to expire in 2014. The Agency successfully resolved its entire 2014 liquidity expiration exposure of $549.4 million by taking the following actions:
January 2014 ‐ Extended two SF liquidity facilities totaling $77.4 million with current provider (Barclays Bank PLC).
July 2014 ‐ Extended $175.2 million MF liquidity facility with current provider (Bank of America, N.A.).
October 2014 ‐ Extended three SF liquidity facilities totaling $127.6 million with current provider (Royal Bank of Canada).
October 2014 ‐ Extended $79.1 million SF liquidity facility with current provider (TD Bank, N.A.).
October 2014 – Replaced $90.1 million SF liquidity facility with new provider (Bank of America, N.A.).
The following credit rating actions occurred in 2014:
January 2014 ‐ Moody’s Investors Service (Moody’s) maintained its Aa2 (negative outlook) rating on the Agency’s Single Family Housing Revenue Bonds (HRB) resolution.
May 2014 ‐ Standard & Poor’s Rating Services (S&P) affirmed its AA‐ (stable outlook) rating on the Agency’s Multi‐Family Housing Revenue Bonds (MF 1995) resolution.
May 2014 ‐ Standard & Poor’s Rating Services (S&P) affirmed its A+ rating on the Agency’s Multi‐Family 1991 Series 1 (Presidential Plaza at Newport) bond resolution.

NEW JERSEY HOUSING AND MORTGAGE FINANCE AGENCY MANAGEMENT’S DISCUSSION AND ANALYSIS
December 31, 2014
8
May 2014 ‐ Standard & Poor’s Rating Services (S&P) affirmed its A+ (stable outlook) rating on the Agency’s Multi‐Family Revenue Bonds (MF 2004) resolution.
July 2014 ‐ Moody’s Investors Service (Moody’s) downgraded its rating on the Agency’s Single Family Housing Revenue Bonds (HRB) resolution from Aa2 (negative outlook) to Aa3 (negative outlook).
July 2014 ‐ Moody’s Investors Service (Moody’s) downgraded its issuer credit rating (ICR) on the Agency from Aa1 (stable outlook) to Aa2 (stable outlook). At the same time, Moody’s downgraded its rating on the Agency’s Single Family Home Mortgage Bonds (HMB) resolution from Aa1 (stable outlook) to Aa2 (stable outlook), and downgraded its rating on the Agency’s Multi‐Family General Housing Loan Bonds (GHLB) resolution from Aa1 (stable outlook) to Aa2 (stable outlook).
September 2014 ‐ Standard & Poor’s Rating Services (S&P) upgraded its rating on the Agency’s Multi‐Family Housing Revenue Bonds (MF 1995) resolution from AA‐ (stable outlook) to AA (stable outlook).
December 2014 ‐ Standard & Poor’s Rating Services (S&P) affirmed its A+ (stable outlook) rating on the Agency’s Multi‐Family Revenue Bonds (MF 2004) resolution.
December 2014 ‐ Standard & Poor’s Rating Services (S&P) affirmed its AA (stable outlook) rating on the issuer credit rating (ICR) on the Agency. At the same time, S&P affirmed its AA (stable outlook) rating on the Agency’s Multi‐Family General Housing Loan Bonds (GHLB) resolution.
Overview of the Financial Statements The Agency is a self‐supporting entity and follows enterprise fund reporting. An enterprise fund reports activity that is financed with debt that is secured solely by a pledge of the net revenue from that activity as well as activity that is not supported by taxes or similar revenues. NJHMFA’s financial statements are presented using the economic resources measurement focus and the accrual basis of accounting. The accrual basis of accounting matches revenues and expenses to the time period in which they are earned or attributable, respectively, which may differ from the period in which the associated cash is received or expended. Enterprise fund statements offer short‐term and long‐term financial information about the Agency’s activities. While detailed sub‐fund information is not presented in the Agency’s financial statements, separate accounts are maintained for each bond issue and component unit, as well as the Agency’s general operating fund, known as the General Fund. These sub‐funds permit NJHMFA to control and manage money for particular purposes and to determine that the Agency is properly using specific resources.

NEW JERSEY HOUSING AND MORTGAGE FINANCE AGENCY MANAGEMENT’S DISCUSSION AND ANALYSIS
December 31, 2014
9
Financial Analysis
The following sections will discuss the Agency’s financial results for 2014 compared to 2013. Additionally, an examination of major economic factors that have contributed to the Agency’s operations is provided. It should be noted that for purposes of this MD&A, summaries of the financial statements and the various exhibits presented are in conformity with the Agency’s financial statements, which are presented in accordance with accounting principles generally accepted in the United States. All dollar amounts are in thousands.
NJHMFA’s Condensed Statement of Net Position
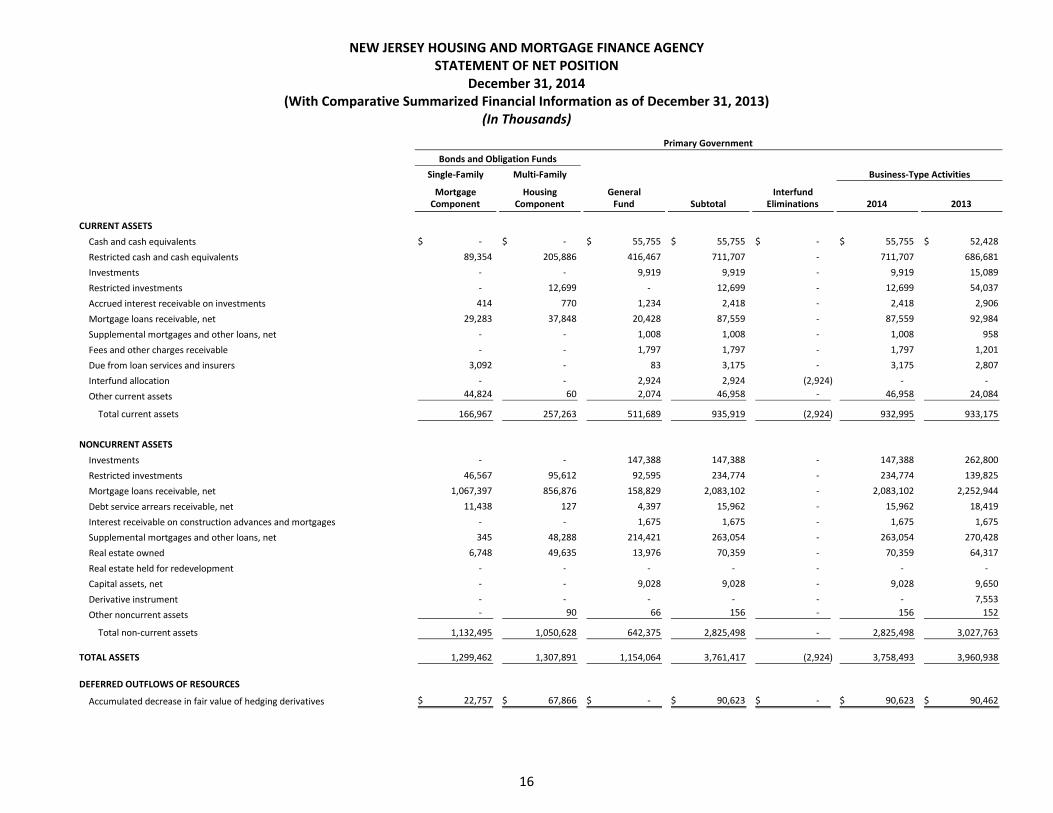
The Statement of Net Position in the financial statements presents the Agency’s assets, deferred outflows of resources, liabilities, deferred inflows of resources and net position as of December 31, 2014. The following table represents the comparison of net position as of December 31, 2014 and 2013. The change between December 31, 2014 and December 31, 2013 should be read in conjunction with the financial statements.
Condensed Statement of Net Position (In Thousands)
% Change
2014 2013 2014/2013
Current and other assets 932,995$ 933,175$ 0.0%
Other noncurrent assets 2,816,470 3,018,113 ‐6.7%Capital assets 9,028 9,650 ‐6.4%
Total assets 3,758,493 3,960,938 ‐5.1%
Deferred outflows 90,623 90,462 0.2%
Current liabilities 353,440 376,889 ‐6.2%
Long‐term liabilities 2,622,855 2,806,999 ‐6.6%
Total liabilities 2,976,295 3,183,888 ‐6.5%
Deferred Inflows 932 9,006 ‐89.7%
Net position:
Net investment in capital assets 9,028 9,650 ‐6.4%
Restricted 380,883 356,199 6.9%
Unrestricted 481,978 492,657 ‐2.2%
Total net position 871,889$ 858,506$ 1.6%
The Agency’s overall 5.1% decrease in total assets resulted from the following factors:
Cash and cash equivalents increased by $28.4 million due to the $25 million of General Fund investments being transferred to the Single Family Housing Revenue Bond Resolution and being invested in cash equivalents. This was offset by a decrease in investments of $67.0 million primarily due to the sale of $50 million in General Fund investments to transfer to the SF HRB Resolution and an addition $25 million to temporarily fund multifamily loans until multifamily bonds are sold in 2015. In addition, an investment agreement in the Multifamily Revenue Bond resolution Series 2005 D & E matured in the amount of $34 million.

NEW JERSEY HOUSING AND MORTGAGE FINANCE AGENCY MANAGEMENT’S DISCUSSION AND ANALYSIS
December 31, 2014
10
Other assets increased by $22.9 million due to the increase of foreclosure receivable on government insured (FHA) single family loans, which proceeded to sheriff sale but had not yet received insurance proceeds.
Mortgage loans receivable decreased by $185.0 million, primarily due to an approximately $100 million decrease in single family loans. Single family loans receivable dropped as the low interest rate environment prompted more borrowers to refinance or trade up, increasing loan prepayments. Foreclosures and regular loan amortization also contributed to the decline in single family loans receivable. Multifamily prepayments and regular loan amortization also added to the decrease in mortgage loans receivable.
Real estate owned increased by $6.0 million mainly due to an increase of $3.8 million in single family properties held, as the delinquent loans worked their way through the court system. The agency’s acquisition of a deed in lieu of foreclosure for the Kuzuri Kijiji multifamily project (valued at $2.2 million) also contributed to the increase in real estate owned.
The Agency’s overall 6.5% decrease in total liabilities resulted from the following factors:
Bonds and accrued interest payable decreased by $190.9 million due to regularly scheduled payments of $ 93.0 million and early redemptions of $150.4 million coupled with low interest rates on unhedged variable rate bonds. This was offset by the issuance of $54.6 million bonds payable.
Funds held in trust for mortgagors increased by $9.0 million due to the receipt of $13 million of FHA Risk Share insurance proceeds for the Assisted Living at Wall multifamily project.
Unearned revenue decreased by $23.2 million due to the decrease in U.S. Treasury Hardest Hit Funds held at December 31, 2014.
NJHMFA’s Condensed Statements of Revenues, Expenses and Changes in Net Position
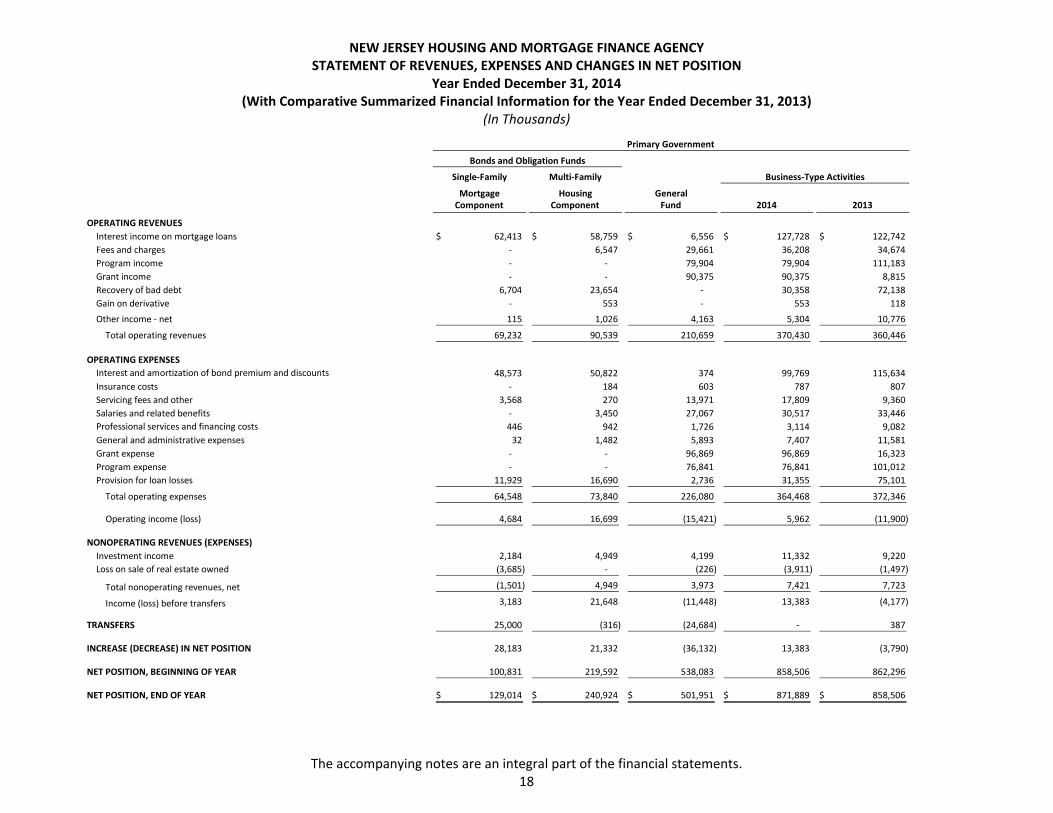
The Statements of Revenues, Expenses and Changes in Net Position reports revenues recognized and expenses incurred for the years ended December 31, 2014 and 2013. The table below summarizes the Agency’s revenues and expenses for the years ended December 31, 2014 and 2013. It should be read in conjunction with the financial statements.

NEW JERSEY HOUSING AND MORTGAGE FINANCE AGENCY MANAGEMENT’S DISCUSSION AND ANALYSIS
December 31, 2014
11
Condensed Statements of Revenues, Expenses and Changes in Net Position for the Years Ended December 31, 2014 and 2013
(In Thousands)
% Change
2014 2013 2014/2013
Operating revenues:Interest income on mortgage loans 127,728$ 122,742$ 4.1%Fees and charges 36,208 34,674 4.4%Program income 79,904 111,183 ‐28.1%Grant income 90,375 8,815 925.2%Recovery of bad debt 30,358 72,138 ‐57.9%Gain on derivative 553 118 368.6%Other 5,304 10,776 ‐50.8%
370,430 360,446 2.8%Operating expenses 364,468 372,346 ‐2.1%
Operating income (loss) 5,962 (11,900) 150.1%
Non‐operating revenues, net 7,421 7,723 ‐3.9%Transfers ‐ 387 100.0%
(Decrease) increase in net position 13,383 (3,790) 453.1%
Total net position‐ beginning of year 858,506 862,296 ‐0.4%
Total net position ‐ end of year 871,889$ 858,506$ 1.6%
The 150.1% increase in operating income is due to the following factors:
Interest income on mortgages receivable increased by $5.0 million due a decrease in mortgage interest arrears as the Agency collected on more outstanding balances.
Program income decreased by $31.3 million due to lower loan production in the U.S. Treasury Hardest Hit Fund program.
Grant income increased by $81.6 million due to the receipt of Federal CDBG‐DR funds for funding of loans for Superstorm Sandy housing recovery.
Recovery of bad debt decreased by $41.8 million due to the $63 million recovery of one of the Agency’s largest loans, Waterford Towers, in 2013.

NEW JERSEY HOUSING AND MORTGAGE FINANCE AGENCY MANAGEMENT’S DISCUSSION AND ANALYSIS
December 31, 2014
12
Summary of Operating Expenses for the Years Ended
December 31, 2014 and 2013 (In Thousands)
% Change
2014 2013 2014/2013
Operating expenses:Interest 99,769$ 115,634$ ‐13.7%Insurance costs 787 807 ‐2.5%Servicing fees and other 17,809 9,360 90.3%Salaries and related benefits 30,517 33,446 ‐8.8%Professional services and financing costs 3,114 9,082 ‐65.7%General and administrative expenses 7,407 11,581 ‐36.0%Grant expense 96,869 16,323 493.5%Program expense 76,841 101,012 ‐23.9%Provision for loan losses 31,355 75,101 ‐58.2%
Total operating expenses 364,468$ 372,346$ ‐2.1%
Although total operating expenses remained relatively flat, the following significant fluctuations occurred:
Interest expense decreased by $15.9 million due to the early redemption of bonds and low interest rates on variable rate debt.
Servicing fees increased by $8.4 million due to the continued escrow shortages on delinquent single family loans.
Professional services and financing costs decreased by $6.0 million primarily due to the decrease of approximately $5 million in bond costs of issuance as $384.7 in bonds were issued in 2013, compared to $54.6 million in 2014.
Grant expense increased by $80.5 million due the disbursement of the Superstorm Sandy CDBG funds.
Program expense decreased by $24.2 million as the loan production for U.S. Department of Treasury Hardest Hit Funds decreased from 3,167 new loans in 2013 to 741 loans in 2014.
Provision for loan losses decreased by $43.7 million due the advancement of single family foreclosures through the court system, a decrease in the reserves on single family loans, and more aggressive recovery efforts on delinquent multi‐family loans.

NEW JERSEY HOUSING AND MORTGAGE FINANCE AGENCY MANAGEMENT’S DISCUSSION AND ANALYSIS
December 31, 2014
13
Debt Administration At December 31, 2014, the Agency had $2.1 billion of bond principal outstanding, net of deferral on refunding, discount and premium, a decrease of 8.1% over the prior year. The following table summarizes the Agency’s bonds payable outstanding at December 31, 2014 and 2013, and the changes in bonds payable. Dollars are in thousands.
% Change
2014 2013 2014/2013
Bonds payable, net 2,149,050$ 2,338,536$ ‐8.1%
Additional information about the Agency’s debt is presented in Note 8 of the financial statements. Single Family Programs The Agency provides a variety of residential mortgage financing programs that primarily serve low to moderate and middle‐income first time homebuyers and homebuyers purchasing in certain designated urban areas. Traditionally, the programs are funded with Mortgage Revenue Bond proceeds. No Single Family bonds were issued in 2014. Multi‐Family Programs In June 2014 the Agency issued $27.8 million of Multi‐family revenue bonds 2014 Series A & B and $51.2 million of 2014 Series C & D which are purchase draw down bonds. These bonds will finance 18 new money rental housing developments providing 1,076 housing units. Economic Factors
The Agency is a self‐supporting entity and is not funded by the general taxing authority of the State of New Jersey. As the State’s leader in affordable housing certain market/economic factors can have an impact on the Agency’s operations.
Trends in single family mortgage rates‐ Although the Federal Reserve continued to apply downward pressure on interest rates, the Agency’s traditional cost of funds in the mortgage revenue bond (MRB) market remained relatively high, limiting the Agency’s ability to lend profitably at competitive interest rates. This market anomaly caused a significant decline in single family loan production. As an alternative way to remain relevant and profitable in the single family mortgage market, the Agency is in the process of implementing a mortgage backed security (MBS) funding program, which will allow the Agency to sell whole loans for securitization into Ginnie Mae mortgage backed securities.
NEW JERSEY HOUSING AND MORTGAGE FINANCE AGENCY MANAGEMENT’S DISCUSSION AND ANALYSIS
December 31, 2014
14
Trends in foreclosure processing‐ New Jersey is a judicial state and as such all foreclosures must be processed through the court system. In 2010, the state, by way of an Administrative Order, imposed a moratorium on residential foreclosures, which expired in 2012. The expiration of the moratorium caused a backlog in the court proceedings which caused our delinquencies to remain high, pending judicial foreclosure. This backlog continues to slow the foreclosure process.
Trends in home prices‐ The Agency experienced an increase in REO losses in 2014. This was a result of increases in the number of properties to be sold in the portfolio coupled with the sale of homes at reduced prices. New Jersey has one of the highest foreclosure rates in the country, which has resulted in a growing inventory of for sale homes, contributing further to the overall decline in sale prices.
Continued Effect of Superstorm Sandy‐ The recovery from Superstorm Sandy continues to influence our multifamily production. Community Development Block Grant Funds (CDBG) provided much needed subsidy for the development of multifamily housing in the hardest hit counties served by the Agency.
Trends in the Agency’s credit ratings‐ The cost of capital available to the Agency increases as credit ratings trend downward. In 2014 Moody’s Investor Services downgraded both of the Agency’s single family bond resolutions. Standard and Poor’s Rating Services upgraded the Multifamily Housing Revenue Bonds resolution ratings during the same period.
Contacting The Agency’s Financial Management
This financial report is designed to provide a general overview of the Agency’s business, financial position,
and fiscal accountability for the funds it generates and receives. If you have questions about any information
in this report, contact the Finance Division of the New Jersey Housing and Mortgage Finance Agency.

15
BASIC FINANCIAL STATEMENTS
NEW JERSEY HOUSING AND MORTGAGE FINANCE AGENCY STATEMENT OF NET POSITION
December 31, 2014 (With Comparative Summarized Financial Information as of December 31, 2013)
(In Thousands)
16
Single‐Family Multi‐Family
Mortgage Housing General Interfund Component Component Fund Subtotal Eliminations 2014 2013
CURRENT ASSETS
Cash and cash equivalents ‐$ ‐$ 55,755$ 55,755$ ‐$ 55,755$ 52,428$
Restricted cash and cash equivalents 89,354 205,886 416,467 711,707 ‐ 711,707 686,681
Investments ‐ ‐ 9,919 9,919 ‐ 9,919 15,089
Restricted investments ‐ 12,699 ‐ 12,699 ‐ 12,699 54,037
Accrued interest receivable on investments 414 770 1,234 2,418 ‐ 2,418 2,906
Mortgage loans receivable, net 29,283 37,848 20,428 87,559 ‐ 87,559 92,984
Supplemental mortgages and other loans, net ‐ ‐ 1,008 1,008 ‐ 1,008 958
Fees and other charges receivable ‐ ‐ 1,797 1,797 ‐ 1,797 1,201
Due from loan services and insurers 3,092 ‐ 83 3,175 ‐ 3,175 2,807
Interfund allocation ‐ ‐ 2,924 2,924 (2,924) ‐ ‐
Other current assets 44,824 60 2,074 46,958 ‐ 46,958 24,084
Total current assets 166,967 257,263 511,689 935,919 (2,924) 932,995 933,175
NONCURRENT ASSETS
Investments ‐ ‐ 147,388 147,388 ‐ 147,388 262,800
Restricted investments 46,567 95,612 92,595 234,774 ‐ 234,774 139,825
Mortgage loans receivable, net 1,067,397 856,876 158,829 2,083,102 ‐ 2,083,102 2,252,944
Debt service arrears receivable, net 11,438 127 4,397 15,962 ‐ 15,962 18,419
Interest receivable on construction advances and mortgages ‐ ‐ 1,675 1,675 ‐ 1,675 1,675
Supplemental mortgages and other loans, net 345 48,288 214,421 263,054 ‐ 263,054 270,428
Real estate owned 6,748 49,635 13,976 70,359 ‐ 70,359 64,317
Real estate held for redevelopment ‐ ‐ ‐ ‐ ‐ ‐ ‐
Capital assets, net ‐ ‐ 9,028 9,028 ‐ 9,028 9,650
Derivative instrument ‐ ‐ ‐ ‐ ‐ ‐ 7,553
Other noncurrent assets ‐ 90 66 156 ‐ 156 152
Total non‐current assets 1,132,495 1,050,628 642,375 2,825,498 ‐ 2,825,498 3,027,763
TOTAL ASSETS 1,299,462 1,307,891 1,154,064 3,761,417 (2,924) 3,758,493 3,960,938
DEFERRED OUTFLOWS OF RESOURCES
Accumulated decrease in fair value of hedging derivatives 22,757$ 67,866$ ‐$ 90,623$ ‐$ 90,623$ 90,462$
Business‐Type Activities
Bonds and Obligation Funds
Primary Government

NEW JERSEY HOUSING AND MORTGAGE FINANCE AGENCY STATEMENT OF NET POSITION (CONTINUED)
December 31, 2014 (With Comparative Summarized Financial Information as of December 31, 2013)
(In Thousands)
The accompanying notes are an integral part of these financial statements. 17
Single‐Family Multi‐Family
Mortgage Housing General InterfundComponent Component Fund Subtotal Eliminations 2014 2013
CURRENT LIABILITIES
Bonds and obligations, net 34,050$ 44,570$ ‐$ 78,620$ ‐$ 78,620$ 94,535$
Accrued interest payable on bonds and obligations 10,552 7,399 ‐ 17,951 ‐ 17,951 19,411
Subsidy payments received in advance ‐ ‐ 4,575 4,575 ‐ 4,575 4,590
Advances from State of NJ for bond and housing assistance ‐ ‐ 16,836 16,836 ‐ 16,836 19,777
Other current liabilities 1,411 74 5,181 6,666 ‐ 6,666 9,735
Interfund allocation ‐ 2,924 ‐ 2,924 (2,924) ‐ ‐
Mortgagor escrow deposits ‐ 1,124 227,668 228,792 ‐ 228,792 228,841
Total current liabilities 46,013 56,091 254,260 356,364 (2,924) 353,440 376,889
NONCURRENT LIABILITIES
Bonds and obligations, net 1,123,503 946,927 ‐ 2,070,430 ‐ 2,070,430 2,244,001
Minimum escrow requirement ‐ 7,245 906 8,151 ‐ 8,151 8,776
Funds held in trust for mortgagors ‐ 53,839 280,488 334,327 ‐ 334,327 325,315
Other non‐current liabilities ‐ 2,148 5,745 7,893 ‐ 7,893 7,512
OPEB liability ‐ ‐ 63,107 63,107 ‐ 63,107 59,215
Derivative instrument 22,757 68,583 ‐ 91,340 ‐ 91,340 91,406
Unearned revenue ‐ ‐ 47,607 47,607 ‐ 47,607 70,774
Total noncurrent liabilities 1,146,260 1,078,742 397,853 2,622,855 ‐ 2,622,855 2,806,999
Total liabilities 1,192,273 1,134,833 652,113 2,979,219 (2,924) 2,976,295 3,183,888
DEFERRED INFLOWS OF RESOURCES
Commitment fees 932 ‐ 932 ‐ 932 1,127
Accrued increase in fair value of hedging derivatives ‐ ‐ ‐ ‐ ‐ ‐ 7,879
Total deferred inflows 932 ‐ ‐ 932 ‐ 932 9,006
NET POSITION (DEFICIT)
Net investment in capital assets ‐ ‐ 9,028 9,028 ‐ 9,028 9,650
Restricted under bond and obligation resolutions 129,014 240,924 ‐ 369,938 ‐ 369,938 320,423
Restricted for Special Needs Housing ‐ ‐ 10,945 10,945 ‐ 10,945 35,776
Unrestricted ‐ ‐ 481,978 481,978 ‐ 481,978 492,657
TOTAL NET POSITION (DEFICIT) 129,014$ 240,924$ 501,951$ 871,889$ ‐$ 871,889$ 858,506$
Business‐Type Activities
Bonds and Obligation Funds
Primary Government
NEW JERSEY HOUSING AND MORTGAGE FINANCE AGENCY STATEMENT OF REVENUES, EXPENSES AND CHANGES IN NET POSITION
Year Ended December 31, 2014 (With Comparative Summarized Financial Information for the Year Ended December 31, 2013)
(In Thousands)
The accompanying notes are an integral part of the financial statements. 18
Single‐Family Multi‐Family
Mortgage Housing GeneralComponent Component Fund 2014 2013
OPERATING REVENUES
Interest income on mortgage loans 62,413$ 58,759$ 6,556$ 127,728$ 122,742$
Fees and charges ‐ 6,547 29,661 36,208 34,674
Program income ‐ ‐ 79,904 79,904 111,183
Grant income ‐ ‐ 90,375 90,375 8,815
Recovery of bad debt 6,704 23,654 ‐ 30,358 72,138
Gain on derivative ‐ 553 ‐ 553 118
Other income ‐ net 115 1,026 4,163 5,304 10,776
Total operating revenues 69,232 90,539 210,659 370,430 360,446
OPERATING EXPENSES
Interest and amortization of bond premium and discounts 48,573 50,822 374 99,769 115,634
Insurance costs ‐ 184 603 787 807
Servicing fees and other 3,568 270 13,971 17,809 9,360
Salaries and related benefits ‐ 3,450 27,067 30,517 33,446
Professional services and financing costs 446 942 1,726 3,114 9,082
General and administrative expenses 32 1,482 5,893 7,407 11,581
Grant expense ‐ ‐ 96,869 96,869 16,323
Program expense ‐ ‐ 76,841 76,841 101,012
Provision for loan losses 11,929 16,690 2,736 31,355 75,101
Total operating expenses 64,548 73,840 226,080 364,468 372,346
Operating income (loss) 4,684 16,699 (15,421) 5,962 (11,900)
NONOPERATING REVENUES (EXPENSES)
Investment income 2,184 4,949 4,199 11,332 9,220
Loss on sale of real estate owned (3,685) ‐ (226) (3,911) (1,497)
Total nonoperating revenues, net (1,501) 4,949 3,973 7,421 7,723
Income (loss) before transfers 3,183 21,648 (11,448) 13,383 (4,177)
TRANSFERS 25,000 (316) (24,684) ‐ 387
INCREASE (DECREASE) IN NET POSITION 28,183 21,332 (36,132) 13,383 (3,790)
NET POSITION, BEGINNING OF YEAR 100,831 219,592 538,083 858,506 862,296
NET POSITION, END OF YEAR 129,014$ 240,924$ 501,951$ 871,889$ 858,506$
Business‐Type Activities
Bonds and Obligation Funds
Primary Government
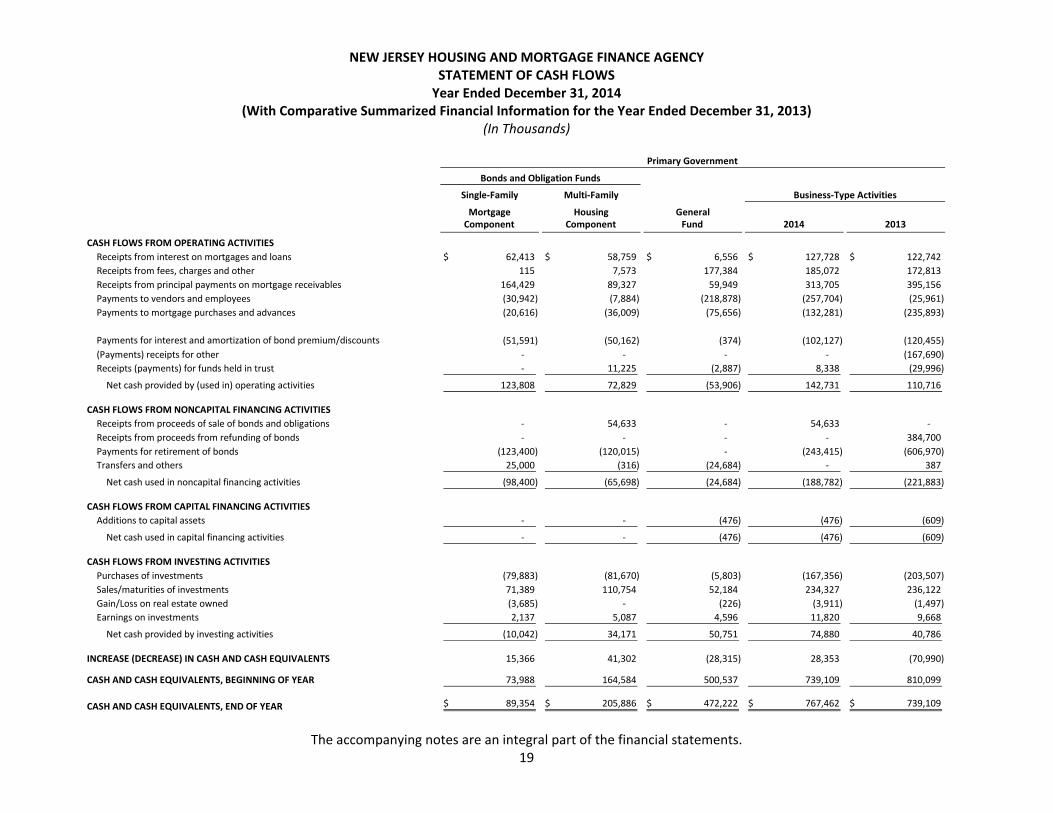
NEW JERSEY HOUSING AND MORTGAGE FINANCE AGENCY STATEMENT OF CASH FLOWS Year Ended December 31, 2014
(With Comparative Summarized Financial Information for the Year Ended December 31, 2013) (In Thousands)
The accompanying notes are an integral part of the financial statements. 19
Single‐Family Multi‐Family
Mortgage Housing GeneralComponent Component Fund 2014 2013
CASH FLOWS FROM OPERATING ACTIVITIES
Receipts from interest on mortgages and loans 62,413$ 58,759$ 6,556$ 127,728$ 122,742$
Receipts from fees, charges and other 115 7,573 177,384 185,072 172,813
Receipts from principal payments on mortgage receivables 164,429 89,327 59,949 313,705 395,156
Payments to vendors and employees (30,942) (7,884) (218,878) (257,704) (25,961)
Payments to mortgage purchases and advances (20,616) (36,009) (75,656) (132,281) (235,893)
Payments for interest and amortization of bond premium/discounts (51,591) (50,162) (374) (102,127) (120,455)
(Payments) receipts for other ‐ ‐ ‐ ‐ (167,690)
Receipts (payments) for funds held in trust ‐ 11,225 (2,887) 8,338 (29,996)
Net cash provided by (used in) operating activities 123,808 72,829 (53,906) 142,731 110,716
CASH FLOWS FROM NONCAPITAL FINANCING ACTIVITIES
Receipts from proceeds of sale of bonds and obligations ‐ 54,633 ‐ 54,633 ‐
Receipts from proceeds from refunding of bonds ‐ ‐ ‐ ‐ 384,700
Payments for retirement of bonds (123,400) (120,015) ‐ (243,415) (606,970)
Transfers and others 25,000 (316) (24,684) ‐ 387
Net cash used in noncapital financing activities (98,400) (65,698) (24,684) (188,782) (221,883)
CASH FLOWS FROM CAPITAL FINANCING ACTIVITIES
Additions to capital assets ‐ ‐ (476) (476) (609)
Net cash used in capital financing activities ‐ ‐ (476) (476) (609)
CASH FLOWS FROM INVESTING ACTIVITIES
Purchases of investments (79,883) (81,670) (5,803) (167,356) (203,507)
Sales/maturities of investments 71,389 110,754 52,184 234,327 236,122
Gain/Loss on real estate owned (3,685) ‐ (226) (3,911) (1,497)
Earnings on investments 2,137 5,087 4,596 11,820 9,668
Net cash provided by investing activities (10,042) 34,171 50,751 74,880 40,786
INCREASE (DECREASE) IN CASH AND CASH EQUIVALENTS 15,366 41,302 (28,315) 28,353 (70,990)
CASH AND CASH EQUIVALENTS, BEGINNING OF YEAR 73,988 164,584 500,537 739,109 810,099
CASH AND CASH EQUIVALENTS, END OF YEAR 89,354$ 205,886$ 472,222$ 767,462$ 739,109$
Bonds and Obligation Funds
Business‐Type Activities
Primary Government

NEW JERSEY HOUSING AND MORTGAGE FINANCE AGENCY STATEMENT OF CASH FLOWS (CONTINUED)
Year Ended December 31, 2014 (With Comparative Summarized Financial Information for the Year Ended December 31, 2013)
(In Thousands)
The accompanying notes are an integral part of the financial statements. 20
Single‐Family Multi‐Family
Mortgage Housing GeneralComponent Component Fund 2014 2013
RECONCILIATION OF OPERATING INCOME (LOSS) TO NET CASH
PROVIDED BY (USED IN) OPERATING ACTIVITIES
Operating income (loss) 4,684$ 16,699$ (15,421)$ 5,962$ (11,900)$
Adjustments to reconcile operating income (loss) to net cash
provided by (used in) operating activities:
Depreciation expense ‐ ‐ 1,098 1,098 1,000
Provision for loan losses 11,929 16,690 2,736 31,355 75,101
Amortization of premium and discounts (774) 70 ‐ (704) (244)
Effects of changes in operating assets and liabilities:
Mortgage loans receivable, net 140,508 29,663 (15,708) 154,463 83,466
Fees and other charges receivable ‐ ‐ (596) (596) (229)
Due from loan servicers and insurers (369) ‐ 1 (368) 631
Deferred charges ‐ bond issuance costs, net ‐ ‐ ‐ ‐
Deferred outflow of resources ‐ ‐ ‐ ‐
Other assets and real estate owned (25,192) (2,253) (2,241) (29,686) (7,407)
Due to/from other funds (1,734) (151) 1,884 (1) 24
Accrued interest payable on bonds (2,049) 589 (1,460) (4,577)
Advance from the State of New Jersey ‐ ‐ (2,941) (2,941) (736)
Funds held in trust for mortgagor ‐ 13,489 (4,477) 9,012 (39,895)
Minimum escrow requirement ‐ (613) (12) (625) (1,025)
Mortgagor escrow deposits ‐ (1,651) 1,602 (49) 10,924
Subsidy payments received in advance ‐ ‐ (15) (15) 1,432
Unearned revenue ‐ ‐ (23,167) (23,167) 6,962
OPEB liability ‐ ‐ 3,892 3,892 7,485
Interest rate swap (195) (553) ‐ (748) 2,397
Other liabilites (3,000) 850 (541) (2,691) (12,693)
NET CASH PROVIDED BY (USED IN) OPERATING ACTIVITIES 123,808$ 72,829$ (53,906)$ 142,731$ 110,716$
Bonds and Obligation Funds
Business‐Type Activities
Primary Government

NEW JERSEY HOUSING AND MORTGAGE FINANCE AGENCY NOTES TO FINANCIAL STATEMENTS
December 31, 2014 (In Thousands)
21
NOTE 1 – SUMMARY OF SIGNIFICANT ACCOUNTING POLICIES Description of the Agency Authorizing Legislation and Organization – The New Jersey Housing and Mortgage Finance Agency (the Agency), which is established in, but not part of, the Department of Community Affairs, is a body, corporate and politic, created by the New Jersey Housing and Mortgage Finance Agency Law of 1983, constituting Chapter 530, Laws of New Jersey, 1983 (the Act), which combined the New Jersey Housing Finance Agency and the New Jersey Mortgage Finance Agency into a single agency. The initial legislation and subsequent amendment grant the Agency the power to issue debt to finance the construction and rehabilitation of housing projects for families of low and moderate income by providing mortgage loans to qualified housing sponsors or to increase the funds available for residential mortgage and rehabilitation or improvement loans. In addition, the Agency is authorized to make loans to boarding home operators for life safety improvements. The Agency is governed by nine members: the Commissioner of the Department of Community Affairs who serves as Chair, the State Treasurer, the Attorney General, the Commissioner of Banking and Insurance, and the Commissioner of the Department of Human Services who are members of the New Jersey Housing and Mortgage Finance Agency ex officio, and four persons appointed by the Governor with the advice and consent of the State Senate for terms of three years. Certain bonds and other obligations issued under the provisions of the Act are general obligations of the Agency to which its full faith and credit are pledged. Certain mortgages issued from the proceeds of Multi‐Family Housing Revenue Bonds are insured by the Federal Housing Administration. The Agency has no taxing power; however, certain bonds issued are separately secured, special and limited obligations of the Agency. See Note 9 to the financial statements for a more detailed discussion of the Agency’s bonds, notes and obligations. Federal Subsidy Programs – Many of the Agency‐financed Multi‐Family Housing projects (the projects) have entered into subsidy contracts with the U.S. Department of Housing and Urban Development (HUD) under Section 236 of the National Housing Act, as amended, or under Section 8 of the United States Housing Act of 1937, as amended (Section 8). The subsidies, paid to the Agency for the account of the respective projects, have been pledged, under the terms of the bond resolutions, for the security of the bondholders. The Section 8 program provides for payment of housing assistance payments to or for the account of the owners of projects assisted under such program. The housing assistance payments represent the difference between the total contract rents (an average of 141% of fair market rents as determined by HUD) for such developments and the eligible tenants’ rental payments, which are up to 30% of each such tenant’s adjusted income. The housing assistance payments, as adjusted from time to time by HUD to reflect changing economic conditions and subject to the limitations of the Section 8 program, together with the tenants’ rental payments, are used to pay all operating costs of the project and debt service on the project’s mortgage.
NEW JERSEY HOUSING AND MORTGAGE FINANCE AGENCY NOTES TO FINANCIAL STATEMENTS
December 31, 2014 (In Thousands)
22
NOTE 1 – SUMMARY OF SIGNIFICANT ACCOUNTING POLICIES (CONTINUED)
Description of the Agency (Continued)
The Section 8 Housing Assistance Payments (HAP) received by the Projects amounted to approximately $449,247 for the year ended December 31, 2014.
The Section 236 program provides for interest reductions on mortgages of projects assisted under the program. HUD subsidizes the difference between the actual amortization schedule on the mortgages and an amortization schedule based upon a 1% interest rate. Several Section 236 projects also receive additional rental assistance for eligible tenants. The payments represent the difference between contract rent (as defined above) and the tenants’ eligible rental payments.
The Section 236 Interest Reduction Payments (IRP) received by the Agency amounted to approximately $16,622 for the year ended December 31, 2014.
Reporting Entity
In determining how to define the reporting entity, management has considered all potential component units. The decision to include a component unit in the reporting entity was made by applying the criteria set forth in the Governmental Accounting Standards Board (GASB) Statement No. 61, The Financial Reporting Entity: Omnibus – an amendment of GASB Statements No. 14 and No. 34. These criteria include manifestation of oversight responsibility including financial accountability, imposition of will, financial benefit to or burden on a primary organization, and financial accountability as a result of fiscal dependency.
The Agency is a component unit of the State of New Jersey. The Agency’s financial statements are discretely presented as part of the State’s financial statements.
The Agency determined based on the criteria above that the component unit described below should be identified as a blended component unit of the Agency.
ABC
On April 17, 1997, the Board Members of the Agency approved the formation of a wholly‐owned subsidiary corporation, the A Better Camden Corporation (ABC). The Board consists of four State Directors and three Camden Directors as follows: The Commissioner of the New Jersey Department of Community Affairs, ex officio, or his or her designee; the Executive Director of the Agency, ex officio, or his or her designee; two employees of the Agency appointed by, and serving at the pleasure of the Executive Director of the Agency; the Mayor of the City of Camden, ex officio, or his or her designee; the Executive Director of the Camden Redevelopment Agency, ex officio, or his or her designee; and one resident of Camden appointed by a majority of the other directors to serve for a term of two years. ABC was formed to stimulate and encourage the construction, rehabilitation and improvement of adequate and affordable housing in Camden, particularly for persons of low and moderate income.
The activity and balances of ABC are immaterial to the Agency as a whole and therefore, the Agency has chosen not to include ABC in their financial statement. Separate financial statements are issued for ABC and can be obtained by contacting the New Jersey Housing and Mortgage Finance Agency, 637 South Clinton Avenue, P.O. Box 18550, Trenton, New Jersey 08650‐2085.
NEW JERSEY HOUSING AND MORTGAGE FINANCE AGENCY NOTES TO FINANCIAL STATEMENTS
December 31, 2014 (In Thousands)
23
NOTE 1 – SUMMARY OF SIGNIFICANT ACCOUNTING POLICIES (CONTINUED) Basis of Accounting The financial statements of the Agency are reported using the economic resources measurement focus and the accrual basis of accounting. Revenues are recorded when earned, regardless of when the cash flow takes place. Operating costs and expenses are charged to expense as incurred. The Agency is required to follow all statements of the GASB. GASB Statement No. 62, Codification of Accounting and Financial Reporting Guidance Contained in Pre‐November 30, 1989 FASB and AICPA Pronouncements (GASB 62), was issued to incorporate FASB and AICPA guidance into GASB authoritative literature. Prior Year Comparative Financial Information The basic financial statements include certain prior year summarized comparative information that is not at the level of detail required for a presentation in conformity with GAAP. Accordingly, such information should be read in conjunction with the Agency’s financial statements for the year ended December 31, 2013, from which the summarized information was derived. Descriptions of Funds The accounts of the Agency are organized on the basis of separate enterprise funds, each of which is considered to be a separate accounting entity with a separate set of self‐balancing accounts that comprise its assets, deferred outflows, liabilities, deferred inflows, net position, and revenues and expenses. Within each fund there are accounts required by the respective bond resolutions. The Agency reports all funds as major funds. The following is a description of each fund: General Fund – The General Fund is utilized to record transactions which are not directly related to a specific bond resolution. All Agency expenses are recorded in this fund except provisions for potential loan losses, and specific program expenses which are charged to the loan‐related funds. Multi‐Family Program – The Multi‐Family Program transactions relate to the construction, rehabilitation and permanent financing of multi‐family rental housing developments generally designed for persons and families of low and moderate income or the elderly. The Multi‐Family Program also provides funds for the bridge loan program. This program provides funds to multi‐family construction projects to be used as owner’s equity. These funds assist the construction project to finance pre‐construction costs. Assets under the bond resolution are restricted and are not available for any other purpose other than as provided. Single Family Program – The Single Family Program transactions relate to the purchase of mortgage loans for owner‐occupied single‐family residences for persons and families of low and moderate income. Assets under the bond resolution are restricted and are not available for any other purpose other than as provided.
NEW JERSEY HOUSING AND MORTGAGE FINANCE AGENCY NOTES TO FINANCIAL STATEMENTS
December 31, 2014 (In Thousands)
24
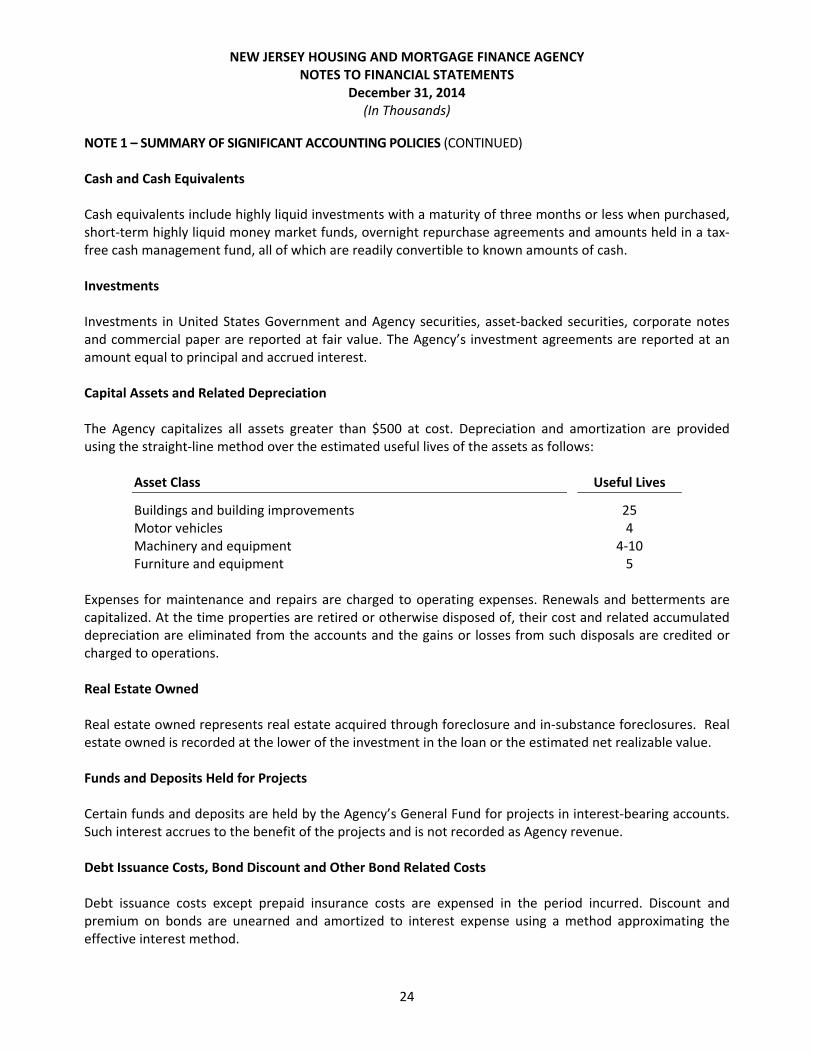
NOTE 1 – SUMMARY OF SIGNIFICANT ACCOUNTING POLICIES (CONTINUED) Cash and Cash Equivalents Cash equivalents include highly liquid investments with a maturity of three months or less when purchased, short‐term highly liquid money market funds, overnight repurchase agreements and amounts held in a tax‐free cash management fund, all of which are readily convertible to known amounts of cash. Investments Investments in United States Government and Agency securities, asset‐backed securities, corporate notes and commercial paper are reported at fair value. The Agency’s investment agreements are reported at an amount equal to principal and accrued interest. Capital Assets and Related Depreciation The Agency capitalizes all assets greater than $500 at cost. Depreciation and amortization are provided using the straight‐line method over the estimated useful lives of the assets as follows:
Asset Class Useful Lives
Buildings and building improvements 25 Motor vehicles 4 Machinery and equipment 4‐10 Furniture and equipment 5
Expenses for maintenance and repairs are charged to operating expenses. Renewals and betterments are capitalized. At the time properties are retired or otherwise disposed of, their cost and related accumulated depreciation are eliminated from the accounts and the gains or losses from such disposals are credited or charged to operations. Real Estate Owned Real estate owned represents real estate acquired through foreclosure and in‐substance foreclosures. Real estate owned is recorded at the lower of the investment in the loan or the estimated net realizable value. Funds and Deposits Held for Projects Certain funds and deposits are held by the Agency’s General Fund for projects in interest‐bearing accounts. Such interest accrues to the benefit of the projects and is not recorded as Agency revenue. Debt Issuance Costs, Bond Discount and Other Bond Related Costs Debt issuance costs except prepaid insurance costs are expensed in the period incurred. Discount and premium on bonds are unearned and amortized to interest expense using a method approximating the effective interest method.

NEW JERSEY HOUSING AND MORTGAGE FINANCE AGENCY NOTES TO FINANCIAL STATEMENTS
December 31, 2014 (In Thousands)
25
NOTE 1 – SUMMARY OF SIGNIFICANT ACCOUNTING POLICIES (CONTINUED) Mortgage Loans Mortgage loans are stated at principal amounts outstanding, net of unearned discount. Interest income on first mortgage loans is accrued and credited to interest income as earned. The Agency is involved in foreclosure proceedings relating to both single and multi‐family mortgages. For single‐family mortgages, the Agency allows its outside servicers to represent them in Agency‐approved foreclosure proceedings. The Agency enacts foreclosure proceedings against Multi‐Family loans at the direction of its executive director with the approval of the Agency’s Board. The Agency is the first lien holder for all supplemental mortgages. Interest income on supplemental mortgages is not accrued, but is credited to income as collected. Allowance for Loan Losses Certain projects have not generated sufficient cash flow to meet both operating expenses and debt service payments as a result of delays in attaining full occupancy levels, rising operating costs, or a combination thereof. The Agency has developed programs designed to provide adequate cash flow for these projects by obtaining additional rental assistance subsidies from HUD, rent increases, additional contributions by limited‐dividend sponsors, the State of New Jersey Bond and Housing Assistance Funds and the Agency’s General Fund. In addition, the Single Family home owners may face similar cash flow issues causing loans to become uncollectible. The Agency has provided allowances for loan losses aggregating $361,367 as of December 31, 2014 against mortgage loans receivable, debt service arrears receivable, supplemental mortgages, other loans, and fees and charges including provision for negative cash flows and cost overruns for these projects. The allowance is an amount that management believes will be adequate to absorb possible losses on existing loans that may become uncollectible, based on evaluations of the collectability of the loans. The evaluations take into consideration such factors as changes in the nature and volume of the loan portfolio, overall portfolio quality, review of specific problem loans and current economic conditions that may affect the borrowers’ ability to pay. Economic conditions may result in the necessity to change the allowance quickly in order to react to deteriorating financial conditions of the Agency’s borrowers. As a result, additional provisions on existing loans may be required in the future if borrowers’ financial conditions deteriorate or if real estate values decline. Advances from the State of New Jersey for Bond and Housing Assistance Pursuant to the provisions of agreements with the State of New Jersey Department of Community Affairs, the Agency has received funds from the 1968 and 1976 State of New Jersey General Obligation Bond Assistance Funds. These funds have been pledged as security for the bonds of certain bond resolutions and to provide supplemental financing to certain housing projects (see Note 8). Advances from the State of New Jersey for Affordable Housing Pursuant to the provisions of an agreement with the State of New Jersey Department of Community Affairs, the Agency has received funds to facilitate the building of low income projects. The amount available for the program is $3,081 as of December 31, 2014 which is included in restricted cash and cash equivalents.

NEW JERSEY HOUSING AND MORTGAGE FINANCE AGENCY NOTES TO FINANCIAL STATEMENTS
December 31, 2014 (In Thousands)
26
NOTE 1 – SUMMARY OF SIGNIFICANT ACCOUNTING POLICIES (CONTINUED) Minimum Escrow Requirement In accordance with the bond resolutions and/or deed and regulatory agreements, substantially all permanently financed projects are required to deposit with the Agency one month’s principal and interest on their mortgage loans as security against the late payment of subsequent remittances. Unearned Revenue Unearned revenue represents the cumulative amount by which pass‐through revenues exceed expenses. Deferred Outflows and Deferred Inflows State and local governments enter into transactions that result in the consumption or acquisition of net assets in one period that are applicable to future periods. GASB Statement No. 65, Items Previously Reported as Assets and Liabilities identifies those consumptions or acquisitions as deferred outflows of resources and deferred inflows of resources, respectively, and distinguishes them from assets and liabilities. As such, these transactions are reported on the Statement of Net Position. Net Position Net position comprises the excess of revenues over expenses from operating income, non‐operating revenues, expenses and capital contributions. Net position is classified in the following three components: Net investment in Capital Assets – This component of net position consists of capital assets, net of accumulated depreciation and reduced by the outstanding balances of any bonds, mortgages, notes or other borrowings that are attributable to the acquisition, construction or improvement of those assets, if any. Restricted – Net position is reported as restricted when constraints placed on net position use either: (1) externally imposed by creditors, grantors, contributors, or laws or regulations of other governments, or (2) imposed by law through constitutional provisions or enabling legislation. Unrestricted – This component of net position consists of assets that do not meet the definition of restricted or net investment in capital assets. This component includes assets that may be designated for specific purposes by the Board.
When both restricted and unrestricted resources are available for use, it is the Agency’s policy to use restricted resources first and unrestricted resources as needed.

NEW JERSEY HOUSING AND MORTGAGE FINANCE AGENCY NOTES TO FINANCIAL STATEMENTS
December 31, 2014 (In Thousands)
27
NOTE 1 – SUMMARY OF SIGNIFICANT ACCOUNTING POLICIES (CONTINUED) Operating and Non‐Operating Revenues and Expenses Operating revenues consist primarily of all revenues derived from interest income on mortgage loans, fees and charges on mortgages and loans issued and gains on the sale of real estate owned. Investment income, which consists of interest income earned on various interest‐bearing accounts and on investments in debt securities is reported as non‐operating revenues. Operating expenses include general and administrative expenses of the Agency; salaries and benefits; costs and expenses incurred in connection with the issuance and sale of certain bonds and notes; fees and expenses of trustees and depository and paying agents; and other costs associated with the Agency’s various loan programs. Non‐operating expenses principally include loss on early extinguishment of debt. Interest Rate Swaps The Agency enters into various interest rate swaps in order to manage risks associated with interest on its bond portfolio. Tax Status The Agency is exempt from federal income taxes under the Internal Revenue Code Section 115 and from state income taxes under N.J.S.A. 27‐25‐16. Accordingly, no provision is recorded for federal and state income taxes. Reclassifications Certain reclassifications have been made to prior year summarized balances in order to conform to current year presentation. The reclassifications did not affect net position or changes therein. New Accounting Pronouncements In fiscal year 2014, the Agency implemented GASB Statement No. 70, Accounting and Financial Reporting for Nonexchange Finance Guarantees. This Statement requires a government that extends a nonexchange financial guarantee to recognize a liability when qualitative factors and historical data, if any, indicate that it is more likely than not that the government will be required to make a payment on the guarantee. The implementation of this Standard did not impact the Agency’s financial statement. NOTE 2 – EARLY EXTINGUISHMENT OF DEBT During the year ended December 31, 2014, as a result of the prepayment and refinancing of certain mortgages, the Agency repurchased or redeemed, prior to their scheduled maturity, the principal amount of certain of its bonds, totaling approximately $150,420.
NEW JERSEY HOUSING AND MORTGAGE FINANCE AGENCY NOTES TO FINANCIAL STATEMENTS
December 31, 2014 (In Thousands)
28
NOTE 3 – INVESTMENTS AND DEPOSITS Investment Policy – Agency General Fund The Agency has established an investment policy, which pertains to assets of the Agency such as the General Fund assets, which are held outside of the Agency’s Bond Resolutions. The primary investment objectives of the Agency’s investment activities are to preserve principal, meet liquidity needs, further purposes of the Agency and provide a suitable return in relationship to current market conditions and the established investment policy. The Agency’s investment policy includes guidelines as to liquidity and duration, eligible investments, concentration limits, credit quality and currency. The Agency’s General Fund cash and equivalents are managed by BlackRock pursuant to an agreement between the Agency and BlackRock. BlackRock has been instructed to follow the Agency’s aforementioned investment policy. The investment policy permits investments in obligations issued by U.S. Treasury or guaranteed by the U.S. government as well as obligations issued by or guaranteed by U.S. federal agencies, commercial paper, repurchase agreements having maximum maturities of seven days or less that are fully collateralized by U.S. government and/or agency securities, money market mutual funds and commercial bank obligations including time deposits, bank notes and bankers’ acceptances, certain AAA rated asset‐backed and mortgage‐backed securities, highly rated corporate bonds and bond obligations of the Agency. Investment Policy – Bond Resolutions The Agency’s Single Family and Multi Family Bond Resolutions govern the investment of assets and funds held under the Resolutions and, as such, establish permitted investments in which funds held under the Resolutions may be invested. The Agency currently has two Single Family Bond Resolutions and four Multi‐Family Resolutions, all of which govern the types of investments in which monies held under each resolution may be invested. Generally, the Agency’s Bond Resolutions permit the deposit of funds with commercial banks and the investment of funds in time deposits and certificates of deposits, U.S. government obligations, obligations of certain U.S. Government Agencies or obligations that are guaranteed by the U.S. Government. Additionally, certain of the Agency’s Resolutions also permit the investment in money market funds with stipulated rating and maturity levels, as well as repurchase agreements, certain federal funds, commercial paper, bankers acceptances and funds of which the N.J. treasurer is custodian. Custodial Credit Risk Custodial credit risk is the risk that, in the event of a bank failure, the Agency’s deposits may not be returned to it. The Agency has no formal policy as to custodial credit risk related to cash and equivalents held outside of its Bond Resolutions. Certain of the Agency’s Bond Resolutions have varying provisions which relate to custodial credit risk including requirements that certain monies and certain deposits of funds held under Resolutions be insured by federal deposit insurance or collateralized or secured by the U.S. government, or U.S. government agency obligations. In some cases, the Trustee or paying agent is excluded from these requirements related to funds held by them in trust. In some cases certain of the Agency’s Bond Resolutions require that the holders (banks and other entities) of certain deposits have certain minimum long‐term or short‐term credit rating levels. All funds are deposited in public depositories protected from loss under the provisions of the Governmental Unit Deposit Protection Act (GUDPA).
NEW JERSEY HOUSING AND MORTGAGE FINANCE AGENCY NOTES TO FINANCIAL STATEMENTS
December 31, 2014 (In Thousands)
29
NOTE 3 – INVESTMENTS AND DEPOSITS (CONTINUED) Custodial Credit Risk (Continued) As of December 31, 2014, the Agency’s bank balance amounted to $292,776, of which $263,189 was uninsured and uncollateralized. New Jersey Cash Management Fund and Bank of America Cash Management Fund During the year, the Agency invested certain funds in the New Jersey Cash Management Fund. The Fund is governed by regulations of the State Investment Council, who prescribe standards designed to insure the quality of investments in order to minimize risk to the Fund’s participants. Investments with the New Jersey Cash Management Fund are not subject to custodial credit risk as defined above. The Fund does not have a credit rating. The Agency also utilizes Bank of America Cash Management Funds for certain project escrow accounts. These funds are invested in government securities and NJ municipal securities. At December 31, 2014, the Agency’s investment in Cash Management Funds amounted to $208,855. These amounts are included in cash and cash equivalents (unrestricted and restricted) on the Statement of Net Position. Investment Type and Interest Rate Risk Disclosure The Agency holds various investments, outside of the Bond Resolutions, within the Agency’s General Fund. As discussed, these investments are currently managed by BlackRock. In addition to the eligible investments permitted by the Agency’s Investment Policy discussed above, the aforementioned Investment Policy also permits corporate bonds, notes and medium term notes. Also permitted are asset backed securities, mortgage backed securities and collateralized mortgage obligations, however, these securities must be rated AAA by at least one of the national rating agencies. Equity investments in project‐specific housing and housing‐related developments which further the purposes of the Agency are also permitted with approval from the Agency Board. However, these investments may not exceed $10 million. Further, excluding the aforementioned equity investments, the Agency’s Investment Policy indicates that the average effective duration of the portfolio is not to exceed 2.5 years and the maximum effective duration of any individual security is not to exceed 6 years. In addition to those investments discussed above, certain of the Agency’s Bond Resolutions also permit guaranteed investment contracts or investment agreements, obligations or notes of certain U.S. government agencies which are not backed by the U.S. government, certain short‐term and long‐term debt providing the issuers fall within permissible rating categories, direct and general obligations of the State of New Jersey guaranteed by the State, obligations of states and municipalities which are fully secured by contributions contracts with the U.S. government, certain stripped U.S. Treasury securities, shares of open‐end, diversified investment companies having certain minimum credit ratings and Federal Housing Administration debentures.
NEW JERSEY HOUSING AND MORTGAGE FINANCE AGENCY NOTES TO FINANCIAL STATEMENTS
December 31, 2014 (In Thousands)
30
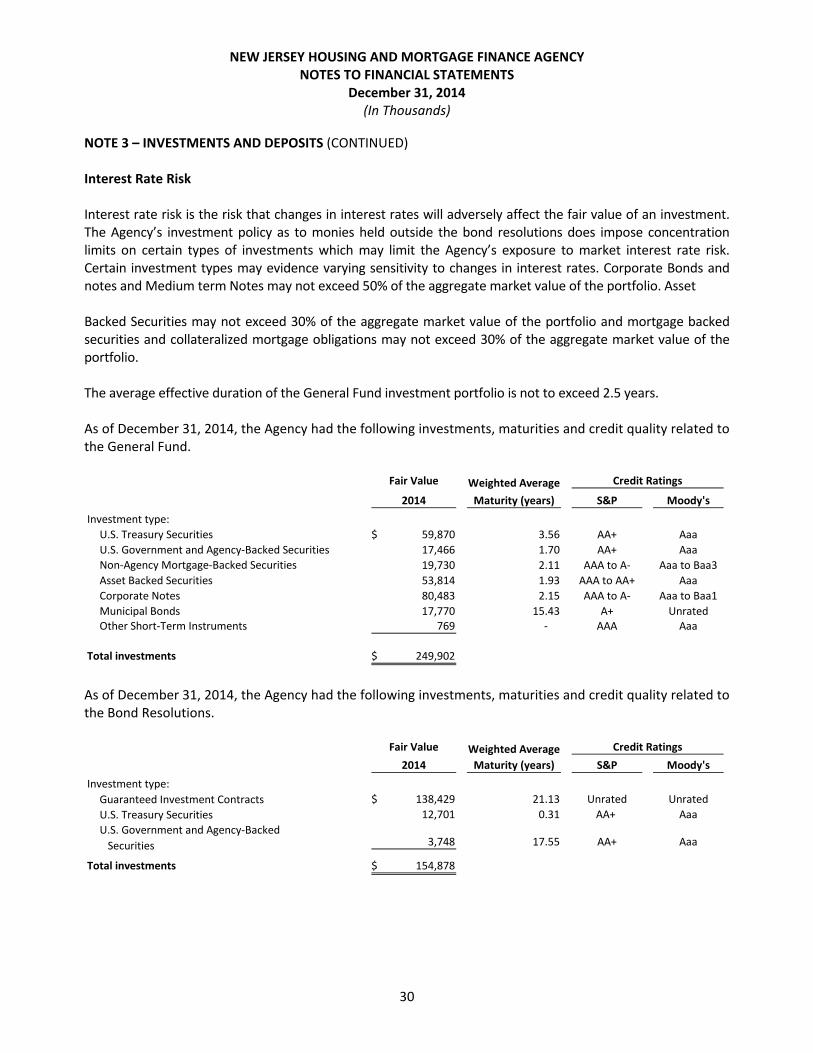
NOTE 3 – INVESTMENTS AND DEPOSITS (CONTINUED) Interest Rate Risk Interest rate risk is the risk that changes in interest rates will adversely affect the fair value of an investment. The Agency’s investment policy as to monies held outside the bond resolutions does impose concentration limits on certain types of investments which may limit the Agency’s exposure to market interest rate risk. Certain investment types may evidence varying sensitivity to changes in interest rates. Corporate Bonds and notes and Medium term Notes may not exceed 50% of the aggregate market value of the portfolio. Asset Backed Securities may not exceed 30% of the aggregate market value of the portfolio and mortgage backed securities and collateralized mortgage obligations may not exceed 30% of the aggregate market value of the portfolio. The average effective duration of the General Fund investment portfolio is not to exceed 2.5 years. As of December 31, 2014, the Agency had the following investments, maturities and credit quality related to the General Fund.
Fair Value Weighted Average
2014 Maturity (years) S&P Moody's
Investment type:
U.S. Treasury Securities 59,870$ 3.56 AA+ Aaa
U.S. Government and Agency‐Backed Securities 17,466 1.70 AA+ Aaa
Non‐Agency Mortgage‐Backed Securities 19,730 2.11 AAA to A‐ Aaa to Baa3
Asset Backed Securities 53,814 1.93 AAA to AA+ Aaa
Corporate Notes 80,483 2.15 AAA to A‐ Aaa to Baa1
Municipal Bonds 17,770 15.43 A+ UnratedOther Short‐Term Instruments 769 ‐ AAA Aaa
Total investments 249,902$
Credit Ratings
As of December 31, 2014, the Agency had the following investments, maturities and credit quality related to the Bond Resolutions.
Fair Value Weighted Average
2014 Maturity (years) S&P Moody's
Investment type:
Guaranteed Investment Contracts 138,429$ 21.13 Unrated Unrated
U.S. Treasury Securities 12,701 0.31 AA+ Aaa
U.S. Government and Agency‐Backed
Securities 3,748 17.55 AA+ Aaa
Total investments 154,878$
Credit Ratings

NEW JERSEY HOUSING AND MORTGAGE FINANCE AGENCY NOTES TO FINANCIAL STATEMENTS
December 31, 2014 (In Thousands)
31
NOTE 3 – INVESTMENTS AND DEPOSITS (CONTINUED)
Credit Risk
Credit risk is the risk that an issuer or counterparty to an investment will not fulfill its obligations. The Agency’s investment policy specifies minimum rating levels for certain types of eligible investments. Asset backed securities, mortgage backed securities and collateralized mortgage obligations must have a minimum rating of AAA. Further, the minimum short‐term debt rating of money market instruments or other instruments with maturities of less than one year is Tier Two while the minimum long‐term debt rating for all other instruments, excluding the permitted equity investments, is single A.
The Agency’s Bond Resolutions establish varying minimum rating levels for different types of investments. Generally, commercial paper must be rated in the highest rating category or A‐1 / P‐1 and money market funds must be rated in the highest rating category or in some cases must be rated at least the unenhanced rating on the bonds. Also, certain resolutions require that certain deposits or various short‐term investments or cash equivalents may only be held by providers in either the highest or two highest rating categories. In some cases, certain debt obligations and state obligations must be rated in either the highest or the two highest rating categories. The Agency’s guaranteed investment contracts which are permitted by certain of the Agency’s Bond Resolutions are not rated, however, the Bond Resolutions which allow guaranteed investment contracts require either that the provider of such contracts have a long‐term rating of double A or in some cases A‐1 if the agreement term is less than one year or be rated within the two highest credit rating categories by two national credit rating agencies, must not affect the rating of the bonds or must be rated at least the unenhanced rating on the bonds.
Concentration of Credit Risk
The Agency’s aforementioned investment policy does place limits on the amounts that may be invested in any one issuer relating to certain types of investments. There are no concentration limits on obligations of the U.S. government and U.S. federal agencies; however, obligations of all other issuers are limited such that those with any one issuer may not exceed 5% of the aggregate market value of the portfolio. As of December 31, 2014, the General Fund did not have any investments that represented 5% or more of total investments that were subject to concentration of credit risk.
The Agency also purchases U.S. Government securities from certain financial institutions under agreements whereby the seller has agreed to repurchase the securities at cost plus accrued interest. During the years ended December 31, 2014, the Agency did not invest in any repurchase agreements.
Although the bond resolutions do not impose such limits, the following table shows investments of the Bond Resolutions in issuers that represent 5% or more of total investments at December 31, 2014:
Issuer December 31, 2014
Natixis Funding Corp 125,513$ 61.40%
Monumental Life 27,127 13.30%
US Treasury 12,701 8.20%
GE Capital 11,770 5.80%
AEGON 10,717 5.00%

NEW JERSEY HOUSING AND MORTGAGE FINANCE AGENCY NOTES TO FINANCIAL STATEMENTS
December 31, 2014 (In Thousands)
32
NOTE 3 – INVESTMENTS AND DEPOSITS (CONTINUED)
Concentration of Credit Risk (Continued)
Pursuant to most bond resolutions, the Agency is required to maintain certain invested debt service reserves with the Trustees to fund potential deficiencies in principal and interest required to be paid in succeeding fiscal years. These debt service reserve investments for the Multi‐Family Program (funded by bond proceeds) are included in the restricted balances of $108,311 and aggregate a fair value of approximately $51,344 as of December 31, 2014. The debt service reserve for several of the Multi‐Family issues is called the Housing Finance Fund. The debt service reserve investments for the Single‐Family Program (funded by bond proceeds or contributed cash) are included in the restricted investment balances of $46,567 and had an aggregate fair value of approximately $16,104 as of December 31, 2014. In addition to the above investments, the debt service reserves may be satisfied with a Surety Bond issued by a qualified insurer. The Multi‐Family component had $25,558 and the Single‐Family component had $0 of Surety Bonds outstanding as of December 31, 2014.
Investment Income
Investment income is comprised of the following elements:
Interest Income – is the return on the original principal amount invested and the amortization of premium/discount on short‐term investments.
Unrealized Gain (Loss) on Investments – takes into account all changes in fair value that occurred during the year.
The Agency’s investment income for the year ended December 31, 2014 is:
2014
Interest income on investments 9,957$ Unrealized gain (loss) on investments 1,375
Total 11,332$
Single‐Family Mortgage Component
Mortgage loans held by the Single‐Family Mortgage Program of the Agency have stated interest rates and are secured by first liens on the related real property. The outstanding balances by type of loan as of December 31 are as follows:
2014
Mortgage loans receivable 1,107,075$ Allowance for loan losses (10,395)
Mortgage receivable ‐ net 1,096,680 Less current portion (29,283)
Long term portion 1,067,397$

NEW JERSEY HOUSING AND MORTGAGE FINANCE AGENCY NOTES TO FINANCIAL STATEMENTS
December 31, 2014 (In Thousands)
33
NOTE 4 – MORTGAGE LOANS RECEIVABLE
Multi‐Family Housing Component
The Multi‐Family Housing Component of the Agency’s mortgage loans receivable as of December 31 consisted of the following:
2014
Mortgage loans subject to subsidy contracts under Section 8
of the United States Housing Act 112,241$ Mortgage loans subject to subsidy contracts under Section 236
of the National Housing Act 143,648 Unsubsidized mortgage loans 701,103
Subtotal 956,992 Allowance for loan losses (22,067) Undisbursed mortgage loans (40,201)
Mortgage receivable ‐ net 894,724 Less current portion (37,848)
Long term portion 856,876$
The Multi‐Family Housing Component mortgage loans are repayable over terms originally up to 48 years and bear interest at rates from 0% to 13% per annum. Substantially all mortgage loans receivable are collateralized by first mortgages on the property of the housing sponsors and contain exculpatory clauses with respect to the liability of the principals of such housing sponsors.
Construction advances made from the proceeds of the sale of bonds and obligations are recorded as mortgage loans receivable. These funds are disbursed for construction costs, interest, carrying fees, working capital advances and other project‐related expenses. Upon substantial completion and occupancy of the project, amortization of the loan will commence.
General Fund Component
The General Fund mortgage loans receivable as of December 31 consisted of the following:
2014
Mortgage loans subject to subsidy contracts under Section 8
of the United States Housing Act 12,455$ Mortgage loans subject to subsidy contracts under Section 236
of the National Housing Act 21,928 Unsubsidized mortgage loans 258,100
Subtotal 292,483 Allowance for loan losses (78,621) Advanced (undisbursed) mortgage proceeds (34,605)
Mortgage receivable ‐ net 179,257 Less current portion (20,428)
Long term portion 158,829$

NEW JERSEY HOUSING AND MORTGAGE FINANCE AGENCY NOTES TO FINANCIAL STATEMENTS
December 31, 2014 (In Thousands)
34
NOTE 5 – DEBT SERVICE ARREARS RECEIVABLE Debt service arrears consist of mortgage principal, interest payments and fees in arrears on permanently financed loans, net of the allowance for loan losses as described in Note 4. The debt service arrears receivable was $78,605 at December 31, 2014. The debt service allowance for loan losses was $62,770 as of December 31, 2014. A subsidy payment receivable of $127 was due at December 31, 2014. The Agency requires FHA guarantees, VA insurance, private mortgage insurance, pool insurance and other features to increase the security of Single‐Family mortgage loans depending on the individual bond resolution and individual mortgages. For the Single‐Family component, the Agency’s allowance is based on historical loss percentages applied to all mortgage loan principal balances. Accrued interest in excess of 180 days is fully reserved. For the Multi‐Family Housing Component, the Agency’s policy is to provide an allowance for substantially all interest receivable on first mortgage loans when interest payments become past due, except for Section 8 program loans for which no allowance is recorded due to the nature of those specific loans. An allowance of approximately $17,346 against interest receivable was recorded at December 31, 2014. The balances of loans included in mortgage loans receivable for which an allowance has been recorded against interest receivable amounted to $155,246 as of December 31, 2014. NOTE 6 – SUPPLEMENTAL MORTGAGES AND OTHER LOANS Certain projects have received supplemental mortgages and other loans from the Agency’s General Fund and/or from the State of New Jersey Bond and Housing Assistance Funds. An allowance for loan losses has not been provided on supplemental mortgages funded from the State Bond and Housing Assistance Funds because the Agency is not obligated to repay the State until the projects repay the Agency.

NEW JERSEY HOUSING AND MORTGAGE FINANCE AGENCY NOTES TO FINANCIAL STATEMENTS
December 31, 2014 (In Thousands)
35
NOTE 6 – SUPPLEMENTAL MORTGAGES AND OTHER LOANS (CONTINUED) General Fund Component The General Fund supplemental mortgages and other loans receivable as of December 31 consisted of the following:
2014
Mortgage loans subject to subsidy contracts under Section 8 of the National Housing Act 844$
Mortgage loans subject to subsidy contracts under Section 236 of the National Housing Act3,915
Agency supplemental mortgages 208,290 Special Needs Housing Trust Fund mortgages 149,599 HUD supplemental mortgages 881 Loans to projects 9,143 State of New Jersey supplemental mortgages 10,993 Other 3,946
Subtotal 387,611 Allowance for loan losses (165,773)
Undisbursed supplemental mortgage proceeds (6,409)
Supplemental mortgages and other loans receivable, net 215,429 Less current portion (1,008)
Long term portion 214,421$
Based on the program type, certain supplemental loans under the General Fund Component have significant allowances in place. Multi‐Family Housing Component The Multi‐Family Housing Component of the Agency’s supplemental mortgage receivable and other loans as of December 31 consisted of the following:
Supplemental mortgages 61,747$ Allowance for loan losses (13,459)
Long term portion 48,288$

NEW JERSEY HOUSING AND MORTGAGE FINANCE AGENCY NOTES TO FINANCIAL STATEMENTS
December 31, 2014 (In Thousands)
36
NOTE 6 – SUPPLEMENTAL MORTGAGES AND OTHER LOANS (CONTINUED) Single‐Family Housing Component The Single‐Family Housing Component of the Agency’s supplemental mortgage receivable and other loans as of December 31 consisted of the following:
Supplemental mortgages 8,627$ Allowance for loan losses (8,282)
Long term portion 345$
NOTE 7 – CAPITAL ASSETS Capital assets are summarized as follows:
Balance Balance
December 31, December 31,
2013 Additions Deletions 2014
Non‐depreciable capital assets:Land 1,225$ ‐$ ‐$ 1,225$
Depreciable capital assets:
Building and building improvements 17,019 43 ‐ 17,062
Motor vehicles 541 57 (61) 537
Machinery and equipment 6,577 330 (24) 6,883
Furniture and fixtures 537 46 ‐ 583
Total 24,674 476 (85) 25,065
Less accumulated depreciation:
Building and building improvements (9,772) (682) ‐ (10,454)
Motor vehicles (421) (67) 61 (427)
Machinery and equipment (5,636) (309) 24 (5,921)
Furniture and fixtures (420) (40) ‐ (460)
Total (16,249) (1,098) 85 (17,262)
Total capital assets, net 9,650$ (622)$ ‐$ 9,028$
Depreciation expense was $1,098 for the year ended December 31, 2014.

NEW JERSEY HOUSING AND MORTGAGE FINANCE AGENCY NOTES TO FINANCIAL STATEMENTS
December 31, 2014 (In Thousands)
37
NOTE 8 – BONDS AND OBLIGATIONS The Agency obtains funds to finance its various mortgage programs through the sale of bonds and other obligations. Interest on Agency bonds and obligations is generally payable monthly, quarterly or semiannually. Generally, bond principal is due in annual or semiannual installments. Term bonds are subject to redemption by application of sinking fund installments. Pursuant to the related bond and obligation resolutions, the Agency has authorized and issued as of December 31, 2014 the following bonds and obligations:
Bonds BondsOutstanding Matured/ Outstanding Amount DueDecember 31, Called/ December 31, Within One
Description of Bonds as Issued 2013 Issued Redeemed 2014 Year
Single Family Housing Revenue Bonds:2004 Series I, variable rate, due 2025 to 2034 18,925$ ‐$ 2,750$ 16,175$ 1,200 2005 Series L, 2.625% to 4.35%, due 2006 to 2017 5,505 ‐ 1,315 4,190 1,355 2005 Series M, 4.87% to 5.00%, due 2026 to 2036 2,645 ‐ 2,465 180 ‐ 2005 Series N., variable rate, due 2017 15,615 ‐ 3,300 12,315 3,440 2005 Series O, variable rate, due 2026 to 2031 39,025 ‐ ‐ 39,025 ‐ 2005 Series P, variable rate, due 2008 to 2025 12,050 ‐ 1,970 10,080 2,045 2005 Series Q, variable rate, due 2010 to 2032 10,750 ‐ 5,990 4,760 135 2005 Series R, variable rate, due 2031 to 2038 24,565 ‐ ‐ 24,565 ‐ 2007 Series S, 3.60% to 4.05%, due 2008 to 2017 23,160 ‐ 5,335 17,825 5,540 2007 Series T, 4.55% to 5.25%, due 2022 to 2047 98,075 ‐ 8,945 89,130 ‐ 2007 Series U, 3.60% to 5%, due 2008 to 2037 46,765 ‐ 6,165 40,600 660 2007 Series V, variable rate, due 2037 96,375 ‐ 6,300 90,075 ‐ 2008 Series X, 3.25% to 5.375%, due 2030 15,460 ‐ 9,775 5,685 275 2008 Series Y, variable rate, due 2039 78,130 ‐ 3,205 74,925 ‐ 2008 Series Z, variable rate, due 2034 37,580 ‐ 1,105 36,475 1,160 2008 Series AA, 3.00% to 6.50%, due 2038 75,540 ‐ 22,575 52,965 1,700 2008 Series BB, variable rate, due 2039 79,085 ‐ ‐ 79,085 ‐ 2009 Series CC, .88% to 5.25%, due 2038 50,585 ‐ 4,575 46,010 530 2009 Series DD, .75% to 3.50%, due 2017 14,910 ‐ 4,685 10,225 3,510 2009 Series EE, 2.00% to 5.20%, due 2025 29,765 ‐ 2,750 27,015 ‐ 2009 Series FF, 4.00% to 5.05%, due 2039 11,025 ‐ 1,845 9,180 ‐ 2009 Series GG, 1.00% to 5.00%, due 2039 20,620 ‐ 1,470 19,150 440
Total housing revenue bonds 806,155 ‐ 96,520 709,635 21,990
Single Family Home Mortgage Bonds:
2009 Series A1, 3.63%, due 10/01/2041 101,780 ‐ 1,030 100,750 ‐ 2009 Series A2, 3.63%, due 10/01/2029 43,530 ‐ 330 43,200 ‐ 2011 Series A, .50% to 4.65%, due 10/01/2029 85,105 ‐ 7,320 77,785 6,670 2009 Series B1, 2.64%, due 10/01/2041 92,640 ‐ 5,020 87,620 ‐ 2009 Series B2, 2.64%, due 10/01/2025 56,680 ‐ 2,970 53,710 ‐ 2011 Series B, 4.00% to 4.50%, due 10/01/2032 68,645 ‐ 4,055 64,590 ‐ 2011 Series C, .3% to 2.25%, due 04/01/2017 4,645 ‐ 1,580 3,065 1,670 2011 Series D, 1.2% to 3.25%, due 04/01/2018 18,905 ‐ 4,575 14,330 3,720
Total single family home mortgage bonds 471,930 ‐ 26,880 445,050 12,060
Total single family bonds program 1,278,085 ‐ 123,400 1,154,685 34,050
Net premium on bonds payable 3,642 ‐ 774 2,868 ‐
Total single family bonds payable (net) 1,281,727$ ‐$ 124,174$ 1,157,553$ 34,050$
Multi Family General housing loan bonds:1970 Series A, 4.50%, due 2004 to 2019 1,320$ ‐$ 195$ 1,125$ 205$ 1971 Series A, 5.35% to 5.40%, due 2004 to 2019 7,710 ‐ 2,730 4,980 1,660 1972 Series B, 5.20% to 5.25%, due 2004 to 2021 8,580 ‐ 4,055 4,525 2,090
Total general housing loan bonds 17,610 ‐ 6,980 10,630 3,955
Multi‐Family Housing Revenue:1991 Series I, (Presidential Plaza) 6.50% to 7.00%,
due 2004 to 2030 101,800 ‐ 3,605 98,195 3,865

NEW JERSEY HOUSING AND MORTGAGE FINANCE AGENCY NOTES TO FINANCIAL STATEMENTS
December 31, 2014 (In Thousands)
38
NOTE 8 – BONDS AND OBLIGATIONS (CONTINUED)
Bonds BondsOutstanding Matured/ Outstanding Amount DueDecember 31, Called/ December 31, Within One
Description of Bonds as Issued 2013 Issued Redeemed 2014 Year
Multi‐Family Housing Revenue Bonds 1995 Resolution:2000 Series C2, variable rate, due 2004 to 2032 5,045$ ‐$ 125$ 4,920$ 135$ 2000 Series F, 7.93%, due 2004 to 2031 100 ‐ ‐ 100 ‐ 2002 Series B, variable rate, due 2004 to 2023 5,690 ‐ 4,420 1,270 115 2002 Series G, variable rate, due 2004 to 2025 4,140 ‐ 260 3,880 275 2004 Series A, 1.80% to 3.75%, due 2006 to 2014 1,170 ‐ 1,170 ‐ ‐ 2004 Series D, 1.70% to 5.20%, due 2006 to 2046 18,365 ‐ 890 17,475 920 2008 Series 1, 5.75%, due 2038 3,260 ‐ ‐ 3,260 ‐ 2008 Series 2, 4.375%, due 2046 6,370 ‐ ‐ 6,370 ‐ 2013 Series 1, 0.20% to 4.25%, due 2013 to 2039 47,475 ‐ 6,110 41,365 2,150 2013 Series 2, 0.50% to 4.75%, due 2013 to 2046 87,575 ‐ 2,220 85,355 2,585 2013 Series 3, 0.60% to 5.01%, due 2013 to 2034 43,725 ‐ 1,245 42,480 1,330 2013 Series 4, 0.90%, due 2015 51,645 ‐ 42,210 9,435 9,435 2013 Series 5, variable rate, due 2046 126,605 ‐ 3,160 123,445 4,180 2013 Series 6, variable rate, due 2037 17,055 ‐ 435 16,620 450 2013 Series 7, 1.25%, due 2015 4,990 ‐ 4,990 ‐ ‐
Total 1995 Resolution 423,210 ‐ 67,235 355,975 21,575
Multi‐Family Revenue Bonds 2005 Resolution:2005 Series A1, 2.20% to4.95%, due 2005 to 2046 21,220 ‐ 445 20,775 470 2005 Series A2, 4.95%, due 2040 to 2046 4,365 ‐ ‐ 4,365 ‐ 2005 Series D, 2.00% to 4.70%, due 2005 to 2030 18,475 ‐ 1,155 17,320 1,055 2005 Series F, variable rate, due 2005 to 2040 10,985 ‐ 470 10,515 495 2005 Series G, variable rate, due 2007 to 2047 4,465 ‐ 75 4,390 75 2006 Series A, variable rate, due 2006 to 2028 18,660 ‐ 990 17,670 1,030 2006 Series B, variable rate, due 2006 to 2028 5,675 ‐ 500 5,175 525 2006 Series C, 4.90% to 5.00%, due 2007 to 2026 2,680 ‐ 60 2,620 65 2006 Series E, 4.65% to 4.80%, due 2007 to 2036 4,705 ‐ 100 4,605 115 2007 Series A, 3.75% to 4.95%, due 2008 to 2048 23,780 ‐ ‐ 23,780 ‐ 2007 Series B, 5.39% to 6.13%, due 2017 to 2037 4,355 ‐ 80 4,275 90 2007 Series G, variable rate, due 2008 to 2034 12,895 ‐ 520 12,375 540 2007 Series I, variable rate, due 2008 to 2029 6,725 ‐ 295 6,430 315 2008 Series A, 2.5% to 6.0%, due 2009 to 2050 9,575 ‐ 120 9,455 150 2008 Series B, variable rate, due 2008 to 2048 55,200 ‐ 575 54,625 610 2008 Series C, variable rate, due 2009 to 2039 10,030 ‐ 180 9,850 180 2008 Series D, 2.75% to 5.20%, due 2008 to 2019 3,515 ‐ 570 2,945 595 2008 Series E, 2.00% to 5.63%, due 2008 to 2029 13,225 ‐ 1,135 12,090 1,060 2008 Series F, variable rate, due 2019 to 2048 96,025 ‐ ‐ 96,025 ‐ 2008 Series G, variable rate, due 2008 to 2039 14,395 ‐ 210 14,185 215 2009 Series A, 1.95% to 4.95%, due 2011 to 2041 30,010 ‐ 725 29,285 970 2009 Series B, 4.70% to 4.90%, due 2010 to 2040 3,900 ‐ 60 3,840 60 2009 Series D, variable rate, due 2010 to 2048 18,095 ‐ 325 17,770 340 2010 Series A, 0.8% to 4.65%, due 2011 to 2041 6,475 ‐ 335 6,140 335 2010 Series B, 1.10% to 1.70%, due 2012 to 2014 6,390 ‐ 6,390 ‐ ‐ 2010 Series C, 1.12% to 6.65%, due 2011 to 2044 42,625 ‐ 805 41,820 830 2012 Series A, 1.00% to 4.55%, due 2013 to 2043 21,915 ‐ 305 21,610 330 2012 Series B, .9% to 1.75%, due 2013 to 2016 16,095 ‐ 9,875 6,220 4,265 2012 Series C, 4.38%, due 2013 to 2025 3,150 ‐ 35 3,115 40 2012 Series D, 1.13%, due 2014 15,275 395 15,670 ‐ ‐ 2012 Series E, 1.439% to 5.086%, due 2013 to 2043 9,180 ‐ 125 9,055 135 2012 Series F, 4.83%, due 2014 to 2025 355 ‐ 5 350 5 2014 Series A, 0.5% to 4.55%, due 2016 to 2045 ‐ 2,430 ‐ 2,430 ‐ 2014 Series B, 0.45% to 5.25%, due 2014 to 2046 ‐ 25,340 60 25,280 280 2014 Series C, variable rate, due 2016 ‐ 12,298 ‐ 12,298 ‐ 2014 Series D, variable rate, due 2016 ‐ 14,170 ‐ 14,170 ‐
Total 2005 bond resolution 514,415 54,633 42,195 526,853 15,175
Total multi‐family bonds program 1,057,035 54,633 120,015 991,653 44,570
Net discount on bonds payable (226) ‐ (70) (156) ‐
Total multi‐family bonds payable (net) 1,056,809 54,633$ 119,945$ 991,497 44,570
Total bonds payable 2,338,536$ 2,149,050$ 78,620$
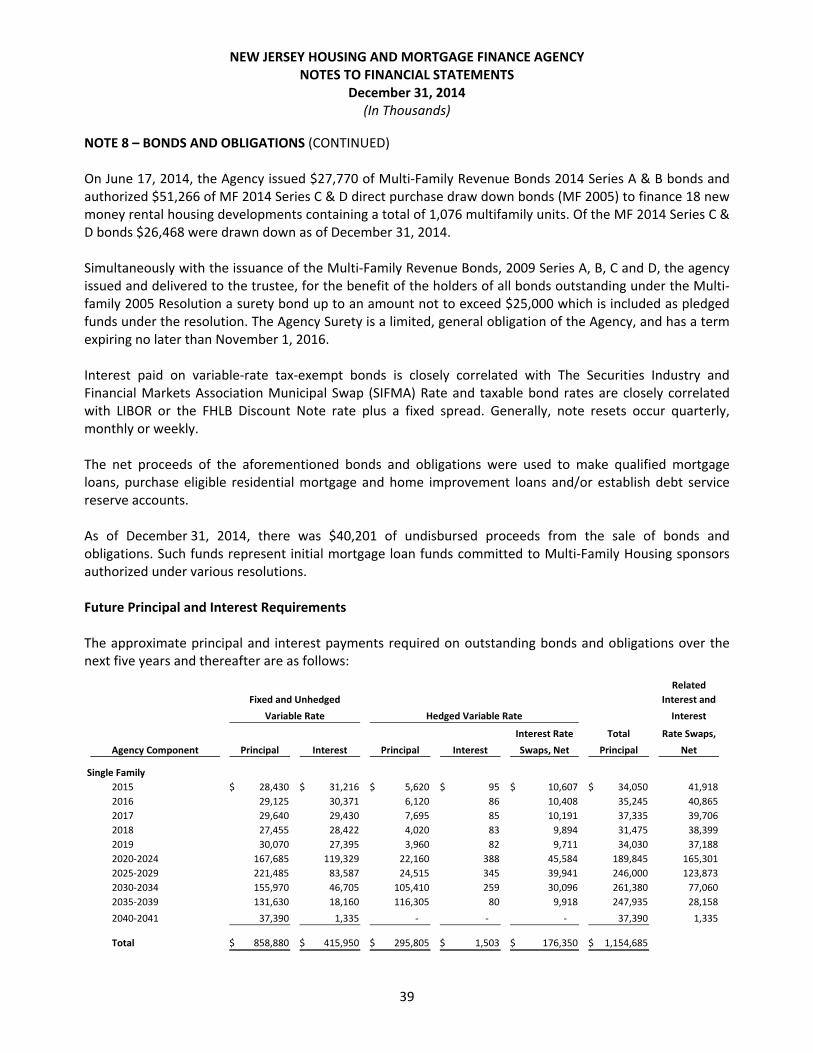
NEW JERSEY HOUSING AND MORTGAGE FINANCE AGENCY NOTES TO FINANCIAL STATEMENTS
December 31, 2014 (In Thousands)
39
NOTE 8 – BONDS AND OBLIGATIONS (CONTINUED) On June 17, 2014, the Agency issued $27,770 of Multi‐Family Revenue Bonds 2014 Series A & B bonds and authorized $51,266 of MF 2014 Series C & D direct purchase draw down bonds (MF 2005) to finance 18 new money rental housing developments containing a total of 1,076 multifamily units. Of the MF 2014 Series C & D bonds $26,468 were drawn down as of December 31, 2014. Simultaneously with the issuance of the Multi‐Family Revenue Bonds, 2009 Series A, B, C and D, the agency issued and delivered to the trustee, for the benefit of the holders of all bonds outstanding under the Multi‐family 2005 Resolution a surety bond up to an amount not to exceed $25,000 which is included as pledged funds under the resolution. The Agency Surety is a limited, general obligation of the Agency, and has a term expiring no later than November 1, 2016. Interest paid on variable‐rate tax‐exempt bonds is closely correlated with The Securities Industry and Financial Markets Association Municipal Swap (SIFMA) Rate and taxable bond rates are closely correlated with LIBOR or the FHLB Discount Note rate plus a fixed spread. Generally, note resets occur quarterly, monthly or weekly. The net proceeds of the aforementioned bonds and obligations were used to make qualified mortgage loans, purchase eligible residential mortgage and home improvement loans and/or establish debt service reserve accounts. As of December 31, 2014, there was $40,201 of undisbursed proceeds from the sale of bonds and obligations. Such funds represent initial mortgage loan funds committed to Multi‐Family Housing sponsors authorized under various resolutions. Future Principal and Interest Requirements The approximate principal and interest payments required on outstanding bonds and obligations over the next five years and thereafter are as follows:
Related
Interest and
Interest
Interest Rate Total Rate Swaps,
Agency Component Principal Interest Principal Interest Swaps, Net Principal Net
Single Family
2015 28,430$ 31,216$ 5,620$ 95$ 10,607$ 34,050$ 41,918
2016 29,125 30,371 6,120 86 10,408 35,245 40,865
2017 29,640 29,430 7,695 85 10,191 37,335 39,706
2018 27,455 28,422 4,020 83 9,894 31,475 38,399
2019 30,070 27,395 3,960 82 9,711 34,030 37,188
2020‐2024 167,685 119,329 22,160 388 45,584 189,845 165,301
2025‐2029 221,485 83,587 24,515 345 39,941 246,000 123,873
2030‐2034 155,970 46,705 105,410 259 30,096 261,380 77,060
2035‐2039 131,630 18,160 116,305 80 9,918 247,935 28,158
2040‐2041 37,390 1,335 ‐ ‐ ‐ 37,390 1,335
Total 858,880$ 415,950$ 295,805$ 1,503$ 176,350$ 1,154,685$
Fixed and Unhedged
Variable Rate Hedged Variable Rate

NEW JERSEY HOUSING AND MORTGAGE FINANCE AGENCY NOTES TO FINANCIAL STATEMENTS
December 31, 2014 (In Thousands)
40
NOTE 8 – BONDS AND OBLIGATIONS (CONTINUED) Future Principal and Interest Requirements (Continued)
Related
Interest and
Interest
Interest Rate Total Rate Swaps,
Agency Component Principal Interest Principal Interest Swaps, Net Principal Net
Multi‐Family
2015 35,340$ 26,967$ 9,230$ 436$ 16,907$ 44,570$ 44,310
2016 51,858 26,055 9,680 418 16,542 61,538 43,015
2017 23,410 24,893 10,105 403 16,119 33,515 41,415
2018 22,730 23,966 10,495 387 15,664 33,225 40,017
2019 24,065 23,040 12,140 371 15,207 36,205 38,618
2020‐2024 126,470 98,796 75,055 1,580 66,019 201,525 166,395
2025‐2029 126,000 67,275 78,040 1,083 41,883 204,040 110,241
2030‐2034 84,950 37,879 66,595 684 27,352 151,545 65,915
2035‐2039 55,680 20,353 58,385 340 15,344 114,065 36,037
2040‐2044 35,625 7,771 39,700 136 7,583 75,325 15,490
2045‐2049 12,420 1,650 23,530 25 1,907 35,950 3,582
2050 150 5 ‐ ‐ ‐ 150 5
Total 598,698$ 358,650$ 392,955$ 5,863$ 240,527$ 991,653$
Fixed and Unhedged
Variable Rate Hedged Variable Rate
NOTE 9 – CONDUIT DEBT OBLIGATIONS The Agency may issue bonds to provide funds to local Housing Authorities to finance on an accelerated basis certain capital renovations and an improvement to each of the Authority’s public housing developments. The bonds are payable from and secured primarily by Capital Fund Program monies, subject to the availability of appropriations to be paid by the United States Department of HUD to each Authority. The Agency may also issue other bonds for housing development purposes. These bonds are special and limited obligations of the Agency. The bonds, which are considered conduit debt obligations by GASB, do not constitute a debt or pledge of the faith and credit of the Agency and, accordingly, have not been reported in the accompanying financial statements. At December 31, 2014, conduit debt outstanding aggregated $432,159.

NEW JERSEY HOUSING AND MORTGAGE FINANCE AGENCY NOTES TO FINANCIAL STATEMENTS
December 31, 2014 (In Thousands)
41
NOTE 9 – CONDUIT DEBT OBLIGATIONS (CONTINUED) The Agency’s MF Conduit Bonds Outstanding as of December 31, 2014 are as follows:
Balance Balance BalanceConduit Project Series Closing Date At Closing 12/31/2013 Additions Reductions 12/31/2014
^ Capital Funds Program Revenue Bonds 2004‐A 12/23/2004 79,860$ 53,540$ ‐$ (3,435)$ 50,105$ ^ Capital Funds Program Revenue Bonds 2007‐A 8/15/2007 18,585 14,570 ‐ (750) 13,820 * 2006‐A Meadow Brook Apartments 2006‐A 9/9/2006 8,350 6,830 ‐ (15) 6,815 * Woodbury Oakwood Housing Project 2011‐A 12/21/2011 4,550 4,550 ‐ (20) 4,530 * Asbury Park Gardens 2012‐A 7/1/2012 14,310 14,145 ‐ (180) 13,965 * Washington Dodd 2012‐F 12/12/2012 19,755 19,645 ‐ (1,440) 18,205 * Carl Miller Homes 2012‐C 12/28/2012 31,656 31,656 ‐ ‐ 31,656 * Hampshire House 2012‐D 1/11/2013 6,400 6,400 ‐ ‐ 6,400 * Alexander Hamilton III 2013‐B 2/20/2013 11,762 11,507 ‐ ‐ 11,507 * McIver Homes 2013‐C 5/23/2013 5,200 5,185 ‐ (135) 5,050
* Somerset Mews (1) 2013‐A 8/23/2013 2,984 7,167 41,386 ‐ 48,553 * Penny Point Apartments 2013‐L 10/10/2013 9,200 9,200 ‐ ‐ 9,200 * Chestnut Homes Apartments 2013‐K 11/19/2013 6,900 6,900 ‐ ‐ 6,900
* Salem Lafayette Apartments 2013‐J 12/16/2013 61,680 61,680 ‐ ‐ 61,680
* Brigantine Apts. 2014‐G 1/30/2014 11,510 ‐ 11,510 (95) 11,415
* Great Falls 2013‐M 1/9/2014 15,400 ‐ 15,400 ‐ 15,400
* Sycamore Ridge 2014‐A 3/3/2014 26,000 ‐ 26,000 ‐ 26,000
* Broadway Townhouses 2014‐E 6/4/2014 27,500 ‐ 27,500 ‐ 27,500
* South Village I and II 2014‐B 11/10/2014 30,000 ‐ 30,000 ‐ 30,000
* Catherine Todd 2014‐N 10/24/2014 9,415 ‐ 9,415 ‐ 9,415
* Glennview Townhouses II 2014‐R 12/30/2014 6,243 ‐ 6,243 ‐ 6,243 * Atlantic City Townhouses 2014‐P 12/23/2014 17,800 ‐ 17,800 ‐ 17,800
Total conduit debt 425,060$ 252,975$ 185,254$ (6,070)$ 432,159$
^ Capital Fund bonds to finance certain capital renovations* Fixed rate bonds to finance a single Multifamily project1
New Jersey Housing and Mortgage Finance Agency MF Conduit Bonds Outstanding as of December 31, 2014
The 2013‐A (Somerset Mews) bonds in the amount of $60, 035 were issued as direct purchase, drawdown bonds. Bond proceeds are drawn down
periodically as needed by the borrower. Bonds are not considered outstanding until drawn by the borrower.
NOTE 10 – FUNDS HELD IN TRUST FOR MORTGAGORS Funds held by the Agency for its projects include proceeds from conversion of projects from non‐profit to limited dividend status in the form of development cost and community development escrows and unspent subsidies. These funds are available to absorb initial operating deficits, construction overruns, provide additional amenities to the projects, and for other contingencies.
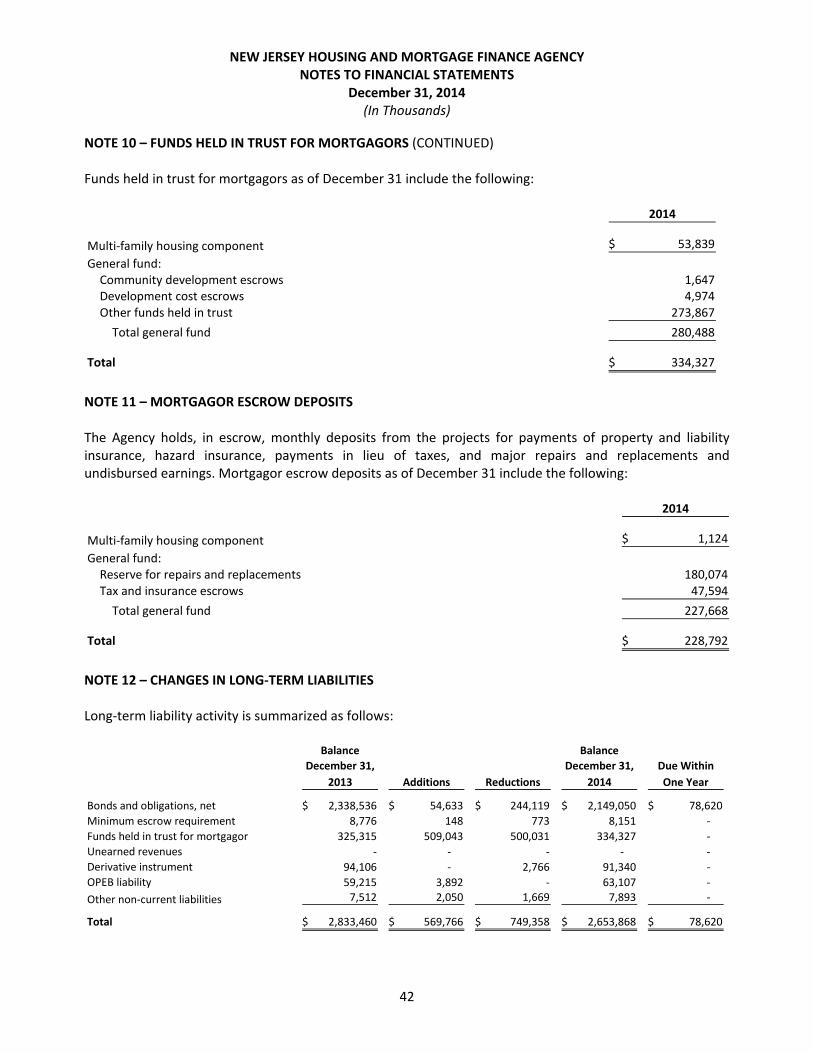
NEW JERSEY HOUSING AND MORTGAGE FINANCE AGENCY NOTES TO FINANCIAL STATEMENTS
December 31, 2014 (In Thousands)
42
NOTE 10 – FUNDS HELD IN TRUST FOR MORTGAGORS (CONTINUED) Funds held in trust for mortgagors as of December 31 include the following:
2014
Multi‐family housing component 53,839$
General fund:Community development escrows 1,647 Development cost escrows 4,974 Other funds held in trust 273,867
Total general fund 280,488
Total 334,327$
NOTE 11 – MORTGAGOR ESCROW DEPOSITS The Agency holds, in escrow, monthly deposits from the projects for payments of property and liability insurance, hazard insurance, payments in lieu of taxes, and major repairs and replacements and undisbursed earnings. Mortgagor escrow deposits as of December 31 include the following:
2014
Multi‐family housing component 1,124$
General fund:Reserve for repairs and replacements 180,074 Tax and insurance escrows 47,594
Total general fund 227,668
Total 228,792$
NOTE 12 – CHANGES IN LONG‐TERM LIABILITIES Long‐term liability activity is summarized as follows:
Balance Balance
December 31, December 31, Due Within
2013 Additions Reductions 2014 One Year
Bonds and obligations, net 2,338,536$ 54,633$ 244,119$ 2,149,050$ 78,620$
Minimum escrow requirement 8,776 148 773 8,151 ‐
Funds held in trust for mortgagor 325,315 509,043 500,031 334,327 ‐
Unearned revenues ‐ ‐ ‐ ‐ ‐
Derivative instrument 94,106 ‐ 2,766 91,340 ‐
OPEB liability 59,215 3,892 ‐ 63,107 ‐
Other non‐current liabilities 7,512 2,050 1,669 7,893 ‐
Total 2,833,460$ 569,766$ 749,358$ 2,653,868$ 78,620$

NEW JERSEY HOUSING AND MORTGAGE FINANCE AGENCY NOTES TO FINANCIAL STATEMENTS
December 31, 2014 (In Thousands)
43
NOTE 13 – NET POSITION Restricted Under Bond and Obligation Resolutions As described in Note 3, monies within each Bond and Obligation Fund are pledged as security for the respective bondholders, and thus are restricted as to their application. Restricted Restricted net position represents the portion of total net position restricted by the various programs established for the sole purpose of providing housing and residential opportunities for individuals with special needs. All restricted amounts are net of related liabilities. Appropriated General Fund Net Position Appropriated General Fund net position is unrestricted net position that has been designated by the Agency’s members for the following purposes at December 31, 2014.

NEW JERSEY HOUSING AND MORTGAGE FINANCE AGENCY NOTES TO FINANCIAL STATEMENTS
December 31, 2014 (In Thousands)
44
NOTE 13 – NET POSITION (CONTINUED) Appropriated General Fund Net Position (Continued)
2014
ABC Corporation 95$
Affordable Rental Housing Subsidy Loan Program 2
Agency CIAP 697
Aging Out of Foster Care 1,135
At Home Downtown 154
Bond Refunding Proceeds 1,687
Cash Flow Swap Advisory 604
CHOICE 34,766
CIAP Loan Program 4,971
Developmental Disabilities Partnership 5,883
Energy Benchmarking 50
Ex‐Offenders Re‐Entry Housing Program 68
Homeless Management Information System 100
HOPE 500
Information Technology 1,384
Life Safety Rehabilitation 153
Live Where You Work 682
MBS Guarantee Program 3,324
MBS Mortgage Backed Security Start Up 1,058
MONI HIF 90
Mortgage Assistance PILOT 750
NJHMFA Portion of Undisbursed Mtg. Proceeds 531
Non‐Bond Multi‐Family Program 29,692
Paragon Village #1316 445
Policy and Community Initiatives 59
Portfolio Reserve Balance 1,706
Preservation Initiatives 10
Project Remediation 698
Public Outreach Initiatives 207
Sandy Home Buyer Assistance Advance Fund 4,679
Shore Easy 80
Single Family Counseling 94
Small Rental Project Preservation Loan Program 3,315
Strategic Zone Lending Pool 11,714
Transitional Housing Loans 189
UHORP HIF 151
UHORP Mortgage Commitment 17,093
Welcome Home Program 1,779 Whitlock Mills 184
Total 130,779$

NEW JERSEY HOUSING AND MORTGAGE FINANCE AGENCY NOTES TO FINANCIAL STATEMENTS
December 31, 2014 (In Thousands)
45
NOTE 13 – NET POSITION (CONTINUED) Appropriated General Fund Net Position (Continued) Changes in net position are summarized as follows:
Net Investment in
Capital Assets Restricted Unrestricted Total
Net position at December 31, 2013 9,650$ 356,199$ 492,657$ 858,506$
Income ‐ ‐ 13,383 13,383
Acquisition of capital assets 476 ‐ (476) ‐
Transfer ‐ 24,684 (24,684) ‐
Depreciation on capital assets (1,098) ‐ 1,098 ‐
Net position at December 31, 2014 9,028$ 380,883$ 481,978$ 871,889$
NOTE 14 – PENSION PLAN Public Employees Retirement System The Agency contributes to a cost‐sharing multiple‐employer defined benefit pension plan, the Public Employees’ Retirement System (PERS), which is administered by the New Jersey Division of Pensions and Benefits. This plan provides retirement, death and disability, and medical benefits to qualified members. Vesting and benefit provisions are established by N.J.S.A. 43:15A and 43:3B. The plan has a Board of Trustees that is primarily responsible for its administration. The contribution requirements of plan members are determined by State statute. Effective July 1, 2011, in accordance with Chapter 78, P.L. 2011, the contribution rate increased to 6.5% of annual covered salary for plan members enrolled in the Public Employees’ Retirement System with an additional 1% increase to be phased in over the next 7 years bringing the total pension contribution rate to 7.5% of salary by July 1, 2018. At December 31, 2014 the contribution rate is 6.92% of annual salary. The Agency is billed annually for its normal contribution plus any accrued liability. The Agency’s contributions to the plan, equal to the required contributions, were as follows:
Normal Accrued Total Funded by Paid by
Period Contribution Liability Liability State Agency
Fiscal year ended December 31, 2014 368$ 1,489$ 1,857$ ‐$ 1,857$
Fiscal year ended December 31, 2013 556 1,329 1,885 ‐ 1,885
Fiscal year ended December 31, 2012 629 1,257 1,886 ‐ 1,886

NEW JERSEY HOUSING AND MORTGAGE FINANCE AGENCY NOTES TO FINANCIAL STATEMENTS
December 31, 2014 (In Thousands)
46
NOTE 14 – PENSION PLAN (CONTINUED) Early Retirement Incentive Program The Agency has approved Early Retirement Incentive Programs known as ERI 1 and ERI 3, as permitted by State legislation for certain members of the Public Employees’ Retirement System. These members had to meet certain age and service requirements and had to apply for retirement between certain dates. Three (3) employees participated in ERI 1 and fifteen (15) employees participated in ERI 3. The Agency is assessed annually for the actuarially determined contribution to fund this program. The Agency is obligated to make annual installments with each subsequent year payment increasing every year by 4% (ERI 1) and 5.95% for 2006 and 4% beginning in 2007 (ERI 3). Payments for the years ended December 31, 2014, 2013, and 2012, were $139, $132, and $123, respectively. Installments due by the Agency at December 31, 2014 are as follows:
2015 138$ 2016 144 2017 150 2018 156 2019 162 2020‐2024 797 2025‐2029 885 2030‐2034 845
Total 3,277$
The Division issues a publicly available financial report that includes financial statements and required supplementary information. That report may be obtained by writing to:
State of New Jersey Division of Pensions and Benefits P.O. Box 295 Trenton, New Jersey 08625‐0295
NOTE 15 – POST EMPLOYMENT BENEFITS The Agency follows the accounting provisions of GASB Statement No. 45, Accounting and Financial Reporting by Employers for Post‐employment Benefits Other Than Pensions. This statement establishes guidelines for reporting costs associated with “other post‐employment benefits” (OPEB). OPEB costs are actuarially calculated based on plan benefits (other than pensions) that current and retired employees have accrued as a result of their respective years of employment service and to what extent progress is being made in funding the plan.

NEW JERSEY HOUSING AND MORTGAGE FINANCE AGENCY NOTES TO FINANCIAL STATEMENTS
December 31, 2014 (In Thousands)
47
NOTE 15 – POST EMPLOYMENT BENEFITS (CONTINUED) The Plan The Agency is responsible for the cost of health benefits provided to members of PERS who retired from the Agency with 25 years of service along with their spouses, and some dependent children. The plan offers comprehensive benefits through various plan providers consisting of hospital, medical, health, substance abuse and prescription drug programs. The State administers the plan and has the authority to establish and amend certain benefit provisions offered. The State’s plan is considered a single employer defined benefit plan, is not a separate entity or trust and does not issue stand‐alone financial statements. The Agency, as a participant in the plan, recognizes OPEB expenses on an accrual basis. Funding Policy On June 28, 2011 the State of New Jersey Legislature passed Pension and Health Benefits Reform. This legislation requires all employees to contribute a certain percentage of their health benefit premiums towards the cost of their coverage. The percentage is tiered based on coverage type and salary. The percentages will be phased in over 4 years with the full amount becoming effective July 1, 2014. The percentages for 2011 range from 1% ‐ 8.75% of the insurance premium based on salary, with a minimum of 1.5% of salary to be contributed. The Agency implemented this plan in October 2011, and prior to that as of July 1, 2008 current employees contributed 1.5% of their salary toward medical benefits. During the year ended December 31, 2014, the Agency paid $4,222 in health insurance premiums for current employees. The Agency also paid $1,154 for the year ended December 31, 2014 towards benefits for 76 and 66 eligible retired members. Retired employees who are eligible for Medicare are also reimbursed for their portion of Medicare insurance premiums on a pay‐as‐you‐go basis. The Agency’s annual OPEB cost is calculated based on the annual required contribution (ARC), an amount actuarially determined in accordance with the parameters of GASB Statement 45. The ARC represents a level of funding that, if paid on an ongoing basis, is projected to cover normal cost each year and to amortize any unfunded actuarial accrued liabilities (UAAL) over a period not to exceed thirty years. The Agency has elected to amortize the UAAL over one year. The Agency’s annual OPEB cost for the year ended December 31, 2014 and the related information for the plan are as follows (dollar amounts in thousands):
2014
Annual required contribution 64,224$
Interest on net OPEB obligation 2,073
Adjustment to ARC (61,288)
Annual OPEB cost 5,009
Contributions made (1,117)
Increase in net OPEB obligation 3,892
Net OPEB obligation, beginning of year 59,215
Net OPEB obligation, end of year 63,107$
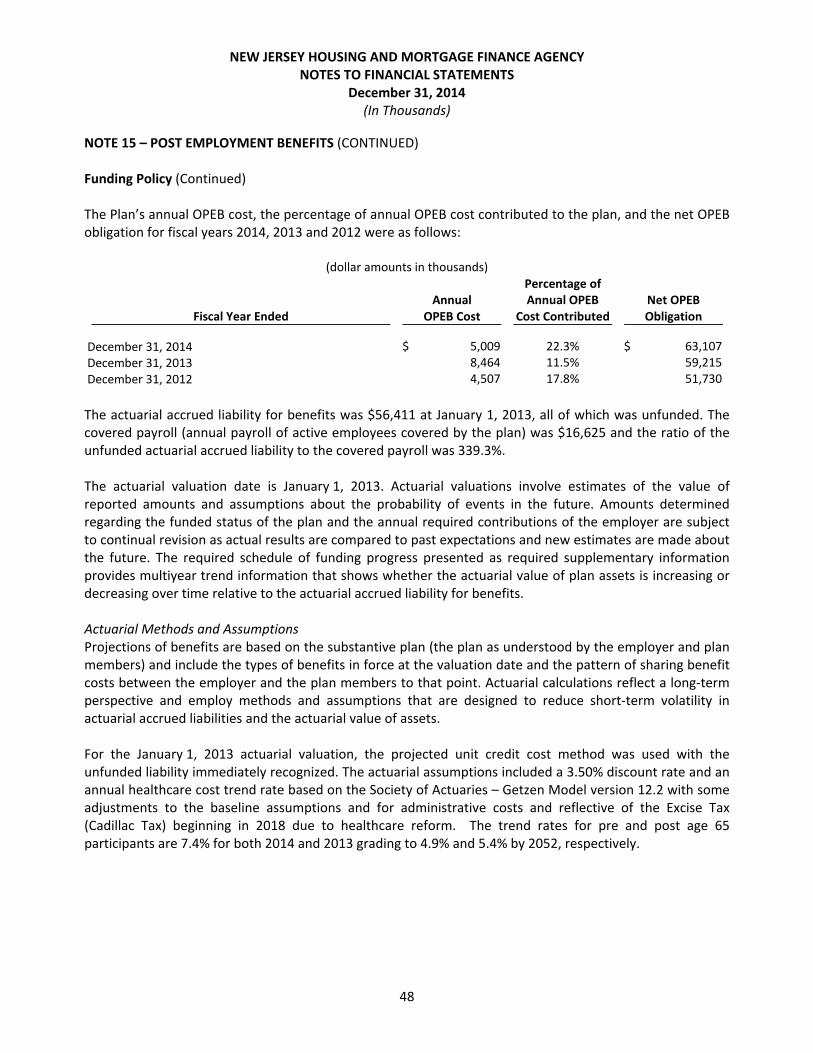
NEW JERSEY HOUSING AND MORTGAGE FINANCE AGENCY NOTES TO FINANCIAL STATEMENTS
December 31, 2014 (In Thousands)
48
NOTE 15 – POST EMPLOYMENT BENEFITS (CONTINUED) Funding Policy (Continued) The Plan’s annual OPEB cost, the percentage of annual OPEB cost contributed to the plan, and the net OPEB obligation for fiscal years 2014, 2013 and 2012 were as follows:
(dollar amounts in thousands) Percentage of
Annual Annual OPEB Net OPEBFiscal Year Ended OPEB Cost Cost Contributed Obligation
December 31, 2014 5,009$ 22.3% 63,107$
December 31, 2013 8,464 11.5% 59,215
December 31, 2012 4,507 17.8% 51,730 The actuarial accrued liability for benefits was $56,411 at January 1, 2013, all of which was unfunded. The covered payroll (annual payroll of active employees covered by the plan) was $16,625 and the ratio of the unfunded actuarial accrued liability to the covered payroll was 339.3%. The actuarial valuation date is January 1, 2013. Actuarial valuations involve estimates of the value of reported amounts and assumptions about the probability of events in the future. Amounts determined regarding the funded status of the plan and the annual required contributions of the employer are subject to continual revision as actual results are compared to past expectations and new estimates are made about the future. The required schedule of funding progress presented as required supplementary information provides multiyear trend information that shows whether the actuarial value of plan assets is increasing or decreasing over time relative to the actuarial accrued liability for benefits. Actuarial Methods and Assumptions Projections of benefits are based on the substantive plan (the plan as understood by the employer and plan members) and include the types of benefits in force at the valuation date and the pattern of sharing benefit costs between the employer and the plan members to that point. Actuarial calculations reflect a long‐term perspective and employ methods and assumptions that are designed to reduce short‐term volatility in actuarial accrued liabilities and the actuarial value of assets. For the January 1, 2013 actuarial valuation, the projected unit credit cost method was used with the unfunded liability immediately recognized. The actuarial assumptions included a 3.50% discount rate and an annual healthcare cost trend rate based on the Society of Actuaries – Getzen Model version 12.2 with some adjustments to the baseline assumptions and for administrative costs and reflective of the Excise Tax (Cadillac Tax) beginning in 2018 due to healthcare reform. The trend rates for pre and post age 65 participants are 7.4% for both 2014 and 2013 grading to 4.9% and 5.4% by 2052, respectively.

NEW JERSEY HOUSING AND MORTGAGE FINANCE AGENCY NOTES TO FINANCIAL STATEMENTS
December 31, 2014 (In Thousands)
49
NOTE 16 – DEFERRED COMPENSATION ACCOUNT The Agency offers its employees a choice of two Deferred Compensation Plans in accordance with Internal Revenue Code Section 457. The Plans, available to all full time employees at their option, permit employees to defer a portion of their salary to future years. The deferred compensation is not available to participants until termination, retirement, death or unforeseeable emergency. Amounts deferred under Section 457 plans must be held in trust for the exclusive benefit of participating employees and not be accessible by the Agency or its creditors. NOTE 17 – RESERVE FOR INTEREST REBATE The Tax Reform Act of 1986 placed restrictions on the investments of the proceeds of certain tax‐exempt bonds issued after December 31, 1986. Specifically, investment earnings which are above arbitrage bond yield are required to be rebated to the United States Treasury Department within sixty days of the end of the fifth bond year. A bond year is defined as ending on the anniversary date of the bond settlement. The Agency has various issues of bonds outstanding (see Note 8), which also had various settlement dates. Rebate calculations on these bonds are required to be made at least once every five years. However, the Agency prepares annual rebate calculations for purposes of determining any contingent liability for rebate. The Agency has elected to establish a reserve account in the amount of $668 for the year ended December 31, 2014 for the Multi‐Family Bond Resolution Fund and $0 at December 31, 2014 for the Single‐Family Bond Resolution Fund in case a rebate may be required as the result of the occurrence of future events. NOTE 18 – DERIVATIVE INSTRUMENTS The Agency has several variable rate bond series currently outstanding. In order to protect against the potential of rising interest rates, the Agency entered into various pay‐fixed, receive‐variable interest rate swaps at a cost anticipated to be less than what the Agency would have paid to issue fixed‐rate debt. The notional principal of the swaps in some cases initially increase as the borrowed funds are anticipated to be loaned out. For footnote purposes, the fair values of the Agency’s derivatives have been presented. For each of the interest rate swaps, the Agency used one of the following methods to evaluate the hedge effectiveness of the potential hedging derivative instrument: consistent critical terms method, synthetic instrument method or regression analysis method. The consistent critical terms method evaluates effectiveness by qualitative consideration of the uniformity of the significant terms of the hedgeable item with the terms of the potential hedging derivative instrument. If the relevant terms match, or in certain instances are similar, the potential hedging derivative instrument is determined to be effective. The synthetic instrument method evaluates effectiveness by combining the cash flows on the derivative with the cash flows on the hedged item to create a new instrument. The synthetic rate on the cash flows is calculated

NEW JERSEY HOUSING AND MORTGAGE FINANCE AGENCY NOTES TO FINANCIAL STATEMENTS
December 31, 2014 (In Thousands)
50
NOTE 18 – DERIVATIVE INSTRUMENTS (CONTINUED) based on the combination of all the cash flows and is compared against the fixed rate on the derivative. A potential hedging derivative instrument is effective if the actual synthetic rate is within a range of 90 to 111 percent of the fixed rate of the potential hedging derivative instrument to be substantially fixed. The regression analysis method examines the statistical relationship between changes in the fair values or cash flows of a hedged item and its associated potential hedging derivative. For a potential hedging derivative instrument evaluated using regression analysis to be considered effective for financial reporting purposes, the analysis should produce an R‐squared of at least 0.80, an F‐statistic that indicates statistical significance at the 95 percent confidence level, and a regression coefficient for the slope between ‐1.25 and ‐0.80. Terms, Fair Values and Credit Risk As of December 31, 2014, the Agency determined that a portion of the MRB 2007‐G Multi‐Family Bond Component Swap listed as an investment derivative instrument in the chart below no longer met the criteria for effectiveness. Accordingly, the fair value of the swap of $(717) is reported within the investment revenue classification for the year ended December 31, 2014. At December 31, 2014, all single family derivatives and all multi‐family derivatives, except MRB 2007‐G, met the criteria for effectiveness. The terms and fair values of the outstanding swaps as of December 31, 2014, are summarized in the table below. The swaps are utilized to hedge the risk from the associated variable rate debt. The Agency’s swap agreements contain scheduled reductions to outstanding notional amounts that are expected to approximately follow scheduled or anticipated reductions in the associated bonds payable category. The Agency pays a fixed interest rate on the notional amount that represents the principal amount of the related bonds. The Agency receives either 1‐month LIBOR times the notional amount for the taxable borrowings, or a percentage of 1‐month LIBOR plus a fixed spread or The Securities Industry and Financial Markets Association Municipal Swap (SIFMA) Index times the notional amount for the tax‐exempt borrowings from the counterparty, plus a fixed spread as applicable, as listed below. Where possible, only the net difference will be exchanged with the counterparty and the Agency continues to pay interest to the certificate‐holders at the variable rate provided on the bonds. The purpose of the swap is to mitigate interest rate risk. The Agency will be exposed to variable rates if the counterparty to the swap defaults or if the swap is terminated. The following tables present both the hedging derivative value and the off market loan balances for Single Family and Multi‐Family Bond Component Swaps at December 31, 2014. This presentation has no effect on the net position of the Agency.
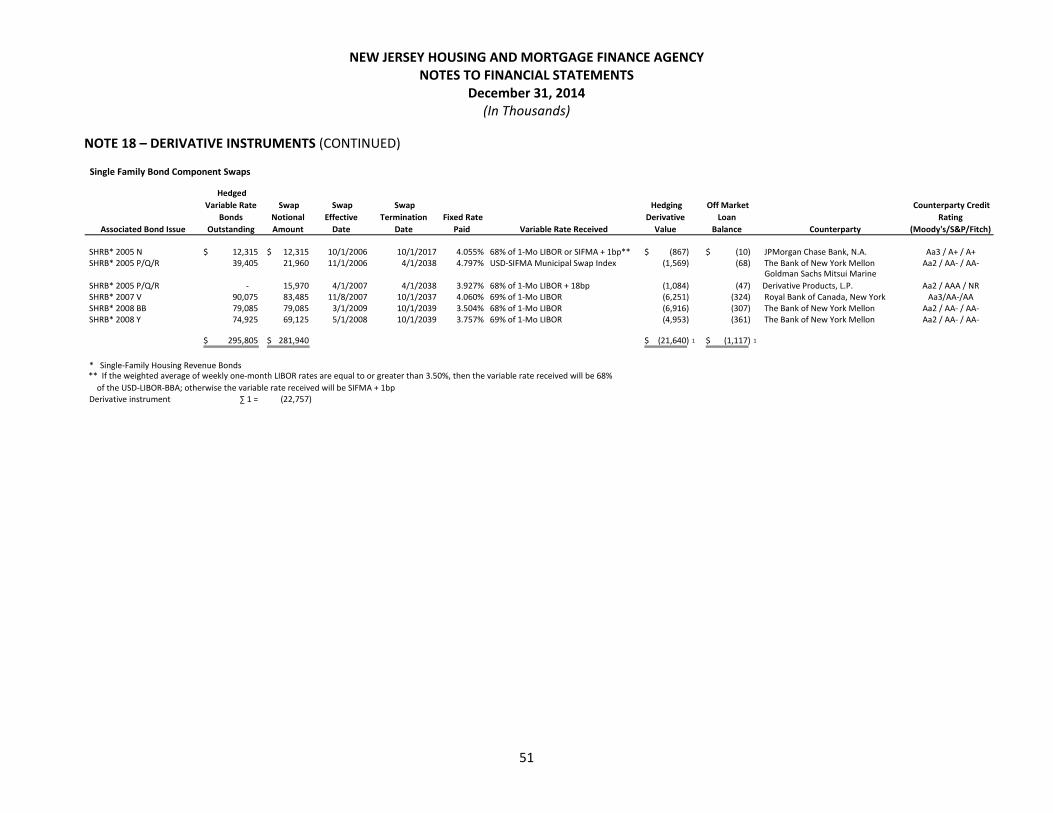
NEW JERSEY HOUSING AND MORTGAGE FINANCE AGENCY NOTES TO FINANCIAL STATEMENTS
December 31, 2014 (In Thousands)
51
NOTE 18 – DERIVATIVE INSTRUMENTS (CONTINUED) Single Family Bond Component Swaps
Associated Bond Issue
Hedged
Variable Rate
Bonds
Outstanding
Swap
Notional
Amount
Swap
Effective
Date
Swap
Termination
Date
Fixed Rate
Paid Variable Rate Received
Hedging
Derivative
Value
Off Market
Loan
Balance Counterparty
Counterparty Credit
Rating
(Moody's/S&P/Fitch)
SHRB* 2005 N 12,315$ 12,315$ 10/1/2006 10/1/2017 4.055% 68% of 1‐Mo LIBOR or SIFMA + 1bp** (867)$ (10)$ JPMorgan Chase Bank, N.A. Aa3 / A+ / A+SHRB* 2005 P/Q/R 39,405 21,960 11/1/2006 4/1/2038 4.797% USD‐SIFMA Municipal Swap Index (1,569) (68) The Bank of New York Mellon Aa2 / AA‐ / AA‐
SHRB* 2005 P/Q/R ‐ 15,970 4/1/2007 4/1/2038 3.927% 68% of 1‐Mo LIBOR + 18bp (1,084) (47)
Goldman Sachs Mitsui Marine
Derivative Products, L.P. Aa2 / AAA / NRSHRB* 2007 V 90,075 83,485 11/8/2007 10/1/2037 4.060% 69% of 1‐Mo LIBOR (6,251) (324) Royal Bank of Canada, New York Aa3/AA‐/AASHRB* 2008 BB 79,085 79,085 3/1/2009 10/1/2039 3.504% 68% of 1‐Mo LIBOR (6,916) (307) The Bank of New York Mellon Aa2 / AA‐ / AA‐SHRB* 2008 Y 74,925 69,125 5/1/2008 10/1/2039 3.757% 69% of 1‐Mo LIBOR (4,953) (361) The Bank of New York Mellon Aa2 / AA‐ / AA‐
295,805$ 281,940$ (21,640)$ 1 (1,117)$ 1
* Single‐Family Housing Revenue Bonds
Derivative instrument ∑ 1 = (22,757)
** If the weighted average of weekly one‐month LIBOR rates are equal to or greater than 3.50%, then the variable rate received will be 68%
of the USD‐LIBOR‐BBA; otherwise the variable rate received will be SIFMA + 1bp
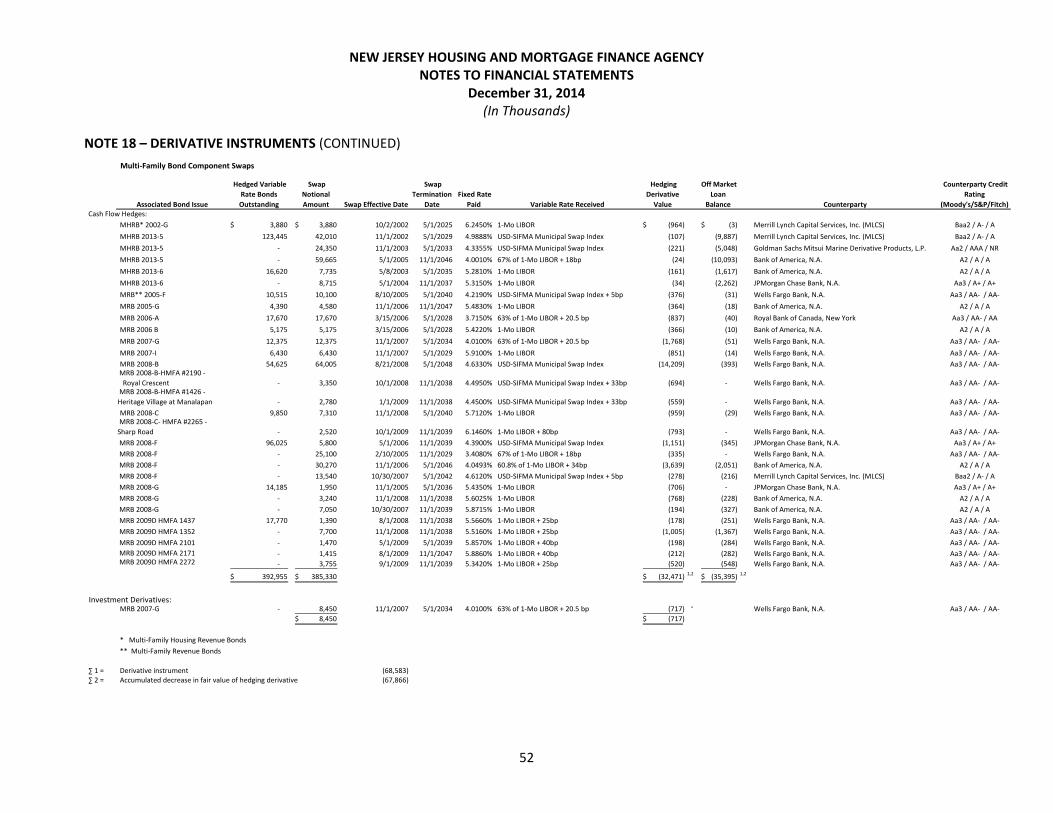
NEW JERSEY HOUSING AND MORTGAGE FINANCE AGENCY NOTES TO FINANCIAL STATEMENTS
December 31, 2014 (In Thousands)
52
NOTE 18 – DERIVATIVE INSTRUMENTS (CONTINUED)
Multi‐Family Bond Component Swaps
Associated Bond Issue
Hedged Variable
Rate Bonds
Outstanding
Swap
Notional
Amount Swap Effective Date
Swap
Termination
Date
Fixed Rate
Paid Variable Rate Received
Hedging
Derivative
Value
Off Market
Loan
Balance Counterparty
Counterparty Credit
Rating
(Moody's/S&P/Fitch) Cash Flow Hedges:
MHRB* 2002‐G 3,880$ 3,880$ 10/2/2002 5/1/2025 6.2450% 1‐Mo LIBOR (964)$ (3)$ Merrill Lynch Capital Services, Inc. (MLCS) Baa2 / A‐ / A
MHRB 2013‐5 123,445 42,010 11/1/2002 5/1/2029 4.9888% USD‐SIFMA Municipal Swap Index (107) (9,887) Merrill Lynch Capital Services, Inc. (MLCS) Baa2 / A‐ / A
MHRB 2013‐5 ‐ 24,350 11/1/2003 5/1/2033 4.3355% USD‐SIFMA Municipal Swap Index (221) (5,048) Goldman Sachs Mitsui Marine Derivative Products, L.P. Aa2 / AAA / NR
MHRB 2013‐5 ‐ 59,665 5/1/2005 11/1/2046 4.0010% 67% of 1‐Mo LIBOR + 18bp (24) (10,093) Bank of America, N.A. A2 / A / A
MHRB 2013‐6 16,620 7,735 5/8/2003 5/1/2035 5.2810% 1‐Mo LIBOR (161) (1,617) Bank of America, N.A. A2 / A / A
MHRB 2013‐6 ‐ 8,715 5/1/2004 11/1/2037 5.3150% 1‐Mo LIBOR (34) (2,262) JPMorgan Chase Bank, N.A. Aa3 / A+ / A+
MRB** 2005‐F 10,515 10,100 8/10/2005 5/1/2040 4.2190% USD‐SIFMA Municipal Swap Index + 5bp (376) (31) Wells Fargo Bank, N.A. Aa3 / AA‐ / AA‐
MRB 2005‐G 4,390 4,580 11/1/2006 11/1/2047 5.4830% 1‐Mo LIBOR (364) (18) Bank of America, N.A. A2 / A / A
MRB 2006‐A 17,670 17,670 3/15/2006 5/1/2028 3.7150% 63% of 1‐Mo LIBOR + 20.5 bp (837) (40) Royal Bank of Canada, New York Aa3 / AA‐ / AA
MRB 2006 B 5,175 5,175 3/15/2006 5/1/2028 5.4220% 1‐Mo LIBOR (366) (10) Bank of America, N.A. A2 / A / A
MRB 2007‐G 12,375 12,375 11/1/2007 5/1/2034 4.0100% 63% of 1‐Mo LIBOR + 20.5 bp (1,768) (51) Wells Fargo Bank, N.A. Aa3 / AA‐ / AA‐
MRB 2007‐I 6,430 6,430 11/1/2007 5/1/2029 5.9100% 1‐Mo LIBOR (851) (14) Wells Fargo Bank, N.A. Aa3 / AA‐ / AA‐
MRB 2008‐B 54,625 64,005 8/21/2008 5/1/2048 4.6330% USD‐SIFMA Municipal Swap Index (14,209) (393) Wells Fargo Bank, N.A. Aa3 / AA‐ / AA‐ MRB 2008‐B‐HMFA #2190 ‐
Royal Crescent ‐ 3,350 10/1/2008 11/1/2038 4.4950% USD‐SIFMA Municipal Swap Index + 33bp (694) ‐ Wells Fargo Bank, N.A. Aa3 / AA‐ / AA‐ MRB 2008‐B‐HMFA #1426 ‐
Heritage Village at Manalapan ‐ 2,780 1/1/2009 11/1/2038 4.4500% USD‐SIFMA Municipal Swap Index + 33bp (559) ‐ Wells Fargo Bank, N.A. Aa3 / AA‐ / AA‐
MRB 2008‐C 9,850 7,310 11/1/2008 5/1/2040 5.7120% 1‐Mo LIBOR (959) (29) Wells Fargo Bank, N.A. Aa3 / AA‐ / AA‐ MRB 2008‐C‐ HMFA #2265 ‐
Sharp Road ‐ 2,520 10/1/2009 11/1/2039 6.1460% 1‐Mo LIBOR + 80bp (793) ‐ Wells Fargo Bank, N.A. Aa3 / AA‐ / AA‐
MRB 2008‐F 96,025 5,800 5/1/2006 11/1/2039 4.3900% USD‐SIFMA Municipal Swap Index (1,151) (345) JPMorgan Chase Bank, N.A. Aa3 / A+ / A+
MRB 2008‐F ‐ 25,100 2/10/2005 11/1/2029 3.4080% 67% of 1‐Mo LIBOR + 18bp (335) ‐ Wells Fargo Bank, N.A. Aa3 / AA‐ / AA‐
MRB 2008‐F ‐ 30,270 11/1/2006 5/1/2046 4.0493% 60.8% of 1‐Mo LIBOR + 34bp (3,639) (2,051) Bank of America, N.A. A2 / A / A
MRB 2008‐F ‐ 13,540 10/30/2007 5/1/2042 4.6120% USD‐SIFMA Municipal Swap Index + 5bp (278) (216) Merrill Lynch Capital Services, Inc. (MLCS) Baa2 / A‐ / A
MRB 2008‐G 14,185 1,950 11/1/2005 5/1/2036 5.4350% 1‐Mo LIBOR (706) ‐ JPMorgan Chase Bank, N.A. Aa3 / A+ / A+
MRB 2008‐G ‐ 3,240 11/1/2008 11/1/2038 5.6025% 1‐Mo LIBOR (768) (228) Bank of America, N.A. A2 / A / A
MRB 2008‐G ‐ 7,050 10/30/2007 11/1/2039 5.8715% 1‐Mo LIBOR (194) (327) Bank of America, N.A. A2 / A / A
MRB 2009D HMFA 1437 17,770 1,390 8/1/2008 11/1/2038 5.5660% 1‐Mo LIBOR + 25bp (178) (251) Wells Fargo Bank, N.A. Aa3 / AA‐ / AA‐
MRB 2009D HMFA 1352 ‐ 7,700 11/1/2008 11/1/2038 5.5160% 1‐Mo LIBOR + 25bp (1,005) (1,367) Wells Fargo Bank, N.A. Aa3 / AA‐ / AA‐
MRB 2009D HMFA 2101 ‐ 1,470 5/1/2009 5/1/2039 5.8570% 1‐Mo LIBOR + 40bp (198) (284) Wells Fargo Bank, N.A. Aa3 / AA‐ / AA‐
MRB 2009D HMFA 2171 ‐ 1,415 8/1/2009 11/1/2047 5.8860% 1‐Mo LIBOR + 40bp (212) (282) Wells Fargo Bank, N.A. Aa3 / AA‐ / AA‐ MRB 2009D HMFA 2272 ‐ 3,755 9/1/2009 11/1/2039 5.3420% 1‐Mo LIBOR + 25bp (520) (548) Wells Fargo Bank, N.A. Aa3 / AA‐ / AA‐
392,955$ 385,330$ (32,471)$ 1,2 (35,395)$ 1,2
Investment Derivatives:MRB 2007‐G ‐ 8,450 11/1/2007 5/1/2034 4.0100% 63% of 1‐Mo LIBOR + 20.5 bp (717) 1 Wells Fargo Bank, N.A. Aa3 / AA‐ / AA‐
8,450$ (717)$
* Multi‐Family Housing Revenue Bonds
** Multi‐Family Revenue Bonds
∑ 1 = Derivative instrument (68,583) ∑ 2 = Accumulated decrease in fair value of hedging derivative (67,866)

NEW JERSEY HOUSING AND MORTGAGE FINANCE AGENCY NOTES TO FINANCIAL STATEMENTS
December 31, 2014 (In Thousands)
53
NOTE 18 – DERIVATIVE INSTRUMENTS (CONTINUED)
Credit Risk
The aggregate notional outstanding of hedging derivative instrument positions at December 31, 2014 was $675,720. This portfolio of derivative instruments is used to hedge $688,760 of variable rate debt as of December 31, 2014.
The swap agreements contain varying collateral agreements with the counterparties. At any point in time in which the outstanding swaps have positive fair values, each swap counterparty is required to post collateral to a third party when their credit rating, as determined by the specified nationally recognized credit rating agencies, falls below a trigger level as defined in the swap agreements. This protects the agency by mitigating the credit risk, and therefore termination risk, inherent in the swap. Collateral on all swaps is to be in the form of U.S. government securities held by a third‐party custodian.
Basis Risk
Basis risk exists to the extent the Agency’s variable‐rate bond coupon payments do not exactly equal the index on the swap. The Agency’s tax‐exempt bonds are hedged with tax‐exempt SIFMA based swaps and percentage of LIBOR swaps. The Agency’s taxable bonds are hedged with taxable, LIBOR‐based swaps. In this way, basis risk should be minimized.
Interest Rate Risk
The Agency’s interest rate swaps serve to guard against a rise in variable interest rates associated with its outstanding variable rate bonds. In addition, certain bond proceeds are invested in variable rate Guaranteed Investment Contracts (GICs) or other variable rate investment obligations in order to further mitigate interest rate risk on the variable rate bonds.
The Agency is invested in a pay‐fixed, receive‐variable interest rate swap with a notional amount of $8,450 at December 31, 2014. The Agency makes semiannual fixed payments to the counterparty of 4.01 percent and receives variable payments based on 63 percent of LIBOR, plus 20.5 basis points. This interest rate swap was executed in November 2007 and matures in May 2034. At December 31, 2014, this interest rate swap had a fair value of $(717).
Termination Risk
The Agency retains the right to terminate any swap agreement at the market value prior to maturity, and the Agency was granted the right to cancel certain agreements, in whole or in part, at Par. The Agency has termination risk under the contract particularly if an Additional Termination Event (ATE) as defined in the swap documents were to occur. An ATE occurs if either the credit rating of the bonds associated with a specific swap, or the credit rating of the swap counterparty falls below a threshold defined in each swap agreement. The Agency has purchased termination payment insurance on certain swap contracts, which acts as a buffer against a portion of potential termination payments if an ATE was to occur. As long as the swap insurer maintains at least a minimal rating as defined in the swap documents, the insurance policy will allow the Agency to avoid termination due to a decline in the credit rating of the agency bonds. If at the time of termination the swap has a negative fair value, the Agency would be liable to the counterparty for a payment equal to the swap’s fair value.
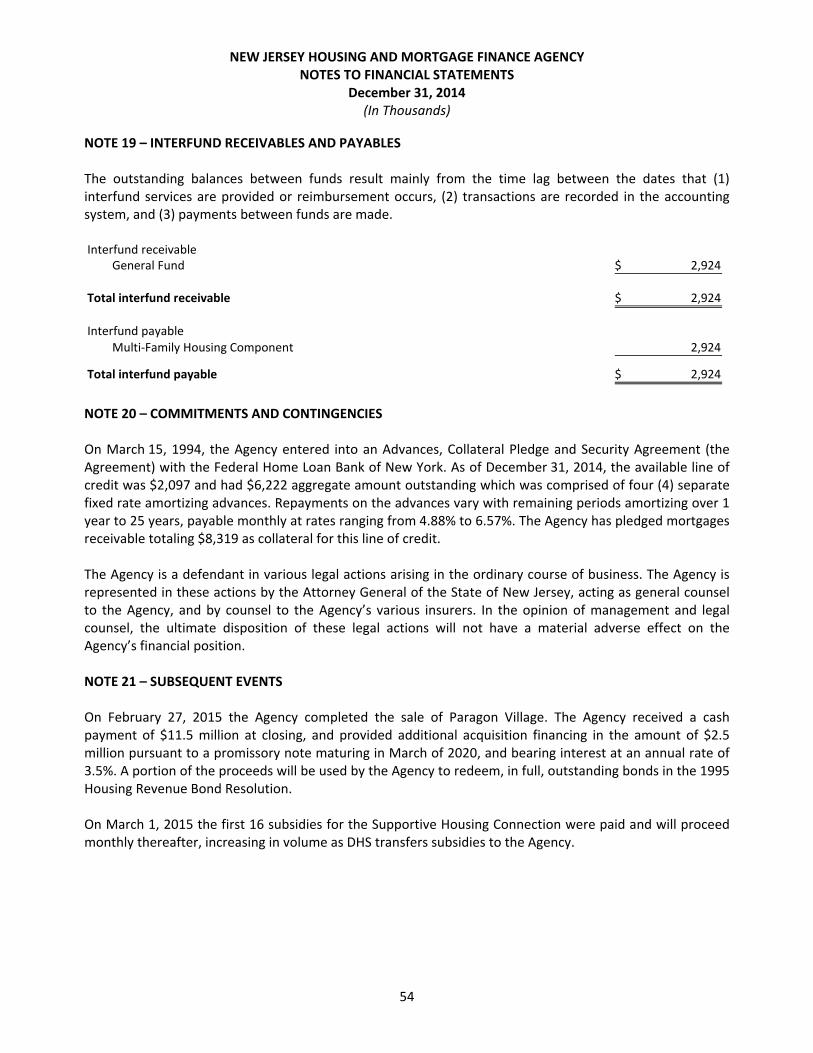
NEW JERSEY HOUSING AND MORTGAGE FINANCE AGENCY NOTES TO FINANCIAL STATEMENTS
December 31, 2014 (In Thousands)
54
NOTE 19 – INTERFUND RECEIVABLES AND PAYABLES The outstanding balances between funds result mainly from the time lag between the dates that (1) interfund services are provided or reimbursement occurs, (2) transactions are recorded in the accounting system, and (3) payments between funds are made. Interfund receivable
General Fund 2,924$
Total interfund receivable 2,924$
Interfund payableMulti‐Family Housing Component 2,924
Total interfund payable 2,924$
NOTE 20 – COMMITMENTS AND CONTINGENCIES On March 15, 1994, the Agency entered into an Advances, Collateral Pledge and Security Agreement (the Agreement) with the Federal Home Loan Bank of New York. As of December 31, 2014, the available line of credit was $2,097 and had $6,222 aggregate amount outstanding which was comprised of four (4) separate fixed rate amortizing advances. Repayments on the advances vary with remaining periods amortizing over 1 year to 25 years, payable monthly at rates ranging from 4.88% to 6.57%. The Agency has pledged mortgages receivable totaling $8,319 as collateral for this line of credit. The Agency is a defendant in various legal actions arising in the ordinary course of business. The Agency is represented in these actions by the Attorney General of the State of New Jersey, acting as general counsel to the Agency, and by counsel to the Agency’s various insurers. In the opinion of management and legal counsel, the ultimate disposition of these legal actions will not have a material adverse effect on the Agency’s financial position. NOTE 21 – SUBSEQUENT EVENTS On February 27, 2015 the Agency completed the sale of Paragon Village. The Agency received a cash payment of $11.5 million at closing, and provided additional acquisition financing in the amount of $2.5 million pursuant to a promissory note maturing in March of 2020, and bearing interest at an annual rate of 3.5%. A portion of the proceeds will be used by the Agency to redeem, in full, outstanding bonds in the 1995 Housing Revenue Bond Resolution. On March 1, 2015 the first 16 subsidies for the Supportive Housing Connection were paid and will proceed monthly thereafter, increasing in volume as DHS transfers subsidies to the Agency.

NEW JERSEY HOUSING AND MORTGAGE FINANCE AGENCY NOTES TO FINANCIAL STATEMENTS
December 31, 2014 (In Thousands)
55
NOTE 21 – SUBSEQUENT EVENTS (CONTINUED) In advance of and in conjunction with the implementation of a Mortgage‐Backed Securities (“MBS”) program, the Agency entered into a $50 million Revolving Line of Credit and Security Agreement (“Facility”) with Wells Fargo Bank, National Association on January 5, 2015. This Facility will provide a continual source of advance funding for the origination of up to $50 million in single family mortgage loans prior to the issuance of single family mortgage revenue bonds, the sale of whole loans and/or MBS to approved purchasers, or any other permanent take‐out funding source(s) subsequently approved by the Board. Utilization of this Facility will further enhance the Agency’s mission by offering more competitive mortgage rates without being limited by the availability of Agency funds. On March 26, 2015, the Agency issued $69.6 million of publically‐offered taxable and tax‐exempt Multi‐Family Revenue Bonds (“MFRB”), and $31.8 million of tax‐exempt direct purchase MFRB draw down bonds to finance 26 new money rental housing developments containing a total of 1,637 multifamily units. In addition, this financing included a $109.8 million taxable fixed rate refunding component which refunded $57.6 million of fixed rate bonds, and $52.1 million of hedged variable rate bonds (“VRDN’s”). The VRDN‐related Interest Rate Swaps are fully cancelable at Par, and will be terminated at no cost to the Agency on 5/1/15. The refunding is expected to generate approximately $8.1 million in net present value (PV) savings (7.38% of the bonds) to the Agency. In conjunction with the MF 2015 Series A‐F financing discussed above, on February 23, 2015, Standard & Poors Ratings Services, Inc. (“S&P”) raised its rating for the Agency’s outstanding Multifamily Revenue Bonds Resolution one notch to “AA‐” from “A+”. The AA‐ rating reflects S&Ps view of NJHMFA's very strong strategy and management of the Resolution, very high loss coverage based on the Resolution's strong overcollateralization, the Resolution's strong financial performance and loss coverage indicated by 1.45x weighted average debt service coverage and increasing parity within the Resolution, and extremely strong ongoing governmental support in the form of low‐income housing tax credits, Federal Housing Administration mortgage insurance, Section 8 rental subsidies, property tax exemptions, and tax‐exempt bond financing. Partially offsetting the above‐mentioned strengths is S&P’s assessment of the Resolution's average operating performance, based on loan delinquencies of 60 days or more of about 3% (by loan balance). At the same time, S&P provided a rating of “AA‐” to the NJHMFA’s Series 2015 A, B, C, D, E, F Bonds. Finally, Standard & Poor's affirmed its 'AAA/A‐1' rating on NJHMFA's Series 2008 B, C, F, and G variable‐rate Multifamily Revenue Bonds. The outlook on all issues is stable. NOTE 22 – PENDING GASB PRONOUNCEMENTS The Agency will be required to implement GASB Statement No. 68, Accounting and Financial Reporting for Pensions – an amendment of GASB Statement No. 27 for the period ending December 31, 2015. The objective of this Statement is to improve accounting and financial reporting by state and local government employers for the pension in which they are involved. The Agency is currently evaluating the effect of the implementation of this Statement.
NEW JERSEY HOUSING AND MORTGAGE FINANCE AGENCY NOTES TO FINANCIAL STATEMENTS
December 31, 2014 (In Thousands)
This information is an integral part of the accompanying financial statements 56
NOTE 22 – PENDING GASB PRONOUNCEMENTS (CONTINUED) The Agency will be required to implement GASB Statement No. 71, Pension Transition for Contributions Made Subsequent to the Measurement Date – an amendment of GASB Statement No. 68 for the period ending December 31, 2015. The objective of this Statement is to address an issue regarding the provisions of Statement No. 68 relating to contributions, if any, made by a state or local government employer or nonemployer contributing entity to a defined benefit pension plan after the measurement date of the beginning net pension liability. The Agency is currently evaluating the effect of the implementation of this Statement.

57
REQUIRED SUPPLEMENTARY INFORMATION

NEW JERSEY HOUSING AND MORTGAGE FINANCE AGENCY SCHEDULE OF FUNDING PROGRESS ‐ OPEB
As of December 31, 2014 (In Thousands)
58
Actuarial UAAL as a
Actuarial Accrued Percentage of
Actuarial Value of Liability Unfunded AAL Funded Covered Covered
Valuation Assets (AAL) Ratio Payroll Payroll Payroll
Date (a) (b) (b‐a) (a/b) (c) (b‐a)/c
January 1, 2009 ‐$ 29,199$ 29,199$ 0.00% 18,466$ 158.10%
January 1, 2011 ‐ 45,393 45,393 0.00% 18,209 249.30%
January 1, 2013 ‐ 56,411 56,411 0.00% 16,625 339.30%

59
SUPPLEMENTARY INFORMATION

NEW JERSEY HOUSING AND MORTGAGE FINANCE AGENCY SCHEDULE OF NET POSITION – SINGLE‐FAMILY HOUSING PROGRAM
December 31, 2014 (In Thousands)
60
Housing Home
Revenue Bond Mortgage 2013Resolution Bonds Total Total
ASSETS
CURRENT ASSETS
Restricted cash and cash equivalents 64,923$ 24,431$ 89,354$ 73,988$
Accrued interest receivable on investments 414 ‐ 414 367
Mortgage loans receivable, net 19,432 9,851 29,283 31,513
Due from loan servicers and insurers 2,311 781 3,092 2,723
Other current assets 37,070 7,754 44,824 22,334
Total current assets 124,150 42,817 166,967 130,925
NONCURRENT ASSETS
Restricted investments 46,567 ‐ 46,567 38,073
Mortgage loans receivable, net 661,294 406,103 1,067,397 1,199,555
Debt service arrears receivable, net 7,477 3,961 11,438 16,453
Supplemental mortgages and other loans, net 184 161 345 12,765
Real estate owned 5,230 1,518 6,748 4,660
Total noncurrent assets 720,752 411,743 1,132,495 1,271,506
TOTAL ASSETS 844,902 454,560 1,299,462 1,402,431
DEFERRED OUTFLOW OF RESOURCESAccumulated decrease in fair value
of hedging derivatives 22,757 ‐ 22,757 28,606
LIABILITIES AND NET POSITION
CURRENT LIABILITIES
Bonds and obligations, net 21,990$ 12,060$ 34,050$ 34,165$
Accrued interest payable on bonds
and obligations 6,731 3,821 10,552 12,601
Interfund allocation ‐ ‐ ‐ 1,734
Other current liabilities 991 420 1,411 4,411
Total current liabilities 29,712 16,301 46,013 52,911
NONCURRENT LIABILITIES
Bonds and obligations, net 689,016 434,487 1,123,503 1,247,562
Derivative instrument 22,757 ‐ 22,757 28,606
Total non‐current liabilities 711,773 434,487 1,146,260 1,276,168
Total liabilities 741,485 450,788 1,192,273 1,329,079
DEFERRED INFLOWS OF RESOURCES
Commitment fees 821 111 932 1,127
NET POSITION
Restricted under bond and obligation
resolutions 125,353 3,661 129,014 100,831
TOTAL NET POSITION 125,353$ 3,661$ 129,014$ 100,831$
FY 2014
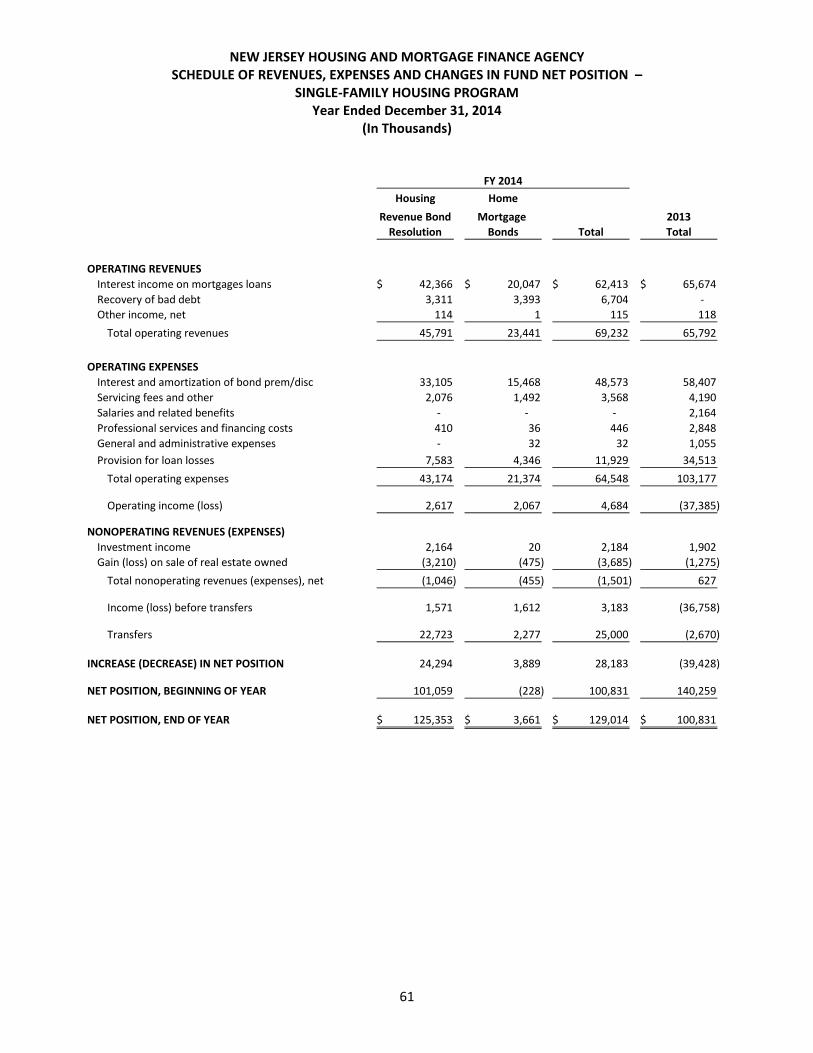
NEW JERSEY HOUSING AND MORTGAGE FINANCE AGENCY SCHEDULE OF REVENUES, EXPENSES AND CHANGES IN FUND NET POSITION –
SINGLE‐FAMILY HOUSING PROGRAM Year Ended December 31, 2014
(In Thousands)
61
Housing Home
Revenue Bond Mortgage 2013
Resolution Bonds Total Total
OPERATING REVENUES
Interest income on mortgages loans 42,366$ 20,047$ 62,413$ 65,674$
Recovery of bad debt 3,311 3,393 6,704 ‐
Other income, net 114 1 115 118
Total operating revenues 45,791 23,441 69,232 65,792
OPERATING EXPENSES
Interest and amortization of bond prem/disc 33,105 15,468 48,573 58,407
Servicing fees and other 2,076 1,492 3,568 4,190
Salaries and related benefits ‐ ‐ ‐ 2,164
Professional services and financing costs 410 36 446 2,848
General and administrative expenses ‐ 32 32 1,055
Provision for loan losses 7,583 4,346 11,929 34,513
Total operating expenses 43,174 21,374 64,548 103,177
Operating income (loss) 2,617 2,067 4,684 (37,385)
NONOPERATING REVENUES (EXPENSES)
Investment income 2,164 20 2,184 1,902
Gain (loss) on sale of real estate owned (3,210) (475) (3,685) (1,275)
Total nonoperating revenues (expenses), net (1,046) (455) (1,501) 627
Income (loss) before transfers 1,571 1,612 3,183 (36,758)
Transfers 22,723 2,277 25,000 (2,670)
INCREASE (DECREASE) IN NET POSITION 24,294 3,889 28,183 (39,428)
NET POSITION, BEGINNING OF YEAR 101,059 (228) 100,831 140,259
NET POSITION, END OF YEAR 125,353$ 3,661$ 129,014$ 100,831$
FY 2014

NEW JERSEY HOUSING AND MORTGAGE FINANCE AGENCY SCHEDULE OF NET POSITION – MULTI‐FAMILY HOUSING PROGRAM
December 31, 2014 (In Thousands)
62
General
Housing Loan 2013
Bond Funds 1991‐I 1995 2005 Total Total
ASSETS
CURRENT ASSETS
Restricted cash and cash equivalents 8,711$ 4$ 78,541$ 118,630$ 205,886$ 164,584$
Restricted investments 12,699 ‐ ‐ ‐ 12,699 54,037
Accrued interest receivable on investments ‐ 62 525 183 770 908
Mortgage loans receivable, net 1,050 3,904 17,314 15,580 37,848 58,122
Supplemental mortgages and other loans, net ‐ ‐ ‐ ‐ ‐ ‐
Other current assets ‐ ‐ 10 50 60 57
Total current assets 22,460 3,970 96,390 134,443 257,263 277,708
NONCURRENT ASSETS
Restricted investments ‐ 6,954 63,466 25,192 95,612 83,358
Mortgage loans receivable, net 5,386 87,988 321,879 441,623 856,876 882,872
Debt service arrears receivable, net 2 ‐ ‐ 125 127 1,808
Supplemental mortgages and other loans, net ‐ ‐ 11,547 36,741 48,288 46,690
Real estate owned 2,250 ‐ 47,385 ‐ 49,635 47,385
Derivative instrument ‐ ‐ ‐ ‐ ‐ 7,553
Other noncurrent assets ‐ ‐ ‐ 90 90 123
Total noncurrent assets 7,638 94,942 444,277 503,771 1,050,628 1,069,789
TOTAL ASSETS 30,098 98,912 540,667 638,214 1,307,891 1,347,497
DEFERRED OUTFLOW OF RESOURCES
Accumulated decrease in fair value of hedging
derivatives ‐ ‐ 30,421 37,445 67,866 61,856
LIABILITIES AND NET POSITION
CURRENT LIABILITIES
Bonds and obligations, net 3,955$ 3,865$ 21,575$ 15,175$ 44,570$ 60,370$
Accrued interest payable on bonds
and obligations 93 1,146 2,271 3,889 7,399 6,810
Mortgagor escrow deposits 1,124 ‐ ‐ ‐ 1,124 2,775
Interfund allocation 150 ‐ 1,393 1,381 2,924 3,111
Other current liabilities ‐ ‐ 36 38 74 79
Total current liabilities 5,322 5,011 25,275 20,483 56,091 73,145
NONCURRENT LIABILITIES
Bonds and obligations, net 6,675 94,330 334,370 511,552 946,927 996,439
Minimum escrow requirement 219 ‐ 3,607 3,419 7,245 7,858
Funds held in trust for mortgagor 7,951 ‐ 17,551 28,337 53,839 40,350
Other noncurrent liabilities ‐ 3 666 1,479 2,148 1,290
Derivative instrument ‐ ‐ 30,421 38,162 68,583 62,800
Total noncurrent liabilities 14,845 94,333 386,615 582,949 1,078,742 1,108,737
Total liabilities 20,167 99,344 411,890 603,432 1,134,833 1,181,882
DEFERRED INFLOW OF RESOURCES
Accumulated increase in fair value of hedging derivatives ‐ ‐ ‐ ‐ ‐ 7,879
NET POSITION (DEFICIT)
Restricted under bond and obligation resolutions 9,931 (432) 159,198 72,227 240,924 219,592
TOTAL NET POSITION 9,931$ (432)$ 159,198$ 72,227$ 240,924$ 219,592$
FY 2014

NEW JERSEY HOUSING AND MORTGAGE FINANCE AGENCY SCHEDULE OF REVENUE, EXPENSES AND CHANGES IN FUND NET POSITION
MULTI‐FAMILY HOUSING PROGRAM Year Ended June 30, 2014
(In Thousands)
63
General
Housing Loan 2013
Bond Funds 1991‐I 1995 2005 Total Total
OPERATING REVENUES
Interest income on mortgages loans 400$ 6,563$ 22,472$ 29,324$ 58,759$ 50,024$
Fees and charges 338 135 2,910 3,164 6,547 8,202
Recovery of bad debt 4,928 ‐ 8,024 10,702 23,654 72,138
Gain on derivative ‐ ‐ 326 227 553 118
Other income ‐ net 70 ‐ 183 773 1,026 1,710
Total operating revenues 5,736 6,698 33,915 44,190 90,539 132,192
OPERATING EXPENSES
Interest and amortization of bond
premium/discounts 776 7,022 17,294 25,730 50,822 56,831
Insurance costs ‐ ‐ 38 146 184 303
Servicing fees and other ‐ 270 ‐ ‐ 270 270
Salaries and related benefits ‐ ‐ 1,778 1,672 3,450 3,596
Professional services and financing costs 53 11 320 558 942 3,004
General and administrative expenses ‐ ‐ 762 720 1,482 1,681
Provision for loan losses 121 ‐ 6,440 10,129 16,690 17,081
Total operating expenses 950 7,303 26,632 38,955 73,840 82,766
Operating income (loss) 4,786 (605) 7,283 5,235 16,699 49,426
NONOPERATING REVENUES (EXPENSES)
Investment income 3 266 3,056 1,624 4,949 6,447
Loss on early extinguishment of old debt ‐ ‐ ‐ ‐ ‐ ‐
Total nonoperating revenues
(expenses), net 3 266 3,056 1,624 4,949 6,447
Income (loss) before transfers 4,789 (339) 10,339 6,859 21,648 55,873
TRANSFERS ‐ ‐ (62) (254) (316) (97)
INCREASE IN NET POSITION 4,789 (339) 10,277 6,605 21,332 55,776
NET POSITION, BEGINNING OF YEAR 5,142 (93) 148,921 65,622 219,592 163,816
NET POSITION, END OF YEAR 9,931$ (432)$ 159,198$ 72,227$ 240,924$ 219,592$
FY 2014