Embed Size (px)
Citation preview

New Jersey Highlands Water Protection and Planning CouncilDRAFT March 19, 2015
- DRAFT -- Confidential -

FISCAL IMPACT ASSESSMENT
• Regional Economic Evaluation
• Demographic and Real Estate Analysis
• Fiscal and Financial Analysis
• Final Fiscal Impact Assessment Report

AGENDA
• Data Sources+ Where do the numbers come from?
• Municipal Classification+ Comparing like to like
• Economic Evaluation+ Measuring employment change
• Correlations+ Factors that influence employment change


EMPLOYMENT DATA
Quarterly Census of Employment and Wages (QCEW)• Data collected by State
for Workmen’s Compensation
• Data for each job location• Monthly job counts• Data lag about 9 months• < 1% data error• Confidential
Longitudinal Employer-Household Dynamics Program (LEHD)• Census Bureau program
linking QCEW data with tax returns
• Consistency across states• Most recent data is 2011;
almost a year behind schedule
• Public

SOCIAL/DEMOGRAPHIC DATA
Decennial Census• Data collected by the
Census Bureau every 10 years
• Consistent across states• High sample rate, low
statistical error rate• Beginning in 2010, no
long-form; census collects only number of people, age, race, and gender
American Community Survey (ACS)• Successor to the Census• Surveys conducted each
year• Small sample size, higher
statistical error rates• For jurisdictions with less
than 20,000 people, data are combined over a five-year period


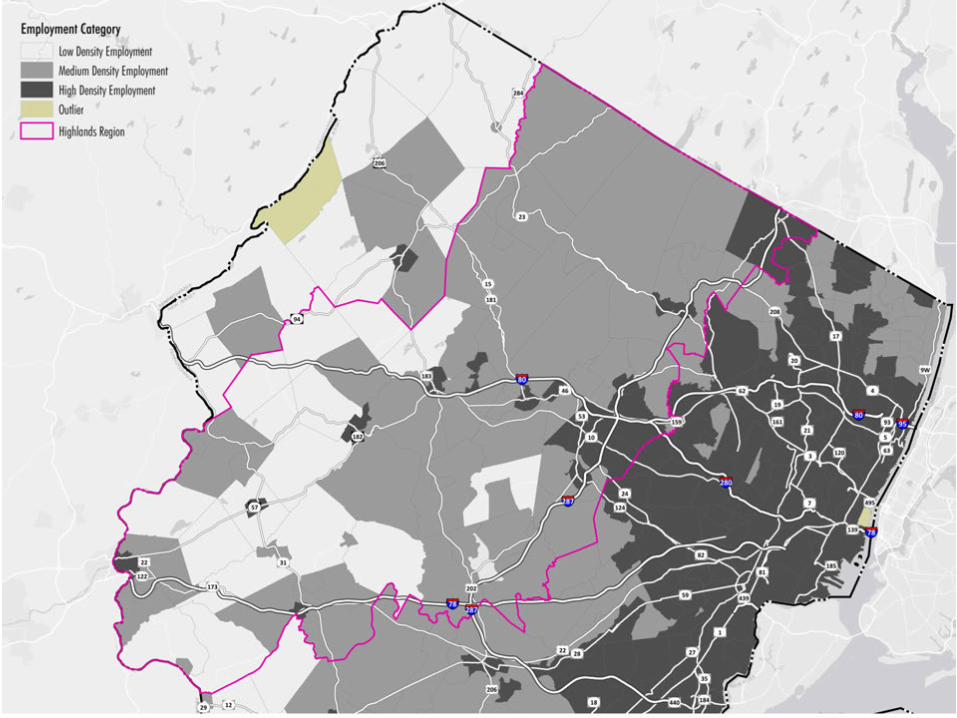
MUNICIPAL CLASSIFICATIONS
• Meant to ensure that the analysis compares similar jurisdictions
• Classification based on population and employment density
• Classification uses a net acreage for each jurisdiction
• Population data from 2000 Census; Employment data for 2004 LEHD
• Net acreage excludes water, wetlands, and federal, state, and local open space
• Agricultural easements were not excluded

LAND AREAS EXCLUDED FROM DENSITY


DENSITY CLASSIFICATION VALUES
Greater Than Less Than Classification Value
Low population density 0 .62 10
Medium population density .62 4.5 20
High population density 4.5 19.83 30
Low employment density 0 .12 1
Medium employment density .12 2.08 2
High employment density 2.08 17.59 3
Population Density: Persons per Acre | Employment Density: Total Jobs per Acre


NATIONAL ECONOMIC CONTEXTUS Quarterly Gross Domestic Product
Purple areas show the time periods analyzed in the FIA
0
4,000
8,000
12,000
16,000
1947
1951
1955
1959
1963
1967
1971
1975
1979
1983
1987
1991
1995
1999
2003
2007
2011
Billi
ons o
f Cha
ined
200
5 Do
llars

NATIONAL ECONOMIC CONTEXTUS Total Employment, Seasonally Adjusted
Purple areas show the time periods analyzed in the FIA
0
20
40
60
80
100
120
140
1947
1951
1955
1959
1963
1967
1971
1975
1979
1983
1987
1991
1995
1999
2003
2007
2011
Tota
l Num
ber o
f Job
s in
Mill
ions

NATIONAL ECONOMIC CONTEXT
0
500
1,000
1,500
2,000
2,500
1968
1973
1978
1983
1988
1993
1998
2003
2008
2013
Seas
onal
ly A
djus
ted
Annu
al R
ate
(1,0
00 u
nits
)
US Monthly Housing Completions
Purple areas show the time periods analyzed in the FIA
NEW JERSEYAREA COMPARISON
• Using Confidential Data from the Quarterly Census of Employment and Wages (QCEW)
• Data represents average monthly employment for the years 2004, 2008, and 2013


TOTAL EMPLOYMENT, NORTHERN NEW JERSEY
0
1,000,000
2,000,000
Highlands Region Highlands CountyMunicipalities not in the
Highlands Region
Northern New Jersey
2004 2008 2013

RATE OF CHANGE IN TOTAL EMPLOYMENT
Highlands Region
Highlands CountyMunicipalities notin the Highlands
Region
Northern NewJersey Total New Jersey
04 to 08 0.86% 0.69% 0.57% 0.39%08 to 13 -0.56% -0.52% -0.81% -0.63%
-1.0%
-0.5%
0.0%
0.5%
1.0%
Annu
al R
ate
of C
hang
e in
Tot
al E
mpl
oym
ent
12,000 20,000 48,000 61,000-10,000 -19,000 -84,000 -122,000

TOTAL EMPLOYMENT, HIGHLANDS REGION
0
100,000
200,000
300,000
400,000
PreservationArea
ConformingPlanning Area
Non-ConformingPlanning Area
Planning Area ConformingHighlandsCenters
HighlandsRegion
2004 2008 2013

CHANGE IN TOTAL EMPLOYMENT
PreservationArea
ConformingPlanning
Area
Non-Conforming
PlanningArea
PlanningArea
ConformingHighlands
Centers
HighlandsRegion
04 to 08 -0.18% 2.33% 0.59% 0.98% 2.83% 0.86%08 to 13 -1.23% -0.69% -0.42% -0.48% 0.74% -0.56%
-2.0%
-1.0%
0.0%
1.0%
2.0%
3.0%
Annu
al R
ate
of C
hang
e in
Tot
al E
mpl
oym
ent
-300 6,000 6,000 12,000 4,000 12,000-2,000 -2,000 -5,000 -7,000 1,000 -10,000

NEW JERSEY AREA CONCLUSIONS
• Relative to Northern New Jersey and the State as a whole, the Highlands Region had a higher employment growth rate from 2004 to 2008, and less job loss from 2008 to 2013.
• Within the Highlands Region, the preservation area was the only geographic area with negative job growth rate from 2004 to 2008, for a decline of 300 jobs. It also had the highest job loss rate from 2008 to 2013, for a total five-year decline of 2,400 jobs.
• The conforming Highlands Centers generated the highest employment growth rates from 2004 to 2008 and from 2008 to 2013.

INTERSTATE COMPARISONS
• Using Data from the Census Bureau’s Longitudinal Employer-Household Dynamics (LEHD) Program
• Data represents average annual employment for each year from 2002 to 2011

TOTAL EMPLOYMENT
0
500,000
1,000,000
1,500,000
2,000,000
2,500,000
2002
2003
2004
2005
2006
2007
2008
2009
2010
2011
Northern New Jersey
Highlands CountyMunicipalities not in theHighlands Region
Adjacent New York Region
Adjacent PennsylvaniaRegion
Highlands Region

HighlandsRegion
HighlandsCounty
Municipalitiesnot in theHighlands
Region
Northern NewJersey
Adjacent NewYork Region
AdjacentPennsylvania
Region
07 to 08 724 532 -6,464 4,211 -66108 to 09 -16,231 -19,816 -57,000 -25,544 -14,12309 to 10 1,352 -1,988 6,461 10,131 4,310
-60,000
-40,000
-20,000
0
20,000
Chan
ge in
Tot
al E
mpl
oym
ent
RECESSION EFFECT ON EMPLOYMENT
700 500 -6,000 4,000 -700-16,000 -20,000 -57,000 -26,000 -14,0001,000 -2,000 6,000 10,000 4,000

RATE OF CHANGE IN EMPLOYMENT
HighlandsRegion
HighlandsCounty
Municipalitiesnot in theHighlands
Region
Northern NewJersey
Adjacent NewYork Region
AdjacentPennsylvania
Region
02 to 04 0.1% -0.2% -0.4% -0.5% 1.9%04 to 08 2.8% 1.9% 1.8% 5.6% 7.7%08 to 11 -1.5% -0.9% -1.0% -0.6% 0.1%
-2%
0%
2%
4%
6%
8%An
nual
Rat
e of
Cha
nge
in T
otal
Em
ploy
men
t
800 -2,000 -16,000 -5,000 14,0007,000 9,000 25,000 22,000 20,000
-15,000 -19,000 -61,000 -10,000 700

ANNUAL RATE OF EMPLOYMENT CHANGE
-5%
-4%
-3%
-2%
-1%
0%
1%
2%
3%
2003 2004 2005 2006 2007 2008 2009 2010 2011
Observed Growth Rate Expansion Period Trend
Slowing Growth and Recession Trend Early Recovery Period Trend
Highlands Region

ANNUAL RATE OF EMPLOYMENT CHANGE
-5%
-4%
-3%
-2%
-1%
0%
1%
2%
3%
2003 2004 2005 2006 2007 2008 2009 2010 2011
Observed Growth Rate Expansion Period Trend
Slowing Growth and Recession Trend Early Recovery Period Trend
Highlands Region

ANNUAL RATE OF EMPLOYMENT CHANGE
-5%
-4%
-3%
-2%
-1%
0%
1%
2%
3%
2003 2004 2005 2006 2007 2008 2009 2010 2011
Highlands Region Adjacent New York Region Adjacent Pennsylvania Region

ANNUAL RATE OF EMPLOYMENT CHANGE
-5%
-4%
-3%
-2%
-1%
0%
1%
2%
3%
2003 2004 2005 2006 2007 2008 2009 2010 2011
Highlands Region
Highlands County Municipalities Not in the Highlands Region
Northern New Jersey

ANNUAL RATE OF EMPLOYMENT CHANGE
-5%
-4%
-3%
-2%
-1%
0%
1%
2%
2003 2004 2005 2006 2007 2008 2009 2010 2011
Highlands Region 18-County Interstate Region

INTERSTATE COMPARISON CONCLUSIONS
• From 2004 to 2008, the Highlands Region rate of employment change was higher than the NJ comparison regions and lower than the interstate comparison regions.
• From 2008 to 2011, the Highlands Region had the lowest rate of employment growth among the comparison regions, but this reflects recovery from the recession rather than an economic trend.
• The QCEW data show that the Highlands Counties (in the Highlands Region and outside) outperformed Northern New Jersey from 2008 to 2013, while the LEHD shows the opposite from 2008 to 2011. This suggests that employment recovery came more slowly to these seven counties.

INTERSTATE COMPARISON CONCLUSIONS
• The Highlands Region’s trend in rate of employment change was more or less similar to the other regions; it was never the extreme value.
• Recession-related job losses were the end result of a five-year trend of slowing then declining rate of employment change among the comparison regions.
• The trend in the Highlands Region appears to be tied to the overall regional economy rather than a result of the Act and the RMP.
• The trends in the Highlands county municipalities not in the Highlands Region appear to the somewhat out of sync with the broader regional economy.

MUNICIPAL-LEVELCOMPARISONS

ANNUAL EMPLOYMENT GROWTH RATE
-8%
-4%
0%
4%
8%
04 to 08 08 to 13
Highlands Region (13)Non-Highlands Municipalities (11)Northern New Jersey (26)
Low Population and Low Employment Density
Medium Population and Medium Employment Density
-8%
-4%
0%
4%
8%
04 to 08 08 to 13
Highlands Region (47)Non-Highlands Municipalities (27)Northern New Jersey (83)

CONCLUSION FROM MUNICIPAL LEVEL ANALYSIS
• There is no consistent pattern of employment change at the municipal level to find that a municipality’s location in the Highlands Region had a positive or negative impact on economic growth from 2004 to 2008 and from 2008 to 2013.


CORRELATIONS CONCLUSIONS, 2004 TO 2008
• 12.1 percent of the change in employment explained by:+ Population density in 2000 (negative)+ Percentage change in portion of population with only
a high school diploma 2000 to 2010 (negative)+ Manufacturing sector’s share of total jobs in 2004
(positive)• Location in the Highlands Region does not have a
statistically significant correlation with the rate of change in employment growth from 2004 to 2008.

CORRELATIONS CONCLUSIONS, 2008 TO 2013
• 19.3 percent of the change in employment explained by:+ Percentage change in median age from 2010 to 2013
(negative)+ Construction sector’s share of total jobs in 2008
(positive)• Location in the Highlands Region does not have a
statistically significant correlation with the rate of change in employment growth from 2008 to 2013.


OVERALL CONCLUSION
The employment and demographic data analysis revealed no statistically relevant basis to conclude that the Act or the RMP had a positive or negative impact on economic growth in the Highlands Region.

FIA: NEXT STEPS
• Regional Economic Evaluation
• Demographic and Real Estate Analysis
• Fiscal and Financial Analysis
• Final Fiscal Impact Assessment Report