Embed Size (px)
Citation preview

60
Following the first period of weak subgrade support and after rut development has stabilized, the SFA system surface is graded (with or without the addition of aggregate) and smoothness is restored. The SFA system is then surfaced (probably with a surface treatment) • If necessary, the SFA system could be surfaced initially and then resurfaced following the period of development of rut depth.
A similar approach is possible for applications of track systems. Following initial development of permanent deformation in the ballast-subgrade system, the track could be resnrfr1cP.c'l, thus a desirr1hle level of track geometry could be restored. Subsequent development of permanent deformation would be minimized because of the structural improvement affected by the fabric.
The construction procedure in stages permits the use of the full potential of the fabric (separation and structural improvement). Note that to maximize structural improvement effects it is necessary to develop significant permanent deformation in the fabric.
SUMMARY
Structural improvement effects, as evidenced by ILLI-PAVE-calculated vertical stress distributions and vertical deflections in a conventional SFA system, are not achieved for the small permanent ~e:1:0~1-i1a\..l.0uo \..i!;'tl.Ca.l.l~- CJ.\t:-i:i i..:;,-J..::-C~, .... uuo ~z~ -.;!..:.u.~
experimental data are confirmed. BISAR structural analyses of a typical SFA system indicated the beneficial effects of no-slippage conditions at the aggregate-subgrade interface (it is postulated that fabric will decrease slippage at the interface) .
A simplified confinement model indicated that, if significant permanent deformation is developed in an SFA system, a substantial percentage increase in confinement can hP. developed. This effect is most pronounced for soft subgrade conditions.
Fabric can be used beneficially in the construction or rehabilitation of the transportation support system in many situations. The most-promising applications are unsurfaced aggregate layers (lowtraffic-volume roads and track systems) • We postu-
Transportation Research Record 810
late that a construction procedure in stages (surface treatment of an aggregate road following the initial period of reduced subgrade support) would be feasible for low-traffic-volume roads. The concept of construction in stages also can be applied to track system problems.
ACKNOWLEDGMENT
This study was conducted by the Department of Civil Engineering, University of Illinois, at UrbanaChampaign under the sponsorship of the Celanese Fibers Marketing Company.
REFERENCES
l. M.R. Thompson and L. Raad. Fabric Utilization in Transportation Support Systems. Univ. of Illinois, Urbana-Champaign, Rept. UILU-ENG-79-2021, Dec. 1979.
2. E.L. Wilson. LSTRN3, A Computer Program for Finite Element Analysis of Plane Structures. Univ. of California, Berkeley, Jan. 1967.
3. J. Hales, J. Dowland, and E.J. Barenberg. Interim Report: Evaluation of Fabric Membrane in Pavement Systems. Univ. of Illinois, UrbanaChampaign, 1975.
4. o. Anderson. The Use of Plastic Fabrics for Pavemen_t Protection During Frost Break. International Conference on the Use of Fabrics in
?n-?1 , 1 Q77 .
5. O. Anderson and S. Freden. The Plastic Fabric Upon the Pavement Frost I Jard, Norwegian Committee Oslo, Norway, July 1977.
Influence of a at Frost Break.
on Permafrost,
6. S.F. Brown, B.V. Brodrick, Permanent Deformation of European Research Office, Final Tech. Rept., June 1980.
and J.W. Pappin. Flexible Pavements. U.S. Army, London,
7. T.C. Kinney. Fabric-Induced Changes in High Deformation Soil-Fabric-Aggregate Systems. Univ. of Illinois, Urbana-Champaign, Ph.D. dissertation, June 1978.
Publication of this paper sponsored by Committee on Strength and Deformation Characteristics of Pavement Sections.
New Interpretation of Plate-Bearing Tests
R. BUTTERFIELD AND M. GEORGIADIS
A new procedure for interpreting plete·bearing tests is proposed that allows the complete nonlinear pressure versus displacement curve to be described in terms of stiffness parameters that are quite independent of the plate size. The nonlinear model incorporates shear springs in between the usual Winkler compression springs and requires conventional plate tests on plates of two different sizes in order to determine the two stiffness contributions. The predictive capacity of the procedure has been demonstrated by tests on both London clay and Kaolin with square plates that span an 8: 1 size range as well as in situ tests from the literature. Examples are also included to illustrate its application to the analysis of soil-supported, very flexible elastic beams.
The conventional plate-bearing test, in which a rigid plate (area A) is pushed vertically into the ground at a constant rate, is a convenient way to generate information on the stiffness and load capacity of such a system. The load (Q) (or pres-
sure, q = Q/A) versus displacement (w) curves obtained are usually of the form shown in Figure l, which depicts the mean results of a series of circular plate tests on a remolded London clay bed (wL = 65 percent; wp 23 percent; w c 25 ± l percent; and cu 97 kN/m 2 ). Each of the curves shown is, in fact, a very close, best-fit representation of the experimental results by using the empirical equation for a plate of diameter D.
q/qu = Q/Qu =I - exp[-{K0 - Kr)(w/D)] + Kr(w/D)
where
Ko koD/qu, Kf kfD/qu,
(!)

Transportation Research Record 810
Figure 1. Pressure-displacement curves for rigid plates.
0
Table 1. Diameter-dependent stiffness parameters for a remolded London clay.
Parameter
D= 12.5 D= 25 Item mm mm
qu (N/mm2) 1.03 0.94 k0 (N/mm3) 1.95 1.15 kr ('N/mm3) 0.04 0.026 Ko 23.7 30.6 Kr 0.49 0.69
k0 initial stiffness, kf final stiffness, and
D= 50 mm
0.83 0.65 0.018
39.2 1.08
qu pressure axis intercept.
D = 63.5 D= 76 mm mm
0.78 0.75 0.56 0.48 0.014 0.012
45.6 48.6 1.14 1.22
The key parameters k0 , kf, and qu are all defined as shown in Figure 1. We have used Equation 1 in previous papers (.!_,l), although neither the values of qu, k0 , and kf nor Qu, K0 , and Kf, which generate each best-fit curve, are constant and, as is well known, qu, k0 , and kf all decrease with increasing size of bearing plate (Table 1). In all the tests being discussed, the loads varied slowly enough for dynamic effects to be negligible and sufficiently rapidly for soil consolidation not to be the underlying cause of the dependence on the plate size.
That the coefficient of subgrade reaction (k0 =
Q/Aw), which represents the initial, approximately linear, part of the loading curves, decreases with increasing plate size was first noted by Engesser (3). He suggested, in relation to beams (of breadth Bl on elastic foundations, that an empirical equation should be used, of the form
k =a+ (b/B) (2)
Equation 2 is actually a compromise between the k = constant (Winkler) model and the result for a linear elastic half space [k "' l/BJ. A similar empirical equation was proposed by Housel (4) for the interpretation of plate-bearing tests on cohesive soils. He introduced the concept of an edge shear contribu-
2
61
3 4 5 6 7 8 DISPLACEMENT (mml
tion around the plate perimeter (P) and assumed the plate pressure (q) to consist of a base reaction component (a) and a peripheral component [B(P/A)]
q =a+ ~(P/A) (3)
The objective of most plate tests is to provide data that can be used to predict the response of larger footings, pavements, beams, and rafts. Although analyses can be developed to include the nonlinear behavior implicit in Equation 1 (2), the crucial problem still remains that, inevitably, the diameter of the plate used to establish the curves (Figure 1) radically affects the results obtained. As an illustration of this point, Figure 2 (1) shows the predicted load-displacement response -at the midpoint of a centrally loaded elastic beam (500x63.5x3.9 mm) based on the Figure 1 plate-test data and Equation 1. The heavy line is the experimental result obtained, which shows that the correct plate size to use was D = 125 mm--about twice the breadth of the beam. This is, of course, not known a priori and is unlikely to be a useful general rule. Indeed, Georgiadis (2) found that the bestfit plate size varied with both beam breadth and thickness.
This paper presents an extension of Engesser' s idea, which follows naturally from a generalization of the Winkler spring model, due to Pasternak (§), in which the simple compression springs are each interconnected by a shear spring. The Winkler stiffness (k) is thereby augmented by a shear spring (stiffness = g). W~ shall extend this model to include a complete nonlinear response, as in Figure 1, and show how unique, plate-diameter-independent stiffnesses can be obtained quite simply that remove, for example, the ambiguities of Figure 2.
ANALYSIS OF PLATE-BEARING TESTS
The extended Pasternak model is illustrated in Figure 3 and incorporates nonlinear shear spring coupling [stiffness g(w0 )] between each nonlinear compression spring [stiffness k (w)]. The shear springs are entirely equivalent to adding a foundation resistance proportional to the curvature of the
62
Figure 2. Center point load-displacement curves for a soil-supported flexible beam.
Transportation Research Record 810
12.5 mm 25m
q'"-~+---.!-~~1-o,..µ~~,,c....-1--~~~~~~--1-~~~-1-~~~'"-~~--1
D ct 0 ...J
soil surface, which leads to a pressure-displacement relationship for the ground given by Kerr (]),
(4)
where we have written, for convenience, k = k(w) and g = g (w0 ) , both of which are nonlinear functions of displacement but quite independent of plate size.
By analyzing plate test results we found that g influences the displacement much less than does k and, therefore, since shear deformation is also maximum adjacent to the plate, we have adopted the assumption indicated above that g = g (wo) (i.e., that g varies with plate displacement but is otherwise constant throughout the supporting soil).
For an unloaded surface region q = 0 and, therefore, if we write p(w) : kw, we have
(5)
Figure 3. Idealized foundation model.
~a
g~~::f~ . '~Tr ~i iilllllilliiL . (a)
Region II Region I
I b I
Experimental curves
Predicted curves
2 3 4 5 6 7 8
DISPLACEMENT l mm l
Because g is only a function of wo, it is easily established by integrating Equation 5,
dw/dx = ../(2/g) f p(w ·dw (6)
Since many practical applications of plate tests relate to rectilinear beams and foundation slabs, we consider that this provides a justification for studying square plates rather than circular ones.
Figure 3 shows a rigid square plate (B x B) supporting a total load (Q). There are four regions (such as I) surrounding it, each of which, if they deform independently, contributes a reaction R to the plate calculable from Equations 5 and 6 as
R=B i~ p(w)dx=Bg0·5 iWo [p(w)·dw/V2fp(w)dw] (7)
The soil reaction immediately under gion II) is (from Equation 4) P (w0 ), hence
the plate (resimply kw0 _
rWO
q = Q/D2 = p(w0 ) + (4g0·5/B) Jo [p(w)·dw/\/ 2 J iJ(w)dw] (8)
In the development of this equation we have ignored the effect of the four regions immediately outside the corners of the plate. Calculations of the lateral extent of the deformed soil surface, when plates are displaced up to 10 percent of their breadth, suggest that errors due to this will be very small even for 50 mm plates. Experiments bear this out and the effect will be even less for larger plates.
Although at first sight Equation 8 looks rather formidable, comparison with Equation 3 will show that they have a similar torm (a term dependent on B and one that is not). Suppose, therefore, that we have results from two plate tests (side lengths B1 and B2) then, if we start from the unloaded state, we can rewrite Equation 8 for each plate as
Transportation Research Record 810
(9a)
and
(9b)
In these equations ql and q2 are the pressures that displace each plate by w0 and, since g, k, and p are functions of w0 only, "' and a are identical in each of them. The simultaneous solving of the equations provides "' (w0 ) p (w0 ) and S(w0 ). If p and a are known, we can approximate the integrals in Equation 7 numerically and
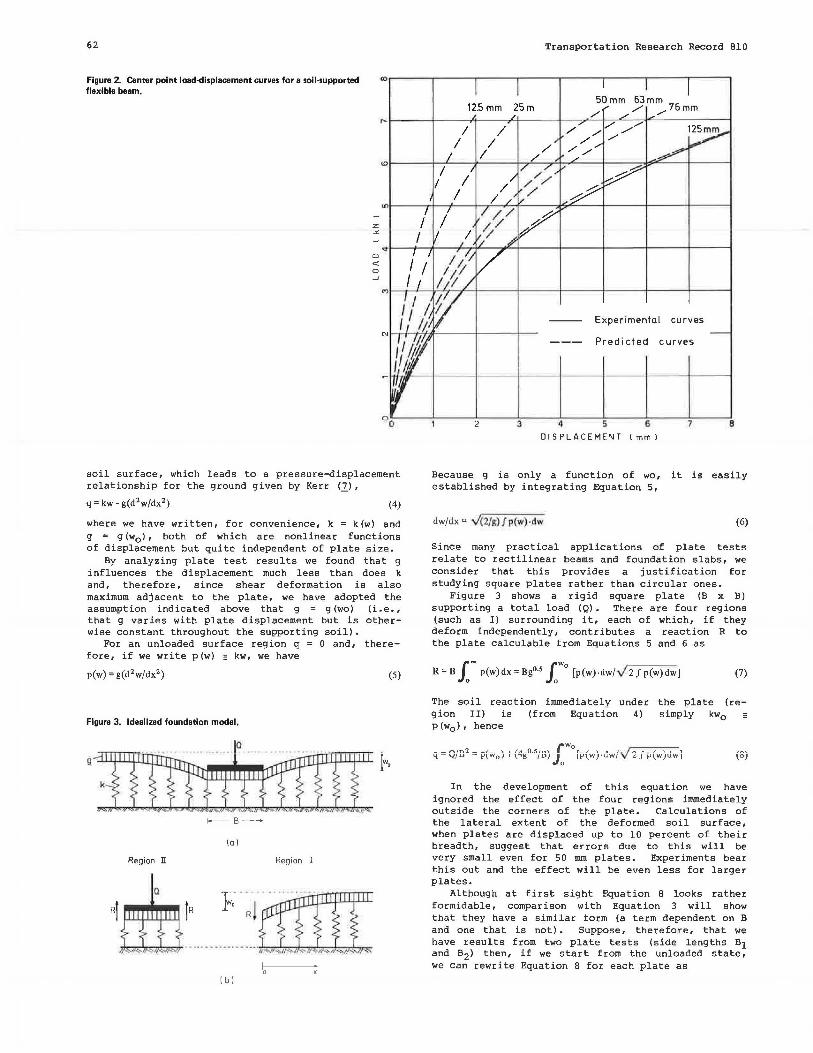
Figure 4. Square plate tests on London clay.
0 <t
~ ~l-~'----+~~~-i-~~~±-~~---'~~~-1-~~----1
DISPLACEMENT <mml
§ N
~ 0 81--~~.¥'~~-4-~~~1--~~4-~~-4-~~---1 <t !2 0 _J
DISPLACEMENT ( mml
§t---~-;-~-t-~----1~~-r-=:--t-~-----j ....
~ ~1--~~-i>'<-~-1-~~~1--~~-+-~~-1-~~----1 _J
( c)
o._~~ ...... ~~~--~~~ ....... ~~ ...... ~~~~~~__. 0 2 3 4 5 6
DISPLACEMENT (mm)
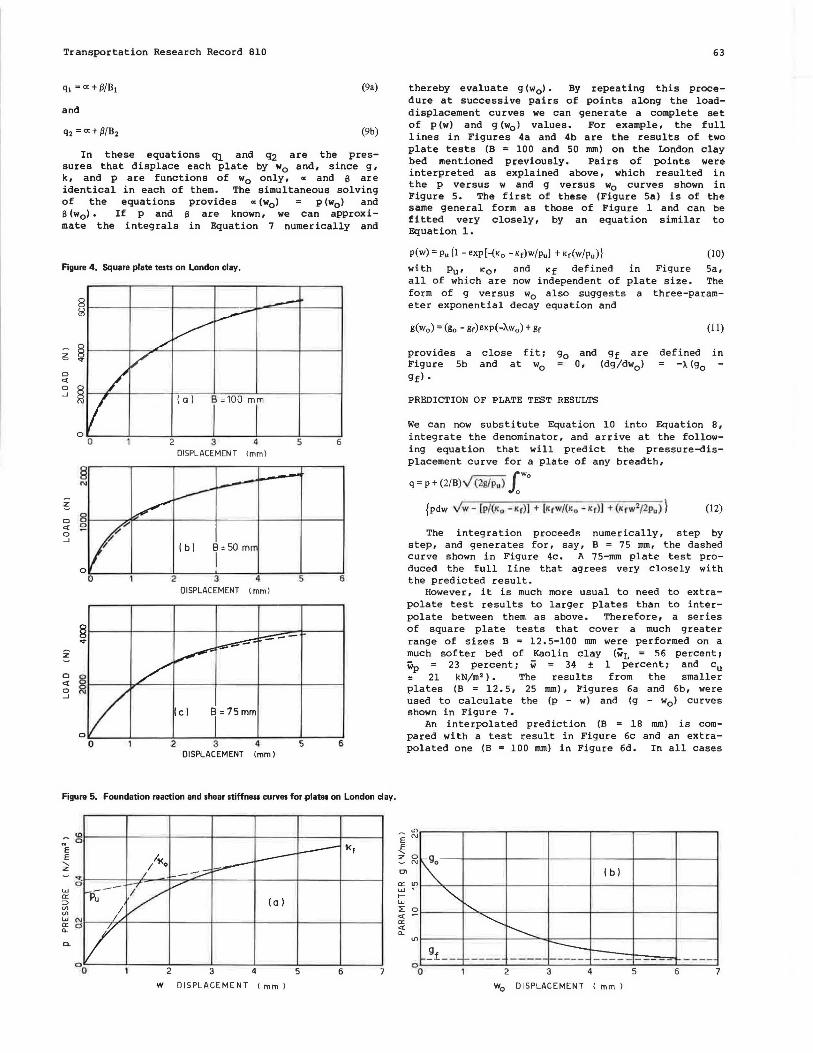
Figure 5. Foundation reaction and shear stiffness curves for plates on London clay.
l<f
7
W DISPLACEMENT <mm)
E ~ z
63
thereby evaluate g (w0 J. By repeating this procedure at successive pairs of points along the loaddisplacement curves we can generate a complete set of p (wl and g (w0 ) values. For example, the full lines in Figures 4a and 4b are the results of two plate tests (B = 100 and SO mm) on the London clay bed mentioned previously. Pairs of points were interpreted as explained above, which resulted in the p versus w and g versus w0 curves shown in Figure S. The first of these (Figure Sa) is of the same general form as those of Figure l and can be fitted very closely, by an equation similar to Equation 1.
(IO)
with Pu• ic 0 , and Kf defined in Figure Sa, all of which are now independent of plate size. The form of g versus w0 also suggests a three-parameter exponential decay equation and
provides a Figure Sb gf).
close fit: and at w0
g0 and gf are O, (dg/dw0 )
PREDICTION OF PLATE TEST RESULTS
(! !)
defined in ->.(go
We can now substitute Equation 10 into Equation 8, integrate the denominator, and arrive at the following equation that will predict the pressure-displacement curve for a plate of any breadth,
q = p + (2/B).../fiiJP.J iwo {pdw Yw- (p/(1( 0 - Kr)] + [ICrw/(1< 0 -Kr)J + (1<rw1/ 2r>u) } (12)
The integration proceeds numerically, step by step, and generates for, say, B = 7S mm, the dashed curve shown in Figure 4c. A 75-mm plate test produced the full line that agrees very closely with the predicted result.
However, it is much more usual to need to extrapolate test results to larger plates than to interpolate between them as above. Therefore, a series of square plate tests that cover a much greater range of sizes B = 12. 5-100 mm were performed on a much softer bed of Kaolin clay (wL = 56 percent i wp 23 percent: w 34 ± 1 percent: and cu
21 kN/m 2 ). The results from the smaller plates (B = 12. 5, 25 mm), Figures 6a and 6b, were used to calculate the (p - w) and (g - w0 ) curves shown in Figure 7.
An interpolated prediction (B • 18 mm) is compared with a test result in Figure 6c and an extrapolated one (B = 100 mm) in Figure 6d. In all cases
L()
"' 0
"' Cl ~ I b I a:: w I-w ::>: <t a:: <t a..
L()
""" 0
.__'!.t._ __ 0
0
"" ~ r'---
----------- ----1------- --- -- r--- ---2 3 4 5 6 7
W0 DISPLACEMENT <mm J

64
Figure 6. Square plate tests on Kaolin. 0
"' 0 ... 0 M
~
0 0 N
<[
0 ...J
0
0
OD 0.5 1.0 1.5 2.0 25
"' N
0 N
"' z
0 0
<[
0 ...J
"' 0
0.0 0.5 1.0 1.5 2.0 2.5 DISPLACEMENT !mm)
Figure 7. Foundation reaction and shear stiffness curves for plates on Kaolin.
.. E E ..... z
w
"' ::>
"'
0 M
z 0 N
D <[
0 ...J
0
0
0 ..,. N
:z 0
~ D <[
u ...J
0 ro
0
ml
"' ... w t-w
Transportation Research Record 810
B = 18 mm
ns 1.0 1.5 2.0 2.5
0.0 0.5 1.0 1.5 2.0 2.5 DISPLACEME NT !mm)
Yo "
~ ! b I
~ --"' w
"' t--f+~--t~~~-;--~~~1-~~---1~~~--j~ ~----· ----- --- ----g.
a..
0..
Figure 8. Interpretation of field test data.
~
·-' "' c.
"" w
"" ~ ::> U)
"' w
"" a..
"'
(o)
0.5 1.0 1.5 2.0
W DISPLACEMENT ( mm l
Ko :55.6 lb/in'
Kf = 5.25 lb/in' Pu=26.0 lb/in2
90
=1130 lb/in
91 =184 lb/in
~ =0.771. in-'
0.0 0.5 1.0 1.5 2.0 2.5 3.0 DISPLACEMENT <i nl
0: N
~
0 2.5 0 05 1.0 1.5 2.0
W0
DISPLACEMENT <mm)
Each curve is an average of (b)
three field tests
2 4 6 8
DISPLACEMENT <mm)
Ko=6800 kN/ m3
Kf = 2600 kN/m3
Pu= 20 kN/m2
g0 =1850 kN/ m
g1 = 300 kN/m
>- = 0.145 mm-1
10
2.5
12

Transportation Research Record 810
prediction and experiment agree very closely, even over an 8: 1 range of plate sizes, which appears to confirm that the new interpretation procedure does establish a valid set of size-independent stiffness parameters.
Further supporting evidence is shown in Figure Ba and Sb, in each of which the full lines refer to experiments and the dashed ones to predicted curves based on two of the tests irtterpreted as explained previously. The results in Figure Ba are Housel' s (!) tests on a plastic yellow clay and those in Figure Sb are due to Osterberg (~) who used Buckshot clay. These tests were not really continued far enough to predict the constant, final stiffness (Kf) value, although they do show that the fitting technique can be used successfully in spite of this.
INTERPRETATION OF BEAM ON ELASTIC FOUNDATION TESTS
The work stemmed from a study of very flexible, metal, aircraft landing mats, one aspect of which
Figure 9. Comparison between experiment and prediction: flexible "° beams on London clay (t = 3.9 mm and B = 63.5 mm).
D
"' 0 -'
D
"' 0 -'
ao 0
65
was to predict the static, load-deflection character is tics of any centrally loaded component of the mat from plate-bearing test data.
A nonlinear, transfer-matrix (~) analysis of the problem was developed based on Equation 1 together with a no-tension condition across the soil-plank interface (l,2_). Such an analysis can predict the mat response (Figure 2) if one is fortunate enough to guess the correct plate size to use. The new interpretation of plate tests reported here eliminates this problem, as exemplified by Figures 9 and 10, which compare experimental and analytical loaddisplacement curves at both central and offset points for model mats (B = 63.5 mm) of two different thicknesses (t = 3.9 and 5.9 mm) bedded on London clay. The parameters used in the analyses were those obtained from Figure 5 and the computer program was modified to include the edge shear contribution, which arises from g, along the plank boundary.
Mat tests were also performed on the Kaolin clay bed. Figures 11 and 12 show similar comparisons
2 3 4
---- -~.:: ~
~ -Y-
/ ~ I bl 50 mm FROM MIDDLE
/' N
0
00 o.s 1.0 1.5 2.0 2.5 3.0
DISPLACEMENT (mm)
Figure 10. Comparison between experiment and prediction: flexible beams on London clay (t = 5.9 mm andB = 63.5 mm).
D
"' 0 -'
(a I Ml ODLE POINT
2 3 4
DISPLACEMENT Imm)
D
"' 0 -'
<D
"' /
v
0 / 5 0.0 0.5 1.0
...-,-.~
~
~ ~
~
(bl 50mm FROM MIDDLE
1.5 2.0 2.5 3.0
DISPLACEMENT (mm)
35 4.0
3.5

66 Transportation Research Record 810
Figure 11. Comparison between experiment and prediction: flexible beams on Kaolin clay IB • 30 mm and t = 1.2 mm).
c <[
0 ...J
(al MIDDLE POINT
1.0 DISPLACEMENT (mml
Figure 12. Comparison between experiment and prediction: flexible beams on Kaolin clay (Ba 40 mm and t = 1.2 mm).
125
0 0
"'
a Lil
0 z $1
0 <[
0 _J
/ ~
L~ ~
';<'" 9"
';<'"' ?
/' !Y
!Y
/
I (b) 50 mm FROM MIDDLE
I 1.5 00 0.1 0.2 0.3 0.4 0.5 0.6
DISPLACEMENT <mml
w ~ ....... --~
... .....
........-:::: ..... ~~ ....
f ~/ /"'
/ ,..
v (a) MIDDLE POINT !Y
~ # 0 Lil
I 0
0 8 "'
0 Ill
z g
0 <[
0 _J
0 Lil
0 0
between measurement and prediction (now based on the Figure 7 parameters) for mats of different breadth (B = 30, 40 mm) • In every case the predictions are remarkably good.
CONCLUDING REMARKS
The salient features of the new, general interpretation of static plate-bearing tests are as follows:
1. An extension of the use of shear-spring cou-
1.0 2.0 3.0 4.0
~ ~ ....
/ ~
A?
~ ~
& //
I I ( b) 50mm FROM MIDDLE
I 0.5 1.0 1.5 2.0
DISPLACEMEN T mm)
pling is given, originally due to Pasternak (~.l,
between conventional Winkler springs to develop a nonlinear model of the supporting soil:
2. The stiffness parameters introduced can be determined from conventional tests on plates of two different sizes: and
3. These parameters, six in number and summarized in Table 2, are independent of plate size and describe accurately the complete nonlinear load-displacement curve for all plates within at least an 8:1 range of dimensions.

Transportation Research Record 810
Table 2. Size-independent stiffness parameters.
Parameter
Item London Clay Kaolin Clay
Pu (N/mm 2) 0.33 0.0095
K 0 (N/mm3) 0.32 0.031 Kr (N/mm3
) 0.038 0.001 !lo (N/mm) 20.0 6.6 gf (N/mm) 1.0 2.6 X(l/mm) 0.53 2.1
The nonlinear Winkler-spring-plus-shear-spring model has been used successfully in soil-supported flexible beam analyses, following Kerr <llr augmented by an edge shear resistance along the beam length, and also for the prediction of the response of rigid plates and footings to eccentric loads (10) and as an improvement on the conventional p-y analysis of laterally loaded piles (11).
ACKNOWLEDGMENT
We are pleased to acknowledge the support provided by the Military Vehicles and Engineering Establishment, Christchurch, for the work on landing mats and plates.
REFERENCES
1. R. Butterfield and M. Georgiadis. The Response of Model, Flexible Landing Mats to Cyclic Loading. International Symposium on Soils under Cyclic and Transient Loading, Swansea, England, 1979, pp. 697-703.
67
2. R. Butterfield and M. Georgiadis. Cyclic Plate Bearing Tests. Journal of Terramechanics, Vol. 17, No. 3, 1980, pp. 149-160.
3. F. Engesser. Zur Theorie des Baugraundes. Zentralblatt der Bauverwaltung, Berlin, Germany, 1893.
4. w.s. Housel. A Practical Method of the Selec-tion of Foundations. Univ. of Michigan, Engi-neering Research Bull., 1929.
5. M. Georgiadis. Flexible Landing Mats on Clay. Univ. of Southampton, Southampton, England, Ph.D. thesis, 1979.
6. P.L. Pasternak. On a New Method of Analysis of an Elastic Foundation by Means of Two Foundation Constants. Gosudarstvennoe Izdatelstvo Literaturi po Stroitelstvo i Arkhitekture, Moscow, 1954.
7. A.D. Kerr. Elastic and Viscoelastic Foundation Models. Journal of Applied Mechanics, ASME, Transactions, Vol. 31, No. 3, 1964, pp. 491-498.
8. T.O. Osterberg. Discussion: Symposium on Load Testing of Bearing Capacity of Soils. AS'IM, No. 79, 1948, pp. 128-148.
9. E.G. Pestel and F.A. Leckie. Matrix Methods in Elastomechanics. McGraw-Hill, New York, 1963.
10. R. Butterfield and M. Georgiadis. The Non-Linear Load Displacement Response of Eccentr ically Loaded Footings. 3rd International Symposium, Soil Mechanics Foundation Engineering, Dresden, East German Democratic Republic, 1980.
11. R. Butterfield and M. Georgiadis. A Non-Linear Analysis of Laterally Loaded Piles. Division of Soil Mechanics, ASCE (forthcoming).
Publication of this paper sponsored by Committee on Pavement Condition Evaluation.
Nottingham Pavement Test Facility
S.F. BROWN AND B.V. BRODRICK
The Nottingham pavement test facility was developed for the experimental study of pavement structures under wheel loading. A description is given of its mode of operation and capabilities. It is located in a laboratory and allows pavement sections 4.8x2.4 m to be subjected to moving wheel loads up to 15 kN at contact pressures comparable with actual commercial traffic and at speeds up to 16 km/h. Electronic controls allow a lateral distribution of wheel passes while loading may be either unidirectional or bidirectional. Controlled temperature and moisture conditions can be achieved. Each pavement under test is instrumented to measure transient stress and strain. Permanent strains and surface deformations are measured at intervals during loading. Typical tests continue until 100 000 wheel passes have been applied. The main objective of the research for which the facility has been developed is the provision of data for comparison with theoretical predictions of pavement response to load as part of an effort to produce analytically based methods of pavement design.
In developing workable procedures for pavement design based on the use of theoretical concepts, data from controlled, realistic pavement tests play an important part in the validation exercise. Philosophically, we must demonstrate that theoretical models work in a controlled situation so that their use in the more variable real environment can be approached with confidence.
The pavement test facility at Nottingham grew out of an earlier dynamic plate loading and test pit
facility (!.) through a need to apply rolling wheel loads so that the stresses generated in the structures were representative of those expected in real pavements. The earlier work had demonstrated that linear elastic theory was valid, but the equipment could not provide data for tackling the extension of this to the prediction of pavement performance and, in particular, the development of permanent deformation.
Although some full-scale trials, such as that at Brampton (~) , had produced data on rutting that was used for comparison with theoretical predictions, a laboratory-based test facility was considered more helpful in checking the details of computational procedures and for understanding the mechanisms of deformation. This is possible by use of more detailed in situ instrumentation than is generally available with full-scale trials and the exercise of greater control over materials and test conditions. Nonetheless, the full-scale trial still has a valuable role to play in extending theory to practice.
The design of the pavement test facility was, to some extent, dictated by the available space. A test pit 2.4 m on each side by 1.5-m deep was doubled in size to occupy almost the full length of