Embed Size (px)
DESCRIPTION
The Tyrolean Iceman, a 5,300-year-old Copper age individual, was discovered in 1991 on the Tisenjoch Pass in the Italian part of the Ötztal Alps. Here we report the complete genome sequence of the Iceman and show 100% concordance between the previously reported mitochondrial genome sequence and the consensus sequence generated from our genomic data. We present indications for recent common ancestry between the Iceman and present-day inhabitants of the Tyrrhenian Sea, that the Iceman probably had brown eyes, belonged to blood group O and was lactose intolerant. His genetic predisposition shows an increased risk for coronary heart disease and may have contributed to the development of previously reported vascular calcifications. Sequences corresponding to ~60% of the genome of Borrelia burgdorferi are indicative of the earliest human case of infection with the pathogen for Lyme borreliosis.
Citation preview
ARTICLE
�nATuRE CommunICATIons | 3:698 | DoI: 10.1038/ncomms1701 | www.nature.com/naturecommunications
© 2012 Macmillan Publishers Limited. All rights reserved.
Received 28 oct 2011 | Accepted 24 Jan 2012 | Published 28 Feb 2012 DOI: 10.1038/ncomms1701
The Tyrolean Iceman, a 5,300-year-old Copper age individual, was discovered in 1991 on the Tisenjoch Pass in the Italian part of the Ötztal Alps. Here we report the complete genome sequence of the Iceman and show 100% concordance between the previously reported mitochondrial genome sequence and the consensus sequence generated from our genomic data. We present indications for recent common ancestry between the Iceman and present-day inhabitants of the Tyrrhenian sea, that the Iceman probably had brown eyes, belonged to blood group o and was lactose intolerant. His genetic predisposition shows an increased risk for coronary heart disease and may have contributed to the development of previously reported vascular calcifications. sequences corresponding to ~60% of the genome of Borrelia burgdorferi are indicative of the earliest human case of infection with the pathogen for Lyme borreliosis.
1 Department of Human Genetics, Saarland University, 66421 Homburg, Saar, Germany. 2 Siemens Healthcare, 91052 Erlangen, Germany. 3 Institute for Mummies and the Iceman, EURAC research, 39100 Bolzano, Italy. 4 Division of Molecular Genetics, Institute of Human Genetics, University of Tuebingen, 72074 Tuebingen, Germany. 5 Febit biomed GmbH, 69120 Heidelberg, Germany. 6 Institute of Clinical Molecular Biology, Christian-Albrechts-University Kiel, Kiel, Germany. 7 Genome Sequencing Collaborations Group, Life Technologies, Beverly, Massachusetts 01915, USA. 8 Department of Genetics, Stanford University School of Medicine, Stanford, California 94305, USA. 9 Dipartimento di Genetica e Microbiologia, Università di Pavia, Via Ferrata, 1 27100 Pavia, Italy. 10 Unité Mixte de Recherche 6578, Centre National de la RechercheScientifique, and EtablissementFrançais du Sang, Biocultural Anthropology, Medical Faculty, Université de la Méditerranée, 13916 Marseille, France. 11 Department of Evolutionary Biology, University of Tartu and Estonian Biocentre, 23 Riia Street, 510101 Tartu, Estonia. 12 Sorenson Molecular Genealogy Foundation, Salt Lake City, Utah 84115, USA. 13 Departamento de Genética, Facultad de Biología, Universidad de La Laguna, Tenerife 38271, Spain. 14 Department of Pathological Anatomy and Histology, General Hospital Bolzano, 39100 Bolzano, Italy. 15 Department of Internal Medicine III, University of Heidelberg, 69120 Heidelberg, Germany. 16 The Ontario Institute for Cancer Research, 101 College Street, Suite 800, Toronto, Ontario, Canada M5G 0A3. 17 Nimbus Informatics LLC, 104R NC Hwy 54 West, Suite 252, Carrboro, North Carolina 27510, USA. 18 Department of Computational Biology, Fred Hutchinson Cancer Research Center, Seattle, Washington 98109, USA. 19 Department of Genetics, Wroclaw Medical University, 50-368 Wroclaw, Poland. *These authors contributed equally to this work. Correspondence and requests for materials should be addressed to A.Z. (email: [email protected]).
new insights into the Tyrolean Iceman’s origin and phenotype as inferred by whole-genome sequencingAndreas Keller1,2,*, Angela Graefen3,*, markus Ball4,*, mark matzas5, Valesca Boisguerin5, Frank maixner3, Petra Leidinger1, Christina Backes1, Rabab Khairat4, michael Forster6, Björn stade6, Andre Franke6, Jens mayer1, Jessica spangler7, stephen mcLaughlin7, minita shah7, Clarence Lee7, Timothy T. Harkins7, Alexander sartori7, Andres moreno-Estrada8, Brenna Henn8, martin sikora8, ornella semino9, Jacques Chiaroni10, siiri Rootsi11, natalie m. myres12, Vicente m. Cabrera13, Peter A. underhill8, Carlos D. Bustamante8, Eduard Egarter Vigl14, marco samadelli3, Giovanna Cipollini3, Jan Haas15, Hugo Katus15, Brian D. o’Connor16,17, marc R.J. Carlson18, Benjamin meder15, nikolaus Blin4,19, Eckart meese1, Carsten m. Pusch4 & Albert Zink3
ARTICLE
��
nATuRE CommunICATIons | DoI: 10.1038/ncomms1701
nATuRE CommunICATIons | 3:698 | DoI: 10.1038/ncomms1701 | www.nature.com/naturecommunications
© 2012 Macmillan Publishers Limited. All rights reserved.
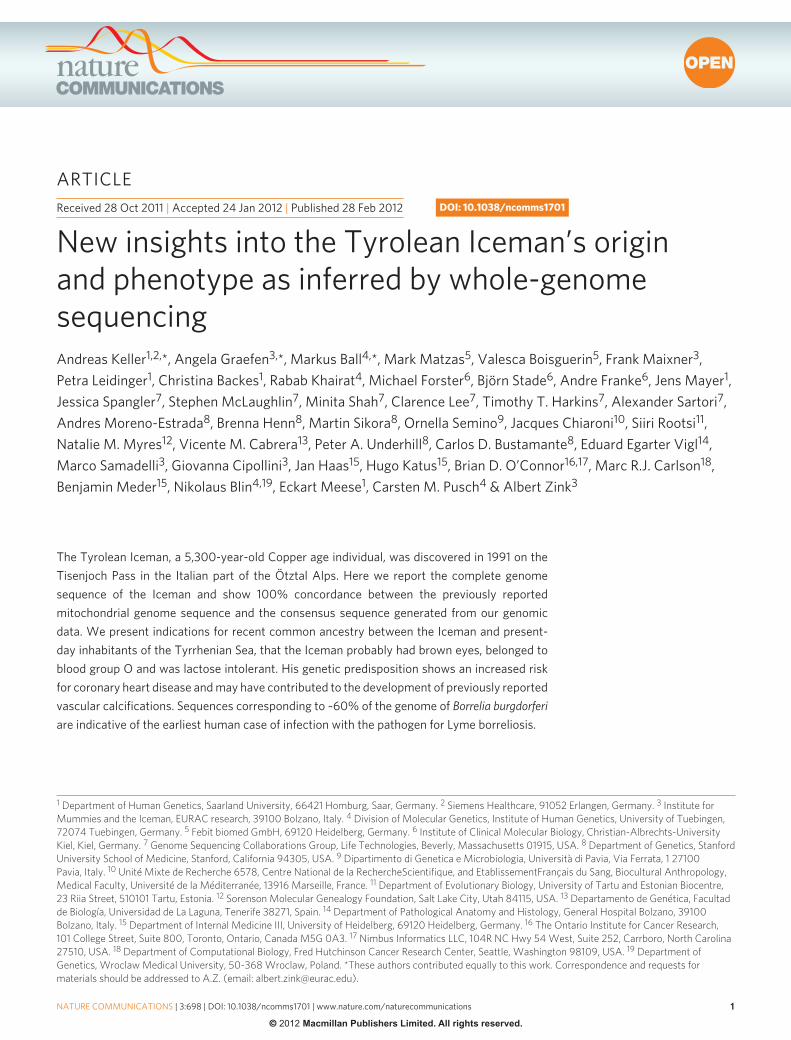
In September 1991, two hikers discovered a human corpse (Fig. 1), partially covered by snow and ice, on the Tisenjoch Pass in the Italian part of the Ötztal Alps. The Tyrolean Iceman, a 5,300-year-
old Copper age individual, is now conserved at the Archaeological Museum in Bolzano, Italy, together with an array of accompany-ing artefacts. An arrowhead lodged within the soft tissue of the left shoulder, having caused substantial damage to the left subclavian artery, indicated a violent death1. Speculations on his origin, his life habits and the circumstances surrounding his demise initiated a variety of morphological, biochemical and molecular analyses. Studies of the Iceman’s mitochondrial genome began 3 years after his discovery with an analysis of the HVS1 region2 and led to the sequence analysis of the entire mitochondrial genome3,4. Although these mitochondrial DNA (mtDNA) studies yielded conclusive data, no successful amplification of nuclear DNA from the Iceman has been reported to date. As cold environments often provide for good biomolecular preservation and as methods for ancient DNA analysis have recently improved, a whole-genome sequencing study was initiated in 2010. A 0.1-g bone biopsy was taken from the Ice-man’s left ilium under sterile conditions in the Iceman’s preservation cell at the South Tyrol Archaeological Museum in Bolzano, Italy, DNA was extracted at the Institute of Human Genetics in Tübingen, Germany and a sequencing library was generated at febit GmbH in Heidelberg, Germany. Paired-end high-throughput sequencing on the SOLiD 4 platform was performed at Life Technologies facilities, Beverly, MA, USA. We found indication for recent common ancestry between the Iceman and present-day inhabitants of the Tyrrhenian Sea (particularly Corsica and Sardinia), that the Iceman probably had brown eyes, belonged to blood group O and was probably lac-tose intolerant. We further found a genetic predisposition for an increased risk for coronary heart disease (CHD), which may have contributed to the development of previously reported vascular cal-cifications. In addition, we found sequences corresponding to ~60% of the genome of B. burgdorferi that are indicative of the earliest human case of infection with the pathogen for Lyme borreliosis.
ResultsOverall sequencing results. We obtained a total of 2.93×10⁹ sequencing reads out of which 1.11×10⁹ reads (37.9%) mapped uniquely to the human reference genome (hg18). Paired-end reads covered 96% of the reference genome with small variation among chromosomes (max = 97.74% for chr22, min = 89.61% for chrY) (Supplementary Fig. S1a and Supplementary Table S1). The average depth of coverage for non-redundant reads excluding duplicates is 7.6-fold, ranging from 4.76-fold for chromosome X to 10.8-fold for chromosome Y (Supplementary Fig. S1b). More than 65% of the genome is covered at least five-fold. Regions with more than ×100 coverage were excluded from analysis, as these most likely represent PCR duplication artefacts.
Deamination-based damage, as the most common modification in ancient DNA5,6, potentially complicates correct identification of base substitutions that result from evolutionary processes. The sequencing of a 4,000-year-old palaeo-eskimo’s DNA sequence dem-onstrated that exclusion of postmortem, damage-based changes had little impact on the high-throughput sequencing result5. However, to estimate the extent of miscoding lesions (that is, postmortem changes in DNA), we determined the transition and transversion ratios (Supplementary Table S2 and Supplementary Table S3) and found them to be largely consistent with ratios observed for other genomes recently analysed by high-throughput sequencing.
One limitation to the whole-human genome sequencing has been the ability to provide broad access to the underlying sequence information in a useable format such that individuals can readily query the genome for their own specific research needs. To enable full access to the Iceman’s genome to a broader scientific community, we have generated a genome browser (http://IcemanGenome.net)8.
This browser contains all the aligned sequencing reads to the Human Genome Reference 19, provides a basic level of annotation includ-ing individual single-nucleotide polymorphisms (SNPs), insertions and deletions, and gene identification. We have also incorporated a query engine for more complicated analysis routines, such as the comparison of the Iceman’s genome to other contemporary genomes (Methods).
Contamination controls. Assessment of the percentage of miscod-ing lesions and potential human contamination was carried out through analysis of the mtDNA. As the mitochondrial genome is naturally at a very high ratio as compared with the nuclear genome (×1160 coverage versus ×7.6 in this specific case), it provides a good target to identify low-frequency variants that can be caused by con-tamination. Additionally, the Iceman’s mitochondrial genome had previously been sequenced in a different laboratory using a different sample3, thus serving as an ideal independent comparison. Allele ratios were determined for the previously noted positions at which the Iceman differs from the Cambridge Reference Sequence (rCRS, NC_012920). For each read not consistent with the known Iceman genome, the specific exchange type was examined as to whether it is a typical deamination product or whether it constitutes a known human mitochondrial variant (Supplementary Fig. S2, Supplemen-tary Table S4). The average rate of concordance with the known Ice-man genome is over 94%, the percentage of exchanges correspond-ing to miscoding lesions is under 5% and the rate of exchanges corresponding to other known human sequences is < 2.5%. While the latter may be caused by modern contamination (either human or other), it may also suggest heteroplasmy of certain positions of the Iceman’s mitochondrial genome. Although this phenomenon was thought to be rare, recent studies have shown that heteroplasmy is not uncommon in healthy mitochondrial cells6. This analysis suggests a maximum potential contamination level of 2.5%, an amount that would have little impact on the allele calls for the nuclear genome.
The next step comprised the analysis of DNA damage patterns. As sequences derived from ancient DNA molecules show charac-teristic nucleotide composition patterns, those can be used to dis-tinguish them from contaminants of modern DNA fragments. In particular, postmortem deamination of cytosine to uracil leads to an increased rate of observed C to T transitions, particularly near the ends of the DNA fragments7. Furthermore, postmortem DNA fragmentation occurs at an increased rate at the 3′-end of purine
Figure 1 | The Tyrolean Iceman. The mummy of the Tyrolean Iceman in his preservation cell at the Archaeological museum of Bolzano.
ARTICLE
�
nATuRE CommunICATIons | DoI: 10.1038/ncomms1701
nATuRE CommunICATIons | 3:698 | DoI: 10.1038/ncomms1701 | www.nature.com/naturecommunications
© 2012 Macmillan Publishers Limited. All rights reserved.
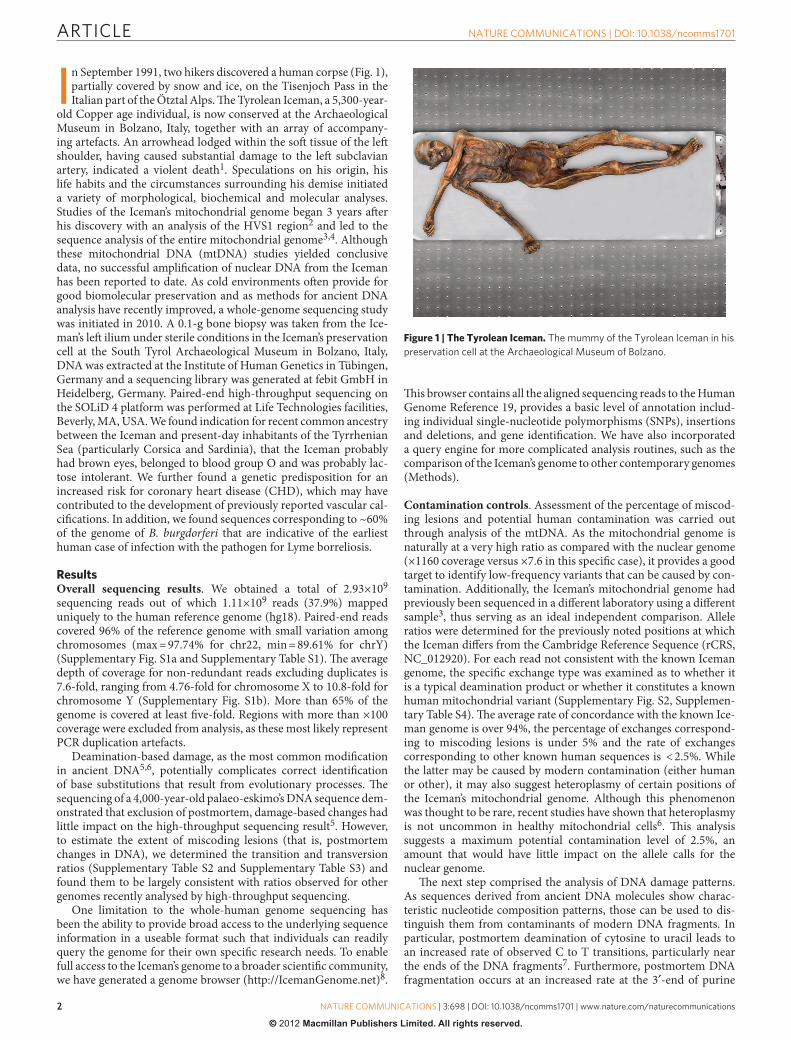
nucleotides due to depurination, leading to a characteristic enrich-ment in purines at the base preceding the sequencing read7.
In order to determine whether the Iceman DNA shows these characteristic patterns, we analysed a random subsample of the aligned sequencing reads for their nucleotide composition and misincorporation patterns. From each of the SAM files containing the aligned read data of the three sequencing slides, we randomly sampled one out of every 1,000 reads, and combined them into an initial analysis file containing a total of 1,156,960 reads. To simplify the subsequent nucleotide substitution analysis, we removed reads that showed insertions or deletions with respect to the reference sequence, as well as reads that mapped closer than 10 bp from the edges of the respective chromosome. This final read set contained 1,148,786 reads, and all subsequent results are based on this set. For each read, we then retrieved the corresponding genomic sequence from the human genome hg18 build, extended to include sequence up to 10 bp upstream (downstream) for reads that map to the forward (reverse) strand.
The average nucleotide composition around the ends of the ana-lysed reads shows the typical pattern expected for ancient DNA fragmentation (Fig. 2a and b). A sharp increase in the frequency of purines (A and G) is observed at the first base upstream of the for-ward reads, accompanied by a complementary increase of pyrimi-dines (C and T) just downstream of the reverse reads. Additionally, substitution rates for each of the possible nucleotide mismatches along the sequencing read also show the expected pattern. While substitution rates are generally low ( < 0.25%) for most mismatch types, C to T transitions show an increased overall rate, in particular towards the end of the reads (up to 3.5% at the first nucleotide). As above, the increase in C to T transitions for the forward reads are accompanied by the complementary increase in G to A transitions observed for the reverse reads. Overall, these results are compara-ble to other ancient human genomes recently published, such as the Saqqaq5 and the Australian Aboriginal genome8,9, and there-fore provide additional indication that the sequences are indeed ancient.
SNP analysis. To gain first insight into genetic traits and into physi-ological and pathological characteristics of the Iceman, we identi-fied 2.2. million SNPs in the Iceman’s genome sequence of which 1.7 million SNPs have previously been reported in dbSNP, with ~900,000 and 800,000 positions being present in a heterozygous and a homozygous state, respectively (Supplementary Table S5). As the 1,000 Genomes Project has demonstrated, using higher sequence coverage should result in the detection of ~3.5 million SNPs per individual; however, due to the limited amount of ancient DNA, lower sequencing coverage was generated, resulting in the detection of fewer SNPs. As shown in Supplementary Table S5, we found a concordance rate of ~92% for homozygous SNPs but only of 55% for heterozygous SNPs indicative of an undercalling of heterozygous SNPs as expected for 7.6-fold coverage.
We compared the number and frequency of homozygous to heterozygous SNPs known from dbSNP on each chromosome. The highest frequency of homozygous SNPs among autosomes was detected for chromosome 13, where 29,400 of the 43,680 SNPs were shown to be homozygous (67.3%). We detected heterozygous SNPs in regions with high similarity to other genomic regions and pseudo-autosomal regions. However, the overall highest rate of homozygous SNPs, namely 96.8% (16,080 of 16,606 SNPs), was detected in the X chromosome. As the Iceman was a male, these results further dem-onstrate the low potential degree of contamination, consistent with the results derived from the mtDNA analysis.
We furthermore analysed SNPs, including variants in specific genomic regions, of potential clinical or functional relevance. In the 5,300-year-old mummy, our analysis did not identify variations in human accelerated regions10, which are apparently functional
sections of the genome showing human-specific evolution over the last few million years.
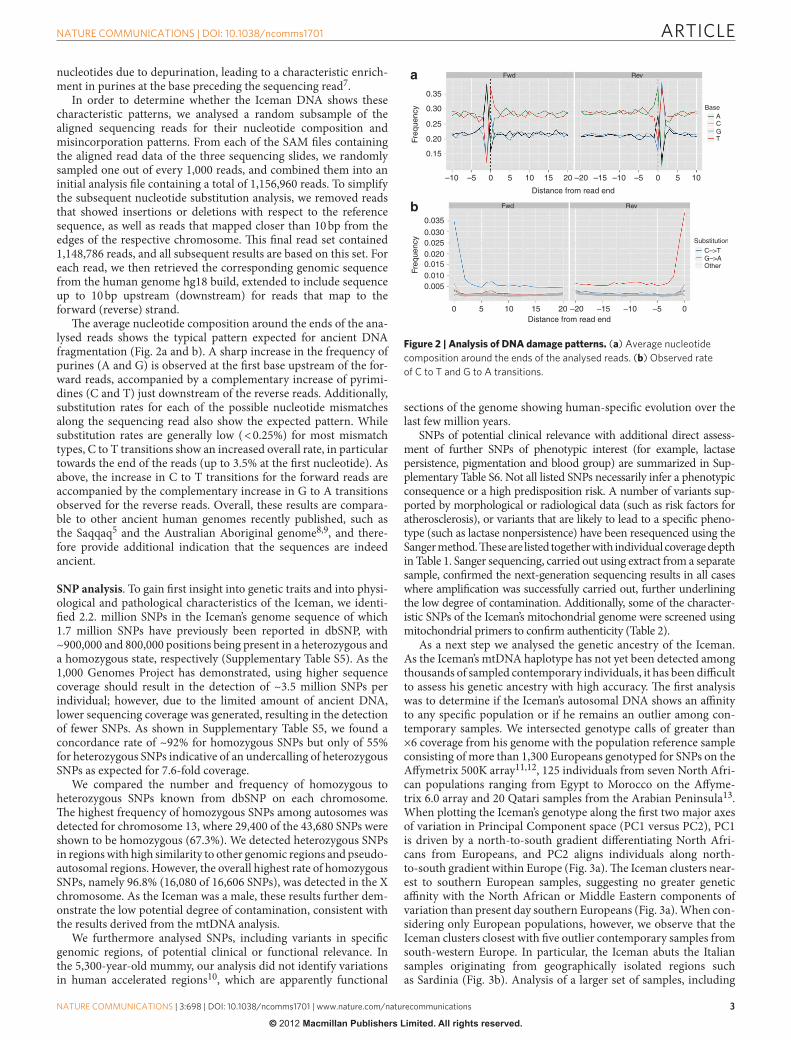
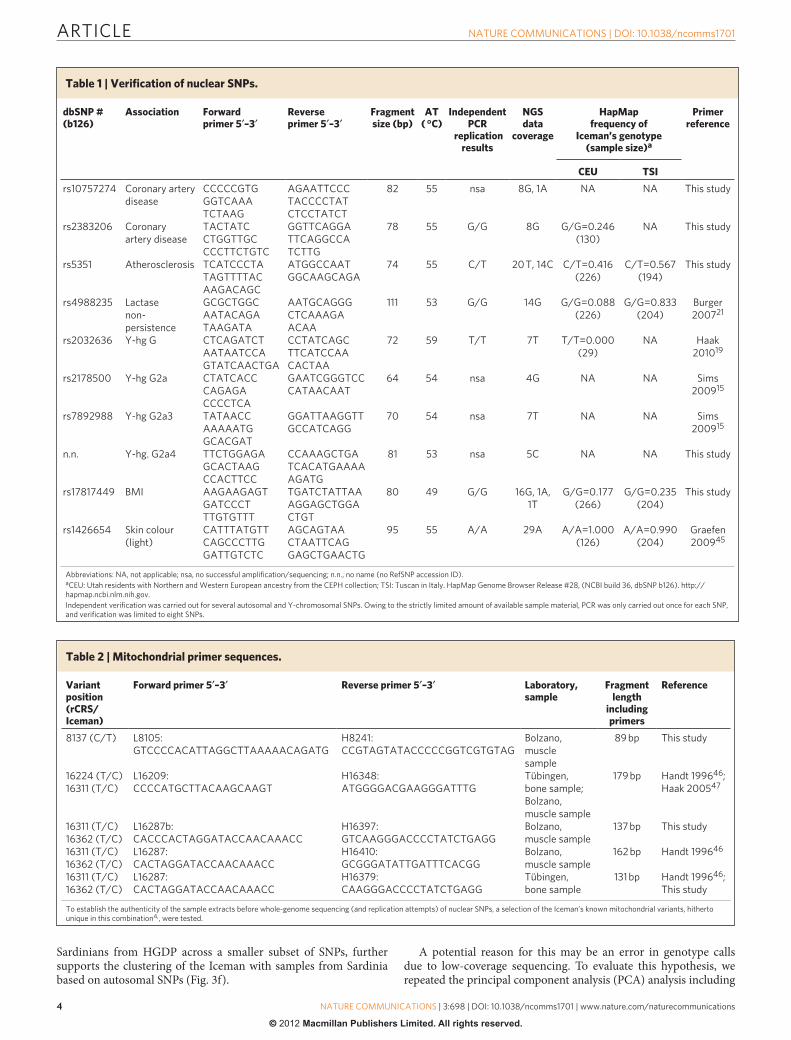
SNPs of potential clinical relevance with additional direct assess-ment of further SNPs of phenotypic interest (for example, lactase persistence, pigmentation and blood group) are summarized in Sup-plementary Table S6. Not all listed SNPs necessarily infer a phenotypic consequence or a high predisposition risk. A number of variants sup-ported by morphological or radiological data (such as risk factors for atherosclerosis), or variants that are likely to lead to a specific pheno-type (such as lactase nonpersistence) have been resequenced using the Sanger method. These are listed together with individual coverage depth in Table 1. Sanger sequencing, carried out using extract from a separate sample, confirmed the next-generation sequencing results in all cases where amplification was successfully carried out, further underlining the low degree of contamination. Additionally, some of the character-istic SNPs of the Iceman’s mitochondrial genome were screened using mitochondrial primers to confirm authenticity (Table 2).
As a next step we analysed the genetic ancestry of the Iceman. As the Iceman’s mtDNA haplotype has not yet been detected among thousands of sampled contemporary individuals, it has been difficult to assess his genetic ancestry with high accuracy. The first analysis was to determine if the Iceman’s autosomal DNA shows an affinity to any specific population or if he remains an outlier among con-temporary samples. We intersected genotype calls of greater than ×6 coverage from his genome with the population reference sample consisting of more than 1,300 Europeans genotyped for SNPs on the Affymetrix 500K array11,12, 125 individuals from seven North Afri-can populations ranging from Egypt to Morocco on the Affyme-trix 6.0 array and 20 Qatari samples from the Arabian Peninsula13. When plotting the Iceman’s genotype along the first two major axes of variation in Principal Component space (PC1 versus PC2), PC1 is driven by a north-to-south gradient differentiating North Afri-cans from Europeans, and PC2 aligns individuals along north- to-south gradient within Europe (Fig. 3a). The Iceman clusters near-est to southern European samples, suggesting no greater genetic affinity with the North African or Middle Eastern components of variation than present day southern Europeans (Fig. 3a). When con-sidering only European populations, however, we observe that the Iceman clusters closest with five outlier contemporary samples from south-western Europe. In particular, the Iceman abuts the Italian samples originating from geographically isolated regions such as Sardinia (Fig. 3b). Analysis of a larger set of samples, including
Fwd
0.35
0.30
0.25
0.20
Freq
uenc
yFr
eque
ncy
0.15
0.035
0.0300.0250.0200.0150.0100.005
–10
0 5 10 15 20 –20 –15 –10 –5 0
–5 0 5 10 15 20
Distance from read end
Distance from read end
–20 –15 –10 –5 0 5 10
Base
Substitution
C–>TG–>AOther
ACGT
Rev
Fwd Rev
a
b
Figure 2 | Analysis of DNA damage patterns. (a) Average nucleotide composition around the ends of the analysed reads. (b) observed rate of C to T and G to A transitions.
ARTICLE
��
nATuRE CommunICATIons | DoI: 10.1038/ncomms1701
nATuRE CommunICATIons | 3:698 | DoI: 10.1038/ncomms1701 | www.nature.com/naturecommunications
© 2012 Macmillan Publishers Limited. All rights reserved.
Sardinians from HGDP across a smaller subset of SNPs, further supports the clustering of the Iceman with samples from Sardinia based on autosomal SNPs (Fig. 3f).
A potential reason for this may be an error in genotype calls due to low-coverage sequencing. To evaluate this hypothesis, we repeated the principal component analysis (PCA) analysis including
Table 1 | Verification of nuclear SNPs.
dbSNP # (b126)
Association Forward primer 5′–3′
Reverse primer 5′–3′
Fragment size (bp)
AT ( °C)
Independent PCR
replication results
NGS data
coverage
HapMap frequency of
Iceman’s genotype (sample size)a
Primer reference
CEU TSI
rs10757274 Coronary artery disease
CCCCCGTG GGTCAAA TCTAAG
AGAATTCCC TACCCCTAT CTCCTATCT
82 55 nsa 8G, 1A nA nA This study
rs2383206 Coronary artery disease
TACTATC CTGGTTGC CCCTTCTGTC
GGTTCAGGA TTCAGGCCA TCTTG
78 55 G/G 8G G/G=0.246 (130)
nA This study
rs5351 Atherosclerosis TCATCCCTA TAGTTTTAC AAGACAGC
ATGGCCAAT GGCAAGCAGA
74 55 C/T 20 T, 14C C/T=0.416 (226)
C/T=0.567 (194)
This study
rs4988235 Lactase non- persistence
GCGCTGGC AATACAGA TAAGATA
AATGCAGGG CTCAAAGA ACAA
111 53 G/G 14G G/G=0.088 (226)
G/G=0.833 (204)
Burger 200721
rs2032636 Y-hg G CTCAGATCT AATAATCCA GTATCAACTGA
CCTATCAGC TTCATCCAA CACTAA
72 59 T/T 7T T/T=0.000 (29)
nA Haak 201019
rs2178500 Y-hg G2a CTATCACC CAGAGA CCCCTCA
GAATCGGGTCC CATAACAAT
64 54 nsa 4G nA nA sims 200915
rs7892988 Y-hg G2a3 TATAACC AAAAATG GCACGAT
GGATTAAGGTT GCCATCAGG
70 54 nsa 7T nA nA sims 200915
n.n. Y-hg. G2a4 TTCTGGAGA GCACTAAG CCACTTCC
CCAAAGCTGA TCACATGAAAA AGATG
81 53 nsa 5C nA nA This study
rs17817449 BmI AAGAAGAGT GATCCCT TTGTGTTT
TGATCTATTAA AGGAGCTGGA CTGT
80 49 G/G 16G, 1A, 1T
G/G=0.177 (266)
G/G=0.235 (204)
This study
rs1426654 skin colour (light)
CATTTATGTT CAGCCCTTG GATTGTCTC
AGCAGTAA CTAATTCAG GAGCTGAACTG
95 55 A/A 29A A/A=1.000 (126)
A/A=0.990 (204)
Graefen 200945
Abbreviations: nA, not applicable; nsa, no successful amplification/sequencing; n.n., no name (no RefsnP accession ID).aCEu: utah residents with northern and Western European ancestry from the CEPH collection; TsI: Tuscan in Italy. Hapmap Genome Browser Release #28, (nCBI build 36, dbsnP b126). http://hapmap.ncbi.nlm.nih.gov.Independent verification was carried out for several autosomal and Y-chromosomal snPs. owing to the strictly limited amount of available sample material, PCR was only carried out once for each snP, and verification was limited to eight snPs.
Table 2 | Mitochondrial primer sequences.
Variant position (rCRS/Iceman)
Forward primer 5′–3′ Reverse primer 5′–3′ Laboratory, sample
Fragment length
including primers
Reference
8137 (C/T) L8105: GTCCCCACATTAGGCTTAAAAACAGATG
H8241: CCGTAGTATACCCCCGGTCGTGTAG
Bolzano, muscle sample
89 bp This study
16224 (T/C) 16311 (T/C)
L16209: CCCCATGCTTACAAGCAAGT
H16348: ATGGGGACGAAGGGATTTG
Tübingen, bone sample; Bolzano, muscle sample
179 bp Handt 199646; Haak 200547
16311 (T/C) 16362 (T/C)
L16287b: CACCCACTAGGATACCAACAAACC
H16397: GTCAAGGGACCCCTATCTGAGG
Bolzano, muscle sample
137 bp This study
16311 (T/C) 16362 (T/C)
L16287: CACTAGGATACCAACAAACC
H16410: GCGGGATATTGATTTCACGG
Bolzano, muscle sample
162 bp Handt 199646
16311 (T/C) 16362 (T/C)
L16287: CACTAGGATACCAACAAACC
H16379: CAAGGGACCCCTATCTGAGG
Tübingen, bone sample
131 bp Handt 199646; This study
To establish the authenticity of the sample extracts before whole-genome sequencing (and replication attempts) of nuclear snPs, a selection of the Iceman’s known mitochondrial variants, hitherto unique in this combination4,, were tested.
ARTICLE
�
nATuRE CommunICATIons | DoI: 10.1038/ncomms1701
nATuRE CommunICATIons | 3:698 | DoI: 10.1038/ncomms1701 | www.nature.com/naturecommunications
© 2012 Macmillan Publishers Limited. All rights reserved.
data from five HapMap CEU individuals with high-confidence genotype calls based on multiple array platforms that were also sequenced as part of the 1,000 Genomes Project. To establish con-trols for the PCA analysis and to address any issues that may arise from the low sequencing coverage of the Iceman, we randomly chose five CEU individuals from the Pilot 1 data release, which had a simi-lar (or lower) coverage to the Iceman, and were sequenced using the same SOLiD technology. The 1,000G CEU sample genotypes were inferred using a single-sample procedure similar to that used for the Iceman (Supplementary Methods). SNP array genotype data for the same individuals were obtained from HapMap release 28. The merged HapMap/1,000 Genomes/PopRes/Iceman dataset con-tained 125,729 SNPs. The 1,000 Genomes control samples were pro-jected onto the PC space inferred from the rest of the dataset using both the low-coverage SNP calls and the high-confidence HapMap genotypes. The low-coverage 1,000 Genome control samples fall
closer to the middle of the PCA plot, near central Europe, when compared with their corresponding genotype HapMap data (Sup-plementary Fig. S3a). The 1,000 Genomes control samples illustrate how low-sequence-coverage genomes tend to project towards the averaged centre of the distribution due to the missing genotypes. Thus, the Iceman’s position along with the 1,000 Genomes control samples are shifted towards the origin as those missing genotype values are set to 0 after the normalization step in the PCA. When using a ×12 threshold (though with fewer loci) the placement of the Iceman shifts from the European continent closer to the Sardinian sample group, as there are no missing genotypes, reflecting his true position more accurately. (Supplementary Figs S3b–d show place-ment of the Iceman on PopRes PCA based on varying degrees of coverage and thresholding for missing genotypes.)
To determine the Iceman’s paternal ancestry, his Y-chromosome haplogroup allocation was assessed according to the hierarchical
0.050.04
0.02
0.00
–0.02
–0.04
–0.06
0.00
–0.05
–0.10
–0.08
M201
U6
U17U33
M342
G G G G G G G G2a2
G2a3
G2a3b
2a
a1 1
2 2 2a a a
*4
Iceman 2%
0 %
1 %
3 %
5 %
7 %
9 %
11 %
13 %
15 %
17 %
19 %
4%6%8%10%12%14%16%18%
20%22%24%26%
1*2
P287
U5
P15
P16L30
U8
U1M286
P18
L91
–0.06 –0.04 –0.02 0.00 0.02 –0.05 0.00 0.05
0.04
0.02
0.00
–0.02
–0.04
–0.06
–0.05 0.00 0.05 0.10
Prin
cipa
l com
pone
nt 2
Principal component 1 Principal component 2
Prin
cipa
l com
pone
nt 1
Principal component 2
Prin
cipa
l com
pone
nt 1
Iceman
Iceman
Iceman
Iceman
IcemanEurope S
Europe NWEurope NNEEurope SEEurope ESESardinian
Europe SWEurope WEurope C
Europe SEurope SWEurope WEurope CEurope NWEurope NNEEurope SEEurope ESENorth AfricaNear East
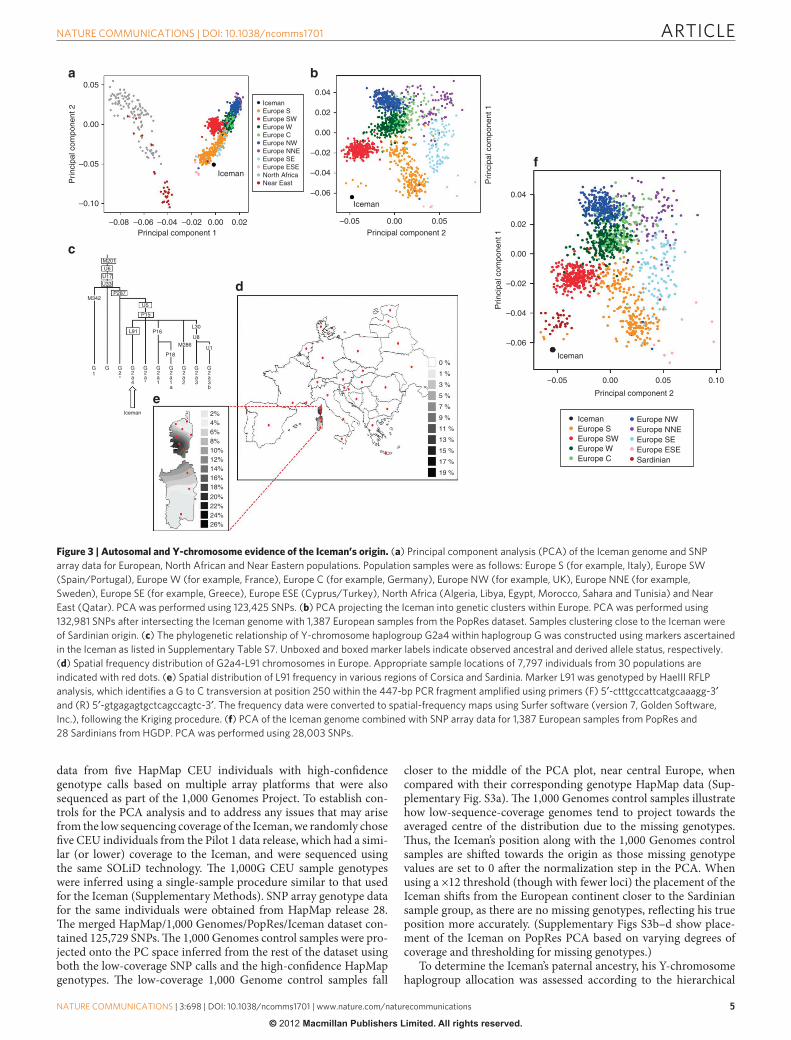
Figure 3 | Autosomal and Y-chromosome evidence of the Iceman’s origin. (a) Principal component analysis (PCA) of the Iceman genome and snP array data for European, north African and near Eastern populations. Population samples were as follows: Europe s (for example, Italy), Europe sW (spain/Portugal), Europe W (for example, France), Europe C (for example, Germany), Europe nW (for example, uK), Europe nnE (for example, sweden), Europe sE (for example, Greece), Europe EsE (Cyprus/Turkey), north Africa (Algeria, Libya, Egypt, morocco, sahara and Tunisia) and near East (Qatar). PCA was performed using 123,425 snPs. (b) PCA projecting the Iceman into genetic clusters within Europe. PCA was performed using 132,981 snPs after intersecting the Iceman genome with 1,387 European samples from the PopRes dataset. samples clustering close to the Iceman were of sardinian origin. (c) The phylogenetic relationship of Y-chromosome haplogroup G2a4 within haplogroup G was constructed using markers ascertained in the Iceman as listed in supplementary Table s7. unboxed and boxed marker labels indicate observed ancestral and derived allele status, respectively. (d) spatial frequency distribution of G2a4-L91 chromosomes in Europe. Appropriate sample locations of 7,797 individuals from 30 populations are indicated with red dots. (e) spatial distribution of L91 frequency in various regions of Corsica and sardinia. marker L91 was genotyped by HaeIII RFLP analysis, which identifies a G to C transversion at position 250 within the 447-bp PCR fragment amplified using primers (F) 5′-ctttgccattcatgcaaagg-3′ and (R) 5′-gtgagagtgctcagccagtc-3′. The frequency data were converted to spatial-frequency maps using surfer software (version 7, Golden software, Inc.), following the Kriging procedure. (f) PCA of the Iceman genome combined with snP array data for 1,387 European samples from PopRes and 28 sardinians from HGDP. PCA was performed using 28,003 snPs.
ARTICLE
��
nATuRE CommunICATIons | DoI: 10.1038/ncomms1701
nATuRE CommunICATIons | 3:698 | DoI: 10.1038/ncomms1701 | www.nature.com/naturecommunications
© 2012 Macmillan Publishers Limited. All rights reserved.
order of markers organized by the International Society of Genetic Genealogy14. The detection of four phylogenetically equivalent SNPs15 and an independent verification of the rs2032636 (M201) SNP by Sanger sequencing of a PCR amplicon obtained using genomic DNA isolated from a 2007 muscle biopsy unequivocally assigns the Iceman to haplogroup G, specifically subgroup G2a (Supplementary Table S7). While haplogroup G displays its highest frequency in the Caucasus16, it is also present at ~11% in present day Italy17. Genetic analysis of ancient DNA from 5,000-year-old skeletons from a burial cave site in southern France were mostly assigned to haplogroup G2a-P15 (ref. 18). Haplogroup G2a3 was also reported in an ancient DNA sample of an early Neolithic indi-vidual from Saxony-Anhalt, Germany19. We used the phylogenetic relationships of the ancestral and derived allelic states for 13 other detected SNPs within the G hierarchy (Supplementary Table S7, Fig. 3c) to place the Iceman into the G2a4-L91 lineage that is nota-bly divergent from G2a3-U8 lineages typical of modern continental Europeans. Knowledge about the phylogeography of haplogroup G2a4 is unreported. We addressed this issue here by analysing the G2a4-defining L91 SNP in 7,797 chromosomes from 30 regions across Europe. Fig. 3d shows the spatial frequency distribution of G2a4 throughout Europe. The highest frequencies (25 and 9%) occur in southern Corsica and northern Sardinia, respectively, (Fig. 3e) while in mainland Europe the frequencies do not reach 1%.
We also performed a detailed analysis of the Iceman’s phenotype and the diseases he may have suffered from. One trait associated with the beginning of agriculture in Europe is lactase persistence (the ability to digest milk after early childhood), which is commonly associated with a polymorphism in the MCM6 gene ( − 13,910*T)20. Palaeogenetic analyses from various prehistoric sites failed to detect the derived allele in any of the tested Neolithic samples, indicat-ing that lactase persistence was rare in the Neolithic and, due to the substantial selective advantage conferred by this trait, gained in frequency over the next millennia and was widespread in Central Europe by the Middle Ages21. Comparisons between genotype and phenotype (diagnostic methane–hydrogen breath test) in South European individuals have shown that the homozygous ancestral C allele causes clinical symptoms in over 85% of cases22. Although a small number of genetically non-lactase-persistent individuals show no malabsorption problems, this may not least depend on the age variation of the study group: the onset age of lactose mal-absorption differs between populations, sometimes not becoming manifest before the 30th year of life. As the Iceman’s genome dis-plays the homozygous ancestral allele at this site (coverage 14-fold, independently replicated by PCR), he was in all probability lactose intolerant as an adult.
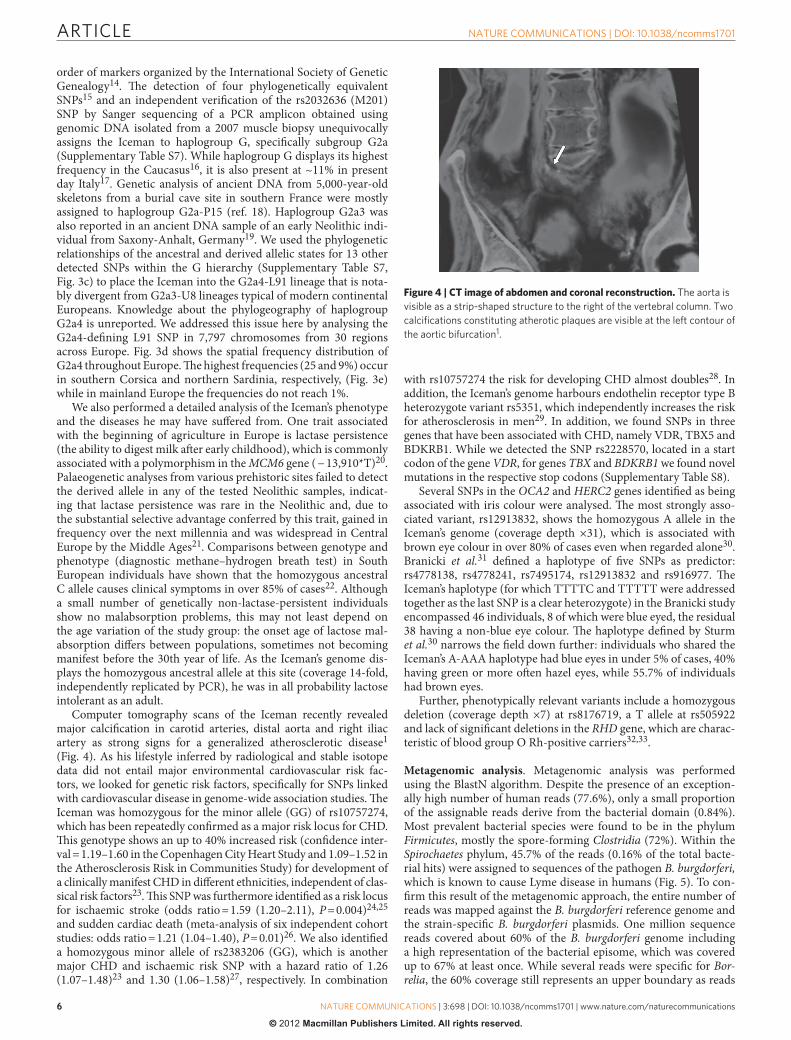
Computer tomography scans of the Iceman recently revealed major calcification in carotid arteries, distal aorta and right iliac artery as strong signs for a generalized atherosclerotic disease1 (Fig. 4). As his lifestyle inferred by radiological and stable isotope data did not entail major environmental cardiovascular risk fac-tors, we looked for genetic risk factors, specifically for SNPs linked with cardiovascular disease in genome-wide association studies. The Iceman was homozygous for the minor allele (GG) of rs10757274, which has been repeatedly confirmed as a major risk locus for CHD. This genotype shows an up to 40% increased risk (confidence inter-val = 1.19–1.60 in the Copenhagen City Heart Study and 1.09–1.52 in the Atherosclerosis Risk in Communities Study) for development of a clinically manifest CHD in different ethnicities, independent of clas-sical risk factors23. This SNP was furthermore identified as a risk locus for ischaemic stroke (odds ratio = 1.59 (1.20–2.11), P = 0.004)24,25 and sudden cardiac death (meta-analysis of six independent cohort studies: odds ratio = 1.21 (1.04–1.40), P = 0.01)26. We also identified a homozygous minor allele of rs2383206 (GG), which is another major CHD and ischaemic risk SNP with a hazard ratio of 1.26 (1.07–1.48)23 and 1.30 (1.06–1.58)27, respectively. In combination
with rs10757274 the risk for developing CHD almost doubles28. In addition, the Iceman’s genome harbours endothelin receptor type B heterozygote variant rs5351, which independently increases the risk for atherosclerosis in men29. In addition, we found SNPs in three genes that have been associated with CHD, namely VDR, TBX5 and BDKRB1. While we detected the SNP rs2228570, located in a start codon of the gene VDR, for genes TBX and BDKRB1 we found novel mutations in the respective stop codons (Supplementary Table S8).
Several SNPs in the OCA2 and HERC2 genes identified as being associated with iris colour were analysed. The most strongly asso-ciated variant, rs12913832, shows the homozygous A allele in the Iceman’s genome (coverage depth ×31), which is associated with brown eye colour in over 80% of cases even when regarded alone30. Branicki et al.31 defined a haplotype of five SNPs as predictor: rs4778138, rs4778241, rs7495174, rs12913832 and rs916977. The Iceman’s haplotype (for which TTTTC and TTTTT were addressed together as the last SNP is a clear heterozygote) in the Branicki study encompassed 46 individuals, 8 of which were blue eyed, the residual 38 having a non-blue eye colour. The haplotype defined by Sturm et al.30 narrows the field down further: individuals who shared the Iceman’s A-AAA haplotype had blue eyes in under 5% of cases, 40% having green or more often hazel eyes, while 55.7% of individuals had brown eyes.
Further, phenotypically relevant variants include a homozygous deletion (coverage depth ×7) at rs8176719, a T allele at rs505922 and lack of significant deletions in the RHD gene, which are charac-teristic of blood group O Rh-positive carriers32,33.
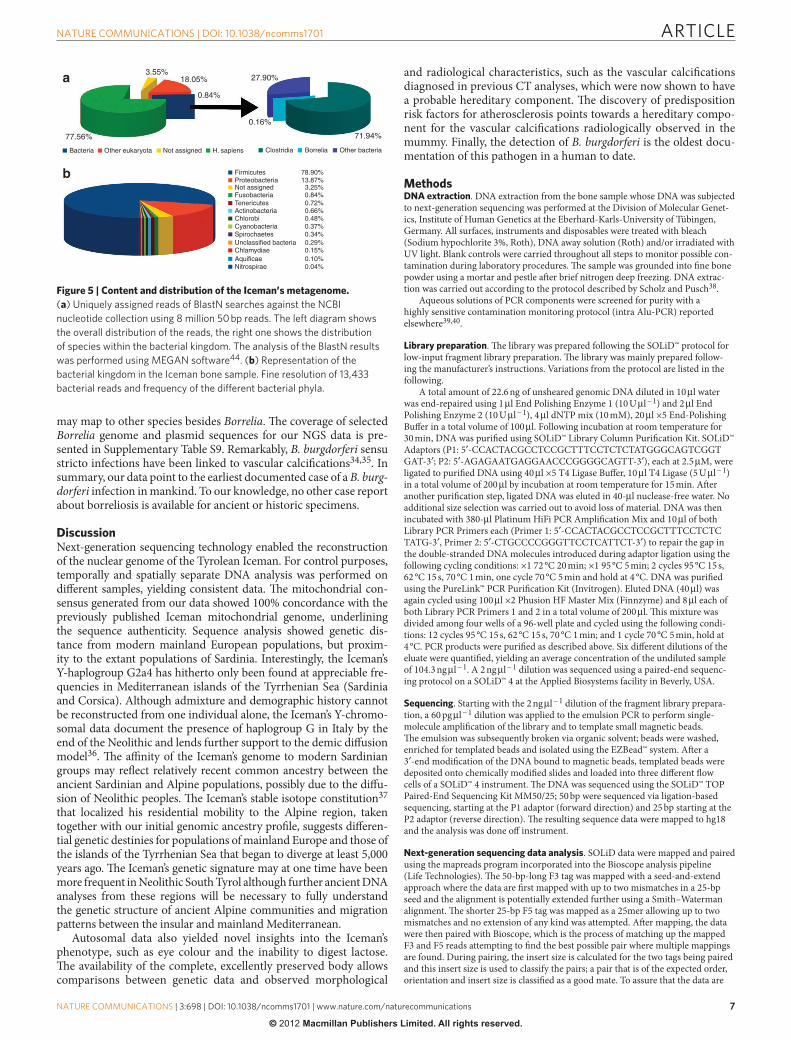
Metagenomic analysis. Metagenomic analysis was performed using the BlastN algorithm. Despite the presence of an exception-ally high number of human reads (77.6%), only a small proportion of the assignable reads derive from the bacterial domain (0.84%). Most prevalent bacterial species were found to be in the phylum Firmicutes, mostly the spore-forming Clostridia (72%). Within the Spirochaetes phylum, 45.7% of the reads (0.16% of the total bacte-rial hits) were assigned to sequences of the pathogen B. burgdorferi, which is known to cause Lyme disease in humans (Fig. 5). To con-firm this result of the metagenomic approach, the entire number of reads was mapped against the B. burgdorferi reference genome and the strain-specific B. burgdorferi plasmids. One million sequence reads covered about 60% of the B. burgdorferi genome including a high representation of the bacterial episome, which was covered up to 67% at least once. While several reads were specific for Bor-relia, the 60% coverage still represents an upper boundary as reads
Figure 4 | CT image of abdomen and coronal reconstruction. The aorta is visible as a strip-shaped structure to the right of the vertebral column. Two calcifications constituting atherotic plaques are visible at the left contour of the aortic bifurcation1.
ARTICLE
�
nATuRE CommunICATIons | DoI: 10.1038/ncomms1701
nATuRE CommunICATIons | 3:698 | DoI: 10.1038/ncomms1701 | www.nature.com/naturecommunications
© 2012 Macmillan Publishers Limited. All rights reserved.
may map to other species besides Borrelia. The coverage of selected Borrelia genome and plasmid sequences for our NGS data is pre-sented in Supplementary Table S9. Remarkably, B. burgdorferi sensu stricto infections have been linked to vascular calcifications34,35. In summary, our data point to the earliest documented case of a B. burg-dorferi infection in mankind. To our knowledge, no other case report about borreliosis is available for ancient or historic specimens.
DiscussionNext-generation sequencing technology enabled the reconstruction of the nuclear genome of the Tyrolean Iceman. For control purposes, temporally and spatially separate DNA analysis was performed on different samples, yielding consistent data. The mitochondrial con-sensus generated from our data showed 100% concordance with the previously published Iceman mitochondrial genome, underlining the sequence authenticity. Sequence analysis showed genetic dis-tance from modern mainland European populations, but proxim-ity to the extant populations of Sardinia. Interestingly, the Iceman’s Y-haplogroup G2a4 has hitherto only been found at appreciable fre-quencies in Mediterranean islands of the Tyrrhenian Sea (Sardinia and Corsica). Although admixture and demographic history cannot be reconstructed from one individual alone, the Iceman’s Y-chromo-somal data document the presence of haplogroup G in Italy by the end of the Neolithic and lends further support to the demic diffusion model36. The affinity of the Iceman’s genome to modern Sardinian groups may reflect relatively recent common ancestry between the ancient Sardinian and Alpine populations, possibly due to the diffu-sion of Neolithic peoples. The Iceman’s stable isotope constitution37 that localized his residential mobility to the Alpine region, taken together with our initial genomic ancestry profile, suggests differen-tial genetic destinies for populations of mainland Europe and those of the islands of the Tyrrhenian Sea that began to diverge at least 5,000 years ago. The Iceman’s genetic signature may at one time have been more frequent in Neolithic South Tyrol although further ancient DNA analyses from these regions will be necessary to fully understand the genetic structure of ancient Alpine communities and migration patterns between the insular and mainland Mediterranean.
Autosomal data also yielded novel insights into the Iceman’s phenotype, such as eye colour and the inability to digest lactose. The availability of the complete, excellently preserved body allows comparisons between genetic data and observed morphological
and radiological characteristics, such as the vascular calcifications diagnosed in previous CT analyses, which were now shown to have a probable hereditary component. The discovery of predisposition risk factors for atherosclerosis points towards a hereditary compo-nent for the vascular calcifications radiologically observed in the mummy. Finally, the detection of B. burgdorferi is the oldest docu-mentation of this pathogen in a human to date.
MethodsDNA extraction. DNA extraction from the bone sample whose DNA was subjected to next-generation sequencing was performed at the Division of Molecular Genet-ics, Institute of Human Genetics at the Eberhard-Karls-University of Tübingen, Germany. All surfaces, instruments and disposables were treated with bleach (Sodium hypochlorite 3%, Roth), DNA away solution (Roth) and/or irradiated with UV light. Blank controls were carried throughout all steps to monitor possible con-tamination during laboratory procedures. The sample was grounded into fine bone powder using a mortar and pestle after brief nitrogen deep freezing. DNA extrac-tion was carried out according to the protocol described by Scholz and Pusch38.
Aqueous solutions of PCR components were screened for purity with a highly sensitive contamination monitoring protocol (intra Alu-PCR) reported elsewhere39,40.
Library preparation. The library was prepared following the SOLiD™ protocol for low-input fragment library preparation. The library was mainly prepared follow-ing the manufacturer’s instructions. Variations from the protocol are listed in the following.
A total amount of 22.6 ng of unsheared genomic DNA diluted in 10 µl water was end-repaired using 1 µl End Polishing Enzyme 1 (10 U µl − 1) and 2 µl End Polishing Enzyme 2 (10 U µl − 1), 4 µl dNTP mix (10 mM), 20 µl ×5 End-Polishing Buffer in a total volume of 100 µl. Following incubation at room temperature for 30 min, DNA was purified using SOLiD™ Library Column Purification Kit. SOLiD™ Adaptors (P1: 5′-CCACTACGCCTCCGCTTTCCTCTCTATGGGCAGTCGGT GAT-3′; P2: 5′-AGAGAATGAGGAACCCGGGGCAGTT-3′), each at 2.5 µM, were ligated to purified DNA using 40 µl ×5 T4 Ligase Buffer, 10 µl T4 Ligase (5 U µl − 1) in a total volume of 200 µl by incubation at room temperature for 15 min. After another purification step, ligated DNA was eluted in 40-µl nuclease-free water. No additional size selection was carried out to avoid loss of material. DNA was then incubated with 380-µl Platinum HiFi PCR Amplification Mix and 10 µl of both Library PCR Primers each (Primer 1: 5′-CCACTACGCCTCCGCTTTCCTCTC TATG-3′, Primer 2: 5′-CTGCCCCGGGTTCCTCATTCT-3′) to repair the gap in the double-stranded DNA molecules introduced during adaptor ligation using the following cycling conditions: ×1 72 °C 20 min; ×1 95 °C 5 min; 2 cycles 95 °C 15 s, 62 °C 15 s, 70 °C 1 min, one cycle 70 °C 5 min and hold at 4 °C. DNA was purified using the PureLink™ PCR Purification Kit (Invitrogen). Eluted DNA (40 µl) was again cycled using 100 µl ×2 Phusion HF Master Mix (Finnzyme) and 8 µl each of both Library PCR Primers 1 and 2 in a total volume of 200 µl. This mixture was divided among four wells of a 96-well plate and cycled using the following condi-tions: 12 cycles 95 °C 15 s, 62 °C 15 s, 70 °C 1 min; and 1 cycle 70 °C 5 min, hold at 4 °C. PCR products were purified as described above. Six different dilutions of the eluate were quantified, yielding an average concentration of the undiluted sample of 104.3 ng µl − 1. A 2 ng µl − 1 dilution was sequenced using a paired-end sequenc-ing protocol on a SOLiD™ 4 at the Applied Biosystems facility in Beverly, USA.
Sequencing. Starting with the 2 ng µl − 1 dilution of the fragment library prepara-tion, a 60 pg µl − 1 dilution was applied to the emulsion PCR to perform single- molecule amplification of the library and to template small magnetic beads. The emulsion was subsequently broken via organic solvent; beads were washed, enriched for templated beads and isolated using the EZBead™ system. After a 3′-end modification of the DNA bound to magnetic beads, templated beads were deposited onto chemically modified slides and loaded into three different flow cells of a SOLiD™ 4 instrument. The DNA was sequenced using the SOLiD™ TOP Paired-End Sequencing Kit MM50/25; 50 bp were sequenced via ligation-based sequencing, starting at the P1 adaptor (forward direction) and 25 bp starting at the P2 adaptor (reverse direction). The resulting sequence data were mapped to hg18 and the analysis was done off instrument.
Next-generation sequencing data analysis. SOLiD data were mapped and paired using the mapreads program incorporated into the Bioscope analysis pipeline (Life Technologies). The 50-bp-long F3 tag was mapped with a seed-and-extend approach where the data are first mapped with up to two mismatches in a 25-bp seed and the alignment is potentially extended further using a Smith–Waterman alignment. The shorter 25-bp F5 tag was mapped as a 25mer allowing up to two mismatches and no extension of any kind was attempted. After mapping, the data were then paired with Bioscope, which is the process of matching up the mapped F3 and F5 reads attempting to find the best possible pair where multiple mappings are found. During pairing, the insert size is calculated for the two tags being paired and this insert size is used to classify the pairs; a pair that is of the expected order, orientation and insert size is classified as a good mate. To assure that the data are
3.55%
77.56%
Bacteria Other eukaryota Not assigned Clostridia
Firmicutes 78.90%13.87%3.25%0.84%0.72%0.66%0.48%0.37%0.34%0.29%0.15%0.10%0.04%
ProteobacteriaNot assignedFusobacteriaTenericutesActinobacteriaChlorobiCyanobacteriaSpirochaetesUnclassified bacteriaChlamydiaeAquificaeNitrospirae
Borrelia Other bacteriaH. sapiens
18.05%
0.84%
27.90%
0.16%
71.94%
a
b
Figure 5 | Content and distribution of the Iceman’s metagenome. (a) uniquely assigned reads of Blastn searches against the nCBI nucleotide collection using 8 million 50 bp reads. The left diagram shows the overall distribution of the reads, the right one shows the distribution of species within the bacterial kingdom. The analysis of the Blastn results was performed using mEGAn software44. (b) Representation of the bacterial kingdom in the Iceman bone sample. Fine resolution of 13,433 bacterial reads and frequency of the different bacterial phyla.
ARTICLE
��
nATuRE CommunICATIons | DoI: 10.1038/ncomms1701
nATuRE CommunICATIons | 3:698 | DoI: 10.1038/ncomms1701 | www.nature.com/naturecommunications
© 2012 Macmillan Publishers Limited. All rights reserved.
not biased by PCR duplicates and other redundant molecules that may be over-represented in the library, especially considering the age of the sample, the three slides of data were merged together and PCR duplicates were removed using Picard (http://picard.sourceforge.net/). These non-redundant good mates—along with any singletons, which were flagged as primary alignments by mapreads but do not have a mapped mate—were used for SNP calling and the resultant coverage of these reads was ×7.6. The SNP caller, diBayes (http://solidsoftwaretools.com/gf/project/dibayes/), is also part of the Bioscope package. Default medium stringency settings were applied.
Functional SNP analysis. SNPs of potential clinical relevance were primarily identified through comparison with the Human Gene Mutation Database41 release 2011.1. with additional direct assessment of further SNPs of phenotypic interest (for example, lactase persistence, pigmentation and blood group) and are sum-marized in Supplementary Table S6. Allele frequency was derived from the 1,000 Genomes Project data via dbSNP. To determine coverage depth for each allele in the Iceman’s genome, generated reads were viewed in the Integrative Genomics Viewer (IGV, http://broadinstitute.org/software/igv/), version 1.5.64. Y-chromo-somal haplotype allocation was carried out according to the nomenclature of the Y-Chromosome Consortium42. In addition, more recently reported subvariants of haplogroup G15 were characterised for the Iceman. Supplementary Table S8 contains a detailed analysis of all identified SNPs as to formation of premature stop codons, altered start codons and readthrough stop codons in genes.
Principal component analysis. We used PCA to identify clusters of genetic simi-larity among samples with European ancestry and projected the inferred genotype for the Iceman sample based on aDNA sequencing to 7.6-fold coverage. We used the same subset of samples and SNPs reported by Novembre et al.12 in order to reproduce the PCA map of Europe, which includes 1,387 samples from throughout Europe with four grandparents born in a single country and 197,146 autosomal SNPs. As predicted from the aDNA sample coverage, 31% of the SNPs had missing genotypes in the Iceman, so after quality-control filtering for missingness, a total of 132,981 SNPs remained for subsequent analyses. PCA was performed using EIGENSOFT with default parameters and the top principal components were plotted using R 2.11.1. Additional genotype data from 125 individuals represent-ing 7 different North African populations43 and 20 Qatari from the Arabian Peninsula13 was used to further explore the clustering patterns of the Iceman with neighbouring geographical regions. After merging and quality-control filtering for missingness, a total of 123,425 SNPs remained. In order to avoid potential excess of degraded sites, all C/T and G/A SNPs were removed, and although only 37,306 SNPs remained after such stringent quality-control filtering, the discrimination of clusters remained the same.
To evaluate the influence of missing data and/or increased genotype error rates due to low-coverage sequencing on the PCA results, we repeated the PCA including data from five HapMap CEU individuals that were also sequenced as part of the 1,000 Genomes Project. In order to match the genotype calling of the Iceman data as closely as possible, we randomly chose five CEU individuals from the Pilot 1 data release, which were sequenced using SOLiD technology. For each sample separately, we downloaded the aligned BAM files (ftp://ftp-trace.ncbi.nih.gov/1000genomes/ftp/pilot_data/data) NA06985.SOLID.corona.SRP000031.2009_08.bam, NA06986.SOLID.corona.SRP000031.2009_08.bam, NA06994.SOLID.corona.SRP000031.2009_08.bam, NA07000.SOLID.corona.SRP000031.2009_08.bam and NA07357.SOLID.corona.SRP000031.2009_08.bam, and used the GATK unified genotyper to call genotypes, with default parameters except a reduced confidence threshold (-stand_call_conf = 10). The single-sample raw genotypes were then merged without any further filtering. SNP array genotype data for the same individuals were obtained from HapMap, release 28.
After genotyping, we merged both HapMap and 1,000 Genomes genotypes with the Popres/Iceman-merged dataset, resulting in a final analysis dataset containing 125,729 SNPs. PCA was then performed on all samples, excluding the five 1,000 Genomes samples, which were subsequently projected onto the PC space inferred from the rest of the dataset.
Metagenomic analysis. BlastN searches against the NCBI nucleotide collection were done using 8 million random 50 bp reads with a word size of 28. This analysis resulted in 1.6 million uniquely assigned reads, those with no hits were discarded. The results were analysed by MEGAN software44. Computation was performed on the Galaxy platform at the Eberhard-Karls University of Tübingen.
References1. Murphy, W. A. Jr et al. The Iceman: discovery and imaging. Radiology 226,
614–629 (2003).2. Handt, O. et al. Molecular genetic analyses of the Tyrolean Ice Man. Science
264, 1775–1778 (1994).3. Ermini, L. et al. Complete mitochondrial genome sequence of the Tyrolean
Iceman. Curr. Biol. 18, 1687–1693 (2008).4. Rollo, F. et al. Fine characterization of the Iceman’s mtDNA haplogroup. Am.
J. Phys. Anthropol. 130, 557–564 (2006).
5. Rasmussen, M. et al. Ancient human genome sequence of an extinct Palaeo-Eskimo. Nature 463, 757–762 (2010).
6. He, Y. et al. Heteroplasmic mitochondrial DNA mutations in normal and tumour cells. Nature 464, 610–614 (2010).
7. Briggs, A. W. et al. Patterns of damage in genomic DNA sequences from a Neandertal. Proc. Natl Acad. Sci. USA 104, 14616–14621 (2007).
8. Ginolhac, A., Rasmussen, M., Gilbert, M. T., Willerslev, E. & Orlando, L. mapDamage: testing for damage patterns in ancient DNA sequences. Bioinformatics 27, 2153–2155 (2011).
9. Rasmussen, M. et al. An Aboriginal Australian genome reveals separate human dispersals into Asia. Science 334, 94–98 (2011).
10. Pollard, K. S. et al. Forces shaping the fastest evolving regions in the human genome. PLoS Genet. 2, e168 (2006).
11. Nelson, M. R. et al. The population reference sample, POPRES: a resource for population, disease, and pharmacological genetics research. Am. J. Hum. Genet. 83, 347–358 (2008).
12. Novembre, J. & Stephens, M. Interpreting principal component analyses of spatial population genetic variation. Nat. Genet. 40, 646–649 (2008).
13. Hunter-Zinck, H. et al. Population genetic structure of the people of Qatar. Am. J. Hum. Genet. 87, 17–25 (2010).
14. Y-DNA Haplogroup Tree 2011 <http://www.isogg.org/tree/> (2011).15. Sims, L. M., Garvey, D. & Ballantyne, J. Improved resolution haplogroup G
phylogeny in the Y chromosome, revealed by a set of newly characterized SNPs. PLoS One 4, e5792 (2009).
16. Balanovsky, O. et al. Parallel evolution of genes and languages in the Caucasus region. Mol. Biol. Evol. 28, 2905–2920 (2011).
17. Capelli, C. et al. Y chromosome genetic variation in the Italian peninsula is clinal and supports an admixture model for the Mesolithic-Neolithic encounter. Mol. Phylogenet. Evol. 44, 228–239 (2007).
18. Lacan, M. et al. Ancient DNA reveals male diffusion through the Neolithic Mediterranean route. Proc. Natl Acad. Sci. USA 108, 9788–9791 (2011).
19. Haak, W. et al. Ancient DNA from European early neolithic farmers reveals their near eastern affinities. PLoS Biol. 8, e1000536 (2010).
20. Enattah, N. S. et al. Identification of a variant associated with adult-type hypolactasia. Nat. Genet. 30, 233–237 (2002).
21. Burger, J., Kirchner, M., Bramanti, B., Haak, W. & Thomas, M. G. Absence of the lactase-persistence-associated allele in early Neolithic Europeans. Proc. Natl Acad. Sci. USA 104, 3736–3741 (2007).
22. Obinu, D. A. et al. Prevalence of lactase persistence and the performance of a non-invasive genetic test in adult Sardinian patients. Eur. e-J. Clin. Nutr. Metab. 5, e1–e5 (2010).
23. McPherson, R. et al. A common allele on chromosome 9 associated with coronary heart disease. Science 316, 1488–1491 (2007).
24. Luke, M. M. et al. Polymorphisms associated with both noncardioembolic stroke and coronary heart disease: vienna stroke registry. Cerebrovasc. Dis. 28, 499–504 (2009).
25. Smith, J. G. et al. Common genetic variants on chromosome 9p21 confers risk of ischemic stroke: a large-scale genetic association study. Circ. Cardiovasc. Genet. 2, 159–164 (2009).
26. Newton-Cheh, C. et al. A common variant at 9p21 is associated with sudden and arrhythmic cardiac death. Circulation 120, 2062–2068 (2009).
27. Shen, G. Q. et al. Four SNPs on chromosome 9p21 in a South Korean population implicate a genetic locus that confers high cross-race risk for development of coronary artery disease. Arterioscler. Thromb. Vasc. Biol. 28, 360–365 (2008).
28. Chen, S. N., Ballantyne, C. M., Gotto, A. M. Jr. & Marian, A. J. The 9p21 susceptibility locus for coronary artery disease and the severity of coronary atherosclerosis. BMC Cardiovasc. Disord. 9, 3 (2009).
29. Yasuda, H. et al. Association of single nucleotide polymorphisms in endothelin family genes with the progression of atherosclerosis in patients with essential hypertension. J. Hum. Hypertens. 21, 883–892 (2007).
30. Sturm, R. A. et al. A single SNP in an evolutionary conserved region within intron 86 of the HERC2 gene determines human blue-brown eye color. Am. J. Hum. Genet. 82, 424–431 (2008).
31. Branicki, W., Brudnik, U. & Wojas-Pelc, A. Interactions between HERC2, OCA2 and MC1R may influence human pigmentation phenotype. Ann. Hum. Genet. 73, 160–170 (2009).
32. Yamamoto, F., Clausen, H., White, T., Marken, J. & Hakomori, S. Molecular genetic basis of the histo-blood group ABO system. Nature 345, 229–233 (1990).
33. Iwamoto, S. Molecular aspects of Rh antigens. Leg. Med. (Tokyo) 7, 270–273 (2005).
34. Stollberger, C., Molzer, G. & Finsterer, J. Seroprevalence of antibodies to microorganisms known to cause arterial and myocardial damage in patients with or without coronary stenosis. Clin. Diagn. Lab. Immunol. 8, 997–1002 (2001).
35. Volzke, H. et al. Seropositivity for anti-Borrelia IgG antibody is independently associated with carotid atherosclerosis. Atherosclerosis 184, 108–112 (2006).
ARTICLE
�
nATuRE CommunICATIons | DoI: 10.1038/ncomms1701
nATuRE CommunICATIons | 3:698 | DoI: 10.1038/ncomms1701 | www.nature.com/naturecommunications
© 2012 Macmillan Publishers Limited. All rights reserved.
36. Ammerman, A. J. & Cavalli-Sforza, L. L. The Neolithic Transition and the Genetics of Populations in Europe (Princeton University Press, 1984).
37. Müller, W., Fricke, H., Halliday, A. N., McCulloch, M. T. & Wartho, J. A. Origin and migration of the Alpine Iceman. Science 302, 862–866 (2003).
38. Scholz, M. & Pusch, C. An efficient isolation method for high-quality DNA from ancient bones. Technical Tips Online 2, 61–64 (1997).
39. Hawass, Z. et al. Ancestry and pathology in King Tutankhamun’s family. JAMA 303, 638–647 (2010).
40. Pusch, C. M., Bachmann, L., Broghammer, M. & Scholz, M. Internal Alu-polymerase chain reaction: a sensitive contamination monitoring protocol for DNA extracted from prehistoric animal bones. Anal. Biochem. 284, 408–411 (2000).
41. Stenson, P. D. et al. The Human Gene Mutation Database: 2008 update. Genome Med. 1, 13 (2009).
42. Karafet, T. M. et al. New binary polymorphisms reshape and increase resolution of the human Y chromosomal haplogroup tree. Genome Res. 18, 830–838 (2008).
43. Henn, B. M. et al. Genomic ancestry of North Africans supports back-to-Africa migrations. PLoS Genet. 8, e1002397 (2012).
44. Huson, D. H., Auch, A. F., Qi, J. & Schuster, S. C. MEGAN analysis of metagenomic data. Genome Res. 17, 377–386 (2007).
45. Graefen, A., Unterländer, M., Parzinger, H. & Burger, J. Multiplex-PCR as a tool for assessing ancient DNA preservation levels in human remains prior to next-generation sequencing. Bulletin de la Société Suisse d’Anthropologie 14, 81 (2009).
46. Handt, O., Krings, M., Ward, R. H. & Pääbo, S. The retrieval of ancient human DNA sequences. Am. J. Hum. Genet. 59, 368–376 (1996).
47. Haak, W. et al. Ancient DNA from the first European farmers in 7,500-year-old Neolithic sites. Science 310, 1016–1018 (2005).
AcknowledgementsThe work was supported in part by a grant of the National Geographic Society (Grant EC0469-10), the Südtiroler Sparkasse and Foundation HOMFOR. E.M., J.M. and P.L. are supported by D.F.G., C.M.P. and M.B. by the Minigraduierten-Kolleg Tübingen, N.B. by the FNP Humboldt fellowship, R.K. by the DAAD/GERLS, B.H., A.M.-E. and C.D.B.
by the National Institutes of Health, S.R. by the Estonian Science Foundation (Grant 7445), and M.S. and C.D.B. by the National Science Foundation.
Author contributionsE.M., C.M.P. and A.Z. contributed equally as senior authors; A.K., A.G. and M.B. contributed equally as first authors; A.K., E.M., C.M.P. and A.Z. initiated the study; A.K., E.M., C.M.P., A.Z. and N.B. designed the study; A.G., M.M., V.B., F.M., A.F., J.M., C.L., T.T.H., A.S., P.A.U., C.D.B., H.K. and B.M. contributed to the study design; A.G., A.K., E.M. and P.L. wrote the paper; F.M., P.A.U., C.D.B. and C.B. were supportive in writing the revision; F.M., A.G., M.M., V.B., B.M., M.B., R.K., M.F., B.S., S.M., M.S., A.M.-E., B.H., M.S., O.S., J.C., S.R., N.M.M., V.M.C., M.S., G.C., J.H., B.D.O. and M.R.J.C. analysed the data; A.G., V.B., M.B., C.L., J.S. and G.C. performed the experiments; E.E.V. collected the samples; C.L., O.S., J.C., S.R., N.M.M. and T.T.H. provided the reagents; all authors discussed the results and commented on the manuscript.
Additional informationAccession codes: The sequencing data have been uploaded to the European Nucleotide Archive under accession code ERP001144.
Supplementary Information accompanies this paper at http://www.nature.com/naturecommunications
Competing financial interests: J.S., S.M., M.S., C.L., T.T.H. and A.S. are employees of Life Technologies. M.M., V.B. and A.K were previously employed by Febit biomed GmbH.
Reprints and permission information is available online at http://npg.nature.com/reprintsandpermissions/
How to cite this article: Keller, A. et al. New insights into the Tyrolean Iceman’s origin and phenotype as inferred by whole-genome sequencing. Nat. Commun. 3:698 doi: 10.1038/ncomms1701 (2012).
License: This work is licensed under a Creative Commons Attribution-NonCommercial-Share Alike 3.0 Unported License. To view a copy of this license, visit http://creativecommons.org/licenses/by-nc-sa/3.0/