Embed Size (px)
Citation preview
New Information Reported under HMDA andIts Application in Fair Lending Enforcement
Robert B. Avery and Glenn B. Canner, of the Divisionof Research and Statistics, and Robert E. Cook, of theDivision of Consumer and Community Affairs, pre-pared this article. Shannon C. Mok and Caitlin G.Coslett provided research assistance. Patricia J.Dykes and Sylvia A. Freeland assisted in preparingthe 2004 HMDA data for analysis.
Most lending institutions with offices in metropolitanstatistical areas are required by the Home MortgageDisclosure Act of 1975 (HMDA) to disclose informa-tion to the public about applications for home loansand the home loans that they originate or purchaseduring each calendar year. The law’s requirementsarose from concerns that, in some cases, lenders werecontributing to the decline of certain neighborhoodsby failing to provide adequate home financing toqualified applicants on reasonable terms and condi-tions. The disclosure of lending activity is intended tohelp determine whether lenders are adequately serv-ing their communities’ housing finance needs, tofacilitate enforcement of the nation’s fair lendinglaws, and to guide investment activities in both thepublic and the private sectors. HMDA is imple-mented by the Federal Reserve Board’s Regula-tion C.
Underlying HMDA’s disclosure requirements is apresumption that more publicly available informationwill improve market performance and help preventmarket failures. The data reported under HMDA arecertainly extensive: Taken together, the 8,853 lenderscovered by the law as of the end of 2004 are esti-mated to have accounted for about 80 percent ofhome loans extended that year.
The Congress has amended HMDA on severaloccasions to extend the reach of the law to morelenders and to expand the types of information thatmust be disclosed. Amendments passed in 1989 havebeen the most sweeping to date. They require thatlenders disclose the disposition of each applicationthey process for home loans and the income, race,ethnicity, and sex of the individuals applying for the
loans. As this new information became available, itrevealed wide differences in rates of approval of loanapplications across racial and ethnic lines and therebyheightened concerns about whether lending decisionscomplied with the nation’s fair lending laws. Thedisclosures triggered a continuing debate about theproper interpretation of the data and the significanceof the differences in lending decisions. Many lendinginstitutions have responded to the concerns raised inthe debate by adopting new loan-underwriting proce-dures to help ensure fair treatment of all applicantsand by initiating a wide variety of community out-reach and affordable lending programs intended tobenefit minority borrowers and lower-income indi-viduals and neighborhoods.
In 2002, in its most recent review of Regulation C,the Federal Reserve Board made a number of impor-tant changes to the disclosure requirements that sub-stantially increase the types and amount of informa-tion made available through HMDA.1 The revisionsare intended to better advance the purposes of the lawby keeping the regulation in step with recent develop-ments in home-loan markets and by incorporating therevised standards of classification for the collectionof information on race and ethnicity as established bythe Office of Management and Budget (OMB).
Most of the recent changes in the information thatis required to be reported under HMDA apply to datarelating to loans extended in 2004. Individual lenderscovered by HMDA were required to make their 2004data available to the public beginning on March 31,2005. However, only the September 2005 release ofthe data will have been comprehensively checked bythe supervisory agencies for the errors and omissionsthat are detectable from a review of the data.
Perhaps the most important change to Regula-tion C is the requirement that lenders now disclosepricing (interest rates and fees) for loans with prices
Note: Gregory Elliehausen, of the Credit Research Center ofGeorgetown University, prepared a special analysis for this article.
1. See Home Mortgage Disclosure Act (12 U.S.C. 2801), Regula-tion C (12 C.F.R. pt. 203), and the staff commentary accompanyingRegulation C (12 C.F.R. pt. 203, Supp. I). The Board’s revisions toRegulation C that are the focus of this article were issued in 2002.See the following issues of Federal Register (2002), vol. 67: Febru-ary 15, p. 7222; May 8, p. 30771; and June 27, p. 43218; and FederalRegister (2003), vol. 68 (May 28), p. 31589.
344
above designated thresholds. Loans with prices abovethe thresholds are referred to here as ‘‘higher-pricedloans.’’ Other important new information beingreported under the revised regulation is whetherthe loan is a first lien, a junior lien, or unsecured(characteristics referred to here as a loan’s lien sta-tus), whether it is secured by a manufactured home,and whether it is subject to the protections of theHome Ownership and Equity Protection Act of 1994(HOEPA). These new pieces of information allow fora better understanding of lending activity in thehigher-priced segment of the home-loan market, asegment that was virtually nonexistent a decade or soago and is now a substantial part of the market. Thegrowth of this market segment, while affording someconsumers greater access to credit, has been accom-panied by concerns about abusive lending practices,often referred to as ‘‘predatory lending.’’2 These con-cerns lend importance to a better understanding ofthe higher-priced segment of the market and a greaterability to monitor the activities of the individuallenders involved in it.
This article presents a first look at the greatlyexpanded 2004 HMDA data and considers some oftheir implications for the continuing concerns aboutfair lending.3 The analysis highlights some key rela-tionships revealed in an initial review of the types ofdata that are new for 2004. Some parts of the analysisfocus on nationwide statistics, and others examinepatterns across groups of lenders, loan products, andvarious groupings of applicants, borrowers, andneighborhoods. The authors explore, in particular andin some depth, the strengths and limitations of theinformation on loan pricing.
We also describe how the Federal Reserve uses theHMDA data as part of a screening tool to facilitate
the enforcement of the fair lending laws. In thisregard, we discuss the way the expanded HMDAdata, particularly the information on loan pricing,enhance the utility of the screening tool. At the sametime, we emphasize that, although these data presentvaluable new opportunities for researchers and othersto learn more about the home-loan market and for theregulatory agencies to improve the enforcement offair lending laws, the data are not sufficient by them-selves for drawing conclusions about the fairness ofthe lending process or the activities of any individuallender. For example, credit history scores and otherfactors not included in the HMDA data can be criti-cal in determining loan prices. With regard to thisissue, we collaborated with researchers at the CreditResearch Center of Georgetown University, whichhas data on credit history scores and other loan-levelfactors relevant to loan pricing. The loan-level datawere supplied to the Credit Research Center by asmall group of lenders that are covered by HMDAand are active originators of loans in the higher-priced segment of the home-loan market.
Our examination of the 2004 data also focuses onthe newly reported information about loans on manu-factured homes. The disposition of applications forloans to buy, refinance, or improve such units hasan important influence on the pattern of denial ratesof all loans reported under HMDA. We also discussthe new information on HOEPA-related lending andcertain requests for pre-approvals of home-purchaseloans and assess their overall significance in themarket. Finally, in the article’s summary and conclu-sions, we review our key findings and emphasize thatusers of the data should exercise particular cautionin drawing conclusions about lending patterns fromHMDA data alone.
THE REQUIREMENTS OF REGULATION C
The Federal Reserve Board’s Regulation C, whichimplements HMDA, applies to most depository insti-tutions (commercial banks, savings institutions, andcredit unions—hereafter, ‘‘banks’’) with a home orbranch office in a metropolitan area. Banks that areexempt from Regulation C are small (currently thosewith assets of less than $34 million), or are not inthe home-lending business, or have offices exclu-sively in rural (nonmetropolitan) areas.4 Regula-
2. The Federal Reserve has adopted no specific definition of preda-tory lending, but the term is often considered to encompass a varietyof lending practices involving fraud, deception, or unfairness. Somepredatory lending practices are illegal; others, although legal, are stillconsidered abusive in certain circumstances. Some of the practicesconsidered questionable or in some cases illegal include (1) makingloans that are based on the asset value of the collateral but areunaffordable given the consumer’s ability to pay the obligation;(2) inducing repeated refinancing accompanied by high fees thatprovide no material benefit to the consumer (sometimes referred to as‘‘loan flipping’’); (3) inducing the consumer, through deception orfraud, to accept loan add-ons, such as single-premium credit insur-ance; (4) ‘‘steering’’ borrowers qualified for lower-rate loans intohigher-priced loans; and (5) purposely overestimating the value of thecollateral to overstate available equity or induce a consumer to pay aninflated price for a home.
3. For additional information, see Board of Governors of the Fed-eral Reserve System, Department of Housing and Urban Develop-ment, Federal Deposit Insurance Corporation, National Credit UnionAdministration, Office of the Comptroller of the Currency, and Officeof Thrift Supervision (2005), ‘‘Agencies Announce Answers to Fre-quently Asked Questions about New HMDA Data,’’ press release,March 31, www.federalreserve.gov/boarddocs/press/all/2005/.
4. Although coverage of financial institutions under HMDA islimited to those with offices in metropolitan statistical areas, coveredinstitutions must report on all their home-lending activities whetherthe properties involved in the loan are located in a metropolitan ornonmetropolitan area.
345
tion C also extends to mortgage and consumer financecompanies—hereafter, ‘‘mortgage companies’’—whether such companies are independent or are sub-sidiaries of banks or affiliates of bank holding com-panies. Coverage of mortgage companies appliesmainly to those that are active in the home-loanmarket—that is, those that extend 100 or more home-purchase or home-refinancing loans per year andoperate in at least one metropolitan area.5
The HMDA data include information about appli-cants and borrowers, the home-loan products theyseek, the disposition of their requests for credit, anddetails about the location of the property that relate tothe application. For information about the channelsthrough which the HMDA data are released and for adescription of the data that were required of lendersbefore the 2002 revisions, see box ‘‘Distribution ofHMDA Data and Pre-2004 Requirements of Regula-tion C.’’
The New Reporting Requirements
The 2002 revisions to Regulation C are intended toimprove the quality, consistency, and utility of thedata reported under HMDA; they are also intendedto ease regulatory burden, primarily by clarifyingand simplifying parts of the regulation. The newrequirements
• expand coverage to more nondepository lenders• streamline the definitions of refinancing and home-
improvement loan• revise the definition of application to include cer-
tain requests for pre-approvals (however, in thisarticle, applications are defined as being for a loanon a specific property; they are thus distinct in ouranalyses from requests for pre-approval, which areunrelated to a specific property)
• mandate for the first time the collection of lienstatus; property code (to distinguish between one-to four-family dwellings that are site-built andthose that are manufactured homes); loan pricing;and HOEPA status
• incorporate changes to the rules on collecting andreporting information on race and ethnicity to con-form to guidance issued by the OMB
• require lenders to request the race, ethnicity, andsex of prospective borrowers who apply by mail,Internet, or telephone
• revise the categories that identify the type of insti-tution to which loans are sold
The disclosure of additional data and the reviseddefinitions for some currently reported items serveseveral purposes. For example, the revised definitionof refinancing is intended to reduce inconsistency inthe data and to simplify reporting.6 Some of the newdata items—such as lien status and identification ofloans for manufactured homes—allow more-precisedifferentiation among loan products and consequentlyreduce the possible analytical biases that arise whendissimilar loan products are grouped together. Toensure that nondepository institutions that are activehome lenders are subject to the same reporting regimeas are other lenders, coverage rules were changed byadding an annual dollar-volume threshold of $25 mil-lion of home-loan originations to the current criterionof 10 percent of total loan originations measured indollars.
Pricing information increases the scope of analysisof HMDA data in support of fair lending enforcementand makes possible an assessment of pricing patternsin the higher-priced segment of the home-loan mar-ket. In addition, designation of HOEPA status canbe used to identify lenders involved in that type oflending, to measure its incidence in the market, andto aid in fair lending evaluations and HOEPA com-pliance. Finally, the new information on requestsfor pre-approvals provides more data on consumers’experiences in the early stages of shopping for a loanto buy a home, a phase of the loan process that hasheretofore gone largely unreported, and thus shouldalso facilitate fair lending enforcement.
Transition Rules
To minimize reporting burden and to help ensurethe quality and usefulness of the expanded data,the Federal Reserve established transition rules forHMDA compliance that generally did not requirelenders to collect some of the new information forrequests for pre-approval and applications submittedbefore January 1, 2004. Among the new information
5. For the details of the coverage rules and for additional informa-tion about the data collection and reporting requirements, see A Guideto HMDA Reporting: Getting It Right! published annually by theFederal Financial Institutions Examination Council (www.ffiec.gov/hmda/guide.htm).
6. Reporting institutions had been allowed to choose from fourscenarios in deciding which refinancings to report. The new rulesdefine a refinancing simply as a secured home loan that satisfies andreplaces another secured home loan by the same borrower. Thereporting of home equity lines of credit (extended for any purpose) isvoluntary.
346 Federal Reserve Bulletin Summer 2005
items affected by the transition rules were the dataon pricing; the information on whether an applicationor loan involved a request for pre-approval and onwhether the dwelling involved was a manufacturedhome; and the classifications of race and ethnicity.
Of all applications involving one- to four-familyunits in the 2004 HMDA data, about 2 million, or7 percent, were filed before 2004, and thus the datareported on those applications (pertaining to about
1 million loans) might not reflect the new reportingrules. Users of the 2004 data should be aware of thislimitation.
To help users of the HMDA data better distinguishloans subject to the transition rules, the FederalFinancial Institutions Examination Council (FFIEC)has added a data item to the 2004 CD-ROM thatcontains a copy of the HMDA/LAR for each institu-tion that indicates whether or not an application was
Distribution of HMDA Data and Pre-2004 Requirements of Regulation C
Under the Home Mortgage Disclosure Act (HMDA), lend-ers use a ‘‘loan/application register’’ (HMDA/LAR) toreport information annually to their federal supervisoryagencies for each application and loan acted on during thecalendar year. Lenders must make their HMDA/LARs avail-able to the public by March 31 following the year to whichthe data relate, and they must remove the two date-relatedfields to help preserve applicants’ privacy.1
The Federal Financial Institutions Examination Council(FFIEC), acting on behalf of the federal supervisory agen-cies, compiles the reported information and prepares anindividual disclosure statement for each institution—one foreach metropolitan statistical area (MSA) and metropolitandivision (MD) in which it has offices—as well as aggregatereports for all covered lenders in each MSA and otherreports.2 The disclosure and aggregate reports are detailedtables of data on individual loans and applications.
The disclosure statements and reports are available to thepublic at the FFIEC website for HMDA (www.ffiec.gov/hmda), from the covered lenders themselves, and fromdepositories (such as public libraries and other governmentoffices) in each MSA.3 In addition, a copy of the HMDA/LAR for each institution is available to the public onCD-ROM for a nominal charge. The FFIEC also makesavailable a copy of the file of population characteristics ofeach census tract covered by the tables on individual institu-tions and by the aggregate tables. The 2004 census tract fileis derived from the 2000 decennial census. MSA and MDidentifiers included on that file are based on the designa-tions of MSAs issued by the Office of Management andBudget.4
1. Lenders must make their date-modified register available to the publicfor a period of three years.
2. MSAs that have a single core with a population of 2.5 million or moreand meet certain other requirements contain MDs. Of the 370 MSAs in theUnited States, 11 have a population of at least 2.5 million and have a total of29 MDs. Starting with the release of the 2004 HMDA data, disclosure reportswill follow the guidance provided by the Office of Management and Budget(OMB) regarding the appropriate use of statistical-area definitions; see Officeof Management and Budget (2003), OMB Bulletin, no. 03-04 (June),www.whitehouse.gov/omb/bulletins/b03-04.html. In conformance with OMBguidance, the FFIEC will prepare disclosure reports for each MSA and MD.
3. The FFIEC maintains the most recent three years of HMDA data. Datafor earlier years can be obtained from the National Technical InformationCenter, Springfield, Virginia, www.ntis.gov.
4. See Office of Management and Budget, OMB Bulletin.
Before the most recent revisions, in 2002, the FederalReserve Board’s Regulation C required lenders to report thefollowing information on home-purchase and home-improvement loans and on the refinancing of such loans:
For each application or loan• application date and the date an action was taken on the
application• action taken on the application
— approved and originated— approved but not accepted by the applicant— denied (with the reasons for denial—voluntary for
some lenders)— withdrawn by the applicant— file closed for incompleteness
• loan amount• income relied on in loan underwriting• loan type
— conventional— insured by the Federal Housing Administration— guaranteed by the Veterans Administration— backed by the Farm Service Agency or Rural Housing
Service• loan purpose
— home purchase— refinance— home improvement
• type of purchaser (if the lender subsequently sold theloan)
For each applicant or co-applicant• race or ethnicity• sex
For each property• location, by state, county, and census tract• type (one- to four-family dwelling or dwelling with five
or more units)• occupancy status (owner-occupied or nonowner-
occupied)
Information is also reported on home loans purchased by aninstitution during a calendar year. Under the 2002 revisionsto Regulation C, additional items became required begin-ning in 2004.
New Information Reported under HMDA and Its Application in Fair Lending Enforcement 347
filed before January 1, 2004 (see box ‘‘Distributionof HMDA Data and Pre-2004 Requirements ofRegulation C’’). Users of the 2004 data can makeassumptions or restrict their analysis in various waysto address problems created by the transition rules.For example, in preparing the institution and aggre-gate MSA disclosure reports for 2004, the FFIECexcluded applications filed before January 1, 2004,from all tables reporting pricing (but not other)information.
The transition rules should have little effect on thedata in future HMDA filings. However, because someapplications have application filing dates that precedea decision on the application by more than a year, afew applications subject to the transition rules may beincluded when the 2005 HMDA data are reported in2006.
Lien Status
Information on lien status differentiates home loanssecured by a first lien, those secured by a junior(second or third) lien, and those not secured. (The lastcategory arises only among home-improvementloans, for which a security interest in a property mayor may not be taken.) Knowledge of lien status isbasic to credit underwriting because loans secured byfirst liens have a lower incidence of default than loanssecured by junior liens or unsecured loans; conse-quently, loans secured by a first lien are generallyoffered at the lowest rates of interest.
The information on lien status serves a numberof public policy interests. First, the informationimproves the measurement of the overall size of thehome-loan market and particular segments withinthat market, such as home-purchase lending.Although HMDA data have always included informa-tion about the purpose of a loan, recent market devel-opments have made that information less useful formeasuring lending. Today, many home purchasesinvolve both first- and junior-lien loans. The junior-lien loan in such transactions is often used to avoidrequirements to purchase private mortgage insurance(PMI) or to avoid exceeding the loan-size limits usedby some secondary-market purchasers, especiallyFannie Mae and Freddie Mac (see the appendix formore information about PMI and the availability ofdata on loans backed by PMI). In the past, a loanbacked by a junior lien could not be distinguisheddirectly in the home-purchase loan data from onebacked by a first lien and was therefore often assumedto represent a separate home-purchase loan ratherthan to be one of two used to purchase a single
property.7 The expanded HMDA data allow suchdistinctions to be made and consequently help avoidthe double counting of loans in the home-purchasemarket.
Second, lien status is essential for interpretingloan-pricing information and in conducting fair lend-ing investigations. Regarding fair lending reviews,the historical lack of information on lien status inthe HMDA data has hampered analyses focusingon potential differences in the pattern of the dispo-sition of applications because distinguishing prop-erly among loan products using only HMDA datahas been difficult or impossible.8 Because the use ofvarious loan products and patterns of applicationdisposition can vary across racial and ethnic groups,an inability to distinguish products can lead to spuri-ous correlations and potentially inappropriate conclu-sions about the fairness of the application of credit-underwriting policies.
Manufactured-Home Status
Available evidence indicates that the credit profiles ofindividuals seeking loans backed by manufacturedhomes differ from those of individuals borrowing forsite-built homes.9 On the whole, loans to purchasemanufactured homes involve relatively high creditrisk, in part because the buyers of such homes tend tohave weaker financial profiles than do those purchas-ing other single-family properties. This evidence hasimportant implications for denial rates and pricing.
Analysis of past HMDA data implied that lendersdenied about 60 percent of all applications for con-ventional home-purchase loans for manufacturedhomes, whereas they denied only about 12 percent of
7. One technique used to identify loans backed by junior liens wasto assume that all loans below a given amount were junior-lien loans.This approach is flawed because some homes, including many manu-factured homes, have low prices and purchasers of these propertiesoften need only a small loan. Similarly, some borrowers make substan-tial down payments when they buy a home, and in such circum-stances, the amount of the first-lien loan may be small.
8. During some fair lending reviews, lenders have provided exam-iners with information that has allowed the separation of first andjunior liens.
9. A manufactured home is a single-family house constructedunder a federal building code administered by the U.S. Department ofHousing and Urban Development (HUD). The Federal ManufacturedHome Construction and Safety Standards (commonly known as theHUD code) took effect on June 15, 1976. The result of federalregulation was to more clearly define mobile homes as buildingsrather than vehicles—although the HUD code imposes standards tomake sure the units can be transported by truck to the placement site.The Housing Act of 1980 officially adopted this change, mandatingthat, for homes built under the HUD code, the term manufacturedhousing (factory-built homes) replace the term mobile homes in allfederal law and literature.
348 Federal Reserve Bulletin Summer 2005

applications for other conventional home-purchaseloans.10 Until now, the general inability to accuratelydistinguish manufactured-home loans from loansrelated to site-built homes complicated the determina-tion of whether differences in denial rates acrossgroups of applicants arose from differences in under-writing practices across the groups or simply fromdifferent mixes of loan products sought by the groups.Identification of applications and loans involvingmanufactured homes in the expanded HMDA dataallows for more-refined analysis of the sources ofdifferent denial rate patterns and for greater under-standing of financing activities in this important mar-ket segment.
Loan Pricing
The home-loan market has evolved in a number ofimportant respects over the past decade or so. Tradi-tionally, lenders offered consumers a relatively lim-ited array of products at prices that varied accordingto the characteristics of the loan and property but notaccording to the creditworthiness of the borrower.Effectively, borrowers either did or did not meet theunderwriting criteria for a particular product, andthose who met the criteria paid about the same price.This market characterization may explain why thecongressional revisions to HMDA in 1989 focusedon the disclosure of data on the disposition of applica-tions rather than on loan prices.
Since then, improvements in information process-ing and the maturation of a robust secondary marketfor loans have spurred changes in the home-loanmarket. Prominent among these changes has beenan evolution toward an explicitly risk-based pricingof credit. Now the creditworthiness of individualborrowers can lead to different prices for the sameproduct. Less-creditworthy applicants, or those eitherunwilling or unable to document their creditworthi-ness or income, are increasingly less likely to beturned down for a loan; rather, they are offered creditat higher prices.
Borrowers in the higher-priced market generallyfall into one of two market segments, ‘‘near prime’’and ‘‘subprime,’’ with individuals in the latter cate-gory paying the highest prices because they pose the
greatest risk of default. In practice, the dividing linebetween these two ‘‘nonprime’’ markets is becomingincreasingly amorphous, as is the line between theprime (lower-price) and nonprime markets.
Estimates of the annual volume of subprime lend-ing vary, but all sources agree that this market hasgrown substantially in recent years.11 One industrysource estimates that over the period 1994–2004,the annual dollar volume of subprime home loansincreased from about $35 billion to more than$530 billion. Consequently, subprime lending is nolonger a minor segment of the market. Subprimeloans are estimated to have accounted for about19 percent of all home-loan originations in 2004, upfrom less than 5 percent in 1994.12
As significant pricing variability has emerged inthe market, so have concerns about the fairness ofcreditor decisions in this regard. Little informationhas been available to assess the merits of these con-cerns, and only a few fair lending investigationsfocusing on pricing issues have been pursued by thefederal banking agencies or the Department of Jus-tice. In its review of Regulation C that led to the 2002revisions, the Federal Reserve Board averred theimportance of gathering information to facilitateassessments of the fairness of loan-pricing decisions,particularly for nondepository institutions, whichare less likely to be subject to periodic fair lendingexaminations. Recognizing the costs incurred bylenders to comply with such a reporting and disclo-sure requirement, the Board limited the scope of theregulation to the disclosure of pricing on loan origina-tions (not loans purchased from other entities orapplications that did not result in a loan origination)in the higher-priced segment of the loan market andto focus within that segment only on dwelling-secured loans subject to Regulation Z (which doesnot cover ‘‘business purpose’’ loans—including someloans to individuals who do not intend to occupy thedwelling being financed).13
Specifically, the 2002 revisions to Regulation Crequire the reporting of the spread between the annualpercentage rate (APR) on a loan and the rate on
10. In the past, loans on manufactured homes were identified usinginformation about the lender’s main line of business. This proxy ishelpful only for lenders focused mainly on manufactured-home lend-ing. A large number of other lenders also extend such credit, butbecause manufactured-home lending does not constitute their mainline of business, determining which of their loans involve manufac-tured homes has been impossible. See www.huduser.org/datasets/manu.html.
11. One method of estimating the annual volume of subprime loansis based on a list of subprime lenders that was developed by HUD andhas been released each year since 1993. The number of loans in theHMDA data originated by lenders on the HUD list has been used asan estimate of subprime lending volume. The list has also been usedto support other analyses of subprime lending activity. Of the 224lenders on the list for 2003, 191 appear under the same name andidentification number as reported in the HMDA filings for 2004.
12. Estimates pertain to home loans backed by one- to four-familyhomes; see Inside Mortgage Finance Publications (2005), MortgageMarket Statistical Annual 2005, 2 vols. (Bethesda, Md.: IMFP).
13. Regulation Z, 226.3(a). The Federal Reserve Board’s Regula-tion Z (12 C.F.R. pt. 226) implements the Truth in Lending Act.
New Information Reported under HMDA and Its Application in Fair Lending Enforcement 349
Treasury securities of comparable maturity for loanswith spreads above designated thresholds. The APRwas selected as the measure of the loan’s pricingbecause it was regarded as the best single measure ofthe ‘‘true’’ cost of a loan. The thresholds for reportingdiffer by lien status: 3 percentage points for first liensand 5 percentage points for junior liens. To calculatethe rate spread, the lender uses the yield on Treasurysecurities as of the fifteenth day of a given monthdepending on when the interest rate was set on theloan.14
In establishing this disclosure rule, the FederalReserve sought to select thresholds that wouldexclude the vast majority of prime rate loans andinclude the vast majority of subprime loans. Theselection of specific thresholds was based on loan-price data from several sources.15 The analysisrevealed that roughly 98 percent of prime first-lienloans have APRs that would likely fall below thethreshold of 3 percentage points for reporting firstliens.16 The analysis also indicated that this thresholdwould require reporting for about 98 percent of thesubprime loans backed by first liens and that the5 percentage point threshold would capture about95 percent of the subprime loans backed by juniorliens. Overall, data from the Annual Housing Surveycovering prime, near-prime, and subprime loans sug-gested that, in a typical year, the thresholds would fallsomewhere in the near-prime range and wouldrequire the reporting of about 10 percent of all homeloans backed by first liens and about 22 percent of allloans backed by junior liens.
In a given year, various factors may influence theproportion of loans that have prices placing themabove or below the pricing thresholds. A change ininterest rates can influence the volume and types ofloans that exceed the pricing thresholds. With gen-erally rising interest rates, for example, refinancing
activity will be reduced, and consequently a largerproportion of loans reported above the thresholds willinvolve home purchases. Moreover, borrowers whorefinance during a period of rising interest rates arelikely to differ from those who borrow when ratesare falling. When rates are rising, borrowers seekingto refinance their outstanding loans are likely to havemore-urgent needs for additional funds that can beraised by a cash-out refinancing or are seeking tolower their total monthly payment obligations bylengthening the terms of their outstanding debt.
Changing interest rates also may affect the propor-tion of adjustable-rate versus fixed-rate loans origi-nated over the course of a year and thus the mixof loans reported with rates above the threshold. Tocompensate borrowers for bearing the additionalinterest rate risk associated with adjustable-rate loans,such loans typically have lower initial APRs than dofixed-rate loans with the same term to maturity. Ifmarket participants expect interest rates to rise, theseexpectations tend to be built into the term structureof interest rates (the ‘‘yield curve’’) and to widenthe difference between the initial rates on adjustable-rate and fixed-rate loans. This widening can increasethe proportion of fixed-rate loans with APRs abovethe threshold because the APRs for longer-termadjustable-rate loans will not rise as much in such amarket as will those for fixed-rate longer-term loans.
HOEPA Status
Long-standing concerns about predatory lending ledthe Congress to enact the Home Ownership andEquity Protection Act of 1994, the first federal statuteto explicitly target such lending practices. HOEPA,which amends the Truth in Lending Act, applies toclosed-end home loans (excluding home-purchaseloans) bearing an APR or dollar-amount fees abovespecified thresholds.17 The act imposes restrictionson certain loan features, including balloon paymentsand prepayment penalties, and requires improveddisclosures for consumers. HOEPA, like most otherfederal consumer protection statutes, overridesweaker state laws but permits states to enact stricterrules.
14. For such calculation, the rule directs creditors to use the fif-teenth day of a given month for any loan on which the interest ratewas set on or after that day through the fourteenth day of the nextmonth. The relevant date is when the interest rate on the loan wasdetermined, which is often, but not always, set pursuant to a lock-inagreement between the borrower and the lender. The APR used inthe calculations is the one determined and disclosed to the consumerunder section 226.6 or section 226.18 of Regulation Z. To easereporting burdens and to help ensure high-quality data, the FFIECmakes available a ‘‘Rate Spread Calculator’’ that lenders can use todetermine whether they must report the spread on a given loan and, ifso, what the spread is; see www.ffiec.gov/ratespread/default.aspx.
15. See the U.S. Census Bureau’s 1998 and 1999 Annual HousingSurveys, the Federal Reserve Board’s 2001 Survey of ConsumerFinances, the Federal Housing Finance Board’s 1999 Mortgage Inter-est Rate Survey, and data on subprime lending from the CreditResearch Center of Georgetown University.
16. See Board of Governors of the Federal Reserve System (2002),‘‘Regulatory Analysis of Proposed Amendments to Regulation C,’’staff memorandum, Division of Research and Statistics, January 15.
17. Unlike lines of credit, closed-end loans are amortizing—theyrequire fixed monthly payments against both principal and interest—and are thus scheduled to close at the end of a given term to maturity,when the balance will reach zero. A balloon payment might beinvolved if the amortization schedule leaves a relatively large balanceowed at the end of the loan’s term. In contrast, a home equity line ofcredit (HELOC) is a revolving account that permits borrowing fromtime to time at the account holder’s discretion, up to the amount of thecredit line. Under a HELOC, a consumer may repeatedly pay thebalance down to zero and then redraw against the line.
350 Federal Reserve Bulletin Summer 2005
The Federal Reserve Board, which has authority tomodify some of the requirements of HOEPA (imple-mented by the Board’s Regulation Z), made such amodification in 2001. The 2001 revisions to the reg-ulation lowered the APR trigger for coverage offirst-lien loans from 10 percentage points above thecomparable-maturity Treasury security to 8 percent-age points (the threshold for junior liens was leftat 10 percentage points), adjusted the calculation ofthe dollar-amount trigger for fees to include amountspaid at closing for optional credit insurance products,prohibited or restricted certain practices, and requiredimproved disclosures.18 Although these amendmentsaddressed some concerns, predatory lending contin-ues to some degree. Since 1999, about thirty statesand numerous local governments have enacted lawsregarding predatory lending to address certain prac-tices and contract terms. The Congress has also con-sidered amendments to HOEPA to broaden its scopeand to preempt state laws, but to date, no final actionhas been taken.
In its 2002 amendments to Regulation C (theHMDA regulation), the Board required lenders toreport whether a loan is subject to HOEPA. In sodoing, the Board recognized that obtaining informa-tion on the volume and pattern of lending coveredunder HOEPA would be useful for a better under-standing of the size of the HOEPA-related segmentof the market and would allow regulators to focusexaminations on the loans and creditors posing thegreatest concern. The HOEPA status of loans at bankscould always be obtained through on-site examina-tions; but nondepository lenders are not subject toregular examinations, and thus the extent of theirHOEPA-related lending has been largely unknown.Moreover, although banks are examined regularly,the collection of data on HOEPA status on theHMDA/LAR is a much more efficient way for theenforce-ment agencies to obtain the data and allows for sometypes of analysis to precede an on-site complianceexamination.
Requests for Pre-Approvals
Prospective homebuyers are often asked by sellers todemonstrate that they are likely to qualify for financ-ing. In recent years, many lending institutions havedeveloped pre-approval programs to respond to thatrequest. Such programs typically provide qualifiedprospective homebuyers with a binding written com-
mitment to finance their purchase, subject to certainconditions related primarily to the property to bepurchased and any changes in their financial cir-cumstances. The request for a pre-approval doesnot generally identify a specific property so that, ifgranted, it can be used by the prospective buyer withmore than one prospective seller. In the past, theHMDA records did not include data on requests forpre-approvals unless they ultimately resulted in anapplication related to a specific property. Under theexpanded reporting requirements, lenders must alsoreport requests for pre-approval that were denied.Disclosure of denials of pre-approval requests isintended to provide more-complete information onthe availability of home financing and to facilitatefair lending enforcement. Lenders have the optionof reporting pre-approvals that were granted but notacted on by the consumer.19
Changes in the Collection of Data RegardingRace and Ethnicity
The 2004 HMDA data incorporate the revised stan-dards of classification for government collection ofinformation on race and ethnicity as established bythe OMB.20 Perhaps the most important OMB revi-sion allows individuals to select multiple racial andethnic identifications, and HMDA reporting ruleswere modified to conform to these changes. ForHMDA data collected before 2004, applicants forcredit had no opportunity to designate both race andethnicity but had to categorize themselves as beingof Hispanic origin or as being in one of five racialcategories (American Indian or Alaskan Native,Asian or Pacific Islander, black, white, or other). Asof 2004, applicants may designate more than oneracial category (American Indian or Alaska Native,Asian, black or African American, Native Hawaiianor other Pacific Islander, or white) and may designateone of two ethnicities (either ‘‘Hispanic or Latino’’ or
18. For further details, see section 226.32 of Regulation Z.
19. The only pre-approval programs covered by HMDA are thosein which the decision to grant or deny the request is based on acomprehensive credit underwriting process in which a lender collectsand reviews the information it typically considers in making creditdecisions in a traditional application (that is, an application for aspecific property). For a pre-approval program to be covered, thelender must issue binding written commitments (subject only to verylimited conditions) for consumers whose requests were granted.Because requests for pre-approval typically do not identify a specifichome for purchase, the HMDA data do not show the property locationfor pre-approvals that do not ultimately result in an application forcredit related to a specific property.
20. See Office of Management and Budget (1997), ‘‘Revisions tothe Standards for the Classification of Federal Data on Race andEthnicity,’’ Federal Register, vol. 62 (October 30), pp. 58782–90.
New Information Reported under HMDA and Its Application in Fair Lending Enforcement 351
‘‘not Hispanic or Latino’’). (Hereafter, for concision,we refer to the category ‘‘black or African Ameri-can’’ as black and to the category ‘‘Hispanic orLatino’’ as Hispanic.)
The changes regarding race and ethnicity will makeit difficult to align the HMDA data for 2004 withthose for earlier years. Most important, applicantswho in 2003 were classified as Hispanic were notalso classified by their race. Consequently, a compari-son of lending activity by race between 2004 andearlier years might lead some to conclude that lend-ing to certain racial groups may have changed when,in fact, the only change was in the classificationsystem.
Changes in the Data-Collection Requirements forSales in the Secondary Market
The secondary market for home loans is the arena inwhich loans already originated are bought and sold.HMDA requires that, for a given year, covered insti-tutions report the sales of loans that they originated inthat year as well the sales of loans that they pur-chased in that year. For each sale, the institution mustalso report the type of purchaser.
HMDA data have long been one of the few sourcesof loan-level information describing secondary-market activities. The 2004 data are reported usingcodes that represent revised categories for identifyingthe secondary-market purchasers. For the first time,the HMDA data identify loans placed in private secu-ritizations, which represent a growing segment of thesecondary market. The revisions in the reportingcategories are intended to improve the utility of thedata.
SUMMARY OF RESULTS FROMTHE 2004 HMDA DATA
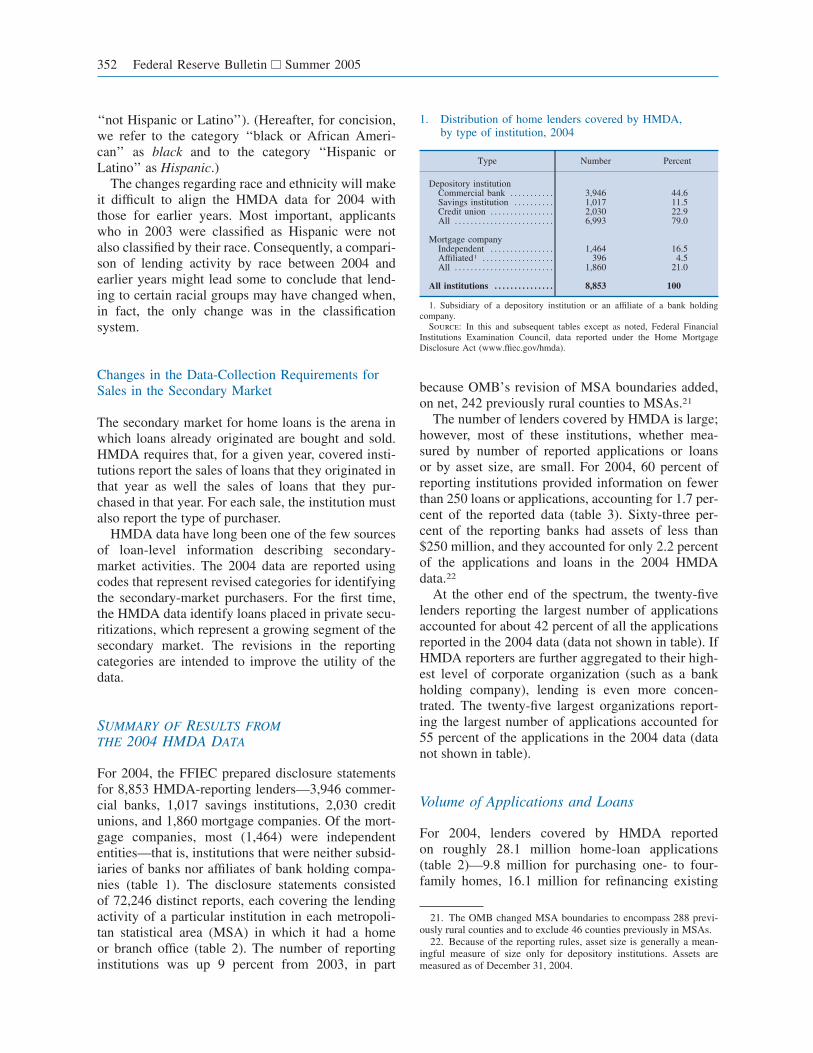
For 2004, the FFIEC prepared disclosure statementsfor 8,853 HMDA-reporting lenders—3,946 commer-cial banks, 1,017 savings institutions, 2,030 creditunions, and 1,860 mortgage companies. Of the mort-gage companies, most (1,464) were independententities—that is, institutions that were neither subsid-iaries of banks nor affiliates of bank holding compa-nies (table 1). The disclosure statements consistedof 72,246 distinct reports, each covering the lendingactivity of a particular institution in each metropoli-tan statistical area (MSA) in which it had a homeor branch office (table 2). The number of reportinginstitutions was up 9 percent from 2003, in part
because OMB’s revision of MSA boundaries added,on net, 242 previously rural counties to MSAs.21
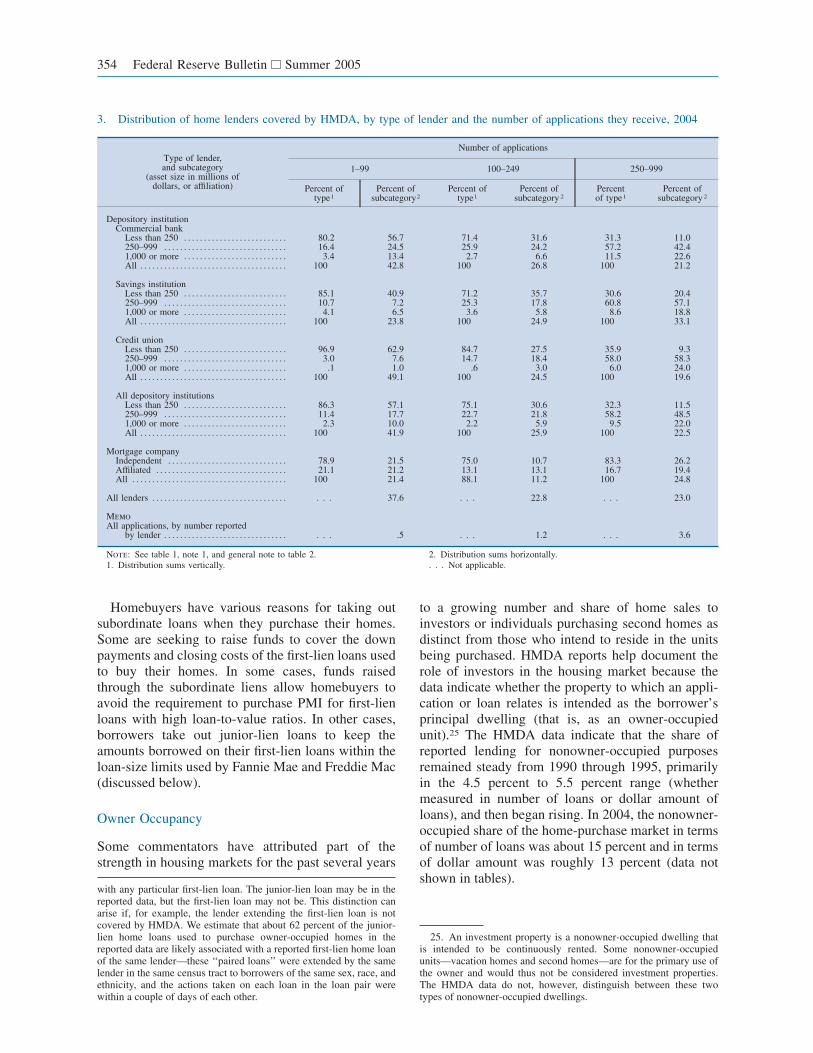
The number of lenders covered by HMDA is large;however, most of these institutions, whether mea-sured by number of reported applications or loansor by asset size, are small. For 2004, 60 percent ofreporting institutions provided information on fewerthan 250 loans or applications, accounting for 1.7 per-cent of the reported data (table 3). Sixty-three per-cent of the reporting banks had assets of less than$250 million, and they accounted for only 2.2 percentof the applications and loans in the 2004 HMDAdata.22
At the other end of the spectrum, the twenty-fivelenders reporting the largest number of applicationsaccounted for about 42 percent of all the applicationsreported in the 2004 data (data not shown in table). IfHMDA reporters are further aggregated to their high-est level of corporate organization (such as a bankholding company), lending is even more concen-trated. The twenty-five largest organizations report-ing the largest number of applications accounted for55 percent of the applications in the 2004 data (datanot shown in table).
Volume of Applications and Loans
For 2004, lenders covered by HMDA reportedon roughly 28.1 million home-loan applications(table 2)—9.8 million for purchasing one- to four-family homes, 16.1 million for refinancing existing
21. The OMB changed MSA boundaries to encompass 288 previ-ously rural counties and to exclude 46 counties previously in MSAs.
22. Because of the reporting rules, asset size is generally a mean-ingful measure of size only for depository institutions. Assets aremeasured as of December 31, 2004.
1. Distribution of home lenders covered by HMDA,by type of institution, 2004
Type Number Percent
Depository institutionCommercial bank . . . . . . . . . . . 3,946 44.6Savings institution . . . . . . . . . . 1,017 11.5Credit union . . . . . . . . . . . . . . . . 2,030 22.9All . . . . . . . . . . . . . . . . . . . . . . . . . 6,993 79.0
Mortgage companyIndependent . . . . . . . . . . . . . . . . 1,464 16.5Affiliated1 . . . . . . . . . . . . . . . . . . 396 4.5All . . . . . . . . . . . . . . . . . . . . . . . . . 1,860 21.0
All institutions . . . . . . . . . . . . . . . 8,853 100
1. Subsidiary of a depository institution or an affiliate of a bank holdingcompany.
Source: In this and subsequent tables except as noted, Federal FinancialInstitutions Examination Council, data reported under the Home MortgageDisclosure Act (www.ffiec.gov/hmda).
352 Federal Reserve Bulletin Summer 2005
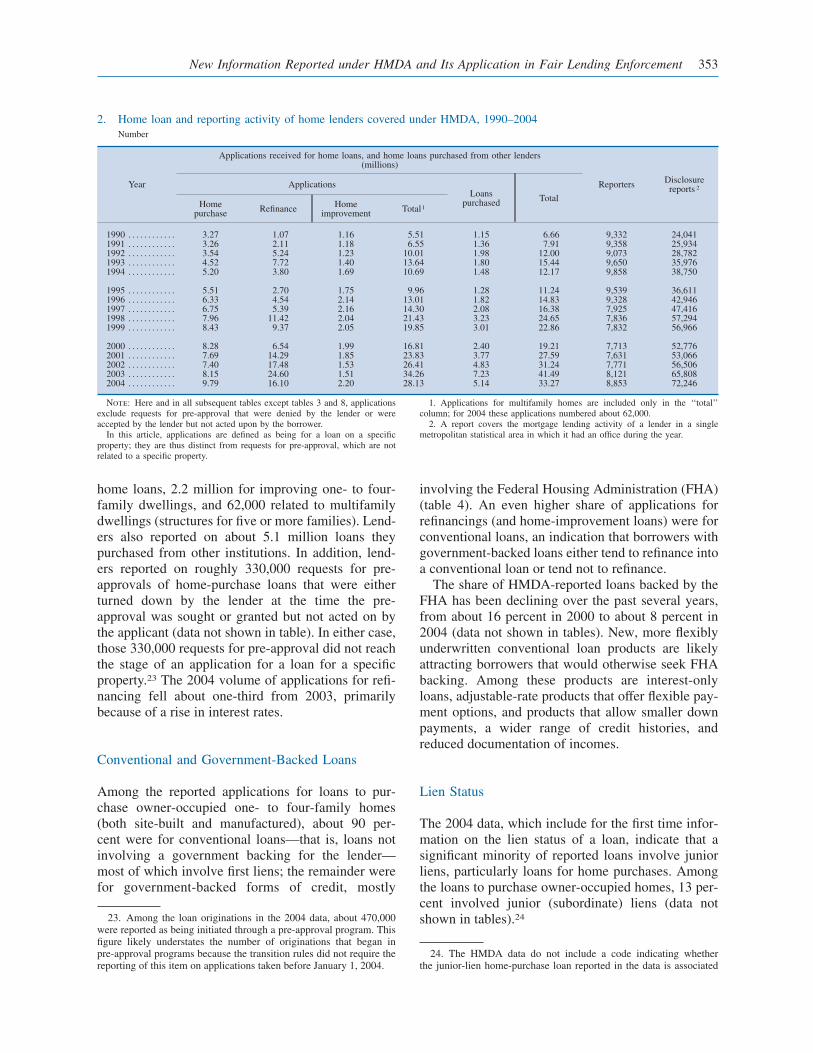
home loans, 2.2 million for improving one- to four-family dwellings, and 62,000 related to multifamilydwellings (structures for five or more families). Lend-ers also reported on about 5.1 million loans theypurchased from other institutions. In addition, lend-ers reported on roughly 330,000 requests for pre-approvals of home-purchase loans that were eitherturned down by the lender at the time the pre-approval was sought or granted but not acted on bythe applicant (data not shown in table). In either case,those 330,000 requests for pre-approval did not reachthe stage of an application for a loan for a specificproperty.23 The 2004 volume of applications for refi-nancing fell about one-third from 2003, primarilybecause of a rise in interest rates.
Conventional and Government-Backed Loans
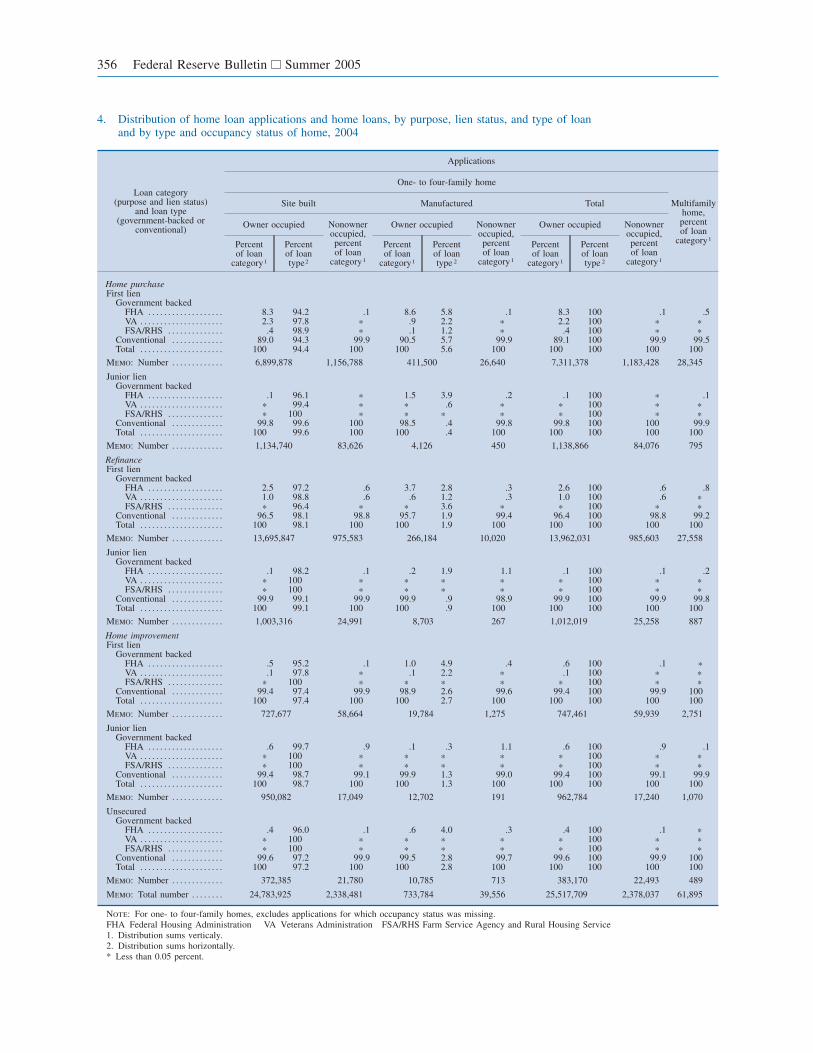
Among the reported applications for loans to pur-chase owner-occupied one- to four-family homes(both site-built and manufactured), about 90 per-cent were for conventional loans—that is, loans notinvolving a government backing for the lender—most of which involve first liens; the remainder werefor government-backed forms of credit, mostly
involving the Federal Housing Administration (FHA)(table 4). An even higher share of applications forrefinancings (and home-improvement loans) were forconventional loans, an indication that borrowers withgovernment-backed loans either tend to refinance intoa conventional loan or tend not to refinance.
The share of HMDA-reported loans backed by theFHA has been declining over the past several years,from about 16 percent in 2000 to about 8 percent in2004 (data not shown in tables). New, more flexiblyunderwritten conventional loan products are likelyattracting borrowers that would otherwise seek FHAbacking. Among these products are interest-onlyloans, adjustable-rate products that offer flexible pay-ment options, and products that allow smaller downpayments, a wider range of credit histories, andreduced documentation of incomes.
Lien Status
The 2004 data, which include for the first time infor-mation on the lien status of a loan, indicate that asignificant minority of reported loans involve juniorliens, particularly loans for home purchases. Amongthe loans to purchase owner-occupied homes, 13 per-cent involved junior (subordinate) liens (data notshown in tables).2423. Among the loan originations in the 2004 data, about 470,000
were reported as being initiated through a pre-approval program. Thisfigure likely understates the number of originations that began inpre-approval programs because the transition rules did not require thereporting of this item on applications taken before January 1, 2004.
24. The HMDA data do not include a code indicating whetherthe junior-lien home-purchase loan reported in the data is associated
2. Home loan and reporting activity of home lenders covered under HMDA, 1990–2004Number
Year
Applications received for home loans, and home loans purchased from other lenders(millions)
Reporters Disclosurereports 2Applications
Loanspurchased Total
Homepurchase Refinance Home
improvement Total1
1990 . . . . . . . . . . . . 3.27 1.07 1.16 5.51 1.15 6.66 9,332 24,0411991 . . . . . . . . . . . . 3.26 2.11 1.18 6.55 1.36 7.91 9,358 25,9341992 . . . . . . . . . . . . 3.54 5.24 1.23 10.01 1.98 12.00 9,073 28,7821993 . . . . . . . . . . . . 4.52 7.72 1.40 13.64 1.80 15.44 9,650 35,9761994 . . . . . . . . . . . . 5.20 3.80 1.69 10.69 1.48 12.17 9,858 38,750
1995 . . . . . . . . . . . . 5.51 2.70 1.75 9.96 1.28 11.24 9,539 36,6111996 . . . . . . . . . . . . 6.33 4.54 2.14 13.01 1.82 14.83 9,328 42,9461997 . . . . . . . . . . . . 6.75 5.39 2.16 14.30 2.08 16.38 7,925 47,4161998 . . . . . . . . . . . . 7.96 11.42 2.04 21.43 3.23 24.65 7,836 57,2941999 . . . . . . . . . . . . 8.43 9.37 2.05 19.85 3.01 22.86 7,832 56,966
2000 . . . . . . . . . . . . 8.28 6.54 1.99 16.81 2.40 19.21 7,713 52,7762001 . . . . . . . . . . . . 7.69 14.29 1.85 23.83 3.77 27.59 7,631 53,0662002 . . . . . . . . . . . . 7.40 17.48 1.53 26.41 4.83 31.24 7,771 56,5062003 . . . . . . . . . . . . 8.15 24.60 1.51 34.26 7.23 41.49 8,121 65,8082004 . . . . . . . . . . . . 9.79 16.10 2.20 28.13 5.14 33.27 8,853 72,246
Note: Here and in all subsequent tables except tables 3 and 8, applicationsexclude requests for pre-approval that were denied by the lender or wereaccepted by the lender but not acted upon by the borrower.
In this article, applications are defined as being for a loan on a specificproperty; they are thus distinct from requests for pre-approval, which are notrelated to a specific property.
1. Applications for multifamily homes are included only in the ‘‘total’’column; for 2004 these applications numbered about 62,000.
2. A report covers the mortgage lending activity of a lender in a singlemetropolitan statistical area in which it had an office during the year.
New Information Reported under HMDA and Its Application in Fair Lending Enforcement 353
Homebuyers have various reasons for taking outsubordinate loans when they purchase their homes.Some are seeking to raise funds to cover the downpayments and closing costs of the first-lien loans usedto buy their homes. In some cases, funds raisedthrough the subordinate liens allow homebuyers toavoid the requirement to purchase PMI for first-lienloans with high loan-to-value ratios. In other cases,borrowers take out junior-lien loans to keep theamounts borrowed on their first-lien loans within theloan-size limits used by Fannie Mae and Freddie Mac(discussed below).
Owner Occupancy
Some commentators have attributed part of thestrength in housing markets for the past several years
to a growing number and share of home sales toinvestors or individuals purchasing second homes asdistinct from those who intend to reside in the unitsbeing purchased. HMDA reports help document therole of investors in the housing market because thedata indicate whether the property to which an appli-cation or loan relates is intended as the borrower’sprincipal dwelling (that is, as an owner-occupiedunit).25 The HMDA data indicate that the share ofreported lending for nonowner-occupied purposesremained steady from 1990 through 1995, primarilyin the 4.5 percent to 5.5 percent range (whethermeasured in number of loans or dollar amount ofloans), and then began rising. In 2004, the nonowner-occupied share of the home-purchase market in termsof number of loans was about 15 percent and in termsof dollar amount was roughly 13 percent (data notshown in tables).
with any particular first-lien loan. The junior-lien loan may be in thereported data, but the first-lien loan may not be. This distinction canarise if, for example, the lender extending the first-lien loan is notcovered by HMDA. We estimate that about 62 percent of the junior-lien home loans used to purchase owner-occupied homes in thereported data are likely associated with a reported first-lien home loanof the same lender—these ‘‘paired loans’’ were extended by the samelender in the same census tract to borrowers of the same sex, race, andethnicity, and the actions taken on each loan in the loan pair werewithin a couple of days of each other.
25. An investment property is a nonowner-occupied dwelling thatis intended to be continuously rented. Some nonowner-occupiedunits—vacation homes and second homes—are for the primary use ofthe owner and would thus not be considered investment properties.The HMDA data do not, however, distinguish between these twotypes of nonowner-occupied dwellings.
3. Distribution of home lenders covered by HMDA, by type of lender and the number of applications they receive, 2004
Type of lender,and subcategory
(asset size in millions ofdollars, or affiliation)
Number of applications
1–99 100–249 250–999
Percent oftype1
Percent ofsubcategory2
Percent oftype1
Percent ofsubcategory 2
Percentof type1
Percent ofsubcategory 2
Depository institutionCommercial bank
Less than 250 . . . . . . . . . . . . . . . . . . . . . . . . . . 80.2 56.7 71.4 31.6 31.3 11.0250–999 . . . . . . . . . . . . . . . . . . . . . . . . . . . . . . . 16.4 24.5 25.9 24.2 57.2 42.41,000 or more . . . . . . . . . . . . . . . . . . . . . . . . . . 3.4 13.4 2.7 6.6 11.5 22.6All . . . . . . . . . . . . . . . . . . . . . . . . . . . . . . . . . . . . . 100 42.8 100 26.8 100 21.2
Savings institutionLess than 250 . . . . . . . . . . . . . . . . . . . . . . . . . . 85.1 40.9 71.2 35.7 30.6 20.4250–999 . . . . . . . . . . . . . . . . . . . . . . . . . . . . . . . 10.7 7.2 25.3 17.8 60.8 57.11,000 or more . . . . . . . . . . . . . . . . . . . . . . . . . . 4.1 6.5 3.6 5.8 8.6 18.8All . . . . . . . . . . . . . . . . . . . . . . . . . . . . . . . . . . . . . 100 23.8 100 24.9 100 33.1
Credit unionLess than 250 . . . . . . . . . . . . . . . . . . . . . . . . . . 96.9 62.9 84.7 27.5 35.9 9.3250–999 . . . . . . . . . . . . . . . . . . . . . . . . . . . . . . . 3.0 7.6 14.7 18.4 58.0 58.31,000 or more . . . . . . . . . . . . . . . . . . . . . . . . . . .1 1.0 .6 3.0 6.0 24.0All . . . . . . . . . . . . . . . . . . . . . . . . . . . . . . . . . . . . . 100 49.1 100 24.5 100 19.6
All depository institutionsLess than 250 . . . . . . . . . . . . . . . . . . . . . . . . . . 86.3 57.1 75.1 30.6 32.3 11.5250–999 . . . . . . . . . . . . . . . . . . . . . . . . . . . . . . . 11.4 17.7 22.7 21.8 58.2 48.51,000 or more . . . . . . . . . . . . . . . . . . . . . . . . . . 2.3 10.0 2.2 5.9 9.5 22.0All . . . . . . . . . . . . . . . . . . . . . . . . . . . . . . . . . . . . . 100 41.9 100 25.9 100 22.5
Mortgage companyIndependent . . . . . . . . . . . . . . . . . . . . . . . . . . . . . . 78.9 21.5 75.0 10.7 83.3 26.2Affiliated . . . . . . . . . . . . . . . . . . . . . . . . . . . . . . . . . 21.1 21.2 13.1 13.1 16.7 19.4All . . . . . . . . . . . . . . . . . . . . . . . . . . . . . . . . . . . . . . . 100 21.4 88.1 11.2 100 24.8
All lenders . . . . . . . . . . . . . . . . . . . . . . . . . . . . . . . . . . . . . 37.6 . . . 22.8 . . . 23.0
MemoAll applications, by number reported
by lender . . . . . . . . . . . . . . . . . . . . . . . . . . . . . . . . . . .5 . . . 1.2 . . . 3.6
Note: See table 1, note 1, and general note to table 2.1. Distribution sums vertically.
2. Distribution sums horizontally.. . . Not applicable.
354 Federal Reserve Bulletin Summer 2005
Lender Specialization
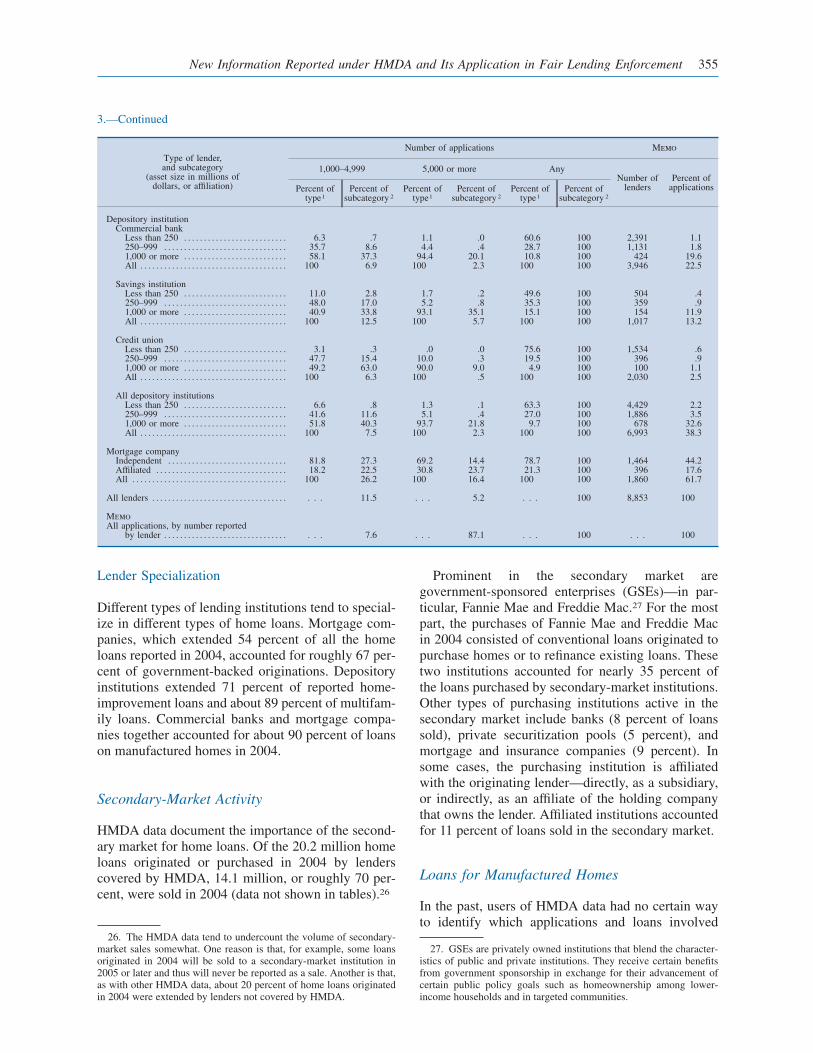
Different types of lending institutions tend to special-ize in different types of home loans. Mortgage com-panies, which extended 54 percent of all the homeloans reported in 2004, accounted for roughly 67 per-cent of government-backed originations. Depositoryinstitutions extended 71 percent of reported home-improvement loans and about 89 percent of multifam-ily loans. Commercial banks and mortgage compa-nies together accounted for about 90 percent of loanson manufactured homes in 2004.
Secondary-Market Activity
HMDA data document the importance of the second-ary market for home loans. Of the 20.2 million homeloans originated or purchased in 2004 by lenderscovered by HMDA, 14.1 million, or roughly 70 per-cent, were sold in 2004 (data not shown in tables).26
Prominent in the secondary market aregovernment-sponsored enterprises (GSEs)—in par-ticular, Fannie Mae and Freddie Mac.27 For the mostpart, the purchases of Fannie Mae and Freddie Macin 2004 consisted of conventional loans originated topurchase homes or to refinance existing loans. Thesetwo institutions accounted for nearly 35 percent ofthe loans purchased by secondary-market institutions.Other types of purchasing institutions active in thesecondary market include banks (8 percent of loanssold), private securitization pools (5 percent), andmortgage and insurance companies (9 percent). Insome cases, the purchasing institution is affiliatedwith the originating lender—directly, as a subsidiary,or indirectly, as an affiliate of the holding companythat owns the lender. Affiliated institutions accountedfor 11 percent of loans sold in the secondary market.
Loans for Manufactured Homes
In the past, users of HMDA data had no certain wayto identify which applications and loans involved
26. The HMDA data tend to undercount the volume of secondary-market sales somewhat. One reason is that, for example, some loansoriginated in 2004 will be sold to a secondary-market institution in2005 or later and thus will never be reported as a sale. Another is that,as with other HMDA data, about 20 percent of home loans originatedin 2004 were extended by lenders not covered by HMDA.
27. GSEs are privately owned institutions that blend the character-istics of public and private institutions. They receive certain benefitsfrom government sponsorship in exchange for their advancement ofcertain public policy goals such as homeownership among lower-income households and in targeted communities.
3.—Continued
Type of lender,and subcategory
(asset size in millions ofdollars, or affiliation)
Number of applications Memo
1,000–4,999 5,000 or more AnyNumber of
lendersPercent of
applicationsPercent oftype1
Percent ofsubcategory 2
Percent oftype1
Percent ofsubcategory 2
Percent oftype1
Percent ofsubcategory 2
Depository institutionCommercial bank
Less than 250 . . . . . . . . . . . . . . . . . . . . . . . . . . 6.3 .7 1.1 .0 60.6 100 2,391 1.1250–999 . . . . . . . . . . . . . . . . . . . . . . . . . . . . . . . 35.7 8.6 4.4 .4 28.7 100 1,131 1.81,000 or more . . . . . . . . . . . . . . . . . . . . . . . . . . 58.1 37.3 94.4 20.1 10.8 100 424 19.6All . . . . . . . . . . . . . . . . . . . . . . . . . . . . . . . . . . . . . 100 6.9 100 2.3 100 100 3,946 22.5
Savings institutionLess than 250 . . . . . . . . . . . . . . . . . . . . . . . . . . 11.0 2.8 1.7 .2 49.6 100 504 .4250–999 . . . . . . . . . . . . . . . . . . . . . . . . . . . . . . . 48.0 17.0 5.2 .8 35.3 100 359 .91,000 or more . . . . . . . . . . . . . . . . . . . . . . . . . . 40.9 33.8 93.1 35.1 15.1 100 154 11.9All . . . . . . . . . . . . . . . . . . . . . . . . . . . . . . . . . . . . . 100 12.5 100 5.7 100 100 1,017 13.2
Credit unionLess than 250 . . . . . . . . . . . . . . . . . . . . . . . . . . 3.1 .3 .0 .0 75.6 100 1,534 .6250–999 . . . . . . . . . . . . . . . . . . . . . . . . . . . . . . . 47.7 15.4 10.0 .3 19.5 100 396 .91,000 or more . . . . . . . . . . . . . . . . . . . . . . . . . . 49.2 63.0 90.0 9.0 4.9 100 100 1.1All . . . . . . . . . . . . . . . . . . . . . . . . . . . . . . . . . . . . . 100 6.3 100 .5 100 100 2,030 2.5
All depository institutionsLess than 250 . . . . . . . . . . . . . . . . . . . . . . . . . . 6.6 .8 1.3 .1 63.3 100 4,429 2.2250–999 . . . . . . . . . . . . . . . . . . . . . . . . . . . . . . . 41.6 11.6 5.1 .4 27.0 100 1,886 3.51,000 or more . . . . . . . . . . . . . . . . . . . . . . . . . . 51.8 40.3 93.7 21.8 9.7 100 678 32.6All . . . . . . . . . . . . . . . . . . . . . . . . . . . . . . . . . . . . . 100 7.5 100 2.3 100 100 6,993 38.3
Mortgage companyIndependent . . . . . . . . . . . . . . . . . . . . . . . . . . . . . . 81.8 27.3 69.2 14.4 78.7 100 1,464 44.2Affiliated . . . . . . . . . . . . . . . . . . . . . . . . . . . . . . . . . 18.2 22.5 30.8 23.7 21.3 100 396 17.6All . . . . . . . . . . . . . . . . . . . . . . . . . . . . . . . . . . . . . . . 100 26.2 100 16.4 100 100 1,860 61.7
All lenders . . . . . . . . . . . . . . . . . . . . . . . . . . . . . . . . . . . . . 11.5 . . . 5.2 . . . 100 8,853 100
MemoAll applications, by number reported
by lender . . . . . . . . . . . . . . . . . . . . . . . . . . . . . . . . . . 7.6 . . . 87.1 . . . 100 . . . 100
New Information Reported under HMDA and Its Application in Fair Lending Enforcement 355
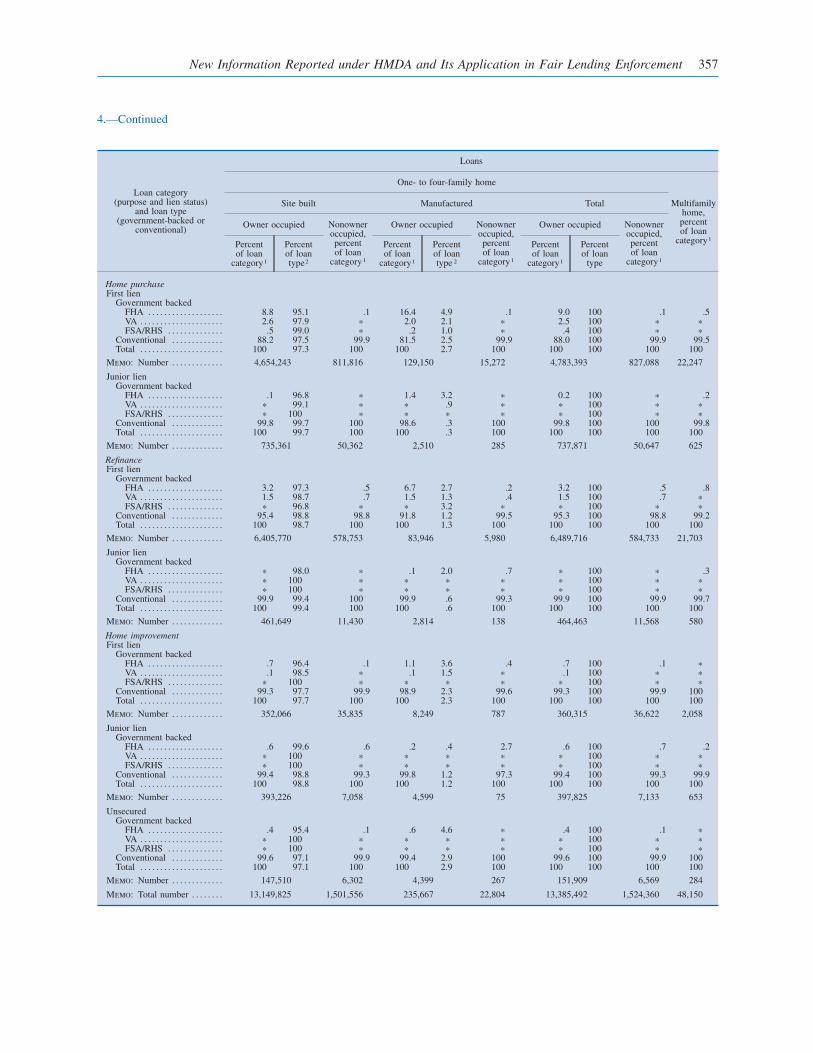
4. Distribution of home loan applications and home loans, by purpose, lien status, and type of loanand by type and occupancy status of home, 2004
Loan category(purpose and lien status)
and loan type(government-backed or
conventional)
Applications
One- to four-family home
Multifamilyhome,percentof loan
category1
Site built Manufactured Total
Owner occupied Nonowneroccupied,percentof loan
category1
Owner occupied Nonowneroccupied,percentof loan
category1
Owner occupied Nonowneroccupied,percentof loan
category1
Percentof loan
category1
Percentof loantype2
Percentof loan
category1
Percentof loantype 2
Percentof loan
category1
Percentof loantype 2
Home purchaseFirst lien
Government backedFHA . . . . . . . . . . . . . . . . . . . 8.3 94.2 .1 8.6 5.8 .1 8.3 100 .1 .5VA . . . . . . . . . . . . . . . . . . . . . 2.3 97.8 * .9 2.2 * 2.2 100 * *FSA/RHS . . . . . . . . . . . . . . .4 98.9 * .1 1.2 * .4 100 * *
Conventional . . . . . . . . . . . . . 89.0 94.3 99.9 90.5 5.7 99.9 89.1 100 99.9 99.5Total . . . . . . . . . . . . . . . . . . . . . 100 94.4 100 100 5.6 100 100 100 100 100
Memo: Number . . . . . . . . . . . . . 6,899,878 1,156,788 411,500 26,640 7,311,378 1,183,428 28,345
Junior lienGovernment backed
FHA . . . . . . . . . . . . . . . . . . . .1 96.1 * 1.5 3.9 .2 .1 100 * .1VA . . . . . . . . . . . . . . . . . . . . . * 99.4 * * .6 * * 100 * *FSA/RHS . . . . . . . . . . . . . . * 100 * * * * * 100 * *
Conventional . . . . . . . . . . . . . 99.8 99.6 100 98.5 .4 99.8 99.8 100 100 99.9Total . . . . . . . . . . . . . . . . . . . . . 100 99.6 100 100 .4 100 100 100 100 100
Memo: Number . . . . . . . . . . . . . 1,134,740 83,626 4,126 450 1,138,866 84,076 795
RefinanceFirst lien
Government backedFHA . . . . . . . . . . . . . . . . . . . 2.5 97.2 .6 3.7 2.8 .3 2.6 100 .6 .8VA . . . . . . . . . . . . . . . . . . . . . 1.0 98.8 .6 .6 1.2 .3 1.0 100 .6 *FSA/RHS . . . . . . . . . . . . . . * 96.4 * * 3.6 * * 100 * *
Conventional . . . . . . . . . . . . . 96.5 98.1 98.8 95.7 1.9 99.4 96.4 100 98.8 99.2Total . . . . . . . . . . . . . . . . . . . . . 100 98.1 100 100 1.9 100 100 100 100 100
Memo: Number . . . . . . . . . . . . . 13,695,847 975,583 266,184 10,020 13,962,031 985,603 27,558
Junior lienGovernment backed
FHA . . . . . . . . . . . . . . . . . . . .1 98.2 .1 .2 1.9 1.1 .1 100 .1 .2VA . . . . . . . . . . . . . . . . . . . . . * 100 * * * * * 100 * *FSA/RHS . . . . . . . . . . . . . . * 100 * * * * * 100 * *
Conventional . . . . . . . . . . . . . 99.9 99.1 99.9 99.9 .9 98.9 99.9 100 99.9 99.8Total . . . . . . . . . . . . . . . . . . . . . 100 99.1 100 100 .9 100 100 100 100 100
Memo: Number . . . . . . . . . . . . . 1,003,316 24,991 8,703 267 1,012,019 25,258 887
Home improvementFirst lien
Government backedFHA . . . . . . . . . . . . . . . . . . . .5 95.2 .1 1.0 4.9 .4 .6 100 .1 *VA . . . . . . . . . . . . . . . . . . . . . .1 97.8 * .1 2.2 * .1 100 * *FSA/RHS . . . . . . . . . . . . . . * 100 * * * * * 100 * *
Conventional . . . . . . . . . . . . . 99.4 97.4 99.9 98.9 2.6 99.6 99.4 100 99.9 100Total . . . . . . . . . . . . . . . . . . . . . 100 97.4 100 100 2.7 100 100 100 100 100
Memo: Number . . . . . . . . . . . . . 727,677 58,664 19,784 1,275 747,461 59,939 2,751
Junior lienGovernment backed
FHA . . . . . . . . . . . . . . . . . . . .6 99.7 .9 .1 .3 1.1 .6 100 .9 .1VA . . . . . . . . . . . . . . . . . . . . . * 100 * * * * * 100 * *FSA/RHS . . . . . . . . . . . . . . * 100 * * * * * 100 * *
Conventional . . . . . . . . . . . . . 99.4 98.7 99.1 99.9 1.3 99.0 99.4 100 99.1 99.9Total . . . . . . . . . . . . . . . . . . . . . 100 98.7 100 100 1.3 100 100 100 100 100
Memo: Number . . . . . . . . . . . . . 950,082 17,049 12,702 191 962,784 17,240 1,070
UnsecuredGovernment backed
FHA . . . . . . . . . . . . . . . . . . . .4 96.0 .1 .6 4.0 .3 .4 100 .1 *VA . . . . . . . . . . . . . . . . . . . . . * 100 * * * * * 100 * *FSA/RHS . . . . . . . . . . . . . . * 100 * * * * * 100 * *
Conventional . . . . . . . . . . . . . 99.6 97.2 99.9 99.5 2.8 99.7 99.6 100 99.9 100Total . . . . . . . . . . . . . . . . . . . . . 100 97.2 100 100 2.8 100 100 100 100 100
Memo: Number . . . . . . . . . . . . . 372,385 21,780 10,785 713 383,170 22,493 489
Memo: Total number . . . . . . . . 24,783,925 2,338,481 733,784 39,556 25,517,709 2,378,037 61,895
Note: For one- to four-family homes, excludes applications for which occupancy status was missing.FHA Federal Housing Administration VA Veterans Administration FSA/RHS Farm Service Agency and Rural Housing Service1. Distribution sums verticaly.2. Distribution sums horizontally.* Less than 0.05 percent.
356 Federal Reserve Bulletin Summer 2005
4.—Continued
Loan category(purpose and lien status)
and loan type(government-backed or
conventional)
Loans
One- to four-family home
Multifamilyhome,percentof loan
category1
Site built Manufactured Total
Owner occupied Nonowneroccupied,percentof loan
category1
Owner occupied Nonowneroccupied,percentof loan
category1
Owner occupied Nonowneroccupied,percentof loan
category1
Percentof loan
category1
Percentof loantype2
Percentof loan
category1
Percentof loantype 2
Percentof loan
category1
Percentof loan
type
Home purchaseFirst lien
Government backedFHA . . . . . . . . . . . . . . . . . . . 8.8 95.1 .1 16.4 4.9 .1 9.0 100 .1 .5VA . . . . . . . . . . . . . . . . . . . . . 2.6 97.9 * 2.0 2.1 * 2.5 100 * *FSA/RHS . . . . . . . . . . . . . . .5 99.0 * .2 1.0 * .4 100 * *
Conventional . . . . . . . . . . . . . 88.2 97.5 99.9 81.5 2.5 99.9 88.0 100 99.9 99.5Total . . . . . . . . . . . . . . . . . . . . . 100 97.3 100 100 2.7 100 100 100 100 100
Memo: Number . . . . . . . . . . . . . 4,654,243 811,816 129,150 15,272 4,783,393 827,088 22,247
Junior lienGovernment backed
FHA . . . . . . . . . . . . . . . . . . . .1 96.8 * 1.4 3.2 * 0.2 100 * .2VA . . . . . . . . . . . . . . . . . . . . . * 99.1 * * .9 * * 100 * *FSA/RHS . . . . . . . . . . . . . . * 100 * * * * * 100 * *
Conventional . . . . . . . . . . . . . 99.8 99.7 100 98.6 .3 100 99.8 100 100 99.8Total . . . . . . . . . . . . . . . . . . . . . 100 99.7 100 100 .3 100 100 100 100 100
Memo: Number . . . . . . . . . . . . . 735,361 50,362 2,510 285 737,871 50,647 625
RefinanceFirst lien
Government backedFHA . . . . . . . . . . . . . . . . . . . 3.2 97.3 .5 6.7 2.7 .2 3.2 100 .5 .8VA . . . . . . . . . . . . . . . . . . . . . 1.5 98.7 .7 1.5 1.3 .4 1.5 100 .7 *FSA/RHS . . . . . . . . . . . . . . * 96.8 * * 3.2 * * 100 * *
Conventional . . . . . . . . . . . . . 95.4 98.8 98.8 91.8 1.2 99.5 95.3 100 98.8 99.2Total . . . . . . . . . . . . . . . . . . . . . 100 98.7 100 100 1.3 100 100 100 100 100
Memo: Number . . . . . . . . . . . . . 6,405,770 578,753 83,946 5,980 6,489,716 584,733 21,703
Junior lienGovernment backed
FHA . . . . . . . . . . . . . . . . . . . * 98.0 * .1 2.0 .7 * 100 * .3VA . . . . . . . . . . . . . . . . . . . . . * 100 * * * * * 100 * *FSA/RHS . . . . . . . . . . . . . . * 100 * * * * * 100 * *
Conventional . . . . . . . . . . . . . 99.9 99.4 100 99.9 .6 99.3 99.9 100 99.9 99.7Total . . . . . . . . . . . . . . . . . . . . . 100 99.4 100 100 .6 100 100 100 100 100
Memo: Number . . . . . . . . . . . . . 461,649 11,430 2,814 138 464,463 11,568 580
Home improvementFirst lien
Government backedFHA . . . . . . . . . . . . . . . . . . . .7 96.4 .1 1.1 3.6 .4 .7 100 .1 *VA . . . . . . . . . . . . . . . . . . . . . .1 98.5 * .1 1.5 * .1 100 * *FSA/RHS . . . . . . . . . . . . . . * 100 * * * * * 100 * *
Conventional . . . . . . . . . . . . . 99.3 97.7 99.9 98.9 2.3 99.6 99.3 100 99.9 100Total . . . . . . . . . . . . . . . . . . . . . 100 97.7 100 100 2.3 100 100 100 100 100
Memo: Number . . . . . . . . . . . . . 352,066 35,835 8,249 787 360,315 36,622 2,058
Junior lienGovernment backed
FHA . . . . . . . . . . . . . . . . . . . .6 99.6 .6 .2 .4 2.7 .6 100 .7 .2VA . . . . . . . . . . . . . . . . . . . . . * 100 * * * * * 100 * *FSA/RHS . . . . . . . . . . . . . . * 100 * * * * * 100 * *
Conventional . . . . . . . . . . . . . 99.4 98.8 99.3 99.8 1.2 97.3 99.4 100 99.3 99.9Total . . . . . . . . . . . . . . . . . . . . . 100 98.8 100 100 1.2 100 100 100 100 100
Memo: Number . . . . . . . . . . . . . 393,226 7,058 4,599 75 397,825 7,133 653
UnsecuredGovernment backed
FHA . . . . . . . . . . . . . . . . . . . .4 95.4 .1 .6 4.6 * .4 100 .1 *VA . . . . . . . . . . . . . . . . . . . . . * 100 * * * * * 100 * *FSA/RHS . . . . . . . . . . . . . . * 100 * * * * * 100 * *
Conventional . . . . . . . . . . . . . 99.6 97.1 99.9 99.4 2.9 100 99.6 100 99.9 100Total . . . . . . . . . . . . . . . . . . . . . 100 97.1 100 100 2.9 100 100 100 100 100
Memo: Number . . . . . . . . . . . . . 147,510 6,302 4,399 267 151,909 6,569 284
Memo: Total number . . . . . . . . 13,149,825 1,501,556 235,667 22,804 13,385,492 1,524,360 48,150
New Information Reported under HMDA and Its Application in Fair Lending Enforcement 357
manufactured homes. To help overcome this limita-tion, the Department of Housing and Urban Develop-ment (HUD) produced annually a list of reportinginstitutions (typically about twenty) that it believedwere primarily in the business of extending suchcredit.28 Users of the HMDA data often relied on theHUD list to identify, albeit imperfectly, loans andapplications related to manufactured homes. Thispractice had its own limitations—it could not be usedto identify applications and loans related to manufac-tured homes reported by lenders not on the HUD list,and users often assumed that all loans by the lenderson the list were for manufactured homes when somewere not. The expanded HMDA data resolve thisproblem by explicitly including a code to identifyapplications and loans for manufactured homes. Forbackground information on manufactured homes, seebox ‘‘Manufactured Homes in the U.S. HousingMarket.’’
Loans for manufactured homes entail more creditrisk than do most other forms of credit extended toconsumers.29 For example, the proportion of loansfor manufactured homes that are thirty days or morepast due is far higher than for most other consumercredit products and is about twice the rate for conven-tional loans secured by one- to four-family homes.30
In part, the elevated credit risk arises from moreuncertainty about whether the collateral backing theloan will retain its original value. Much of the creditrisk arises from the poorer credit history profiles ofthe typical borrowers in the manufactured-home loanmarket compared with those in the site-built home-loan market.
An individual’s credit history score (a statisticalcharacterization of an individual’s creditworthinessbased exclusively on information in a credit recordmaintained by a credit-reporting agency) is a com-
mon metric of credit risk.31 Among individuals whohave manufactured-home loans (whether home loansor, as is the case for most manufactured homes,personal-property loans), the average credit historyscore as of June 30, 2003, was 666, a score nearly70 points lower than the average among individualswith loans secured by one- to four-family site-builthomes. Moreover, nearly 25 percent of the individ-uals with loans secured by manufactured homeshad credit history scores below 600, a threshold thatis often associated with high-risk lending, comparedwith only about 5 percent of the individuals withloans backed by site-built units.
Lenders recognize the elevated risks related toloans backed by manufactured homes and factor theserisks into the interest rates they charge borrowers.32
Lender caution is also reflected in the very highdenial rates on applications for loans backed bymanufactured homes.
28. See www.huduser.org/datasets/manu.html.29. Unless otherwise indicated, information in this section is
derived from the following sources: U.S. Bureau of the Census (forHUD), American Housing Survey (formerly the Annual HousingSurvey) and the Residential Finance Survey www.huduser.org/datasets/pdrdatas.html; Manufactured Housing Institute 2004,www.manufacturedhousing.org; and U.S. Census Bureau 2000 cen-sus, www.census.gov/main/www/cen2000.html. Information on thedefault experience regarding loans secured by manufactured homesand on the credit history scores of individuals were derived from theJune 30, 2003, credit records of a nationally representative sample ofapproximately 300,000 individuals (with all personal identifying infor-mation removed); the sample was obtained by the Federal ReserveBoard from one of the three national credit-reporting agencies. SeeRobert B. Avery, Paul S. Calem, and Glenn B. Canner (2004), ‘‘CreditReport Accuracy and Access to Credit,’’ Federal Reserve Bulletin,vol. 90 (Summer), pp. 297–322.
30. See American Bankers Association, Consumer Credit Delin-quency Bulletin, www.aba.com.
31. To facilitate this discussion, we have adjusted the credit historyscores assigned to the individuals in the Federal Reserve sample of300,000 credit records (see text note 30) to match the distributionof the more-familiar FICO credit history scores developed by FairIsaac Corporation, for which information is publicly available. Seewww.myfico.com/myfico/CreditCentral/ScoringWorks.asp.
32. In recent years, the manufactured-home lending industry hasbeen adversely affected by the excessive production of units in the late1990s and the reliance on the relaxed credit underwriting that accom-panied the sales of these units. See Neil J. Morse (2004), ‘‘Manufac-turing the Dream,’’ Mortgage Banking (August), pp. 50–56.
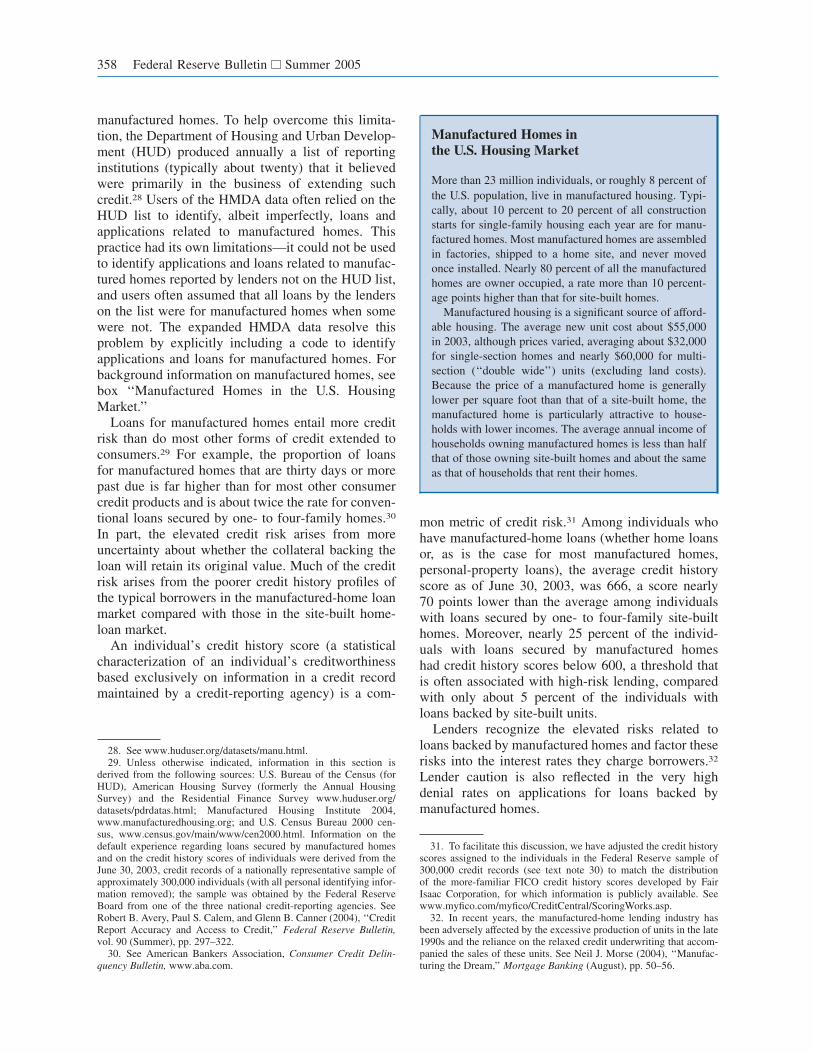
Manufactured Homes inthe U.S. Housing Market
More than 23 million individuals, or roughly 8 percent ofthe U.S. population, live in manufactured housing. Typi-cally, about 10 percent to 20 percent of all constructionstarts for single-family housing each year are for manu-factured homes. Most manufactured homes are assembledin factories, shipped to a home site, and never movedonce installed. Nearly 80 percent of all the manufacturedhomes are owner occupied, a rate more than 10 percent-age points higher than that for site-built homes.
Manufactured housing is a significant source of afford-able housing. The average new unit cost about $55,000in 2003, although prices varied, averaging about $32,000for single-section homes and nearly $60,000 for multi-section (‘‘double wide’’) units (excluding land costs).Because the price of a manufactured home is generallylower per square foot than that of a site-built home, themanufactured home is particularly attractive to house-holds with lower incomes. The average annual income ofhouseholds owning manufactured homes is less than halfthat of those owning site-built homes and about the sameas that of households that rent their homes.
358 Federal Reserve Bulletin Summer 2005
The 2004 HMDA Data on Manufactured Housing
The 2004 HMDA data indicate that, on the basisof applications that lenders received after January 1,2004, nearly 4,400 lenders extended more than242,000 manufactured-home loans.33 About 57 per-cent of these loans were for home purchases; mostof the rest were for refinancing an earlier loan (dataderived from table 5). Commercial banks, the largestsource of loans on manufactured homes, extended46 percent of the total number; mortgage companiesextended 44 percent.
The data indicate further that manufactured-homelending is a relatively concentrated business. Theten lenders that extended the largest number ofmanufactured-home loans in 2004 accounted for one-third of all such loans that year, and the top twentysuch lenders accounted for 42 percent (data notshown in tables). Likewise, 60 percent of the lendersthat extended manufactured-home loans in 2004extended ten or fewer such loans. The 2004 dataindicate that thirty-five lenders could reasonably beconsidered to have specialized in manufactured-homelending that year (see box ‘‘The HUD List of Special-ists in Manufactured-Home Lending and the 2004HMDA Data’’).
For a number of the largest lenders that extendedmanufactured-home loans (measured by the numberof such loans), that business segment was only a verysmall portion of their lending activity, according tothe 2004 data. In fact, among the twenty-five firmsthat extended the largest number of manufactured-home loans, only three could be characterized asfocused primarily on that business segment. Forvirtually all the rest, manufactured-home lendingamounted to 5 percent or less of their total lendingactivity.
Of those obtaining loans to purchase manufacturedhomes, 41 percent were of lower income, whereas ofthose borrowing to purchase site-built homes, about
24 percent had lower incomes (table 6).34 On aver-age, minority borrowers have lower incomes than donon-Hispanic white borrowers, but only about 18 per-cent of manufactured-home purchasers were mem-bers of a racial or ethnic minority group, whereasabout 30 percent of purchasers of site-built homeswere minorities (data derived from table 6).3533. As noted, the transition rules regarding the reporting of data
pose difficulties for evaluating the 2004 HMDA data for manufacturedhomes. Consequently, applications governed by the transition rulesare excluded from tables 5 and 6. Despite the reporting exceptionscreated by the rules, some lenders chose to report information onmanufactured-home status for applications submitted before Janu-ary 1, 2004. However, it is not clear whether these lenders identifiedall, or only some, of the pre-2004 applications for loans on manu-factured homes, and so we exclude these additional data from theanalysis.
The 2004 data include information on applications or loans relatedto manufactured homes from an additional 400 or so lenders—about4,800 in all—which indicates that some institutions chose to identifymanufactured homes on applications taken during the transition period(before January 1, 2004).
34. The income category of a purchaser is relative to the medianfamily income of the area (MSA or statewide non-MSA) in which theproperty being purchased is located, and the income category of acensus tract is the median family income of the tract relative to that ofthe area (MSA or statewide non-MSA) in which the tract is located:‘‘Low’’ is less than 50 percent of the median; ‘‘moderate’’ is 50 per-cent to 79 percent (in this article, ‘‘lower income’’ encompasses thelow and moderate categories); ‘‘middle’’ is 80 percent to 119 percent;and ‘‘higher’’ is 120 percent or more.
35. For loans with two or more applicants, HMDA-covered lendersreport data on only two. Income for two applicants is reported jointly.
The HUD List of Specialistsin Manufactured-Home Lendingand the 2004 HMDA Data
Before 2004, HMDA reporters were not required to iden-tify which of their applications and loans involved manu-factured homes, and identifying all of the lenders offeringsuch credit was impossible. For 2003, HUD’s list ofmanufactured-home loan specialists who are also HMDAreporters identified 19 such lenders. Only 13 of the19 lenders that reported 2003 HMDA data provided2004 HMDA data under the same name and identifica-tion number. These 13 lenders accounted for 15 percentof all the manufactured-home loans reported in the 2004data. Among the 6 manufactured-home lenders on the2003 HUD list that did not report in 2004 under the samename or identification number, 2 reported under differ-ent names and identification numbers. These 2 lendersreported information on only about 950 loans relatedto manufactured homes (about 0.4 percent of the total).Of the 15 manufactured-home loan specialists on theHUD list that reported data for 2004, only 11 were in factprimarily involved in extending loans on manufacturedhomes.
For 35 lenders that supplied 2004 data (including the11 on the 2003 HUD list), lending for manufacturedhomes constituted at least 80 percent of their reportedlending activity, and so they may reasonably warrantconsideration as specialists in manufactured-home lend-ing. Among the rest of the approximately 4,400 reportinglenders that had extended at least one manufactured-home loan in 2004, about 500 indicated that the propor-tion of their originations related to manufactured homeswas at least 20 percent but less than 80 percent, and theremaining 3,900 indicated that the proportion was lessthan 20 percent.
New Information Reported under HMDA and Its Application in Fair Lending Enforcement 359
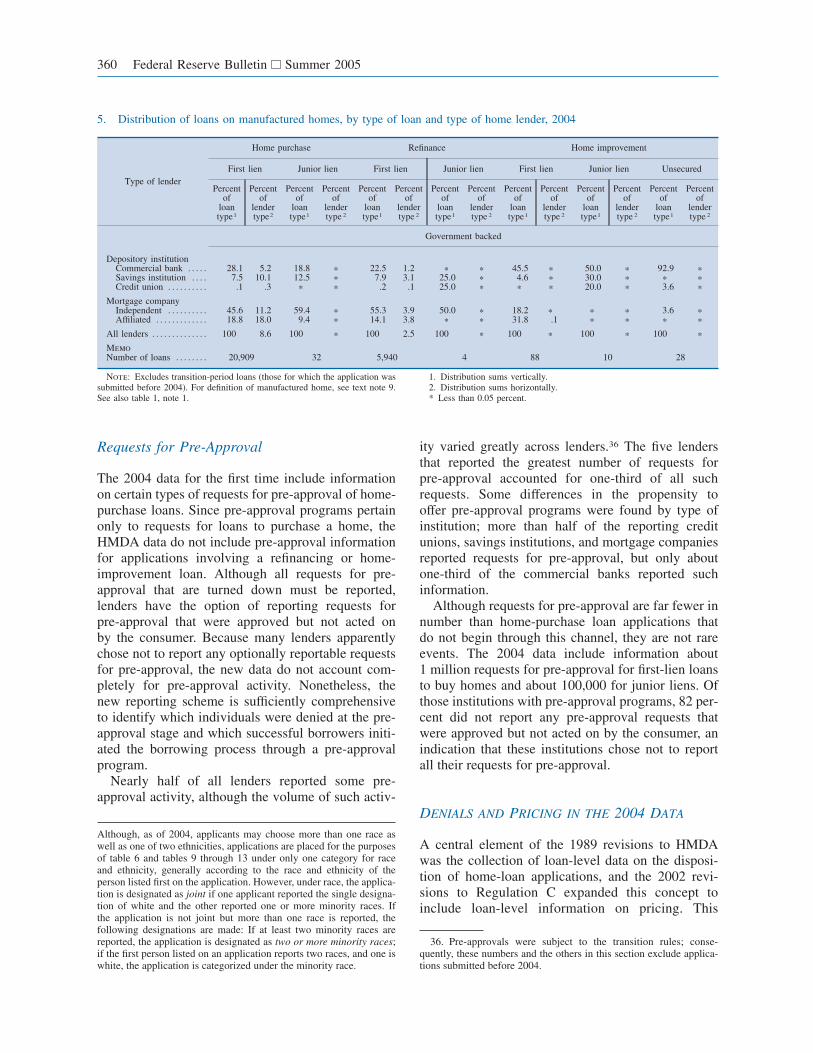
Requests for Pre-Approval
The 2004 data for the first time include informationon certain types of requests for pre-approval of home-purchase loans. Since pre-approval programs pertainonly to requests for loans to purchase a home, theHMDA data do not include pre-approval informationfor applications involving a refinancing or home-improvement loan. Although all requests for pre-approval that are turned down must be reported,lenders have the option of reporting requests forpre-approval that were approved but not acted onby the consumer. Because many lenders apparentlychose not to report any optionally reportable requestsfor pre-approval, the new data do not account com-pletely for pre-approval activity. Nonetheless, thenew reporting scheme is sufficiently comprehensiveto identify which individuals were denied at the pre-approval stage and which successful borrowers initi-ated the borrowing process through a pre-approvalprogram.
Nearly half of all lenders reported some pre-approval activity, although the volume of such activ-
ity varied greatly across lenders.36 The five lendersthat reported the greatest number of requests forpre-approval accounted for one-third of all suchrequests. Some differences in the propensity tooffer pre-approval programs were found by type ofinstitution; more than half of the reporting creditunions, savings institutions, and mortgage companiesreported requests for pre-approval, but only aboutone-third of the commercial banks reported suchinformation.
Although requests for pre-approval are far fewer innumber than home-purchase loan applications thatdo not begin through this channel, they are not rareevents. The 2004 data include information about1 million requests for pre-approval for first-lien loansto buy homes and about 100,000 for junior liens. Ofthose institutions with pre-approval programs, 82 per-cent did not report any pre-approval requests thatwere approved but not acted on by the consumer, anindication that these institutions chose not to reportall their requests for pre-approval.
DENIALS AND PRICING IN THE 2004 DATA
A central element of the 1989 revisions to HMDAwas the collection of loan-level data on the disposi-tion of home-loan applications, and the 2002 revi-sions to Regulation C expanded this concept toinclude loan-level information on pricing. This
Although, as of 2004, applicants may choose more than one race aswell as one of two ethnicities, applications are placed for the purposesof table 6 and tables 9 through 13 under only one category for raceand ethnicity, generally according to the race and ethnicity of theperson listed first on the application. However, under race, the applica-tion is designated as joint if one applicant reported the single designa-tion of white and the other reported one or more minority races. Ifthe application is not joint but more than one race is reported, thefollowing designations are made: If at least two minority races arereported, the application is designated as two or more minority races;if the first person listed on an application reports two races, and one iswhite, the application is categorized under the minority race.
36. Pre-approvals were subject to the transition rules; conse-quently, these numbers and the others in this section exclude applica-tions submitted before 2004.
5. Distribution of loans on manufactured homes, by type of loan and type of home lender, 2004
Type of lender
Home purchase Refinance Home improvement
First lien Junior lien First lien Junior lien First lien Junior lien Unsecured
Percentof
loantype1
Percentof
lendertype2
Percentof
loantype1
Percentof
lendertype 2
Percentof
loantype1
Percentof
lendertype 2
Percentof
loantype1
Percentof
lendertype 2
Percentof
loantype1
Percentof
lendertype 2
Percentof
loantype1
Percentof
lendertype 2
Percentof
loantype1
Percentof
lendertype 2
Government backed
Depository institutionCommercial bank . . . . . 28.1 5.2 18.8 * 22.5 1.2 * * 45.5 * 50.0 * 92.9 *Savings institution . . . . 7.5 10.1 12.5 * 7.9 3.1 25.0 * 4.6 * 30.0 * * *Credit union . . . . . . . . . . .1 .3 * * .2 .1 25.0 * * * 20.0 * 3.6 *
Mortgage companyIndependent . . . . . . . . . . 45.6 11.2 59.4 * 55.3 3.9 50.0 * 18.2 * * * 3.6 *Affiliated . . . . . . . . . . . . . 18.8 18.0 9.4 * 14.1 3.8 * * 31.8 .1 * * * *
All lenders . . . . . . . . . . . . . . 100 8.6 100 * 100 2.5 100 * 100 * 100 * 100 *MemoNumber of loans . . . . . . . . 20,909 32 5,940 4 88 10 28
Note: Excludes transition-period loans (those for which the application wassubmitted before 2004). For definition of manufactured home, see text note 9.See also table 1, note 1.
1. Distribution sums vertically.2. Distribution sums horizontally.* Less than 0.05 percent.
360 Federal Reserve Bulletin Summer 2005
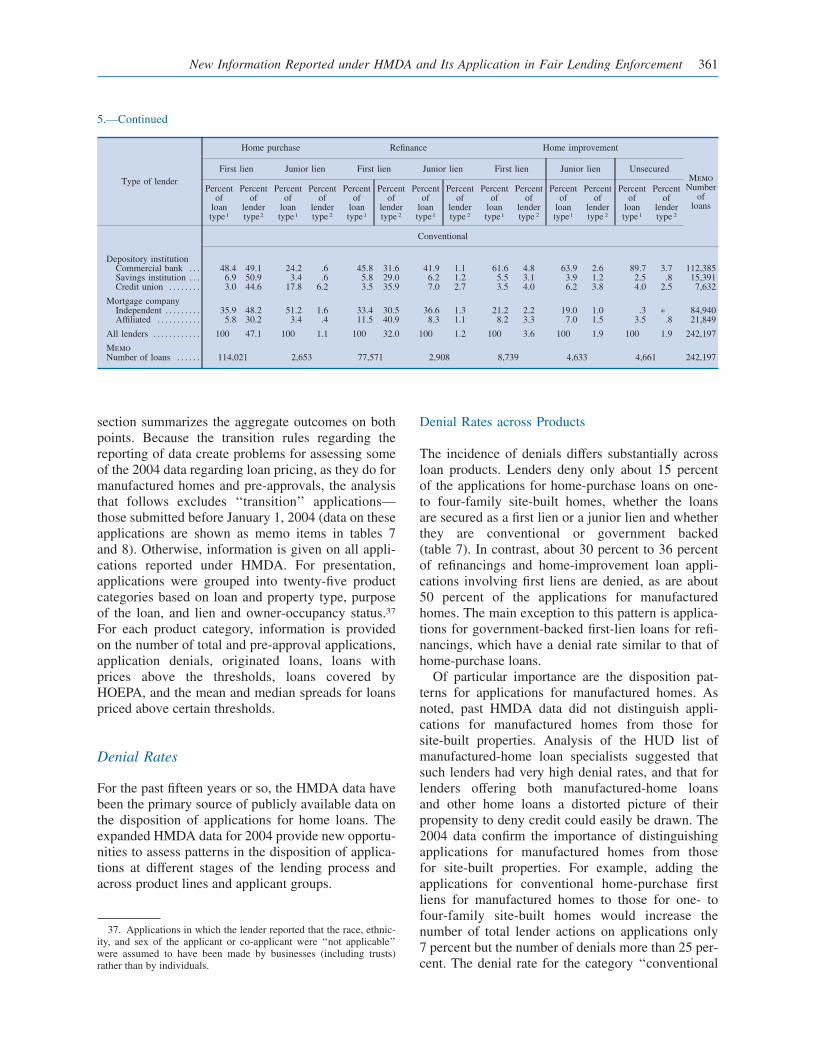
section summarizes the aggregate outcomes on bothpoints. Because the transition rules regarding thereporting of data create problems for assessing someof the 2004 data regarding loan pricing, as they do formanufactured homes and pre-approvals, the analysisthat follows excludes ‘‘transition’’ applications—those submitted before January 1, 2004 (data on theseapplications are shown as memo items in tables 7and 8). Otherwise, information is given on all appli-cations reported under HMDA. For presentation,applications were grouped into twenty-five productcategories based on loan and property type, purposeof the loan, and lien and owner-occupancy status.37
For each product category, information is providedon the number of total and pre-approval applications,application denials, originated loans, loans withprices above the thresholds, loans covered byHOEPA, and the mean and median spreads for loanspriced above certain thresholds.
Denial Rates
For the past fifteen years or so, the HMDA data havebeen the primary source of publicly available data onthe disposition of applications for home loans. Theexpanded HMDA data for 2004 provide new opportu-nities to assess patterns in the disposition of applica-tions at different stages of the lending process andacross product lines and applicant groups.
Denial Rates across Products
The incidence of denials differs substantially acrossloan products. Lenders deny only about 15 percentof the applications for home-purchase loans on one-to four-family site-built homes, whether the loansare secured as a first lien or a junior lien and whetherthey are conventional or government backed(table 7). In contrast, about 30 percent to 36 percentof refinancings and home-improvement loan appli-cations involving first liens are denied, as are about50 percent of the applications for manufacturedhomes. The main exception to this pattern is applica-tions for government-backed first-lien loans for refi-nancings, which have a denial rate similar to that ofhome-purchase loans.
Of particular importance are the disposition pat-terns for applications for manufactured homes. Asnoted, past HMDA data did not distinguish appli-cations for manufactured homes from those forsite-built properties. Analysis of the HUD list ofmanufactured-home loan specialists suggested thatsuch lenders had very high denial rates, and that forlenders offering both manufactured-home loansand other home loans a distorted picture of theirpropensity to deny credit could easily be drawn. The2004 data confirm the importance of distinguishingapplications for manufactured homes from thosefor site-built properties. For example, adding theapplications for conventional home-purchase firstliens for manufactured homes to those for one- tofour-family site-built homes would increase thenumber of total lender actions on applications only7 percent but the number of denials more than 25 per-cent. The denial rate for the category ‘‘conventional
37. Applications in which the lender reported that the race, ethnic-ity, and sex of the applicant or co-applicant were ‘‘not applicable’’were assumed to have been made by businesses (including trusts)rather than by individuals.
5.—Continued
Type of lender
Home purchase Refinance Home improvement
MemoNumber
ofloans
First lien Junior lien First lien Junior lien First lien Junior lien Unsecured
Percentof
loantype1
Percentof
lendertype2
Percentof
loantype1
Percentof
lendertype 2
Percentof
loantype1
Percentof
lendertype 2
Percentof
loantype1
Percentof
lendertype 2
Percentof
loantype1
Percentof
lendertype 2
Percentof
loantype1
Percentof
lendertype 2
Percentof
loantype1
Percentof
lendertype 2
Conventional
Depository institutionCommercial bank . . . 48.4 49.1 24.2 .6 45.8 31.6 41.9 1.1 61.6 4.8 63.9 2.6 89.7 3.7 112,385Savings institution . . . 6.9 50.9 3.4 .6 5.8 29.0 6.2 1.2 5.5 3.1 3.9 1.2 2.5 .8 15,391Credit union . . . . . . . . 3.0 44.6 17.8 6.2 3.5 35.9 7.0 2.7 3.5 4.0 6.2 3.8 4.0 2.5 7,632
Mortgage companyIndependent . . . . . . . . . 35.9 48.2 51.2 1.6 33.4 30.5 36.6 1.3 21.2 2.2 19.0 1.0 .3 * 84,940Affiliated . . . . . . . . . . . 5.8 30.2 3.4 .4 11.5 40.9 8.3 1.1 8.2 3.3 7.0 1.5 3.5 .8 21,849
All lenders . . . . . . . . . . . . 100 47.1 100 1.1 100 32.0 100 1.2 100 3.6 100 1.9 100 1.9 242,197
MemoNumber of loans . . . . . . 114,021 2,653 77,571 2,908 8,739 4,633 4,661 242,197
New Information Reported under HMDA and Its Application in Fair Lending Enforcement 361
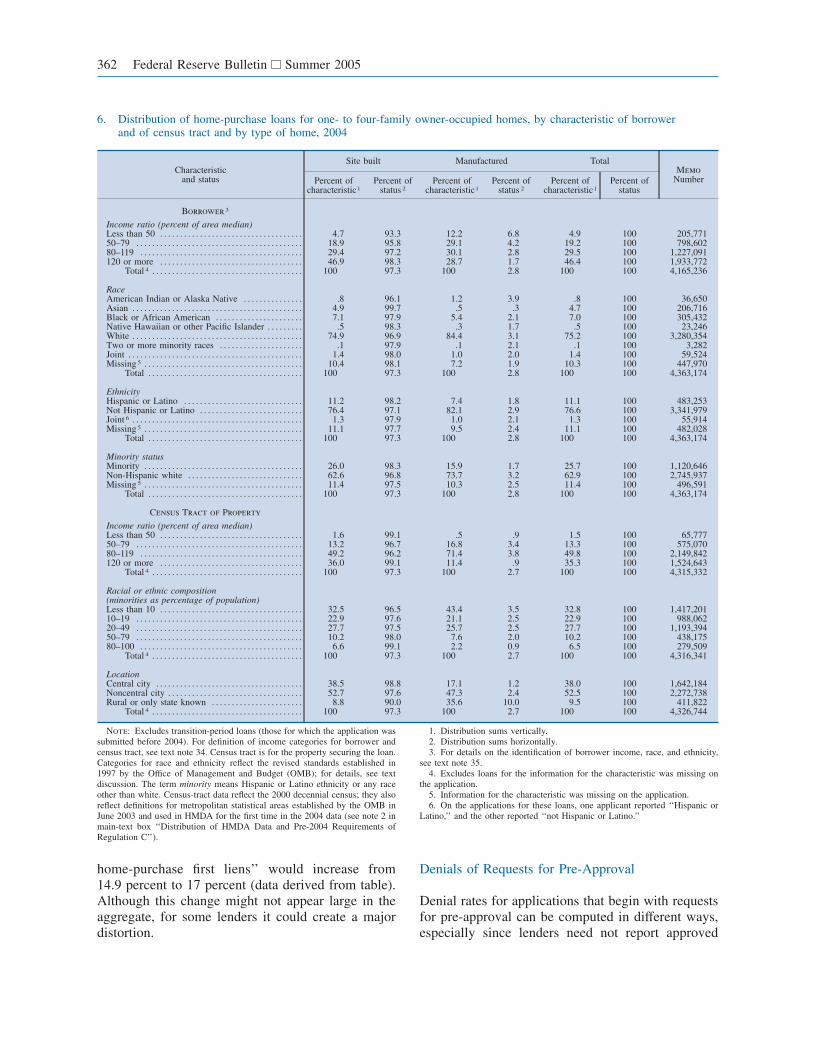
home-purchase first liens’’ would increase from14.9 percent to 17 percent (data derived from table).Although this change might not appear large in theaggregate, for some lenders it could create a majordistortion.
Denials of Requests for Pre-Approval
Denial rates for applications that begin with requestsfor pre-approval can be computed in different ways,especially since lenders need not report approved
6. Distribution of home-purchase loans for one- to four-family owner-occupied homes, by characteristic of borrowerand of census tract and by type of home, 2004
Characteristicand status
Site built Manufactured TotalMemo
NumberPercent ofcharacteristic1
Percent ofstatus 2
Percent ofcharacteristic1
Percent ofstatus 2
Percent ofcharacteristic1
Percent ofstatus
Borrower 3
Income ratio (percent of area median)Less than 50 . . . . . . . . . . . . . . . . . . . . . . . . . . . . . . . . . . . . 4.7 93.3 12.2 6.8 4.9 100 205,77150–79 . . . . . . . . . . . . . . . . . . . . . . . . . . . . . . . . . . . . . . . . . . 18.9 95.8 29.1 4.2 19.2 100 798,60280–119 . . . . . . . . . . . . . . . . . . . . . . . . . . . . . . . . . . . . . . . . . 29.4 97.2 30.1 2.8 29.5 100 1,227,091120 or more . . . . . . . . . . . . . . . . . . . . . . . . . . . . . . . . . . . . 46.9 98.3 28.7 1.7 46.4 100 1,933,772
Total 4 . . . . . . . . . . . . . . . . . . . . . . . . . . . . . . . . . . . . . . 100 97.3 100 2.8 100 100 4,165,236
RaceAmerican Indian or Alaska Native . . . . . . . . . . . . . . . .8 96.1 1.2 3.9 .8 100 36,650Asian . . . . . . . . . . . . . . . . . . . . . . . . . . . . . . . . . . . . . . . . . . . 4.9 99.7 .5 .3 4.7 100 206,716Black or African American . . . . . . . . . . . . . . . . . . . . . . 7.1 97.9 5.4 2.1 7.0 100 305,432Native Hawaiian or other Pacific Islander . . . . . . . . . .5 98.3 .3 1.7 .5 100 23,246White . . . . . . . . . . . . . . . . . . . . . . . . . . . . . . . . . . . . . . . . . . . 74.9 96.9 84.4 3.1 75.2 100 3,280,354Two or more minority races . . . . . . . . . . . . . . . . . . . . . .1 97.9 .1 2.1 .1 100 3,282Joint . . . . . . . . . . . . . . . . . . . . . . . . . . . . . . . . . . . . . . . . . . . . 1.4 98.0 1.0 2.0 1.4 100 59,524Missing 5 . . . . . . . . . . . . . . . . . . . . . . . . . . . . . . . . . . . . . . . . 10.4 98.1 7.2 1.9 10.3 100 447,970
Total . . . . . . . . . . . . . . . . . . . . . . . . . . . . . . . . . . . . . . . 100 97.3 100 2.8 100 100 4,363,174
EthnicityHispanic or Latino . . . . . . . . . . . . . . . . . . . . . . . . . . . . . . 11.2 98.2 7.4 1.8 11.1 100 483,253Not Hispanic or Latino . . . . . . . . . . . . . . . . . . . . . . . . . . 76.4 97.1 82.1 2.9 76.6 100 3,341,979Joint 6 . . . . . . . . . . . . . . . . . . . . . . . . . . . . . . . . . . . . . . . . . . . 1.3 97.9 1.0 2.1 1.3 100 55,914Missing 5 . . . . . . . . . . . . . . . . . . . . . . . . . . . . . . . . . . . . . . . . 11.1 97.7 9.5 2.4 11.1 100 482,028
Total . . . . . . . . . . . . . . . . . . . . . . . . . . . . . . . . . . . . . . . 100 97.3 100 2.8 100 100 4,363,174
Minority statusMinority . . . . . . . . . . . . . . . . . . . . . . . . . . . . . . . . . . . . . . . . 26.0 98.3 15.9 1.7 25.7 100 1,120,646Non-Hispanic white . . . . . . . . . . . . . . . . . . . . . . . . . . . . . 62.6 96.8 73.7 3.2 62.9 100 2,745,937Missing 5 . . . . . . . . . . . . . . . . . . . . . . . . . . . . . . . . . . . . . . . . 11.4 97.5 10.3 2.5 11.4 100 496,591
Total . . . . . . . . . . . . . . . . . . . . . . . . . . . . . . . . . . . . . . . 100 97.3 100 2.8 100 100 4,363,174
Census Tract of Property
Income ratio (percent of area median)Less than 50 . . . . . . . . . . . . . . . . . . . . . . . . . . . . . . . . . . . . 1.6 99.1 .5 .9 1.5 100 65,77750–79 . . . . . . . . . . . . . . . . . . . . . . . . . . . . . . . . . . . . . . . . . . 13.2 96.7 16.8 3.4 13.3 100 575,07080–119 . . . . . . . . . . . . . . . . . . . . . . . . . . . . . . . . . . . . . . . . . 49.2 96.2 71.4 3.8 49.8 100 2,149,842120 or more . . . . . . . . . . . . . . . . . . . . . . . . . . . . . . . . . . . . 36.0 99.1 11.4 .9 35.3 100 1,524,643
Total 4 . . . . . . . . . . . . . . . . . . . . . . . . . . . . . . . . . . . . . . 100 97.3 100 2.7 100 100 4,315,332
Racial or ethnic composition(minorities as percentage of population)Less than 10 . . . . . . . . . . . . . . . . . . . . . . . . . . . . . . . . . . . . 32.5 96.5 43.4 3.5 32.8 100 1,417,20110–19 . . . . . . . . . . . . . . . . . . . . . . . . . . . . . . . . . . . . . . . . . . 22.9 97.6 21.1 2.5 22.9 100 988,06220–49 . . . . . . . . . . . . . . . . . . . . . . . . . . . . . . . . . . . . . . . . . . 27.7 97.5 25.7 2.5 27.7 100 1,193,39450–79 . . . . . . . . . . . . . . . . . . . . . . . . . . . . . . . . . . . . . . . . . . 10.2 98.0 7.6 2.0 10.2 100 438,17580–100 . . . . . . . . . . . . . . . . . . . . . . . . . . . . . . . . . . . . . . . . . 6.6 99.1 2.2 0.9 6.5 100 279,509
Total 4 . . . . . . . . . . . . . . . . . . . . . . . . . . . . . . . . . . . . . . 100 97.3 100 2.7 100 100 4,316,341
LocationCentral city . . . . . . . . . . . . . . . . . . . . . . . . . . . . . . . . . . . . . 38.5 98.8 17.1 1.2 38.0 100 1,642,184Noncentral city . . . . . . . . . . . . . . . . . . . . . . . . . . . . . . . . . . 52.7 97.6 47.3 2.4 52.5 100 2,272,738Rural or only state known . . . . . . . . . . . . . . . . . . . . . . . 8.8 90.0 35.6 10.0 9.5 100 411,822
Total 4 . . . . . . . . . . . . . . . . . . . . . . . . . . . . . . . . . . . . . . 100 97.3 100 2.7 100 100 4,326,744
Note: Excludes transition-period loans (those for which the application wassubmitted before 2004). For definition of income categories for borrower andcensus tract, see text note 34. Census tract is for the property securing the loan.Categories for race and ethnicity reflect the revised standards established in1997 by the Office of Management and Budget (OMB); for details, see textdiscussion. The term minority means Hispanic or Latino ethnicity or any raceother than white. Census-tract data reflect the 2000 decennial census; they alsoreflect definitions for metropolitan statistical areas established by the OMB inJune 2003 and used in HMDA for the first time in the 2004 data (see note 2 inmain-text box ‘‘Distribution of HMDA Data and Pre-2004 Requirements ofRegulation C’’).
1. Distribution sums vertically.2. Distribution sums horizontally.3. For details on the identification of borrower income, race, and ethnicity,
see text note 35.4. Excludes loans for the information for the characteristic was missing on
the application.5. Information for the characteristic was missing on the application.6. On the applications for these loans, one applicant reported ‘‘Hispanic or
Latino,’’ and the other reported ‘‘not Hispanic or Latino.’’
362 Federal Reserve Bulletin Summer 2005
requests for pre-approval not acted on by the borrow-ers. One way to assess the disposition of applicationsreceived through the pre-approval process is to com-pute denial rates for requests for pre-approval sepa-rately from the denial rates for subsequent applica-tions related to a specific property. Another way ofassessing denial rates is to combine the two stages(pre-approval requests and subsequent applicationsfor a specific property) and to treat a denial at eitherstage as a denial.
The denial rates for pre-approval requests (col-umn 3 of table 8) are similar to the denial rates forall applications for home loans on specific prop-erties (column 4 of table 7). Not surprisingly, thedenial rates on applications for a specific propertythat began as requests for pre-approval (derivedfrom columns 5 and 6 of table 8) are lower thanthe denial rates on pre-approval requests and onapplications for a specific property that did notcome through the pre-approval process. But althoughthey are relatively low, the denial rates for pre-approved borrowers are not zero: More than8 percent of pre-approved applicants for con-ventional first-lien home-purchase loans are turneddown when they apply for a loan on a specificproperty.
If we view requests for pre-approval and appli-cations for loans to purchase a specific property aselements of a single process, the data suggest thatthe overall denial rates for applicants for home loanson specific properties who came through the pre-approval process are about the same as for applicantswho did not first request a pre-approval. Seventeenpercent of the applicants for conventional first-lienhome-purchase loans who came through the pre-approval process were denied versus 15 percent ofthose who did not first request a pre-approval (dataderived from tables 7 and 8).
However, origination rates for the two groups werevery different. Only 49 percent of the applicants forconventional first-lien home-purchase loans whobegan the process with a request for a pre-approvalended up with a loan, compared with 67 percentof other applicants. This difference appears to stemnot from lender actions but from markedly differentrates of withdrawal from the process by applicants.Thirty-four percent of applications for conventionalfirst-lien home-purchase loans that started at the pre-approval stage are withdrawn by the applicant atsome point (or not acted on by the lender). Thewithdrawal rate for other applications is much lower(19 percent).
Reported Reasons for Denial
The HMDA data include information from lenders onwhy they turned down an application. Lenders gener-ally provide the information voluntarily; however,two federal bank supervisory agencies, the Office ofThrift Supervision and the Office of the Comptrollerof the Currency, require the institutions they super-vise to report this information.38
Institutions are allowed to cite up to three reasons(from a list of nine) that an application was turneddown. Overall, one or more reasons for denial wereprovided for about 81 percent of the denials across allloan products and for about 75 percent of the denialsfor home-purchase loans (data not shown in tables).Poor or no credit history was the most frequentlycited reason for denying applications: Credit-relatedissues were cited in about 26 percent of the denialsof applications for conventional first-lien loans topurchase one- to four-family site-built homes andin about 52 percent of the denials of applications forsuch loans to purchase manufactured homes. Otherreasons often cited for credit denials involved exces-sive debt-to-income ratios, issues related to collat-eral, and unverifiable or incomplete information onapplications; a catch-all category in the HMDA datalabeled ‘‘other’’ was also frequently cited.
Loan Pricing
Because of the transition rules, some unknown pro-portion of higher-priced loans was reported in thesame way as loans that did not meet the thresholdrequirements.39 The inability to identify higher-pricedloans that were originated in 2004 but had applicationdates preceding that year means that users of the dataneed to take special account of these applicationswhen conducting analyses.
Reasons for Loan-Price Variation
The HMDA data on loans in the higher-priced seg-ment of the home-loan market do not include much
38. Reasons for denial are not provided for requests for pre-approvals that are denied.
39. Analysis of the data is further complicated because loans notsubject to the Federal Reserve’s Regulation Z—that is, businessloans—are reported with the same code as loans with spreads belowthe threshold. Some, perhaps most, of these loans are identifiable,however, because, as explained in text note 37, an application can beidentified as being from a trust or other organization rather than from aperson.
New Information Reported under HMDA and Its Application in Fair Lending Enforcement 363
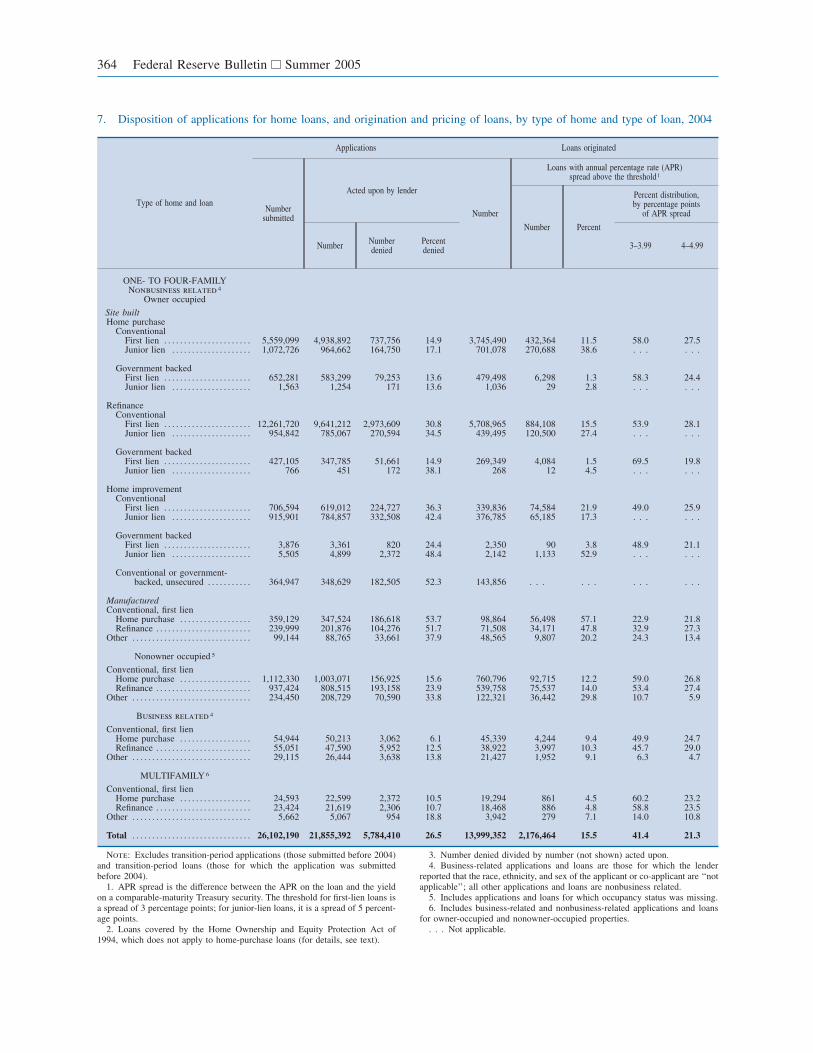
7. Disposition of applications for home loans, and origination and pricing of loans, by type of home and type of loan, 2004
Type of home and loan
Applications Loans originated
Numbersubmitted
Acted upon by lender
Number
Loans with annual percentage rate (APR)spread above the threshold1
Number Percent
Percent distribution,by percentage points
of APR spread
Number Numberdenied
Percentdenied 3–3.99 4–4.99
ONE- TO FOUR-FAMILYNonbusiness related 4
Owner occupied
Site builtHome purchase
ConventionalFirst lien . . . . . . . . . . . . . . . . . . . . . . 5,559,099 4,938,892 737,756 14.9 3,745,490 432,364 11.5 58.0 27.5Junior lien . . . . . . . . . . . . . . . . . . . . 1,072,726 964,662 164,750 17.1 701,078 270,688 38.6 . . . . . .
Government backedFirst lien . . . . . . . . . . . . . . . . . . . . . . 652,281 583,299 79,253 13.6 479,498 6,298 1.3 58.3 24.4Junior lien . . . . . . . . . . . . . . . . . . . . 1,563 1,254 171 13.6 1,036 29 2.8 . . . . . .
RefinanceConventional
First lien . . . . . . . . . . . . . . . . . . . . . . 12,261,720 9,641,212 2,973,609 30.8 5,708,965 884,108 15.5 53.9 28.1Junior lien . . . . . . . . . . . . . . . . . . . . 954,842 785,067 270,594 34.5 439,495 120,500 27.4 . . . . . .
Government backedFirst lien . . . . . . . . . . . . . . . . . . . . . . 427,105 347,785 51,661 14.9 269,349 4,084 1.5 69.5 19.8Junior lien . . . . . . . . . . . . . . . . . . . . 766 451 172 38.1 268 12 4.5 . . . . . .
Home improvementConventional
First lien . . . . . . . . . . . . . . . . . . . . . . 706,594 619,012 224,727 36.3 339,836 74,584 21.9 49.0 25.9Junior lien . . . . . . . . . . . . . . . . . . . . 915,901 784,857 332,508 42.4 376,785 65,185 17.3 . . . . . .
Government backedFirst lien . . . . . . . . . . . . . . . . . . . . . . 3,876 3,361 820 24.4 2,350 90 3.8 48.9 21.1Junior lien . . . . . . . . . . . . . . . . . . . . 5,505 4,899 2,372 48.4 2,142 1,133 52.9 . . . . . .
Conventional or government-backed, unsecured . . . . . . . . . . . 364,947 348,629 182,505 52.3 143,856 . . . . . . . . . . . .
ManufacturedConventional, first lien
Home purchase . . . . . . . . . . . . . . . . . . 359,129 347,524 186,618 53.7 98,864 56,498 57.1 22.9 21.8Refinance . . . . . . . . . . . . . . . . . . . . . . . . 239,999 201,876 104,276 51.7 71,508 34,171 47.8 32.9 27.3
Other . . . . . . . . . . . . . . . . . . . . . . . . . . . . . . 99,144 88,765 33,661 37.9 48,565 9,807 20.2 24.3 13.4
Nonowner occupied 5
Conventional, first lienHome purchase . . . . . . . . . . . . . . . . . . 1,112,330 1,003,071 156,925 15.6 760,796 92,715 12.2 59.0 26.8Refinance . . . . . . . . . . . . . . . . . . . . . . . . 937,424 808,515 193,158 23.9 539,758 75,537 14.0 53.4 27.4
Other . . . . . . . . . . . . . . . . . . . . . . . . . . . . . . 234,450 208,729 70,590 33.8 122,321 36,442 29.8 10.7 5.9
Business related 4
Conventional, first lienHome purchase . . . . . . . . . . . . . . . . . . 54,944 50,213 3,062 6.1 45,339 4,244 9.4 49.9 24.7Refinance . . . . . . . . . . . . . . . . . . . . . . . . 55,051 47,590 5,952 12.5 38,922 3,997 10.3 45.7 29.0
Other . . . . . . . . . . . . . . . . . . . . . . . . . . . . . . 29,115 26,444 3,638 13.8 21,427 1,952 9.1 6.3 4.7
MULTIFAMILY 6
Conventional, first lienHome purchase . . . . . . . . . . . . . . . . . . 24,593 22,599 2,372 10.5 19,294 861 4.5 60.2 23.2Refinance . . . . . . . . . . . . . . . . . . . . . . . . 23,424 21,619 2,306 10.7 18,468 886 4.8 58.8 23.5
Other . . . . . . . . . . . . . . . . . . . . . . . . . . . . . . 5,662 5,067 954 18.8 3,942 279 7.1 14.0 10.8
Total . . . . . . . . . . . . . . . . . . . . . . . . . . . . . . 26,102,190 21,855,392 5,784,410 26.5 13,999,352 2,176,464 15.5 41.4 21.3
Note: Excludes transition-period applications (those submitted before 2004)and transition-period loans (those for which the application was submittedbefore 2004).
1. APR spread is the difference between the APR on the loan and the yieldon a comparable-maturity Treasury security. The threshold for first-lien loans isa spread of 3 percentage points; for junior-lien loans, it is a spread of 5 percent-age points.
2. Loans covered by the Home Ownership and Equity Protection Act of1994, which does not apply to home-purchase loans (for details, see text).
3. Number denied divided by number (not shown) acted upon.4. Business-related applications and loans are those for which the lender
reported that the race, ethnicity, and sex of the applicant or co-applicant are ‘‘notapplicable’’; all other applications and loans are nonbusiness related.
5. Includes applications and loans for which occupancy status was missing.6. Includes business-related and nonbusiness-related applications and loans
for owner-occupied and nonowner-occupied properties.. . . Not applicable.
364 Federal Reserve Bulletin Summer 2005
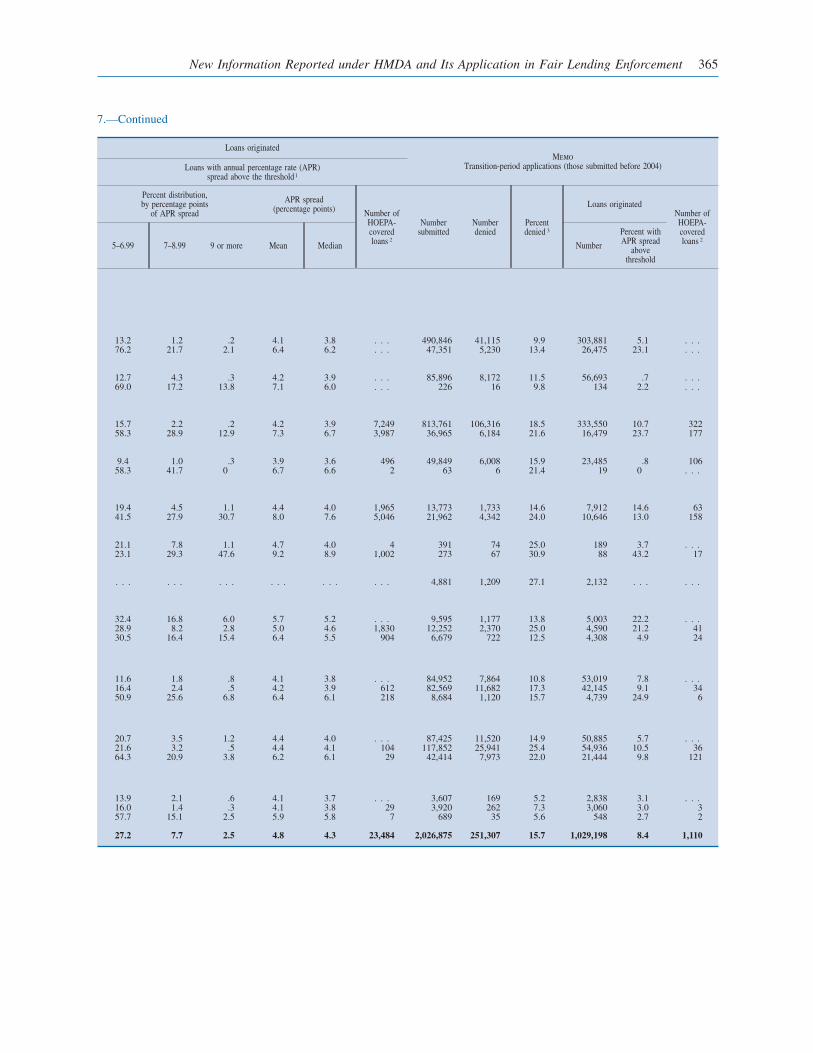
7.—Continued
Loans originatedMemo
Transition-period applications (those submitted before 2004)Loans with annual percentage rate (APR)spread above the threshold1
Percent distribution,by percentage points
of APR spread
APR spread(percentage points) Number of
HOEPA-coveredloans 2
Numbersubmitted
Numberdenied
Percentdenied 3
Loans originatedNumber ofHOEPA-coveredloans 2
5–6.99 7–8.99 9 or more Mean Median Number
Percent withAPR spread
abovethreshold
13.2 1.2 .2 4.1 3.8 . . . 490,846 41,115 9.9 303,881 5.1 . . .76.2 21.7 2.1 6.4 6.2 . . . 47,351 5,230 13.4 26,475 23.1 . . .
12.7 4.3 .3 4.2 3.9 . . . 85,896 8,172 11.5 56,693 .7 . . .69.0 17.2 13.8 7.1 6.0 . . . 226 16 9.8 134 2.2 . . .
15.7 2.2 .2 4.2 3.9 7,249 813,761 106,316 18.5 333,550 10.7 32258.3 28.9 12.9 7.3 6.7 3,987 36,965 6,184 21.6 16,479 23.7 177
9.4 1.0 .3 3.9 3.6 496 49,849 6,008 15.9 23,485 .8 10658.3 41.7 0 6.7 6.6 2 63 6 21.4 19 0 . . .
19.4 4.5 1.1 4.4 4.0 1,965 13,773 1,733 14.6 7,912 14.6 6341.5 27.9 30.7 8.0 7.6 5,046 21,962 4,342 24.0 10,646 13.0 158
21.1 7.8 1.1 4.7 4.0 4 391 74 25.0 189 3.7 . . .23.1 29.3 47.6 9.2 8.9 1,002 273 67 30.9 88 43.2 17
. . . . . . . . . . . . . . . . . . 4,881 1,209 27.1 2,132 . . . . . .
32.4 16.8 6.0 5.7 5.2 . . . 9,595 1,177 13.8 5,003 22.2 . . .28.9 8.2 2.8 5.0 4.6 1,830 12,252 2,370 25.0 4,590 21.2 4130.5 16.4 15.4 6.4 5.5 904 6,679 722 12.5 4,308 4.9 24
11.6 1.8 .8 4.1 3.8 . . . 84,952 7,864 10.8 53,019 7.8 . . .16.4 2.4 .5 4.2 3.9 612 82,569 11,682 17.3 42,145 9.1 3450.9 25.6 6.8 6.4 6.1 218 8,684 1,120 15.7 4,739 24.9 6
20.7 3.5 1.2 4.4 4.0 . . . 87,425 11,520 14.9 50,885 5.7 . . .21.6 3.2 .5 4.4 4.1 104 117,852 25,941 25.4 54,936 10.5 3664.3 20.9 3.8 6.2 6.1 29 42,414 7,973 22.0 21,444 9.8 121
13.9 2.1 .6 4.1 3.7 . . . 3,607 169 5.2 2,838 3.1 . . .16.0 1.4 .3 4.1 3.8 29 3,920 262 7.3 3,060 3.0 357.7 15.1 2.5 5.9 5.8 7 689 35 5.6 548 2.7 2
27.2 7.7 2.5 4.8 4.3 23,484 2,026,875 251,307 15.7 1,029,198 8.4 1,110
New Information Reported under HMDA and Its Application in Fair Lending Enforcement 365

of the information that might explain variations in theprices of reported loans. Among the factors reflectedin loan pricing are the cost of the funds to be lent,credit risk, prepayment risk, overhead expenses, loan-servicing costs, the negotiating abilities and inclina-tions of the creditor and borrower, the possibility ofdiscriminatory pricing, and variations in the channelsthrough which a loan application at a given lendermay be processed (see box ‘‘Reasons for Loan PriceVariation’’).
Issues Raised by Expanding the Disclosureof Pricing-Related Items
Although disclosures that are more comprehensivecould improve the understanding of loan pricing, itwould impose new costs on lenders to collect andreport the additional data, raise difficult reportingissues, and might pose privacy concerns for consum-ers and reveal otherwise nonpublic information about
lenders’ business strategies. Adding new data ele-ments to mandated disclosures would require institu-tions to train staff, modify data collection and report-ing software, and expand controls to ensure thereporting of correct data.
Further, the fact that lenders differ in the factorsthey consider in setting loan prices makes it difficultto select additional data elements that would allowa complete understanding of the determinants of aparticular lender’s pricing method. Also, some loan-pricing items that might be added to the HMDA dataraise technical issues about what, precisely, to report.For example, if lenders were required to report creditscores, getting consistent data across lenders wouldbe difficult because institutions rely on different typesof credit scores in underwriting—for example, somelenders rely on generic FICO credit history scores(see text note 31), whereas others use proprietarycredit scores developed from information on theirown experience with lending.
8. Home-purchase lending that began with a request for pre-approval: Disposition and pricing, by type of home, 2004
Type of home
Requests for pre-approval Applications preceded byrequests for pre-approval1
Loan originations whose applications werepreceded by requests for pre-approval
Numbersubmitted
Numberdenied
Percentdenied 2
Numbersubmitted
Acted upon by lender
Number
Loans with annual percentagerate (APR) spread
above the threshold 3
Number Numberdenied Number Percent
ONE- TO FOUR-FAMILYNonbusiness related
Owner occupied
Site builtConventional
First lien . . . . . . . . . . . . . . . . . . . . . . . . 684,306 153,773 22.5 448,771 396,998 34,665 332,804 27,340 8.2Junior lien . . . . . . . . . . . . . . . . . . . . . . . 88,793 15,423 17.4 67,757 61,771 4,728 52,671 14,865 28.2
Government backedFirst lien . . . . . . . . . . . . . . . . . . . . . . . . 100,118 26,682 26.7 71,632 64,214 7,218 53,527 662 1.2Junior lien . . . . . . . . . . . . . . . . . . . . . . . 147 35 23.8 118 99 13 83 7 8.4
ManufacturedConventional, first lien . . . . . . . . . . . . . 39,791 23,838 59.9 37,592 35,700 22,039 7,430 4,735 63.7Other . . . . . . . . . . . . . . . . . . . . . . . . . . . . . . 3,714 935 25.2 2,912 2,351 419 1,787 94 5.3
Nonowner occupied
Conventional, first lien . . . . . . . . . . . . . 84,763 15,252 18.0 58,101 51,548 5,457 41,564 3,478 8.4Other . . . . . . . . . . . . . . . . . . . . . . . . . . . . . . 7,003 1,067 15.2 5,953 5,040 487 4,000 1,307 32.7
Business related
Conventional, first lien . . . . . . . . . . . . . 3,667 350 9.5 3,317 2,791 244 2,417 364 15.1Other . . . . . . . . . . . . . . . . . . . . . . . . . . . . . . 1,540 117 7.6 1,419 1,208 90 1,079 149 13.8
MULTIFAMILY
Conventional, first lien . . . . . . . . . . . . . 226 29 12.8 207 186 14 167 19 11.4Other . . . . . . . . . . . . . . . . . . . . . . . . . . . . . . 16 4 25.0 14 13 2 11 6 54.5
Total . . . . . . . . . . . . . . . . . . . . . . . . . . . . . . 1,014,084 237,505 23.4 697,793 621,919 75,376 497,540 53,026 10.7
Note: Excludes transition-period requests for pre-approval (those submit-ted before 2004). See also notes 4, 5, and 6 of table 7 for details on business-related, nonowner-occupied, and multifamily properties and general note totable 2.
1. These applications are included in the total of 26,102,190 reported intable 7.
2. Number denied divided by number (not shown) acted upon.3. See table 7, note 1.. . . Not applicable.
366 Federal Reserve Bulletin Summer 2005
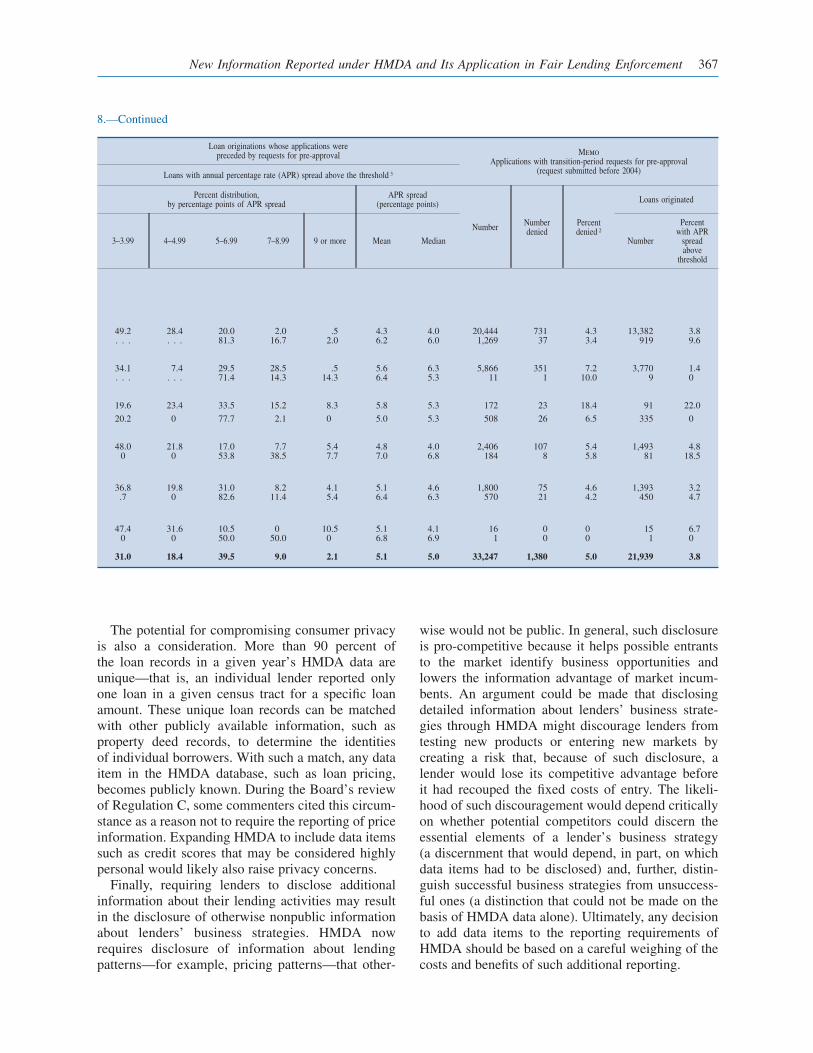
The potential for compromising consumer privacyis also a consideration. More than 90 percent ofthe loan records in a given year’s HMDA data areunique—that is, an individual lender reported onlyone loan in a given census tract for a specific loanamount. These unique loan records can be matchedwith other publicly available information, such asproperty deed records, to determine the identitiesof individual borrowers. With such a match, any dataitem in the HMDA database, such as loan pricing,becomes publicly known. During the Board’s reviewof Regulation C, some commenters cited this circum-stance as a reason not to require the reporting of priceinformation. Expanding HMDA to include data itemssuch as credit scores that may be considered highlypersonal would likely also raise privacy concerns.
Finally, requiring lenders to disclose additionalinformation about their lending activities may resultin the disclosure of otherwise nonpublic informationabout lenders’ business strategies. HMDA nowrequires disclosure of information about lendingpatterns—for example, pricing patterns—that other-
wise would not be public. In general, such disclosureis pro-competitive because it helps possible entrantsto the market identify business opportunities andlowers the information advantage of market incum-bents. An argument could be made that disclosingdetailed information about lenders’ business strate-gies through HMDA might discourage lenders fromtesting new products or entering new markets bycreating a risk that, because of such disclosure, alender would lose its competitive advantage beforeit had recouped the fixed costs of entry. The likeli-hood of such discouragement would depend criticallyon whether potential competitors could discern theessential elements of a lender’s business strategy(a discernment that would depend, in part, on whichdata items had to be disclosed) and, further, distin-guish successful business strategies from unsuccess-ful ones (a distinction that could not be made on thebasis of HMDA data alone). Ultimately, any decisionto add data items to the reporting requirements ofHMDA should be based on a careful weighing of thecosts and benefits of such additional reporting.
8.—Continued
Loan originations whose applications werepreceded by requests for pre-approval Memo
Applications with transition-period requests for pre-approval(request submitted before 2004)Loans with annual percentage rate (APR) spread above the threshold 3
Percent distribution,by percentage points of APR spread
APR spread(percentage points)
Number Numberdenied
Percentdenied 2
Loans originated
3–3.99 4–4.99 5–6.99 7–8.99 9 or more Mean Median Number
Percentwith APR
spreadabove
threshold
49.2 28.4 20.0 2.0 .5 4.3 4.0 20,444 731 4.3 13,382 3.8. . . . . . 81.3 16.7 2.0 6.2 6.0 1,269 37 3.4 919 9.6
34.1 7.4 29.5 28.5 .5 5.6 6.3 5,866 351 7.2 3,770 1.4. . . . . . 71.4 14.3 14.3 6.4 5.3 11 1 10.0 9 0
19.6 23.4 33.5 15.2 8.3 5.8 5.3 172 23 18.4 91 22.0
20.2 0 77.7 2.1 0 5.0 5.3 508 26 6.5 335 0
48.0 21.8 17.0 7.7 5.4 4.8 4.0 2,406 107 5.4 1,493 4.80 0 53.8 38.5 7.7 7.0 6.8 184 8 5.8 81 18.5
36.8 19.8 31.0 8.2 4.1 5.1 4.6 1,800 75 4.6 1,393 3.2.7 0 82.6 11.4 5.4 6.4 6.3 570 21 4.2 450 4.7
47.4 31.6 10.5 0 10.5 5.1 4.1 16 0 0 15 6.70 0 50.0 50.0 0 6.8 6.9 1 0 0 1 0
31.0 18.4 39.5 9.0 2.1 5.1 5.0 33,247 1,380 5.0 21,939 3.8
New Information Reported under HMDA and Its Application in Fair Lending Enforcement 367
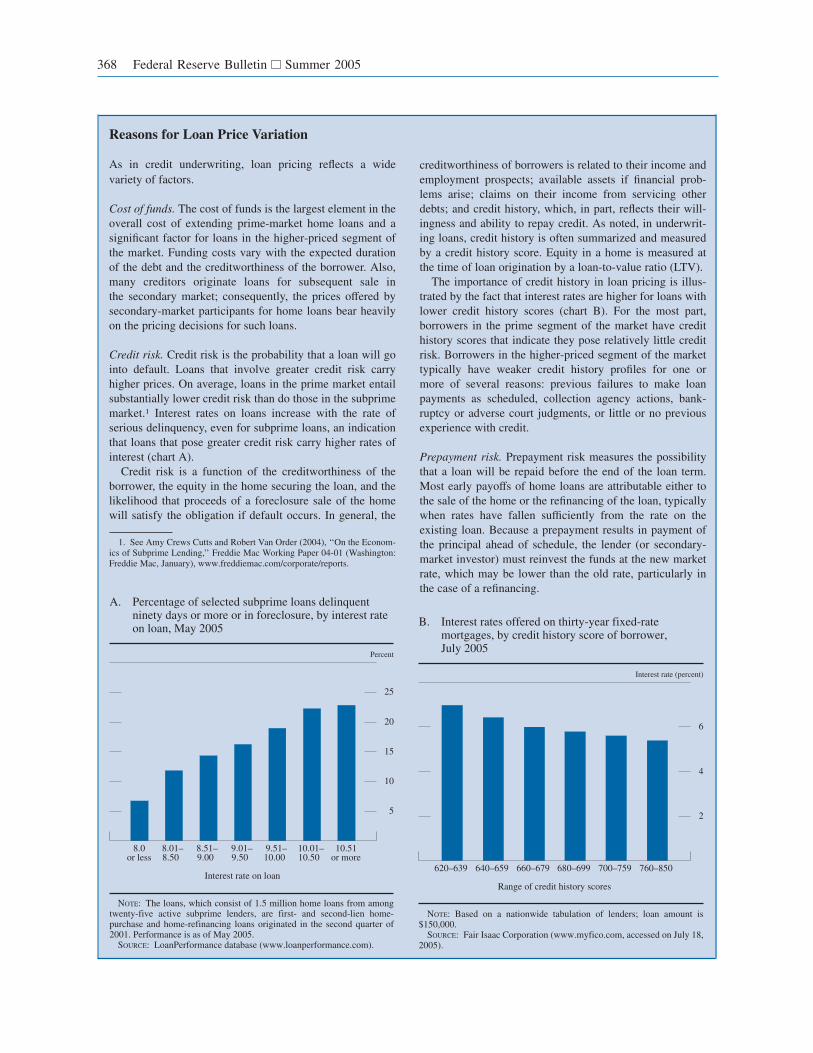
Reasons for Loan Price Variation
As in credit underwriting, loan pricing reflects a widevariety of factors.
Cost of funds. The cost of funds is the largest element in theoverall cost of extending prime-market home loans and asignificant factor for loans in the higher-priced segment ofthe market. Funding costs vary with the expected durationof the debt and the creditworthiness of the borrower. Also,many creditors originate loans for subsequent sale inthe secondary market; consequently, the prices offered bysecondary-market participants for home loans bear heavilyon the pricing decisions for such loans.
Credit risk. Credit risk is the probability that a loan will gointo default. Loans that involve greater credit risk carryhigher prices. On average, loans in the prime market entailsubstantially lower credit risk than do those in the subprimemarket.1 Interest rates on loans increase with the rate ofserious delinquency, even for subprime loans, an indicationthat loans that pose greater credit risk carry higher rates ofinterest (chart A).
Credit risk is a function of the creditworthiness of theborrower, the equity in the home securing the loan, and thelikelihood that proceeds of a foreclosure sale of the homewill satisfy the obligation if default occurs. In general, the
1. See Amy Crews Cutts and Robert Van Order (2004), ‘‘On the Econom-ics of Subprime Lending,’’ Freddie Mac Working Paper 04-01 (Washington:Freddie Mac, January), www.freddiemac.com/corporate/reports.
creditworthiness of borrowers is related to their income andemployment prospects; available assets if financial prob-lems arise; claims on their income from servicing otherdebts; and credit history, which, in part, reflects their will-ingness and ability to repay credit. As noted, in underwrit-ing loans, credit history is often summarized and measuredby a credit history score. Equity in a home is measured atthe time of loan origination by a loan-to-value ratio (LTV).
The importance of credit history in loan pricing is illus-trated by the fact that interest rates are higher for loans withlower credit history scores (chart B). For the most part,borrowers in the prime segment of the market have credithistory scores that indicate they pose relatively little creditrisk. Borrowers in the higher-priced segment of the markettypically have weaker credit history profiles for one ormore of several reasons: previous failures to make loanpayments as scheduled, collection agency actions, bank-ruptcy or adverse court judgments, or little or no previousexperience with credit.
Prepayment risk. Prepayment risk measures the possibilitythat a loan will be repaid before the end of the loan term.Most early payoffs of home loans are attributable either tothe sale of the home or the refinancing of the loan, typicallywhen rates have fallen sufficiently from the rate on theexisting loan. Because a prepayment results in payment ofthe principal ahead of schedule, the lender (or secondary-market investor) must reinvest the funds at the new marketrate, which may be lower than the old rate, particularly inthe case of a refinancing.
5
10
15
20
25
Percent
8.0or less
8.01–8.50
8.51–9.00
9.01–9.50
9.51–10.00
10.01–10.50
10.51or more
Interest rate on loan
A. Percentage of selected subprime loans delinquent ninety days or more or in foreclosure, by interest rate on loan, May 2005
NOTE: The loans, which consist of 1.5 million home loans from amongtwenty-five active subprime lenders, are first- and second-lien home-purchase and home-refinancing loans originated in the second quarter of2001. Performance is as of May 2005.
SOURCE: LoanPerformance database (www.loanperformance.com).
2
4
6
Interest rate (percent)
620–639 640–659 660–679 680–699 700–759 760–850
Range of credit history scores
B. Interest rates offered on thirty-year fixed-rate mortgages, by credit history score of borrower, July 2005
NOTE: Based on a nationwide tabulation of lenders; loan amount is$150,000.
SOURCE: Fair Isaac Corporation (www.myfico.com, accessed on July 18,2005).
368 Federal Reserve Bulletin Summer 2005
Reasons for Loan Price Variation—Continued
Although the possibility of prepayment is well under-stood, estimating when it will happen is quite difficult. Forthis reason, lenders compensate for the risk either by includ-ing prepayment penalties in their loan contracts or by pric-ing the risk in their calculation of the interest rate on theloan. The first of these options, the prepayment penalty, israre in the prime segment of the market but is more com-mon in the subprime segment.
Borrowers in the higher-priced segment of the home-loanmarket have higher prepayment rates than others becausemany of them improve their credit profiles over time as theymake regular payments, and this improvement in turnallows them to qualify for a lower-rate loan. Our review ofdepersonalized credit record information from one of thethree national credit-reporting agencies indicates that, as ofJune 30, 2003, almost one-fourth of those with outstandinghome-loan debt and with credit history scores between 580and 620 (a credit score range associated with individualswith subprime credit quality) increased their credit scores40 points or more over the ensuing eighteen-month period.A change in credit score of this magnitude would typicallybe sufficient to move their credit risk profiles into thenear-prime or prime segment of the market.2
The effect of even a small improvement in the credithistory score is much larger for borrowers in the higher-priced segment of the home-loan market than for thosein the prime segment. For a higher-priced loan, a smallimprovement in the borrower’s credit history score maytranslate into a substantial reduction in interest rates andmay encourage prepayment (chart B).3 Because pricing inthe prime segment varies little by credit score, borrowers inthe prime market are less likely to obtain a lower-pricedloan if their credit scores improve.
Another factor that may result in elevated rates of prepay-ment in the higher-priced portion of the market is thepractice referred to as ‘‘loan flipping.’’ Flipping is inducinga borrower to refinance a loan repeatedly—even thoughthe refinancing may not be in the borrower’s interest—andcharging high fees with each refinancing.
Overhead expenses. Overhead expenses represent a fairlysmall component of the cost of lending for most homeloans. However, borrowers who have experienced paymentproblems in the past, or who have little or no credit history,or who are unable or unwilling to document their employ-ment histories or income are likely to require more time tounderwrite. The higher cost of underwriting may be passedon to such borrowers and can result in prices that place theirloans in the higher-priced segment of the market. Marketing
2. The three national credit-reporting agencies are Equifax(www.equifax.com), Experian (www.experian.com), and Trans Union Cor-poration (www.transunion.com).
3. Of course, prepayment penalties may deter prepayment among someborrowers in the higher-priced segment of the market even when their creditscores improve.
and other expenses incurred to identify market opportuni-ties and solicit customers may also differ across segments ofthe home-loan market.
Servicing costs. Servicing costs are expenses incurred toprocess and distribute loan payments, monitor accounts,and deal with borrowers who fall behind in their payments.Servicing costs can be particularly high if the loan involvesa foreclosure—that is, a forced sale. Because the higher-priced segment of the market has high rates of seriousdelinquency, servicing costs are higher than in the primemarket. And because higher-priced loans tend to be smallerthan prime loans, the costs of servicing and the costs ofextra underwriting efforts (noted earlier) must be spreadover a smaller dollar volume of loans. Borrowing a rela-tively small amount increases the possibility that elevatedcosts will lead to a higher-priced loan because any givenamount of fixed costs passed on to the borrower increasesthe APR more on a smaller loan than on a larger loan.Hence, these costs have a larger effect on loan prices in thehigher-priced segment of the market than in the primesegment.
In general, the cost and risk-related factors noted earliermay be measured in an objective way and are demonstrablyrelated to the costs, and hence the prices established, forcredit. Two additional, and related, pricing factors are notnecessarily objective and, moreover, are more likely thanothers to raise fair lending concerns: discretionary pricingby loan officers and price negotiations between creditor andapplicant.
Discretionary pricing. Many creditors provide their loanofficers and agents working on their behalf (for example,mortgage brokers) with rate sheets that indicate the credi-tors’ minimum prices by product (for example, for con-ventional loans of various types or with various types ofgovernment backing), loan characteristics (for example,term to maturity and LTV ratio), and borrower creditworthi-ness (for example, credit history score and debt-to-incomeratio). In some cases, loan officers and brokers are allowedto deviate from these prices as market conditions warrantor allow. A loan officer may quote a prospective borrowera price above the rate sheet (sometimes referred to as an‘‘overage’’), and if the consumer accepts the price withoutdemanding cash back to offset loan fees or other closingcosts, the contract interest rate or loan fees on such ‘‘over-aged loans’’ will be higher than they might otherwise havebeen.
Discretionary pricing can be a legitimate business prac-tice and can help ensure that markets allocate resourcesin the most efficient way. However, when loan officers arepermitted latitude in establishing prices, the lender runs therisk that differential treatment on a basis prohibited by lawmay arise. Obtaining overages more often, or in higher
New Information Reported under HMDA and Its Application in Fair Lending Enforcement 369
The Interest Rate Situation in 2004
The interest rates prevailing in a given year cansignificantly affect the proportion of loans that exceedthe thresholds established by the Federal Reserve fordetermining whether a loan is ‘‘higher-priced.’’ For2004, the rate on Treasury securities used to calculatethe spread for home loans with thirty-year termsvaried from 4.67 percent to 5.54 percent. This varia-tion implies that the threshold for reporting a first-lien loan as higher-priced ranged from 7.67 percentto 8.54 percent over the year. For junior liens, whichtypically have a shorter term to maturity than dofirst liens, the reporting threshold ranged from about8.78 percent to 9.79 percent for a fifteen-year loan(different terms to maturity would yield somewhatdifferent ranges).
Data derived by Freddie Mac from its PrimaryMortgage Market Survey show that the spread foraverage interest rates for first-lien conforming mort-gages extended in 2004 imply a typical gap betweenthe thirty-year Treasury rate and an estimated APRfor prime-rate loans of between 1 percent and
1.25 percent.40 This gap implies that a thirty-yearfirst-lien home loan would have to have been pricedbetween 1.75 percentage points and 2 percentagepoints above a prime-rate home loan to exceed theHMDA price-reporting threshold. Such a price spreadwas around the upper end of the near-prime market,but it was probably still below the levels associatedwith most subprime loans. In future years, the thresh-olds may cover a greater proportion of the near-primesegment of the market.
Results: The Incidence of Higher-Priced Lending
Several patterns are revealed in the 2004 HMDApricing data (table 7). First, in almost all cases,government-backed loan products show lower inci-dences of higher-priced lending than do comparableconventional loan products. For example, amongfirst-lien home-purchase loans for site-built homes,11.5 percent of conventional loans have APRs above
40. See www.freddiemac.com.
Reasons for Loan Price Variation—Continued
amounts, from minority borrowers or targeting only minori-ties for overaging may constitute a fair lending violationunless some legitimate, nondiscriminatory reason exists forthe result.
Price negotiations. Price variation can also arise becauseless sophisticated or less knowledgeable borrowers are notas likely to shop for credit or to realize that they maynegotiate with the lender over the interest rate and fees.Moreover, lower-income borrowers may be disproportion-ately represented in the category of less sophisticated bor-rowers. Given that minority borrowers have disproportion-ately lower incomes, there is some likelihood that they willbe overrepresented among borrowers with overaged loans.Such results may be interpreted by some as demonstratingunlawful discriminatory pricing by lenders.
Differences in the extent to which borrowers negotiate orshop for the best deal may result in a pattern of overageloans that is not illegal but that nonetheless may be difficultfor a lender to document and explain. Moreover, instancesof different negotiating strengths among borrowers can bedifficult to distinguish from illegal discriminatory treatmentin which loan officers quote loan rates or provide informa-tion or assistance that varies according to the race, ethnicity,sex, or other prohibited characteristic of the borrower.
Variations in loan-processing channels. The delivery chan-nels through which borrowers obtain loans vary widely
across lenders. On the one hand, underwriting and pricingmay be centrally controlled even though the applicationmay begin on the Internet or with a mailed solicitation orat a bank branch. On the other hand, in complex financialorganizations with bank branches, multiple affiliates, decen-tralized loan production offices, indirect brokerage opera-tions, and nonbank subsidiaries, each application maybe subject to a different underwriting and pricing regimedepending on its point of initiation. The 2004 HMDApricing data suggest that the delivery channel throughwhich a borrower obtains a loan may matter. As dis-cussed elsewhere in this article (see section ‘‘Incidenceof Higher-Priced Lending for Selected Subgroups’’), theincidence of higher-priced lending is higher for borrowerswho live outside the assessment areas of lenders covered bythe Community Reinvestment Act of 1977 (CRA) than forthose who live inside these areas.4 This difference may bedue to a reliance on different delivery channels for loanswithin and outside these lenders’ assessment areas.
4. The assessment areas of lenders covered by the CRA include princi-pally the locales in which a lender has its main or branch offices and itsdeposit-taking automated teller machines. For a more complete definitionof CRA assessment areas, see the Federal Reserve Board’s Regulation BB,section 228.41. See also Robert B. Avery, Glenn B. Canner, Shannon C.Mok, and Dan S. Sokolov (2005), ‘‘Community Banks and Rural Develop-ment: Research Relating to Proposals to Revise the Regulations That Imple-ment the Community Reinvestment Act,’’ Federal Reserve Bulletin, vol. 91(Spring), pp. 202–35.
370 Federal Reserve Bulletin Summer 2005
the pricing threshold versus only 1.3 percent ofgovernment-backed loans. Second, with few excep-tions, first-lien loans have a substantially lower inci-dence of higher-priced lending than do junior-lienloans for the same purposes. For example, nationallythe incidence of higher-priced lending for conven-tional first-lien refinance loans was 15.5 percentwhereas for comparable junior-lien loans it was27.4 percent. Third, manufactured-home loans exhibitthe greatest incidence of higher pricing across allloan products, a result consistent with the elevatedcredit risk associated with such lending. For example,57.1 percent of conventional first-lien loans used topurchase manufactured homes were higher priced, insharp contrast to the 11.5 percent rate for comparableloans for site-built homes. Finally, the lower inci-dence of higher-priced lending (shown in the memoitem in table 7) for loans initiated in the transitionperiod reinforces the decision to exclude such loansfrom the pricing analysis.
Rate spreads for higher-priced loans. Variation inmean and median spreads across products for loanswith rates above the threshold is much smaller thanvariation in the incidence of higher-priced lending.Because the threshold for reporting is set higher forjunior liens than for first liens, higher-priced junior-lien products have higher mean and median spreads.Once again, manufactured-home loans stand out inthat they have the highest average spreads among allthe loan products with comparable lien status.
Except for loans backed by manufactured homes,the vast majority of higher-priced loans have priceswithin 1 or 2 percentage points of the pricing thresh-olds. Only a very small proportion of higher-pricedfirst-lien loans have spreads that exceed 7 percentagepoints. Similarly, only a small proportion of junior-lien loans have spreads of 9 percentage points ormore: But home-improvement loans provide twoexceptions—30.7 percent of conventional junior-lien home-improvement loans and 47.6 percent ofgovernment-backed junior-lien home-improvementloans have spreads of 9 percentage points or more.Reflecting these distributions, the mean and medianspreads for most loan products fall within 2 percent-age points of the reporting thresholds. The exceptionsinclude loans backed by manufactured homes andjunior-lien home-improvement loans, for which thedistribution of prices is more even.
Lenders of higher-priced loans. Most lenders coveredby HMDA reported extending few if any higher-priced loans for 2004 (data not shown in tables).Nearly 3,300 lenders reported making no such loans,
and an additional 2,300 reported making between oneand nine such loans. Nearly 500 lenders reportedmaking more than 100 higher-priced loans; thesemore-active lenders accounted for 96 percent of allreported higher-priced lending of this type. More-over, the 10 lenders with the largest volume extended38 percent of all higher-priced loans.
Variation across metropolitan areas. The analysis ofseparate geographic markets shows that higher-priced lending varies considerably across MSAs.41
For this exercise, the focus is on the incidence ofhigher-priced lending among conventional first-lienhome-purchase loans for site-built, owner-occupiedhomes. The MSA with the lowest incidence ofhigher-priced lending for this product is the San Fran-cisco–San Mateo–Redwood City area in California,at 2 percent; the MSA with the highest incidenceis the McAllen–Edinburg–Pharr area in Texas, at42 percent.42 A review of the full list of MSAsindicates that most of the areas with the highestincidence are in the southern region of the country,whereas those with the lowest incidence are muchmore dispersed.
Although a comprehensive analysis of the reasonsfor such wide variation in the incidence of higher-priced lending is beyond the scope of this article, areview of data from one of the three national credit-reporting agencies finds a close association betweenthe proportion of individuals in an MSA county witha low credit score and the incidence of higher-pricedlending in that area.
Loans Covered by HOEPA
The 2004 HMDA data indicate whether a loan issubject to the Home Ownership and Equity Protec-tion Act of 1994. Before 2004, little information waspublicly available about the extent of such lendingor the number or type of institutions involved insuch activities. However, HMDA data do not captureall HOEPA-related lending. Some HOEPA loans areextended by institutions not covered by HMDA, andsome HOEPA loans that are made by HMDA-coveredinstitutions are not reported under the Federal
41. Reporting institutions are required to report all their lending inMSAs as well as in the nonmetropolitan portions of states. However,because institutions operating exclusively in nonmetropolitan areasare not covered by HMDA, loans in nonmetropolitan areas are under-represented in the data. For this reason, the geographic analysis here isfocused on MSAs.
42. In November 2004, the OMB redesignated this Texas MSA asMcAllen–Edinburg–Mission (see www.whitehouse.gov/omb/bulletins/fy05/b05-02_attachment.pdf).
New Information Reported under HMDA and Its Application in Fair Lending Enforcement 371

Reserve Board’s Regulation C, which implementsHMDA. In particular, if the proceeds of a home-secured loan are not used to refinance an existinghome loan or to finance home improvement, then theloan may be covered by HOEPA but is not reportableunder Regulation C.43
Incidence of HOEPA-Related Lending
For 2004, 1,948 lenders reported extending 24,594loans covered by HOEPA (table 7). The HOEPAloans accounted for only 0.003 percent of all theoriginations of home-secured refinance or home-improvement loans reported for 2004 (derived fromthe table).44
HOEPA lending is relatively concentrated: The tenlenders that reported the largest number of HOEPAoriginations accounted for 37 percent of all reportedHOEPA loans (data not shown in tables). At the otherextreme, 801 institutions reported only one HOEPAloan, and 327 reported only two such loans. MostHOEPA loans were extended by banks (50 percent ofthe total) or by bank subsidiaries or affiliates of bankholding companies (14 percent of the total); indepen-dent mortgage companies extended the rest.
Characteristics of HOEPA-Related Lending
As noted, HOEPA applies only to closed-end homeloans (whether for refinancing or home improve-ment) and not to home-purchase loans or home equitylines of credit. The vast majority of HOEPA loansreported in the 2004 data involved conventional prod-ucts: Only 7 percent of reported HOEPA loans weregovernment backed (derived from table 7). About50 percent of the reported HOEPA loans involvedfirst-lien conventional loans (more than 80 percentof these were for refinancings, and the rest were forhome improvement), and about 40 percent involvedjunior-lien conventional loans (more than half ofthese were for home improvement).
On average, reported HOEPA loans are not large(data not shown in tables). For example, for con-ventional refinancing loans covered by HOEPA, the
average size of a first-lien loan was $98,650, andthe average size of a junior-lien loan was $31,705. Incontrast, the average sizes of such loans not coveredby HOEPA were $173,125 for a first-lien loan and$54,581 for a junior-lien loan.
Reported HOEPA lending varies among borrowerssorted by borrower income, race, and ethnicity andamong census tracts sorted by census tract income,population, and location. However, the data do notindicate that HMDA-reportable HOEPA lending isfocused primarily on lower-income or minority indi-viduals or on those residing in lower-income neigh-borhoods or neighborhoods with high concentrationsof minority individuals. For example, althoughreported HOEPA loans were extended to borrowersin all income groups, about three-fourths wereextended to middle- and higher-income borrowers(data not shown in tables). Similarly, most reportedHOEPA loans were extended to non-Hispanic whiteborrowers. Most of the homes secured by reportedHOEPA loans were in middle- or higher-income areasand in areas with a minority population that was lessthan 20 percent of the total population.
LENDING OUTCOMES BY RACE, ETHNICITY,AND SEX
One of the primary purposes of the HMDA data isto allow comparison of the outcomes of the lendingprocess for applicants and borrowers grouped alongmany dimensions, including by race, ethnicity, andsex. Outcomes reported in the HMDA data includethe disposition of applications (denial rates) and, asof 2004, the pricing of loans. Gross outcomes fordifferent groups of borrowers can be compared, butHMDA data include information on a number ofitems whose presence or absence for borrowers canbe made consistent (‘‘controlled for’’) in conductingthe comparisons. Clearly the HMDA data do notinclude all the factors that are involved in creditunderwriting and pricing. However, by controllingfor variations so as to make borrowers as similar aspossible on the dimensions of the data that are avail-able, one can account for some of the factors thatmay explain differences in the outcomes of the lend-ing process among groups.
The HMDA data allow individuals to be matchedby loan type and purpose, type of property securingthe loan, lien status, owner-occupancy status, prop-erty location (for example, same MSA or even samecensus tract), income relied on for underwriting, loanamount, and time of year when the loan was made aswell as by whether the loan involved a co-applicant.
43. For example, if a homeowner takes out a HOEPA-covered loanto pay off outstanding credit card debt or some other type of consumercredit, and the loan does not involve the refinancing of an existinghome loan or home improvement, then the loan is not covered byRegulation C and is thus not required to be part of an institution’sHMDA reporting.
44. The HMDA data also include information on loans purchasedby covered institutions during 2004: Among purchased loans, about2,700 were designated as HOEPA loans.
372 Federal Reserve Bulletin Summer 2005
In comparing lending outcomes across racial andethnic groups, one can match for the sex of theapplicant and co-applicant, and in comparing out-comes by sex, one can match for race and ethnicity.
Comparisons in outcomes across groups can beconducted at the level of an individual institution,groups of institutions (for example, manufactured-home lending specialists), geographic market, orpopulations as a whole. Further, a variety of statis-tical methodologies can be used to control for theeffects of the credit-related or other factors in HMDAnoted above. The full range of these comparisons isbeyond the scope of this article. However, to gain anunderstanding of the differences that are likely to beimportant, we analyzed the 2004 data using statisticalmatching criteria similar to those used in the FederalReserve’s statistical analysis program (described inthe section ‘‘Using the Expanded HMDA Data as aScreening Tool for Fair Lending Enforcement’’).
We restrict the analysis to denial rates, the inci-dence of higher-priced lending, and the mean spreadspaid by borrowers with higher-priced loans, and wecompare these outcomes across eleven groups—nineracial or ethnic groups and the two sexes. We conductthe analysis for thirteen of the twenty-five loan prod-ucts covered in table 7.45
We present the comparisons at three levels, oneunadjusted and two adjusted. The first level for eachgroup is the raw, or unadjusted, average outcome.The second level is the average outcome as adjustedfor the borrower-related factors reported in theHMDA data—income, loan amount, location (MSA)of the property, presence of a co-applicant, and (inthe comparisons by race and ethnicity) sex or (in thecomparisons by sex) race and ethnicity; applying thisadjustment is hereafter termed ‘‘adjusting (or control-ling or accounting) for borrower-related factors.’’ Thethird level is the average outcome as adjusted for allthe items in the second level (the borrower-relatedfactors) plus the lending institution—applying thisadjustment is hereafter termed ‘‘adjusting (or control-ling, or accounting) for borrower-related factors pluslender.’’
Applications subject to the transition rules wereexcluded from the pricing comparisons; however,they were included for the denial-rate comparisons.46
Also excluded from the sample are applicants resid-ing outside the fifty states and the District of Colum-bia, applications deemed to be business-related, andrequests for pre-approval that were denied by thelender or that were granted by the lender but notacted upon by the borrower. Otherwise, the sampleincludes all 2004 HMDA applications acted upon bythe lender in the thirteen product areas.
Unadjusted and adjusted comparisons for lendingoutcomes across groups are discussed in the sectionsbelow. For purposes of presentation, the adjustedoutcomes shown in the tables are normalized so that,for the base comparison group (non-Hispanic whitesin the case of comparison by race and ethnicity, andmales in the case of comparison by sex), the adjustedmean at each adjustment level is the same as theunadjusted mean. Consequently, the adjusted out-comes for any other group represent the expectedaverage outcome if the members of that group hadthe same distribution of control factors as that of thebase comparison group.
Denial Rates across Groups
Unadjusted mean denial rates vary across loan cate-gories for all groups of borrowers (table 9). Forexample, the mean unadjusted denial rate for Asiansis lowest for government-backed first-lien home-purchase loans (12.4 percent) and highest for con-ventional junior liens for home improvements(46.1 percent).
For every loan category, American Indians, blacks,Hispanic whites, and the group for which race wasmissing have higher unadjusted mean denial ratesthan non-Hispanic whites, with the highest rates gen-erally for blacks and the rates for Hispanic whiteslying about halfway between those for blacks andthose for non-Hispanic whites. The denial rates foreach of the other minority groups vary in their rela-tionship with the rates for non-Hispanic whites.
With few exceptions, controlling for borrower-related factors reduces the differences among racialand ethnic groups. (Although the effect of controllingfor borrower-related factors can widen the racial andethnic differences in denial rates.) Accounting for
45. The analysis was not conducted for unsecured loans becausepricing data were not collected for these loans. Eleven other productareas were not used because they accounted for so few loans thatmatching was difficult.
46. The action date on an application is used to determine thereporting year for HMDA data. The gap between the application dateand the action date is generally shorter for denied applications than fororiginated loans. For example, applications received and acted upon inDecember (and therefore reported in HMDA for that year) are more
likely to be denials than acceptances. Similarly, applications actedupon in January but received in the previous year are more likely to beacceptances. In analyzing denial rates for 2004, excluding applica-tions covered by the transition period (that is, applications receivedbefore 2004) is therefore likely to disproportionately exclude accep-tances. This can be seen in the memo item in table 7, where the denialrates are lower for applications filed during the transition period. Forthis reason, transition-period applications are included in the denial-rate analysis in tables 9 and 14.
New Information Reported under HMDA and Its Application in Fair Lending Enforcement 373
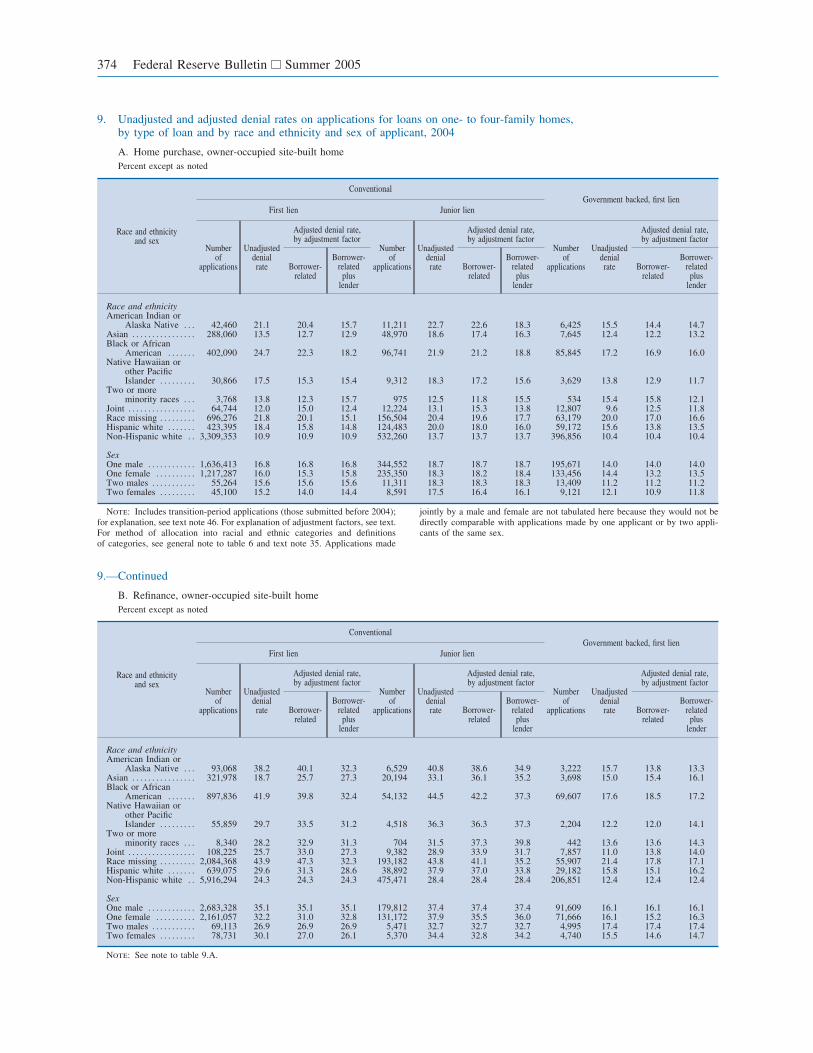
9. Unadjusted and adjusted denial rates on applications for loans on one- to four-family homes,by type of loan and by race and ethnicity and sex of applicant, 2004
A. Home purchase, owner-occupied site-built homePercent except as noted
Race and ethnicityand sex
ConventionalGovernment backed, first lien
First lien Junior lien
Numberof
applications
Unadjusteddenialrate
Adjusted denial rate,by adjustment factor
Numberof
applications
Unadjusteddenialrate
Adjusted denial rate,by adjustment factor
Numberof
applications
Unadjusteddenialrate
Adjusted denial rate,by adjustment factor
Borrower-related
Borrower-related
pluslender
Borrower-related
Borrower-related
pluslender
Borrower-related
Borrower-related
pluslender
Race and ethnicityAmerican Indian or
Alaska Native . . . 42,460 21.1 20.4 15.7 11,211 22.7 22.6 18.3 6,425 15.5 14.4 14.7Asian . . . . . . . . . . . . . . . . 288,060 13.5 12.7 12.9 48,970 18.6 17.4 16.3 7,645 12.4 12.2 13.2Black or African
American . . . . . . . 402,090 24.7 22.3 18.2 96,741 21.9 21.2 18.8 85,845 17.2 16.9 16.0Native Hawaiian or
other PacificIslander . . . . . . . . . 30,866 17.5 15.3 15.4 9,312 18.3 17.2 15.6 3,629 13.8 12.9 11.7
Two or moreminority races . . . 3,768 13.8 12.3 15.7 975 12.5 11.8 15.5 534 15.4 15.8 12.1
Joint . . . . . . . . . . . . . . . . . 64,744 12.0 15.0 12.4 12,224 13.1 15.3 13.8 12,807 9.6 12.5 11.8Race missing . . . . . . . . . 696,276 21.8 20.1 15.1 156,504 20.4 19.6 17.7 63,179 20.0 17.0 16.6Hispanic white . . . . . . . 423,395 18.4 15.8 14.8 124,483 20.0 18.0 16.0 59,172 15.6 13.8 13.5Non-Hispanic white . . 3,309,353 10.9 10.9 10.9 532,260 13.7 13.7 13.7 396,856 10.4 10.4 10.4
SexOne male . . . . . . . . . . . . 1,636,413 16.8 16.8 16.8 344,552 18.7 18.7 18.7 195,671 14.0 14.0 14.0One female . . . . . . . . . . 1,217,287 16.0 15.3 15.8 235,350 18.3 18.2 18.4 133,456 14.4 13.2 13.5Two males . . . . . . . . . . . 55,264 15.6 15.6 15.6 11,311 18.3 18.3 18.3 13,409 11.2 11.2 11.2Two females . . . . . . . . . 45,100 15.2 14.0 14.4 8,591 17.5 16.4 16.1 9,121 12.1 10.9 11.8
Note: Includes transition-period applications (those submitted before 2004);for explanation, see text note 46. For explanation of adjustment factors, see text.For method of allocation into racial and ethnic categories and definitionsof categories, see general note to table 6 and text note 35. Applications made
jointly by a male and female are not tabulated here because they would not bedirectly comparable with applications made by one applicant or by two appli-cants of the same sex.
9.—Continued
B. Refinance, owner-occupied site-built homePercent except as noted
Race and ethnicityand sex
ConventionalGovernment backed, first lien
First lien Junior lien
Numberof
applications
Unadjusteddenialrate
Adjusted denial rate,by adjustment factor
Numberof
applications
Unadjusteddenialrate
Adjusted denial rate,by adjustment factor
Numberof
applications
Unadjusteddenialrate
Adjusted denial rate,by adjustment factor
Borrower-related
Borrower-related
pluslender
Borrower-related
Borrower-related
pluslender
Borrower-related
Borrower-related
pluslender
Race and ethnicityAmerican Indian or
Alaska Native . . . 93,068 38.2 40.1 32.3 6,529 40.8 38.6 34.9 3,222 15.7 13.8 13.3Asian . . . . . . . . . . . . . . . . 321,978 18.7 25.7 27.3 20,194 33.1 36.1 35.2 3,698 15.0 15.4 16.1Black or African
American . . . . . . . 897,836 41.9 39.8 32.4 54,132 44.5 42.2 37.3 69,607 17.6 18.5 17.2Native Hawaiian or
other PacificIslander . . . . . . . . . 55,859 29.7 33.5 31.2 4,518 36.3 36.3 37.3 2,204 12.2 12.0 14.1
Two or moreminority races . . . 8,340 28.2 32.9 31.3 704 31.5 37.3 39.8 442 13.6 13.6 14.3
Joint . . . . . . . . . . . . . . . . . 108,225 25.7 33.0 27.3 9,382 28.9 33.9 31.7 7,857 11.0 13.8 14.0Race missing . . . . . . . . . 2,084,368 43.9 47.3 32.3 193,182 43.8 41.1 35.2 55,907 21.4 17.8 17.1Hispanic white . . . . . . . 639,075 29.6 31.3 28.6 38,892 37.9 37.0 33.8 29,182 15.8 15.1 16.2Non-Hispanic white . . 5,916,294 24.3 24.3 24.3 475,471 28.4 28.4 28.4 206,851 12.4 12.4 12.4
SexOne male . . . . . . . . . . . . 2,683,328 35.1 35.1 35.1 179,812 37.4 37.4 37.4 91,609 16.1 16.1 16.1One female . . . . . . . . . . 2,161,057 32.2 31.0 32.8 131,172 37.9 35.5 36.0 71,666 16.1 15.2 16.3Two males . . . . . . . . . . . 69,113 26.9 26.9 26.9 5,471 32.7 32.7 32.7 4,995 17.4 17.4 17.4Two females . . . . . . . . . 78,731 30.1 27.0 26.1 5,370 34.4 32.8 34.2 4,740 15.5 14.6 14.7
Note: See note to table 9.A.
374 Federal Reserve Bulletin Summer 2005
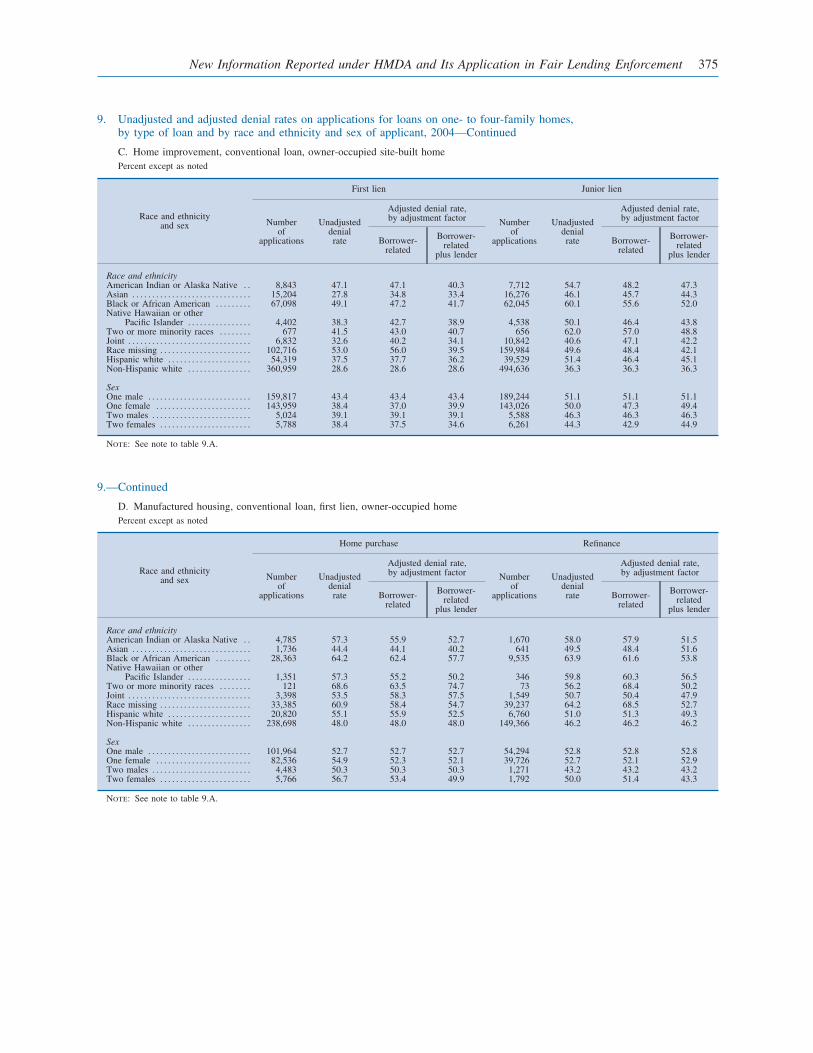
9. Unadjusted and adjusted denial rates on applications for loans on one- to four-family homes,by type of loan and by race and ethnicity and sex of applicant, 2004—Continued
C. Home improvement, conventional loan, owner-occupied site-built homePercent except as noted
Race and ethnicityand sex
First lien Junior lien
Numberof
applications
Unadjusteddenialrate
Adjusted denial rate,by adjustment factor Number
ofapplications
Unadjusteddenialrate
Adjusted denial rate,by adjustment factor
Borrower-related
Borrower-related
plus lender
Borrower-related
Borrower-related
plus lender
Race and ethnicityAmerican Indian or Alaska Native . . 8,843 47.1 47.1 40.3 7,712 54.7 48.2 47.3Asian . . . . . . . . . . . . . . . . . . . . . . . . . . . . . . 15,204 27.8 34.8 33.4 16,276 46.1 45.7 44.3Black or African American . . . . . . . . . 67,098 49.1 47.2 41.7 62,045 60.1 55.6 52.0Native Hawaiian or other
Pacific Islander . . . . . . . . . . . . . . . . 4,402 38.3 42.7 38.9 4,538 50.1 46.4 43.8Two or more minority races . . . . . . . . 677 41.5 43.0 40.7 656 62.0 57.0 48.8Joint . . . . . . . . . . . . . . . . . . . . . . . . . . . . . . . 6,832 32.6 40.2 34.1 10,842 40.6 47.1 42.2Race missing . . . . . . . . . . . . . . . . . . . . . . . 102,716 53.0 56.0 39.5 159,984 49.6 48.4 42.1Hispanic white . . . . . . . . . . . . . . . . . . . . . 54,319 37.5 37.7 36.2 39,529 51.4 46.4 45.1Non-Hispanic white . . . . . . . . . . . . . . . . 360,959 28.6 28.6 28.6 494,636 36.3 36.3 36.3
SexOne male . . . . . . . . . . . . . . . . . . . . . . . . . . 159,817 43.4 43.4 43.4 189,244 51.1 51.1 51.1One female . . . . . . . . . . . . . . . . . . . . . . . . 143,959 38.4 37.0 39.9 143,026 50.0 47.3 49.4Two males . . . . . . . . . . . . . . . . . . . . . . . . . 5,024 39.1 39.1 39.1 5,588 46.3 46.3 46.3Two females . . . . . . . . . . . . . . . . . . . . . . . 5,788 38.4 37.5 34.6 6,261 44.3 42.9 44.9
Note: See note to table 9.A.
9.—Continued
D. Manufactured housing, conventional loan, first lien, owner-occupied homePercent except as noted
Race and ethnicityand sex
Home purchase Refinance
Numberof
applications
Unadjusteddenialrate
Adjusted denial rate,by adjustment factor Number
ofapplications
Unadjusteddenialrate
Adjusted denial rate,by adjustment factor
Borrower-related
Borrower-related
plus lender
Borrower-related
Borrower-related
plus lender
Race and ethnicityAmerican Indian or Alaska Native . . 4,785 57.3 55.9 52.7 1,670 58.0 57.9 51.5Asian . . . . . . . . . . . . . . . . . . . . . . . . . . . . . . 1,736 44.4 44.1 40.2 641 49.5 48.4 51.6Black or African American . . . . . . . . . 28,363 64.2 62.4 57.7 9,535 63.9 61.6 53.8Native Hawaiian or other
Pacific Islander . . . . . . . . . . . . . . . . 1,351 57.3 55.2 50.2 346 59.8 60.3 56.5Two or more minority races . . . . . . . . 121 68.6 63.5 74.7 73 56.2 68.4 50.2Joint . . . . . . . . . . . . . . . . . . . . . . . . . . . . . . . 3,398 53.5 58.3 57.5 1,549 50.7 50.4 47.9Race missing . . . . . . . . . . . . . . . . . . . . . . . 33,385 60.9 58.4 54.7 39,237 64.2 68.5 52.7Hispanic white . . . . . . . . . . . . . . . . . . . . . 20,820 55.1 55.9 52.5 6,760 51.0 51.3 49.3Non-Hispanic white . . . . . . . . . . . . . . . . 238,698 48.0 48.0 48.0 149,366 46.2 46.2 46.2
SexOne male . . . . . . . . . . . . . . . . . . . . . . . . . . 101,964 52.7 52.7 52.7 54,294 52.8 52.8 52.8One female . . . . . . . . . . . . . . . . . . . . . . . . 82,536 54.9 52.3 52.1 39,726 52.7 52.1 52.9Two males . . . . . . . . . . . . . . . . . . . . . . . . . 4,483 50.3 50.3 50.3 1,271 43.2 43.2 43.2Two females . . . . . . . . . . . . . . . . . . . . . . . 5,766 56.7 53.4 49.9 1,792 50.0 51.4 43.3
Note: See note to table 9.A.
New Information Reported under HMDA and Its Application in Fair Lending Enforcement 375
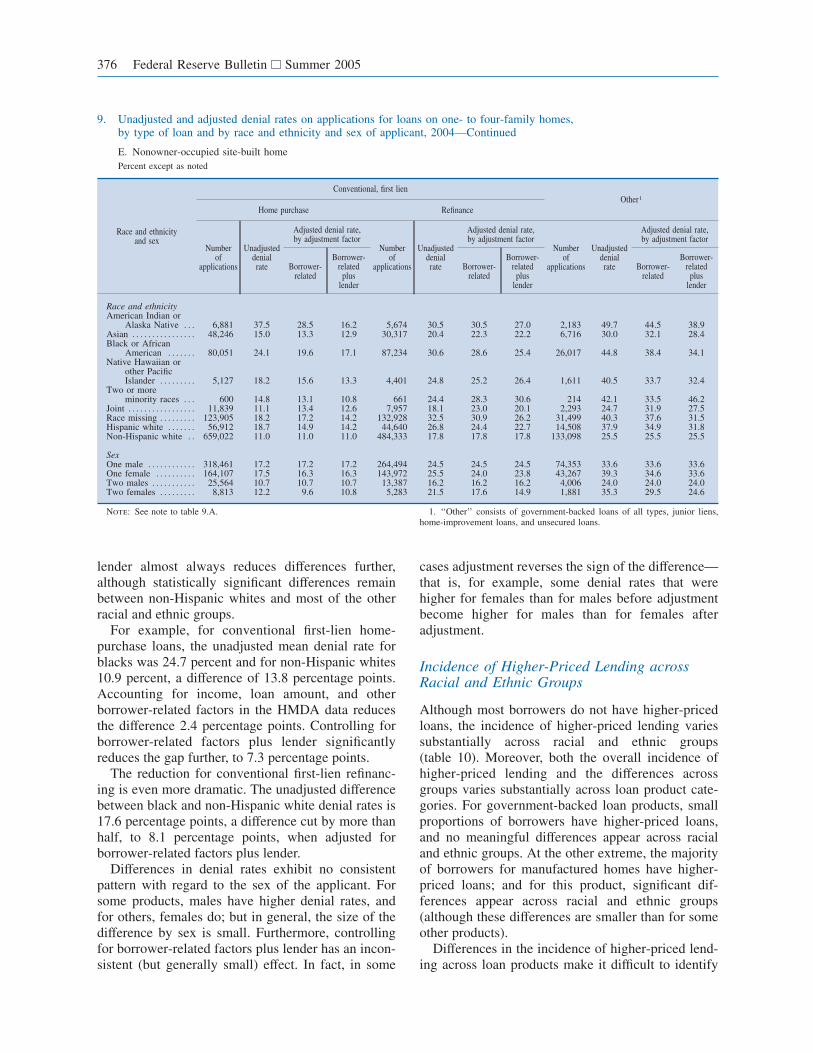
lender almost always reduces differences further,although statistically significant differences remainbetween non-Hispanic whites and most of the otherracial and ethnic groups.
For example, for conventional first-lien home-purchase loans, the unadjusted mean denial rate forblacks was 24.7 percent and for non-Hispanic whites10.9 percent, a difference of 13.8 percentage points.Accounting for income, loan amount, and otherborrower-related factors in the HMDA data reducesthe difference 2.4 percentage points. Controlling forborrower-related factors plus lender significantlyreduces the gap further, to 7.3 percentage points.
The reduction for conventional first-lien refinanc-ing is even more dramatic. The unadjusted differencebetween black and non-Hispanic white denial rates is17.6 percentage points, a difference cut by more thanhalf, to 8.1 percentage points, when adjusted forborrower-related factors plus lender.
Differences in denial rates exhibit no consistentpattern with regard to the sex of the applicant. Forsome products, males have higher denial rates, andfor others, females do; but in general, the size of thedifference by sex is small. Furthermore, controllingfor borrower-related factors plus lender has an incon-sistent (but generally small) effect. In fact, in some
cases adjustment reverses the sign of the difference—that is, for example, some denial rates that werehigher for females than for males before adjustmentbecome higher for males than for females afteradjustment.
Incidence of Higher-Priced Lending acrossRacial and Ethnic Groups
Although most borrowers do not have higher-pricedloans, the incidence of higher-priced lending variessubstantially across racial and ethnic groups(table 10). Moreover, both the overall incidence ofhigher-priced lending and the differences acrossgroups varies substantially across loan product cate-gories. For government-backed loan products, smallproportions of borrowers have higher-priced loans,and no meaningful differences appear across racialand ethnic groups. At the other extreme, the majorityof borrowers for manufactured homes have higher-priced loans; and for this product, significant dif-ferences appear across racial and ethnic groups(although these differences are smaller than for someother products).
Differences in the incidence of higher-priced lend-ing across loan products make it difficult to identify
9. Unadjusted and adjusted denial rates on applications for loans on one- to four-family homes,by type of loan and by race and ethnicity and sex of applicant, 2004—Continued
E. Nonowner-occupied site-built homePercent except as noted
Race and ethnicityand sex
Conventional, first lienOther1
Home purchase Refinance
Numberof
applications
Unadjusteddenialrate
Adjusted denial rate,by adjustment factor
Numberof
applications
Unadjusteddenialrate
Adjusted denial rate,by adjustment factor
Numberof
applications
Unadjusteddenialrate
Adjusted denial rate,by adjustment factor
Borrower-related
Borrower-related
pluslender
Borrower-related
Borrower-related
pluslender
Borrower-related
Borrower-related
pluslender
Race and ethnicityAmerican Indian or
Alaska Native . . . 6,881 37.5 28.5 16.2 5,674 30.5 30.5 27.0 2,183 49.7 44.5 38.9Asian . . . . . . . . . . . . . . . . 48,246 15.0 13.3 12.9 30,317 20.4 22.3 22.2 6,716 30.0 32.1 28.4Black or African
American . . . . . . . 80,051 24.1 19.6 17.1 87,234 30.6 28.6 25.4 26,017 44.8 38.4 34.1Native Hawaiian or
other PacificIslander . . . . . . . . . 5,127 18.2 15.6 13.3 4,401 24.8 25.2 26.4 1,611 40.5 33.7 32.4
Two or moreminority races . . . 600 14.8 13.1 10.8 661 24.4 28.3 30.6 214 42.1 33.5 46.2
Joint . . . . . . . . . . . . . . . . . 11,839 11.1 13.4 12.6 7,957 18.1 23.0 20.1 2,293 24.7 31.9 27.5Race missing . . . . . . . . . 123,905 18.2 17.2 14.2 132,928 32.5 30.9 26.2 31,499 40.3 37.6 31.5Hispanic white . . . . . . . 56,912 18.7 14.9 14.2 44,640 26.8 24.4 22.7 14,508 37.9 34.9 31.8Non-Hispanic white . . 659,022 11.0 11.0 11.0 484,333 17.8 17.8 17.8 133,098 25.5 25.5 25.5
SexOne male . . . . . . . . . . . . 318,461 17.2 17.2 17.2 264,494 24.5 24.5 24.5 74,353 33.6 33.6 33.6One female . . . . . . . . . . 164,107 17.5 16.3 16.3 143,972 25.5 24.0 23.8 43,267 39.3 34.6 33.6Two males . . . . . . . . . . . 25,564 10.7 10.7 10.7 13,387 16.2 16.2 16.2 4,006 24.0 24.0 24.0Two females . . . . . . . . . 8,813 12.2 9.6 10.8 5,283 21.5 17.6 14.9 1,881 35.3 29.5 24.6
Note: See note to table 9.A. 1. ‘‘Other’’ consists of government-backed loans of all types, junior liens,home-improvement loans, and unsecured loans.
376 Federal Reserve Bulletin Summer 2005
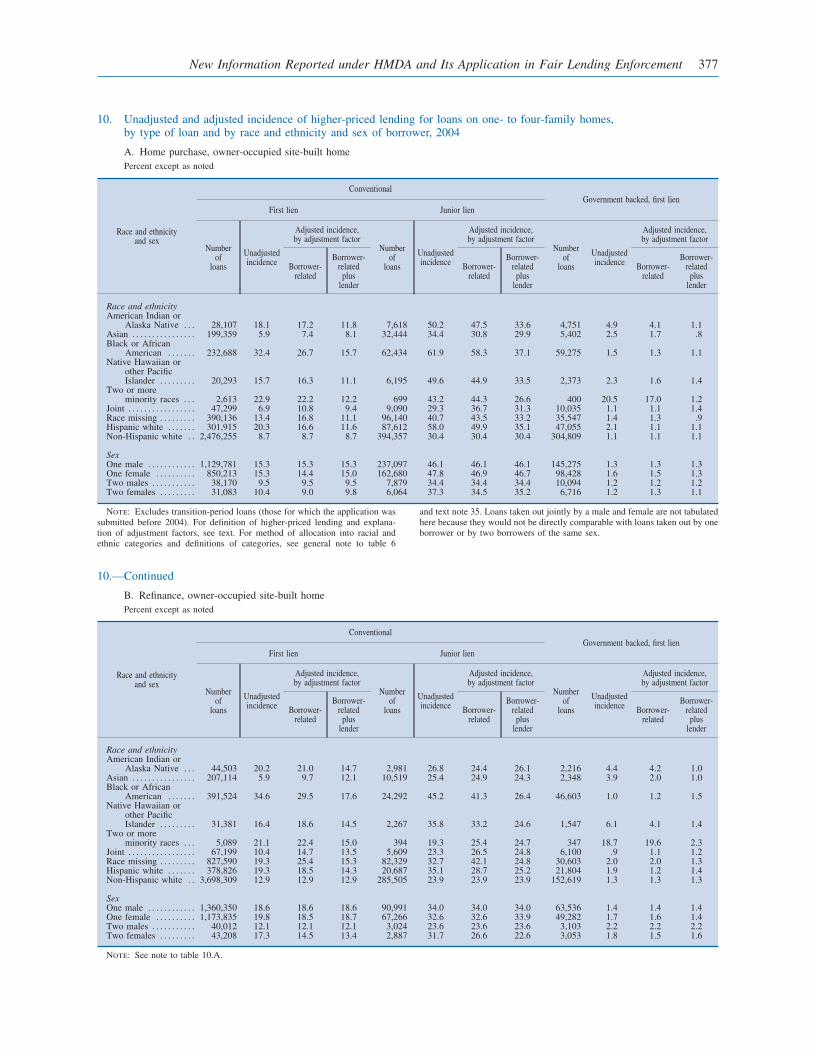
10. Unadjusted and adjusted incidence of higher-priced lending for loans on one- to four-family homes,by type of loan and by race and ethnicity and sex of borrower, 2004
A. Home purchase, owner-occupied site-built homePercent except as noted
Race and ethnicityand sex
ConventionalGovernment backed, first lien
First lien Junior lien
Numberof
loans
Unadjustedincidence
Adjusted incidence,by adjustment factor
Numberof
loans
Unadjustedincidence
Adjusted incidence,by adjustment factor
Numberof
loans
Unadjustedincidence
Adjusted incidence,by adjustment factor
Borrower-related
Borrower-related
pluslender
Borrower-related
Borrower-related
pluslender
Borrower-related
Borrower-related
pluslender
Race and ethnicityAmerican Indian or
Alaska Native . . . 28,107 18.1 17.2 11.8 7,618 50.2 47.5 33.6 4,751 4.9 4.1 1.1Asian . . . . . . . . . . . . . . . . 199,359 5.9 7.4 8.1 32,444 34.4 30.8 29.9 5,402 2.5 1.7 .8Black or African
American . . . . . . . 232,688 32.4 26.7 15.7 62,434 61.9 58.3 37.1 59,275 1.5 1.3 1.1Native Hawaiian or
other PacificIslander . . . . . . . . . 20,293 15.7 16.3 11.1 6,195 49.6 44.9 33.5 2,373 2.3 1.6 1.4
Two or moreminority races . . . 2,613 22.9 22.2 12.2 699 43.2 44.3 26.6 400 20.5 17.0 1.2
Joint . . . . . . . . . . . . . . . . . 47,299 6.9 10.8 9.4 9,090 29.3 36.7 31.3 10,035 1.1 1.1 1.4Race missing . . . . . . . . . 390,136 13.4 16.8 11.1 96,140 40.7 43.5 33.2 35,547 1.4 1.3 .9Hispanic white . . . . . . . 301,915 20.3 16.6 11.6 87,612 58.0 49.9 35.1 47,055 2.1 1.1 1.1Non-Hispanic white . . 2,476,255 8.7 8.7 8.7 394,357 30.4 30.4 30.4 304,809 1.1 1.1 1.1
SexOne male . . . . . . . . . . . . 1,129,781 15.3 15.3 15.3 237,097 46.1 46.1 46.1 145,275 1.3 1.3 1.3One female . . . . . . . . . . 850,213 15.3 14.4 15.0 162,680 47.8 46.9 46.7 98,428 1.6 1.5 1.3Two males . . . . . . . . . . . 38,170 9.5 9.5 9.5 7,879 34.4 34.4 34.4 10,094 1.2 1.2 1.2Two females . . . . . . . . . 31,083 10.4 9.0 9.8 6,064 37.3 34.5 35.2 6,716 1.2 1.3 1.1
Note: Excludes transition-period loans (those for which the application wassubmitted before 2004). For definition of higher-priced lending and explana-tion of adjustment factors, see text. For method of allocation into racial andethnic categories and definitions of categories, see general note to table 6
and text note 35. Loans taken out jointly by a male and female are not tabulatedhere because they would not be directly comparable with loans taken out by oneborrower or by two borrowers of the same sex.
10.—Continued
B. Refinance, owner-occupied site-built homePercent except as noted
Race and ethnicityand sex
ConventionalGovernment backed, first lien
First lien Junior lien
Numberof
loans
Unadjustedincidence
Adjusted incidence,by adjustment factor
Numberof
loans
Unadjustedincidence
Adjusted incidence,by adjustment factor
Numberof
loans
Unadjustedincidence
Adjusted incidence,by adjustment factor
Borrower-related
Borrower-related
pluslender
Borrower-related
Borrower-related
pluslender
Borrower-related
Borrower-related
pluslender
Race and ethnicityAmerican Indian or
Alaska Native . . . 44,503 20.2 21.0 14.7 2,981 26.8 24.4 26.1 2,216 4.4 4.2 1.0Asian . . . . . . . . . . . . . . . . 207,114 5.9 9.7 12.1 10,519 25.4 24.9 24.3 2,348 3.9 2.0 1.0Black or African
American . . . . . . . 391,524 34.6 29.5 17.6 24,292 45.2 41.3 26.4 46,603 1.0 1.2 1.5Native Hawaiian or
other PacificIslander . . . . . . . . . 31,381 16.4 18.6 14.5 2,267 35.8 33.2 24.6 1,547 6.1 4.1 1.4
Two or moreminority races . . . 5,089 21.1 22.4 15.0 394 19.3 25.4 24.7 347 18.7 19.6 2.3
Joint . . . . . . . . . . . . . . . . . 67,199 10.4 14.7 13.5 5,609 23.3 26.5 24.8 6,100 .9 1.1 1.2Race missing . . . . . . . . . 827,590 19.3 25.4 15.3 82,329 32.7 42.1 24.8 30,603 2.0 2.0 1.3Hispanic white . . . . . . . 378,826 19.3 18.5 14.3 20,687 35.1 28.7 25.2 21,804 1.9 1.2 1.4Non-Hispanic white . . 3,698,309 12.9 12.9 12.9 285,505 23.9 23.9 23.9 152,619 1.3 1.3 1.3
SexOne male . . . . . . . . . . . . 1,360,350 18.6 18.6 18.6 90,991 34.0 34.0 34.0 63,536 1.4 1.4 1.4One female . . . . . . . . . . 1,173,835 19.8 18.5 18.7 67,266 32.6 32.6 33.9 49,282 1.7 1.6 1.4Two males . . . . . . . . . . . 40,012 12.1 12.1 12.1 3,024 23.6 23.6 23.6 3,103 2.2 2.2 2.2Two females . . . . . . . . . 43,208 17.3 14.5 13.4 2,887 31.7 26.6 22.6 3,053 1.8 1.5 1.6
Note: See note to table 10.A.
New Information Reported under HMDA and Its Application in Fair Lending Enforcement 377
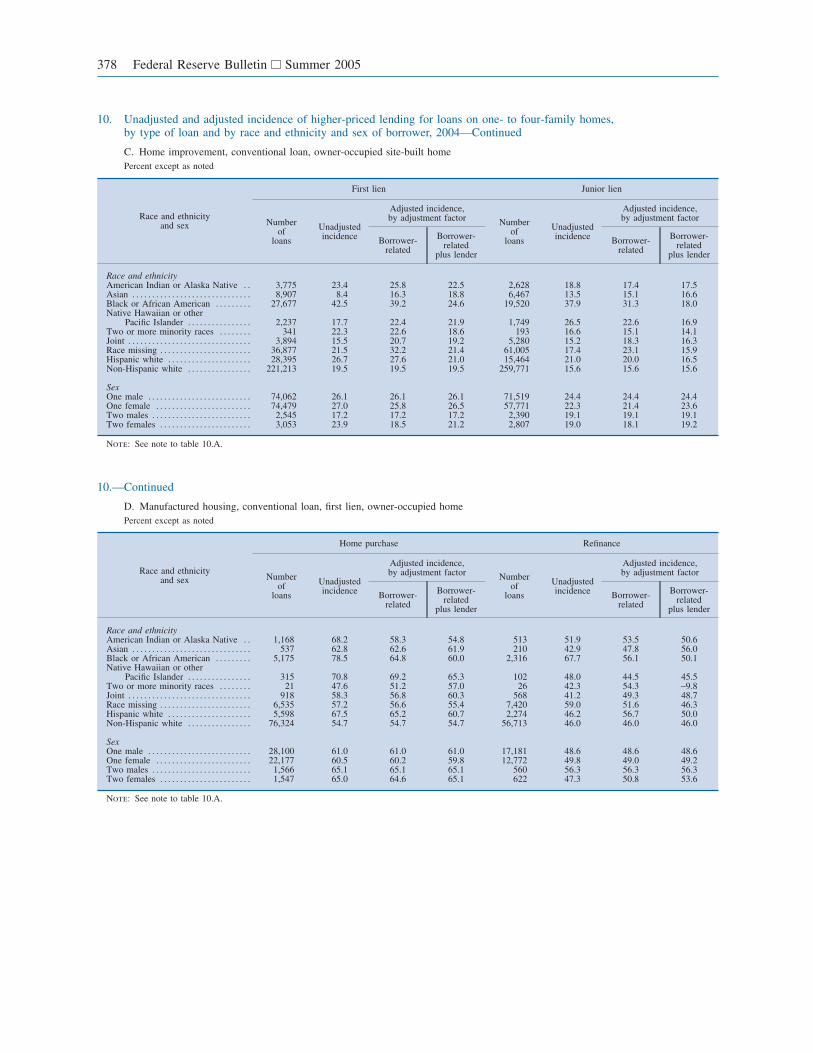
10. Unadjusted and adjusted incidence of higher-priced lending for loans on one- to four-family homes,by type of loan and by race and ethnicity and sex of borrower, 2004—Continued
C. Home improvement, conventional loan, owner-occupied site-built homePercent except as noted
Race and ethnicityand sex
First lien Junior lien
Numberof
loans
Unadjustedincidence
Adjusted incidence,by adjustment factor Number
ofloans
Unadjustedincidence
Adjusted incidence,by adjustment factor
Borrower-related
Borrower-related
plus lender
Borrower-related
Borrower-related
plus lender
Race and ethnicityAmerican Indian or Alaska Native . . 3,775 23.4 25.8 22.5 2,628 18.8 17.4 17.5Asian . . . . . . . . . . . . . . . . . . . . . . . . . . . . . . 8,907 8.4 16.3 18.8 6,467 13.5 15.1 16.6Black or African American . . . . . . . . . 27,677 42.5 39.2 24.6 19,520 37.9 31.3 18.0Native Hawaiian or other
Pacific Islander . . . . . . . . . . . . . . . . 2,237 17.7 22.4 21.9 1,749 26.5 22.6 16.9Two or more minority races . . . . . . . . 341 22.3 22.6 18.6 193 16.6 15.1 14.1Joint . . . . . . . . . . . . . . . . . . . . . . . . . . . . . . . 3,894 15.5 20.7 19.2 5,280 15.2 18.3 16.3Race missing . . . . . . . . . . . . . . . . . . . . . . . 36,877 21.5 32.2 21.4 61,005 17.4 23.1 15.9Hispanic white . . . . . . . . . . . . . . . . . . . . . 28,395 26.7 27.6 21.0 15,464 21.0 20.0 16.5Non-Hispanic white . . . . . . . . . . . . . . . . 221,213 19.5 19.5 19.5 259,771 15.6 15.6 15.6
SexOne male . . . . . . . . . . . . . . . . . . . . . . . . . . 74,062 26.1 26.1 26.1 71,519 24.4 24.4 24.4One female . . . . . . . . . . . . . . . . . . . . . . . . 74,479 27.0 25.8 26.5 57,771 22.3 21.4 23.6Two males . . . . . . . . . . . . . . . . . . . . . . . . . 2,545 17.2 17.2 17.2 2,390 19.1 19.1 19.1Two females . . . . . . . . . . . . . . . . . . . . . . . 3,053 23.9 18.5 21.2 2,807 19.0 18.1 19.2
Note: See note to table 10.A.
10.—Continued
D. Manufactured housing, conventional loan, first lien, owner-occupied homePercent except as noted
Race and ethnicityand sex
Home purchase Refinance
Numberof
loans
Unadjustedincidence
Adjusted incidence,by adjustment factor Number
ofloans
Unadjustedincidence
Adjusted incidence,by adjustment factor
Borrower-related
Borrower-related
plus lender
Borrower-related
Borrower-related
plus lender
Race and ethnicityAmerican Indian or Alaska Native . . 1,168 68.2 58.3 54.8 513 51.9 53.5 50.6Asian . . . . . . . . . . . . . . . . . . . . . . . . . . . . . . 537 62.8 62.6 61.9 210 42.9 47.8 56.0Black or African American . . . . . . . . . 5,175 78.5 64.8 60.0 2,316 67.7 56.1 50.1Native Hawaiian or other
Pacific Islander . . . . . . . . . . . . . . . . 315 70.8 69.2 65.3 102 48.0 44.5 45.5Two or more minority races . . . . . . . . 21 47.6 51.2 57.0 26 42.3 54.3 −9.8Joint . . . . . . . . . . . . . . . . . . . . . . . . . . . . . . . 918 58.3 56.8 60.3 568 41.2 49.3 48.7Race missing . . . . . . . . . . . . . . . . . . . . . . . 6,535 57.2 56.6 55.4 7,420 59.0 51.6 46.3Hispanic white . . . . . . . . . . . . . . . . . . . . . 5,598 67.5 65.2 60.7 2,274 46.2 56.7 50.0Non-Hispanic white . . . . . . . . . . . . . . . . 76,324 54.7 54.7 54.7 56,713 46.0 46.0 46.0
SexOne male . . . . . . . . . . . . . . . . . . . . . . . . . . 28,100 61.0 61.0 61.0 17,181 48.6 48.6 48.6One female . . . . . . . . . . . . . . . . . . . . . . . . 22,177 60.5 60.2 59.8 12,772 49.8 49.0 49.2Two males . . . . . . . . . . . . . . . . . . . . . . . . . 1,566 65.1 65.1 65.1 560 56.3 56.3 56.3Two females . . . . . . . . . . . . . . . . . . . . . . . 1,547 65.0 64.6 65.1 622 47.3 50.8 53.6
Note: See note to table 10.A.
378 Federal Reserve Bulletin Summer 2005
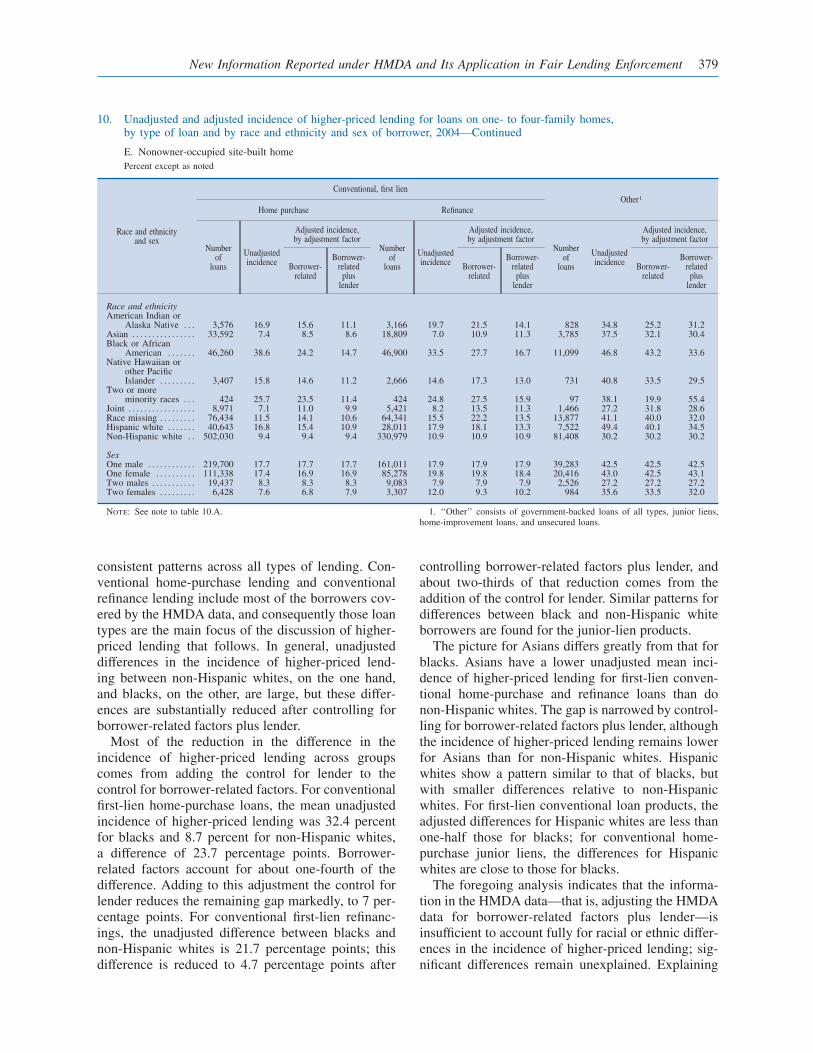
consistent patterns across all types of lending. Con-ventional home-purchase lending and conventionalrefinance lending include most of the borrowers cov-ered by the HMDA data, and consequently those loantypes are the main focus of the discussion of higher-priced lending that follows. In general, unadjusteddifferences in the incidence of higher-priced lend-ing between non-Hispanic whites, on the one hand,and blacks, on the other, are large, but these differ-ences are substantially reduced after controlling forborrower-related factors plus lender.
Most of the reduction in the difference in theincidence of higher-priced lending across groupscomes from adding the control for lender to thecontrol for borrower-related factors. For conventionalfirst-lien home-purchase loans, the mean unadjustedincidence of higher-priced lending was 32.4 percentfor blacks and 8.7 percent for non-Hispanic whites,a difference of 23.7 percentage points. Borrower-related factors account for about one-fourth of thedifference. Adding to this adjustment the control forlender reduces the remaining gap markedly, to 7 per-centage points. For conventional first-lien refinanc-ings, the unadjusted difference between blacks andnon-Hispanic whites is 21.7 percentage points; thisdifference is reduced to 4.7 percentage points after
controlling borrower-related factors plus lender, andabout two-thirds of that reduction comes from theaddition of the control for lender. Similar patterns fordifferences between black and non-Hispanic whiteborrowers are found for the junior-lien products.
The picture for Asians differs greatly from that forblacks. Asians have a lower unadjusted mean inci-dence of higher-priced lending for first-lien conven-tional home-purchase and refinance loans than donon-Hispanic whites. The gap is narrowed by control-ling for borrower-related factors plus lender, althoughthe incidence of higher-priced lending remains lowerfor Asians than for non-Hispanic whites. Hispanicwhites show a pattern similar to that of blacks, butwith smaller differences relative to non-Hispanicwhites. For first-lien conventional loan products, theadjusted differences for Hispanic whites are less thanone-half those for blacks; for conventional home-purchase junior liens, the differences for Hispanicwhites are close to those for blacks.
The foregoing analysis indicates that the informa-tion in the HMDA data—that is, adjusting the HMDAdata for borrower-related factors plus lender—isinsufficient to account fully for racial or ethnic differ-ences in the incidence of higher-priced lending; sig-nificant differences remain unexplained. Explaining
10. Unadjusted and adjusted incidence of higher-priced lending for loans on one- to four-family homes,by type of loan and by race and ethnicity and sex of borrower, 2004—Continued
E. Nonowner-occupied site-built homePercent except as noted
Race and ethnicityand sex
Conventional, first lienOther1
Home purchase Refinance
Numberof
loans
Unadjustedincidence
Adjusted incidence,by adjustment factor
Numberof
loans
Unadjustedincidence
Adjusted incidence,by adjustment factor
Numberof
loans
Unadjustedincidence
Adjusted incidence,by adjustment factor
Borrower-related
Borrower-related
pluslender
Borrower-related
Borrower-related
pluslender
Borrower-related
Borrower-related
pluslender
Race and ethnicityAmerican Indian or
Alaska Native . . . 3,576 16.9 15.6 11.1 3,166 19.7 21.5 14.1 828 34.8 25.2 31.2Asian . . . . . . . . . . . . . . . . 33,592 7.4 8.5 8.6 18,809 7.0 10.9 11.3 3,785 37.5 32.1 30.4Black or African
American . . . . . . . 46,260 38.6 24.2 14.7 46,900 33.5 27.7 16.7 11,099 46.8 43.2 33.6Native Hawaiian or
other PacificIslander . . . . . . . . . 3,407 15.8 14.6 11.2 2,666 14.6 17.3 13.0 731 40.8 33.5 29.5
Two or moreminority races . . . 424 25.7 23.5 11.4 424 24.8 27.5 15.9 97 38.1 19.9 55.4
Joint . . . . . . . . . . . . . . . . . 8,971 7.1 11.0 9.9 5,421 8.2 13.5 11.3 1,466 27.2 31.8 28.6Race missing . . . . . . . . . 76,434 11.5 14.1 10.6 64,341 15.5 22.2 13.5 13,877 41.1 40.0 32.0Hispanic white . . . . . . . 40,643 16.8 15.4 10.9 28,011 17.9 18.1 13.3 7,522 49.4 40.1 34.5Non-Hispanic white . . 502,030 9.4 9.4 9.4 330,979 10.9 10.9 10.9 81,408 30.2 30.2 30.2
SexOne male . . . . . . . . . . . . 219,700 17.7 17.7 17.7 161,011 17.9 17.9 17.9 39,283 42.5 42.5 42.5One female . . . . . . . . . . 111,338 17.4 16.9 16.9 85,278 19.8 19.8 18.4 20,416 43.0 42.5 43.1Two males . . . . . . . . . . . 19,437 8.3 8.3 8.3 9,083 7.9 7.9 7.9 2,526 27.2 27.2 27.2Two females . . . . . . . . . 6,428 7.6 6.8 7.9 3,307 12.0 9.3 10.2 984 35.6 33.5 32.0
Note: See note to table 10.A. 1. ‘‘Other’’ consists of government-backed loans of all types, junior liens,home-improvement loans, and unsecured loans.
New Information Reported under HMDA and Its Application in Fair Lending Enforcement 379
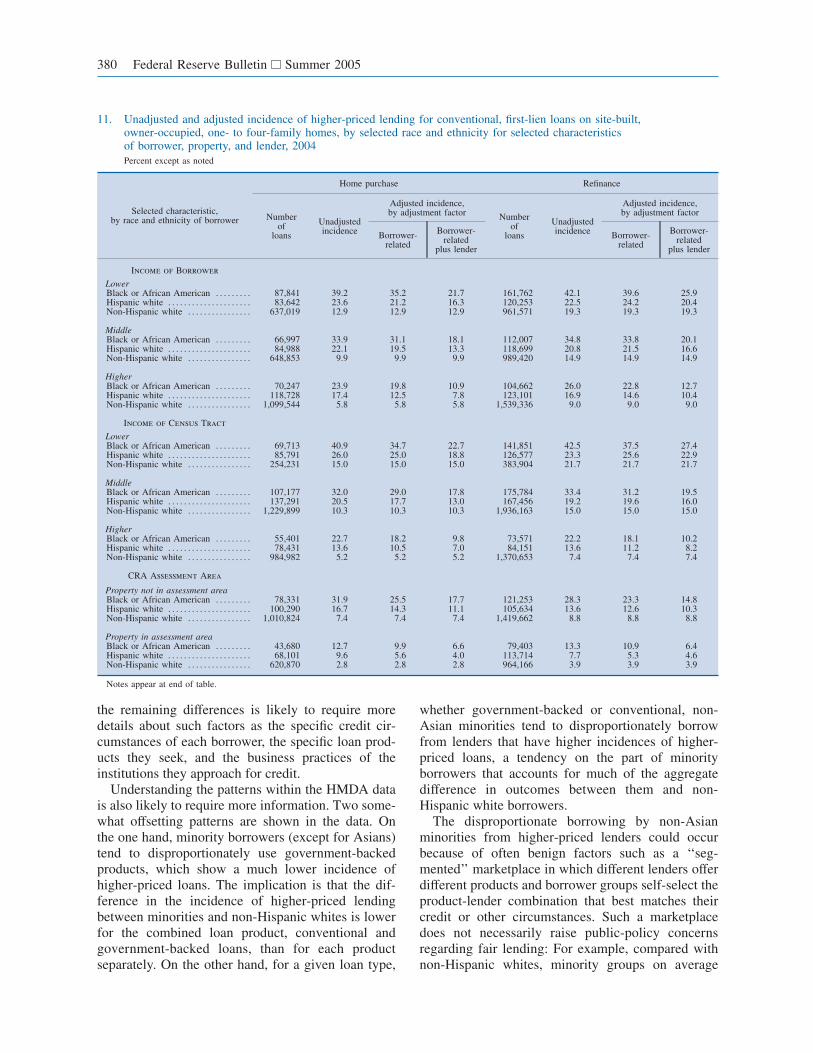
the remaining differences is likely to require moredetails about such factors as the specific credit cir-cumstances of each borrower, the specific loan prod-ucts they seek, and the business practices of theinstitutions they approach for credit.
Understanding the patterns within the HMDA datais also likely to require more information. Two some-what offsetting patterns are shown in the data. Onthe one hand, minority borrowers (except for Asians)tend to disproportionately use government-backedproducts, which show a much lower incidence ofhigher-priced loans. The implication is that the dif-ference in the incidence of higher-priced lendingbetween minorities and non-Hispanic whites is lowerfor the combined loan product, conventional andgovernment-backed loans, than for each productseparately. On the other hand, for a given loan type,
whether government-backed or conventional, non-Asian minorities tend to disproportionately borrowfrom lenders that have higher incidences of higher-priced loans, a tendency on the part of minorityborrowers that accounts for much of the aggregatedifference in outcomes between them and non-Hispanic white borrowers.
The disproportionate borrowing by non-Asianminorities from higher-priced lenders could occurbecause of often benign factors such as a ‘‘seg-mented’’ marketplace in which different lenders offerdifferent products and borrower groups self-select theproduct-lender combination that best matches theircredit or other circumstances. Such a marketplacedoes not necessarily raise public-policy concernsregarding fair lending: For example, compared withnon-Hispanic whites, minority groups on average
11. Unadjusted and adjusted incidence of higher-priced lending for conventional, first-lien loans on site-built,owner-occupied, one- to four-family homes, by selected race and ethnicity for selected characteristicsof borrower, property, and lender, 2004Percent except as noted
Selected characteristic,by race and ethnicity of borrower
Home purchase Refinance
Numberof
loans
Unadjustedincidence
Adjusted incidence,by adjustment factor Number
ofloans
Unadjustedincidence
Adjusted incidence,by adjustment factor
Borrower-related
Borrower-related
plus lender
Borrower-related
Borrower-related
plus lender
Income of Borrower
LowerBlack or African American . . . . . . . . . 87,841 39.2 35.2 21.7 161,762 42.1 39.6 25.9Hispanic white . . . . . . . . . . . . . . . . . . . . . 83,642 23.6 21.2 16.3 120,253 22.5 24.2 20.4Non-Hispanic white . . . . . . . . . . . . . . . . 637,019 12.9 12.9 12.9 961,571 19.3 19.3 19.3
MiddleBlack or African American . . . . . . . . . 66,997 33.9 31.1 18.1 112,007 34.8 33.8 20.1Hispanic white . . . . . . . . . . . . . . . . . . . . . 84,988 22.1 19.5 13.3 118,699 20.8 21.5 16.6Non-Hispanic white . . . . . . . . . . . . . . . . 648,853 9.9 9.9 9.9 989,420 14.9 14.9 14.9
HigherBlack or African American . . . . . . . . . 70,247 23.9 19.8 10.9 104,662 26.0 22.8 12.7Hispanic white . . . . . . . . . . . . . . . . . . . . . 118,728 17.4 12.5 7.8 123,101 16.9 14.6 10.4Non-Hispanic white . . . . . . . . . . . . . . . . 1,099,544 5.8 5.8 5.8 1,539,336 9.0 9.0 9.0
Income of Census Tract
LowerBlack or African American . . . . . . . . . 69,713 40.9 34.7 22.7 141,851 42.5 37.5 27.4Hispanic white . . . . . . . . . . . . . . . . . . . . . 85,791 26.0 25.0 18.8 126,577 23.3 25.6 22.9Non-Hispanic white . . . . . . . . . . . . . . . . 254,231 15.0 15.0 15.0 383,904 21.7 21.7 21.7
MiddleBlack or African American . . . . . . . . . 107,177 32.0 29.0 17.8 175,784 33.4 31.2 19.5Hispanic white . . . . . . . . . . . . . . . . . . . . . 137,291 20.5 17.7 13.0 167,456 19.2 19.6 16.0Non-Hispanic white . . . . . . . . . . . . . . . . 1,229,899 10.3 10.3 10.3 1,936,163 15.0 15.0 15.0
HigherBlack or African American . . . . . . . . . 55,401 22.7 18.2 9.8 73,571 22.2 18.1 10.2Hispanic white . . . . . . . . . . . . . . . . . . . . . 78,431 13.6 10.5 7.0 84,151 13.6 11.2 8.2Non-Hispanic white . . . . . . . . . . . . . . . . 984,982 5.2 5.2 5.2 1,370,653 7.4 7.4 7.4
CRA Assessment Area
Property not in assessment areaBlack or African American . . . . . . . . . 78,331 31.9 25.5 17.7 121,253 28.3 23.3 14.8Hispanic white . . . . . . . . . . . . . . . . . . . . . 100,290 16.7 14.3 11.1 105,634 13.6 12.6 10.3Non-Hispanic white . . . . . . . . . . . . . . . . 1,010,824 7.4 7.4 7.4 1,419,662 8.8 8.8 8.8
Property in assessment areaBlack or African American . . . . . . . . . 43,680 12.7 9.9 6.6 79,403 13.3 10.9 6.4Hispanic white . . . . . . . . . . . . . . . . . . . . . 68,101 9.6 5.6 4.0 113,714 7.7 5.3 4.6Non-Hispanic white . . . . . . . . . . . . . . . . 620,870 2.8 2.8 2.8 964,166 3.9 3.9 3.9
Notes appear at end of table.
380 Federal Reserve Bulletin Summer 2005
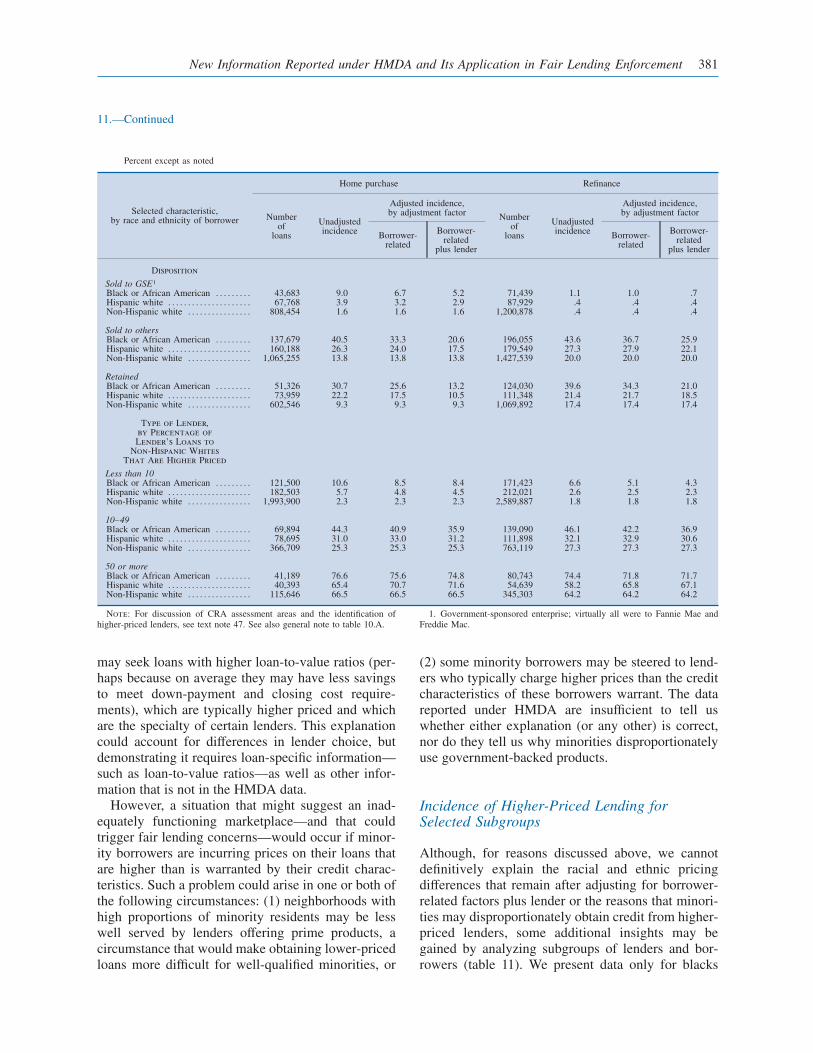
may seek loans with higher loan-to-value ratios (per-haps because on average they may have less savingsto meet down-payment and closing cost require-ments), which are typically higher priced and whichare the specialty of certain lenders. This explanationcould account for differences in lender choice, butdemonstrating it requires loan-specific information—such as loan-to-value ratios—as well as other infor-mation that is not in the HMDA data.
However, a situation that might suggest an inad-equately functioning marketplace—and that couldtrigger fair lending concerns—would occur if minor-ity borrowers are incurring prices on their loans thatare higher than is warranted by their credit charac-teristics. Such a problem could arise in one or both ofthe following circumstances: (1) neighborhoods withhigh proportions of minority residents may be lesswell served by lenders offering prime products, acircumstance that would make obtaining lower-pricedloans more difficult for well-qualified minorities, or
(2) some minority borrowers may be steered to lend-ers who typically charge higher prices than the creditcharacteristics of these borrowers warrant. The datareported under HMDA are insufficient to tell uswhether either explanation (or any other) is correct,nor do they tell us why minorities disproportionatelyuse government-backed products.
Incidence of Higher-Priced Lending forSelected Subgroups
Although, for reasons discussed above, we cannotdefinitively explain the racial and ethnic pricingdifferences that remain after adjusting for borrower-related factors plus lender or the reasons that minori-ties may disproportionately obtain credit from higher-priced lenders, some additional insights may begained by analyzing subgroups of lenders and bor-rowers (table 11). We present data only for blacks
11.—Continued
Percent except as noted
Selected characteristic,by race and ethnicity of borrower
Home purchase Refinance
Numberof
loans
Unadjustedincidence
Adjusted incidence,by adjustment factor Number
ofloans
Unadjustedincidence
Adjusted incidence,by adjustment factor
Borrower-related
Borrower-related
plus lender
Borrower-related
Borrower-related
plus lender
Disposition
Sold to GSE1
Black or African American . . . . . . . . . 43,683 9.0 6.7 5.2 71,439 1.1 1.0 .7Hispanic white . . . . . . . . . . . . . . . . . . . . . 67,768 3.9 3.2 2.9 87,929 .4 .4 .4Non-Hispanic white . . . . . . . . . . . . . . . . 808,454 1.6 1.6 1.6 1,200,878 .4 .4 .4
Sold to othersBlack or African American . . . . . . . . . 137,679 40.5 33.3 20.6 196,055 43.6 36.7 25.9Hispanic white . . . . . . . . . . . . . . . . . . . . . 160,188 26.3 24.0 17.5 179,549 27.3 27.9 22.1Non-Hispanic white . . . . . . . . . . . . . . . . 1,065,255 13.8 13.8 13.8 1,427,539 20.0 20.0 20.0
RetainedBlack or African American . . . . . . . . . 51,326 30.7 25.6 13.2 124,030 39.6 34.3 21.0Hispanic white . . . . . . . . . . . . . . . . . . . . . 73,959 22.2 17.5 10.5 111,348 21.4 21.7 18.5Non-Hispanic white . . . . . . . . . . . . . . . . 602,546 9.3 9.3 9.3 1,069,892 17.4 17.4 17.4
Type of Lender,by Percentage ofLender’s Loans to
Non-Hispanic WhitesThat Are Higher Priced
Less than 10Black or African American . . . . . . . . . 121,500 10.6 8.5 8.4 171,423 6.6 5.1 4.3Hispanic white . . . . . . . . . . . . . . . . . . . . . 182,503 5.7 4.8 4.5 212,021 2.6 2.5 2.3Non-Hispanic white . . . . . . . . . . . . . . . . 1,993,900 2.3 2.3 2.3 2,589,887 1.8 1.8 1.8
10–49Black or African American . . . . . . . . . 69,894 44.3 40.9 35.9 139,090 46.1 42.2 36.9Hispanic white . . . . . . . . . . . . . . . . . . . . . 78,695 31.0 33.0 31.2 111,898 32.1 32.9 30.6Non-Hispanic white . . . . . . . . . . . . . . . . 366,709 25.3 25.3 25.3 763,119 27.3 27.3 27.3
50 or moreBlack or African American . . . . . . . . . 41,189 76.6 75.6 74.8 80,743 74.4 71.8 71.7Hispanic white . . . . . . . . . . . . . . . . . . . . . 40,393 65.4 70.7 71.6 54,639 58.2 65.8 67.1Non-Hispanic white . . . . . . . . . . . . . . . . 115,646 66.5 66.5 66.5 345,303 64.2 64.2 64.2
Note: For discussion of CRA assessment areas and the identification ofhigher-priced lenders, see text note 47. See also general note to table 10.A.
1. Government-sponsored enterprise; virtually all were to Fannie Mae andFreddie Mac.
New Information Reported under HMDA and Its Application in Fair Lending Enforcement 381
and Hispanic whites because they are the two minor-ity groups whose outcomes differ most from those ofnon-Hispanic whites in the incidence of higher-pricedlending. We also restrict the comparison to the twoloan-products that account for the largest number ofloans—conventional home-purchase loans and refi-nancings. We analyze these two minority groups andthe two loan products with regard to five factors:(1) the borrower’s relative income; (2) the relativeincome of the census tract in which the propertyrelated to the loan is located; (3) the location of theproperty relative to the lender’s assessment area asdefined under the Community Reinvestment Act of1977 (CRA); (4) the disposition of the loan—that is,whether the loan was retained or sold and, if it wassold, to whom; and (5) the proportion of the lender’sloans that are higher priced (less than 10 percent,10–49 percent, or 50 percent or more—the last pro-portion being taken to indicate that the lender special-izes in higher-priced lending).47
Results for borrowers grouped by their relativeincome and their census tract income classificationoffer little evidence that unexplained racial differ-ences in pricing or lender choice vary by income.Although the incidence of higher-priced loans ishigher for lower-income borrowers and those wholive in lower-income census tracts, the same istrue for all three racial groups. Thus, although unex-plained price differences are somewhat lower forhigher-income borrowers, price patterns are generallysimilar to those of the overall decompositions.
The decompositions for CRA assessment area andloan sales provide evidence on whether the channelthrough which a loan was obtained and the subse-quent disposition of the loan affect racial or ethnicgroups differently. Although the overall incidence ofhigher-priced loans reported in the 2004 HMDA datais much lower for loans sold to the GSEs, the dataoffer scant evidence that the disposition (sold orretained) is related to unexplained racial differences.
However, whether the loan was originated by aninstitution in its CRA assessment area does matter.
Differences across groups for lending within anassessment area are about one-third of those for lend-ing outside the assessment area. Moreover, for allracial and ethnic groups, lending within an assess-ment area exhibits a much lower incidence of higher-priced lending.
One possible explanation for the assessment-areaeffect may be that the channel through which loansare originated matters. Loans extended to borrowersoutside an institution’s assessment area may be morelikely to have come through mortgage brokers, whomay price differently or who operate in areas withdifferent market conditions than do institutions thatoriginate loans directly. Although this pattern maysuggest that brokers charge higher prices, particularlyto minorities, it is not necessarily evidence of unfairtreatment or that the existence of the broker channeladversely affects minorities. It may indicate thatbrokers serve markets or individuals who are morecostly to serve, or whose credit profiles are weaker,and price accordingly. If so, then were it not forbroker activity, some of these borrowers might not beserved at all or might pay higher prices. Determiningwhether brokers treat minority borrowers fairly isa complex undertaking and requires informationunavailable in the HMDA data. The same can be saidabout lenders that originate loans through differentchannels.
Finally, although the aggregate lending patterns ofspecialists in higher-priced lending exhibit unex-plained racial or ethnic differences, so do the aggre-gate patterns of other lenders to approximately thesame degree. And for the higher-priced specialistswith the highest incidence of higher-priced lending,differences across racial and ethnic groups are, insome instances, lower than for other lenders. Regard-ing the racial and ethnic differences in the lendingpatterns that do exist among higher-priced lendingspecialists, the analysis shows that income, loanamount, and other HMDA factors appear to explainlittle of those differences.
Differences in Mean Price Spreads acrossRacial and Ethnic Groups
Patterns across racial and ethnic groups for the meanspreads paid by those with higher-priced loans arequite different from patterns across such groups forthe incidence of higher-priced lending (table 12). Forthe loan products with the largest numbers of borrow-ers, the unadjusted mean spreads are lower for allminority groups except blacks than they are for non-Hispanic whites. Typically, Asian borrowers have the
47. Larger depository institutions covered by the CRA (generallythose with assets of $250 million or more) are required to identify thecensus tracts in their CRA assessment areas as of the end of eachcalendar year. That information was used to determine which loans inthe HMDA data were for properties within the lenders’ CRA assess-ment areas. When lenders were part of a bank holding company, thecombined assessment areas of all banks in the holding company wereused for the analysis. For a definition of ‘‘assessment area,’’ see note 4to box ‘‘Reasons for Loan Price Variation.’’
The identification of specialists in high-priced lending was basedsolely on the incidence of higher-priced loans for non-Hispanic whites.This restriction prevented the identification from being affected bydifferences between the pricing outcomes of blacks and Hispanics, onthe one hand, and those of non-Hispanic whites, on the other.
382 Federal Reserve Bulletin Summer 2005
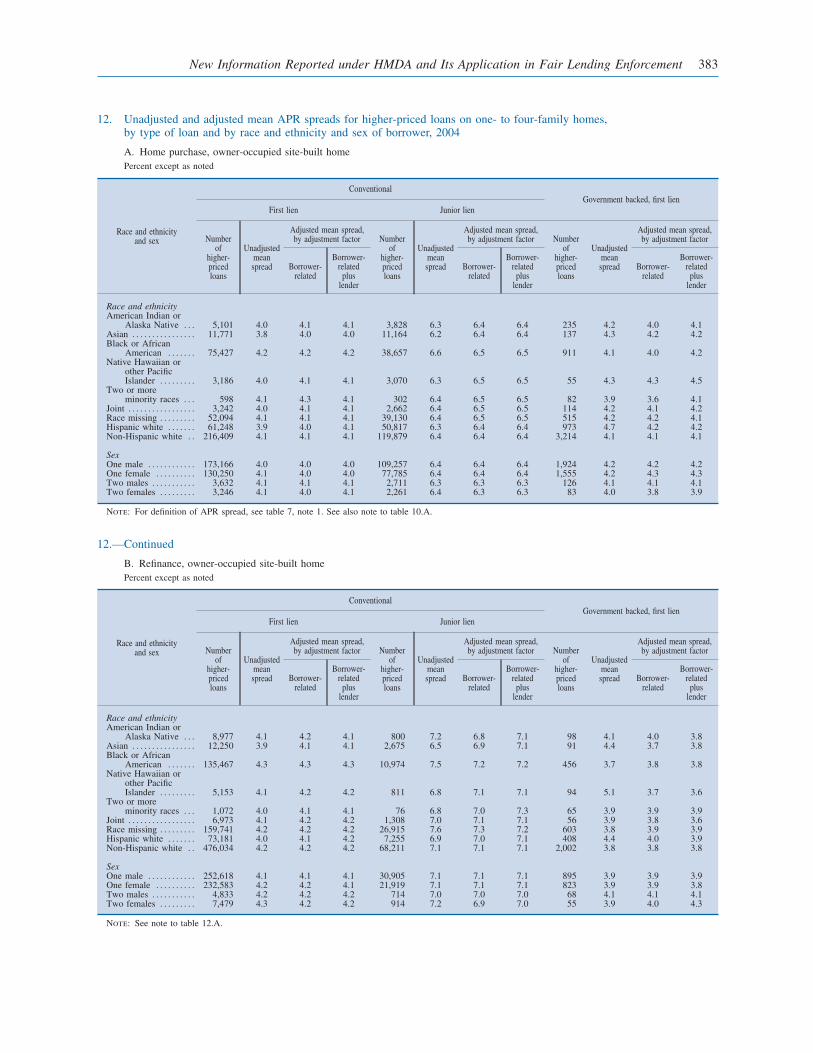
12. Unadjusted and adjusted mean APR spreads for higher-priced loans on one- to four-family homes,by type of loan and by race and ethnicity and sex of borrower, 2004
A. Home purchase, owner-occupied site-built homePercent except as noted
Race and ethnicityand sex
ConventionalGovernment backed, first lien
First lien Junior lien
Numberof
higher-pricedloans
Unadjustedmeanspread
Adjusted mean spread,by adjustment factor Number
ofhigher-pricedloans
Unadjustedmeanspread
Adjusted mean spread,by adjustment factor Number
ofhigher-pricedloans
Unadjustedmeanspread
Adjusted mean spread,by adjustment factor
Borrower-related
Borrower-related
pluslender
Borrower-related
Borrower-related
pluslender
Borrower-related
Borrower-related
pluslender
Race and ethnicityAmerican Indian or
Alaska Native . . . 5,101 4.0 4.1 4.1 3,828 6.3 6.4 6.4 235 4.2 4.0 4.1Asian . . . . . . . . . . . . . . . . 11,771 3.8 4.0 4.0 11,164 6.2 6.4 6.4 137 4.3 4.2 4.2Black or African
American . . . . . . . 75,427 4.2 4.2 4.2 38,657 6.6 6.5 6.5 911 4.1 4.0 4.2Native Hawaiian or
other PacificIslander . . . . . . . . . 3,186 4.0 4.1 4.1 3,070 6.3 6.5 6.5 55 4.3 4.3 4.5
Two or moreminority races . . . 598 4.1 4.3 4.1 302 6.4 6.5 6.5 82 3.9 3.6 4.1
Joint . . . . . . . . . . . . . . . . . 3,242 4.0 4.1 4.1 2,662 6.4 6.5 6.5 114 4.2 4.1 4.2Race missing . . . . . . . . . 52,094 4.1 4.1 4.1 39,130 6.4 6.5 6.5 515 4.2 4.2 4.1Hispanic white . . . . . . . 61,248 3.9 4.0 4.1 50,817 6.3 6.4 6.4 973 4.7 4.2 4.2Non-Hispanic white . . 216,409 4.1 4.1 4.1 119,879 6.4 6.4 6.4 3,214 4.1 4.1 4.1
SexOne male . . . . . . . . . . . . 173,166 4.0 4.0 4.0 109,257 6.4 6.4 6.4 1,924 4.2 4.2 4.2One female . . . . . . . . . . 130,250 4.1 4.0 4.0 77,785 6.4 6.4 6.4 1,555 4.2 4.3 4.3Two males . . . . . . . . . . . 3,632 4.1 4.1 4.1 2,711 6.3 6.3 6.3 126 4.1 4.1 4.1Two females . . . . . . . . . 3,246 4.1 4.0 4.1 2,261 6.4 6.3 6.3 83 4.0 3.8 3.9
Note: For definition of APR spread, see table 7, note 1. See also note to table 10.A.
12.—Continued
B. Refinance, owner-occupied site-built homePercent except as noted
Race and ethnicityand sex
ConventionalGovernment backed, first lien
First lien Junior lien
Numberof
higher-pricedloans
Unadjustedmeanspread
Adjusted mean spread,by adjustment factor Number
ofhigher-pricedloans
Unadjustedmeanspread
Adjusted mean spread,by adjustment factor Number
ofhigher-pricedloans
Unadjustedmeanspread
Adjusted mean spread,by adjustment factor
Borrower-related
Borrower-related
pluslender
Borrower-related
Borrower-related
pluslender
Borrower-related
Borrower-related
pluslender
Race and ethnicityAmerican Indian or
Alaska Native . . . 8,977 4.1 4.2 4.1 800 7.2 6.8 7.1 98 4.1 4.0 3.8Asian . . . . . . . . . . . . . . . . 12,250 3.9 4.1 4.1 2,675 6.5 6.9 7.1 91 4.4 3.7 3.8Black or African
American . . . . . . . 135,467 4.3 4.3 4.3 10,974 7.5 7.2 7.2 456 3.7 3.8 3.8Native Hawaiian or
other PacificIslander . . . . . . . . . 5,153 4.1 4.2 4.2 811 6.8 7.1 7.1 94 5.1 3.7 3.6
Two or moreminority races . . . 1,072 4.0 4.1 4.1 76 6.8 7.0 7.3 65 3.9 3.9 3.9
Joint . . . . . . . . . . . . . . . . . 6,973 4.1 4.2 4.2 1,308 7.0 7.1 7.1 56 3.9 3.8 3.6Race missing . . . . . . . . . 159,741 4.2 4.2 4.2 26,915 7.6 7.3 7.2 603 3.8 3.9 3.9Hispanic white . . . . . . . 73,181 4.0 4.1 4.2 7,255 6.9 7.0 7.1 408 4.4 4.0 3.9Non-Hispanic white . . 476,034 4.2 4.2 4.2 68,211 7.1 7.1 7.1 2,002 3.8 3.8 3.8
SexOne male . . . . . . . . . . . . 252,618 4.1 4.1 4.1 30,905 7.1 7.1 7.1 895 3.9 3.9 3.9One female . . . . . . . . . . 232,583 4.2 4.2 4.1 21,919 7.1 7.1 7.1 823 3.9 3.9 3.8Two males . . . . . . . . . . . 4,833 4.2 4.2 4.2 714 7.0 7.0 7.0 68 4.1 4.1 4.1Two females . . . . . . . . . 7,479 4.3 4.2 4.2 914 7.2 6.9 7.0 55 3.9 4.0 4.3
Note: See note to table 12.A.
New Information Reported under HMDA and Its Application in Fair Lending Enforcement 383
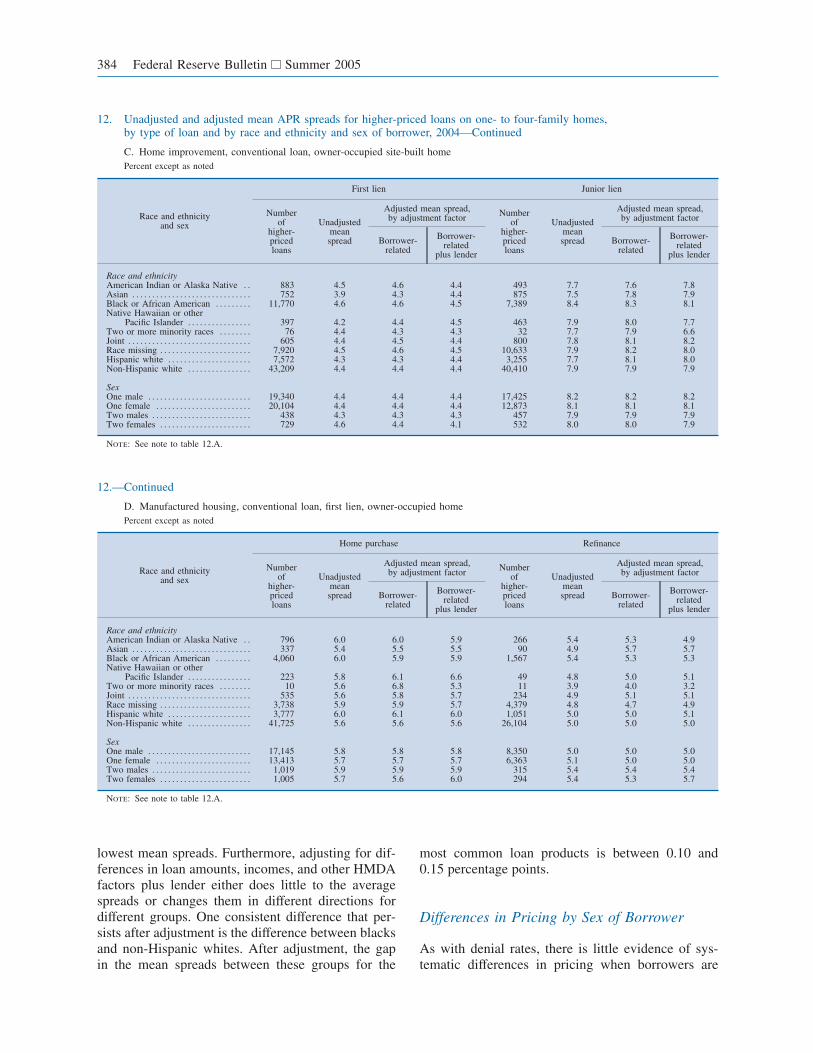
lowest mean spreads. Furthermore, adjusting for dif-ferences in loan amounts, incomes, and other HMDAfactors plus lender either does little to the averagespreads or changes them in different directions fordifferent groups. One consistent difference that per-sists after adjustment is the difference between blacksand non-Hispanic whites. After adjustment, the gapin the mean spreads between these groups for the
most common loan products is between 0.10 and0.15 percentage points.
Differences in Pricing by Sex of Borrower
As with denial rates, there is little evidence of sys-tematic differences in pricing when borrowers are
12. Unadjusted and adjusted mean APR spreads for higher-priced loans on one- to four-family homes,by type of loan and by race and ethnicity and sex of borrower, 2004—Continued
C. Home improvement, conventional loan, owner-occupied site-built homePercent except as noted
Race and ethnicityand sex
First lien Junior lien
Numberof
higher-pricedloans
Unadjustedmeanspread
Adjusted mean spread,by adjustment factor Number
ofhigher-pricedloans
Unadjustedmeanspread
Adjusted mean spread,by adjustment factor
Borrower-related
Borrower-related
plus lender
Borrower-related
Borrower-related
plus lender
Race and ethnicityAmerican Indian or Alaska Native . . 883 4.5 4.6 4.4 493 7.7 7.6 7.8Asian . . . . . . . . . . . . . . . . . . . . . . . . . . . . . . 752 3.9 4.3 4.4 875 7.5 7.8 7.9Black or African American . . . . . . . . . 11,770 4.6 4.6 4.5 7,389 8.4 8.3 8.1Native Hawaiian or other
Pacific Islander . . . . . . . . . . . . . . . . 397 4.2 4.4 4.5 463 7.9 8.0 7.7Two or more minority races . . . . . . . . 76 4.4 4.3 4.3 32 7.7 7.9 6.6Joint . . . . . . . . . . . . . . . . . . . . . . . . . . . . . . . 605 4.4 4.5 4.4 800 7.8 8.1 8.2Race missing . . . . . . . . . . . . . . . . . . . . . . . 7,920 4.5 4.6 4.5 10,633 7.9 8.2 8.0Hispanic white . . . . . . . . . . . . . . . . . . . . . 7,572 4.3 4.3 4.4 3,255 7.7 8.1 8.0Non-Hispanic white . . . . . . . . . . . . . . . . 43,209 4.4 4.4 4.4 40,410 7.9 7.9 7.9
SexOne male . . . . . . . . . . . . . . . . . . . . . . . . . . 19,340 4.4 4.4 4.4 17,425 8.2 8.2 8.2One female . . . . . . . . . . . . . . . . . . . . . . . . 20,104 4.4 4.4 4.4 12,873 8.1 8.1 8.1Two males . . . . . . . . . . . . . . . . . . . . . . . . . 438 4.3 4.3 4.3 457 7.9 7.9 7.9Two females . . . . . . . . . . . . . . . . . . . . . . . 729 4.6 4.4 4.1 532 8.0 8.0 7.9
Note: See note to table 12.A.
12.—Continued
D. Manufactured housing, conventional loan, first lien, owner-occupied homePercent except as noted
Race and ethnicityand sex
Home purchase Refinance
Numberof
higher-pricedloans
Unadjustedmeanspread
Adjusted mean spread,by adjustment factor Number
ofhigher-pricedloans
Unadjustedmeanspread
Adjusted mean spread,by adjustment factor
Borrower-related
Borrower-related
plus lender
Borrower-related
Borrower-related
plus lender
Race and ethnicityAmerican Indian or Alaska Native . . 796 6.0 6.0 5.9 266 5.4 5.3 4.9Asian . . . . . . . . . . . . . . . . . . . . . . . . . . . . . . 337 5.4 5.5 5.5 90 4.9 5.7 5.7Black or African American . . . . . . . . . 4,060 6.0 5.9 5.9 1,567 5.4 5.3 5.3Native Hawaiian or other
Pacific Islander . . . . . . . . . . . . . . . . 223 5.8 6.1 6.6 49 4.8 5.0 5.1Two or more minority races . . . . . . . . 10 5.6 6.8 5.3 11 3.9 4.0 3.2Joint . . . . . . . . . . . . . . . . . . . . . . . . . . . . . . . 535 5.6 5.8 5.7 234 4.9 5.1 5.1Race missing . . . . . . . . . . . . . . . . . . . . . . . 3,738 5.9 5.9 5.7 4,379 4.8 4.7 4.9Hispanic white . . . . . . . . . . . . . . . . . . . . . 3,777 6.0 6.1 6.0 1,051 5.0 5.0 5.1Non-Hispanic white . . . . . . . . . . . . . . . . 41,725 5.6 5.6 5.6 26,104 5.0 5.0 5.0
SexOne male . . . . . . . . . . . . . . . . . . . . . . . . . . 17,145 5.8 5.8 5.8 8,350 5.0 5.0 5.0One female . . . . . . . . . . . . . . . . . . . . . . . . 13,413 5.7 5.7 5.7 6,363 5.1 5.0 5.0Two males . . . . . . . . . . . . . . . . . . . . . . . . . 1,019 5.9 5.9 5.9 315 5.4 5.4 5.4Two females . . . . . . . . . . . . . . . . . . . . . . . 1,005 5.7 5.6 6.0 294 5.4 5.3 5.7
Note: See note to table 12.A.
384 Federal Reserve Bulletin Summer 2005
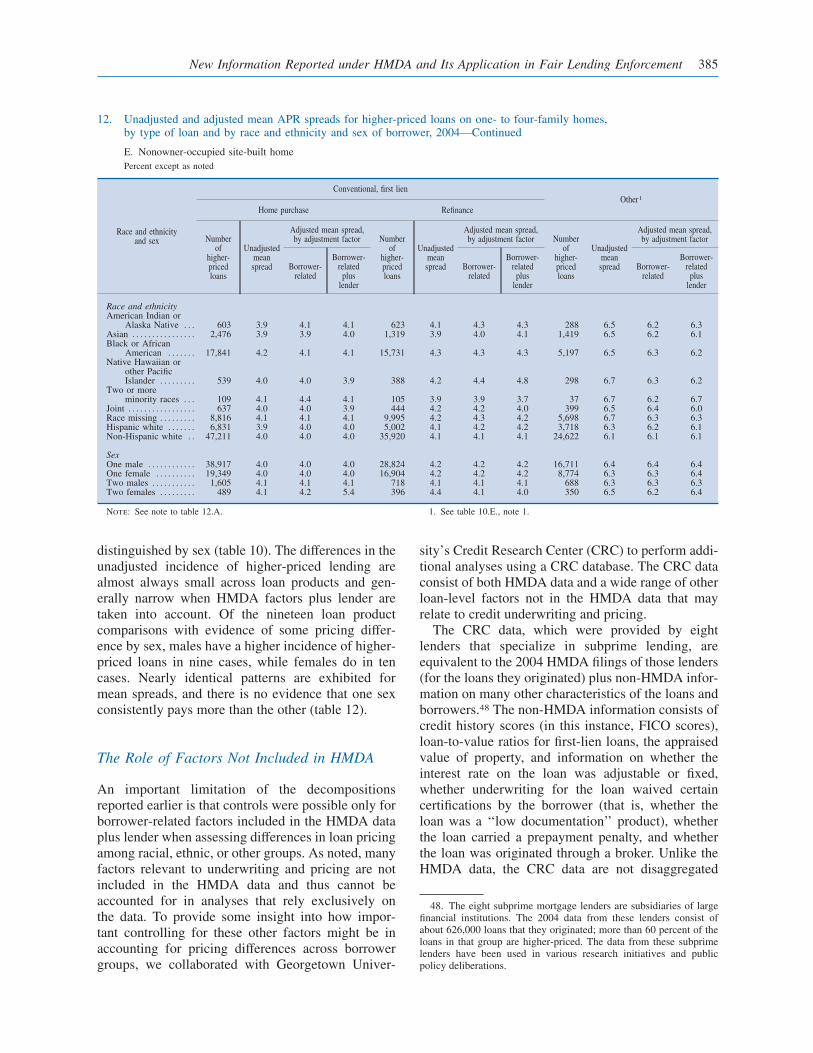
distinguished by sex (table 10). The differences in theunadjusted incidence of higher-priced lending arealmost always small across loan products and gen-erally narrow when HMDA factors plus lender aretaken into account. Of the nineteen loan productcomparisons with evidence of some pricing differ-ence by sex, males have a higher incidence of higher-priced loans in nine cases, while females do in tencases. Nearly identical patterns are exhibited formean spreads, and there is no evidence that one sexconsistently pays more than the other (table 12).
The Role of Factors Not Included in HMDA
An important limitation of the decompositionsreported earlier is that controls were possible only forborrower-related factors included in the HMDA dataplus lender when assessing differences in loan pricingamong racial, ethnic, or other groups. As noted, manyfactors relevant to underwriting and pricing are notincluded in the HMDA data and thus cannot beaccounted for in analyses that rely exclusively onthe data. To provide some insight into how impor-tant controlling for these other factors might be inaccounting for pricing differences across borrowergroups, we collaborated with Georgetown Univer-
sity’s Credit Research Center (CRC) to perform addi-tional analyses using a CRC database. The CRC dataconsist of both HMDA data and a wide range of otherloan-level factors not in the HMDA data that mayrelate to credit underwriting and pricing.
The CRC data, which were provided by eightlenders that specialize in subprime lending, areequivalent to the 2004 HMDA filings of those lenders(for the loans they originated) plus non-HMDA infor-mation on many other characteristics of the loans andborrowers.48 The non-HMDA information consists ofcredit history scores (in this instance, FICO scores),loan-to-value ratios for first-lien loans, the appraisedvalue of property, and information on whether theinterest rate on the loan was adjustable or fixed,whether underwriting for the loan waived certaincertifications by the borrower (that is, whether theloan was a ‘‘low documentation’’ product), whetherthe loan carried a prepayment penalty, and whetherthe loan was originated through a broker. Unlike theHMDA data, the CRC data are not disaggregated
48. The eight subprime mortgage lenders are subsidiaries of largefinancial institutions. The 2004 data from these lenders consist ofabout 626,000 loans that they originated; more than 60 percent of theloans in that group are higher-priced. The data from these subprimelenders have been used in various research initiatives and publicpolicy deliberations.
12. Unadjusted and adjusted mean APR spreads for higher-priced loans on one- to four-family homes,by type of loan and by race and ethnicity and sex of borrower, 2004—Continued
E. Nonowner-occupied site-built homePercent except as noted
Race and ethnicityand sex
Conventional, first lienOther1
Home purchase Refinance
Numberof
higher-pricedloans
Unadjustedmeanspread
Adjusted mean spread,by adjustment factor Number
ofhigher-pricedloans
Unadjustedmeanspread
Adjusted mean spread,by adjustment factor Number
ofhigher-pricedloans
Unadjustedmeanspread
Adjusted mean spread,by adjustment factor
Borrower-related
Borrower-related
pluslender
Borrower-related
Borrower-related
pluslender
Borrower-related
Borrower-related
pluslender
Race and ethnicityAmerican Indian or
Alaska Native . . . 603 3.9 4.1 4.1 623 4.1 4.3 4.3 288 6.5 6.2 6.3Asian . . . . . . . . . . . . . . . . 2,476 3.9 3.9 4.0 1,319 3.9 4.0 4.1 1,419 6.5 6.2 6.1Black or African
American . . . . . . . 17,841 4.2 4.1 4.1 15,731 4.3 4.3 4.3 5,197 6.5 6.3 6.2Native Hawaiian or
other PacificIslander . . . . . . . . . 539 4.0 4.0 3.9 388 4.2 4.4 4.8 298 6.7 6.3 6.2
Two or moreminority races . . . 109 4.1 4.4 4.1 105 3.9 3.9 3.7 37 6.7 6.2 6.7
Joint . . . . . . . . . . . . . . . . . 637 4.0 4.0 3.9 444 4.2 4.2 4.0 399 6.5 6.4 6.0Race missing . . . . . . . . . 8,816 4.1 4.1 4.1 9,995 4.2 4.3 4.2 5,698 6.7 6.3 6.3Hispanic white . . . . . . . 6,831 3.9 4.0 4.0 5,002 4.1 4.2 4.2 3,718 6.3 6.2 6.1Non-Hispanic white . . 47,211 4.0 4.0 4.0 35,920 4.1 4.1 4.1 24,622 6.1 6.1 6.1
SexOne male . . . . . . . . . . . . 38,917 4.0 4.0 4.0 28,824 4.2 4.2 4.2 16,711 6.4 6.4 6.4One female . . . . . . . . . . 19,349 4.0 4.0 4.0 16,904 4.2 4.2 4.2 8,774 6.3 6.3 6.4Two males . . . . . . . . . . . 1,605 4.1 4.1 4.1 718 4.1 4.1 4.1 688 6.3 6.3 6.3Two females . . . . . . . . . 489 4.1 4.2 5.4 396 4.4 4.1 4.0 350 6.5 6.2 6.4
Note: See note to table 12.A. 1. See table 10.E., note 1.
New Information Reported under HMDA and Its Application in Fair Lending Enforcement 385

by individual lender; consequently, the analysis ofthe data could not control for lender. Together, theeight lenders accounted for about 22 percent of thehigher-priced conventional first- or junior-lien home-purchase or refinance loans related to owner-occupiedproperties reported by HMDA filers for 2004.
The CRC analyzed pricing differences among thecombined filings of the eight lenders in a manneridentical to that used to prepare table 10—that is,using only data reported in HMDA—and then itextended the adjustment of differences by using thenon-HMDA items in its database.49 The number ofloans in the CRC database was sufficient to allowmeaningful analysis of conventional home-purchaseand refinance loans on one- to four-family, site-built,owner-occupied homes for two minority groups—
blacks and Hispanic whites—and for non-Hispanicwhites.
For pricing outcomes for conventional first-lienhome-purchase loans from the eight lenders, asadjusted for borrower-related factors (that is, usingonly the HMDA data), the incidence of higher-pricedlending differs between black and non-Hispanic whiteborrowers by 1.5 percentage points and between His-panic white and non-Hispanic white borrowers by0.3 percentage point (table 13). When additional fac-tors available only in the CRC data are taken intoaccount, the differences between black and non-Hispanic white borrowers and between Hispanicwhite and non-Hispanic white borrowers falls aboutone-third. For refinance loans, the 1.2 percentagepoint gap between black and non-Hispanic whiteborrowers that remains after controlling for HMDAdata items is removed when additional factors in theCRC database are controlled for. With respect tomean APR spreads for these loan products, gross
49. Only loans with complete information on all relevent factorswere used in the analysis. Loans with missing information for anyfactor had a somewhat lower incidence of higher-priced lending thandid the loans used in the analysis.
13. Loan pricing by eight subprime specialists, conventional first-lien loans on owner-occupiedone- to four-family homes, by type of loan and by selected race and ethnicity of borrower, 2004
A. Unadjusted and adjusted incidence of higher-priced lendingPercent except as noted
Race and ethnicity
Home purchase Refinance
Numberof loans
Unadjustedincidence
Adjusted incidence,by adjustment factor
Numberof loans
Unadjustedincidence
Adjusted incidence,by adjustment factor
Borrower-related
Borrower-related
plusnon-HMDA
creditfactors
Borrower-related
Borrower-related
plusnon-HMDA
creditfactors
Black or African American . . . . . . . . . 6,369 85.8 84.4 83.9 37,354 82.9 81.9 80.7Hispanic white . . . . . . . . . . . . . . . . . . . . . 6,110 72.6 83.2 83.1 12,800 71.7 78.8 80.9Non-Hispanic white . . . . . . . . . . . . . . . . 30,224 82.9 82.9 82.9 135,667 80.7 80.7 80.7
Note: Includes transition-period loans (those for which the application wassubmitted before 2004). For details on higher-priced lending, the subprime lend-ers, and the adjustment factors, see text and text note 49. For method of alloca-
tion into racial and ethnic categories and definitions of categories, see generalnote to table 6 and text note 35.
Source: Credit Research Center, Georgetown University.
13.—Continued
B. Unadjusted and adjusted mean APR spreads for higher-priced loansPercentage points except as noted
Race and ethnicity
Home purchase Refinance
Numberof
higher-pricedloans
Unadjustedspread
Adjusted spread,by adjustment factor
Numberof
higher-pricedloans
Unadjustedspread
Adjusted spread,by adjustment factor
Borrower-related
Borrower-related
plusnon-HMDA
creditfactors
Borrower-related
Borrower-related
plusnon-HMDA
creditfactors
Black or African American . . . . . . . . . 5,463 5.1 5.1 5.0 30,959 5.1 5.1 5.0Hispanic white . . . . . . . . . . . . . . . . . . . . . 4,437 4.7 4.9 4.9 9,183 4.7 4.8 4.9Non-Hispanic white . . . . . . . . . . . . . . . . 25,053 4.9 4.9 4.9 109,524 5.0 5.0 5.0
Note: For definition of APR spread, see table 7, note 1. See also notes totable 13.A.
386 Federal Reserve Bulletin Summer 2005
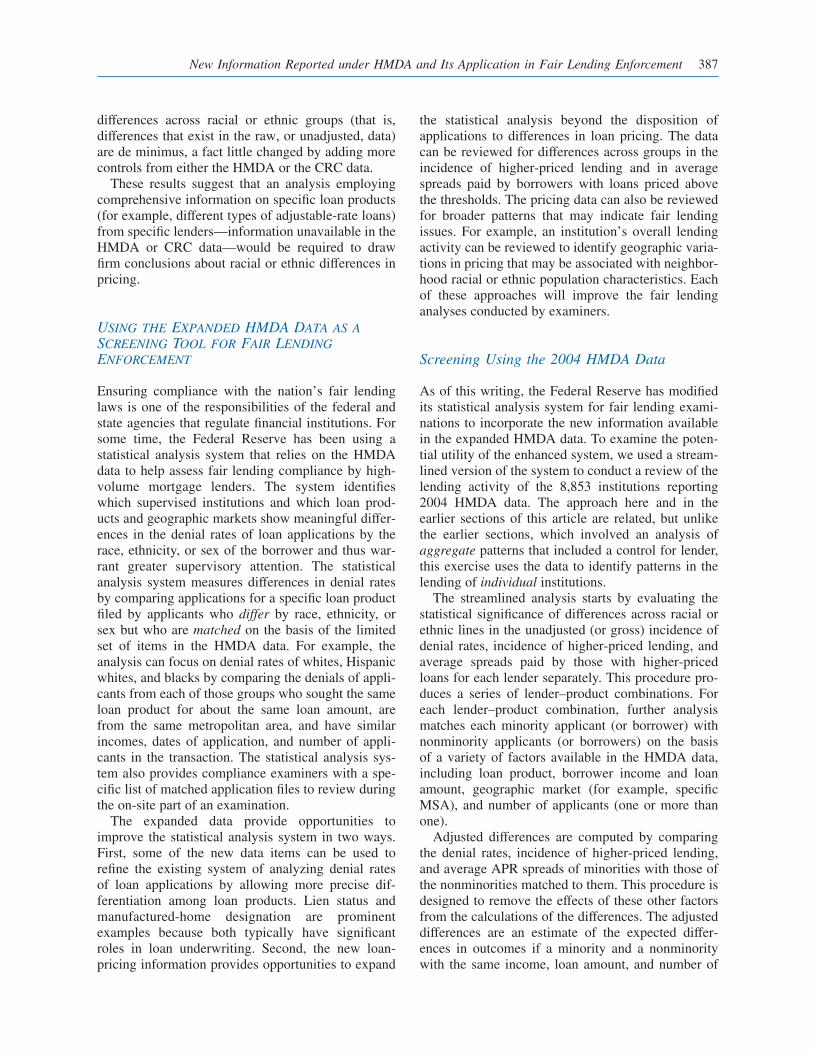
differences across racial or ethnic groups (that is,differences that exist in the raw, or unadjusted, data)are de minimus, a fact little changed by adding morecontrols from either the HMDA or the CRC data.
These results suggest that an analysis employingcomprehensive information on specific loan products(for example, different types of adjustable-rate loans)from specific lenders—information unavailable in theHMDA or CRC data—would be required to drawfirm conclusions about racial or ethnic differences inpricing.
USING THE EXPANDED HMDA DATA AS ASCREENING TOOL FOR FAIR LENDINGENFORCEMENT
Ensuring compliance with the nation’s fair lendinglaws is one of the responsibilities of the federal andstate agencies that regulate financial institutions. Forsome time, the Federal Reserve has been using astatistical analysis system that relies on the HMDAdata to help assess fair lending compliance by high-volume mortgage lenders. The system identifieswhich supervised institutions and which loan prod-ucts and geographic markets show meaningful differ-ences in the denial rates of loan applications by therace, ethnicity, or sex of the borrower and thus war-rant greater supervisory attention. The statisticalanalysis system measures differences in denial ratesby comparing applications for a specific loan productfiled by applicants who differ by race, ethnicity, orsex but who are matched on the basis of the limitedset of items in the HMDA data. For example, theanalysis can focus on denial rates of whites, Hispanicwhites, and blacks by comparing the denials of appli-cants from each of those groups who sought the sameloan product for about the same loan amount, arefrom the same metropolitan area, and have similarincomes, dates of application, and number of appli-cants in the transaction. The statistical analysis sys-tem also provides compliance examiners with a spe-cific list of matched application files to review duringthe on-site part of an examination.
The expanded data provide opportunities toimprove the statistical analysis system in two ways.First, some of the new data items can be used torefine the existing system of analyzing denial ratesof loan applications by allowing more precise dif-ferentiation among loan products. Lien status andmanufactured-home designation are prominentexamples because both typically have significantroles in loan underwriting. Second, the new loan-pricing information provides opportunities to expand
the statistical analysis beyond the disposition ofapplications to differences in loan pricing. The datacan be reviewed for differences across groups in theincidence of higher-priced lending and in averagespreads paid by borrowers with loans priced abovethe thresholds. The pricing data can also be reviewedfor broader patterns that may indicate fair lendingissues. For example, an institution’s overall lendingactivity can be reviewed to identify geographic varia-tions in pricing that may be associated with neighbor-hood racial or ethnic population characteristics. Eachof these approaches will improve the fair lendinganalyses conducted by examiners.
Screening Using the 2004 HMDA Data
As of this writing, the Federal Reserve has modifiedits statistical analysis system for fair lending exami-nations to incorporate the new information availablein the expanded HMDA data. To examine the poten-tial utility of the enhanced system, we used a stream-lined version of the system to conduct a review of thelending activity of the 8,853 institutions reporting2004 HMDA data. The approach here and in theearlier sections of this article are related, but unlikethe earlier sections, which involved an analysis ofaggregate patterns that included a control for lender,this exercise uses the data to identify patterns in thelending of individual institutions.
The streamlined analysis starts by evaluating thestatistical significance of differences across racial orethnic lines in the unadjusted (or gross) incidence ofdenial rates, incidence of higher-priced lending, andaverage spreads paid by those with higher-pricedloans for each lender separately. This procedure pro-duces a series of lender–product combinations. Foreach lender–product combination, further analysismatches each minority applicant (or borrower) withnonminority applicants (or borrowers) on the basisof a variety of factors available in the HMDA data,including loan product, borrower income and loanamount, geographic market (for example, specificMSA), and number of applicants (one or more thanone).
Adjusted differences are computed by comparingthe denial rates, incidence of higher-priced lending,and average APR spreads of minorities with those ofthe nonminorities matched to them. This procedure isdesigned to remove the effects of these other factorsfrom the calculations of the differences. The adjusteddifferences are an estimate of the expected differ-ences in outcomes if a minority and a nonminoritywith the same income, loan amount, and number of
New Information Reported under HMDA and Its Application in Fair Lending Enforcement 387
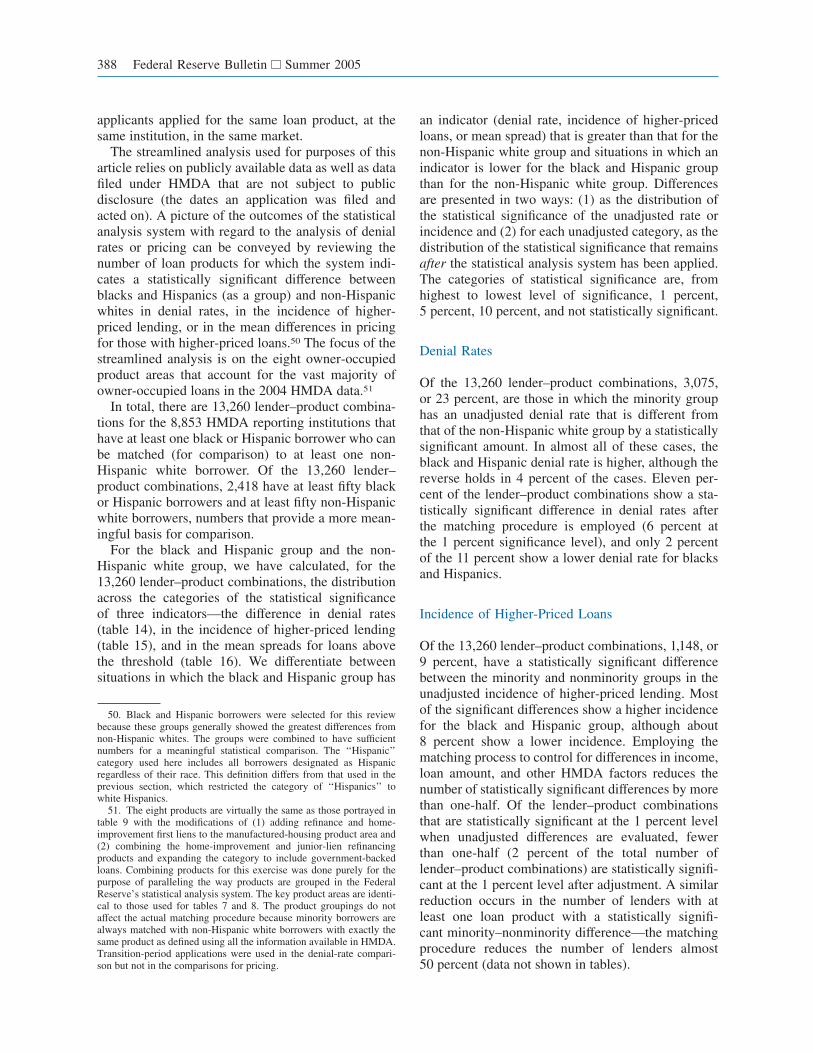
applicants applied for the same loan product, at thesame institution, in the same market.
The streamlined analysis used for purposes of thisarticle relies on publicly available data as well as datafiled under HMDA that are not subject to publicdisclosure (the dates an application was filed andacted on). A picture of the outcomes of the statisticalanalysis system with regard to the analysis of denialrates or pricing can be conveyed by reviewing thenumber of loan products for which the system indi-cates a statistically significant difference betweenblacks and Hispanics (as a group) and non-Hispanicwhites in denial rates, in the incidence of higher-priced lending, or in the mean differences in pricingfor those with higher-priced loans.50 The focus of thestreamlined analysis is on the eight owner-occupiedproduct areas that account for the vast majority ofowner-occupied loans in the 2004 HMDA data.51
In total, there are 13,260 lender–product combina-tions for the 8,853 HMDA reporting institutions thathave at least one black or Hispanic borrower who canbe matched (for comparison) to at least one non-Hispanic white borrower. Of the 13,260 lender–product combinations, 2,418 have at least fifty blackor Hispanic borrowers and at least fifty non-Hispanicwhite borrowers, numbers that provide a more mean-ingful basis for comparison.
For the black and Hispanic group and the non-Hispanic white group, we have calculated, for the13,260 lender–product combinations, the distributionacross the categories of the statistical significanceof three indicators—the difference in denial rates(table 14), in the incidence of higher-priced lending(table 15), and in the mean spreads for loans abovethe threshold (table 16). We differentiate betweensituations in which the black and Hispanic group has
an indicator (denial rate, incidence of higher-pricedloans, or mean spread) that is greater than that for thenon-Hispanic white group and situations in which anindicator is lower for the black and Hispanic groupthan for the non-Hispanic white group. Differencesare presented in two ways: (1) as the distribution ofthe statistical significance of the unadjusted rate orincidence and (2) for each unadjusted category, as thedistribution of the statistical significance that remainsafter the statistical analysis system has been applied.The categories of statistical significance are, fromhighest to lowest level of significance, 1 percent,5 percent, 10 percent, and not statistically significant.
Denial Rates
Of the 13,260 lender–product combinations, 3,075,or 23 percent, are those in which the minority grouphas an unadjusted denial rate that is different fromthat of the non-Hispanic white group by a statisticallysignificant amount. In almost all of these cases, theblack and Hispanic denial rate is higher, although thereverse holds in 4 percent of the cases. Eleven per-cent of the lender–product combinations show a sta-tistically significant difference in denial rates afterthe matching procedure is employed (6 percent atthe 1 percent significance level), and only 2 percentof the 11 percent show a lower denial rate for blacksand Hispanics.
Incidence of Higher-Priced Loans
Of the 13,260 lender–product combinations, 1,148, or9 percent, have a statistically significant differencebetween the minority and nonminority groups in theunadjusted incidence of higher-priced lending. Mostof the significant differences show a higher incidencefor the black and Hispanic group, although about8 percent show a lower incidence. Employing thematching process to control for differences in income,loan amount, and other HMDA factors reduces thenumber of statistically significant differences by morethan one-half. Of the lender–product combinationsthat are statistically significant at the 1 percent levelwhen unadjusted differences are evaluated, fewerthan one-half (2 percent of the total number oflender–product combinations) are statistically signifi-cant at the 1 percent level after adjustment. A similarreduction occurs in the number of lenders with atleast one loan product with a statistically signifi-cant minority–nonminority difference—the matchingprocedure reduces the number of lenders almost50 percent (data not shown in tables).
50. Black and Hispanic borrowers were selected for this reviewbecause these groups generally showed the greatest differences fromnon-Hispanic whites. The groups were combined to have sufficientnumbers for a meaningful statistical comparison. The ‘‘Hispanic’’category used here includes all borrowers designated as Hispanicregardless of their race. This definition differs from that used in theprevious section, which restricted the category of ‘‘Hispanics’’ towhite Hispanics.
51. The eight products are virtually the same as those portrayed intable 9 with the modifications of (1) adding refinance and home-improvement first liens to the manufactured-housing product area and(2) combining the home-improvement and junior-lien refinancingproducts and expanding the category to include government-backedloans. Combining products for this exercise was done purely for thepurpose of paralleling the way products are grouped in the FederalReserve’s statistical analysis system. The key product areas are identi-cal to those used for tables 7 and 8. The product groupings do notaffect the actual matching procedure because minority borrowers arealways matched with non-Hispanic white borrowers with exactly thesame product as defined using all the information available in HMDA.Transition-period applications were used in the denial-rate compari-son but not in the comparisons for pricing.
388 Federal Reserve Bulletin Summer 2005
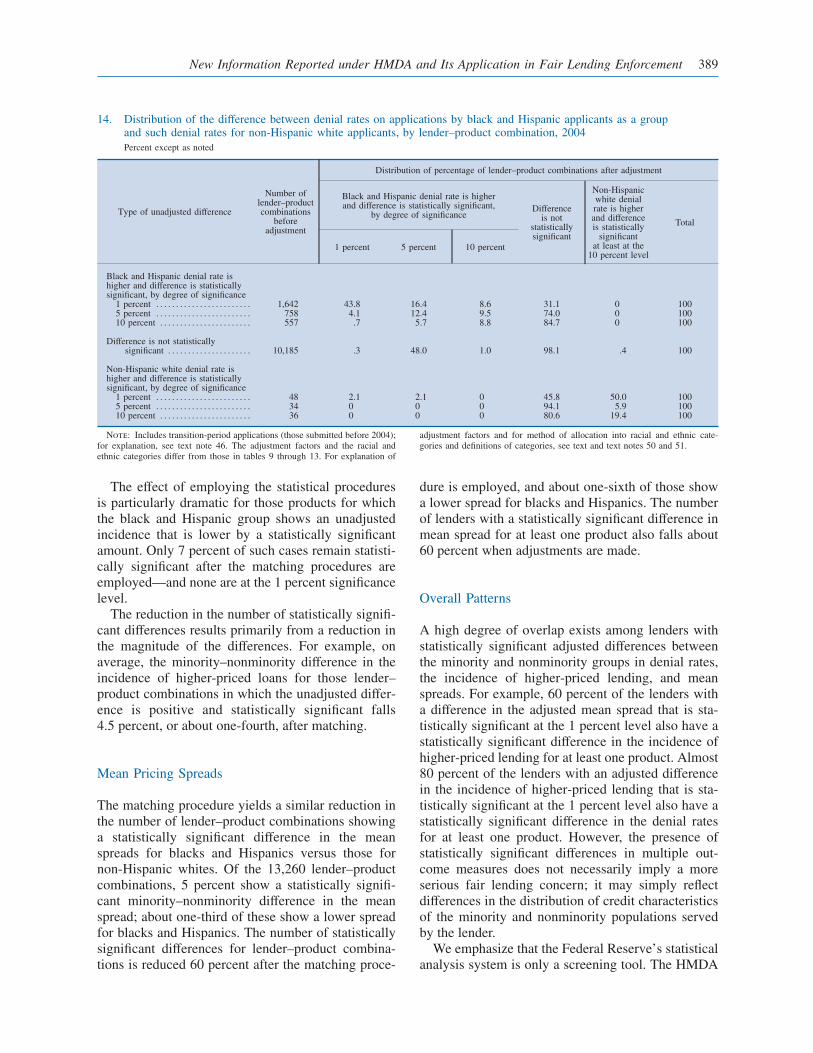
The effect of employing the statistical proceduresis particularly dramatic for those products for whichthe black and Hispanic group shows an unadjustedincidence that is lower by a statistically significantamount. Only 7 percent of such cases remain statisti-cally significant after the matching procedures areemployed—and none are at the 1 percent significancelevel.
The reduction in the number of statistically signifi-cant differences results primarily from a reduction inthe magnitude of the differences. For example, onaverage, the minority–nonminority difference in theincidence of higher-priced loans for those lender–product combinations in which the unadjusted differ-ence is positive and statistically significant falls4.5 percent, or about one-fourth, after matching.
Mean Pricing Spreads
The matching procedure yields a similar reduction inthe number of lender–product combinations showinga statistically significant difference in the meanspreads for blacks and Hispanics versus those fornon-Hispanic whites. Of the 13,260 lender–productcombinations, 5 percent show a statistically signifi-cant minority–nonminority difference in the meanspread; about one-third of these show a lower spreadfor blacks and Hispanics. The number of statisticallysignificant differences for lender–product combina-tions is reduced 60 percent after the matching proce-
dure is employed, and about one-sixth of those showa lower spread for blacks and Hispanics. The numberof lenders with a statistically significant difference inmean spread for at least one product also falls about60 percent when adjustments are made.
Overall Patterns
A high degree of overlap exists among lenders withstatistically significant adjusted differences betweenthe minority and nonminority groups in denial rates,the incidence of higher-priced lending, and meanspreads. For example, 60 percent of the lenders witha difference in the adjusted mean spread that is sta-tistically significant at the 1 percent level also have astatistically significant difference in the incidence ofhigher-priced lending for at least one product. Almost80 percent of the lenders with an adjusted differencein the incidence of higher-priced lending that is sta-tistically significant at the 1 percent level also have astatistically significant difference in the denial ratesfor at least one product. However, the presence ofstatistically significant differences in multiple out-come measures does not necessarily imply a moreserious fair lending concern; it may simply reflectdifferences in the distribution of credit characteristicsof the minority and nonminority populations servedby the lender.
We emphasize that the Federal Reserve’s statisticalanalysis system is only a screening tool. The HMDA
14. Distribution of the difference between denial rates on applications by black and Hispanic applicants as a groupand such denial rates for non-Hispanic white applicants, by lender–product combination, 2004Percent except as noted
Type of unadjusted difference
Number oflender–productcombinations
beforeadjustment
Distribution of percentage of lender–product combinations after adjustment
Black and Hispanic denial rate is higherand difference is statistically significant,
by degree of significanceDifference
is notstatisticallysignificant
Non-Hispanicwhite denialrate is higherand differenceis statistically
significantat least at the
10 percent level
Total
1 percent 5 percent 10 percent
Black and Hispanic denial rate ishigher and difference is statisticallysignificant, by degree of significance
1 percent . . . . . . . . . . . . . . . . . . . . . . . . 1,642 43.8 16.4 8.6 31.1 0 1005 percent . . . . . . . . . . . . . . . . . . . . . . . . 758 4.1 12.4 9.5 74.0 0 10010 percent . . . . . . . . . . . . . . . . . . . . . . . 557 .7 5.7 8.8 84.7 0 100
Difference is not statisticallysignificant . . . . . . . . . . . . . . . . . . . . . 10,185 .3 48.0 1.0 98.1 .4 100
Non-Hispanic white denial rate ishigher and difference is statisticallysignificant, by degree of significance
1 percent . . . . . . . . . . . . . . . . . . . . . . . . 48 2.1 2.1 0 45.8 50.0 1005 percent . . . . . . . . . . . . . . . . . . . . . . . . 34 0 0 0 94.1 5.9 10010 percent . . . . . . . . . . . . . . . . . . . . . . . 36 0 0 0 80.6 19.4 100
Note: Includes transition-period applications (those submitted before 2004);for explanation, see text note 46. The adjustment factors and the racial andethnic categories differ from those in tables 9 through 13. For explanation of
adjustment factors and for method of allocation into racial and ethnic cate-gories and definitions of categories, see text and text notes 50 and 51.
New Information Reported under HMDA and Its Application in Fair Lending Enforcement 389

data alone, no matter how much they are manipu-lated, cannot be used to conclude whether a particularapplicant was treated adversely on the basis of aprohibited factor regarding either the disposition ofthe application or the pricing of the loan. The datareveal little about an individual’s financial circum-stances and nothing about the condition or value ofthe property offered as collateral. Furthermore, thedata reveal nothing about the underwriting standardsused by a lender to assess the creditworthiness of anindividual or to set loan price. Moreover, the data donot reveal how a lender’s credit decisions relate to itsoverall business strategy. For example, the data donot account for the possibility that an institution’soutreach efforts may attract a larger proportion ofapplicants with weaker credit profiles than do otherinstitutions. Consequently, the data do not provide afinal basis on which to draw conclusions regardingeither the existence or the absence of fair lendingviolations.
The Use of Screening in theEnforcement Process
As implemented in the Federal Reserve’s bank super-visory process, the statistical analysis system is usedas a screening procedure to identify those institutionsand their specific products that warrant closer reviewfor fair lending concerns. Examiners familiar withthe procedures and products of a given institution
conduct the analysis and tailor it to the specificcircumstances relevant to the institution in ways thatreflect the institution’s product offerings, its com-pliance risk-management systems, and the FederalReserve’s overall supervisory experience with theinstitution. Thus, the system used as a screening toolto analyze fair lending compliance for a particularinstitution is more complex than the streamlinedanalysis used in this article.
If an institution is targeted for more-intensivereview, follow-up procedures can take one or moreforms, including soliciting more information from theinstitution regarding its lending and underwriting pro-cedures; gathering additional loan-level data, such ascredit scores and loan-to-value ratios; performingdetailed reviews of loan-file data; and conductinginterviews with current or past bank personnel orborrowers. The follow-up can be integrated into thenormal consumer examination cycle or can become aspecial review of fair lending compliance. The Fed-eral Reserve has already applied the expanded sta-tistical management system that includes the 2004HMDA data to many of the institutions it supervisesand has contacted those that exhibited relatively largepricing differences by race, ethnicity, or sex to learnmore about their lending practices and to improvecompliance oversight.
In addition, a review of the 2004 data by otheragencies is under way. The Federal Reserve is shar-ing the screening procedures with other agencies sothat, if they wish, they may integrate them into their
15. Distribution of the difference between incidence of higher-priced loans for black and Hispanic borrowers as a groupand the incidence for non-Hispanic white borrowers, by lender–product combination, 2004Percent except as noted
Type of unadjusted difference
Number oflender–productcombinations
beforeadjustment
Distribution of percentage of lender–product combinations after adjustment
Black and Hispanic incidence is higherand difference is statistically significant,
by degree of significanceDifference
is notstatisticallysignificant
Non-Hispanicwhite incidence
is higherand differenceis statistically
significantat least at the
10 percent level
Total
1 percent 5 percent 10 percent
Black and Hispanic incidence ishigher and difference is statisticallysignificant, by degree of significance
1 percent . . . . . . . . . . . . . . . . . . . . . . . . 532 43.0 15.4 7.5 34.0 0 1005 percent . . . . . . . . . . . . . . . . . . . . . . . . 285 4.9 11.9 8.4 74.7 0 10010 percent . . . . . . . . . . . . . . . . . . . . . . . 241 1.2 4.6 9.1 85.1 0 100
Difference is not statisticallysignificant . . . . . . . . . . . . . . . . . . . . . 12,112 .1 .3 .4 99.0 .2 100
Non-Hispanic white incidence ishigher and difference is statisticallysignificant, by degree of significance
1 percent . . . . . . . . . . . . . . . . . . . . . . . . 33 0 0 0 93.9 6.1 1005 percent . . . . . . . . . . . . . . . . . . . . . . . . 26 0 0 0 96.2 3.8 10010 percent . . . . . . . . . . . . . . . . . . . . . . . 31 0 0 0 90.3 9.7 100.
Note: Excludes transition-period loans (those for which the application wassubmitted before 2004). The adjustment factors and the racial and ethnic cate-gories differ from those in tables 9 through 13. For explanation of adjustment
factors and for method of allocation into racial and ethnic categories and defini-tions of categories, see text and text notes 50 and 51.
390 Federal Reserve Bulletin Summer 2005
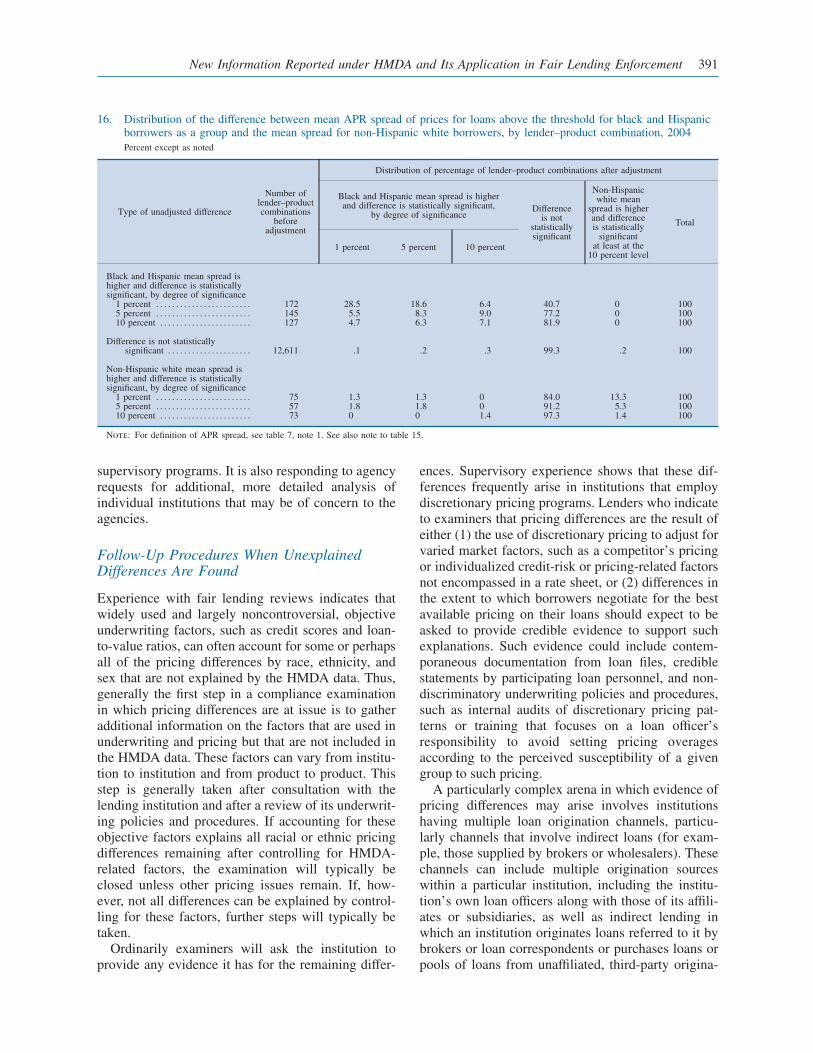
supervisory programs. It is also responding to agencyrequests for additional, more detailed analysis ofindividual institutions that may be of concern to theagencies.
Follow-Up Procedures When UnexplainedDifferences Are Found
Experience with fair lending reviews indicates thatwidely used and largely noncontroversial, objectiveunderwriting factors, such as credit scores and loan-to-value ratios, can often account for some or perhapsall of the pricing differences by race, ethnicity, andsex that are not explained by the HMDA data. Thus,generally the first step in a compliance examinationin which pricing differences are at issue is to gatheradditional information on the factors that are used inunderwriting and pricing but that are not included inthe HMDA data. These factors can vary from institu-tion to institution and from product to product. Thisstep is generally taken after consultation with thelending institution and after a review of its underwrit-ing policies and procedures. If accounting for theseobjective factors explains all racial or ethnic pricingdifferences remaining after controlling for HMDA-related factors, the examination will typically beclosed unless other pricing issues remain. If, how-ever, not all differences can be explained by control-ling for these factors, further steps will typically betaken.
Ordinarily examiners will ask the institution toprovide any evidence it has for the remaining differ-
ences. Supervisory experience shows that these dif-ferences frequently arise in institutions that employdiscretionary pricing programs. Lenders who indicateto examiners that pricing differences are the result ofeither (1) the use of discretionary pricing to adjust forvaried market factors, such as a competitor’s pricingor individualized credit-risk or pricing-related factorsnot encompassed in a rate sheet, or (2) differences inthe extent to which borrowers negotiate for the bestavailable pricing on their loans should expect to beasked to provide credible evidence to support suchexplanations. Such evidence could include contem-poraneous documentation from loan files, crediblestatements by participating loan personnel, and non-discriminatory underwriting policies and procedures,such as internal audits of discretionary pricing pat-terns or training that focuses on a loan officer’sresponsibility to avoid setting pricing overagesaccording to the perceived susceptibility of a givengroup to such pricing.
A particularly complex arena in which evidence ofpricing differences may arise involves institutionshaving multiple loan origination channels, particu-larly channels that involve indirect loans (for exam-ple, those supplied by brokers or wholesalers). Thesechannels can include multiple origination sourceswithin a particular institution, including the institu-tion’s own loan officers along with those of its affili-ates or subsidiaries, as well as indirect lending inwhich an institution originates loans referred to it bybrokers or loan correspondents or purchases loans orpools of loans from unaffiliated, third-party origina-
16. Distribution of the difference between mean APR spread of prices for loans above the threshold for black and Hispanicborrowers as a group and the mean spread for non-Hispanic white borrowers, by lender–product combination, 2004Percent except as noted
Type of unadjusted difference
Number oflender–productcombinations
beforeadjustment
Distribution of percentage of lender–product combinations after adjustment
Black and Hispanic mean spread is higherand difference is statistically significant,
by degree of significanceDifference
is notstatisticallysignificant
Non-Hispanicwhite mean
spread is higherand differenceis statistically
significantat least at the
10 percent level
Total
1 percent 5 percent 10 percent
Black and Hispanic mean spread ishigher and difference is statisticallysignificant, by degree of significance
1 percent . . . . . . . . . . . . . . . . . . . . . . . . 172 28.5 18.6 6.4 40.7 0 1005 percent . . . . . . . . . . . . . . . . . . . . . . . . 145 5.5 8.3 9.0 77.2 0 10010 percent . . . . . . . . . . . . . . . . . . . . . . . 127 4.7 6.3 7.1 81.9 0 100
Difference is not statisticallysignificant . . . . . . . . . . . . . . . . . . . . . 12,611 .1 .2 .3 99.3 .2 100
Non-Hispanic white mean spread ishigher and difference is statisticallysignificant, by degree of significance
1 percent . . . . . . . . . . . . . . . . . . . . . . . . 75 1.3 1.3 0 84.0 13.3 1005 percent . . . . . . . . . . . . . . . . . . . . . . . . 57 1.8 1.8 0 91.2 5.3 10010 percent . . . . . . . . . . . . . . . . . . . . . . . 73 0 0 1.4 97.3 1.4 100
Note: For definition of APR spread, see table 7, note 1. See also note to table 15.
New Information Reported under HMDA and Its Application in Fair Lending Enforcement 391
tors. Such channels can encompass significant varietyin the nature of the relationships between a givenlender and the affiliates, brokers, or third-party origi-nators that deliver loans to the lender. Indeed, suchrelationships may range across a spectrum from aprime-rate lender that also operates a subprime busi-ness in the same geographic market through a directsubsidiary to a regional bank in one section of thecountry that makes fully ‘‘arm’s length’’ purchases ofclosed loans from an unaffiliated mortgage companyoperating solely in a different area.
From a fair lending perspective, a lender whosedifferent channels of lending serve either borrowersor geographic areas that differ by race, ethnicity, orother prohibited characteristic is likely to be furtherreviewed. That will certainly be the case if thesedifferent channels produce loan pricing that also dif-fers by race, ethnicity, or other prohibited character-istic.52 A full review of fair lending compliance inmultiple-channel situations will turn on complex fac-tual analyses that are beyond the scope of this article.It is sufficient to note here that such analyses willcover the type and degree of pricing differences, thenature of the various channels, the lender’s legal andbusiness relationships with other entities (for exam-ple, affiliates, brokers, correspondents, or whole-salers), the lender’s business or economic basis foroperating through those channels, and the lender’sexplanation for the pricing differences.
The process of examining an institution for whichpricing differences based on race, ethnicity, or sex arestatistically significant and for which purely objectivepricing factors, such as credit scores or loan-to-valueratios, cannot explain the differences, will include areview of loan files; discussions with management orloan personnel about possible reasons for the differ-ences; a review of evidence put forth to support theirexplanations; interviews with customers, where nec-essary, regarding their experiences with the lender;and a careful vetting of an institution’s policies andprocedures and actual practices. If, after conductingan examination, there is no credible nondiscrimina-tory explanation for such differences, examiners willconsider what supervisory action will be appropriateto address the issue. Moreover, a lender that cannotaccount for differences in pricing across groups mayalso be exposed to private rights of action under
applicable fair lending laws and may face adverseeffects on its reputation.
HOEPA Enforcement
For the agencies that evaluate compliance withHOEPA, the expanded HMDA data provide the firstopportunity to readily identify which lenders extendhome loans subject to that law and to measure theextent of their involvement in such lending. The newinformation also provides examiners with the dataneeded to efficiently select samples of loan files forreview. The data can also be used to examine patternsof HOEPA-related lending across borrowers andneighborhoods, arrayed by their racial and ethnicprofiles. Such analysis may reveal possible fair lend-ing issues and may indicate communities where creditcounseling activities could be targeted.
The Federal Reserve’s statistical analysis systemhas been augmented to include several screens to aidHOEPA-related enforcement. These screens includethe identification of HOEPA loans that are potentiallyunaffordable given a comparison of the applicant’sincome and the estimated monthly loan payments,the identification of loans with APR spreads thatwould appear to have triggered HOEPA coverage butwere not reported as such, and the calculation ofdifferences across racial and ethnic groups in theincidence of HOEPA lending.53
SUMMARY AND CONCLUSIONS
In 2002 the Federal Reserve Board amended itsRegulation C to expand the types of information thatlenders covered by HMDA must disclose to the pub-lic about their home-lending activities. The amend-ments are intended to improve the quality, consis-tency, and utility of the reported data and to keep theregulation in step with recent developments in home-loan markets. Data reported for 2004 are the first toreflect the changes in the reporting rules.
As anticipated, the expanded data provide newopportunities to assess home-lending activity. Newlyavailable information on lien status and on whether aloan is for a site-built or manufactured home, as wellas more uniformity in the information on home-improvement and refinancing loans, allows analysesthat are more relevant to the current state of the52. The expanded HMDA data can be used to roughly differentiate
the pricing of an institution’s retail lending operations from thepricing of loans obtained from other channels by comparing thelocations of borrowers with the locations of an institution’s assess-ment areas. Loans outside an institution’s assessment areas are morelikely to have been initiated by third-party brokers or through otherindirect channels.
53. The estimated monthly loan payment is derived from HMDAdata using the reported loan amount and an estimated APR thatassumes a fixed-rate thirty-year loan.
392 Federal Reserve Bulletin Summer 2005
market. Most prominently, the new information pro-vides the first publicly available loan-level informa-tion on loan pricing in the higher-priced segment ofthe home-loan market, a segment that was virtuallynonexistent a decade or so ago but is now an impor-tant part of the overall home-loan market.
This article presents an analysis of the 2004HMDA data. The analysis is conducted with thenational HMDA database and is designed to providean understanding of the overall patterns in the datarather than patterns that pertain to any individualmarket or lender. Much of the presentation focuseson the new items in the data. On balance, the analysissuggests that the information on lien status, manufac-tured homes, requests for pre-approval, and refinedproduct definitions provides a much improved basisfor describing lending activity and the disposition ofapplications for credit. Much of the initial publicreview of the data will, however, undoubtedly focuson loan pricing and particularly on the incidence ofhigher-priced lending and the comparison of pricespaid by borrowers grouped by race, ethnicity, andsex.
The most likely initial public focus will be on theincidence of higher-priced lending among minorities(particularly blacks) and among non-Hispanic whites.In the raw data, the differences between these twogroups in the incidence of higher-priced lending aregenerally more than 20 percentage points for variousloan products. Our analysis shows, however, thatmore than two-thirds of the aggregate difference inthe incidence of higher-priced lending between blackand non-Hispanic white borrowers can be explainedby differences in the groups’ distributions of income,loan amounts, other borrower-related characteristicsincluded in the HMDA data, and the choice of lender.Further, analysis at the level of individual lenderssuggests that about 2 percent of the 8,853 lenderscovered by HMDA exhibited a statistically signifi-cant difference in the incidence of higher-priced loansbetween black and Hispanic borrowers, on the onehand, and non-Hispanic white borrowers, on theother, after accounting for factors included in theHMDA data.
Thus, we see a sizable narrowing, at both theaggregate and institution levels, in the unexplaineddifferences in the the incidence of higher-priced lend-ing between minority and nonminority groups. Thisnarrowing suggests that controlling for credit-relatedfactors not found in the HMDA data, such as credithistory scores and loan-to-value ratios, might furtherreduce unexplained racial or ethnic differences.Whether controlling for such additional factors willcompletely account for all remaining differences is
unclear. In that regard, our collaborative study withthe Credit Research Center on the lending activitiesof eight large subprime lenders, reported here, sug-gests that controlling for credit-related factors notincluded in the data can make a difference. Ouranalysis demonstrated that for some products theracial or ethnic differences were fully accounted for,whereas for other products, unexplained differencesremained. Clearly, reaching convincing conclusionsabout whether institutions treat individuals differ-ently on a prohibited basis requires institution-specific analysis.
Hence, our analysis strongly indicates that the rawdata alone can lead to inaccurate conclusions, whichin turn may be unfair to particular institutions andmay lead to unnecessary restrictions on the availabil-ity of loans to less-creditworthy applicants. Risk-based pricing has greatly expanded the availability ofhome loans to borrowers who, because of weaknessesin their credit profiles, had previously been unableto qualify. It would be unfortunate if unwarrantedaccusations of illegal bias, stemming from improp-erly analyzed pricing differences, discouragedlenders from participating in this segment of themarket.
The primary responsibility for ensuring compli-ance with fair lending laws falls on lenders. HMDAdata may help lenders analyze and monitor theirlending patterns. In addition, the regulatory agen-cies use the data for screening purposes to identifyindividual lenders that warrant heightened scrutinyregarding their loan-pricing activities. Where war-ranted, such reviews include gaining a fuller under-standing of the institution’s loan-pricing practices,analyzing loan-level data, and interviewing appropri-ate personnel to determine whether pricing differ-ences identified through the HMDA screening pro-cess are explained by controlling for these additionaldata or by other objective factors.
To improve its fair lending examination capa-bilities, the Federal Reserve has modified its sta-tistical analysis tool to use the new data to screeninstitutions for significant differences in lending out-comes across borrowers grouped by race, ethnicity,or sex. The Federal Reserve has already applied thisexpanded statistical management system to manyof the institutions it supervises. It has also contactedthose institutions that exhibit relatively large pricingdifferences to learn more about their lending prac-tices and to improve its compliance oversight. More-over, a review of the 2004 data by other agenciesis under way, and the Federal Reserve is sharing thescreening procedures with other agencies to facilitatetheir efforts.
New Information Reported under HMDA and Its Application in Fair Lending Enforcement 393
Institution-specific evaluations, which are not pos-sible with the HMDA data alone, are essential todetermining whether loan-pricing differences in factreflect discriminatory treatment of minority groups.However, the aggregate data can nonetheless providevaluable, broader insights into the experience of suchgroups in the home-loan market. For example, blackand Hispanic borrowers taken together are muchmore likely than non-Hispanic white borrowers toobtain credit from institutions that report a higherincidence of higher-priced loans. On the one hand,this pattern may be benign and reflect a sorting ofindividuals into different market segments by theircredit characteristics. On the other hand, it may besymptomatic of a more serious issue. Lenders thatreport a lower incidence of higher-priced productsmay be either less willing or less able to serve minor-ity neighborhoods. More troubling, these patternsmay stem, at least in part, from borrowers beingsteered to lenders or to loans that offer higher pricesthan the credit characteristics of these borrowers war-rant. Reaching accurate determinations among thesealternative possible outcomes is one goal of thesupervision system. Moreover, we hope that futureresearch using the new HMDA data will provideinsights that will facilitate this process.
APPENDIX: ENHANCED DATA ON PRIVATEMORTGAGE INSURANCE
Historically, mortgage lenders have required prospec-tive borrowers to make a down payment of at least20 percent of a home’s value before they will extenda home-purchase loan. Such down payments arerequired because experience has shown that home-owners with little equity are substantially more likelyto default on their mortgage. Private mortgage insur-ance (PMI) emerged as a response to both creditors’concerns about the elevated credit risk of lendingbacked by little equity in a home and the difficul-ties that some consumers encounter in accumulatingsufficient savings to meet required down-paymentand closing costs.
PMI protects a lender if a borrower defaults on aloan: It reduces a lender’s credit risk by insuringagainst losses associated with default up to a contrac-tually established percentage of the claim amount.The costs of the insurance are typically paid by theborrower through a somewhat higher interest rate onthe loan.
In 1993 the Mortgage Insurance Companies ofAmerica (MICA) asked the Federal Financial Institu-tions Examination Council (FFIEC) to process datafrom PMI companies on applications for mortgageinsurance and to produce disclosure statements forthe public based on the data.54 The PMI data largelymirror the types of information submitted by lend-ers covered by HMDA. However, because the PMIcompanies do not receive all the information about aprospective loan from the lenders seeking insurancecoverage, some HMDA items are not included in thePMI data. In particular, loan-pricing information,requests for pre-approval, and HOEPA status areunavailable in the PMI data.
For 2004 the seven PMI companies that were writ-ing private mortgage insurance submitted data tothe FFIEC through MICA. In total, these companiesacted on nearly 2 million applications for insur-ance: 1.3 million to insure mortgages for purchas-ing homes and about 650,000 to insure mortgagesfor refinancing existing mortgages. PMI companiesapproved more than 90 percent of the applicationsthey received. Approval rates are high because lend-ers are familiar with the underwriting standards usedby PMI companies and generally submit applicationsfor insurance only if the applications are likely to beapproved.
54. Founded in 1973, MICA is the trade association for the PMIindustry. The FFIEC prepares disclosure statements for each of thePMI companies. The statements are available at the corporate head-quarters of each company and at a central depository in each MSA inwhich HMDA data are held. The central depository also holds aggre-gate data for all the PMI companies active in that MSA. In addition,the PMI data are available from the Federal Reserve Board through itsHMDA Assistance Line (202-452-2016).
394 Federal Reserve Bulletin Summer 2005