Embed Size (px)
Citation preview
8/7/2019 New Home Sales February 2011
http://slidepdf.com/reader/full/new-home-sales-february-2011 1/4
U.S. Census Bureau News
Joint Release
U.S. Department of Housing and Urban Development
FOR IMMEDIATE RELEASE WEDNESDAY, MARCH 23, 2011 AT 10:00 A.M. EDT
CB11-51
Erica Filipek or Stephen Cooper
Manufacturing and Construction Division
U.S. Department of Commerce Washington, D.C. 20233
(301) 763-5160
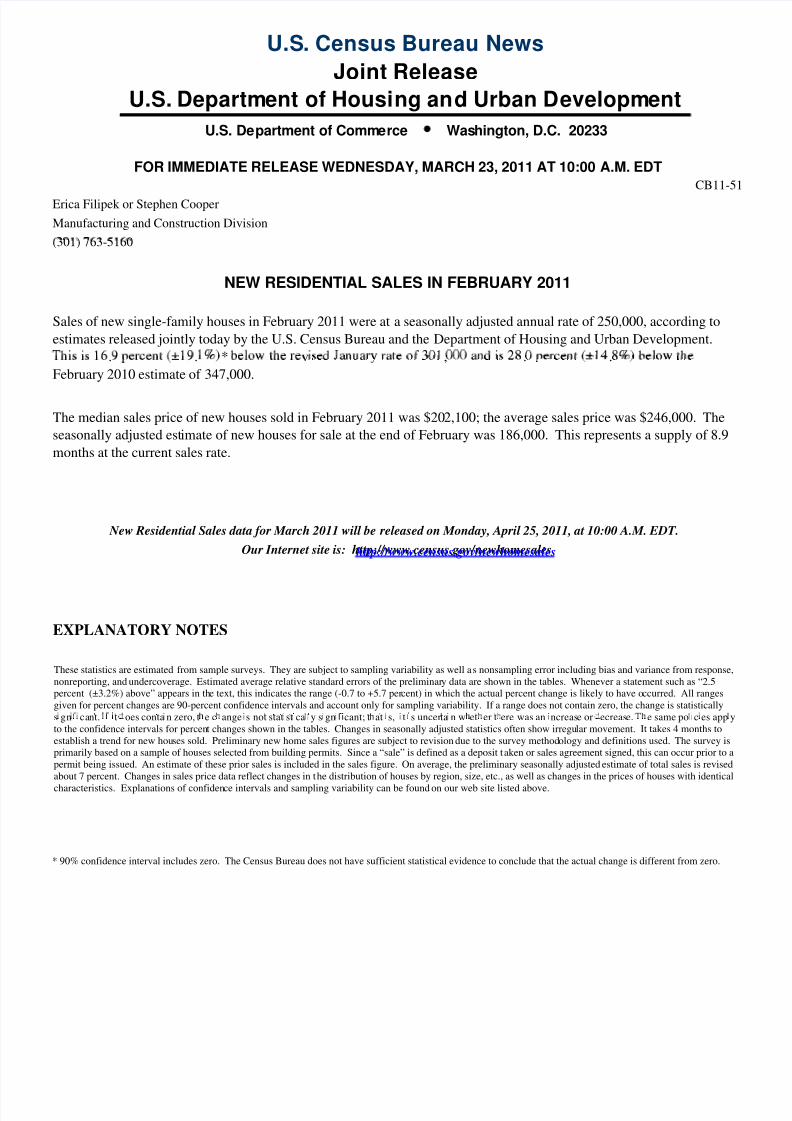
NEW RESIDENTIAL SALES IN FEBRUARY 2011
Sales of new single-family houses in February 2011 were at a seasonally adjusted annual rate of 250,000, according to
estimates released jointly today by the U.S. Census Bureau and the Department of Housing and Urban Development.
* v. . , . .
February 2010 estimate of 347,000.
The median sales price of new houses sold in February 2011 was $202,100; the average sales price was $246,000. The
seasonally adjusted estimate of new houses for sale at the end of February was 186,000. This represents a supply of 8.9
months at the current sales rate.
New Residential Sales data for March 2011 will be released on Monday, April 25, 2011, at 10:00 A.M. EDT.
Our Internet site is: http://www.census.gov/newhomesaleshttp://www.census.gov/newhomesales
EXPLANATORY NOTES
These statistics are estimated from sample surveys. They are subject to sampling variability as well as nonsampling error including bias and variance from response,nonreporting, and undercoverage. Estimated average relative standard errors of the preliminary data are shown in the tables. Whenever a statement such as “2.5percent (±3.2%) above” appears in the text, this indicates the range (-0.7 to +5.7 percent) in which the actual percent change is likely to have occurred. All rangesgiven for percent changes are 90-percent confidence intervals and account only for sampling variability. If a range does not contain zero, the change is statisticallys gn cant. t oes conta n zero, t e c ange s not stat st ca y s gn cant; t at s, t s uncerta n w et er t ere was an ncrease or ecrease. e same po c es app yto the confidence intervals for percent changes shown in the tables. Changes in seasonally adjusted statistics often show irregular movement. It takes 4 months toestablish a trend for new houses sold. Preliminary new home sales figures are subject to revision due to the survey methodology and definitions used. The survey isprimarily based on a sample of houses selected from building permits. Since a “sale” is defined as a deposit taken or sales agreement signed, this can occur prior to apermit being issued. An estimate of these prior sales is included in the sales figure. On average, the preliminary seasonally adjusted estimate of total sales is revisedabout 7 percent. Changes in sales price data reflect changes in the distribution of houses by region, size, etc., as well as changes in the prices of houses with identical
characteristics. Explanations of confidence intervals and sampling variability can be found on our web site listed above.
* 90% confidence interval includes zero. The Census Bureau does not have sufficient statistical evidence to conclude that the actual change is different from zero.
8/7/2019 New Home Sales February 2011
http://slidepdf.com/reader/full/new-home-sales-february-2011 2/4
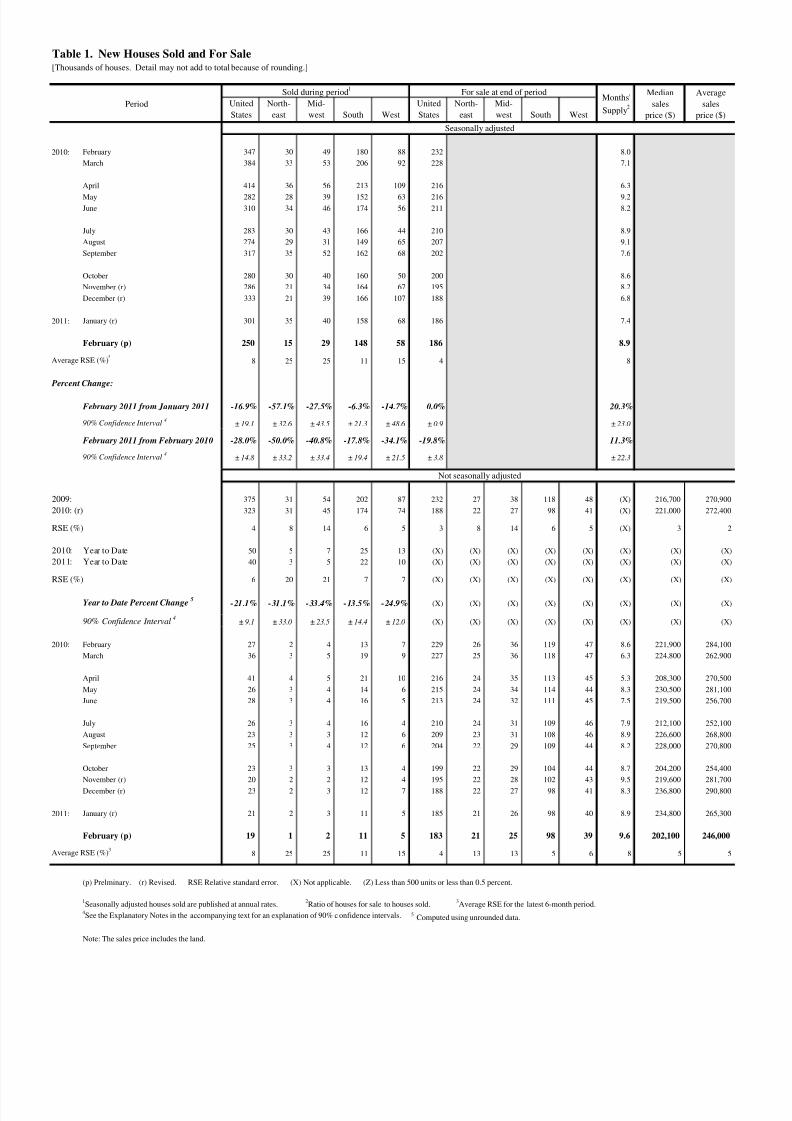
Table 1. New Houses Sold and For Sale[Thousands of houses. Detail may not add to total because of rounding.]
United
States
North-
east
Mid-
west South West
United
States
North-
east
Mid-
west South West
2010: February 347 30 49 180 88 232 8.0
March 384 33 53 206 92 228 7.1
April 414 36 56 213 109 216 6.3
May 282 28 39 152 63 216 9.2 June 310 34 46 174 56 211 8.2
July 283 30 43 166 44 210 8.9
August 274 29 31 149 65 207 9.1
September 317 35 52 162 68 202 7.6
October 280 30 40 160 50 200 8.6
November (r) 286 21 34 164 67 195 8.2
December (r) 333 21 39 166 107 188 6.8
2011: January (r) 301 35 40 158 68 186 7.4
February (p) 250 15 29 148 58 186 8.9
Average RSE (%) 8 25 25 11 15 4 8
Percent Change:
February 2011 from January 2011 -16.9% -57.1% -27.5% -6.3% -14.7% 0.0% 20.3%
90% Confidence Interval4
± 19.1 ± 32.6 ± 43.5 ± 21.3 ± 48.6 ± 0.9 ± 23.0
February 2011 from February 2010 -28.0% -50.0% -40.8% -17.8% -34.1% -19.8% 11.3%
90% Confidence Interval4
± 14.8 ± 33.2 ± 33.4 ± 19.4 ± 21.5 ± 3.8 ± 22.3
2009: 375 31 54 202 87 232 27 38 118 48 (X) 216,700 270,900
2010: (r) 323 31 45 174 74 188 22 27 98 41 (X) 221,000 272,400
RSE (%) 4 8 14 6 5 3 8 14 6 5 (X) 3 2
2010: Year to Date 50 5 7 25 13 (X) (X) (X) (X) (X) (X) (X) (X)
2011: Year to Date 40 3 5 22 10 (X) (X) (X) (X) (X) (X) (X) (X)
RSE (%) 6 20 21 7 7 (X) (X) (X) (X) (X) (X) (X) (X)
Year to Date Percent Change5
-21.1% -31.1% -33.4% -13.5% -24.9% (X) (X) (X) (X) (X) (X) (X) (X)
90% Confidence Interval4
± 9.1 ± 33.0 ± 23.5 ± 14.4 ± 12.0 (X) (X) (X) (X) (X) (X) (X) (X)
2010: February 27 2 4 13 7 229 26 36 119 47 8.6 221,900 284,100
March 36 3 5 19 9 227 25 36 118 47 6.3 224,800 262,900
April 41 4 5 21 10 216 24 35 113 45 5.3 208,300 270,500
May 26 3 4 14 6 215 24 34 114 44 8.3 230,500 281,100
June 28 3 4 16 5 213 24 32 111 45 7.5 219,500 256,700
July 26 3 4 16 4 210 24 31 109 46 7.9 212,100 252,100
August 23 3 3 12 6 209 23 31 108 46 8.9 226,600 268,800
September 25 3 4 12 6 204 22 29 109 44 8.2 228,000 270,800
October 23 3 3 13 4 199 22 29 104 44 8.7 204,200 254,400
November (r) 20 2 2 12 4 195 22 28 102 43 9.5 219,600 281,700
December (r) 23 2 3 12 7 188 22 27 98 41 8.3 236,800 290,800
2011: January (r) 21 2 3 11 5 185 21 26 98 40 8.9 234,800 265,300
February (p) 19 1 2 11 5 183 21 25 98 39 9.6 202,100 246,000
Average RSE (%)3
8 25 25 11 15 4 13 13 5 6 8 5 5
(p) Prelminary. (r) Revised. RSE Relative standard error. (X) Not applicable. (Z) Less than 500 units or less than 0.5 percent.
1Seasonally adjusted houses sold are published at annual rates.
2Ratio of houses for sale to houses sold.
3Average RSE for the latest 6-month period.
4See the Explanatory Notes in the accompanying text for an explanation of 90% c onfidence intervals. 5
Computed using unrounded data.
Note: The sales price includes the land.
Not seasonally adjusted
Average
sales
price ($)
Seasonally adjusted
Period
Sold during period1
For sale at end of periodMonths'
Supply2
Median
sales
price ($)
8/7/2019 New Home Sales February 2011
http://slidepdf.com/reader/full/new-home-sales-february-2011 3/4
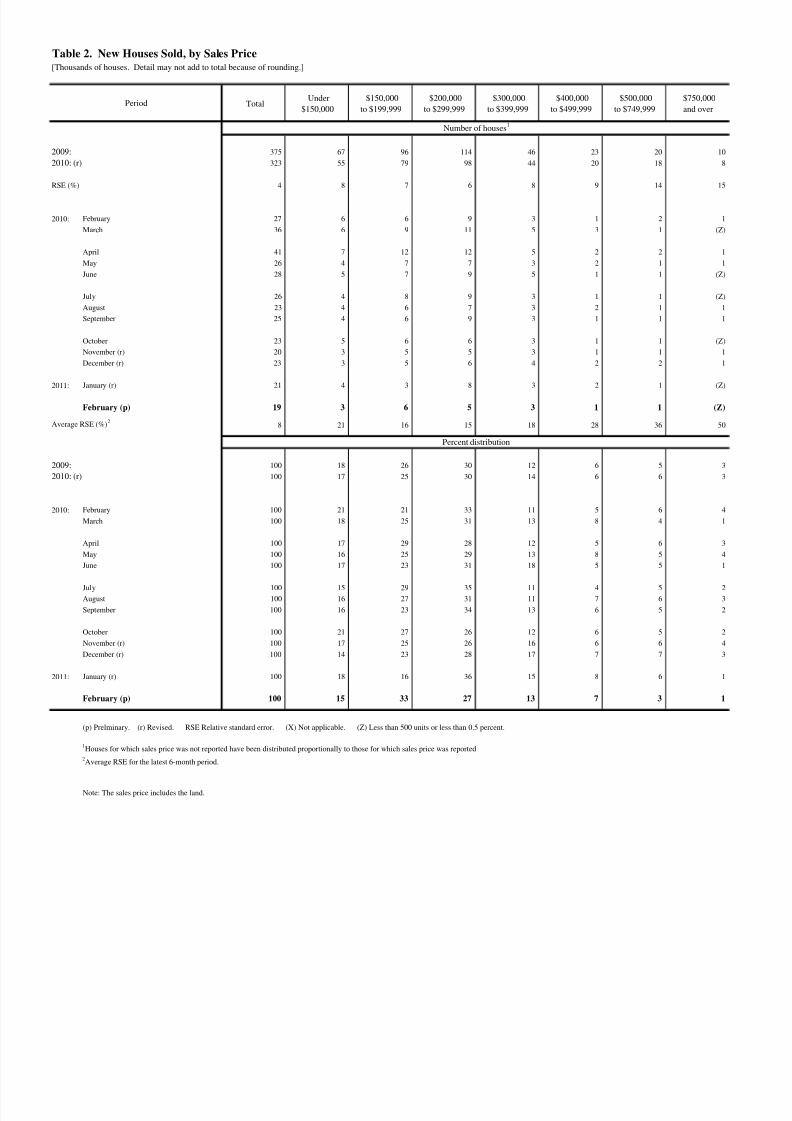
Table 2. New Houses Sold, by Sales Price[Thousands of houses. Detail may not add to total because of rounding.]
TotalUnder
$150,000
$150,000
to $199,999
$200,000
to $299,999
$300,000
to $399,999
$400,000
to $499,999
$500,000
to $749,999
$750,000
and over
2009: 375 67 96 114 46 23 20 10
2010: (r) 323 55 79 98 44 20 18 8
RSE (%) 4 8 7 6 8 9 14 15
2010: February 27 6 6 9 3 1 2 1
March 36 6 9 11 5 3 1 (Z)
April 41 7 12 12 5 2 2 1
May 26 4 7 7 3 2 1 1
June 28 5 7 9 5 1 1 (Z)
July 26 4 8 9 3 1 1 (Z)
August 23 4 6 7 3 2 1 1
September 25 4 6 9 3 1 1 1
October 23 5 6 6 3 1 1 (Z)
November (r) 20 3 5 5 3 1 1 1
December (r) 23 3 5 6 4 2 2 1
2011: January (r) 21 4 3 8 3 2 1 (Z)
February (p) 19 3 6 5 3 1 1 (Z)
Average RSE (%)2
8 21 16 15 18 28 36 50
2009: 100 18 26 30 12 6 5 3
2010: (r) 100 17 25 30 14 6 6 3
2010: February 100 21 21 33 11 5 6 4
March 100 18 25 31 13 8 4 1
April 100 17 29 28 12 5 6 3
May 100 16 25 29 13 8 5 4
June 100 17 23 31 18 5 5 1
July 100 15 29 35 11 4 5 2 August 100 16 27 31 11 7 6 3
September 100 16 23 34 13 6 5 2
October 100 21 27 26 12 6 5 2
November (r) 100 17 25 26 16 6 6 4
December (r) 100 14 23 28 17 7 7 3
2011: January (r) 100 18 16 36 15 8 6 1
February (p) 100 15 33 27 13 7 3 1
(p) Prelminary. (r) Revised. RSE Relative standard error. (X) Not applicable. (Z) Less than 500 units or less than 0.5 percent.
1Houses for which sales price was not reported have been distributed proportionally to those for which sales price was reported
2Average RSE for the latest 6-month period.
Note: The sales price includes the land.
Period
Number of houses1
Percent distribution
8/7/2019 New Home Sales February 2011
http://slidepdf.com/reader/full/new-home-sales-february-2011 4/4
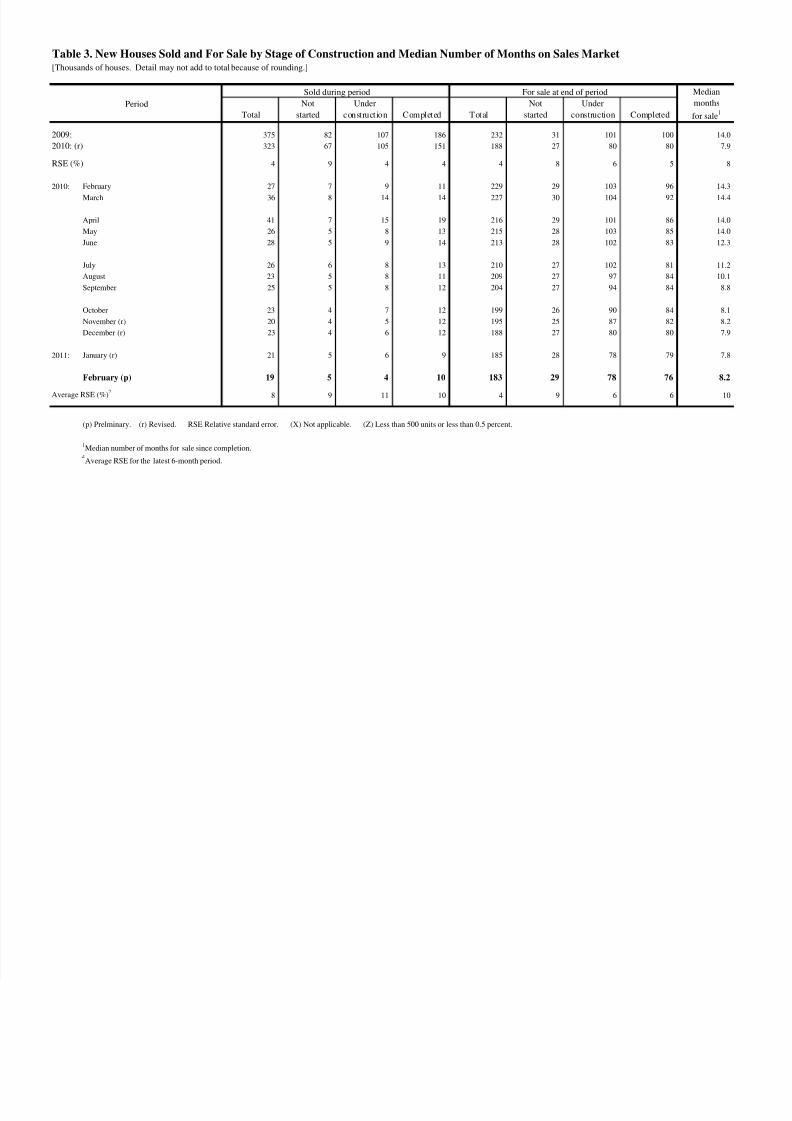
Table 3. New Houses Sold and For Sale by Stage of Construction and Median Number of Months on Sales Market[Thousands of houses. Detail may not add to total because of rounding.]
Total
Not
started
Under
construction Completed Total
Not
started
Under
construction Completed
2009: 375 82 107 186 232 31 101 100 14.0
2010: (r) 323 67 105 151 188 27 80 80 7.9
RSE (%) 4 9 4 4 4 8 6 5 8
2010: February 27 7 9 11 229 29 103 96 14.3
March 36 8 14 14 227 30 104 92 14.4
April 41 7 15 19 216 29 101 86 14.0
May 26 5 8 13 215 28 103 85 14.0
June 28 5 9 14 213 28 102 83 12.3
July 26 6 8 13 210 27 102 81 11.2
August 23 5 8 11 209 27 97 84 10.1
September 25 5 8 12 204 27 94 84 8.8
October 23 4 7 12 199 26 90 84 8.1
November (r) 20 4 5 12 195 25 87 82 8.2
December (r) 23 4 6 12 188 27 80 80 7.9
2011: January (r) 21 5 6 9 185 28 78 79 7.8
February (p) 19 5 4 10 183 29 78 76 8.2
Average RSE (%)2 8 9 11 10 4 9 6 6 10
(p) Prelminary. (r) Revised. RSE Relative standard error. (X) Not applicable. (Z) Less than 500 units or less than 0.5 percent.
1Median number of months for sale since completion.
Average RSE for the latest 6-month period.
Period
Sold during period For sale at end of period Median
months
for sale1