Embed Size (px)
Citation preview
Kancamagus Highway (from Auto Kesariaa on flickr)Kancamagus Highway (from Auto Kesariaa on flickr)
The Coronavirus Pandemic’s Impact on The Transportation and Warehousing Sector
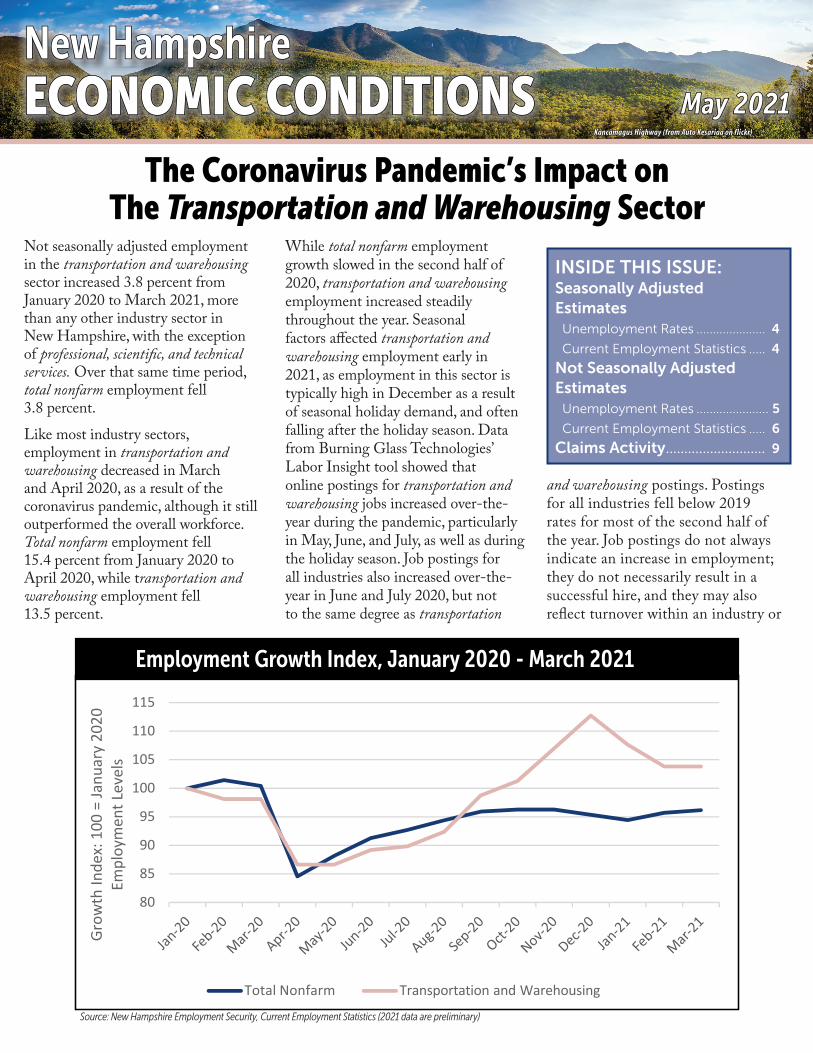
Not seasonally adjusted employment in the transportation and warehousing sector increased 3.8 percent from January 2020 to March 2021, more than any other industry sector in New Hampshire, with the exception of professional, scientific, and technical services. Over that same time period, total nonfarm employment fell 3.8 percent. Like most industry sectors, employment in transportation and warehousing decreased in March and April 2020, as a result of the coronavirus pandemic, although it still outperformed the overall workforce. Total nonfarm employment fell 15.4 percent from January 2020 to April 2020, while transportation and warehousing employment fell 13.5 percent.
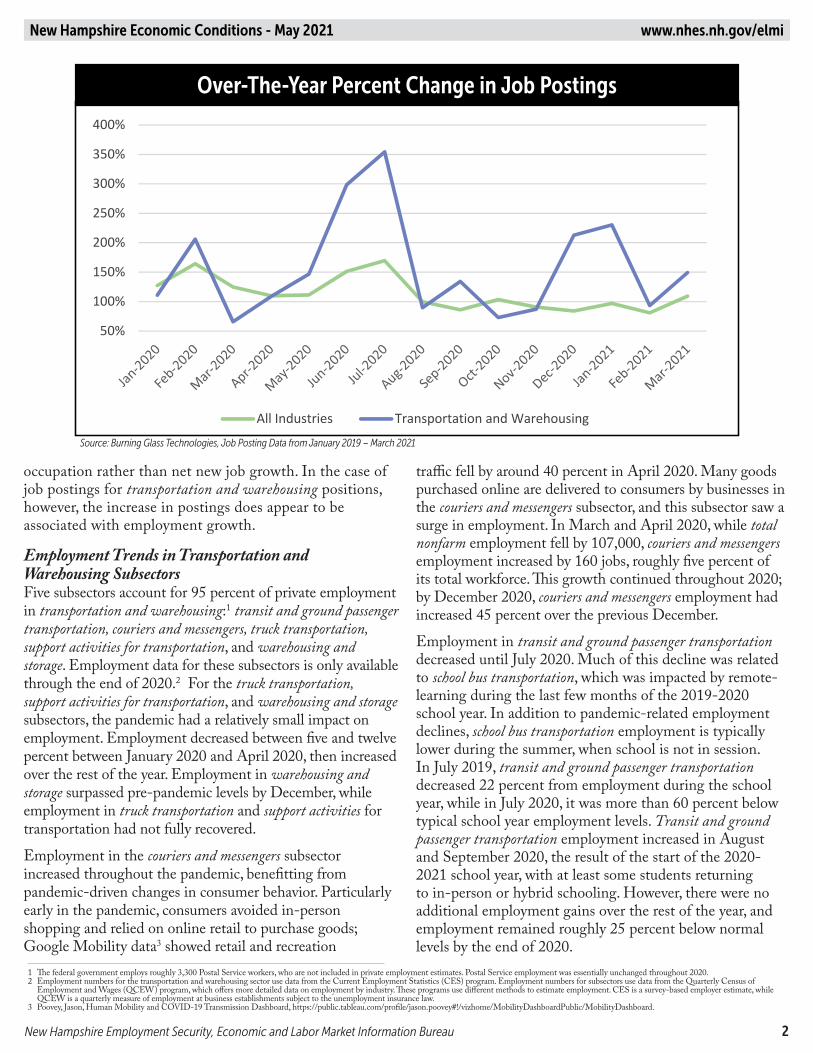
While total nonfarm employment growth slowed in the second half of 2020, transportation and warehousing employment increased steadily throughout the year. Seasonal factors affected transportation and warehousing employment early in 2021, as employment in this sector is typically high in December as a result of seasonal holiday demand, and often falling after the holiday season. Data from Burning Glass Technologies’ Labor Insight tool showed that online postings for transportation and warehousing jobs increased over-the-year during the pandemic, particularly in May, June, and July, as well as during the holiday season. Job postings for all industries also increased over-the-year in June and July 2020, but not to the same degree as transportation
and warehousing postings. Postings for all industries fell below 2019 rates for most of the second half of the year. Job postings do not always indicate an increase in employment; they do not necessarily result in a successful hire, and they may also reflect turnover within an industry or
New HampshireNew HampshireECONOMIC CONDITIONSECONOMIC CONDITIONS May 2021May 2021
80
85
90
95
100
105
110
115
Grow
th In
dex:
100
= Ja
nuar
y 20
20
Empl
oym
ent L
evel
s
Employment Growth Index, January 2020 - March 2021
Total Nonfarm Transportation and Warehousing
Employment Growth Index, January 2020 - March 2021
Source: New Hampshire Employment Security, Current Employment Statistics (2021 data are preliminary)
INSIDE THIS ISSUE:Seasonally AdjustedEstimates Unemployment Rates ..................... 4 Current Employment Statistics ..... 4Not Seasonally AdjustedEstimates Unemployment Rates ...................... 5
Current Employment Statistics ..... 6Claims Activity ........................... 9
New Hampshire Economic Conditions - May 2021 www.nhes.nh.gov/elmi
New Hampshire Employment Security, Economic and Labor Market Information Bureau 2
occupation rather than net new job growth. In the case of job postings for transportation and warehousing positions, however, the increase in postings does appear to be associated with employment growth.
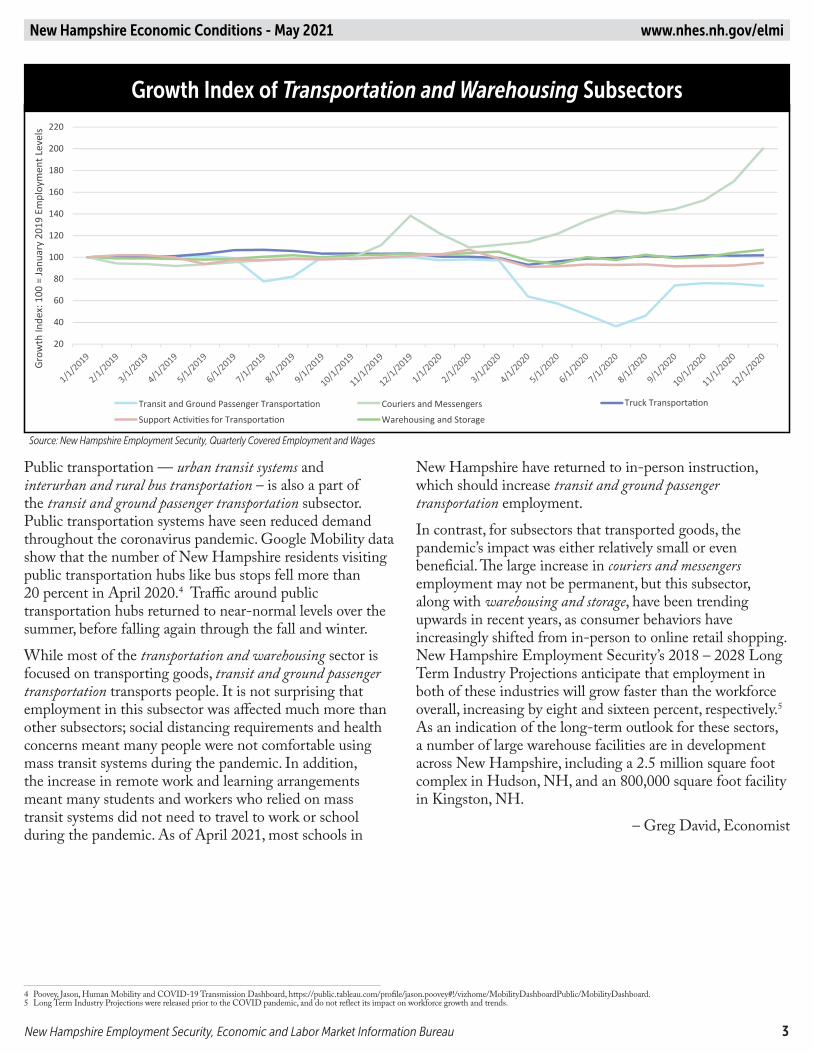
Employment Trends in Transportation and Warehousing Subsectors Five subsectors account for 95 percent of private employment in transportation and warehousing:1 transit and ground passenger transportation, couriers and messengers, truck transportation, support activities for transportation, and warehousing and storage. Employment data for these subsectors is only available through the end of 2020.2 For the truck transportation, support activities for transportation, and warehousing and storage subsectors, the pandemic had a relatively small impact on employment. Employment decreased between five and twelve percent between January 2020 and April 2020, then increased over the rest of the year. Employment in warehousing and storage surpassed pre-pandemic levels by December, while employment in truck transportation and support activities for transportation had not fully recovered.
Employment in the couriers and messengers subsector increased throughout the pandemic, benefitting from pandemic-driven changes in consumer behavior. Particularly early in the pandemic, consumers avoided in-person shopping and relied on online retail to purchase goods; Google Mobility data3 showed retail and recreation 1 The federal government employs roughly 3,300 Postal Service workers, who are not included in private employment estimates. Postal Service employment was essentially unchanged throughout 2020. 2 Employment numbers for the transportation and warehousing sector use data from the Current Employment Statistics (CES) program. Employment numbers for subsectors use data from the Quarterly Census of
Employment and Wages (QCEW) program, which offers more detailed data on employment by industry. These programs use different methods to estimate employment. CES is a survey-based employer estimate, while QCEW is a quarterly measure of employment at business establishments subject to the unemployment insurance law.
3 Poovey, Jason, Human Mobility and COVID-19 Transmission Dashboard, https://public.tableau.com/profile/jason.poovey#!/vizhome/MobilityDashboardPublic/MobilityDashboard.
traffic fell by around 40 percent in April 2020. Many goods purchased online are delivered to consumers by businesses in the couriers and messengers subsector, and this subsector saw a surge in employment. In March and April 2020, while total nonfarm employment fell by 107,000, couriers and messengers employment increased by 160 jobs, roughly five percent of its total workforce. This growth continued throughout 2020; by December 2020, couriers and messengers employment had increased 45 percent over the previous December. Employment in transit and ground passenger transportation decreased until July 2020. Much of this decline was related to school bus transportation, which was impacted by remote-learning during the last few months of the 2019-2020 school year. In addition to pandemic-related employment declines, school bus transportation employment is typically lower during the summer, when school is not in session. In July 2019, transit and ground passenger transportation decreased 22 percent from employment during the school year, while in July 2020, it was more than 60 percent below typical school year employment levels. Transit and ground passenger transportation employment increased in August and September 2020, the result of the start of the 2020-2021 school year, with at least some students returning to in-person or hybrid schooling. However, there were no additional employment gains over the rest of the year, and employment remained roughly 25 percent below normal levels by the end of 2020.
50%
100%
150%
200%
250%
300%
350%
400%
Over-The-Year Percent Change in Job Postings
All Industries Transportation and Warehousing
Over-The-Year Percent Change in Job Postings
Source: Burning Glass Technologies, Job Posting Data from January 2019 – March 2021
New Hampshire Economic Conditions - May 2021 www.nhes.nh.gov/elmi
New Hampshire Employment Security, Economic and Labor Market Information Bureau 3
4 Poovey, Jason, Human Mobility and COVID-19 Transmission Dashboard, https://public.tableau.com/profile/jason.poovey#!/vizhome/MobilityDashboardPublic/MobilityDashboard. 5 Long Term Industry Projections were released prior to the COVID pandemic, and do not reflect its impact on workforce growth and trends.
Public transportation — urban transit systems and interurban and rural bus transportation – is also a part of the transit and ground passenger transportation subsector. Public transportation systems have seen reduced demand throughout the coronavirus pandemic. Google Mobility data show that the number of New Hampshire residents visiting public transportation hubs like bus stops fell more than 20 percent in April 2020.4 Traffic around public transportation hubs returned to near-normal levels over the summer, before falling again through the fall and winter. While most of the transportation and warehousing sector is focused on transporting goods, transit and ground passenger transportation transports people. It is not surprising that employment in this subsector was affected much more than other subsectors; social distancing requirements and health concerns meant many people were not comfortable using mass transit systems during the pandemic. In addition, the increase in remote work and learning arrangements meant many students and workers who relied on mass transit systems did not need to travel to work or school during the pandemic. As of April 2021, most schools in
New Hampshire have returned to in-person instruction, which should increase transit and ground passenger transportation employment. In contrast, for subsectors that transported goods, the pandemic’s impact was either relatively small or even beneficial. The large increase in couriers and messengers employment may not be permanent, but this subsector, along with warehousing and storage, have been trending upwards in recent years, as consumer behaviors have increasingly shifted from in-person to online retail shopping. New Hampshire Employment Security’s 2018 – 2028 Long Term Industry Projections anticipate that employment in both of these industries will grow faster than the workforce overall, increasing by eight and sixteen percent, respectively.5 As an indication of the long-term outlook for these sectors, a number of large warehouse facilities are in development across New Hampshire, including a 2.5 million square foot complex in Hudson, NH, and an 800,000 square foot facility in Kingston, NH.
– Greg David, Economist
Growth Index of Transportation and Warehousing Subsectors
220
200
180
160
140
120
100
80
60
40
20
Transit and Ground Passenger Transporta�on
Support Ac�vi�es for Transporta�on
Couriers and Messengers
Warehousing and Storage
Truck Transporta�on
Grow
th In
dex:
100
= Ja
nuar
y 20
19 E
mpl
oym
ent L
evel
s
Growth Index of Transportation and Warehousing Subsectors
Source: New Hampshire Employment Security, Quarterly Covered Employment and Wages
New Hampshire Economic Conditions - May 2021 www.nhes.nh.gov/elmi
New Hampshire Employment Security, Economic and Labor Market Information Bureau 4
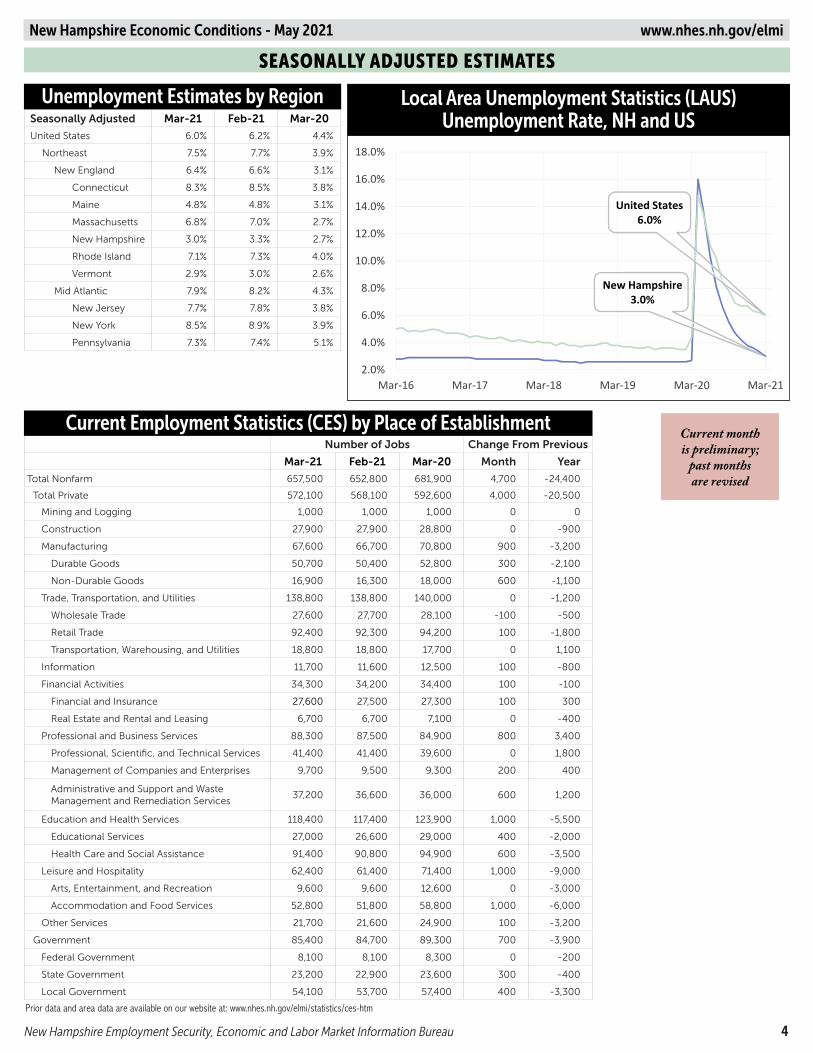
SEASONALLY ADJUSTED ESTIMATES
Local Area Unemployment Statistics (LAUS) Unemployment Rate, NH and US
2.0%
4.0%
6.0%
8.0%
10.0%
12.0%
14.0%
16.0%
18.0%
Mar-16 Mar-17 Mar-18 Mar-19 Mar-20 Mar-21
United States 6.0%
New Hampshire 3.0%
Current monthis preliminary;
past monthsare revised
Prior data and area data are available on our website at: www.nhes.nh.gov/elmi/statistics/ces-htm
Number of Jobs Change From Previous
Mar-21 Feb-21 Mar-20 Month Year
Total Nonfarm 657,500 652,800 681,900 4,700 -24,400
Total Private 572,100 568,100 592,600 4,000 -20,500
Mining and Logging 1,000 1,000 1,000 0 0
Construction 27,900 27,900 28,800 0 -900
Manufacturing 67,600 66,700 70,800 900 -3,200
Durable Goods 50,700 50,400 52,800 300 -2,100
Non-Durable Goods 16,900 16,300 18,000 600 -1,100
Trade, Transportation, and Utilities 138,800 138,800 140,000 0 -1,200
Wholesale Trade 27,600 27,700 28,100 -100 -500
Retail Trade 92,400 92,300 94,200 100 -1,800
Transportation, Warehousing, and Utilities 18,800 18,800 17,700 0 1,100
Information 11,700 11,600 12,500 100 -800
Financial Activities 34,300 34,200 34,400 100 -100
Financial and Insurance 27,600 27,500 27,300 100 300
Real Estate and Rental and Leasing 6,700 6,700 7,100 0 -400
Professional and Business Services 88,300 87,500 84,900 800 3,400
Professional, Scientific, and Technical Services 41,400 41,400 39,600 0 1,800
Management of Companies and Enterprises 9,700 9,500 9,300 200 400
Administrative and Support and WasteManagement and Remediation Services
37,200 36,600 36,000 600 1,200
Education and Health Services 118,400 117,400 123,900 1,000 -5,500
Educational Services 27,000 26,600 29,000 400 -2,000
Health Care and Social Assistance 91,400 90,800 94,900 600 -3,500
Leisure and Hospitality 62,400 61,400 71,400 1,000 -9,000
Arts, Entertainment, and Recreation 9,600 9,600 12,600 0 -3,000
Accommodation and Food Services 52,800 51,800 58,800 1,000 -6,000
Other Services 21,700 21,600 24,900 100 -3,200
Government 85,400 84,700 89,300 700 -3,900
Federal Government 8,100 8,100 8,300 0 -200
State Government 23,200 22,900 23,600 300 -400
Local Government 54,100 53,700 57,400 400 -3,300
Seasonally Adjusted Mar-21 Feb-21 Mar-20
United States 6.0% 6.2% 4.4%
Northeast 7.5% 7.7% 3.9%
New England 6.4% 6.6% 3.1%
Connecticut 8.3% 8.5% 3.8%
Maine 4.8% 4.8% 3.1%
Massachusetts 6.8% 7.0% 2.7%
New Hampshire 3.0% 3.3% 2.7%
Rhode Island 7.1% 7.3% 4.0%
Vermont 2.9% 3.0% 2.6%
Mid Atlantic 7.9% 8.2% 4.3%
New Jersey 7.7% 7.8% 3.8%
New York 8.5% 8.9% 3.9%
Pennsylvania 7.3% 7.4% 5.1%
Current Employment Statistics (CES) by Place of Establishment
Unemployment Estimates by Region
New Hampshire Economic Conditions - May 2021 www.nhes.nh.gov/elmi
New Hampshire Employment Security, Economic and Labor Market Information Bureau 5
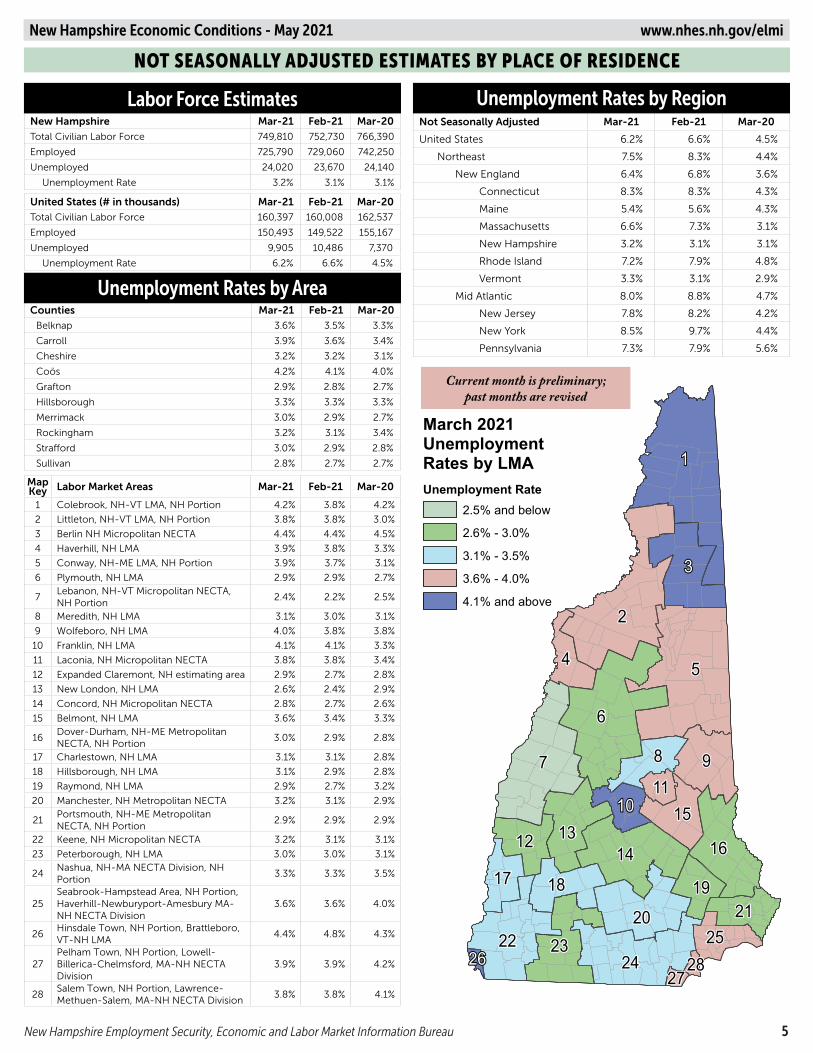
March 2021Unemployment Rates by LMAUnemployment Rate 1
2.5% and belo w
2.6% - 3.0%
3.1% - 3.5%
3.6% - 4.0%
4.1% and above 3
2
4 5
6
7 8 911
10 1512 13
14 1617 18 19
20 2122 23 25
26 24 2827
Not Seasonally Adjusted Mar-21 Feb-21 Mar-20
United States 6.2% 6.6% 4.5%
Northeast 7.5% 8.3% 4.4%
New England 6.4% 6.8% 3.6%
Connecticut 8.3% 8.3% 4.3%
Maine 5.4% 5.6% 4.3%
Massachusetts 6.6% 7.3% 3.1%
New Hampshire 3.2% 3.1% 3.1%
Rhode Island 7.2% 7.9% 4.8%
Vermont 3.3% 3.1% 2.9%
Mid Atlantic 8.0% 8.8% 4.7%
New Jersey 7.8% 8.2% 4.2%
New York 8.5% 9.7% 4.4%
Pennsylvania 7.3% 7.9% 5.6%
NOT SEASONALLY ADJUSTED ESTIMATES BY PLACE OF RESIDENCE
New Hampshire Mar-21 Feb-21 Mar-20
Total Civilian Labor Force 749,810 752,730 766,390
Employed 725,790 729,060 742,250
Unemployed 24,020 23,670 24,140
Unemployment Rate 3.2% 3.1% 3.1%
United States (# in thousands) Mar-21 Feb-21 Mar-20
Total Civilian Labor Force 160,397 160,008 162,537
Employed 150,493 149,522 155,167
Unemployed 9,905 10,486 7,370
Unemployment Rate 6.2% 6.6% 4.5%
Labor Force Estimates Unemployment Rates by Region
Counties Mar-21 Feb-21 Mar-20
Belknap 3.6% 3.5% 3.3%
Carroll 3.9% 3.6% 3.4%
Cheshire 3.2% 3.2% 3.1%
Coös 4.2% 4.1% 4.0%
Grafton 2.9% 2.8% 2.7%
Hillsborough 3.3% 3.3% 3.3%
Merrimack 3.0% 2.9% 2.7%
Rockingham 3.2% 3.1% 3.4%
Strafford 3.0% 2.9% 2.8%
Sullivan 2.8% 2.7% 2.7%
Map Key Labor Market Areas Mar-21 Feb-21 Mar-20
1 Colebrook, NH-VT LMA, NH Portion 4.2% 3.8% 4.2%
2 Littleton, NH-VT LMA, NH Portion 3.8% 3.8% 3.0%
3 Berlin NH Micropolitan NECTA 4.4% 4.4% 4.5%
4 Haverhill, NH LMA 3.9% 3.8% 3.3%
5 Conway, NH-ME LMA, NH Portion 3.9% 3.7% 3.1%
6 Plymouth, NH LMA 2.9% 2.9% 2.7%
7Lebanon, NH-VT Micropolitan NECTA, NH Portion
2.4% 2.2% 2.5%
8 Meredith, NH LMA 3.1% 3.0% 3.1%
9 Wolfeboro, NH LMA 4.0% 3.8% 3.8%
10 Franklin, NH LMA 4.1% 4.1% 3.3%
11 Laconia, NH Micropolitan NECTA 3.8% 3.8% 3.4%
12 Expanded Claremont, NH estimating area 2.9% 2.7% 2.8%
13 New London, NH LMA 2.6% 2.4% 2.9%
14 Concord, NH Micropolitan NECTA 2.8% 2.7% 2.6%
15 Belmont, NH LMA 3.6% 3.4% 3.3%
16Dover-Durham, NH-ME Metropolitan NECTA, NH Portion
3.0% 2.9% 2.8%
17 Charlestown, NH LMA 3.1% 3.1% 2.8%
18 Hillsborough, NH LMA 3.1% 2.9% 2.8%
19 Raymond, NH LMA 2.9% 2.7% 3.2%
20 Manchester, NH Metropolitan NECTA 3.2% 3.1% 2.9%
21Portsmouth, NH-ME Metropolitan NECTA, NH Portion
2.9% 2.9% 2.9%
22 Keene, NH Micropolitan NECTA 3.2% 3.1% 3.1%
23 Peterborough, NH LMA 3.0% 3.0% 3.1%
24Nashua, NH-MA NECTA Division, NH Portion
3.3% 3.3% 3.5%
25Seabrook-Hampstead Area, NH Portion, Haverhill-Newburyport-Amesbury MA-NH NECTA Division
3.6% 3.6% 4.0%
26Hinsdale Town, NH Portion, Brattleboro, VT-NH LMA
4.4% 4.8% 4.3%
27Pelham Town, NH Portion, Lowell-Billerica-Chelmsford, MA-NH NECTA Division
3.9% 3.9% 4.2%
28Salem Town, NH Portion, Lawrence-Methuen-Salem, MA-NH NECTA Division
3.8% 3.8% 4.1%
Current month is preliminary;past months are revised
Unemployment Rates by Area
March 2021Unemployment Rates by LMAUnemployment Rate 1
2.5% and belo w
2.6% - 3.0%
3.1% - 3.5%
3.6% - 4.0%
4.1% and above 3
2
4 5
6
7 8 911
10 1512 13
14 1617 18 19
20 2122 23 25
26 24 2827
2525
33
11
55
22
44
991111
88
15151010
66
13131212
77
17171414
1818
22222020
24242323
1616
19192121
28282727
2626
New Hampshire Economic Conditions - May 2021 www.nhes.nh.gov/elmi
New Hampshire Employment Security, Economic and Labor Market Information Bureau 6
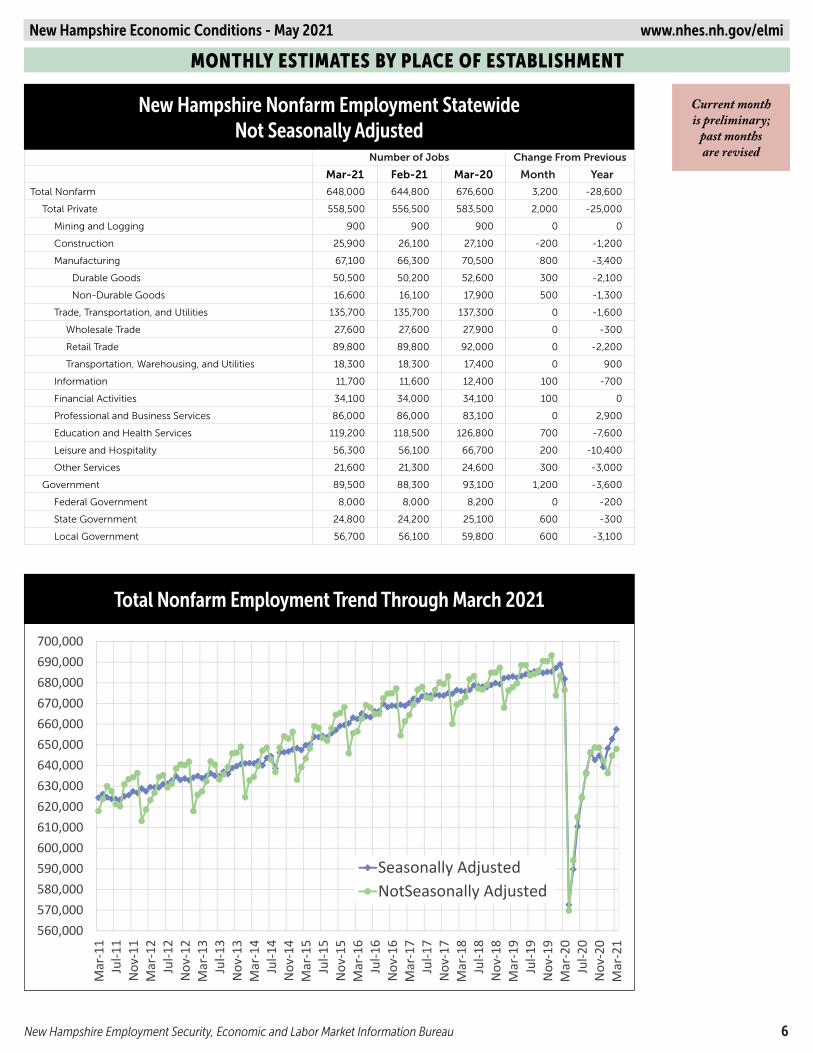
MONTHLY ESTIMATES BY PLACE OF ESTABLISHMENT
Current monthis preliminary;
past monthsare revised
Total Nonfarm Employment TrendTotal Nonfarm Employment Trend Through March 2021
700,000690,000680,000670,000660,000650,000640,000630,000620,000610,000600,000590,000 Seasonally Adjusted580,000 Not Seasonally Adjusted570,000560,000
Mar
-11
Jul-1
1N
ov-1
1M
ar-1
2Ju
l-12
Nov
-12
Mar
-13
Jul-1
3N
ov-1
3M
ar-1
4Ju
l-14
Nov
-14
Mar
-15
Jul-1
5N
ov-1
5M
ar-1
6Ju
l-16
Nov
-16
Mar
-17
Jul-1
7N
ov-1
7M
ar-1
8Ju
l-18
Nov
-18
Mar
-19
Jul-1
9N
ov-1
9M
ar-2
0Ju
l-20
Nov
-20
Mar
-21
Number of Jobs Change From Previous
Mar-21 Feb-21 Mar-20 Month Year
Total Nonfarm 648,000 644,800 676,600 3,200 -28,600
Total Private 558,500 556,500 583,500 2,000 -25,000
Mining and Logging 900 900 900 0 0
Construction 25,900 26,100 27,100 -200 -1,200
Manufacturing 67,100 66,300 70,500 800 -3,400
Durable Goods 50,500 50,200 52,600 300 -2,100
Non-Durable Goods 16,600 16,100 17,900 500 -1,300
Trade, Transportation, and Utilities 135,700 135,700 137,300 0 -1,600
Wholesale Trade 27,600 27,600 27,900 0 -300
Retail Trade 89,800 89,800 92,000 0 -2,200
Transportation, Warehousing, and Utilities 18,300 18,300 17,400 0 900
Information 11,700 11,600 12,400 100 -700
Financial Activities 34,100 34,000 34,100 100 0
Professional and Business Services 86,000 86,000 83,100 0 2,900
Education and Health Services 119,200 118,500 126,800 700 -7,600
Leisure and Hospitality 56,300 56,100 66,700 200 -10,400
Other Services 21,600 21,300 24,600 300 -3,000
Government 89,500 88,300 93,100 1,200 -3,600
Federal Government 8,000 8,000 8,200 0 -200
State Government 24,800 24,200 25,100 600 -300
Local Government 56,700 56,100 59,800 600 -3,100
New Hampshire Nonfarm Employment Statewide Not Seasonally Adjusted
Total Nonfarm Employment Trend Through March 2021
New Hampshire Economic Conditions - May 2021 www.nhes.nh.gov/elmi
New Hampshire Employment Security, Economic and Labor Market Information Bureau 7
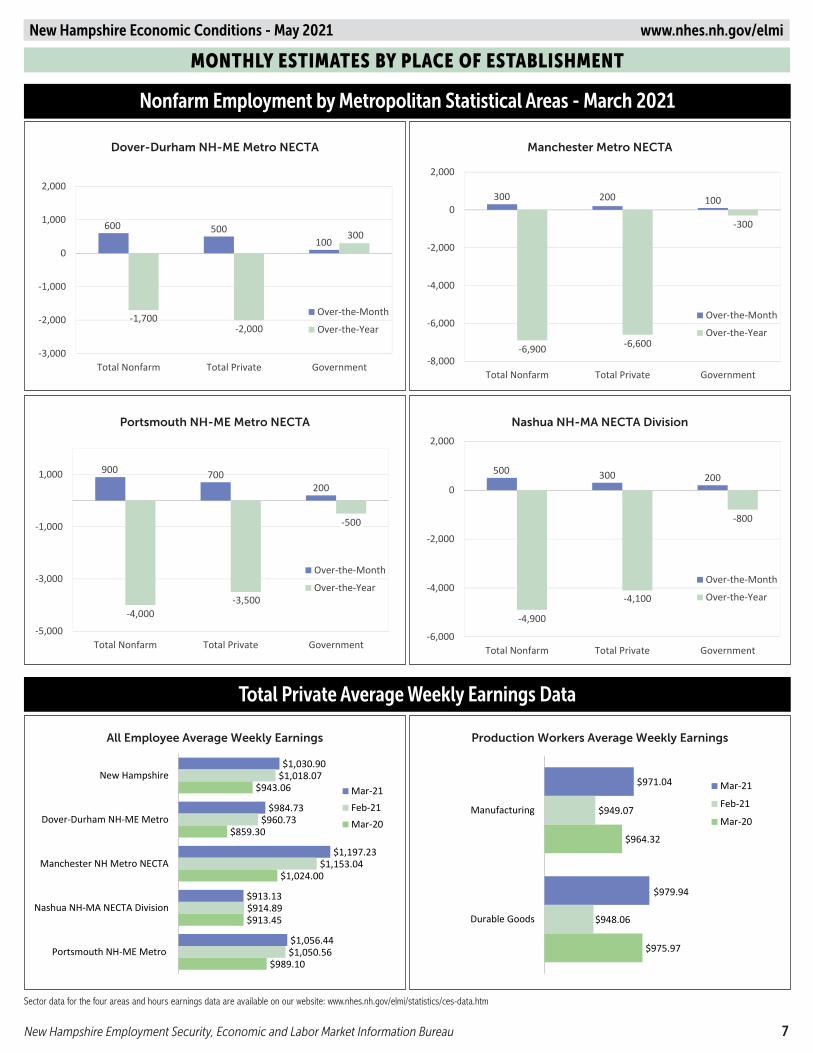
MONTHLY ESTIMATES BY PLACE OF ESTABLISHMENT
Nonfarm Employment by Metropolitan Statistical Areas - March 2021
$1,030.90
$984.73
$1,197.23
$913.13
$1,056.44
$1,018.07
$960.73
$1,153.04
$914.89
$1,050.56
$943.06
$859.30
$1,024.00
$913.45
$989.10
New Hampshire
Dover-Durham NH-ME Metro
Manchester NH Metro NECTA
Nashua NH-MA NECTA Division
Portsmouth NH-ME Metro
All Employee Average Weekly Earnings
Mar-21Feb-21Mar-20
$971.04
$979.94
$949.07
$948.06
$964.32
$975.97
Manufacturing
Durable Goods
Production Workers Average Weekly Earnings
Mar-21
Feb-21
Mar-20
600 500100
-1,700-2,000
300
-3,000
-2,000
-1,000
0
1,000
2,000
Total Nonfarm Total Private Government
Dover-Durham NH-ME Metro NECTA
Over-the-Month
Over-the-Year
300 200 100
-6,900 -6,600
-300
-8,000
-6,000
-4,000
-2,000
0
2,000
Total Nonfarm Total Private Government
Manchester Metro NECTA
Over-the-Month
Over-the-Year
500 300 200
-4,900
-4,100
-800
-6,000
-4,000
-2,000
0
2,000
Total Nonfarm Total Private Government
Nashua NH-MA NECTA Division
Over-the-Month
Over-the-Year
900 700200
-4,000-3,500
-500
-5,000
-3,000
-1,000
1,000
Total Nonfarm Total Private Government
Portsmouth NH-ME Metro NECTA
Over-the-MonthOver-the-Year
Total Private Average Weekly Earnings Data
Sector data for the four areas and hours earnings data are available on our website: www.nhes.nh.gov/elmi/statistics/ces-data.htm
Dover-Durham NH-ME Metro NECTA Manchester Metro NECTA
Portsmouth NH-ME Metro NECTA Nashua NH-MA NECTA Division
All Employee Average Weekly Earnings Production Workers Average Weekly Earnings
New Hampshire Economic Conditions - May 2021 www.nhes.nh.gov/elmi
New Hampshire Employment Security, Economic and Labor Market Information Bureau 8
MONTHLY ANALYSIS OF CURRENT EMPLOYMENT STATISTICS (CES)
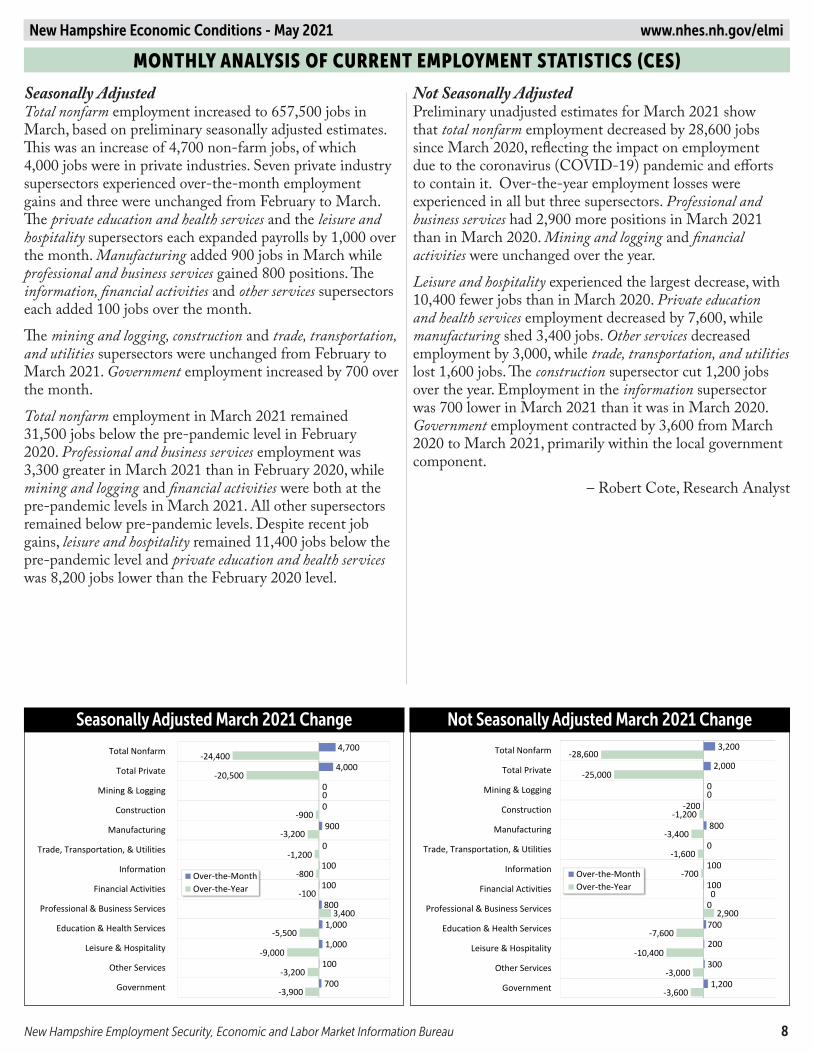
Seasonally AdjustedTotal nonfarm employment increased to 657,500 jobs in March, based on preliminary seasonally adjusted estimates. This was an increase of 4,700 non-farm jobs, of which 4,000 jobs were in private industries. Seven private industry supersectors experienced over-the-month employment gains and three were unchanged from February to March. The private education and health services and the leisure and hospitality supersectors each expanded payrolls by 1,000 over the month. Manufacturing added 900 jobs in March while professional and business services gained 800 positions. The information, financial activities and other services supersectors each added 100 jobs over the month. The mining and logging, construction and trade, transportation, and utilities supersectors were unchanged from February to March 2021. Government employment increased by 700 over the month.Total nonfarm employment in March 2021 remained 31,500 jobs below the pre-pandemic level in February 2020. Professional and business services employment was 3,300 greater in March 2021 than in February 2020, while mining and logging and financial activities were both at the pre-pandemic levels in March 2021. All other supersectors remained below pre-pandemic levels. Despite recent job gains, leisure and hospitality remained 11,400 jobs below the pre-pandemic level and private education and health services was 8,200 jobs lower than the February 2020 level.
3,200
2,000
0
-200
800
0
100
100
0
700
200
300
1,200
-28,600
-25,000
0
-1,200
-3,400
-1,600
-700
0
2,900
-7,600
-10,400
-3,000
-3,600
Total Nonfarm
Total Private
Mining & Logging
Construction
Manufacturing
Trade, Transportation, & Utilities
Information
Financial Activities
Professional & Business Services
Education & Health Services
Leisure & Hospitality
Other Services
Government
Over-the-MonthOver-the-Year
4,700
4,000
0
0
900
0
100
100
800
1,000
1,000
100
700
-24,400
-20,500
0
-900
-3,200
-1,200
-800
-100
3,400
-5,500
-9,000
-3,200
-3,900
Total Nonfarm
Total Private
Mining & Logging
Construction
Manufacturing
Trade, Transportation, & Utilities
Information
Financial Activities
Professional & Business Services
Education & Health Services
Leisure & Hospitality
Other Services
Government
Over-the-MonthOver-the-Year
Seasonally Adjusted March 2021 Change Not Seasonally Adjusted March 2021 Change
Not Seasonally AdjustedPreliminary unadjusted estimates for March 2021 show that total nonfarm employment decreased by 28,600 jobs since March 2020, reflecting the impact on employment due to the coronavirus (COVID-19) pandemic and efforts to contain it. Over-the-year employment losses were experienced in all but three supersectors. Professional and business services had 2,900 more positions in March 2021 than in March 2020. Mining and logging and financial activities were unchanged over the year. Leisure and hospitality experienced the largest decrease, with 10,400 fewer jobs than in March 2020. Private education and health services employment decreased by 7,600, while manufacturing shed 3,400 jobs. Other services decreased employment by 3,000, while trade, transportation, and utilities lost 1,600 jobs. The construction supersector cut 1,200 jobs over the year. Employment in the information supersector was 700 lower in March 2021 than it was in March 2020. Government employment contracted by 3,600 from March 2020 to March 2021, primarily within the local government component.
– Robert Cote, Research Analyst
New Hampshire Economic Conditions - May 2021 www.nhes.nh.gov/elmi
New Hampshire Employment Security, Economic and Labor Market Information Bureau 9
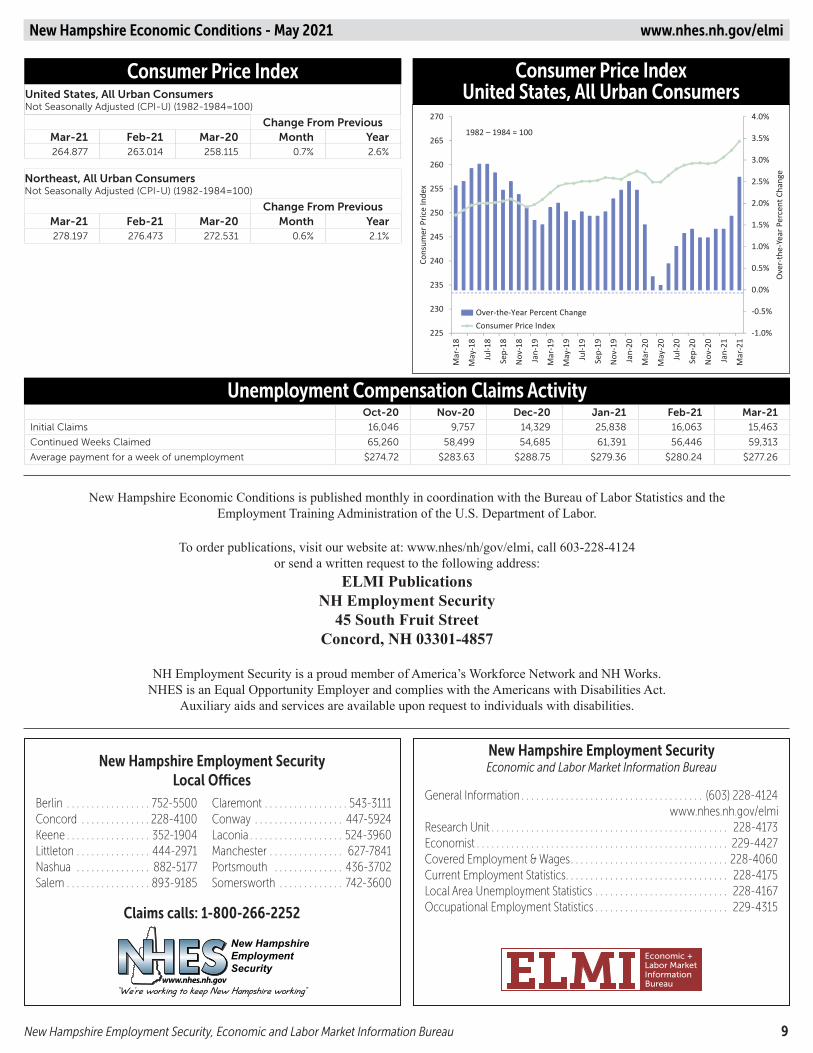
Consumer Price Index
Unemployment Compensation Claims Activity
270 4.0%
1982 – 1984 = 100265 3.5%
260 3.0%
2.5%255
2.0%250
1.5%245
1.0%
2400.5%
235 0.0%
230 Over-the-Year Percent ChangeConsumer Price Index
-0.5%
225 -1.0%
Cons
umer
Pric
e In
dex
Mar
-18
May
-18
Jul-1
8
Sep-
18
Nov
-18
Jan-
19
Mar
-19
May
-19
Jul-1
9
Sep-
19
Nov
-19
Jan-
20
Mar
-20
May
-20
Jul-2
0
Sep-
20
Nov
-20
Jan-
21
Mar
-21
Ove
r-th
e-Ye
ar P
erce
nt C
hang
e
Consumer Price Index United States, All Urban Consumers
New Hampshire Economic Conditions is published monthly in coordination with the Bureau of Labor Statistics and theEmployment Training Administration of the U.S. Department of Labor.
To order publications, visit our website at: www.nhes/nh/gov/elmi, call 603-228-4124or send a written request to the following address:
ELMI PublicationsNH Employment Security
45 South Fruit StreetConcord, NH 03301-4857
NH Employment Security is a proud member of America’s Workforce Network and NH Works.NHES is an Equal Opportunity Employer and complies with the Americans with Disabilities Act.
Auxiliary aids and services are available upon request to individuals with disabilities.
New Hampshire Employment Security Local Offices
Berlin . . . . . . . . . . . . . . . . . 752-5500 Claremont . . . . . . . . . . . . . . . . . 543-3111Concord . . . . . . . . . . . . . . 228-4100 Conway . . . . . . . . . . . . . . . . . . 447-5924Keene . . . . . . . . . . . . . . . . . 352-1904 Laconia . . . . . . . . . . . . . . . . . . . 524-3960Littleton . . . . . . . . . . . . . . . 444-2971 Manchester . . . . . . . . . . . . . . . 627-7841 Nashua . . . . . . . . . . . . . . . 882-5177 Portsmouth . . . . . . . . . . . . . . 436-3702 Salem . . . . . . . . . . . . . . . . . 893-9185 Somersworth . . . . . . . . . . . . . 742-3600
Claims calls: 1-800-266-2252
New Hampshire Employment Security Economic and Labor Market Information Bureau
General Information . . . . . . . . . . . . . . . . . . . . . . . . . . . . . . . . . . . . . (603) 228-4124www .nhes .nh .gov/elmi
Research Unit . . . . . . . . . . . . . . . . . . . . . . . . . . . . . . . . . . . . . . . . . . . . . . . . 228-4173Economist . . . . . . . . . . . . . . . . . . . . . . . . . . . . . . . . . . . . . . . . . . . . . . . . . . . 229-4427Covered Employment & Wages . . . . . . . . . . . . . . . . . . . . . . . . . . . . . . . . 228-4060Current Employment Statistics . . . . . . . . . . . . . . . . . . . . . . . . . . . . . . . . . 228-4175Local Area Unemployment Statistics . . . . . . . . . . . . . . . . . . . . . . . . . . . 228-4167Occupational Employment Statistics . . . . . . . . . . . . . . . . . . . . . . . . . . . 229-4315
Oct-20 Nov-20 Dec-20 Jan-21 Feb-21 Mar-21Initial Claims 16,046 9,757 14,329 25,838 16,063 15,463
Continued Weeks Claimed 65,260 58,499 54,685 61,391 56,446 59,313
Average payment for a week of unemployment $274.72 $283.63 $288.75 $279.36 $280.24 $277.26
United States, All Urban ConsumersNot Seasonally Adjusted (CPI-U) (1982-1984=100)
Change From PreviousMar-21 Feb-21 Mar-20 Month Year264.877 263.014 258.115 0.7% 2.6%
Northeast, All Urban ConsumersNot Seasonally Adjusted (CPI-U) (1982-1984=100)
Change From PreviousMar-21 Feb-21 Mar-20 Month Year278.197 276.473 272.531 0.6% 2.1%