Embed Size (px)
Citation preview
PEONew HampshireOffice of Energy & Planning
2007
2008 - 2013
Statewide ComprehenSive
outdoor reCreation plan
(SCorp)
New Hampshire OUTDOORS
NEW HAMPSHIRE OUTDOORS
2008-2013
STATEWIDE COMPREHENSIVE
OUTDOOR RECREATION PLAN
STATE OF NEW HAMPSHIRE
GOVERNOR
John H. Lynch
OFFICE OF ENERGY AND PLANNING
Amy Ignatius, Director
DEPARTMENT OF RESOURCES AND ECONOMIC DEVELOPMENT
George M. Bald, Commissioner
Allison McLean, Director of Parks and Recreation
December 2007
i
TABLE OF CONTENTS
Table of Contents ..................................................................................................................... i
List of Appendices .................................................................................................................. iii
List of Figures, Tables and Graphs ...................................................................................... iv
Acknowledgements ..................................................................................................................v
Chapter 1 – Overview .............................................................................................................. 1
1. Purpose ...................................................................................................................................... 1
2. New Hampshire Outdoors ......................................................................................................... 1
3. What is Outdoor Recreation ...................................................................................................... 2
4. Planning Process........................................................................................................................ 3
5. Focus of 2008-2013 SCORP .......................................................................................... 8
Chapter 2 – Supply, Demand, and Need .............................................................................. 9
1. Major Trends ............................................................................................................................ 9
National Trends and Management Considerations ............................................................ 9
State Trends ..................................................................................................................... 11
2. Recreation Supply ................................................................................................................. 13
Conservation Lands in New Hampshire .......................................................................... 14
OEP Recreation Inventory ............................................................................................... 18
Supply of Public Access to Public Waters ....................................................................... 22
Current Use Lands ........................................................................................................... 24
State Lands ....................................................................................................................... 27
3. Recreation Demands and Needs ............................................................................................. 34
National Facts and Figures............................................................................................... 34
Participation in the Northeast United States .................................................................... 37
New Hampshire Statistics ................................................................................................ 38
Wildlife-Related Recreation Trends ............................................................................... 39
Statewide Recreational Demand ...................................................................................... 40
Demand for Water Access ............................................................................................... 44
New Hampshire Licenses and Registrations .................................................................... 49
Travel and Tourism .......................................................................................................... 52
Socio-Economic Trends ................................................................................................... 55
Community Recreation .................................................................................................... 59
Community Profiles ......................................................................................................... 61
Chapter 3 – Recreational Issues of Statewide Importance ............................................... 63
1. Stewardship of the Natural Resource Base for Outdoor Recreation ...................................... 65
Summary .......................................................................................................................... 65
Overview .......................................................................................................................... 66
New Hampshire Conditions and Trends .......................................................................... 66
Goal, Objective, Strategy ................................................................................................. 81
Selected Contacts and Information Resources ................................................................. 83
ii
2. Providing Different, Sometimes Competing, Recreational Opportunities ............................. 84
Summary .......................................................................................................................... 84
Overview .......................................................................................................................... 85
New Hampshire Conditions and Trends .......................................................................... 86
Goal, Objective, Strategy ................................................................................................. 95
Selected Contacts and Information Resources ................................................................. 97
3. Apply Limited Financial and Human Resources to Address a
Range of Recreation Needs .................................................................................................... 98
Summary .......................................................................................................................... 98
Overview .......................................................................................................................... 98
Federal Funding ............................................................................................................... 99
State Funding ................................................................................................................. 101
Local Funding ................................................................................................................ 103
Goal, Objective, Strategy ............................................................................................... 105
Selected Contacts and Information Resources ............................................................... 107
4. Education of Recreational Users, Municipalities, and Landowners about
Responsible Behavior, Laws, and Liability .......................................................................... 108
Summary ........................................................................................................................ 108
Overview ........................................................................................................................ 108
New Hampshire Conditions and Trends ........................................................................ 109
Goal, Objective, Strategy ............................................................................................... 113
Selected Contacts and Information Resources ............................................................... 114
5. Impacts of Existing Land Use Patterns on Recreational Opportunities ............................... 115
Summary ........................................................................................................................ 115
Overview ........................................................................................................................ 115
New Hampshire Conditions and Trends ........................................................................ 116
Goal, Objective, Strategy ............................................................................................... 122
Selected Contacts and Information Resources ............................................................... 124
6. Importance of Local Outdoor Recreation Opportunities and Open Space
Protection in Promoting Increased Health and Wellness ..................................................... 124
Summary ........................................................................................................................ 124
Overview ........................................................................................................................ 125
Nationwide Conditions .................................................................................................. 126
New Hampshire Conditions and Trends ........................................................................ 128
Goal, Objective, Strategy ............................................................................................... 128
Selected Contacts and Information Resources ............................................................... 130
Chapter 4 – Plan Implementation ..................................................................................... 131
1. Overview .............................................................................................................................. 131
2. Next Steps ............................................................................................................................ 131
iii
LIST OF APPENDICES
Appendix A 1997 Assessment of Outdoor Recreation in New Hampshire: A Summary
Report
Appendix B-1 2002 NH Outdoor Recreation Stakeholder Survey: Summary Report
Appendix B-2 2002 Summary Report #2: Summary of Open-Ended Responses to the NH
Outdoors Recreation Survey
Appendix C-1 2007 Outdoor Recreation and Conservation Leaders’ Survey: Summary
Report
Appendix C-2 2007 New Hampshire Outdoor Recreation Leaders’ Survey (UNH)
Appendix C-3 2007 New Hampshire Recreation & Conservation Leaders’ Survey:
Community Needs Assessment
Appendix D 2006 Public Advisory Committee Review of Recommendations
Appendix E Agency and Program Roles and Responsibilities
Appendix F SCORP Wetlands Priority Conservation Plan Update
Appendix G Wildlife Action Plan Executive Summary
Appendix H Open Project Selection Process
Appendix I New Hampshire Outdoors, 2003-2007 References
Appendix J New Hampshire Outdoors, 2008-2013 List of Committees
Appendix K List of Acronyms
iv
LIST OF FIGURES, TABLES AND GRAPHS
List of Figures
Figure 1. Counties of New Hampshire ......................................................................................... 13
Figure 2a. Public and Private Conservation Lands in New Hampshire: 2002 ............................... 16
Figure 2b. Public and Private Conservation Lands in New Hampshire: 2006 ............................... 17
Figure 3. NH Fish and Game Management Regions ................................................................... 45
Figure 4a. Locations of Exotic Aquatic Plant Sites in NH: 2002 .................................................. 77
Figure 4b. Locations of Exotic Aquatic Plant Sites in NH: 2007 ................................................... 78
Figure 5. Public Water Access Sign ........................................................................................... 111
List of Tables
Table 1. Conservation Lands by Owner and Protection Type .................................................... 14
Table 2. State and County Population Statistics, Land Acreage and Recreation Supply ........... 18
Table 3. Number of Sites by Selected Activity Types ................................................................ 20
Table 4. Recreational Land Acreage by Owner Type ................................................................ 21
Table 5. NH Fish and Game Public Water Access Sites ............................................................ 23
Table 6. Miles of Shoreline and Public Access Sites to Water ................................................... 24
Table 7. Current Use Lands - 2005 ............................................................................................. 25
Table 8. Current Use Lands with Recreational Adjustment - 2005 ............................................ 26
Table 9. DRED Lands and Reservations - 2006 ........................................................................ 27
Table 10. DRED - Use Classifications ......................................................................................... 28
Table 11. Number of Participations-General Population .............................................................. 36
Table 12. Nationwide Participation Rates - 2005 ......................................................................... 40
Table 13. Perceived Spending Priorities for Outdoor Recreation................................................. 42
Table 14. Importance of Selected Recreation-Related Management Objectives.......................... 42
Table 15. Most Visited Lakes, Ponds and Rivers in New Hampshire .......................................... 46
Table 16. Fishing, Hunting and Combo Licenses in New Hampshire.......................................... 49
Table 17. Wheeled Off Highway Vehicle and Snowmobile Registrations–1995-2006 ............... 51
Table 18. Actual and Projected Population by County: 1970-2020 ............................................. 56
Table 19. Rate of Population Change in New Hampshire Counties ............................................. 57
Table 20. Municipal Demand for LWCF Assistance Since 1990 in New Hampshire.................. 59
Table 21. Reported Community Recreational Needs ................................................................... 60
List of Graphs
Graph 1. Conservation Lands by Owner and Protection Type .................................................... 15
Graph 2. County Population vs. Recreation Acreage in 1997 and 2007 ..................................... 19
Graph 3. Percentage of Recreation Lands Federally or State Owned by County ........................ 22
Graph 4. Percent of Acres with 20% Recreation Adjustment ..................................................... 27
Graph 5. National Participation in Outdoor Recreation Activities .............................................. 35
Graph 6. National Trend by Region ............................................................................................ 38
Graph 7. Household Participation in Water-Based Activities ..................................................... 45
Graph 8. Does NH Need Additional Water Access? ................................................................... 47
Graph 9. What Type of Access Should Be Given Priority? ........................................................ 47
Graph 10. Boating Registrations in New Hampshire 1961-2005 .................................................. 50
Graph 11. New Hampshire State Park Visitation Trends .............................................................. 53
Graph 12. Per Capita Disposable Personal Income ....................................................................... 55
Graph 13. Population Growth by County ...................................................................................... 57
v
ACKNOWLEDGEMENTS
The production of New Hampshire Outdoors 2008-2013 was coordinated by the Office of
Energy and Planning (OEP) with assistance provided by the Department of Resources and
Economic Development (DRED). DRED is responsible for administering the Land and Water
Conservation Fund (LWCF) program in New Hampshire. Special recognition is given to the
SCORP Steering Committee for their valuable advice and direction provided throughout the
course of the project. Thanks are due to the SCORP Public Advisory Committee for their input
and feedback on issues and recommendations (organizations listed in Appendix J). Our thanks
also to Dr. Robert Barcelona, Dr. Joshua Carroll, and Scott Butch at the University of New
Hampshire who were instrumental in completing the web survey work, and to Dr. Michele Gagne
at UNH Cooperative Extension for setting up the Advisory Committee and web review of the
2003-2007 recommendations that were part of the planning process.
SCORP Steering Committee Will Abbott, Society for the Protection of New Hampshire Forests
Greg Bisson, Exeter Parks and Recreation Department
Joshua Carroll, University of New Hampshire
Jacquie Colburn, Department of Environmental Services
Bill Gegas, Department of Resources and Economic Development, Bureau of Trails
Gladi Hartford, Granite State Independent Living
Tom Jameson, Department of Transportation
Donna Kuethe, New Hampshire Recreation and Parks Association
Jayne O’Connor, White Mountain Attractions
Judy Silverberg, New Hampshire Fish and Game Department
Johane Telgener, Center for Health Promotion
OEP Staff Carol Barleon, Principal Planner/Project Manager
Tom Duffy, Demographics
Ken Gallager, GIS Data and Map Production
Jack Ruderman, Deputy Director
Michele Zydel, Administrative Assistance
DRED Staff Shari Colby, Division of Parks and Recreation, Community Outreach Specialist
Johanna Lyons, Division of Parks and Recreation, Planning and Development Specialist
Gail Wolek, Division of Parks and Recreation, Deputy Director
The production of this report was financed in part through a planning grant from the
National Park Service, Department of the Interior, under provisions of the Land and Water
Conservation Act of 1965 (Public Law 88-578).
Cover Photo Credits: From NHDTTD Collection starting from top left: Mountain Biking, Brooks Dodge;
Snowboarding, Bob Grant; Polar Cave, Gary Cralle; The Scent of Spring, Jesse Baker; Windsurfing on
Lake Sunapee, Suki Coughlin; Snowmobiler Climbing a Steep Hill, Yamaha Motor Corp.; Family Hiking,
Bob Grant; Bike Race, Philip Scalia; Walking Through Lupine, NHDTTD.
1
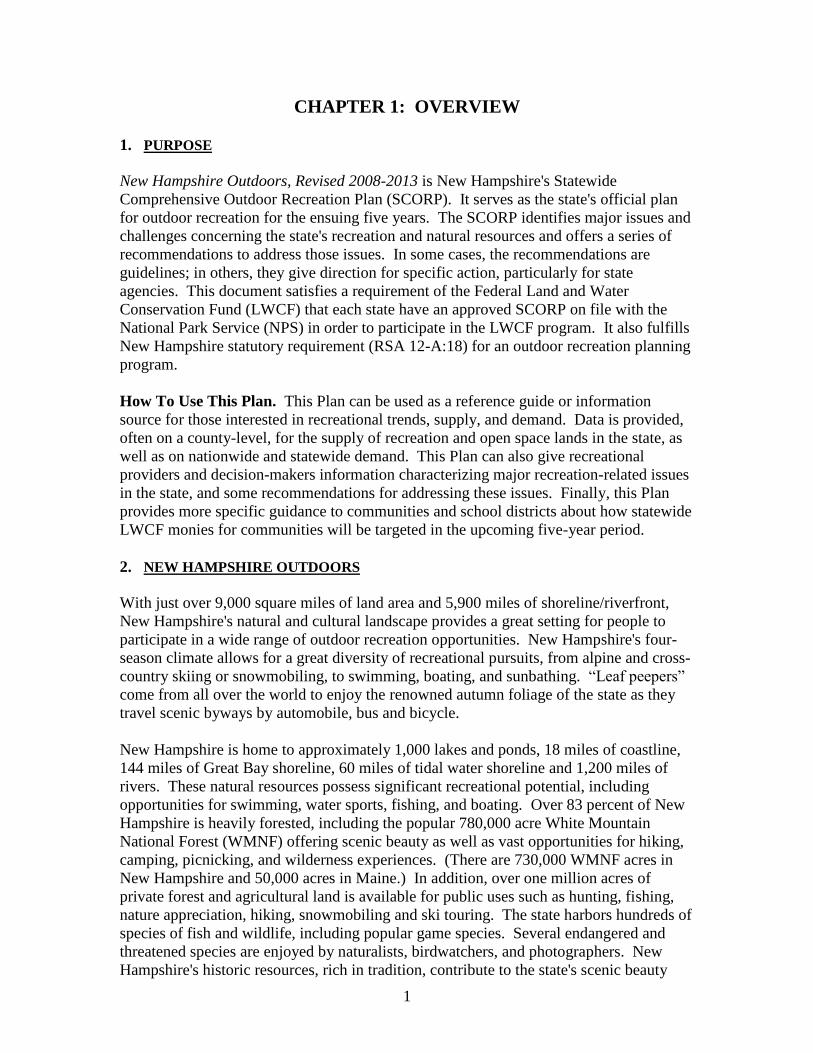
CHAPTER 1: OVERVIEW
1. PURPOSE
New Hampshire Outdoors, Revised 2008-2013 is New Hampshire's Statewide
Comprehensive Outdoor Recreation Plan (SCORP). It serves as the state's official plan
for outdoor recreation for the ensuing five years. The SCORP identifies major issues and
challenges concerning the state's recreation and natural resources and offers a series of
recommendations to address those issues. In some cases, the recommendations are
guidelines; in others, they give direction for specific action, particularly for state
agencies. This document satisfies a requirement of the Federal Land and Water
Conservation Fund (LWCF) that each state have an approved SCORP on file with the
National Park Service (NPS) in order to participate in the LWCF program. It also fulfills
New Hampshire statutory requirement (RSA 12-A:18) for an outdoor recreation planning
program.
How To Use This Plan. This Plan can be used as a reference guide or information
source for those interested in recreational trends, supply, and demand. Data is provided,
often on a county-level, for the supply of recreation and open space lands in the state, as
well as on nationwide and statewide demand. This Plan can also give recreational
providers and decision-makers information characterizing major recreation-related issues
in the state, and some recommendations for addressing these issues. Finally, this Plan
provides more specific guidance to communities and school districts about how statewide
LWCF monies for communities will be targeted in the upcoming five-year period.
2. NEW HAMPSHIRE OUTDOORS
With just over 9,000 square miles of land area and 5,900 miles of shoreline/riverfront,
New Hampshire's natural and cultural landscape provides a great setting for people to
participate in a wide range of outdoor recreation opportunities. New Hampshire's four-
season climate allows for a great diversity of recreational pursuits, from alpine and cross-
country skiing or snowmobiling, to swimming, boating, and sunbathing. “Leaf peepers”
come from all over the world to enjoy the renowned autumn foliage of the state as they
travel scenic byways by automobile, bus and bicycle.
New Hampshire is home to approximately 1,000 lakes and ponds, 18 miles of coastline,
144 miles of Great Bay shoreline, 60 miles of tidal water shoreline and 1,200 miles of
rivers. These natural resources possess significant recreational potential, including
opportunities for swimming, water sports, fishing, and boating. Over 83 percent of New
Hampshire is heavily forested, including the popular 780,000 acre White Mountain
National Forest (WMNF) offering scenic beauty as well as vast opportunities for hiking,
camping, picnicking, and wilderness experiences. (There are 730,000 WMNF acres in
New Hampshire and 50,000 acres in Maine.) In addition, over one million acres of
private forest and agricultural land is available for public uses such as hunting, fishing,
nature appreciation, hiking, snowmobiling and ski touring. The state harbors hundreds of
species of fish and wildlife, including popular game species. Several endangered and
threatened species are enjoyed by naturalists, birdwatchers, and photographers. New
Hampshire's historic resources, rich in tradition, contribute to the state's scenic beauty
2
and cultural heritage. Small historic villages, distinctive architecture, covered bridges,
winding country roads, and historic sites are all part of that tradition.
Tourism is one of the most important industries in the state. Our natural and cultural
resources are important, inspiring millions of residents and out-of-state visitors to visit
the state’s mountains, forests, lakes, rivers, and coastline. Promoting and encouraging
the enjoyment of the state’s outdoors builds the tourism industry and increases its
contributions to the state’s economy. With this, however, also comes the responsibility to
consider consequences related to providing for outdoor recreation and our state’s ability
to manage and steward our resource base. New Hampshire’s outdoors is crucial to
residents’ quality of life and the continued success of our tourism industry. It is
important for the state to protect what it also seeks to promote.
3. WHAT IS OUTDOOR RECREATION
With this diverse array of natural and cultural resources, outdoor recreation comprises
countless activities that are categorized in a variety of ways. Some activities require
specialized skill or equipment (e.g. rock-climbing, off-highway recreation vehicle travel);
others such as picnicking can be enjoyed by anyone. Some activities require a structured
environment and take place in developed recreation areas (e.g. tennis); others, such as
walking, are unstructured and can take place in many different locations at any time.
Activities can be motorized or non-motorized, consumptive (e.g. hunting, fishing) and
non-consumptive (e.g. bird-watching), active (soccer) or passive (sightseeing), have
relatively high impact (e.g. All-Terrain Vehicles) or low impact (e.g. hiking).
Different resources classify recreation in different ways. Below are two examples. In the
Illustrated Book of Development Definitions (Moskowitz and Lindbloom, 1993),
recreation is described as either passive or active. In this book, active recreation consists
of leisure activities that “require equipment or take place at prescribed places, sites, or
fields.” Passive recreation includes those activities that are relatively inactive or “less
energetic,” but also means “open space for nature walks and observation.”
The National Survey on Recreation and Environment (NSRE), one of the most widely
cited surveys on recreation, includes over 80 activities in its survey of U.S. residents, and
classifies outdoor recreation by the type of environment the activity relies upon.
Activities are classified as land-based, water-based, snow/ice-based, or developed and
further described as follows:
Land-based activities include trail, street and road activities, camping activities,
hunting, outdoor adventure activities (e.g. horseback riding, mountain climbing),
viewing/learning activities (e.g. wildlife watching), and social activities (e.g.
family gatherings).
Water-based activities include a range of boating/floating activities, fishing,
swimming, and viewing activities.
Snow and ice-based activities include downhill activities (e.g. snowboarding,
skiing), cross country skiing, ice-skating and snowmobiling.
3
Developed recreational activities (i.e. those that require a developed setting or
facility) include golf, tennis, outdoor team sports, and attending sporting events
or other outdoor events.
This SCORP recognizes that people participate in a broad range of activities that can all
be considered part of outdoor recreation. Some activities may rely on developed
recreational sites; others rely on large tracts of undeveloped open space or access to
public waters. This report addresses the broad range of recreation facilities. It includes
sites that provide for activities requiring some type of constructed or built facility.
Examples might include established campgrounds, picnic areas, boat launches, fishing
piers, tennis courts, golf courses, and the like. It includes recreational areas that may
offer recreational facilities or may offer opportunities for more dispersed recreation such
as hiking, bird watching, or mountain biking. Some recreational areas may have
established facilities; others may not. Undeveloped open space (public or private) also
provide for dispersed recreation activities such as hiking, hunting, snowshoeing and
nature observation.
4. PLANNING PROCESS
The breadth of this topic mandates that this statewide Plan identify and address many
different outdoor recreation-related issues and needs. Accordingly, the planning process
used to understand these issues and needs requires consideration of many different
perspectives. Therefore, multiple methods were used to collect input from various
stakeholder groups. These mechanisms include a public advisory committee, a steering
committee, surveys, and a stakeholder forum.
A Steering Committee was identified to provide the most direct input and guidance in
the planning process. The steering committee is made up of diverse representatives from
agencies, organizations, communities, and other stakeholder groups. The members of the
steering committee are listed in Appendix J.
Public Advisory Committee. A SCORP Public Advisory Committee was also
developed to provide a wider range of organizations an opportunity for input and
feedback about major recreational issues facing New Hampshire. The Office of Energy
and Planning and the Department of Resources and Economic Development identified
the advisory committee jointly. This larger group met once during the planning process
with a follow-up email survey. Organizations were invited to attend a December 2006
meeting to review the recommendations from the 2005-2007 SCORP and evaluate the
continuing relevance of the statewide recommendations (Appendix B). A follow-up
survey was distributed to a broader population, including this same group, to provide
them with an opportunity to give additional feedback and suggestions about the SCORP
recommendations. The University of New Hampshire Cooperative Extension staff
served as facilitators and designed and conducted the email survey.
Outdoor Recreation Leaders Survey. When developing the 2003-2007 SCORP, the
authors learned of the issues and concerns facing public recreation leaders and obtained
information on the quantity and adequacy of public recreation resources in local
communities. The Office of Energy and Planning worked with the University of New
4
Hampshire Recreation Management Department to undertake an Outdoor Recreation
Leaders’ Survey. The survey was used to gather information, create a forum for
communication, and encourage participation from critical stakeholders involved in public
recreation management and delivery. For the purposes of this survey, “public recreation
leaders” were identified as directors (or heads) of municipal and state recreation agencies
as well as chairpersons of local recreation and conservation commissions. For the 2008-
2013 SCORP, the database of public recreation leaders was updated and some minor
modifications were made, but essentially the same sample frame was surveyed.
The 2008-2013 SCORP Outdoor Recreation Leaders’ Survey (ORLS) utilized a modified
Salant-Dillman (1994) methodology:
In 2007 an introductory letter was mailed to a database of municipal recreation
directors, state park and recreation directors, recreation commission chairpersons
(if the municipality did not have a paid recreation director), and conservation
commission chairpersons introducing them to the study and inviting them to
participate. The introductory letter also included a link to an on-line version of
the ORLS.
The ORLS was based on the 2004 Outdoor Recreation Leaders’ Survey
conducted by UNH Resources, Economics and Development Department. The
survey was streamlined and modified slightly. There were several minor content
differences between the recreation and conservation versions of the survey.
A follow-up letter was mailed to all non-respondents approximately one week
later, along with a paper-based version of the ORLS and another link to the on-
line survey. There was no difference between the on-line and paper-based
versions and respondents were asked to choose one option to complete. Cross
checks of survey respondents were conducted to ensure that only one survey was
completed per respondent.
A post-card reminder was mailed to non-respondents approximately two weeks
after the follow-up letter and paper-based survey were mailed out.
A final letter with a link to the on-line version of the survey and additional paper-
based survey were mailed to all non-respondents approximately three weeks after
the follow-up letter and paper-based survey were mailed out. This letter noted
that this was the final opportunity to participate in the 2007 ORLS.
By June 2007, a total of 69 responses were received from recreation directors (n=25) and
conservation chairpersons (n=44). Total response to the 2007 Outdoor Recreation
Leaders’ Survey (N=69) exceeded the 2004 survey effort (N=46).
Findings. The 2007 Outdoor Recreation Leaders’ Survey attempted to investigate the
key management and planning concerns of public recreation leaders. One of the critical
issues facing public recreation delivery in New Hampshire is funding. For this study, the
average annual operating budget for municipal recreation departments was $240,000.
Conservation commissions indicated that their average annual operating budget was
$2,500. Both numbers reflect the restricted resource environment impacting many of the
smaller towns and communities in the state. In fact, access to funding was considered to

5
be one of the key management challenges for recreation managers, as noted by both
municipal recreation directors and conservation chairpersons.
Despite the funding challenges, more than half of recreation directors and conservation
chairpersons indicated that public funding support for recreation and conservation in their
communities had increased in the past 5 years. Less than 5 percent of survey respondents
indicated that public funding support for recreation or conservation had declined during
that time period.
A funding challenge that impacts public recreation managers is the development of a
diversified and stable mix of funding sources. The vast majority of respondents indicated
that taxes/appropriated funds were the principle funding source for both recreation and
conservation activities. Recreation directors indicated a more diversified mix of funding
sources when compared to conservation chairpersons. A significant majority of
municipal recreation departments receive funding from user fees and charges, with a
portion of respondents reporting that they receive funding (in order) from private
donations, public (state or federal) grants, corporate sponsorships, private foundation
grants, and impact fees. Conservation chairpersons indicated that a variety of taxes were
their primary means of funding conservation activities. A smaller portion (less than 25
percent) of conservation commissions indicated that they receive funding from private
donations, public grants (state or federal), private foundation grants, corporate
sponsorships, user fees/charges, and impact fees.
Respondents indicated that the delivery and management of recreation services is
typically carried out by a mix of full-time, part-time, volunteer, and contracted staff.
Municipal recreation departments were more likely to have paid staff assisting with these
efforts. The average numbers of full-time and part-time staff members serving the
communities participating in this study were 2 (full-time) and 19 (part-time).
Conservation commissions indicated that they rely heavily on volunteers to accomplish
their mandates. Respondents indicated that recruiting, motivating, and retaining
volunteers is a significant management challenge, and some conservation chairpersons
indicated support for paid staff to help carry out their duties. Likewise, recreation
directors also relied heavily on volunteers, with an average of 45 volunteers giving their
time to assist with recreation delivery per community.
This study illuminated the need for adequate outdoor space for organized recreation and
sport activities. This was a key concern for municipal recreation directors, as they
identified baseball/softball fields, multiuse athletic fields, nature/hiking trails,
playgrounds, skateboard parks, bike lanes/paths, and municipal parks to be among their
pressing resource acquisition priorities. While not outdoor-focused, more than half of the
recreation directors in this sample indicated that the acquisition of a community center
was a significant planning priority in the next 5 years. Interestingly, 6 of the 8 resource
acquisition priorities in the 2007 study (italicized above) were the same as the 2004
study.
Conservation chairpersons, on the other hand, identified nature/hiking trails, natural
areas, town/city forests, and multipurpose non-motorized trails as their key resource
6
acquisition priorities. All of these were also noted as significant priorities in the 2004
study as well.
The survey attempted to shed light on the key management priorities for public recreation
leaders. Municipal recreation directors identified improving facility maintenance/upkeep,
recruiting/retaining volunteers, developing new facilities for organized sports and
athletics, and marketing recreation opportunities as their most pressing management
priorities. They also identified addressing concerns with overuse of recreation areas,
ensuring public access to water-based recreation, new funding approaches, increasing the
annual operating and capital improvement budgets, increasing part-time staff, recreation
planning, addressing user conflicts, and improving linkages and connectivity as priorities.
The 2007 study included 8 of the top 10 management priorities (italicized) identified in
the 2004 study.
Conservation chairpersons identified protection of important natural areas, resource
acquisition, recreation planning, increasing capital funding budgets, regional planning
for trails and open space, and recruiting and retaining volunteers as their key
management priorities. Six of the top 7 management priorities (italicized) identified in
the 2007 survey were in the top 10 priorities noted in the 2004 study.
Public recreation leaders were asked to indicate, in their own words, their top three
management challenges. After condensing, coding, and categorizing their responses, the
following themes emerged:
Municipal Recreation Directors’ Challenges:
Resource Management and Development
Program Development
Staffing
Financing and Budgeting
Conservation Commission Challenges:
Resource Management and Protection
Education
Staffing and Volunteers
Collaboration and Partnerships
Oversight and Enforcement
Planning and Public Policy
Financing
Consistent with past SCORP survey efforts (1997, 2000, 2003), the 2007 Outdoor
Recreation Leaders’ Survey attempted to identify critical partnership efforts between
various community groups to facilitate recreation delivery. The survey asked
respondents to rank the importance of partnering with a variety of community groups and
organizations, and asked them to rate their organization’s actual level of engagement with
these groups. By doing this, we were able to conduct a basic Importance-Performance
analysis and identify potential partnerships that could be enhanced.
7
Respondents indicated that more effort should be placed on engaging in partnerships with
the following groups, where applicable (results are ranked based on the significance level
of differences between Importance-Performance scores):
Municipal Recreation Departments should focus on engaging in partnerships with the
following groups (where applicable):
Conservation Commissions
Trails Groups
Private Landowners
Planning/Zoning Boards
State Agencies (DRED, OEP, DES)
Tourism/Visitor's Bureaus
Hospitals or Health Care Providers
Colleges/Universities
Public Housing Authority
Schools
Chambers of Commerce
Senior Citizens’ Councils
Boards of Selectmen/City Councils
Conservation Commissions should focus on engaging in partnerships with the following
groups (where applicable):
Parks and Recreation Departments
Schools
Private Landowners
Boards of Selectmen/City Councils
Businesses
Hospitals or Health Care Providers
Trails Groups
Voluntary Community Groups (sports-related)
Voluntary Community Groups (non-sports related)
Chambers of Commerce
Planning/Zoning Boards
Police Departments
Senior Citizens’ Councils
State Agencies (DRED, OEP, DES)
Tourism/Visitors’ Bureaus
Public Housing Authority
Transportation/Public Works Departments
Interestingly, both recreation directors and conservation chairpersons noted that their
organization's biggest partnership gap was with each other! The areas of commonality
between these two groups, especially related to natural resources management and
outdoor recreation provision, indicates an area ripe for partnership.
Recreation leaders indicated a number of significant benefits that accrue from their
partnership efforts. Both municipal recreation directors and conservation chairpersons
noted that partnerships help them better serve their constituents, increase their visibility
8
in the community, avoid duplication of services, contribute to solving community
problems, contribute to community development efforts, avoid unnecessary competition
with other organizations, meet their organizational mandates, enhance their
organization’s prestige, and increase access to additional funding. In addition, municipal
recreation directors indicated that their partnerships allowed them to gain access to
additional recreation facilities, while conservation leaders noted that their partnerships
helped them to acquire and/or provide access to land and/or natural areas.
5. FOCUS OF 2008-2013 SCORP
Since the 2003-2007 SCORP continues to be relevant, this plan has two main
components. The first is to review and update elements of the 2003-2007 SCORP. The
second is to identify changes and trends in New Hampshire’s population, recreation
resources and needs. This plan continues to provide guidance for how New Hampshire
expends federal LWCF monies on a community level and provides direction for
addressing statewide recreational issues.
Chapter 2 provides a summary of available statistics and data related to the supply and
demand for outdoor recreation. National and statewide trends are highlighted in the
beginning and summarized throughout. Specific regional issues and trends were not
identified in this planning process due to financial, staffing, and time constraints.1
Chapter 3 provides information about recreation issues of statewide importance. The
highlights of each issue are summarized in the beginning, followed by reference
information about programs and initiatives that frame the issue in New Hampshire.
Using this information as a foundation, goals, objectives and strategies are then provided
to act as a framework for New Hampshire to address these issues. Some strategies relate
directly to how LWCF funds could be expended, while other strategies consist of broader
policy or practical recommendations. Though some recommendations are targeted to
specific agencies/organizations, many can be applied on either a statewide, regional, or
local level.
1 It is recommended that future SCORP planning efforts examine demand and need on both a regional and
statewide level to better integrate trends/findings from this plan with other regional and local planning
efforts.
9
CHAPTER 2: SUPPLY, DEMAND, AND NEED
1. MAJOR TRENDS
National Trends and Management Considerations
Outdoor recreation is a fundamental aspect of life for most Americans. Almost everyone
participates in some kind of outdoor recreational activity. The most popular are casual
activities such as walking, sightseeing, and visiting beaches. Demand for most activities
is increasing because of the sheer increase in population, growing popularity of these
activities, and for health reasons. More people are participating in a wider variety of
activities today than was the case 10 or 20 years ago. These changes are well
documented in many of the current surveys, recreation magazines and health promotion
programs. National recreation associations have begun to address these changes in their
training workshops, conferences and publications for professions.
To address this trend, the National Recreation and Park Association assembled hundreds
of park and recreation directors, advocates, and elected officials from across the country
in Chicago in May 2007 for the inaugural Summit on Urban Parks and Recreation. The
outcome was to provide guiding principles to the nation’s professional leadership. While
the initial focus was on urban parks, the impact of this blue ribbon assemblage is long-
term and far-reaching. One of the primary outcomes of the conference was the adoption
of a National Agenda which contains a call to action to government agencies, elected
officials and citizens that is based on four guiding principles:
That urban parks and recreation promote health and wellness;
That urban parks and recreation stimulate community and economic development;
That urban parks protect the environment; and
That urban parks educate, protect and enrich America’s young people, families
and seniors.
Although New Hampshire does not have many urban parks, the National Recreation and
Park Association and the leaders who attended this Summit have identified the crucial
issues that are on the cutting edge of recreation planning.
Below are several specific national management considerations identified in Outdoor
Recreation in American Life (Cordell, 1999) that remain relevant today and provide
useful guidance in framing general recreation trends in New Hampshire.
The most popular sites will experience greater congestion in the future.
There will likely be more conflicts among recreationists as they vie for use of the
same areas at the same times.
Access to both developed sites and dispersed areas will become an even more
important management issue.

10
Changes in race, age, income, culture, etc. will continue to change the type of
demand for recreation opportunities, and overall demand will continue to
increase.
America is confronted with an obesity crisis that threatens our nation’s health,
economy and future; it is important that physical activity is seen as a viable
strategy for disease prevention and health promotion for all people.
The number of organized groups (representing a wider variety of outdoor
recreation interests) will continue to grow and will have an increasingly large
voice in public land management.
Pressure is expected to be particularly heavy at already popular water sites,
especially with advances in technology.
Travel and tourism will continue to grow if transportation and access to resources
remains affordable and available.
Additional national considerations include:
In less than five years the majority of the U.S. population will be age 45 or older
(National Recreation and Park Association, Parks and Recreation, October 2005).
The Caucasian population is expected to decrease from 76 percent to 50 percent
by the year 2020 (National Recreation and Park Association, Parks and
Recreation, October 2006).
The environmental, social, psychological and spiritual implications of “nature-
deficit disorder.” (Last Child in the Woods: Saving Our Children from Nature-
Deficit Disorder, Richard Louv, 2006).
Mounting scientific evidence corroborates the theory of global warming. Although no
comprehensive study on the impact of global warming on recreation exists, anecdotal
observations and data on individual activities and specific geographical areas, including
Hew Hampshire, is mounting.
“A growing body of research has shown a close connection between fluctuations
in the northeastern pacific marine ecosystems and large scale features of Pacific
climate…Large die-offs have been observed among higher-level predators like
sea-birds, marine mammals and some salmon populations during the strong
climate warming events of 1983 and 1997/98.” (“Potential Consequences of
Global Warming for the Northwestern US: Water Resources and Marine
Ecosystems” http://www.usgcrp.gov/usgcrp/seminars/980513FP.htm)
“Already, Switzerland’s’ Matterhorn had to be closed to some (rock) climbing at
times because of recent summer rock-fall attributed to global warming and its
Great Aletsch Glacier, Europe’s largest, has retreated a couple miles from its
peak…in 1860”. (“Climbers becoming reluctant witnesses to global warming”
(http://www.zidaho.com/sharedcontent/northwest/trave/stories/NW041107ENBcli
mbersK)
“…as global warming lessens the extreme cold that normally keeps mountain
bark beetles in check, they are multiplying and infesting white bark pines…and
11
threatening the trees with extinction. White bark pines are an important source of
food for grizzly bears, and their loss would drive the bears into more populated
areas in search of food…” impacting recreational camping areas. (“Global
Warming Puts 12 US Parks at Risk”
http://www.planetark.com/avantgo/dailynewstory.cfm?newsid=37391).
Many regions, states and agencies have begun to review and discuss the impacts
of global warming on their economy, environment, and recreation; i.e. US Global
Change Research Program, Great Lakes Region, Tourism and Outdoor
Recreation, National Parks, Oregon, Wisconsin, Utah, and New York to name a
few. (Wake, Cameron and Elizabeth Burakowski (2006). Winter Recreation and
Climate Variability in New Hampshire: 1984-2006)
State Trends
Several other information sources also provide data that helps to frame outdoor
recreational trends in the state. The findings and trends listed below are meant to provide
a general flavor for recreation demand and need across New Hampshire. Refer to the
details in this 2008-2013 SCORP, or to the original data source, for more detailed
information.
A majority of recreational land acreage is found in the northern part of New
Hampshire. Greater numbers of smaller recreational sites are found in the
southern part of the state.
On average, slightly more than 51.3 percent of New Hampshire land acres were
enrolled in Current Use as of 2005. Statewide, almost 47 percent of Current Use
Lands received the recreational adjustment that same year. (Department of
Revenue Administration, Current Use Report 2005.)
State parks have seen an increase in attendance. Current estimates indicate state
parks saw around 6.69 million visitors in 2001.
According to the Comprehensive Statewide Trails Study (OEP, 1997) US Forest
Service Data shows a 23 percent increase in trail use in the White Mountain
National Forest between 1974 and 1995.
Wheeled off-highway vehicle registrations, both in state and out-of-state, are
increasing. Total registrations have more than doubled in the last ten years. Out-
of-state registrations have more than tripled.
In-state snowmobile registrations had been increasing annually from 1996/97 to
2000/2001 winter season. Since 2000/2001 they have fluctuated, reaching an all
time low in 2005/2006. Non-residential snowmobile registrations have followed
a similar pattern.
Boating registrations doubled between 1980 and 1990 alone and increased over
19 percent between 1990 and 2000, reaching a peak of almost 13 percent growth
in 2001. Since then the annual rate of increase is just shy of one percent.
12
According to the 2005 Census, the average age in New Hampshire is increasing.
The average age in 2005 was 39.5 years; in 2000, 37.1; in 1990, 32.8; and in
1980, 30.1. Following this trend, the estimated population change in New
Hampshire from 2005 to 2020 for the 70-74 age groups is 140.0 percent and for
ages 75-79, 72 percent. These ages represent a population that continues to be
healthy and active.
According to U.S. statistics, New England as a region has higher income levels
than the U.S. average. New Hampshire is the sixth highest and Connecticut, the
first. People with middle incomes tend to show higher participation rates in
outdoor recreation than those with low incomes.
Between 1990 and 2000, the state’s population increased by over 11 percent. The
rate of increase from 2000 to 2005 slowed to 6.0 percent. Even with the slowed
growth, the increase in population means the demand for outdoor recreation
opportunities (as measured by participation level) is also likely to increase.
Many of the most popular activities in New Hampshire are similar to those
identified in nationwide studies. Wildlife observation, driving for pleasure,
sightseeing, and jogging/running/walking are extremely popular activities.
Additionally, these activities show a high frequency of participation. Day hiking
tends to be more popular in New Hampshire than the national average.
Native New Hampshire residents have higher participation rates than non-natives
for several different outdoor recreational activities including hunting, fishing,
motor sports, activities that require developed settings, and active pursuits (e.g.
swimming, jogging, hiking, rock climbing, etc.).
The most popular activities in the WMNF include viewing wildlife and natural
features, sightseeing, hiking and walking, general relaxation, driving for pleasure
on forest roads, cross-country skiing, and developed camping.
Available LWCF grants in 2005 and 2006 fell far below the demand for funding.
In those two years, there were 37 local proposals totaling almost $740,000 in
requests. A total of 10 grants equaling $200,000 were awarded.
A majority of recreation leaders (recreation directors) surveyed in a 2007 UNH
survey felt that local recreational demand exceeds supply for a range of recreation
resources, including athletic fields, bike lanes/paths, pet/dog parks, skateboard
parks, public campsites, and greenway corridors. (Wake, Cameron and Elizabeth
Burakowski (2006). Winter Recreation and Climate Variability in New
Hampshire: 1984-2006.)
Half of recreation directors surveyed in the same study indicated that existing
opportunities for motorized recreation on public lands were inadequate to meet
demand.
The impact of global warming on outdoor recreation is a critical consideration
that has not been fully understood or vetted. One study, “Winter Recreation and
Climate Variability in New Hampshire” at UNH (2006) indicates that global
warming has a direct impact on winter recreation.

13
State Parks has begun to implement the “Leave No Child Inside” initiative with a
six-week program, “The Great Park Pursuit” to address the nature-deficit trend in
New Hampshire.
2. RECREATION SUPPLY
New Hampshire has a rich natural and cultural heritage. Our landscape is well suited to a
wide range of recreational pursuits, enjoyed by residents and tourists alike. This heritage
is an important reason why New Hampshire continues to be a popular place to visit and
an even more attractive place to call home.
Residents of New Hampshire have a strong connection with the outside environment.
In the University of New Hampshire (1997) study of New Hampshire residents,
Statewide Outdoor Recreation Needs Assessment, over 81 percent said that New
Hampshire’s scenic beauty and cultural heritage were important to them personally.
Sixty-one (61) percent of respondents agreed that outdoor recreation plays a central role
in their lives. Given recreation’s centrality, planning for outdoor recreation is important
to help ensure that high-quality recreational opportunities remain available for future
generations. Planning is also necessary to ensure that the state’s natural and cultural
heritage is maintained in the face of changing conditions and trends. Understanding the
quality and quantity of New Hampshire’s recreation supply, as well as trends in demand,
provides some guidance and direction to the planning process.
An understanding of “recreational supply” can be gained through quantitative inventories
of existing facilities and resources as well as through more qualitative means of gauging
resource conditions. Maps and inventories in New Hampshire exist for both conservation
lands and for lands with recreational facilities. County-level divisions provide a starting
place for understanding regional variations that may exist beyond a reported statewide
average. Figure 1 shows a map of New Hampshire’s 10 counties.
Figure 1. Counties of New Hampshire
14
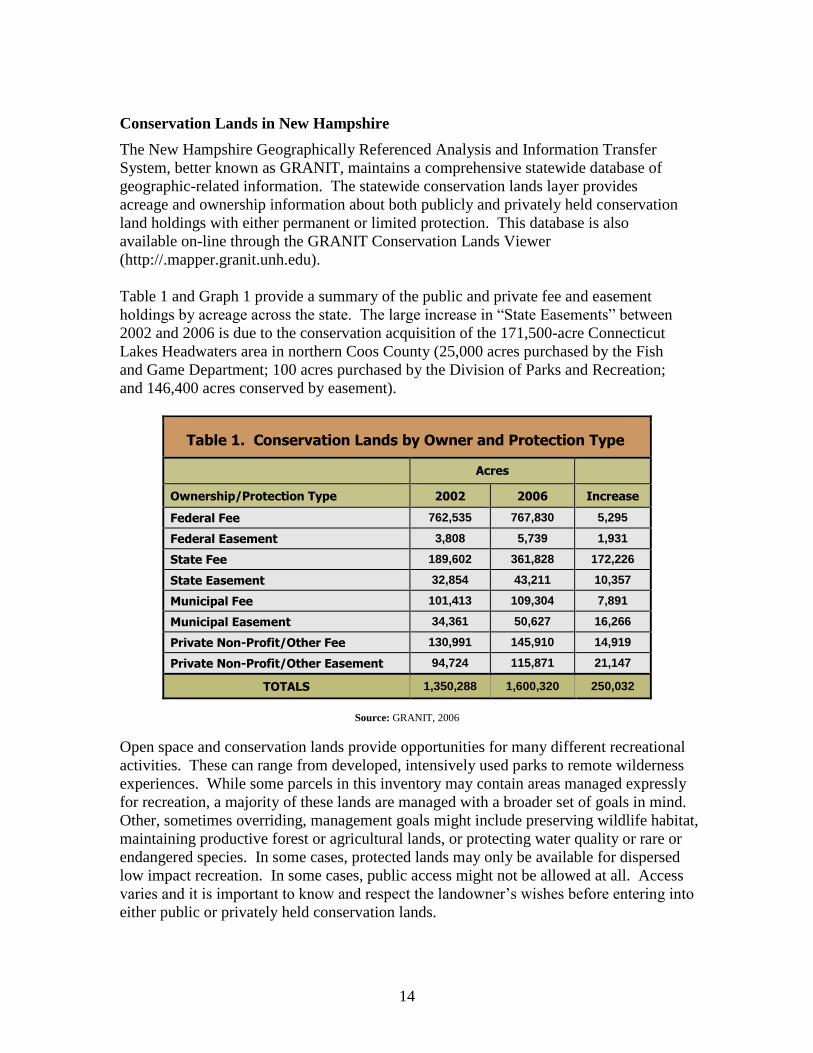
Conservation Lands in New Hampshire
The New Hampshire Geographically Referenced Analysis and Information Transfer
System, better known as GRANIT, maintains a comprehensive statewide database of
geographic-related information. The statewide conservation lands layer provides
acreage and ownership information about both publicly and privately held conservation
land holdings with either permanent or limited protection. This database is also
available on-line through the GRANIT Conservation Lands Viewer
(http://.mapper.granit.unh.edu).
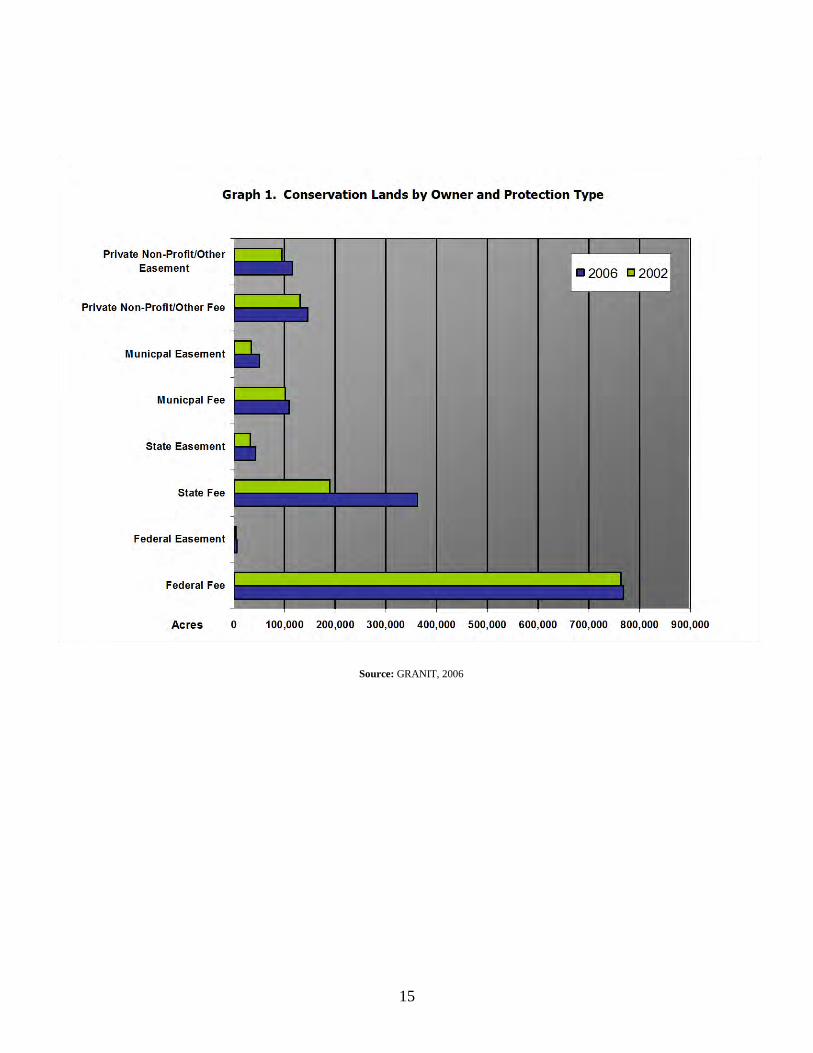
Table 1 and Graph 1 provide a summary of the public and private fee and easement
holdings by acreage across the state. The large increase in “State Easements” between
2002 and 2006 is due to the conservation acquisition of the 171,500-acre Connecticut
Lakes Headwaters area in northern Coos County (25,000 acres purchased by the Fish
and Game Department; 100 acres purchased by the Division of Parks and Recreation;
and 146,400 acres conserved by easement).
Table 1. Conservation Lands by Owner and Protection Type
Acres
Ownership/Protection Type 2002 2006 Increase
Federal Fee 762,535 767,830 5,295
Federal Easement 3,808 5,739 1,931
State Fee 189,602 361,828 172,226
State Easement 32,854 43,211 10,357
Municipal Fee 101,413 109,304 7,891
Municipal Easement 34,361 50,627 16,266
Private Non-Profit/Other Fee 130,991 145,910 14,919
Private Non-Profit/Other Easement 94,724 115,871 21,147
TOTALS 1,350,288 1,600,320 250,032
Source: GRANIT, 2006
Open space and conservation lands provide opportunities for many different recreational
activities. These can range from developed, intensively used parks to remote wilderness
experiences. While some parcels in this inventory may contain areas managed expressly
for recreation, a majority of these lands are managed with a broader set of goals in mind.
Other, sometimes overriding, management goals might include preserving wildlife habitat,
maintaining productive forest or agricultural lands, or protecting water quality or rare or
endangered species. In some cases, protected lands may only be available for dispersed
low impact recreation. In some cases, public access might not be allowed at all. Access
varies and it is important to know and respect the landowner’s wishes before entering into
either public or privately held conservation lands.
15
Source: GRANIT, 2006
16
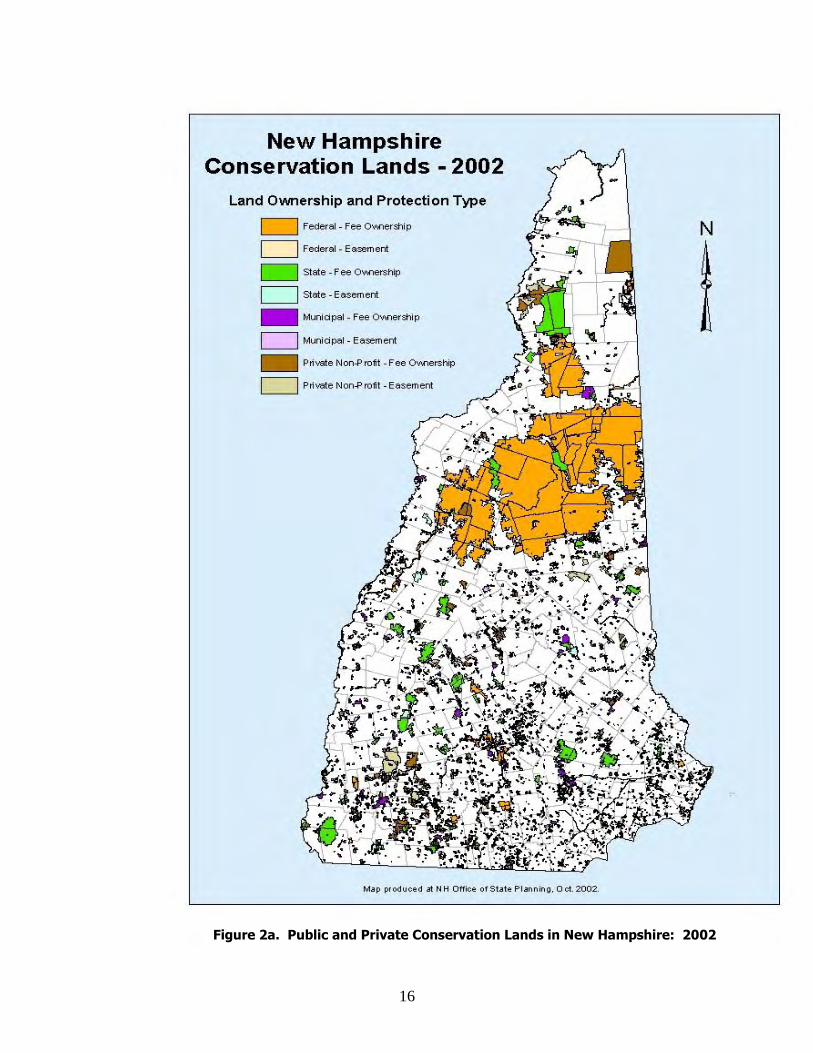
Figure 2a. Public and Private Conservation Lands in New Hampshire: 2002
17
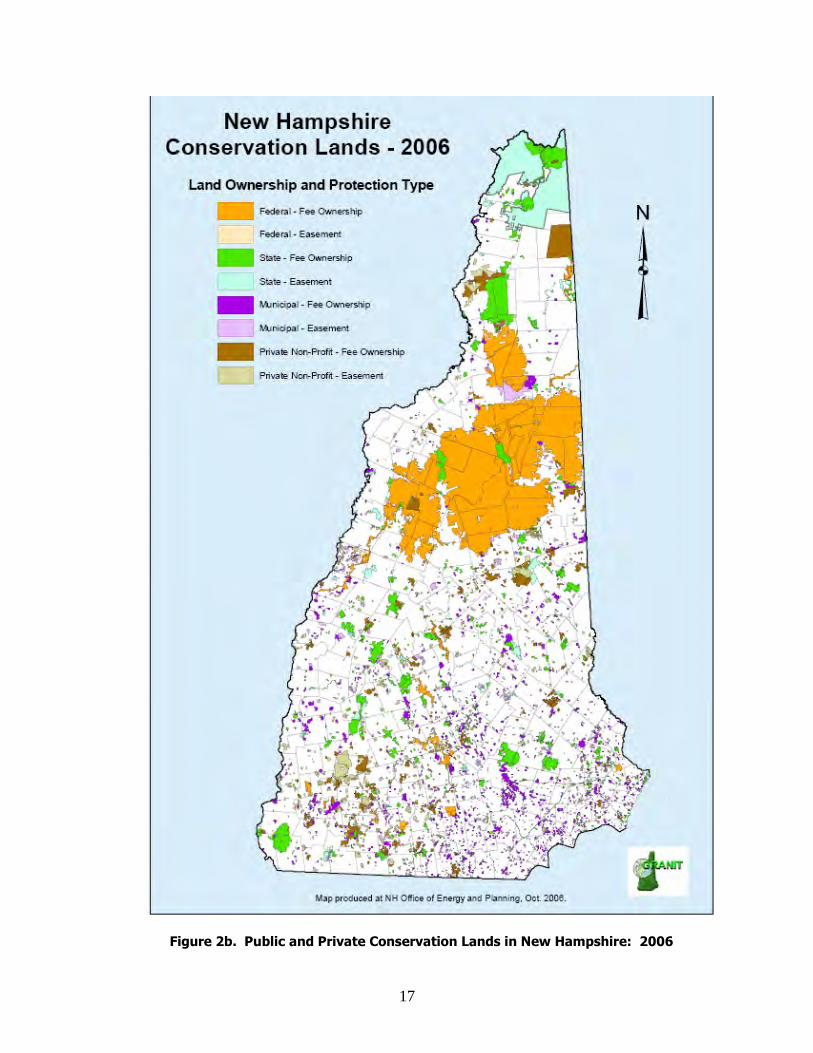
Figure 2b. Public and Private Conservation Lands in New Hampshire: 2006
18
Figures 2a and 2b provide a visual snapshot of the state’s conservation lands, categorized
by private and public ownership and the change since 2002.
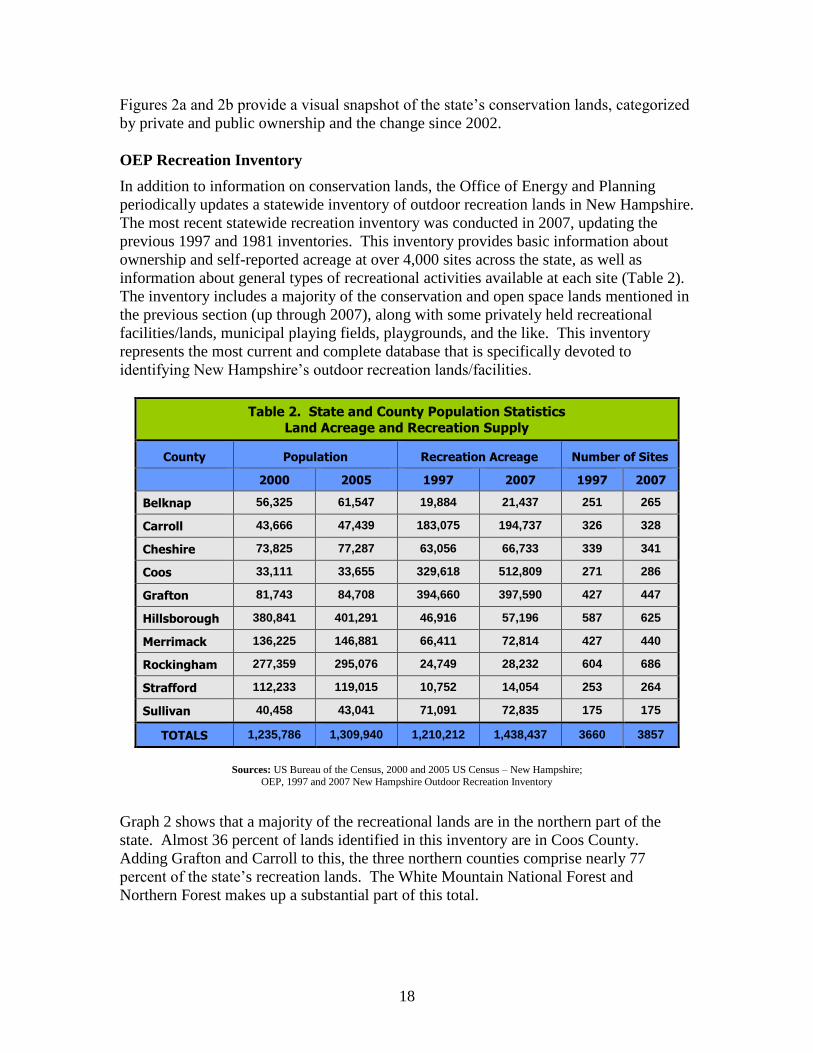
OEP Recreation Inventory
In addition to information on conservation lands, the Office of Energy and Planning
periodically updates a statewide inventory of outdoor recreation lands in New Hampshire.
The most recent statewide recreation inventory was conducted in 2007, updating the
previous 1997 and 1981 inventories. This inventory provides basic information about
ownership and self-reported acreage at over 4,000 sites across the state, as well as
information about general types of recreational activities available at each site (Table 2).
The inventory includes a majority of the conservation and open space lands mentioned in
the previous section (up through 2007), along with some privately held recreational
facilities/lands, municipal playing fields, playgrounds, and the like. This inventory
represents the most current and complete database that is specifically devoted to
identifying New Hampshire’s outdoor recreation lands/facilities.
Table 2. State and County Population Statistics
Land Acreage and Recreation Supply
County Population Recreation Acreage Number of Sites
2000 2005 1997 2007 1997 2007
Belknap 56,325 61,547 19,884 21,437 251 265
Carroll 43,666 47,439 183,075 194,737 326 328
Cheshire 73,825 77,287 63,056 66,733 339 341
Coos 33,111 33,655 329,618 512,809 271 286
Grafton 81,743 84,708 394,660 397,590 427 447
Hillsborough 380,841 401,291 46,916 57,196 587 625
Merrimack 136,225 146,881 66,411 72,814 427 440
Rockingham 277,359 295,076 24,749 28,232 604 686
Strafford 112,233 119,015 10,752 14,054 253 264
Sullivan 40,458 43,041 71,091 72,835 175 175
TOTALS 1,235,786 1,309,940 1,210,212 1,438,437 3660 3857
Sources: US Bureau of the Census, 2000 and 2005 US Census – New Hampshire;
OEP, 1997 and 2007 New Hampshire Outdoor Recreation Inventory
Graph 2 shows that a majority of the recreational lands are in the northern part of the
state. Almost 36 percent of lands identified in this inventory are in Coos County.
Adding Grafton and Carroll to this, the three northern counties comprise nearly 77
percent of the state’s recreation lands. The White Mountain National Forest and
Northern Forest makes up a substantial part of this total.

19
Graph 2. County Population vs. Recreation Acreage in 1997 and 2007
Belknap Carroll Cheshire Coos Grafton
Population 2000 56,325 43,666 73,825 33,111 81,743
Population 2005 61,547 47,439 77,287 33,655 84,708
Acreage 2003 19,884 183,075 63,056 329,618 394,660
Acreage 2007 21,437 194,737 66,733 512,809 397,590
Hillsborough Merrimack Rockingham Strafford Sullivan
Population 2000 380,841 136,225 277,359 112,233 40,651
Population 2005 401,291 146,881 295,076 119,015 43,041
Acreage 2003 45,916 66,414 24,749 10,752 71,091
Acreage 2007 57,196 72,814 28,232 14,054 72,835
Sources: US Bureau of the Census, 2000 and 2005 US Census – New Hampshire;
OEP, 1997 and 2007 New Hampshire Outdoor Recreation Inventory
In general, the northern part of the state can broadly be characterized by large land
holdings with fewer larger individual recreational areas. The southern part of the state by
contrast contains a larger number of smaller recreation sites. This difference makes
intuitive sense given that the major population centers of the state are generally found in
the southern part of the state, and the large tracts of protected land are located towards the
north. While this information provides a general understanding of how recreational lands
20
are distributed across the state, it does not shed much light on the types of recreational
lands or their ownership.
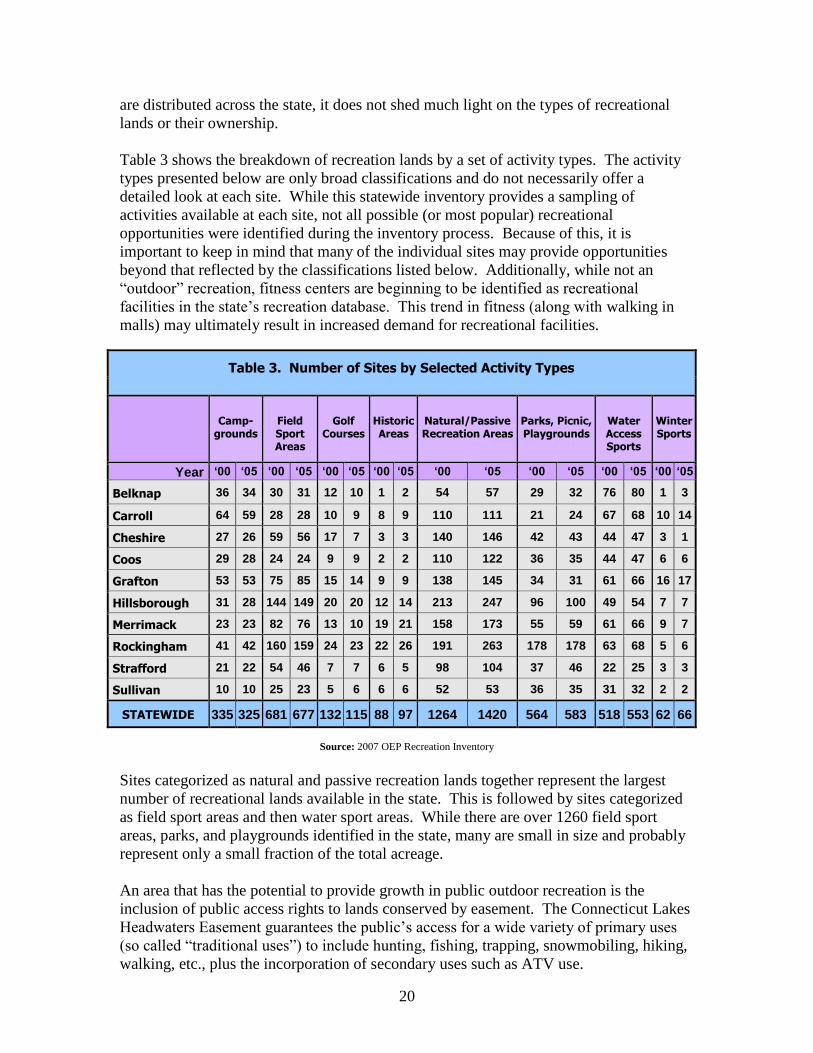
Table 3 shows the breakdown of recreation lands by a set of activity types. The activity
types presented below are only broad classifications and do not necessarily offer a
detailed look at each site. While this statewide inventory provides a sampling of
activities available at each site, not all possible (or most popular) recreational
opportunities were identified during the inventory process. Because of this, it is
important to keep in mind that many of the individual sites may provide opportunities
beyond that reflected by the classifications listed below. Additionally, while not an
“outdoor” recreation, fitness centers are beginning to be identified as recreational
facilities in the state’s recreation database. This trend in fitness (along with walking in
malls) may ultimately result in increased demand for recreational facilities.
Table 3. Number of Sites by Selected Activity Types
Camp-
grounds Field Sport Areas
Golf Courses
Historic Areas
Natural/Passive Recreation Areas
Parks, Picnic, Playgrounds
Water Access Sports
Winter Sports
Year ‘00 ‘05 ‘00 ‘05 ‘00 ‘05 ‘00 ‘05 ‘00 ‘05 ‘00 ‘05 ‘00 ‘05 ‘00 ‘05
Belknap 36 34 30 31 12 10 1 2 54 57 29 32 76 80 1 3
Carroll 64 59 28 28 10 9 8 9 110 111 21 24 67 68 10 14
Cheshire 27 26 59 56 17 7 3 3 140 146 42 43 44 47 3 1
Coos 29 28 24 24 9 9 2 2 110 122 36 35 44 47 6 6
Grafton 53 53 75 85 15 14 9 9 138 145 34 31 61 66 16 17
Hillsborough 31 28 144 149 20 20 12 14 213 247 96 100 49 54 7 7
Merrimack 23 23 82 76 13 10 19 21 158 173 55 59 61 66 9 7
Rockingham 41 42 160 159 24 23 22 26 191 263 178 178 63 68 5 6
Strafford 21 22 54 46 7 7 6 5 98 104 37 46 22 25 3 3
Sullivan 10 10 25 23 5 6 6 6 52 53 36 35 31 32 2 2
STATEWIDE 335 325 681 677 132 115 88 97 1264 1420 564 583 518 553 62 66
Source: 2007 OEP Recreation Inventory
Sites categorized as natural and passive recreation lands together represent the largest
number of recreational lands available in the state. This is followed by sites categorized
as field sport areas and then water sport areas. While there are over 1260 field sport
areas, parks, and playgrounds identified in the state, many are small in size and probably
represent only a small fraction of the total acreage.
An area that has the potential to provide growth in public outdoor recreation is the
inclusion of public access rights to lands conserved by easement. The Connecticut Lakes
Headwaters Easement guarantees the public’s access for a wide variety of primary uses
(so called “traditional uses”) to include hunting, fishing, trapping, snowmobiling, hiking,
walking, etc., plus the incorporation of secondary uses such as ATV use.
21
Looking regionally, Hillsborough and Rockingham Counties have the largest populations
and are also home to the largest number of field sport areas, park/picnic areas, and golf
courses. Given that people tend to participate (or want to participate) in these activities
close to home, it is important that a higher proportion of these sites be located near the
larger population bases. Greater supplies of certain types of recreation facilities provide
the public with greater opportunities to participate in that recreational activity.
This data also shows that Belknap County had the highest number of water sports and
fishing areas, while Strafford County had the fewest. Hillsborough, Merrimack, and
Rockingham Counties had the highest total of natural areas or “passive” recreation
areas, though many of these are smaller in size than the sites listed in counties to the
north or west.
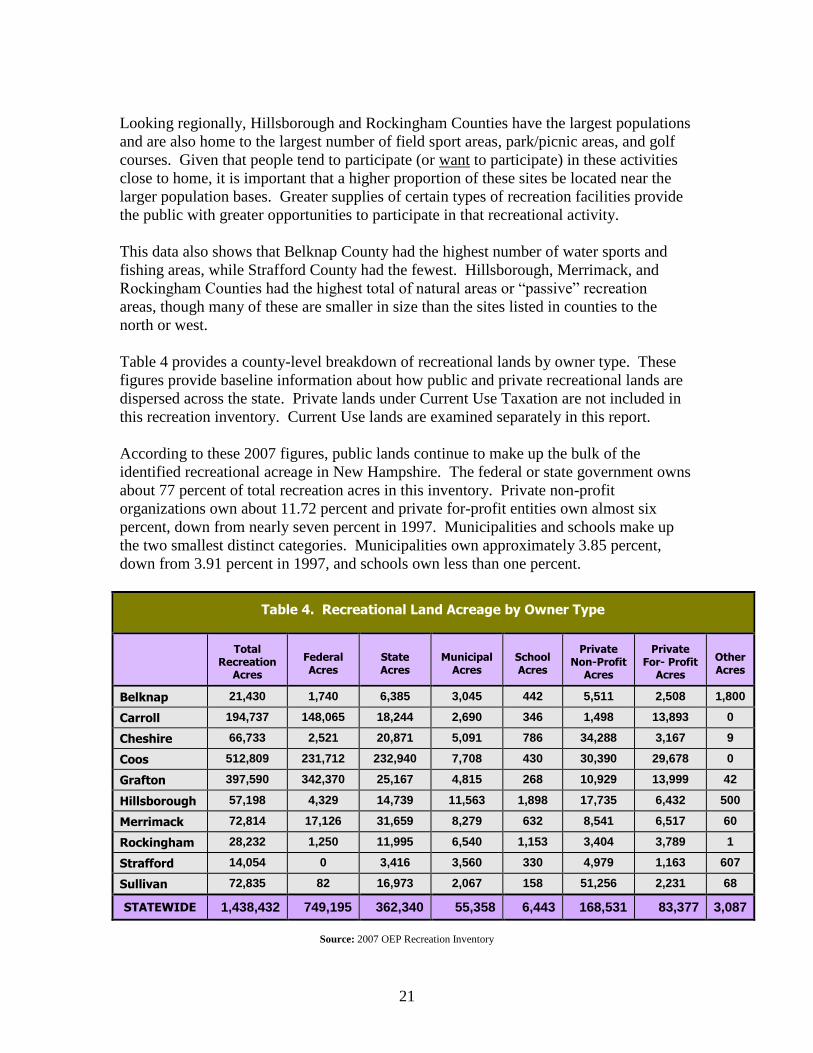
Table 4 provides a county-level breakdown of recreational lands by owner type. These
figures provide baseline information about how public and private recreational lands are
dispersed across the state. Private lands under Current Use Taxation are not included in
this recreation inventory. Current Use lands are examined separately in this report.
According to these 2007 figures, public lands continue to make up the bulk of the
identified recreational acreage in New Hampshire. The federal or state government owns
about 77 percent of total recreation acres in this inventory. Private non-profit
organizations own about 11.72 percent and private for-profit entities own almost six
percent, down from nearly seven percent in 1997. Municipalities and schools make up
the two smallest distinct categories. Municipalities own approximately 3.85 percent,
down from 3.91 percent in 1997, and schools own less than one percent.
Table 4. Recreational Land Acreage by Owner Type
Total
Recreation Acres
Federal Acres
State Acres
Municipal Acres
School Acres
Private Non-Profit
Acres
Private For- Profit
Acres
Other Acres
Belknap 21,430 1,740 6,385 3,045 442 5,511 2,508 1,800
Carroll 194,737 148,065 18,244 2,690 346 1,498 13,893 0
Cheshire 66,733 2,521 20,871 5,091 786 34,288 3,167 9
Coos 512,809 231,712 232,940 7,708 430 30,390 29,678 0
Grafton 397,590 342,370 25,167 4,815 268 10,929 13,999 42
Hillsborough 57,198 4,329 14,739 11,563 1,898 17,735 6,432 500
Merrimack 72,814 17,126 31,659 8,279 632 8,541 6,517 60
Rockingham 28,232 1,250 11,995 6,540 1,153 3,404 3,789 1
Strafford 14,054 0 3,416 3,560 330 4,979 1,163 607
Sullivan 72,835 82 16,973 2,067 158 51,256 2,231 68
STATEWIDE 1,438,432 749,195 362,340 55,358 6,443 168,531 83,377 3,087
Source: 2007 OEP Recreation Inventory
22
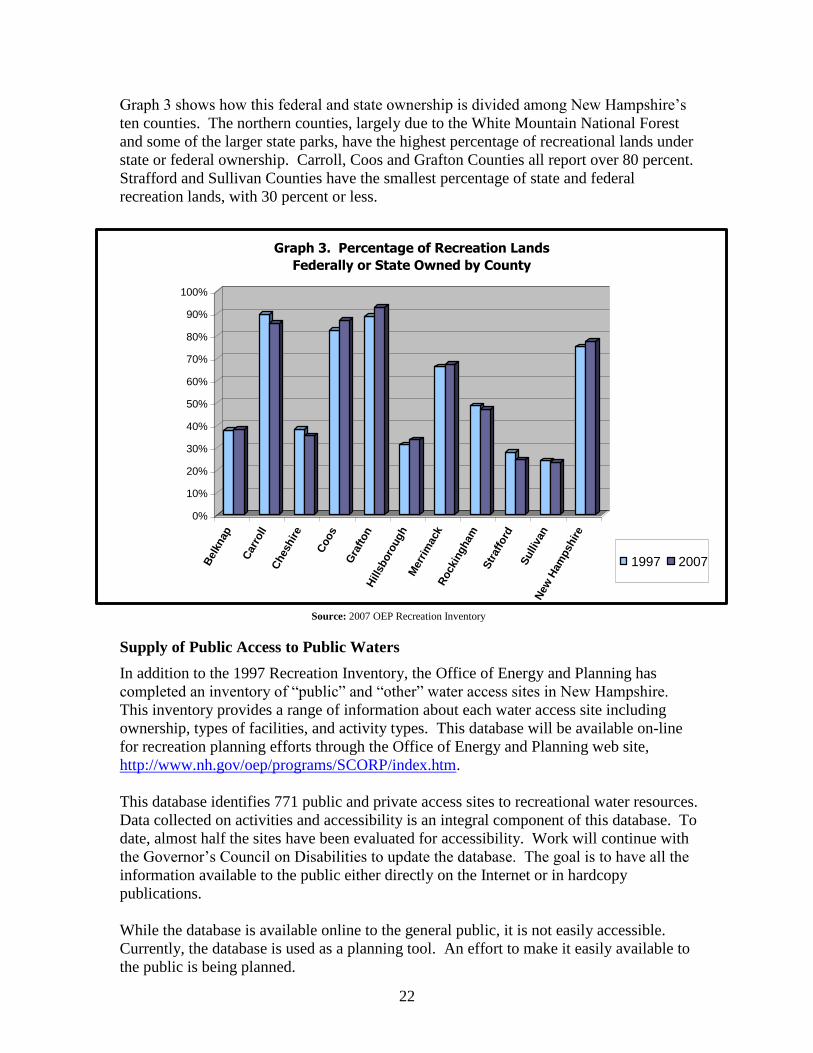
Graph 3 shows how this federal and state ownership is divided among New Hampshire’s
ten counties. The northern counties, largely due to the White Mountain National Forest
and some of the larger state parks, have the highest percentage of recreational lands under
state or federal ownership. Carroll, Coos and Grafton Counties all report over 80 percent.
Strafford and Sullivan Counties have the smallest percentage of state and federal
recreation lands, with 30 percent or less.
0%
10%
20%
30%
40%
50%
60%
70%
80%
90%
100%
Belk
nap
Carr
oll
Cheshir
e
Coos
Gra
fton
Hills
boro
ugh
Merr
imack
Rockin
gham
Str
aff
ord
Sulliv
an
New
Ham
pshir
e
Graph 3. Percentage of Recreation Lands
Federally or State Owned by County
1997 2007
Source: 2007 OEP Recreation Inventory
Supply of Public Access to Public Waters
In addition to the 1997 Recreation Inventory, the Office of Energy and Planning has
completed an inventory of “public” and “other” water access sites in New Hampshire.
This inventory provides a range of information about each water access site including
ownership, types of facilities, and activity types. This database will be available on-line
for recreation planning efforts through the Office of Energy and Planning web site,
http://www.nh.gov/oep/programs/SCORP/index.htm.
This database identifies 771 public and private access sites to recreational water resources.
Data collected on activities and accessibility is an integral component of this database. To
date, almost half the sites have been evaluated for accessibility. Work will continue with
the Governor’s Council on Disabilities to update the database. The goal is to have all the
information available to the public either directly on the Internet or in hardcopy
publications.
While the database is available online to the general public, it is not easily accessible.
Currently, the database is used as a planning tool. An effort to make it easily available to
the public is being planned.
23
In the State of New Hampshire, distinction is made for water access depending upon
whether it is state owned or maintained.
“Public” or state access sites are defined under RSA 233-A:1,III as “…legal
passage to any of the public waters of the state by way of designated contiguous
land owned or controlled by a state agency, assuring that all members of the
public shall have access to and use of the public waters for recreational purposes.”
“Other” access is defined in the Public Access Plan for New Hampshire’s Lakes,
Ponds and Rivers (OEP, 1991) as “…legal passage by way of designated land
owned or controlled by a public entity (e.g. federal, municipal) or private entity
(e.g. commercial, private nonprofit, individual landowner) for the purpose of
providing active or passive recreational opportunities and/or use of the public
waters of the state, and where such legal passage may or may not involve a fee.”
In addition, the New Hampshire Fish and Game Department (NHFG), the lead agency for
public water access, maintains an up-to-date inventory of their state access sites. Though
this information does not provide a comprehensive look at all (e.g. private, municipal,
federal) water access sites across the state, it does provide a solid base of information
about sites guaranteed by the state.
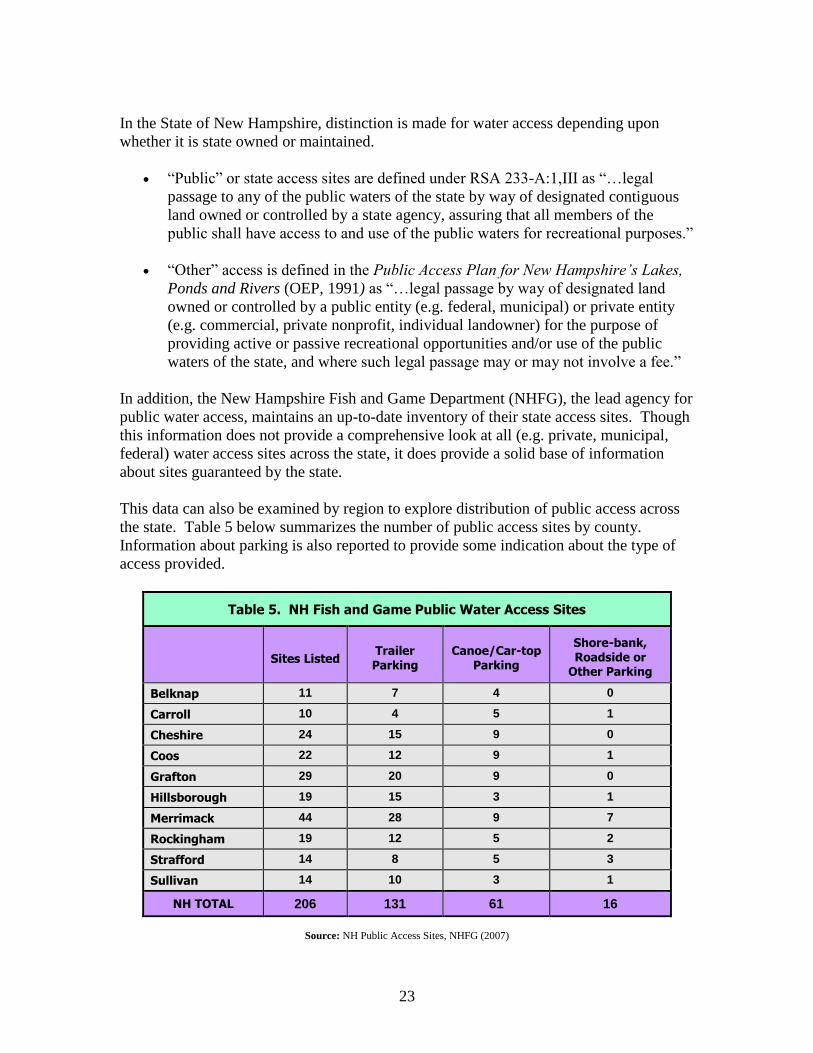
This data can also be examined by region to explore distribution of public access across
the state. Table 5 below summarizes the number of public access sites by county.
Information about parking is also reported to provide some indication about the type of
access provided.
Table 5. NH Fish and Game Public Water Access Sites
Sites Listed Trailer Parking
Canoe/Car-top Parking
Shore-bank, Roadside or
Other Parking
Belknap 11 7 4 0
Carroll 10 4 5 1
Cheshire 24 15 9 0
Coos 22 12 9 1
Grafton 29 20 9 0
Hillsborough 19 15 3 1
Merrimack 44 28 9 7
Rockingham 19 12 5 2
Strafford 14 8 5 3
Sullivan 14 10 3 1
NH TOTAL 206 131 61 16
Source: NH Public Access Sites, NHFG (2007)
24
Overall, the New Hampshire Fish and Game Public Access Inventory lists 206 state-run
public access sites on 151 different lakes, ponds and rivers. Merrimack County has the
highest number of identified access sites, followed by Grafton County and Cheshire
County. Canoe/cartop boat access sites increased from 46 to 61 in the past five years.
There are nine canoe/cartop sites each in Cheshire, Coos, Grafton and Merrimack
Counties.
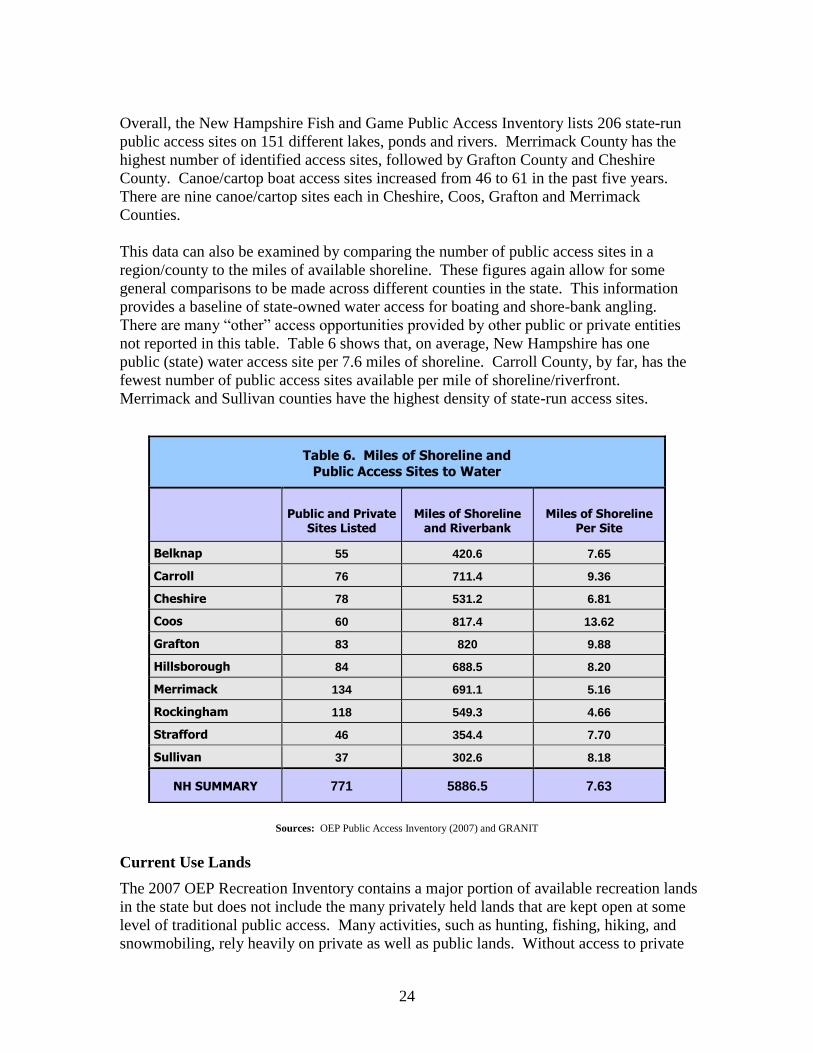
This data can also be examined by comparing the number of public access sites in a
region/county to the miles of available shoreline. These figures again allow for some
general comparisons to be made across different counties in the state. This information
provides a baseline of state-owned water access for boating and shore-bank angling.
There are many “other” access opportunities provided by other public or private entities
not reported in this table. Table 6 shows that, on average, New Hampshire has one
public (state) water access site per 7.6 miles of shoreline. Carroll County, by far, has the
fewest number of public access sites available per mile of shoreline/riverfront.
Merrimack and Sullivan counties have the highest density of state-run access sites.
Sources: OEP Public Access Inventory (2007) and GRANIT
Current Use Lands
The 2007 OEP Recreation Inventory contains a major portion of available recreation lands
in the state but does not include the many privately held lands that are kept open at some
level of traditional public access. Many activities, such as hunting, fishing, hiking, and
snowmobiling, rely heavily on private as well as public lands. Without access to private
Table 6. Miles of Shoreline and
Public Access Sites to Water
Public and Private
Sites Listed Miles of Shoreline
and Riverbank Miles of Shoreline
Per Site
Belknap 55 420.6 7.65
Carroll 76 711.4 9.36
Cheshire 78 531.2 6.81
Coos 60 817.4 13.62
Grafton 83 820 9.88
Hillsborough 84 688.5 8.20
Merrimack 134 691.1 5.16
Rockingham 118 549.3 4.66
Strafford 46 354.4 7.70
Sullivan 37 302.6 8.18
NH SUMMARY 771 5886.5 7.63
25
lands, opportunities to participate in many of these activities would be more limited and
public lands would become increasingly crowded.
Capturing a true measure of the quantity of private lands open to public access is difficult.
Some landowners rely on verbal agreements or informal permits, both of which are
difficult or impossible to measure. Though not complete, one proxy measure is to
examine lands under Current Use. The Current Use Taxation Program, under RSA 79-A,
was established in 1972 to:
“…encourage the preservation of open space, thus providing a healthful and
attractive outdoor environment for work and recreation, maintaining the
character of the state’s landscape, and conserving the land, water, forest,
agricultural and wildlife resources.”
Under this program, parcels of land (10 acre minimum) are taxed based on their current
use value as open space rather than on their potential value for development purposes.
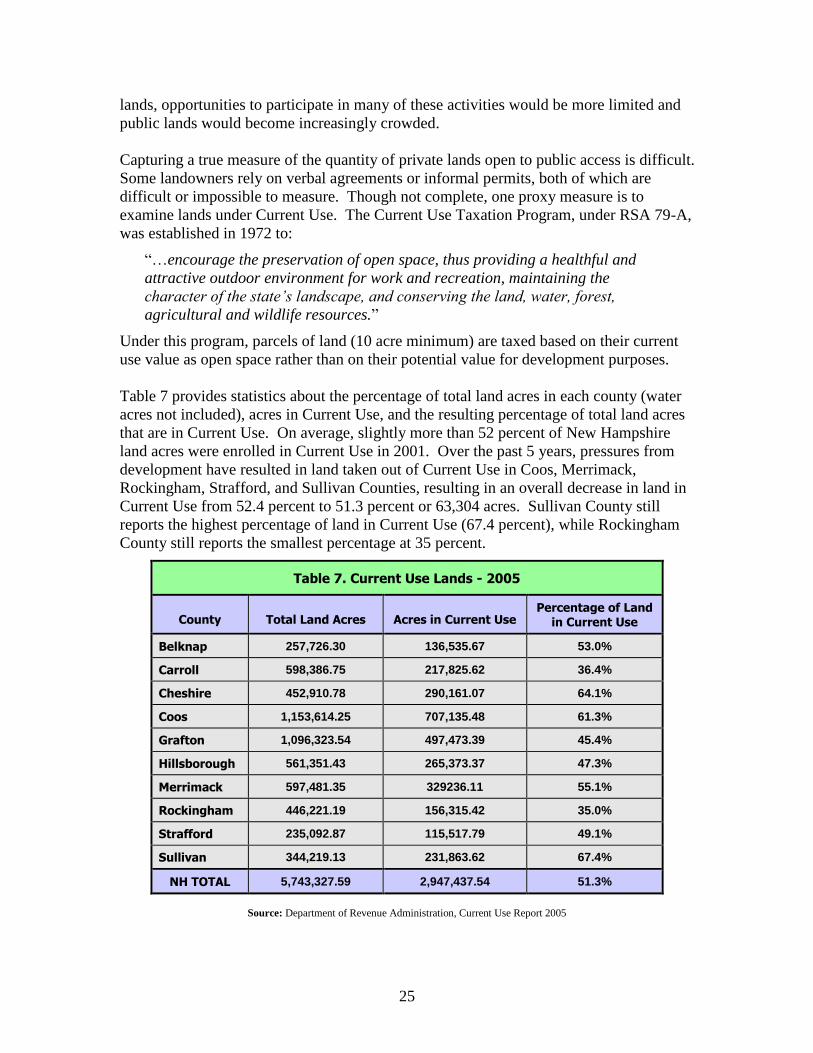
Table 7 provides statistics about the percentage of total land acres in each county (water
acres not included), acres in Current Use, and the resulting percentage of total land acres
that are in Current Use. On average, slightly more than 52 percent of New Hampshire
land acres were enrolled in Current Use in 2001. Over the past 5 years, pressures from
development have resulted in land taken out of Current Use in Coos, Merrimack,
Rockingham, Strafford, and Sullivan Counties, resulting in an overall decrease in land in
Current Use from 52.4 percent to 51.3 percent or 63,304 acres. Sullivan County still
reports the highest percentage of land in Current Use (67.4 percent), while Rockingham
County still reports the smallest percentage at 35 percent.
Table 7. Current Use Lands - 2005
County Total Land Acres Acres in Current Use Percentage of Land
in Current Use
Belknap 257,726.30 136,535.67 53.0%
Carroll 598,386.75 217,825.62 36.4%
Cheshire 452,910.78 290,161.07 64.1%
Coos 1,153,614.25 707,135.48 61.3%
Grafton 1,096,323.54 497,473.39 45.4%
Hillsborough 561,351.43 265,373.37 47.3%
Merrimack 597,481.35 329236.11 55.1%
Rockingham 446,221.19 156,315.42 35.0%
Strafford 235,092.87 115,517.79 49.1%
Sullivan 344,219.13 231,863.62 67.4%
NH TOTAL 5,743,327.59 2,947,437.54 51.3%
Source: Department of Revenue Administration, Current Use Report 2005
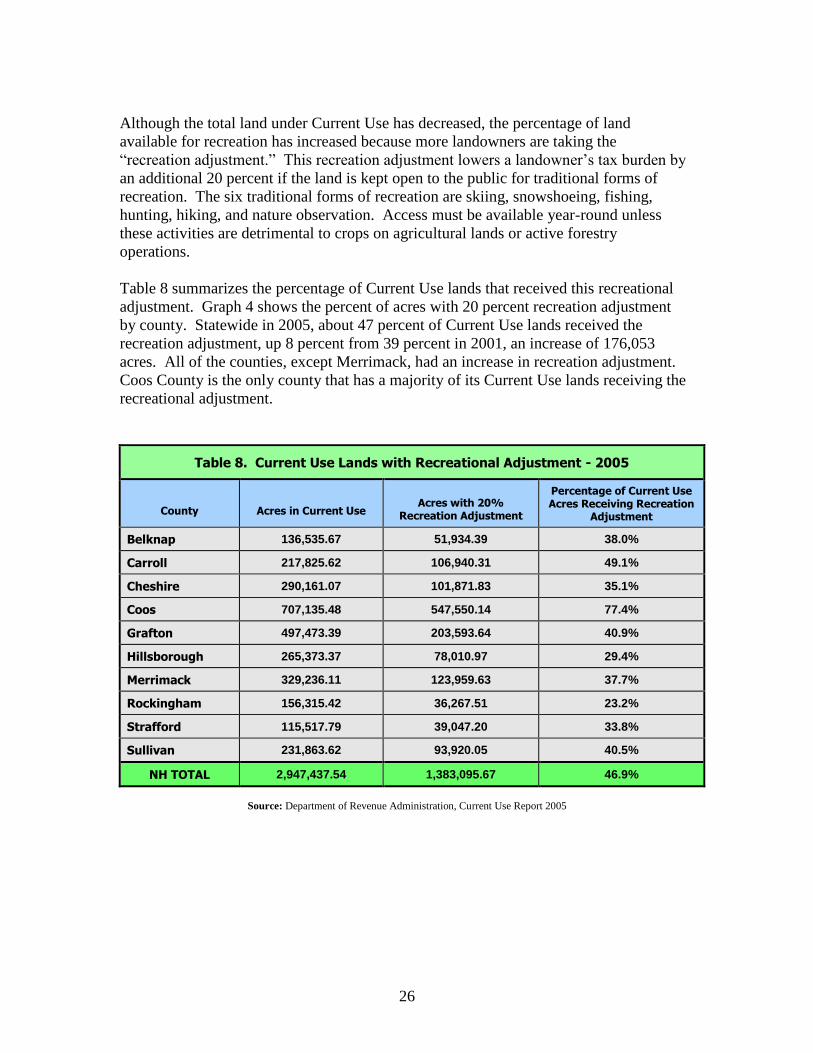
26
Although the total land under Current Use has decreased, the percentage of land
available for recreation has increased because more landowners are taking the
“recreation adjustment.” This recreation adjustment lowers a landowner’s tax burden by
an additional 20 percent if the land is kept open to the public for traditional forms of
recreation. The six traditional forms of recreation are skiing, snowshoeing, fishing,
hunting, hiking, and nature observation. Access must be available year-round unless
these activities are detrimental to crops on agricultural lands or active forestry
operations.
Table 8 summarizes the percentage of Current Use lands that received this recreational
adjustment. Graph 4 shows the percent of acres with 20 percent recreation adjustment
by county. Statewide in 2005, about 47 percent of Current Use lands received the
recreation adjustment, up 8 percent from 39 percent in 2001, an increase of 176,053
acres. All of the counties, except Merrimack, had an increase in recreation adjustment.
Coos County is the only county that has a majority of its Current Use lands receiving the
recreational adjustment.
Table 8. Current Use Lands with Recreational Adjustment - 2005
County Acres in Current Use Acres with 20%
Recreation Adjustment
Percentage of Current Use Acres Receiving Recreation
Adjustment
Belknap 136,535.67 51,934.39 38.0%
Carroll 217,825.62 106,940.31 49.1%
Cheshire 290,161.07 101,871.83 35.1%
Coos 707,135.48 547,550.14 77.4%
Grafton 497,473.39 203,593.64 40.9%
Hillsborough 265,373.37 78,010.97 29.4%
Merrimack 329,236.11 123,959.63 37.7%
Rockingham 156,315.42 36,267.51 23.2%
Strafford 115,517.79 39,047.20 33.8%
Sullivan 231,863.62 93,920.05 40.5%
NH TOTAL 2,947,437.54 1,383,095.67 46.9%
Source: Department of Revenue Administration, Current Use Report 2005
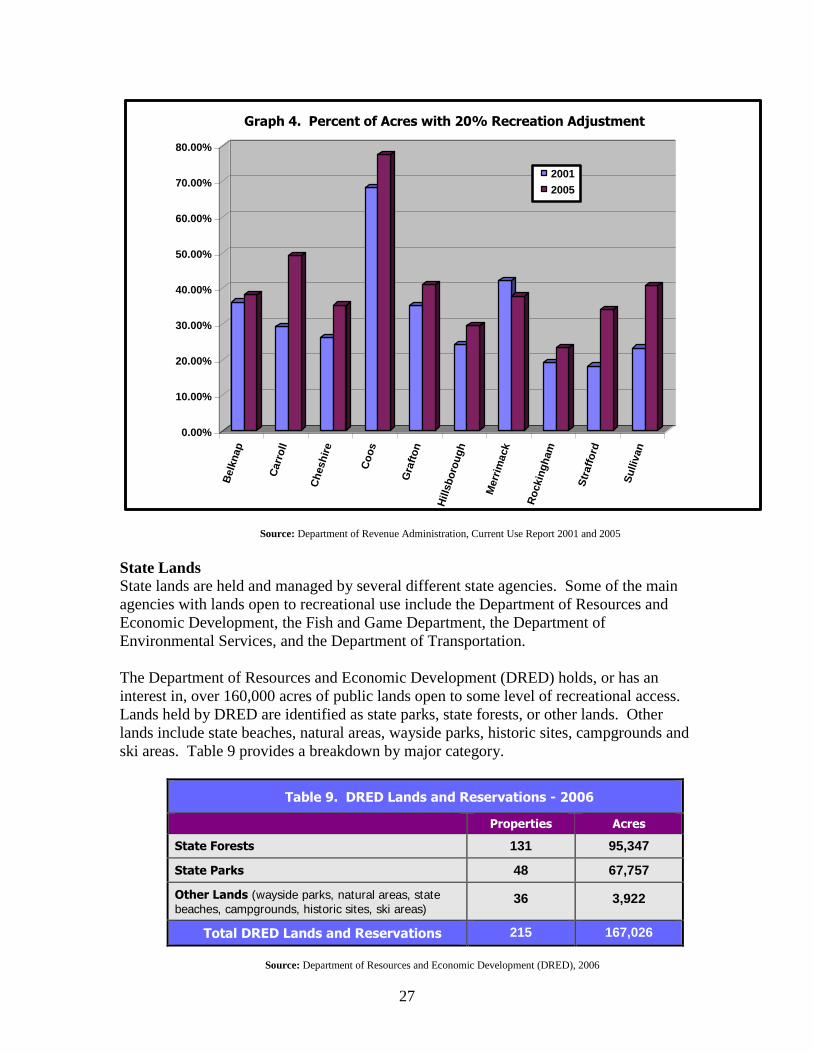
27
0.00%
10.00%
20.00%
30.00%
40.00%
50.00%
60.00%
70.00%
80.00%
Belk
nap
Carr
oll
Ch
esh
ire
Co
os
Gra
fto
n
Hills
bo
rou
gh
Merr
imack
Ro
ckin
gh
am
Str
aff
ord
Su
lliv
an
Graph 4. Percent of Acres with 20% Recreation Adjustment
2001
2005
Source: Department of Revenue Administration, Current Use Report 2001 and 2005
State Lands
State lands are held and managed by several different state agencies. Some of the main
agencies with lands open to recreational use include the Department of Resources and
Economic Development, the Fish and Game Department, the Department of
Environmental Services, and the Department of Transportation.
The Department of Resources and Economic Development (DRED) holds, or has an
interest in, over 160,000 acres of public lands open to some level of recreational access.
Lands held by DRED are identified as state parks, state forests, or other lands. Other
lands include state beaches, natural areas, wayside parks, historic sites, campgrounds and
ski areas. Table 9 provides a breakdown by major category.
Table 9. DRED Lands and Reservations - 2006
Properties Acres
State Forests 131 95,347
State Parks 48 67,757
Other Lands (wayside parks, natural areas, state beaches, campgrounds, historic sites, ski areas)
36 3,922
Total DRED Lands and Reservations 215 167,026
Source: Department of Resources and Economic Development (DRED), 2006
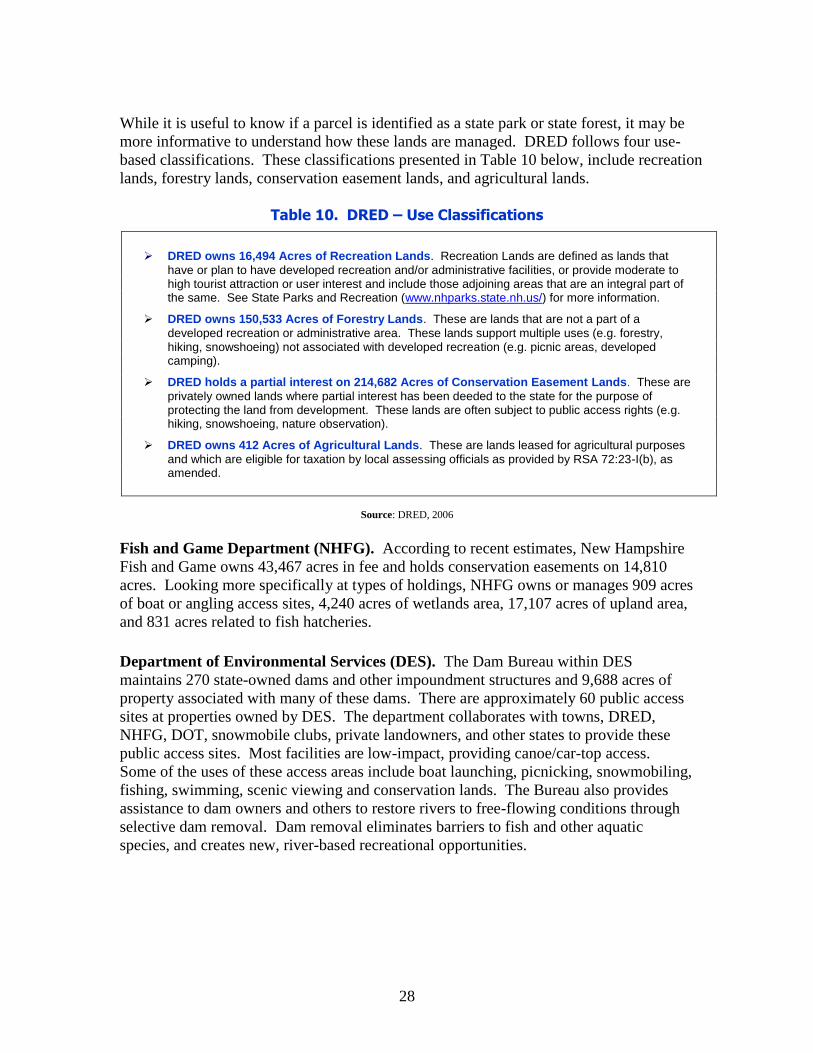
28
While it is useful to know if a parcel is identified as a state park or state forest, it may be
more informative to understand how these lands are managed. DRED follows four use-
based classifications. These classifications presented in Table 10 below, include recreation
lands, forestry lands, conservation easement lands, and agricultural lands.
Table 10. DRED – Use Classifications
DRED owns 16,494 Acres of Recreation Lands. Recreation Lands are defined as lands that
have or plan to have developed recreation and/or administrative facilities, or provide moderate to high tourist attraction or user interest and include those adjoining areas that are an integral part of the same. See State Parks and Recreation (www.nhparks.state.nh.us/) for more information.
DRED owns 150,533 Acres of Forestry Lands. These are lands that are not a part of a
developed recreation or administrative area. These lands support multiple uses (e.g. forestry, hiking, snowshoeing) not associated with developed recreation (e.g. picnic areas, developed camping).
DRED holds a partial interest on 214,682 Acres of Conservation Easement Lands. These are
privately owned lands where partial interest has been deeded to the state for the purpose of protecting the land from development. These lands are often subject to public access rights (e.g. hiking, snowshoeing, nature observation).
DRED owns 412 Acres of Agricultural Lands. These are lands leased for agricultural purposes
and which are eligible for taxation by local assessing officials as provided by RSA 72:23-I(b), as amended.
Source: DRED, 2006
Fish and Game Department (NHFG). According to recent estimates, New Hampshire
Fish and Game owns 43,467 acres in fee and holds conservation easements on 14,810
acres. Looking more specifically at types of holdings, NHFG owns or manages 909 acres
of boat or angling access sites, 4,240 acres of wetlands area, 17,107 acres of upland area,
and 831 acres related to fish hatcheries.
Department of Environmental Services (DES). The Dam Bureau within DES
maintains 270 state-owned dams and other impoundment structures and 9,688 acres of
property associated with many of these dams. There are approximately 60 public access
sites at properties owned by DES. The department collaborates with towns, DRED,
NHFG, DOT, snowmobile clubs, private landowners, and other states to provide these
public access sites. Most facilities are low-impact, providing canoe/car-top access.
Some of the uses of these access areas include boat launching, picnicking, snowmobiling,
fishing, swimming, scenic viewing and conservation lands. The Bureau also provides
assistance to dam owners and others to restore rivers to free-flowing conditions through
selective dam removal. Dam removal eliminates barriers to fish and other aquatic
species, and creates new, river-based recreational opportunities.
29
Department of Transportation (DOT). DOT currently manages over 400 acres of
recreation and conservation lands at 142 separate locations. Included are sites the
Department calls scenic easements, bike paths, scenic overlooks, roads to public waters,
one park, and one trail. The park is the 10-acre Hilton Park in Dover, providing a
playground, picnic tables, baseball diamond, boat launch, and fishing. The Department
also owns 21 scenic easements and overlooks, the largest and most well known being the
70-acre Thirteen Mile Wood Scenic Easement in Cambridge, Dummer, and Errol along
the Androscoggin River and Route 16. DOT is currently reviewing and updating an
inventory of all their state-owned properties. This data will be available in 2008.
Division of Parks and Recreation-NH State Parks. The Division of Parks and
Recreation has been in existence since 1961 when DRED was established, encompassing
a variety of agencies with similar objectives. The legislation, RSA 216-A:1 provides
management direction:
“It is the intent of the general court that a comprehensive state park system shall
be developed, operated, and maintained to achieve the following purposes in order
of the following priority:
I. To protect and preserve unusual scenic, scientific, historical, recreational,
and natural areas within the state.
II. To continually provide such additional park areas and facilities as may be
necessary to meet the recreational needs of the citizens of the state.
III. To make these areas accessible to the public for recreational, education,
scientific, and other uses consistent with their protection and preservation.
IV. To encourage and support tourism and related economic activity within the
state.”
Needs. In the summer of 2002, DRED - Division of Parks conducted a telephone survey
of state park managers to assess conditions and trends in the state’s park system. A total
of 55 managers and regional supervisors were interviewed across DRED’s three park
regions: East, North and West. The East Region includes parks within the Seacoast, as
well as Ahern, Bear Brook and Pawtuckaway. The North Region includes parks in Coos
County and the White Mountains, as well as Wentworth State Park and White Lake State
Park. The West Region includes a range of parks in Cheshire, Sullivan, Hillsborough,
and Grafton Counties such as Pillsbury, Pisgah, Monadnock and Sunapee.
The brief telephone survey asked questions about the quality of state park facilities and
the resource base, the ability of the park to meet demand, and the greatest needs at
individual parks. The questions required managers to rank their park’s facility and
resource base conditions based on a five-point scale; ranging from poor to excellent.
30
In all, 11 percent of park managers felt that the conditions of their state park facilities
were poor. Facilities might include restrooms, parking, picnic areas, and the like. About
42 percent felt conditions were fair (rank of 2 on a five-point scale). Approximately 4
percent ranked facilities as excellent, 15 percent said conditions were very good, and the
remainder, 27 percent, gave a middle rating of “good.”
Managers in the East Region gave the lowest average rating. Approximately 18 percent
rated their facilities as poor and 53 percent rated facilities as fair. The remainder rated
their facility conditions a mid-rating of “good.” No one in the East Region gave facility
conditions a rating of “very good” or “excellent.”
On average, park managers rated the condition of the natural resource base slightly
higher. In all, 13 percent rated the resource base quality as “very good” or “excellent,”
46 percent rated the resource base as “good.” About 26 percent rated the condition of the
resource base as fair and 9 percent gave a poor rating. Park managers in the West Region
gave the highest average rating, with 70 percent giving their resource base at least a
“good” rating while 61 percent in the North Region and 44 percent in the East Region
gave at least a “good” rating respectively.
Park managers were then asked if the park they manage is currently able to meet existing
recreational demand. Responses were split, with about half (48 percent) indicating
demand was being met, half (48 percent) said demand exceeded supply, and 4 percent
giving a conditional response.
In May of 2005, a commission was established by Chapter 276 of the Laws of 2005 to
study the mission of the state park system and the Division of Parks and Recreation
(RSA 216-A:1) including:
The continued efficacy of self-funding the state park system;
The leasing of public lands and property to private interests and the
circumstances under which such leasing is permissible; and
The development of a long-term capital improvement plan for the state park
system.
The commission’s report, issued in 2006, advised that in order to meet the recreational
needs of the ever increasing and changing population, the following recommendations be
considered:
Historic sites: create a separate bureau to address the specific needs of these
visitor destinations;
Capital improvements: allocate substantial bonding to address the most urgent
needs in the system;
Strategic plan: develop a comprehensive strategic plan and update it regularly;
31
Funding: review a wide variety of funding sources and public-private
partnerships; and
Oversight and advice: establish a statewide advisory council and expand financial
support for the agency as well as the legislative reporting system.
The goals of the process are to enhance the recreational resources and ensure that state
parks continue to meet the needs of residents and visitors to New Hampshire
Trails Inventory. The Office of Energy and Planning completed the Comprehensive
Statewide Trails Study in 1997, an update of the 1974 Trails Study to address future trails
needs and establish a recreation-planning framework for trails. While no overarching
study has been done since then, the study provided baseline information from which the
planning, acquisition, and maintenance of current and future trails can be measured for
progress and development.
All-Terrain Vehicles and Snowmobiles. In 2001 the State of New Hampshire
recognized that All-Terrain Vehicle (ATV) use, as a recognized recreational activity, was
on the rise in the state. With registrations increasing 150 percent over the prior 10 years,
a way to address the issues brought about by the use of these machines was paramount.
Over the following years a number of legislative initiatives were undertaken in response.
One of these initiatives was the increase in registration fees with a portion of those fees
dedicated to buying land to develop ATV trails.
“A Plan for Developing New Hampshire’s Statewide Trail System for ATVs and Trail
Bikes 2004-2008” issued in 2003 by DRED found that:
The use of All-Terrain Vehicles (ATVs) and trail bikes has come to the forefront
of New Hampshire’s recreational management issues;
Approximately 22,000, or 2 out of every 100, New Hampshire residents and
4,500 non-residents currently have wheeled off-highway recreational vehicles
(OHRVs);
Over the prior several years, the state had designated 23 wheeled OHRV trails or trail
systems, totaling approximately 700 miles;
There is a great disparity between trail availability and user demand;
Based on the number of registrations over the previous 8 years, total wheeled OHRV
registrations were expected to increase by 42 percent to more than 37,000 in 2008.
The plan outline recommended steps to embark upon addressing current and future
demands and can be downloaded at:
(http://www.nhtrails.org/Trailspages/ATVpages/ATVTrailSystemPlan.pdf)
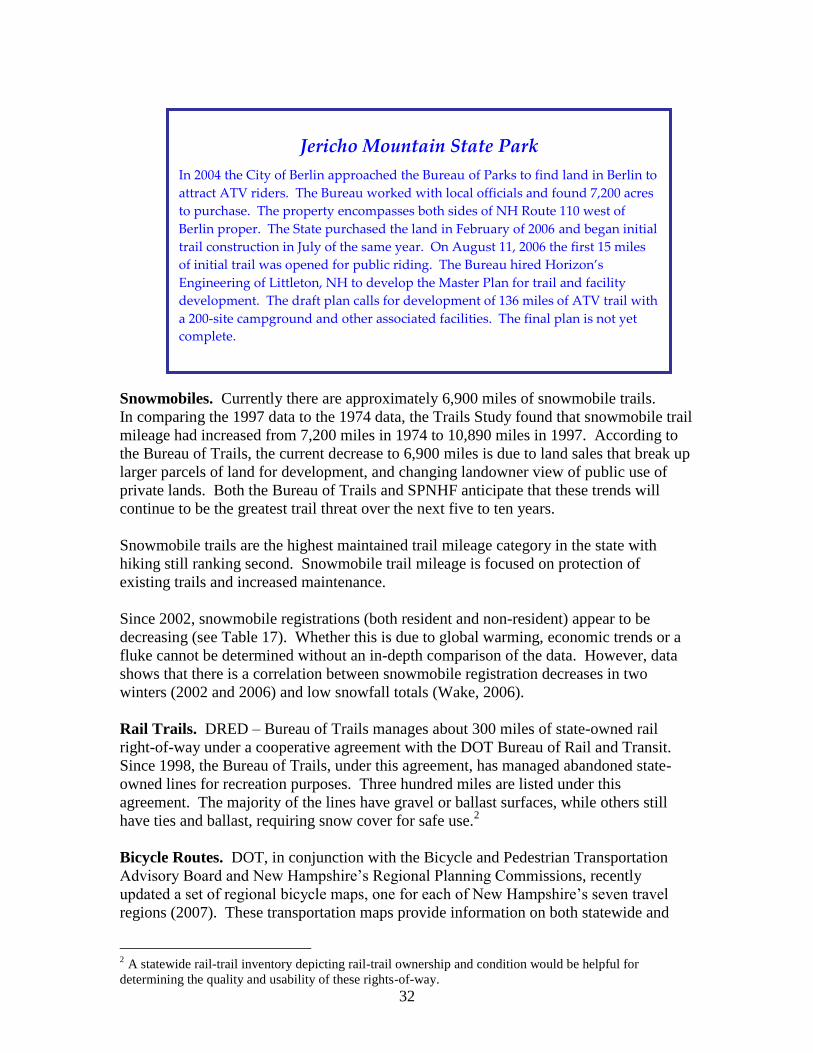
32
Snowmobiles. Currently there are approximately 6,900 miles of snowmobile trails.
In comparing the 1997 data to the 1974 data, the Trails Study found that snowmobile trail
mileage had increased from 7,200 miles in 1974 to 10,890 miles in 1997. According to
the Bureau of Trails, the current decrease to 6,900 miles is due to land sales that break up
larger parcels of land for development, and changing landowner view of public use of
private lands. Both the Bureau of Trails and SPNHF anticipate that these trends will
continue to be the greatest trail threat over the next five to ten years.
Snowmobile trails are the highest maintained trail mileage category in the state with
hiking still ranking second. Snowmobile trail mileage is focused on protection of
existing trails and increased maintenance.
Since 2002, snowmobile registrations (both resident and non-resident) appear to be
decreasing (see Table 17). Whether this is due to global warming, economic trends or a
fluke cannot be determined without an in-depth comparison of the data. However, data
shows that there is a correlation between snowmobile registration decreases in two
winters (2002 and 2006) and low snowfall totals (Wake, 2006).
Rail Trails. DRED – Bureau of Trails manages about 300 miles of state-owned rail
right-of-way under a cooperative agreement with the DOT Bureau of Rail and Transit.
Since 1998, the Bureau of Trails, under this agreement, has managed abandoned state-
owned lines for recreation purposes. Three hundred miles are listed under this
agreement. The majority of the lines have gravel or ballast surfaces, while others still
have ties and ballast, requiring snow cover for safe use.2
Bicycle Routes. DOT, in conjunction with the Bicycle and Pedestrian Transportation
Advisory Board and New Hampshire’s Regional Planning Commissions, recently
updated a set of regional bicycle maps, one for each of New Hampshire’s seven travel
regions (2007). These transportation maps provide information on both statewide and
2 A statewide rail-trail inventory depicting rail-trail ownership and condition would be helpful for
determining the quality and usability of these rights-of-way.
Jericho Mountain State Park
In 2004 the City of Berlin approached the Bureau of Parks to find land in Berlin to
attract ATV riders. The Bureau worked with local officials and found 7,200 acres
to purchase. The property encompasses both sides of NH Route 110 west of
Berlin proper. The State purchased the land in February of 2006 and began initial
trail construction in July of the same year. On August 11, 2006 the first 15 miles
of initial trail was opened for public riding. The Bureau hired Horizon’s
Engineering of Littleton, NH to develop the Master Plan for trail and facility
development. The draft plan calls for development of 136 miles of ATV trail with
a 200-site campground and other associated facilities. The final plan is not yet
complete.

33
regional bicycle routes. This information is available on the web at DOT’s
Bicycle/Pedestrian Information Center (www.NHBikePed.com) or in hard copy.
Trails and Greenways. There are many different types of trail and greenway efforts
underway in the state. Below are several main efforts, though certainly not an exhaustive
list. For instance, there is the Monadnock Sunapee Greenway connecting Mt.
Monadnock in Jaffrey, NH with Mt. Sunapee in Newbury, the evolving Wantastiquet-
Monadnock Greenway linking Mt. Wantastiquet in Hinsdale with Mt. Monadnock in
Jaffrey and Rindge as well as the Sunapee Ragged Kearsarge Greenway (SRKG). The
SRKG Coalition is working on two new linking trails that will expand their current 75-
mile loop around Lake Sunapee.
Some trails not only link New Hampshire communities but also cross state lines. Beyond
the well-known Appalachian Trail, interstate trails include:
The Cohos Trail in the northernmost part of the state, that travels from Bartlett to
the Canadian Border in Pittsburg, is envisioned to connect with trails in Quebec;
and
The Quabbin to Cardigan is a public/private initiative to conserve a corridor of
interconnected forests in the Monadnock Highlands. The region stretches more
than 100 miles from the Quabbin Reservoir in central Massachusetts to Mount
Cardigan and beyond into the White Mountains. It is one of the largest remaining
areas of intact, interconnected, ecologically significant forest in central New
England and is a key headwater area for the Merrimack and Connecticut rivers.
The region features a number of large public and private recreation areas
including Pisgah State Park, Mt. Monadnock, Andorra Forest, Mount Sunapee,
Mount Kearsarge, Gile State Forest, Mount Cardigan, Smarts Mountain, plus
numerous smaller conservation properties that are available for public recreation.
Long-distance hiking trails traversing the region include the Monadnock to
Metacomet Trail (currently under consideration as a National Scenic Trail), the
Wapack Trail, the Monadnock to Sunapee Greenway, and the Sunapee-Ragged-
Kearsarge (SRK) Greenway. Additional through-trail connections, ideally
developed in conjunction with permanent land protection, are possible between
the SRK Greenway and Mount Cardigan, and from Cardigan to the Appalachian
Trail in WMNF. The region also features an extensive, interconnected network of
state and club-maintained multi-use trails.
The Heritage Trail, as envisioned, will be a 230-mile walking path extending from
Massachusetts to Canada along the Merrimack, Pemigewasset and Connecticut Rivers.
Individual community efforts are still underway formalizing the miles of trail that are part
of the Heritage Trail system. Smaller river corridor trail systems will include the
Winnipesaukee River Trail from Center Harbor to Franklin, the Piscataquag River Trail
in Manchester, Goffstown, and New Boston, and the Souhegan River Trail in the towns
of Merrimack, Amherst, Milford and Wilton. (While the Heritage Trail is designated and
managed through the Bureau of Trails, it has had inconsistent interest from communities.)
34
A coalition has created a Birding Trail along the Connecticut River. A series of wildlife
viewing sites have been created and a series of three maps are available on the website
http://www.ctriverbirdingtrail.org/.
At the local level, RSA 231-A:1 gives towns the authority to reclassify roads to be used
as Class A or Class B trails by a vote of the legislative body. “The difference between
the two (Class A and Class B trails) lies in what rights the adjourning landowner retains.
“…with Class B, the owners have no special rights…With Class A trails…the owners can
continue to use the trail for vehicular access for forestry, agriculture and access to
existing buildings.” (A Hard Road to Travel, 2004, page 157). While this provides towns
with the opportunity to expand their trail network, it may not be a permanent designation.
The legislative body can also reconvert the trails back to highways.
Beyond hiking and pedestrian trails there are water trails as well. The Connecticut River
Water Trail travels along the full length of the Connecticut River in Vermont and New
Hampshire. The Connecticut River Joint Commissions revised and published a map and
guidebook of this entire trail for boating enthusiasts in 2001.
In 2004, the City of Portsmouth received LWCF funding for the “Portsmouth Canoe-
Kayak Water Trail.” This trail will connect, via signage, a new public dock at Sagamore
headlands, an improved Pierce Island Boat Launch, and several important open spaces,
conservation lands, and cultural resources between the City-owned Peirce Island and
Sagamore Headlands. The trip length from Pierce Island to Sagamore Headlands and
return is roughly two to three hours. Interpretive signs will be installed along the route
to educate paddlers about various waterfronts, natural and historic resources. The plans
have been completed for this project and construction is slated for completion in 2008.
The Northern Forest Canoe Trail (www.northernforestcanoetrail.org) links the waterways
of New York, Vermont, Québec, New Hampshire and Maine. The route’s flat water,
swift water, rivers, and lakes provide extensive opportunities for canoe and kayak
recreation, complemented by inns, B&Bs and camping facilities.
3. RECREATION DEMANDS AND NEEDS
National Facts and Figures
There are several nationwide studies, conducted on a regular basis, that have helped to
frame recreational demand in the U.S. These studies are particularly helpful in
identifying broad trends and understanding public attitudes. The following section
provides a summary of nationwide statistics and is presented to set a foundation for
statewide information and data.
Roper-Starch, Inc. and the Outdoor Industry Foundation conducted national surveys on
various recreation topics. The 2004 Roper-Starch Inc. and the Outdoor Industry
Foundation 2006 surveys measured participation levels for outdoor recreation activities,
assessed attitudes about outdoor recreation, and explored outdoor recreation’s
relationship to current issues of concern and the environment. This information provides
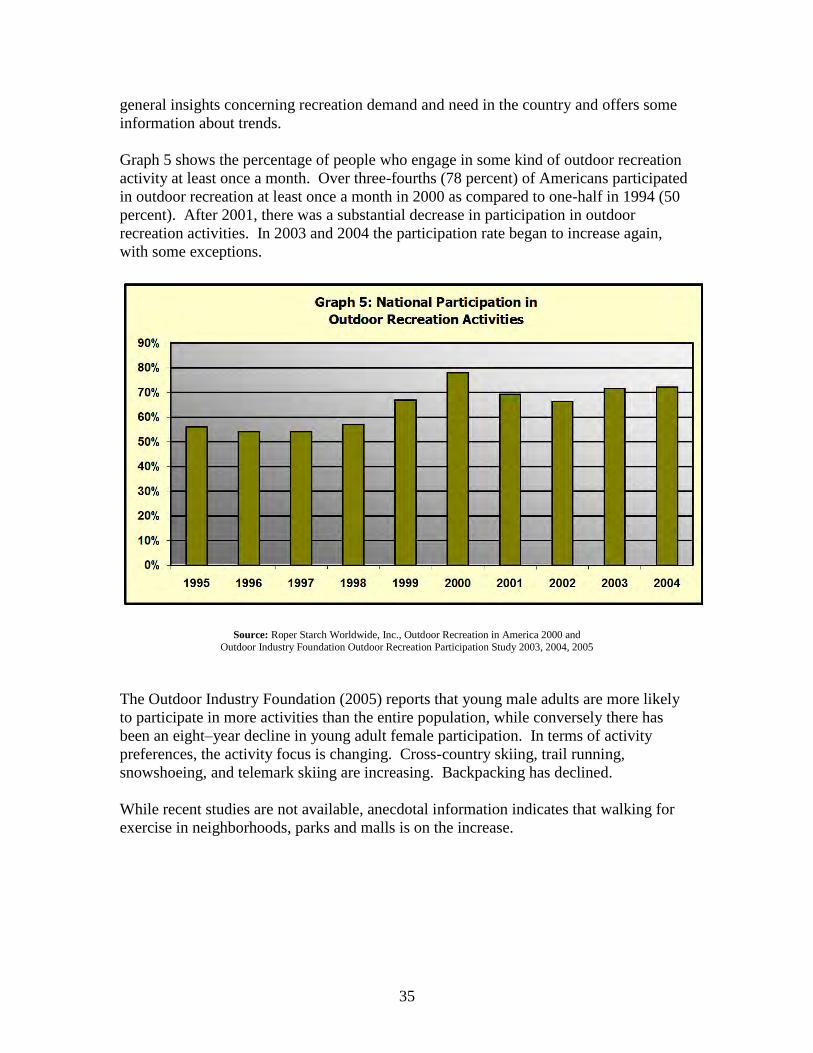
35
general insights concerning recreation demand and need in the country and offers some
information about trends.
Graph 5 shows the percentage of people who engage in some kind of outdoor recreation
activity at least once a month. Over three-fourths (78 percent) of Americans participated
in outdoor recreation at least once a month in 2000 as compared to one-half in 1994 (50
percent). After 2001, there was a substantial decrease in participation in outdoor
recreation activities. In 2003 and 2004 the participation rate began to increase again,
with some exceptions.
Source: Roper Starch Worldwide, Inc., Outdoor Recreation in America 2000 and
Outdoor Industry Foundation Outdoor Recreation Participation Study 2003, 2004, 2005
The Outdoor Industry Foundation (2005) reports that young male adults are more likely
to participate in more activities than the entire population, while conversely there has
been an eight–year decline in young adult female participation. In terms of activity
preferences, the activity focus is changing. Cross-country skiing, trail running,
snowshoeing, and telemark skiing are increasing. Backpacking has declined.
While recent studies are not available, anecdotal information indicates that walking for
exercise in neighborhoods, parks and malls is on the increase.
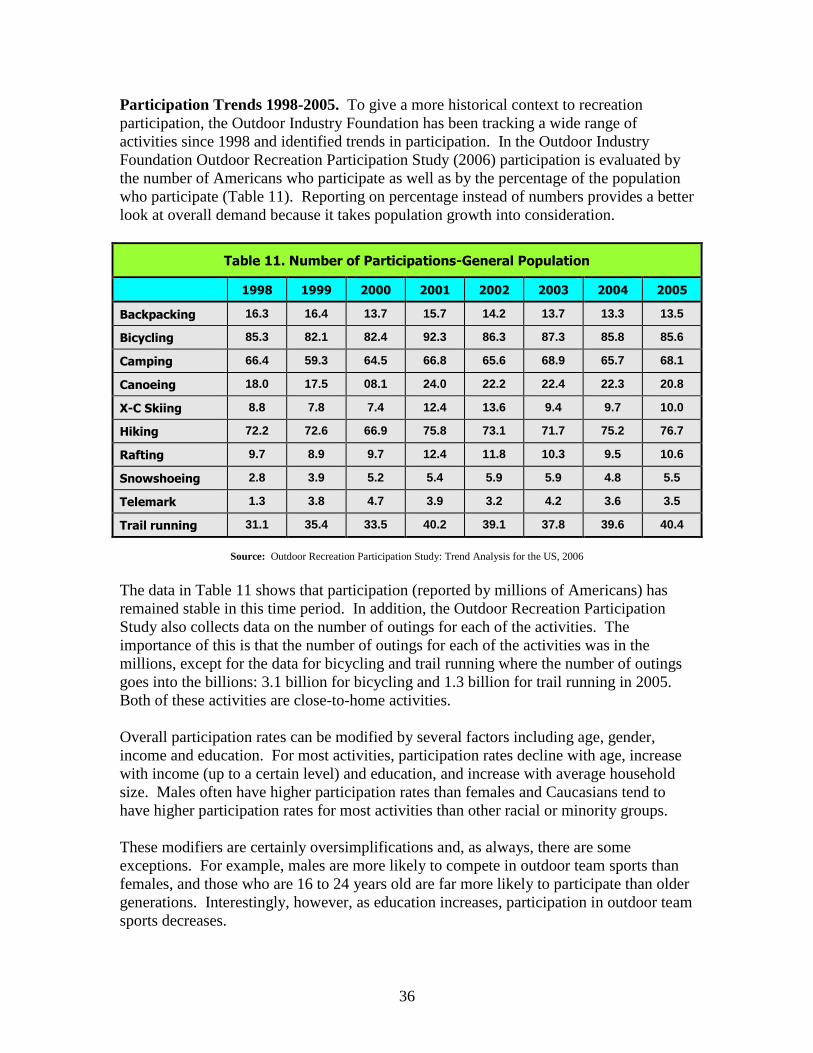
36
Participation Trends 1998-2005. To give a more historical context to recreation
participation, the Outdoor Industry Foundation has been tracking a wide range of
activities since 1998 and identified trends in participation. In the Outdoor Industry
Foundation Outdoor Recreation Participation Study (2006) participation is evaluated by
the number of Americans who participate as well as by the percentage of the population
who participate (Table 11). Reporting on percentage instead of numbers provides a better
look at overall demand because it takes population growth into consideration.
Table 11. Number of Participations-General Population
1998 1999 2000 2001 2002 2003 2004 2005
Backpacking 16.3 16.4 13.7 15.7 14.2 13.7 13.3 13.5
Bicycling 85.3 82.1 82.4 92.3 86.3 87.3 85.8 85.6
Camping 66.4 59.3 64.5 66.8 65.6 68.9 65.7 68.1
Canoeing 18.0 17.5 08.1 24.0 22.2 22.4 22.3 20.8
X-C Skiing 8.8 7.8 7.4 12.4 13.6 9.4 9.7 10.0
Hiking 72.2 72.6 66.9 75.8 73.1 71.7 75.2 76.7
Rafting 9.7 8.9 9.7 12.4 11.8 10.3 9.5 10.6
Snowshoeing 2.8 3.9 5.2 5.4 5.9 5.9 4.8 5.5
Telemark 1.3 3.8 4.7 3.9 3.2 4.2 3.6 3.5
Trail running 31.1 35.4 33.5 40.2 39.1 37.8 39.6 40.4
Source: Outdoor Recreation Participation Study: Trend Analysis for the US, 2006
The data in Table 11 shows that participation (reported by millions of Americans) has
remained stable in this time period. In addition, the Outdoor Recreation Participation
Study also collects data on the number of outings for each of the activities. The
importance of this is that the number of outings for each of the activities was in the
millions, except for the data for bicycling and trail running where the number of outings
goes into the billions: 3.1 billion for bicycling and 1.3 billion for trail running in 2005.
Both of these activities are close-to-home activities.
Overall participation rates can be modified by several factors including age, gender,
income and education. For most activities, participation rates decline with age, increase
with income (up to a certain level) and education, and increase with average household
size. Males often have higher participation rates than females and Caucasians tend to
have higher participation rates for most activities than other racial or minority groups.
These modifiers are certainly oversimplifications and, as always, there are some
exceptions. For example, males are more likely to compete in outdoor team sports than
females, and those who are 16 to 24 years old are far more likely to participate than older
generations. Interestingly, however, as education increases, participation in outdoor team
sports decreases.

37
Several other trends of interest include the following:
161.6 million (72.1 percent) Americans age 16 and older participated in an
outdoor activity in 2005.
The top five outdoor activities by percent of Americans who participated in the
activity at least once in the prior year are: bicycling 38.2 percent; fishing 34.4
percent; hiking 34.2 percent; camping 30.4 percent; and trail running 18 percent.
Except for bicycling, bird watching, and trail running, the majority of individuals
participate only one or two times each year in each activity.
Health and Wellness. The “nature-deficit disorder” trend among children is a growing
concern. A national conversation about this phenomenon has been ignited by Richard
Louv’s groundbreaking book, Last Child in the Woods: Saving Our Children from
Nature-Deficit Disorder. In it, Louv traces the causes and impacts of this separation
through interviews with educators, parents and health professionals, as well as with
children. He outlines the environmental, social, psychological and spiritual implications
of what he calls “nature-deficit disorder,” and describes a growing body of research that
reveals the necessity of contact with nature for healthy child development. The Children
and Nature Network (http://www.cnaturenet.org/), founded by Louv, is dedicated to
informing people about the issue, serving as a clearinghouse of relevant research and
current initiatives, and providing support.
Participation in the Northeast United States
The 2006 Outdoor Industry Foundation Outdoor Recreation Participation Study (in
keeping with other national studies) compares data according to four general regions:
West, North Central, South Central and Northeast. The Northeast region ranges from
New Jersey and Pennsylvania up through Maine and includes New Hampshire. Thirteen
groups of activities were compared across the four regions. For some activities
participation was similar across regions, for others there were regional variations. By
comparison, the findings indicate that Americans living in the Northeast region are less
likely to participate in outdoor activities (Graph 6). It is interesting to note that outdoor
activities in the Northeast have not rebounded as much as the other regions after 2001.
This study cites the increased use of electronics as a major cause of lowered participation
in outdoor activity. However, a definitive study has not been done to determine the
comparable impacts of electronics, higher gas prices, the Iraq War, an aging population
or other factors on participation in recreational activities.
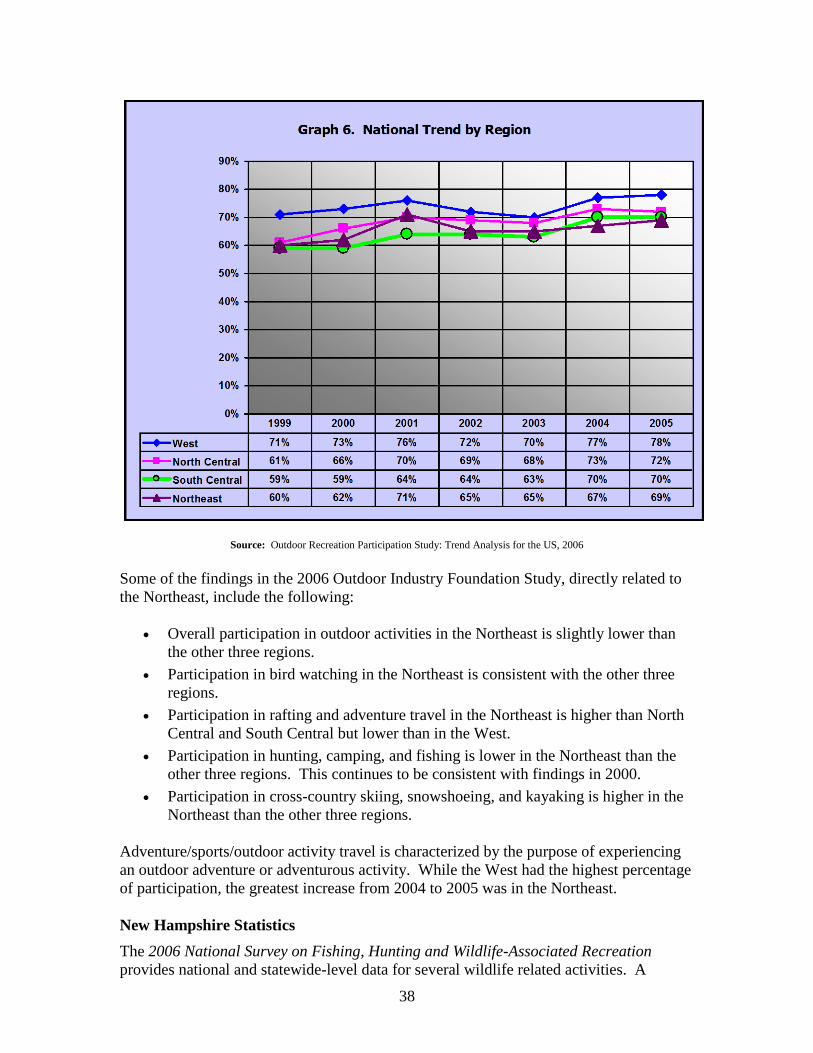
38
Source: Outdoor Recreation Participation Study: Trend Analysis for the US, 2006
Some of the findings in the 2006 Outdoor Industry Foundation Study, directly related to
the Northeast, include the following:
Overall participation in outdoor activities in the Northeast is slightly lower than
the other three regions.
Participation in bird watching in the Northeast is consistent with the other three
regions.
Participation in rafting and adventure travel in the Northeast is higher than North
Central and South Central but lower than in the West.
Participation in hunting, camping, and fishing is lower in the Northeast than the
other three regions. This continues to be consistent with findings in 2000.
Participation in cross-country skiing, snowshoeing, and kayaking is higher in the
Northeast than the other three regions.
Adventure/sports/outdoor activity travel is characterized by the purpose of experiencing
an outdoor adventure or adventurous activity. While the West had the highest percentage
of participation, the greatest increase from 2004 to 2005 was in the Northeast.
New Hampshire Statistics
The 2006 National Survey on Fishing, Hunting and Wildlife-Associated Recreation
provides national and statewide-level data for several wildlife related activities. A
39
preliminary report summarizing New Hampshire data is now available through the U.S.
Fish and Wildlife Service and is summarized below.
These national and statewide surveys provide data about New Hampshire residents as
well as data about the state itself. Specifically, data is available on the level of
participation and expenditures by New Hampshire residents within the entire United
States and on the levels of participation and expenditures by residents and non-residents
alike within the State of New Hampshire. Summarized below are participation rates for
New Hampshire residents and participation totals and expenditures within the State of
New Hampshire by residents and non-residents.
In all, this 2006 survey found that 51 percent of New Hampshire residents who are 16
years of age or older participated in hunting, fishing, and/or wildlife watching activities.
About 46 percent of residents take part in wildlife watching (observing, feeding, or
photographing wildlife) and 14 percent take part in either fishing or hunting.
Using 2006 data, wildlife-associated recreation contributed $516 million in expenditures
within New Hampshire. This includes expenditures for fishing, hunting, items used for
both fishing and hunting, and lastly, wildlife watching. Equipment purchases accounted
for $135 million; licenses, leases, landownership and contributions accounted for $111
million; and auxiliary and special related expenditures accounted for the remainder of
$54 million.
New Hampshire saw a total of 228,000 anglers in 2006. Combined, these anglers fished
for 2.8 million days and spent nearly $178 million on fishing related expenditures in the
state. About 55 percent of all anglers in New Hampshire are residents and about 51
percent are non-residents, though residents account for 70 percent of all fishing days.
The average angler fished 12 days a year.
New Hampshire saw a total of 60,000 hunters in 2006. Combined, these in-state and out-
of-state hunters participated in 1.46 million days of hunting and spent over $80 million in
hunting related expenses in state. About 83 percent of all hunters who hunt in New
Hampshire are state residents, and 17 percent of the total are non-resident hunters. The
average participant hunted 17.5 days.
New Hampshire saw a total of 698,000 participants in wildlife watching activities in
2006. Nonresidential participation, defined as at least one mile or more from home,
consisted of 323,000 participants. Wildlife watching contributed $267 million in
expenditures in New Hampshire. Breaking this down, approximately $114 million was
spent on trip-related expenditures, over $68 million was spent on equipment, and $84
million was spent on “other” expenses such as membership dues, contributions and
magazine subscriptions. Participants spent an average of 9.2 days in wildlife watching
activities.
Wildlife-Related Recreation Trends
The 2001 version of this dataset can be compared against 1996 data. In comparing broad
estimates from both studies, it appears there was little change in participation for fishing,
a slight decrease in hunting, and a similar number of total participants in nonresidential
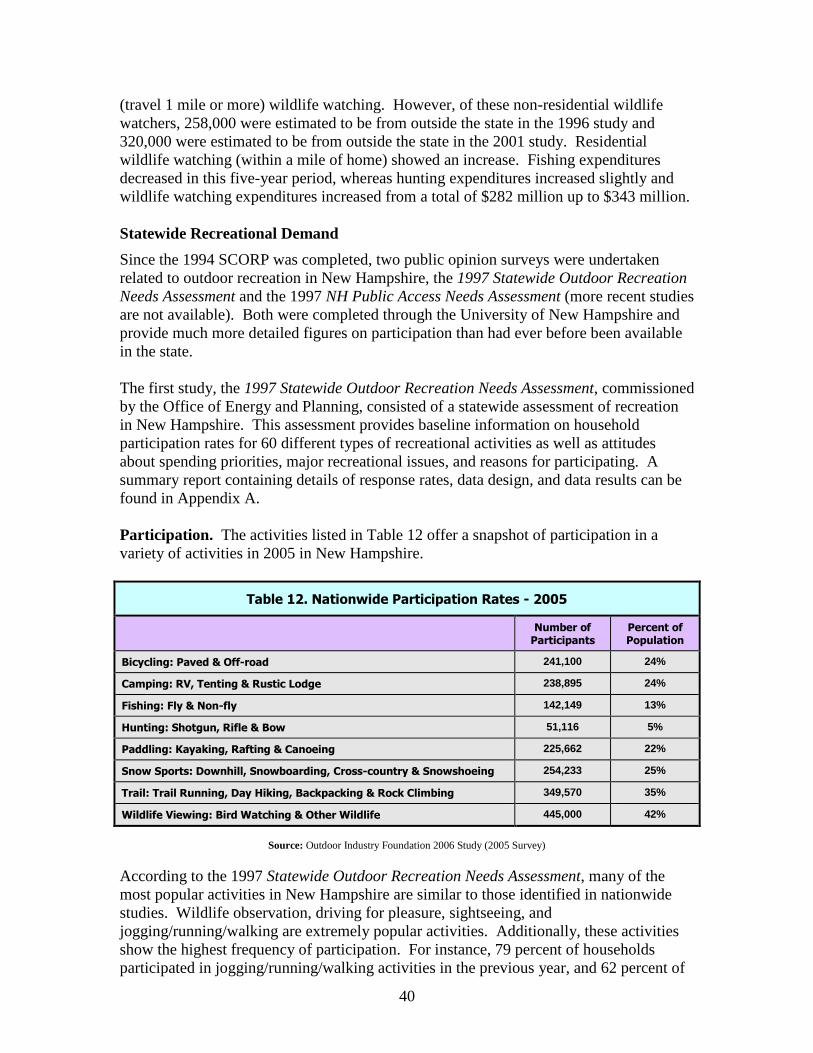
40
(travel 1 mile or more) wildlife watching. However, of these non-residential wildlife
watchers, 258,000 were estimated to be from outside the state in the 1996 study and
320,000 were estimated to be from outside the state in the 2001 study. Residential
wildlife watching (within a mile of home) showed an increase. Fishing expenditures
decreased in this five-year period, whereas hunting expenditures increased slightly and
wildlife watching expenditures increased from a total of $282 million up to $343 million.
Statewide Recreational Demand
Since the 1994 SCORP was completed, two public opinion surveys were undertaken
related to outdoor recreation in New Hampshire, the 1997 Statewide Outdoor Recreation
Needs Assessment and the 1997 NH Public Access Needs Assessment (more recent studies
are not available). Both were completed through the University of New Hampshire and
provide much more detailed figures on participation than had ever before been available
in the state.
The first study, the 1997 Statewide Outdoor Recreation Needs Assessment, commissioned
by the Office of Energy and Planning, consisted of a statewide assessment of recreation
in New Hampshire. This assessment provides baseline information on household
participation rates for 60 different types of recreational activities as well as attitudes
about spending priorities, major recreational issues, and reasons for participating. A
summary report containing details of response rates, data design, and data results can be
found in Appendix A.
Participation. The activities listed in Table 12 offer a snapshot of participation in a
variety of activities in 2005 in New Hampshire.
Table 12. Nationwide Participation Rates - 2005
Number of Participants
Percent of Population
Bicycling: Paved & Off-road 241,100 24%
Camping: RV, Tenting & Rustic Lodge 238,895 24%
Fishing: Fly & Non-fly 142,149 13%
Hunting: Shotgun, Rifle & Bow 51,116 5%
Paddling: Kayaking, Rafting & Canoeing 225,662 22%
Snow Sports: Downhill, Snowboarding, Cross-country & Snowshoeing 254,233 25%
Trail: Trail Running, Day Hiking, Backpacking & Rock Climbing 349,570 35%
Wildlife Viewing: Bird Watching & Other Wildlife 445,000 42%
Source: Outdoor Industry Foundation 2006 Study (2005 Survey)
According to the 1997 Statewide Outdoor Recreation Needs Assessment, many of the
most popular activities in New Hampshire are similar to those identified in nationwide
studies. Wildlife observation, driving for pleasure, sightseeing, and
jogging/running/walking are extremely popular activities. Additionally, these activities
show the highest frequency of participation. For instance, 79 percent of households
participated in jogging/running/walking activities in the previous year, and 62 percent of
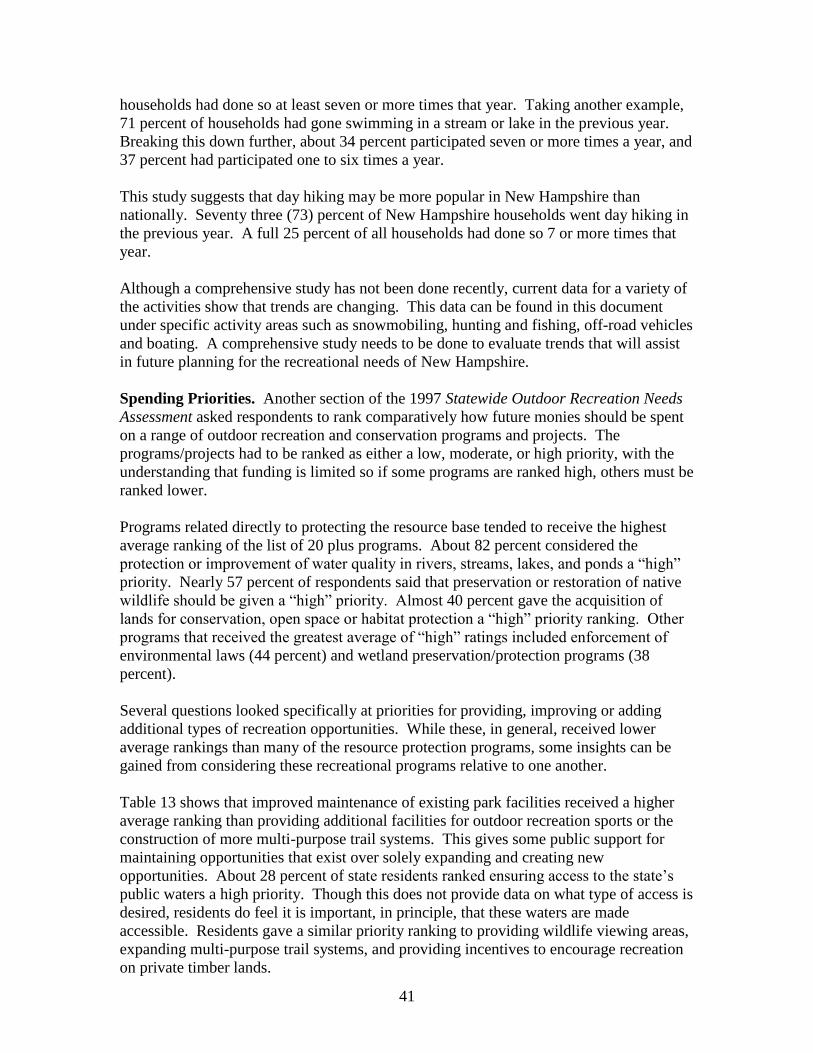
41
households had done so at least seven or more times that year. Taking another example,
71 percent of households had gone swimming in a stream or lake in the previous year.
Breaking this down further, about 34 percent participated seven or more times a year, and
37 percent had participated one to six times a year.
This study suggests that day hiking may be more popular in New Hampshire than
nationally. Seventy three (73) percent of New Hampshire households went day hiking in
the previous year. A full 25 percent of all households had done so 7 or more times that
year.
Although a comprehensive study has not been done recently, current data for a variety of
the activities show that trends are changing. This data can be found in this document
under specific activity areas such as snowmobiling, hunting and fishing, off-road vehicles
and boating. A comprehensive study needs to be done to evaluate trends that will assist
in future planning for the recreational needs of New Hampshire.
Spending Priorities. Another section of the 1997 Statewide Outdoor Recreation Needs
Assessment asked respondents to rank comparatively how future monies should be spent
on a range of outdoor recreation and conservation programs and projects. The
programs/projects had to be ranked as either a low, moderate, or high priority, with the
understanding that funding is limited so if some programs are ranked high, others must be
ranked lower.
Programs related directly to protecting the resource base tended to receive the highest
average ranking of the list of 20 plus programs. About 82 percent considered the
protection or improvement of water quality in rivers, streams, lakes, and ponds a “high”
priority. Nearly 57 percent of respondents said that preservation or restoration of native
wildlife should be given a “high” priority. Almost 40 percent gave the acquisition of
lands for conservation, open space or habitat protection a “high” priority ranking. Other
programs that received the greatest average of “high” ratings included enforcement of
environmental laws (44 percent) and wetland preservation/protection programs (38
percent).
Several questions looked specifically at priorities for providing, improving or adding
additional types of recreation opportunities. While these, in general, received lower
average rankings than many of the resource protection programs, some insights can be
gained from considering these recreational programs relative to one another.
Table 13 shows that improved maintenance of existing park facilities received a higher
average ranking than providing additional facilities for outdoor recreation sports or the
construction of more multi-purpose trail systems. This gives some public support for
maintaining opportunities that exist over solely expanding and creating new
opportunities. About 28 percent of state residents ranked ensuring access to the state’s
public waters a high priority. Though this does not provide data on what type of access is
desired, residents do feel it is important, in principle, that these waters are made
accessible. Residents gave a similar priority ranking to providing wildlife viewing areas,
expanding multi-purpose trail systems, and providing incentives to encourage recreation
on private timber lands.
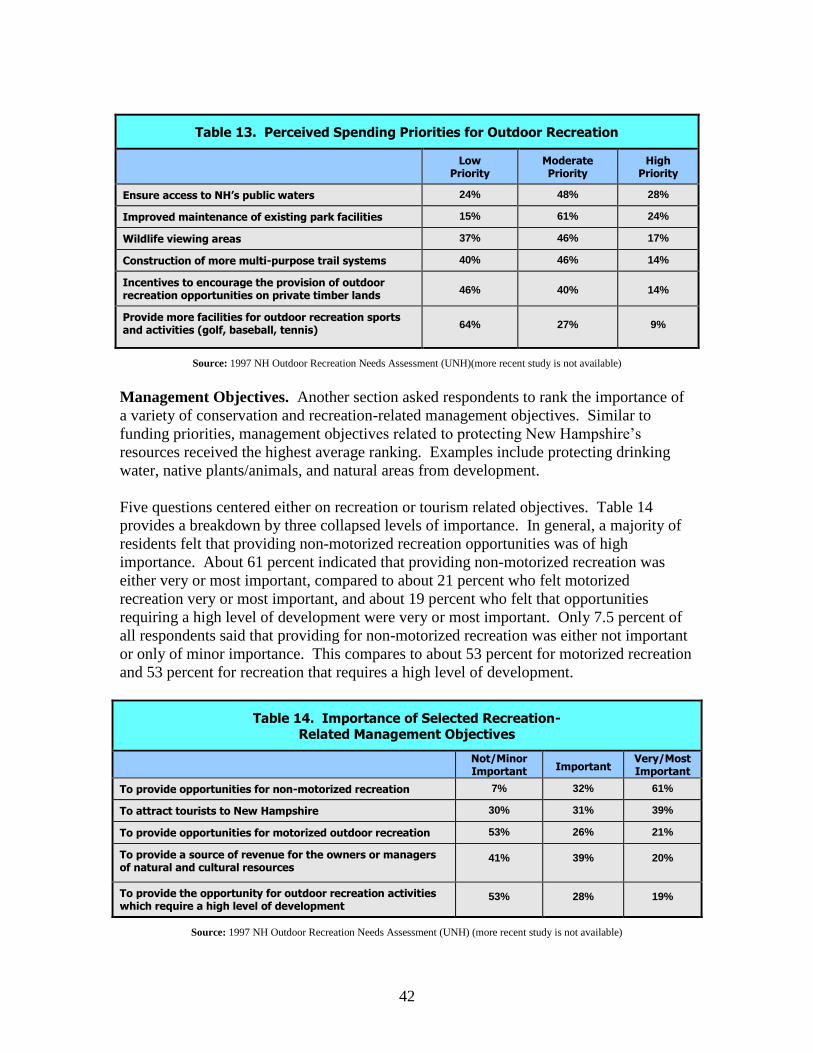
42
Table 13. Perceived Spending Priorities for Outdoor Recreation
Low Priority
Moderate Priority
High Priority
Ensure access to NH’s public waters 24% 48% 28%
Improved maintenance of existing park facilities 15% 61% 24%
Wildlife viewing areas 37% 46% 17%
Construction of more multi-purpose trail systems 40% 46% 14%
Incentives to encourage the provision of outdoor recreation opportunities on private timber lands
46%
40%
14%
Provide more facilities for outdoor recreation sports and activities (golf, baseball, tennis)
64%
27%
9%
Source: 1997 NH Outdoor Recreation Needs Assessment (UNH)(more recent study is not available)
Management Objectives. Another section asked respondents to rank the importance of
a variety of conservation and recreation-related management objectives. Similar to
funding priorities, management objectives related to protecting New Hampshire’s
resources received the highest average ranking. Examples include protecting drinking
water, native plants/animals, and natural areas from development.
Five questions centered either on recreation or tourism related objectives. Table 14
provides a breakdown by three collapsed levels of importance. In general, a majority of
residents felt that providing non-motorized recreation opportunities was of high
importance. About 61 percent indicated that providing non-motorized recreation was
either very or most important, compared to about 21 percent who felt motorized
recreation very or most important, and about 19 percent who felt that opportunities
requiring a high level of development were very or most important. Only 7.5 percent of
all respondents said that providing for non-motorized recreation was either not important
or only of minor importance. This compares to about 53 percent for motorized recreation
and 53 percent for recreation that requires a high level of development.
Table 14. Importance of Selected Recreation- Related Management Objectives
Not/Minor Important Important
Very/Most Important
To provide opportunities for non-motorized recreation 7% 32% 61%
To attract tourists to New Hampshire 30% 31% 39%
To provide opportunities for motorized outdoor recreation 53% 26% 21%
To provide a source of revenue for the owners or managers of natural and cultural resources
41% 39% 20%
To provide the opportunity for outdoor recreation activities which require a high level of development
53% 28% 19%
Source: 1997 NH Outdoor Recreation Needs Assessment (UNH) (more recent study is not available)
43
These figures should not be interpreted to mean that motorized recreation or developed
recreation opportunities are unimportant and consequently should not be given any
consideration. Rather it suggests that a broader range of residents participate in non-
motorized recreation and accordingly, a larger percentage feel it is important to maintain
these opportunities. Many who participate in activities that require development (e.g.
golf, skiing) or motorized activities (e.g. wheeled off-highway recreation vehicle,
snowmobile) also enjoy hiking, canoeing and other non-motorized activities. Non-
motorized recreation, especially walking/hiking, can be enjoyed without a great deal of
equipment or investment. And, as borne out by national and statewide data, these
activities tend to have the highest participation rates.
This information suggests that non-motorized activities should continue to be a major
focus in New Hampshire’s outdoor recreation management. In addition, while overall
statewide participation rates tend to be lower for motorized or developed recreation, those
who do participate tend to participate quite often and their needs cannot be disregarded.
A considerable percentage of state residents (~ 20 percent) indicate that developed
recreation and motorized recreation, respectively, are a very, or the most, important
recreational management objective.
Regional Considerations. Further analysis of this data conducted by the University of
New Hampshire suggests that differences exist between residents, depending on where
they live in the state and by how long they have lived here. In this analysis, several
different groups were identified. To examine differences between those who have lived
in New Hampshire all of their lives versus those who have moved here, groups were
developed for New Hampshire ‘natives’ and New Hampshire ‘non-natives’. In addition,
responses were also analyzed by classifying respondents as to where they live in the state.
The two categories that were developed consisted of ‘metro’ and ‘non-metro’.
This metro/non-metro classification considers the southeastern area of Merrimack,
Hillsborough, Strafford and Rockingham Counties as the “metro” area, and Coos,
Carroll, Belknap, Grafton, Sullivan and Cheshire Counties as the “non-metro” area. This
division was derived based on an examination of average population per square mile.
The four-county “metro” area contains 73 percent of the state’s population and occupies
32 percent of the land base. The average population per square mile is 313.25. The six-
county “non-metro” area occupies 68 percent of the land base but only 27 percent of the
population with an average population per square mile of 69.16. This basic classification
provides an interesting, albeit rough, starting point for examining potential differences
between different parts of the state.
Responses for natives and non-natives, as well as metro areas and non-metro areas, were
compared across several classes of outdoor recreation activities. Responses were also
examined across motivations for participation and across attitudes about recreation
management and the environment. Below is a summary of some recreation participation
and attitudinal differences between native and non-native classifications, as well as
between the two metro/non metro classifications.
44
Natives have higher participation rates than non-natives for several different
outdoor recreational activities including hunting, fishing, motor sports, activities
that require developed settings, and active pursuits (e.g. swimming, jogging,
hiking, rock climbing, etc.).
Non-metro respondents (Coos, Belknap, Grafton, Carroll Counties) have higher
participation rates in hunting than metro respondents.
Motivations for participation in outdoor recreation are generally the same for
natives and non-natives. However, non-metro respondents who have moved to
New Hampshire since the 1970’s were more motivated to participate in recreation
as an ‘escape’ than were natives.
Non-metro respondents tend to have stronger preferences for management
objectives related to environmental protection than those from metro areas.
Native respondents from non-metro areas were an exception.
Non-natives consider wetland protection more of a funding priority than natives.
Natives are more supportive of higher fees for non-residents than are non-native
residents, but are the least supportive of higher in-state fees to support outdoor
recreation management/development.
Non-metro residents, in general, tend to be less supportive of higher fees than
metro residents.
Demand for Water Access
Overview. In the second study, NH Public Access Needs Assessment (1997), the
University of New Hampshire completed a statewide assessment for the New Hampshire
Fish and Game Department to examine the need and demand for public access to lakes,
ponds and rivers in the state. This study provides baseline statistics about what lakes,
ponds and rivers people go to, what they like to do, and general attitudes about public
access needs in the state.
Data in the telephone survey portion of the study was collected so that statistically
significant comparisons could be drawn across four major regions of the state. The
regions represent the four New Hampshire Fish and Game Department management
regions and are drawn along county lines. As illustrated by Figure 3, Region 1 consists
of Coos County, Region 2 consists of Belknap, Grafton and Carroll Counties, Region 3
Consists of Rockingham, Strafford and Merrimack Counties, and Region 4 consists of
Hillsborough, Cheshire and Sullivan Counties.
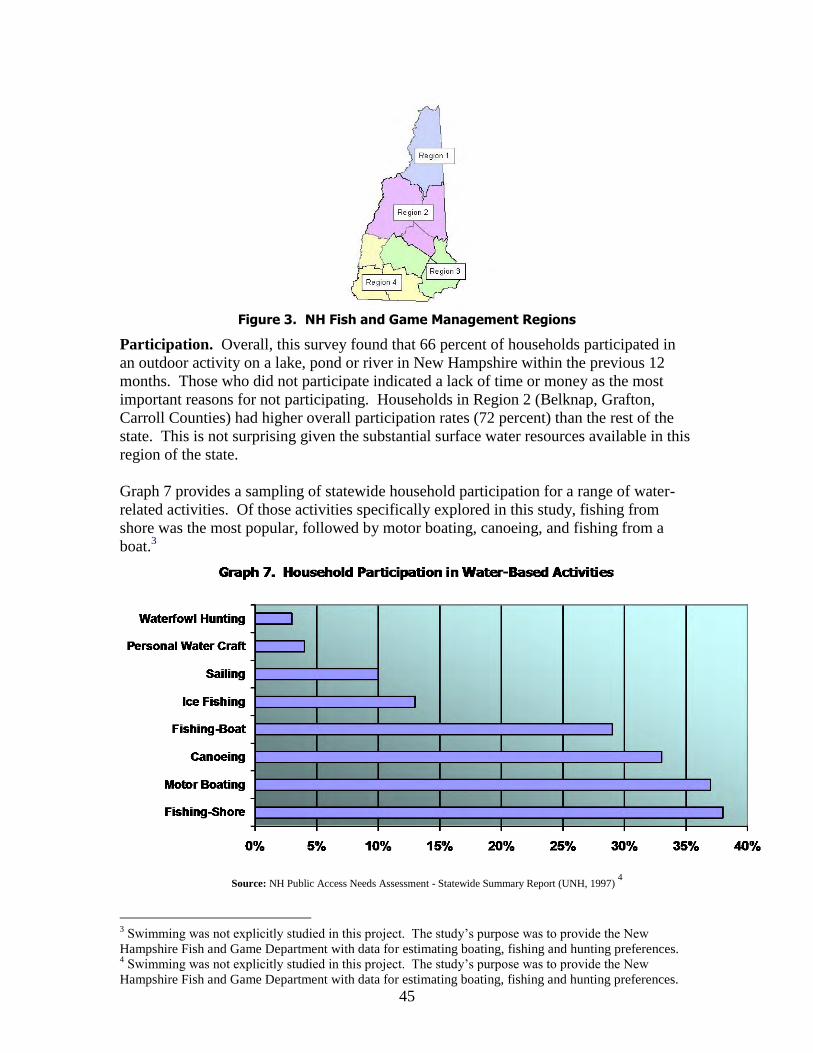
45
Figure 3. NH Fish and Game Management Regions
Participation. Overall, this survey found that 66 percent of households participated in
an outdoor activity on a lake, pond or river in New Hampshire within the previous 12
months. Those who did not participate indicated a lack of time or money as the most
important reasons for not participating. Households in Region 2 (Belknap, Grafton,
Carroll Counties) had higher overall participation rates (72 percent) than the rest of the
state. This is not surprising given the substantial surface water resources available in this
region of the state.
Graph 7 provides a sampling of statewide household participation for a range of water-
related activities. Of those activities specifically explored in this study, fishing from
shore was the most popular, followed by motor boating, canoeing, and fishing from a
boat.3
Source: NH Public Access Needs Assessment - Statewide Summary Report (UNH, 1997) 4
3 Swimming was not explicitly studied in this project. The study’s purpose was to provide the New
Hampshire Fish and Game Department with data for estimating boating, fishing and hunting preferences. 4 Swimming was not explicitly studied in this project. The study’s purpose was to provide the New
Hampshire Fish and Game Department with data for estimating boating, fishing and hunting preferences.
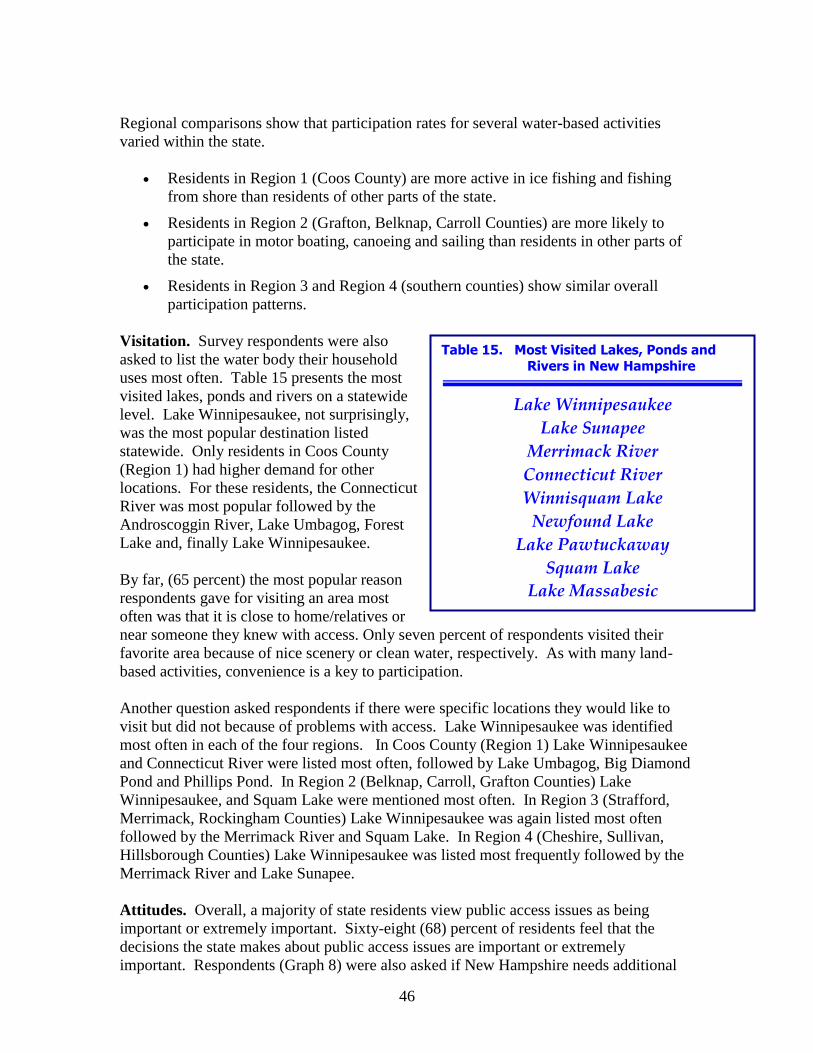
46
Regional comparisons show that participation rates for several water-based activities
varied within the state.
Residents in Region 1 (Coos County) are more active in ice fishing and fishing
from shore than residents of other parts of the state.
Residents in Region 2 (Grafton, Belknap, Carroll Counties) are more likely to
participate in motor boating, canoeing and sailing than residents in other parts of
the state.
Residents in Region 3 and Region 4 (southern counties) show similar overall
participation patterns.
Visitation. Survey respondents were also
asked to list the water body their household
uses most often. Table 15 presents the most
visited lakes, ponds and rivers on a statewide
level. Lake Winnipesaukee, not surprisingly,
was the most popular destination listed
statewide. Only residents in Coos County
(Region 1) had higher demand for other
locations. For these residents, the Connecticut
River was most popular followed by the
Androscoggin River, Lake Umbagog, Forest
Lake and, finally Lake Winnipesaukee.
By far, (65 percent) the most popular reason
respondents gave for visiting an area most
often was that it is close to home/relatives or
near someone they knew with access. Only seven percent of respondents visited their
favorite area because of nice scenery or clean water, respectively. As with many land-
based activities, convenience is a key to participation.
Another question asked respondents if there were specific locations they would like to
visit but did not because of problems with access. Lake Winnipesaukee was identified
most often in each of the four regions. In Coos County (Region 1) Lake Winnipesaukee
and Connecticut River were listed most often, followed by Lake Umbagog, Big Diamond
Pond and Phillips Pond. In Region 2 (Belknap, Carroll, Grafton Counties) Lake
Winnipesaukee, and Squam Lake were mentioned most often. In Region 3 (Strafford,
Merrimack, Rockingham Counties) Lake Winnipesaukee was again listed most often
followed by the Merrimack River and Squam Lake. In Region 4 (Cheshire, Sullivan,
Hillsborough Counties) Lake Winnipesaukee was listed most frequently followed by the
Merrimack River and Lake Sunapee.
Attitudes. Overall, a majority of state residents view public access issues as being
important or extremely important. Sixty-eight (68) percent of residents feel that the
decisions the state makes about public access issues are important or extremely
important. Respondents (Graph 8) were also asked if New Hampshire needs additional
Table 15. Most Visited Lakes, Ponds and
Rivers in New Hampshire
Lake Winnipesaukee
Lake Sunapee
Merrimack River
Connecticut River
Winnisquam Lake
Newfound Lake
Lake Pawtuckaway
Squam Lake
Lake Massabesic
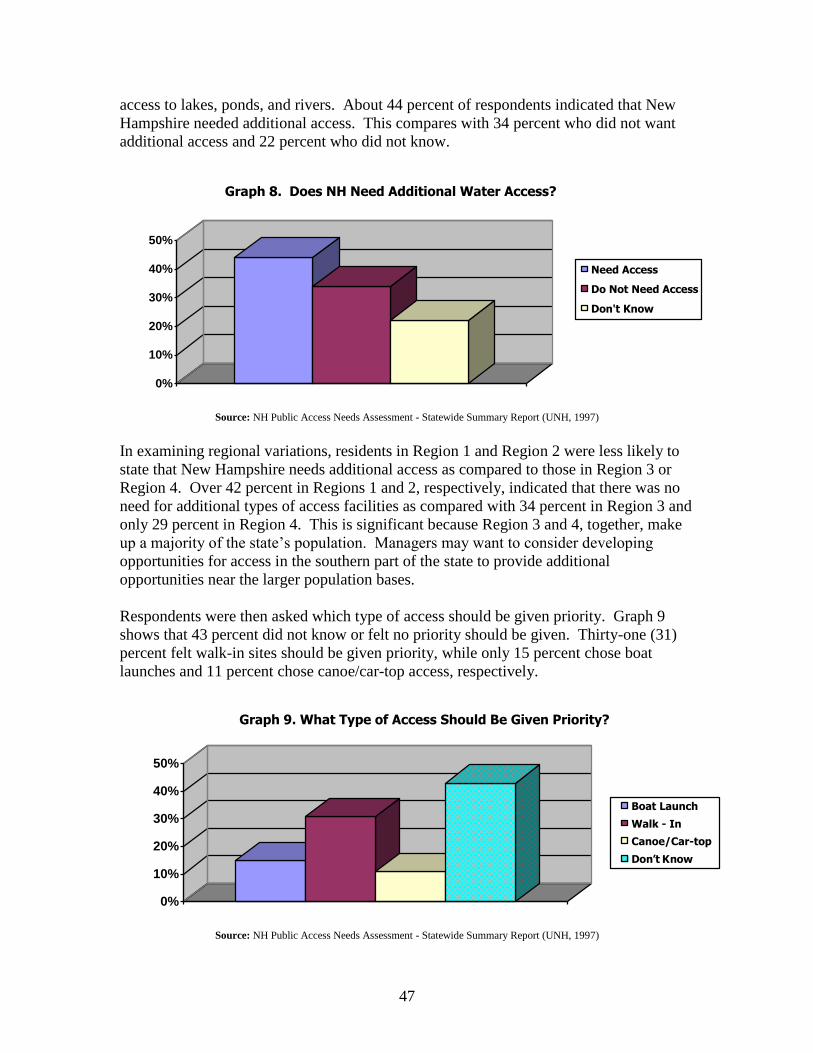
47
access to lakes, ponds, and rivers. About 44 percent of respondents indicated that New
Hampshire needed additional access. This compares with 34 percent who did not want
additional access and 22 percent who did not know.
0%
10%
20%
30%
40%
50%
Graph 8. Does NH Need Additional Water Access?
Need Access
Do Not Need Access
Don't Know
Source: NH Public Access Needs Assessment - Statewide Summary Report (UNH, 1997)
In examining regional variations, residents in Region 1 and Region 2 were less likely to
state that New Hampshire needs additional access as compared to those in Region 3 or
Region 4. Over 42 percent in Regions 1 and 2, respectively, indicated that there was no
need for additional types of access facilities as compared with 34 percent in Region 3 and
only 29 percent in Region 4. This is significant because Region 3 and 4, together, make
up a majority of the state’s population. Managers may want to consider developing
opportunities for access in the southern part of the state to provide additional
opportunities near the larger population bases.
Respondents were then asked which type of access should be given priority. Graph 9
shows that 43 percent did not know or felt no priority should be given. Thirty-one (31)
percent felt walk-in sites should be given priority, while only 15 percent chose boat
launches and 11 percent chose canoe/car-top access, respectively.
0%
10%
20%
30%
40%
50%
Graph 9. What Type of Access Should Be Given Priority?
Boat Launch
Walk - In
Canoe/Car-top
Don’t Know
Source: NH Public Access Needs Assessment - Statewide Summary Report (UNH, 1997)
48
About 51 percent of those who participated in the telephone survey also completed a
more detailed follow-up mail questionnaire. Since this group is self-selected, the
information that follows does not necessarily represent the ‘general public.’ However,
these findings do provide a good indicator of the viewpoints and attitudes of those
residents who tend to be more active or more experienced with water-based recreation.
This group, given their interest in the survey, may represent a population that is
comparatively more interested in the decisions the state makes about water-based
recreation in New Hampshire.
Mail survey respondents were asked to rate the importance of different lake or river
characteristics as part of their recreational experience. Overall, the most important
characteristics relate to safety and the natural character of an area. Over 70 percent of
this sample indicated that having a safe area for recreation was extremely or very
important. Other highly important characteristics include the presence of wildlife and
birds as well as undeveloped shorelines and natural features.
The most common recreational activities include picnicking, sunbathing, swimming,
relaxing/doing nothing, and walking or hiking along shore. Again, these figures support
other studies that report on the high popularity of activities that require little equipment,
can take place in many locations, and can be participated in by young and old alike.
Respondents were asked to identify their priorities for improving water-based or water-
enhanced (e.g. sunbathing, walking/hiking along shore) recreation in the state. A series
of nine potential priorities were ranked. The top three priorities, according to this group,
include improved information, better design and maintenance of existing facilities, and
improved enforcement at public access sites. The lowest priorities within these nine
categories centered on building additional types of public access facilities. The lowest
ranking was given to building more fishing piers, followed by canoe/car-top facilities,
boat launch facilities and shore bank-fishing opportunities. This data suggests that the
NH Fish and Game Department’s continued focus on refurbishing existing access sites is
a good management strategy. Again, residents recognize the importance of providing
quality experiences at existing sites, not just expanding on the overall quantity of sites.
When asked about the severity of different management problems on lakes, ponds and
rivers in the state, respondents reported that excessive horsepower of powerboats,
inconsiderate behavior of others, and human waste were some of the most serious
problems based on their experience. Other issues reported most often as “moderate
problems” included pollution caused by outboard motors and lack of enforcement of
boating rules and regulations.
Another series of questions focused on viewpoints about several public access issues and
concerns. One set of issues centered on people-related concerns. Almost two-thirds of
respondents agreed that litter is a problem at most access sites. About 54 percent
consider public safety to be a concern at boat launch facilities, and nearly 50 percent of
respondents felt that there should be more supervision and security at public access sites.
These responses add weight to the high priority given for better enforcement at public
access sites.
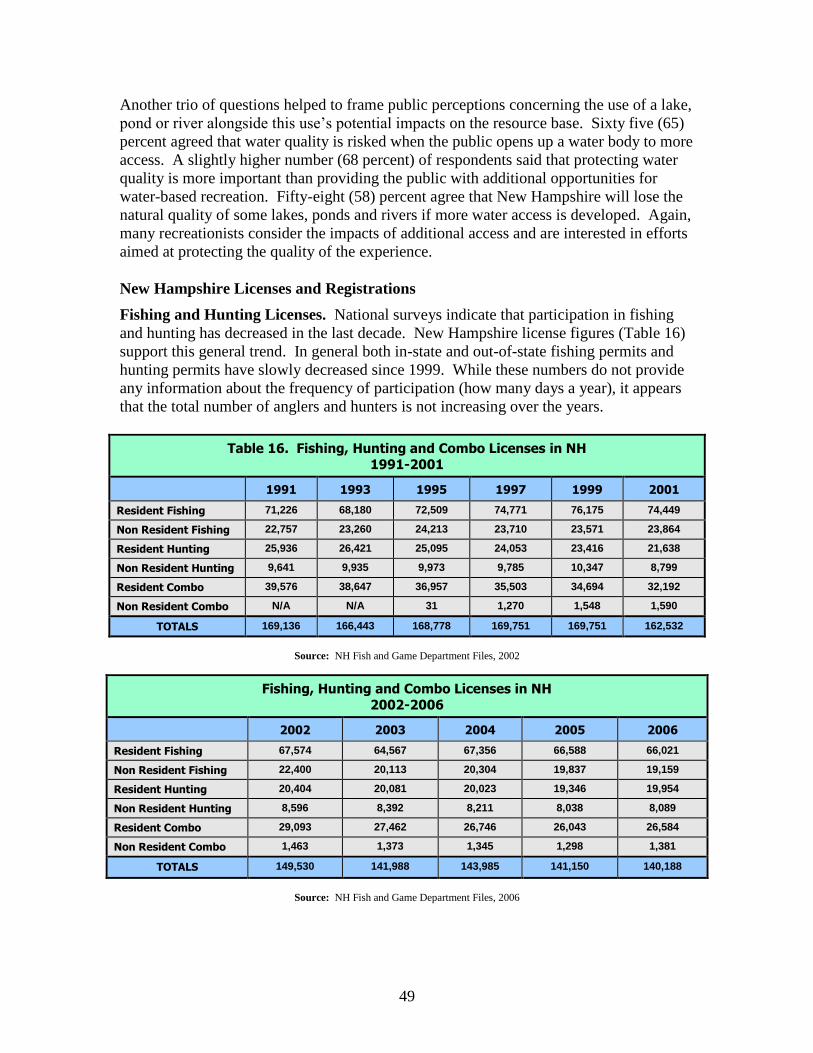
49
Another trio of questions helped to frame public perceptions concerning the use of a lake,
pond or river alongside this use’s potential impacts on the resource base. Sixty five (65)
percent agreed that water quality is risked when the public opens up a water body to more
access. A slightly higher number (68 percent) of respondents said that protecting water
quality is more important than providing the public with additional opportunities for
water-based recreation. Fifty-eight (58) percent agree that New Hampshire will lose the
natural quality of some lakes, ponds and rivers if more water access is developed. Again,
many recreationists consider the impacts of additional access and are interested in efforts
aimed at protecting the quality of the experience.
New Hampshire Licenses and Registrations
Fishing and Hunting Licenses. National surveys indicate that participation in fishing
and hunting has decreased in the last decade. New Hampshire license figures (Table 16)
support this general trend. In general both in-state and out-of-state fishing permits and
hunting permits have slowly decreased since 1999. While these numbers do not provide
any information about the frequency of participation (how many days a year), it appears
that the total number of anglers and hunters is not increasing over the years.
Table 16. Fishing, Hunting and Combo Licenses in NH
1991-2001
1991 1993 1995 1997 1999 2001
Resident Fishing 71,226 68,180 72,509 74,771 76,175 74,449
Non Resident Fishing 22,757 23,260 24,213 23,710 23,571 23,864
Resident Hunting 25,936 26,421 25,095 24,053 23,416 21,638
Non Resident Hunting 9,641 9,935 9,973 9,785 10,347 8,799
Resident Combo 39,576 38,647 36,957 35,503 34,694 32,192
Non Resident Combo N/A N/A 31 1,270 1,548 1,590
TOTALS 169,136 166,443 168,778 169,751 169,751 162,532
Source: NH Fish and Game Department Files, 2002
Fishing, Hunting and Combo Licenses in NH
2002-2006
2002 2003 2004 2005 2006
Resident Fishing 67,574 64,567 67,356 66,588 66,021
Non Resident Fishing 22,400 20,113 20,304 19,837 19,159
Resident Hunting 20,404 20,081 20,023 19,346 19,954
Non Resident Hunting 8,596 8,392 8,211 8,038 8,089
Resident Combo 29,093 27,462 26,746 26,043 26,584
Non Resident Combo 1,463 1,373 1,345 1,298 1,381
TOTALS 149,530 141,988 143,985 141,150 140,188
Source: NH Fish and Game Department Files, 2006
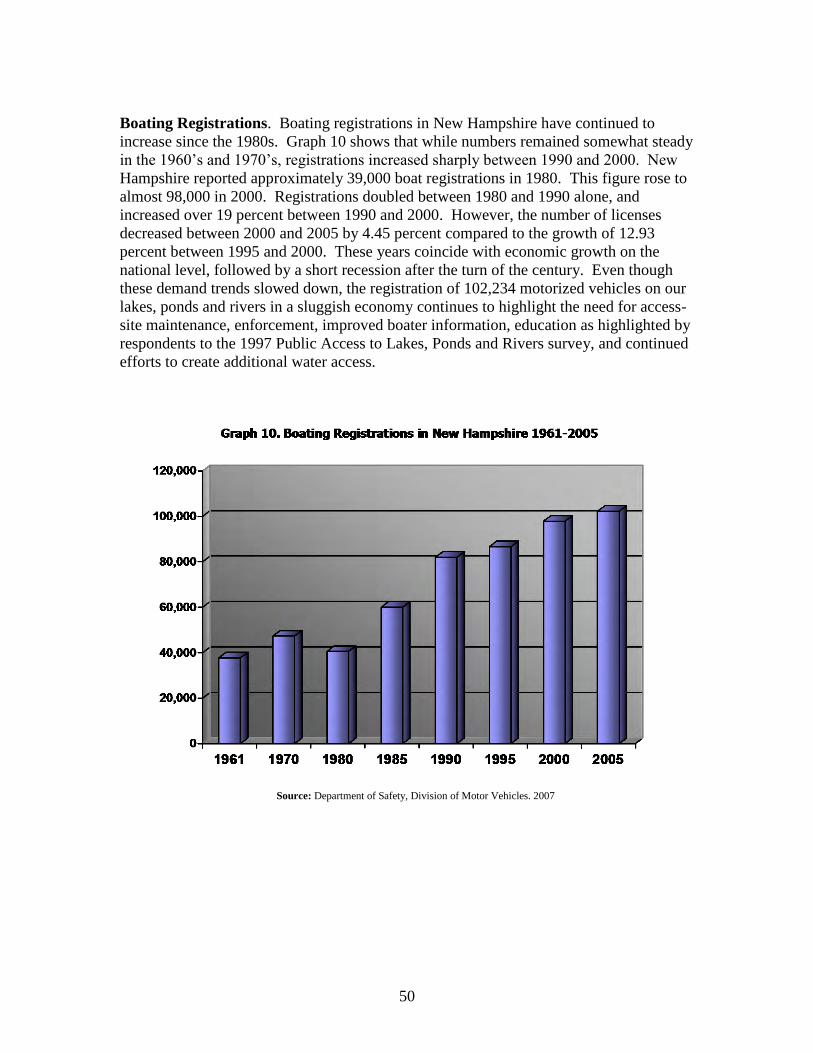
50
Boating Registrations. Boating registrations in New Hampshire have continued to
increase since the 1980s. Graph 10 shows that while numbers remained somewhat steady
in the 1960’s and 1970’s, registrations increased sharply between 1990 and 2000. New
Hampshire reported approximately 39,000 boat registrations in 1980. This figure rose to
almost 98,000 in 2000. Registrations doubled between 1980 and 1990 alone, and
increased over 19 percent between 1990 and 2000. However, the number of licenses
decreased between 2000 and 2005 by 4.45 percent compared to the growth of 12.93
percent between 1995 and 2000. These years coincide with economic growth on the
national level, followed by a short recession after the turn of the century. Even though
these demand trends slowed down, the registration of 102,234 motorized vehicles on our
lakes, ponds and rivers in a sluggish economy continues to highlight the need for access-
site maintenance, enforcement, improved boater information, education as highlighted by
respondents to the 1997 Public Access to Lakes, Ponds and Rivers survey, and continued
efforts to create additional water access.
Source: Department of Safety, Division of Motor Vehicles. 2007
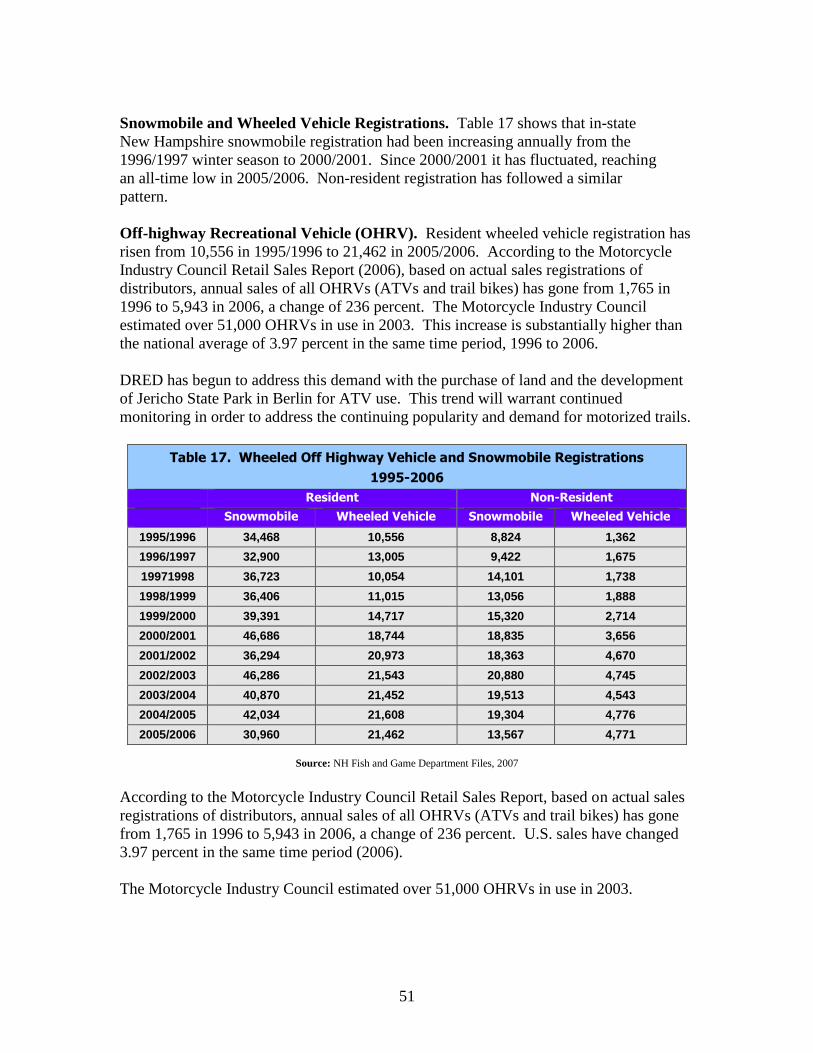
51
Snowmobile and Wheeled Vehicle Registrations. Table 17 shows that in-state
New Hampshire snowmobile registration had been increasing annually from the
1996/1997 winter season to 2000/2001. Since 2000/2001 it has fluctuated, reaching
an all-time low in 2005/2006. Non-resident registration has followed a similar
pattern.
Off-highway Recreational Vehicle (OHRV). Resident wheeled vehicle registration has
risen from 10,556 in 1995/1996 to 21,462 in 2005/2006. According to the Motorcycle
Industry Council Retail Sales Report (2006), based on actual sales registrations of
distributors, annual sales of all OHRVs (ATVs and trail bikes) has gone from 1,765 in
1996 to 5,943 in 2006, a change of 236 percent. The Motorcycle Industry Council
estimated over 51,000 OHRVs in use in 2003. This increase is substantially higher than
the national average of 3.97 percent in the same time period, 1996 to 2006.
DRED has begun to address this demand with the purchase of land and the development
of Jericho State Park in Berlin for ATV use. This trend will warrant continued
monitoring in order to address the continuing popularity and demand for motorized trails.
Table 17. Wheeled Off Highway Vehicle and Snowmobile Registrations
1995-2006
Resident Non-Resident
Snowmobile Wheeled Vehicle Snowmobile Wheeled Vehicle
1995/1996 34,468 10,556 8,824 1,362
1996/1997 32,900 13,005 9,422 1,675
19971998 36,723 10,054 14,101 1,738
1998/1999 36,406 11,015 13,056 1,888
1999/2000 39,391 14,717 15,320 2,714
2000/2001 46,686 18,744 18,835 3,656
2001/2002 36,294 20,973 18,363 4,670
2002/2003 46,286 21,543 20,880 4,745
2003/2004 40,870 21,452 19,513 4,543
2004/2005 42,034 21,608 19,304 4,776
2005/2006 30,960 21,462 13,567 4,771
Source: NH Fish and Game Department Files, 2007
According to the Motorcycle Industry Council Retail Sales Report, based on actual sales
registrations of distributors, annual sales of all OHRVs (ATVs and trail bikes) has gone
from 1,765 in 1996 to 5,943 in 2006, a change of 236 percent. U.S. sales have changed
3.97 percent in the same time period (2006).
The Motorcycle Industry Council estimated over 51,000 OHRVs in use in 2003.

52
Travel and Tourism
Statewide Figures. Tourism represents one of the main sectors of the state’s economy.
According to the Travel Economics Report (FY2000) prepared for DRED, Division of
Travel and Tourism Development by the Institute for New Hampshire Studies, the travel
and tourism industry ranks only behind retail trade in employment and is the second
leading export activity after manufacturing. Recreation and business trips in New
Hampshire during 2005 totaled 33.4 million person trips or 51.6 million visitor days (39
percent in summer; 23 percent in fall; 19 percent in winter; and 19 percent in spring).
Direct spending in New Hampshire by visitors in 2005 reached $4.136 billion and paid
$112.5 million in rooms and meals taxes. Traveler spending supported 66,700 direct full-
time and part-time jobs.
The state providing the most visitors to New Hampshire in 2005 was Massachusetts.
New York, Philadelphia and Connecticut were also significant contributors.
When asked the most important purpose for their trip, 31 percent of respondents
indicated, “to visit friends or relatives.” However, the second most important reason was
for outdoor recreation (22 percent). This was especially important for summer and winter
travelers. Respondents were also asked about the activities they participated in while on
their trip. Shopping was listed as the top reason, followed by outdoor activities (27
percent), visiting national/state parks (12 percent), and visiting beaches (9 percent).
Historic places, skiing, golfing and tennis, and theme/amusement parks were also
mentioned by at least five percent of respondents. In general, most of the activities
mentioned, besides shopping, relate directly to the outdoor environment. Clearly the
ability to participate in outdoor recreation is of prime importance to New Hampshire
visitors.
Relationship to Open Space. A 1999 study by Economic Systems Group for the
Society for the Protection of New Hampshire Forests examined the economic impacts of
open space on the New Hampshire economy. Open space was identified as a
fundamental aspect for four major sectors: agriculture, forestry, tourism/recreation, and
vacation homes. In all, this report found that 54 percent of direct spending on tourism
and recreation was attributed to open space. According to 1996/1997 figures, this
constituted $1.7 billion of $3.2 billion in direct spending on travel and tourism. Spending
related to second homes used primarily for vacation or recreational use was 100 percent
attributed to open space.
State Parks. Visitation to state parks in New Hampshire also underscores the
importance and growing popularity of outdoor recreation in the state for residents and
visitors alike. Graph 11 provides a summary of visitation trends to New Hampshire’s
state park system. State parks have seen an increase in reported attendance. Estimated
use was reported at 3.68 million in 1998 and 6.69 million in 2001.5 The vast majority of
this increase is due to reported increases in day use and better reporting in day use. As
demand continues to increase, the impacts on developed park facilities and the
5 Figures reported in 1999, 2001, and 2002 The 2002 Annual Information Exchange, published by the
National Association of State Park Directors.
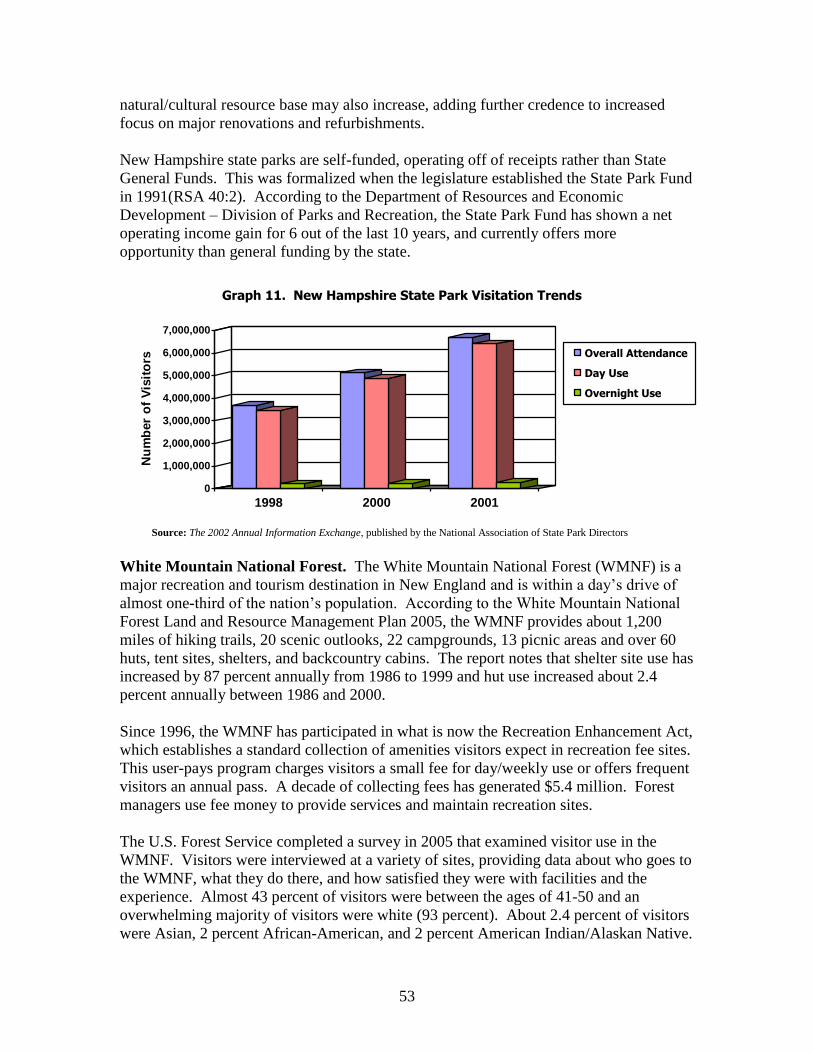
53
natural/cultural resource base may also increase, adding further credence to increased
focus on major renovations and refurbishments.
New Hampshire state parks are self-funded, operating off of receipts rather than State
General Funds. This was formalized when the legislature established the State Park Fund
in 1991(RSA 40:2). According to the Department of Resources and Economic
Development – Division of Parks and Recreation, the State Park Fund has shown a net
operating income gain for 6 out of the last 10 years, and currently offers more
opportunity than general funding by the state.
0
1,000,000
2,000,000
3,000,000
4,000,000
5,000,000
6,000,000
7,000,000
Nu
mb
er
of
Vis
ito
rs
1998 2000 2001
Graph 11. New Hampshire State Park Visitation Trends
Overall Attendance
Day Use
Overnight Use
Source: The 2002 Annual Information Exchange, published by the National Association of State Park Directors
White Mountain National Forest. The White Mountain National Forest (WMNF) is a
major recreation and tourism destination in New England and is within a day’s drive of
almost one-third of the nation’s population. According to the White Mountain National
Forest Land and Resource Management Plan 2005, the WMNF provides about 1,200
miles of hiking trails, 20 scenic outlooks, 22 campgrounds, 13 picnic areas and over 60
huts, tent sites, shelters, and backcountry cabins. The report notes that shelter site use has
increased by 87 percent annually from 1986 to 1999 and hut use increased about 2.4
percent annually between 1986 and 2000.
Since 1996, the WMNF has participated in what is now the Recreation Enhancement Act,
which establishes a standard collection of amenities visitors expect in recreation fee sites.
This user-pays program charges visitors a small fee for day/weekly use or offers frequent
visitors an annual pass. A decade of collecting fees has generated $5.4 million. Forest
managers use fee money to provide services and maintain recreation sites.
The U.S. Forest Service completed a survey in 2005 that examined visitor use in the
WMNF. Visitors were interviewed at a variety of sites, providing data about who goes to
the WMNF, what they do there, and how satisfied they were with facilities and the
experience. Almost 43 percent of visitors were between the ages of 41-50 and an
overwhelming majority of visitors were white (93 percent). About 2.4 percent of visitors
were Asian, 2 percent African-American, and 2 percent American Indian/Alaskan Native.
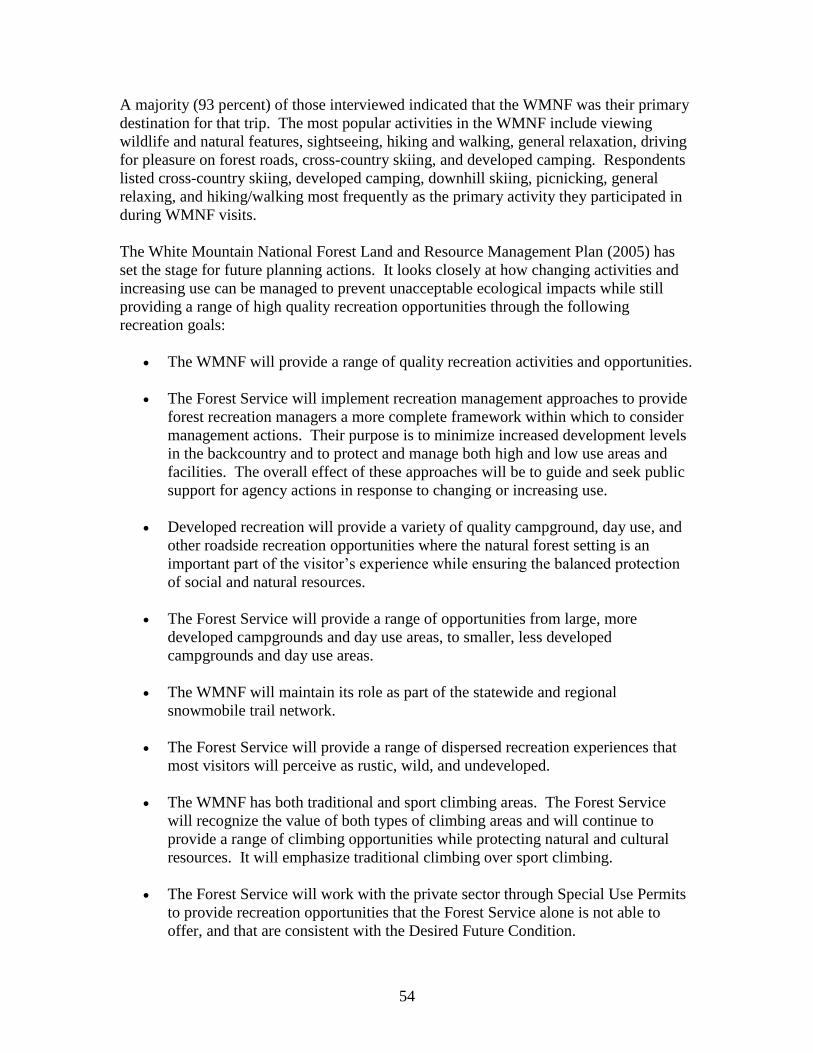
54
A majority (93 percent) of those interviewed indicated that the WMNF was their primary
destination for that trip. The most popular activities in the WMNF include viewing
wildlife and natural features, sightseeing, hiking and walking, general relaxation, driving
for pleasure on forest roads, cross-country skiing, and developed camping. Respondents
listed cross-country skiing, developed camping, downhill skiing, picnicking, general
relaxing, and hiking/walking most frequently as the primary activity they participated in
during WMNF visits.
The White Mountain National Forest Land and Resource Management Plan (2005) has
set the stage for future planning actions. It looks closely at how changing activities and
increasing use can be managed to prevent unacceptable ecological impacts while still
providing a range of high quality recreation opportunities through the following
recreation goals:
The WMNF will provide a range of quality recreation activities and opportunities.
The Forest Service will implement recreation management approaches to provide
forest recreation managers a more complete framework within which to consider
management actions. Their purpose is to minimize increased development levels
in the backcountry and to protect and manage both high and low use areas and
facilities. The overall effect of these approaches will be to guide and seek public
support for agency actions in response to changing or increasing use.
Developed recreation will provide a variety of quality campground, day use, and
other roadside recreation opportunities where the natural forest setting is an
important part of the visitor’s experience while ensuring the balanced protection
of social and natural resources.
The Forest Service will provide a range of opportunities from large, more
developed campgrounds and day use areas, to smaller, less developed
campgrounds and day use areas.
The WMNF will maintain its role as part of the statewide and regional
snowmobile trail network.
The Forest Service will provide a range of dispersed recreation experiences that
most visitors will perceive as rustic, wild, and undeveloped.
The WMNF has both traditional and sport climbing areas. The Forest Service
will recognize the value of both types of climbing areas and will continue to
provide a range of climbing opportunities while protecting natural and cultural
resources. It will emphasize traditional climbing over sport climbing.
The Forest Service will work with the private sector through Special Use Permits
to provide recreation opportunities that the Forest Service alone is not able to
offer, and that are consistent with the Desired Future Condition.
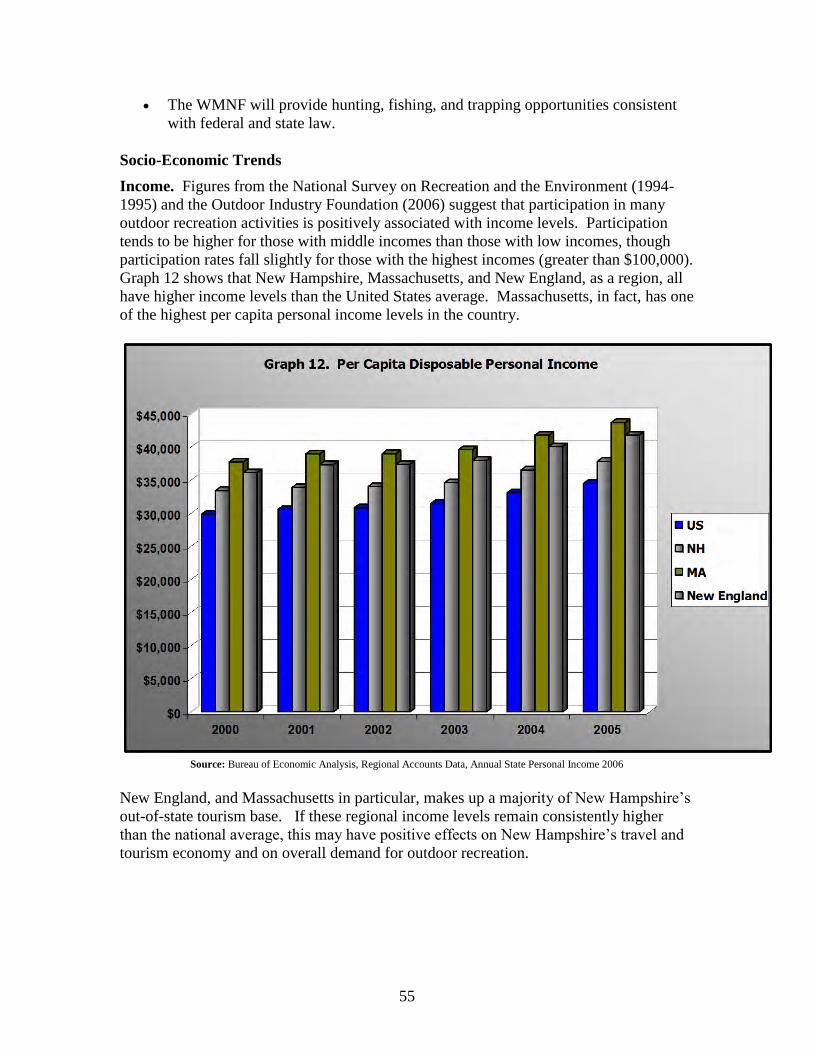
55
The WMNF will provide hunting, fishing, and trapping opportunities consistent
with federal and state law.
Socio-Economic Trends
Income. Figures from the National Survey on Recreation and the Environment (1994-
1995) and the Outdoor Industry Foundation (2006) suggest that participation in many
outdoor recreation activities is positively associated with income levels. Participation
tends to be higher for those with middle incomes than those with low incomes, though
participation rates fall slightly for those with the highest incomes (greater than $100,000).
Graph 12 shows that New Hampshire, Massachusetts, and New England, as a region, all
have higher income levels than the United States average. Massachusetts, in fact, has one
of the highest per capita personal income levels in the country.
Source: Bureau of Economic Analysis, Regional Accounts Data, Annual State Personal Income 2006
New England, and Massachusetts in particular, makes up a majority of New Hampshire’s
out-of-state tourism base. If these regional income levels remain consistently higher
than the national average, this may have positive effects on New Hampshire’s travel and
tourism economy and on overall demand for outdoor recreation.
56
Population. As population increases, overall demand for outdoor recreation (as
measured by the number of people participating) is also likely to increase. Table 18
shows that the state’s overall population increased by 6 percent between 2000 and 2005.
Much of this increase is represented by the growth in the southern tier of the state.
Table 18. Actual and Projected Population by County: 1970-2020
Actual Projected
1970 1980 1990 2000 2005 2010 2020
Belknap 32,367 42,884 49,216 56,325 61547 64,838 69,972
Carroll 18,548 27,931 35,410 43,666 47,439 50,369 57,036
Cheshire 52,364 62,116 70,121 73,825 77,287 78,624 84,672
Coos 34,291 35,147 34,828 33,111 33,655 33,170 33,369
Grafton 54,914 65,806 74,929 81,743 84,708 88,862 95,109
Hillsborough 223,941 276,608 336,073 380,841 401,291 417,281 446,586
Merrimack 80,925 98,302 120,005 136,225 146,881 154,109 169,050
Rockingham 138,951 190,345 245,845 277,359 295,076 308,217 331,191
Strafford 70,431 85,408 104,233 112,233 119,015 124,488 134,211
Sullivan 30,949 36,063 38,592 40,458 43,041 45,182 48,804
New Hampshire 737,681 920,610 1,109,252 1,235,786 1,309,940 1,362,140 1,470,000
Sources: 2006 US Census – New Hampshire, US Bureau of the Census
New Hampshire Population Projections 1990-2020, Office of Energy and Planning, 2006
Hillsborough and Rockingham Counties, the two counties with the greatest overall
population levels, accounted for 60 percent of the total population gain between 1990 and
2000. The greatest percentage gain was noted in Carroll County, which grew by over 23
percent or, by more than 8,000 new residents in the 10-year period between 1990 and
2000. Belknap County saw a rise of over 14 percent and only Coos County saw a decline
in population. Since 2000, the statewide rate of growth has decreased (from 11.4 percent
to 6 percent). The rate of growth has leveled out among the counties with Belknap,
Carroll, Merrimack, Rockingham, Strafford and Sullivan all growing at a rate above the
state average of 6 percent. Belknap and Carroll County grew the fastest, 9.3 and 8.6
percent, respectively. The rate of growth in Coos County has gone from a negative 4.9
percent to an increase of 1.6 percent.
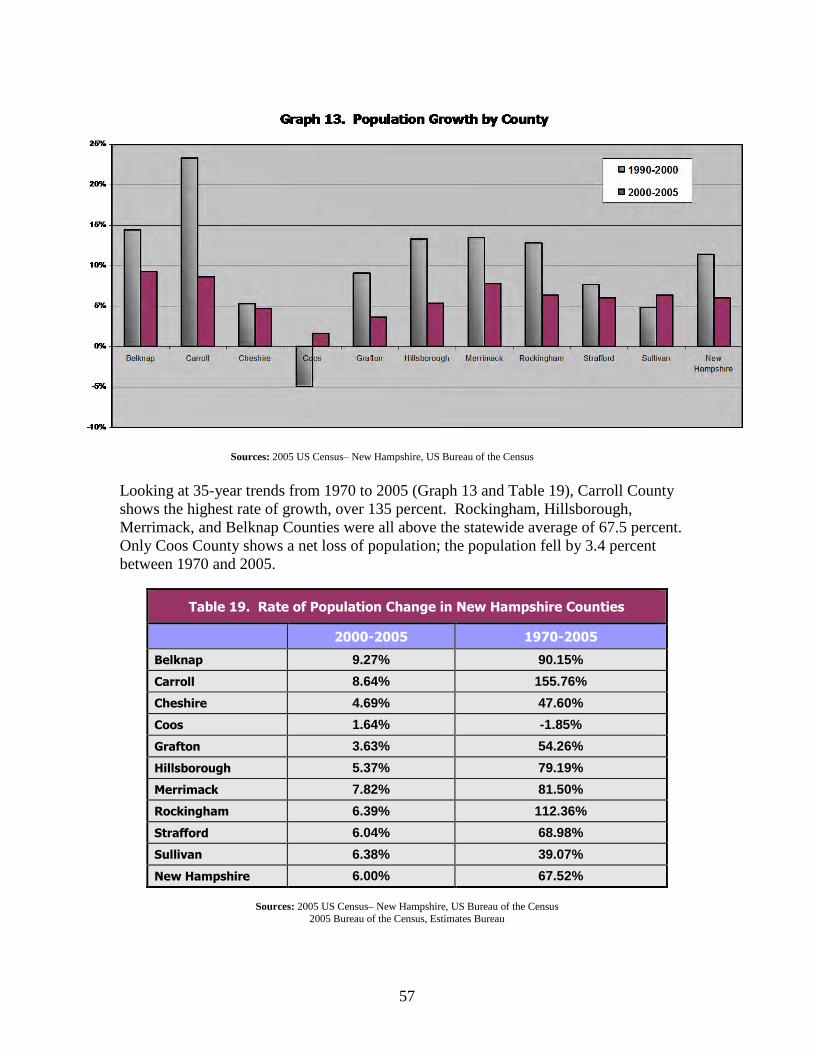
57
Sources: 2005 US Census– New Hampshire, US Bureau of the Census
Looking at 35-year trends from 1970 to 2005 (Graph 13 and Table 19), Carroll County
shows the highest rate of growth, over 135 percent. Rockingham, Hillsborough,
Merrimack, and Belknap Counties were all above the statewide average of 67.5 percent.
Only Coos County shows a net loss of population; the population fell by 3.4 percent
between 1970 and 2005.
Table 19. Rate of Population Change in New Hampshire Counties
2000-2005 1970-2005
Belknap 9.27% 90.15%
Carroll 8.64% 155.76%
Cheshire 4.69% 47.60%
Coos 1.64% -1.85%
Grafton 3.63% 54.26%
Hillsborough 5.37% 79.19%
Merrimack 7.82% 81.50%
Rockingham 6.39% 112.36%
Strafford 6.04% 68.98%
Sullivan 6.38% 39.07%
New Hampshire 6.00% 67.52%
Sources: 2005 US Census– New Hampshire, US Bureau of the Census
2005 Bureau of the Census, Estimates Bureau
58
Age. According to the 2005 Census, the median age of the population in New Hampshire
was 39.0 years. This compares to a median age of 37.1 in 2000; 32.8 in 1990; and 30.1 in
1980. This trend followed the national trend until 2000 when the trend difference began
to widen between the national numbers and the New Hampshire numbers. As of 2005,
the New Hampshire median is 2.5 years above the national median. The New Hampshire
population tends to be older than the general population in the United States.
Additionally, it is well documented that the baby boomers are living longer, healthier
lives. This trend towards an older average population is expected to continue; therefore
New Hampshire recreation providers will need to consider this aging population in the
years to come.
On average, about 75 percent of the state’s population is aged 18 or older. Looking at the
county level, Grafton County and Coos County had older than average populations, and
Hillsborough and Rockingham had the youngest. This younger population base in the
southern part of the state can probably be linked to the influx of new residents and
families to the area in the 1980s and 1990s. Many are young professionals with children
who work in and around the Boston metro area. The older average age of the northern
tier of the state suggests that there are, on average, fewer families with small children,
and that the population is aging in place.
Race and Ethnicity. New Hampshire has a very small minority population compared to
the rest of the nation. While still an overall small percentage, New Hampshire’s minority
population has grown in the last decade. Census figures for 2005 show minority racial
groups representing almost 4 percent of the state’s population; up from almost 3.3 percent
in 2000, and about two percent in 1990.6 The 4 percent represents a statewide minority
population. However, Manchester (6.5 percent) and Nashua (9.3 percent) have a greater
concentration of minority and/or immigrant population than the state average.
While the census tracks population by race and ethnicity, it is difficult to accurately tease
out the demographic details of specific immigrant populations. Still, it is estimated that
the immigrant population in New Hampshire is between 20,000 and 30,000 and growing.
The immigrant population in New Hampshire is represented by a diversity of race and
ethnicity.
This trend makes it increasingly important for communities (especially those with a high
minority and/or immigrant population) to consider the needs and demands of a more
culturally diverse population. Since various races often seek out differing leisure and
recreational activities, research cited in National Recreation and Park Association, Parks
and Recreation, October 2006, urges communities to identify and address differences in
their recreation planning and development.
In order to assist in this process, the National Park Service developed the Urban Park and
Recreation Recovery Program (UPRRP). This federal program is aimed at more urban
areas to help with recreation facility/area rehabilitation, planning, and other innovative
6 The sum of the five race groups adds to more than the total population because individuals may report
more than one race.
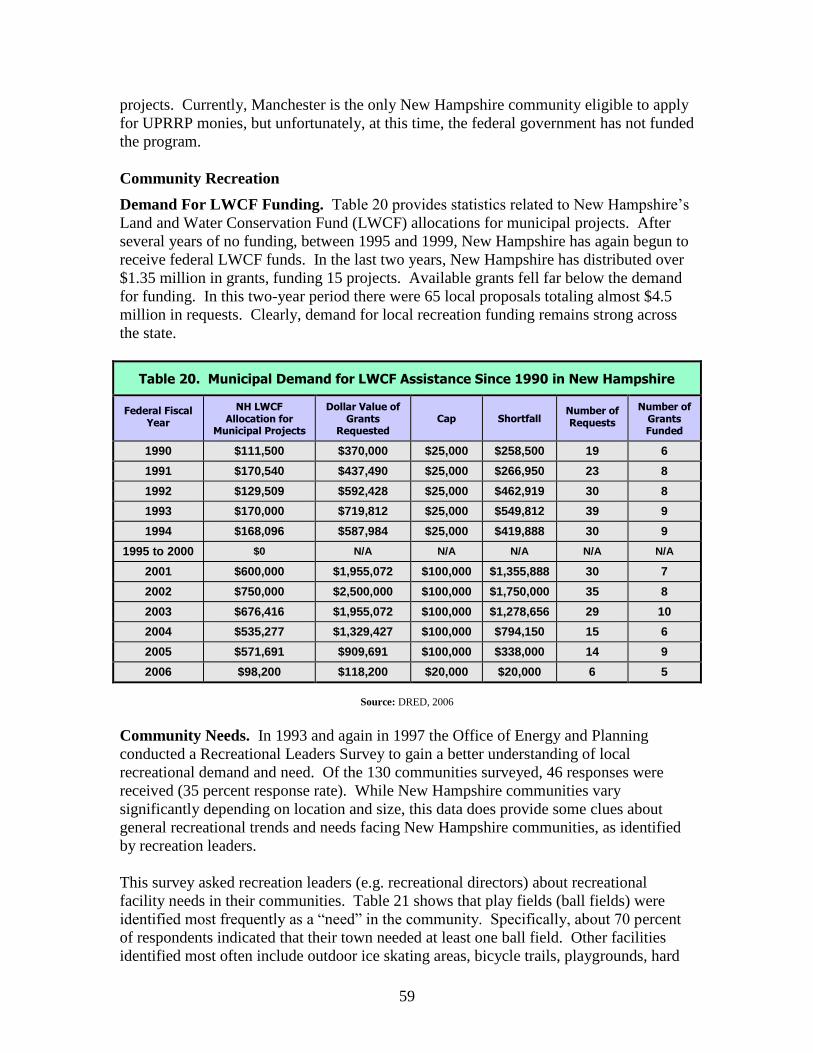
59
projects. Currently, Manchester is the only New Hampshire community eligible to apply
for UPRRP monies, but unfortunately, at this time, the federal government has not funded
the program.
Community Recreation
Demand For LWCF Funding. Table 20 provides statistics related to New Hampshire’s
Land and Water Conservation Fund (LWCF) allocations for municipal projects. After
several years of no funding, between 1995 and 1999, New Hampshire has again begun to
receive federal LWCF funds. In the last two years, New Hampshire has distributed over
$1.35 million in grants, funding 15 projects. Available grants fell far below the demand
for funding. In this two-year period there were 65 local proposals totaling almost $4.5
million in requests. Clearly, demand for local recreation funding remains strong across
the state.
Table 20. Municipal Demand for LWCF Assistance Since 1990 in New Hampshire
Federal Fiscal Year
NH LWCF Allocation for
Municipal Projects
Dollar Value of Grants
Requested Cap Shortfall
Number of Requests
Number of Grants Funded
1990 $111,500 $370,000 $25,000 $258,500 19 6
1991 $170,540 $437,490 $25,000 $266,950 23 8
1992 $129,509 $592,428 $25,000 $462,919 30 8
1993 $170,000 $719,812 $25,000 $549,812 39 9
1994 $168,096 $587,984 $25,000 $419,888 30 9
1995 to 2000 $0 N/A N/A N/A N/A N/A
2001 $600,000 $1,955,072 $100,000 $1,355,888 30 7
2002 $750,000 $2,500,000 $100,000 $1,750,000 35 8
2003 $676,416 $1,955,072 $100,000 $1,278,656 29 10
2004 $535,277 $1,329,427 $100,000 $794,150 15 6
2005 $571,691 $909,691 $100,000 $338,000 14 9
2006 $98,200 $118,200 $20,000 $20,000 6 5
Source: DRED, 2006
Community Needs. In 1993 and again in 1997 the Office of Energy and Planning
conducted a Recreational Leaders Survey to gain a better understanding of local
recreational demand and need. Of the 130 communities surveyed, 46 responses were
received (35 percent response rate). While New Hampshire communities vary
significantly depending on location and size, this data does provide some clues about
general recreational trends and needs facing New Hampshire communities, as identified
by recreation leaders.
This survey asked recreation leaders (e.g. recreational directors) about recreational
facility needs in their communities. Table 21 shows that play fields (ball fields) were
identified most frequently as a “need” in the community. Specifically, about 70 percent
of respondents indicated that their town needed at least one ball field. Other facilities
identified most often include outdoor ice skating areas, bicycle trails, playgrounds, hard
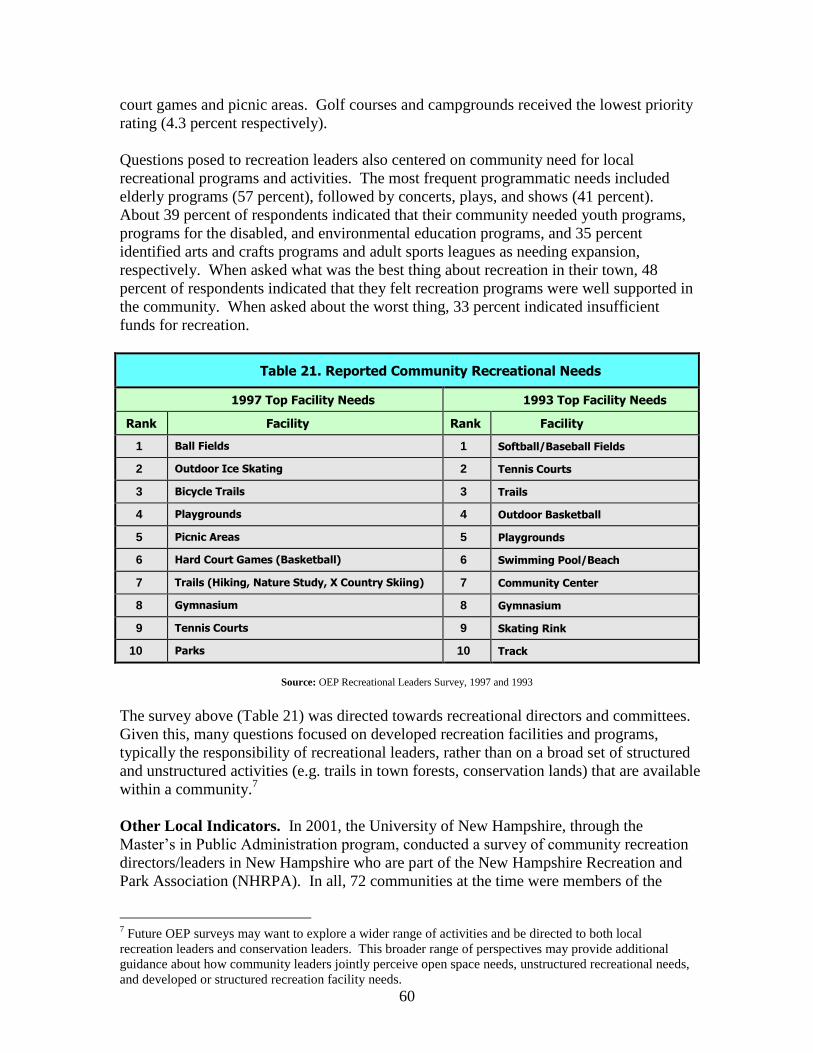
60
court games and picnic areas. Golf courses and campgrounds received the lowest priority
rating (4.3 percent respectively).
Questions posed to recreation leaders also centered on community need for local
recreational programs and activities. The most frequent programmatic needs included
elderly programs (57 percent), followed by concerts, plays, and shows (41 percent).
About 39 percent of respondents indicated that their community needed youth programs,
programs for the disabled, and environmental education programs, and 35 percent
identified arts and crafts programs and adult sports leagues as needing expansion,
respectively. When asked what was the best thing about recreation in their town, 48
percent of respondents indicated that they felt recreation programs were well supported in
the community. When asked about the worst thing, 33 percent indicated insufficient
funds for recreation.
Table 21. Reported Community Recreational Needs
1997 Top Facility Needs 1993 Top Facility Needs
Rank Facility Rank Facility
1 Ball Fields 1 Softball/Baseball Fields
2 Outdoor Ice Skating 2 Tennis Courts
3 Bicycle Trails 3 Trails
4 Playgrounds 4 Outdoor Basketball
5 Picnic Areas 5 Playgrounds
6 Hard Court Games (Basketball) 6 Swimming Pool/Beach
7 Trails (Hiking, Nature Study, X Country Skiing) 7 Community Center
8 Gymnasium 8 Gymnasium
9 Tennis Courts 9 Skating Rink
10 Parks 10 Track
Source: OEP Recreational Leaders Survey, 1997 and 1993
The survey above (Table 21) was directed towards recreational directors and committees.
Given this, many questions focused on developed recreation facilities and programs,
typically the responsibility of recreational leaders, rather than on a broad set of structured
and unstructured activities (e.g. trails in town forests, conservation lands) that are available
within a community.7
Other Local Indicators. In 2001, the University of New Hampshire, through the
Master’s in Public Administration program, conducted a survey of community recreation
directors/leaders in New Hampshire who are part of the New Hampshire Recreation and
Park Association (NHRPA). In all, 72 communities at the time were members of the
7 Future OEP surveys may want to explore a wider range of activities and be directed to both local
recreation leaders and conservation leaders. This broader range of perspectives may provide additional
guidance about how community leaders jointly perceive open space needs, unstructured recreational needs,
and developed or structured recreation facility needs.
61
NHRPA. Forty-five agreed to participate in the telephone interview, resulting in a
participation rate of 62 percent.
The survey asked questions related to program organization, structure, and effectiveness,
rather than asking for information about specific recreational needs. This data provides
some context and information about how recreation-related decisions are made locally.
For instance, approximately 56 percent of the surveyed recreation leaders report to the
Town Administrator, 13 percent report to the Board of Selectmen, and 11 percent report to
the parks and recreation committee in their community. The remainder (20 percent) report
to various other entities in the community. Almost three-quarters (73 percent) have a
parks and recreation committee in their community. Of these, 60 percent are appointed.
About 67 percent of those surveyed indicated that their community has a recreation master
plan.
The survey also asked several questions about community recreation facilities and
programs. When asked for their personal opinion, only 24 percent of respondents
indicated that the existing facilities inventory met the current demand. A majority of
recreational leaders felt that local demand currently exceeds supply. Recreational
programs were perceived differently. A majority (69 percent) felt that the existing
recreation program inventory met the current demand.
When asked about maintenance and joint-use, 44 percent of leaders indicated that the
parks and recreation department maintain town facilities and 18 percent of communities
surveyed have facilities maintained by the public works department. A majority of the
communities surveyed have some level of access to (or utilize) school district facilities (91
percent), though the extent of access or shared use is not known.
In terms of budgets and fees, almost 89 percent of surveyed park and recreation
departments charge fees for some programs/facilities, and 69 percent charge different fees
for residents than non-residents. Of the fees generated, about 64 percent of respondents
said the money went into the community General Fund and only 13 percent said it went
into a designated parks and recreation fund.
Community Profiles
In the last decade, UNH Cooperative Extension has completed Community Profiles in
over 60 communities across the state. Community Profiles provide a forum for local
leaders and residents to identify key issues in their community and generate action steps
to address those issues. UNH Cooperative Extension recently reviewed these 60 profiles
to identify common threads among communities. As part of this process both major and
minor themes were identified.
Though not a major theme for communities, outdoor recreation was identified as a
prevalent issue within larger themes. This review found that recreation is often expressed
as an issue within larger themes of economic development or community development. In
terms of community development, increasing recreational opportunities was often
identified as a way to develop a stronger sense of community and participate in shared
activities. Increasing community access to important resources such as trail systems or
boat ramps was also identified as a theme in many communities. In several communities
62
in the northern part of the state, recreation was discussed in terms of economic
development. Improving recreation is seen as a mechanism for increasing tourism in the
region.
Natural resource protection was an important theme discussed by many communities
across the state. Often, resource protection was discussed in concert with discussions
about the opportunities for economic development through tourism, the need to plan for
managed growth, and needs related to community development through improved
recreational access. This intertwining of issues on paper reflects the real-world integration
of resource protection issues with recreation, community, and economic development and
the need to plan for smarter, balanced growth locally.
Health and Wellness. A steering committee facilitated by New Hampshire Fish and
Game hosted a “Leave No Child Inside” Summit in May 2007 to kick off a New
Hampshire initiative to combat the “nature-deficit disorder” trend. Dr. Susan Lynch, New
Hampshire’s First Lady, served as honorary chair, and participants represented the fields
of education, health, recreation, environment, media and culture, and the built
environment. Working groups have formed to address the top priorities identified at the
Summit, including messaging, networking, and providing an Internet clearinghouse of
existing programs, activities, and locations for engaging children and their families with
the outdoors.
State Parks has begun to implement the “Leave No Child Inside” initiative with a six-week
program, “The Great Park Pursuit”. Teams of two or more participated in three self-
guided challenges and three activity-driven events at a different state park each week to
earn points and win prizes. During this six-week adventure, eighty-five teams competed in
three-legged and wheel barrow races; created origami birds and built bird houses;
inspected specimens netted from ponds; went on hikes; learned how to tie knots and fish;
built castles and creatures in the sand; kayaked; and explored the Flume (a natural gorge
extending 800 feet at the base of Mount Liberty, with walls of Conway granite that rise to
a height of 70 to 90 feet and are 12 to 20 feet apart).
63
CHAPTER 3: RECREATIONAL ISSUES OF
STATEWIDE IMPORTANCE
Changing conditions and trends have far reaching implications for recreation and open
space planning. According to Park, Recreation, Open Space and Greenway Guidelines 8
(1996) developed for the National Recreation and Park Association and the American
Academy for Park and Recreation Administration, this has meant a greater emphasis on
comprehensive open space and greenway planning, and a greater integration of
recreation, open space, and transportation goals. There is also a growing trend towards
more collaboration among recreation providers and between community parks and
schools. Other trends include greater inclusion of green spaces as part of downtown and
neighborhood revitalization, and a heightened recognition of the role recreation and open
space play in contributing to more livable, sustainable communities. These trends are
reflected in the feedback received for the 2003 and 2008 SCORP.
The six issues discussed in this chapter include information and data from a variety of
sources along with input from the SCORP Steering Committee, the larger SCORP Public
Advisory Committee, and comments received during the course of the planning process
for the 2003-2007 SCORP. Open-ended responses from the SCORP Stakeholder Group
Survey (Appendix B-2) were helpful in framing objectives and strategies aimed at
addressing issues.
While working with the Steering Committee and the Advisory Committee for the 2008-
2013 SCORP, it was confirmed that these issues continue to be important for this SCORP
as they were for the 2003-2007 SCORP. The six issues are listed below:
1. Stewardship of the resource base for outdoor recreation;
2. Providing different, sometimes competing, recreational opportunities;
3. Applying limited financial and human resources to address a range of recreation
needs;
4. Educating recreational users, municipalities and landowners about responsible
behavior, laws, and liability;
5. Impacts of existing land use patterns on recreational opportunities; and
6. Importance of local outdoor recreation opportunities and open space protection in
promoting increased health and wellness.
Under each of the following six sections, discussion starts with a section summary of the
issue, highlighting major points and general trends expressed during the early stages of
the SCORP public involvement process. This is followed by a more detailed discussion
of the issue, especially as it relates to New Hampshire.
8 The Park, Recreation, Open Space and Greenway Guidelines (1996) is the most recent publication of
guidelines by the National Recreation and Park Association and the American Academy for Park and
Recreation Administration. It replaces Recreation, Park and Open Space Standards and Guidelines.
64
This discussion is then followed by a defined goal, objectives, and strategies that have
been identified with the assistance of the SCORP Steering Committee and SCORP Public
Advisory Committee to help address each issue in New Hampshire. Some of the
recommended strategies are specifically targeted towards the allocation of Land and
Water Conservation Fund (LWCF) monies.9 Others represent broader policy or practical
recommendations.
LWCF Administration. LWCF administration in New Hampshire is coordinated
through the Department of Resources and Economic Development (DRED) – Division of
Parks and Recreation. DRED oversees the Open Project Selection Process (OPSP) to aid
state allocation of LWCF monies. This process is informed through SCORP planning
efforts.
The OPSP process utilizes a set of criteria and point awards used to rank projects and
allocate LWCF funds. These selection criteria are reviewed and revised by an OPSP
Advisory Panel and the SCORP recommendations provide guidance for modifying or
adding criteria based on updated information. Membership on the OPSP Advisory Panel
includes a range of agencies and organizations representing recreation and conservation
interests. Please refer to Appendix H for more information about the OPSP process and
how decisions about LWCF allocations are made in New Hampshire.
While helping to set LWCF priorities is a required function of a SCORP, New
Hampshire’s plan goes beyond this requirement to also establish recommendations aimed
at addressing a wider set of New Hampshire’s outdoor recreation issues. These
recommendations are targeted towards many different agencies and organizations. This
reflects the fact that outdoor recreation issues far outreach any single agency, and
resolving issues will require coordination, partnerships, and collaboration. A resource list
containing information about a range of recreation-related organizations and agencies is
found in Appendix E. Not every agency and organization has been included in this list.
Efforts will be made to update and expand this list over time.
While emphasis must be placed on addressing these individual issues, there is also an
overarching need to improve upon the way outdoor recreation is incorporated into larger,
broader decision making in the state, and on the way the SCORP planning process is
undertaken in future years. SCORP planning should be an ongoing effort with emphasis
on implementation. The state should also continue to improve upon its efforts to include
a wide range of perspectives in recreation planning work. The Stakeholder Group Survey
(Appendix B-1 and B-2) was a first step in involving a larger audience in the planning
process.
9 Strategies denoted by LWCF represent recommendations targeted towards New Hampshire’s statewide
apportionment of Land and Water Conservation Fund monies.

65
1. STEWARDSHIP OF THE NATURAL RESOURCE BASE FOR OUTDOOR
RECREATION
Summary
New Hampshire is facing pressure on its existing resource base. Tourism continues to
play a key role in the state’s economy even though visitation rates decreased in 2003 and
2004. Development pressures and population growth continue, especially in the southern
part of the state.
Any recreational use can have a negative impact on natural resources (e.g. trail
erosion, introduction of exotic species, impacts on flora and fauna).
Some feel that certain recreational activities have greater negative impacts on the
resource base and should be limited or restricted.
Others feel that all types of use should be allowed on any publicly held land.
Some of the most popular recreational activities in the state (e.g. walking, wildlife
watching, hiking) as identified in the Assessment of Outdoor Recreation in New
Hampshire, conducted by UNH in 1997, are highly dependent on open space and
tracts of undeveloped lands.
This same statewide outdoor recreation assessment shows that residents view the
protection of natural landscapes and natural areas as highly important
management objectives. About 71 percent felt that setting aside natural areas
from development was either a very or most important management objective of
the state. Seventy-six percent felt it was very or most important to protect typical
examples of New Hampshire’s natural regions.
Protection of existing greenways and trail corridors has become an increasing
challenge due to changes in land ownership, private land closures, and increased
development. (Comprehensive Statewide Trails Study,10
1997).
Private lands play an important role, alongside public lands, in protecting the
resource base and providing for certain traditional forms of recreation.
According to New Hampshire’s Changing Landscape (2005), New Hampshire is
projected to add an additional 358,000 residents between 2000 and 2025, an
increase of more than 28 percent. The four southeastern counties will absorb
four-fifths of this new population. New Hampshire is gradually losing the values
provided by extensive forests, including their contribution to water and air quality
and quantity, wildlife habitat, scenic values, and recreation opportunities.
The Fish and Game Wildlife Action Plan (2006) can be used to guide land use,
stewardship and protection efforts. It points out risks to wildlife and habitats so
that ways can be found to reduce or avoid those risks. In this way it helps
communities plan for recreation and development while protecting critical
resources.
10
The Comprehensive Statewide Trails Study is the most recent “comprehensive” study completed by
DRED.
66
Overview
Continued conservation and stewardship of the resource base is critical to maintaining a
wide range of recreational opportunities. Without concerted efforts to protect open space,
both the quality and quantity of many of the most popular outdoor recreational
opportunities is likely to deteriorate. This stands to become an even greater issue as
competing pressures on existing open space grow and demand for outdoor recreation
continues to rise. Of course, the benefits of land and water protection extend beyond
outdoor recreation opportunities. Protected lands and open space help protect our water
supplies, preserve important wildlife habitat, as well as rare and endangered species, help
maintain community identity, and protect our natural and cultural heritage. Given all of
these reasons, it is of utmost importance to identify and protect important natural
resources and practice good stewardship in order to maintain the health of these resources
for future generations. In short, open space is critical to maintaining New Hampshire’s
quality of life.
As population increases and undeveloped land is converted to other uses, large tracts of
un-fragmented open space are lost. Open space planning on a local, regional, and
statewide level will become ever more important to help identify critical areas, identify
how they can be protected, and understand how these areas can be linked together
through greenways and natural corridors. From a recreation perspective, it is often the
trail linkages found within the corridors and greenways themselves that are of key
importance. Planning for trail corridors and greenways should be considered hand-in-
hand with open space planning efforts.
The relationship between land and water conservation and recreation is not necessarily
static. Unmanaged recreation can also bring negative impacts to the very resources on
which it depends. Once land is placed under permanent conservation, it still needs long-
term management and stewardship to protect important resources. Good planning,
management and stewardship are important to limit potential impacts to ecologically
sensitive areas and wildlife as well as to maintain quality recreational experiences.
New Hampshire Conditions and Trends
Land protection and resource conservation are important to New Hampshire residents.
Some of the most popular recreational activities in the state (e.g. walking, wildlife
watching, hiking) as identified in the Statewide Outdoor Recreation Needs Assessment
(UNH, 1997) are highly dependent on open space and tracts of undeveloped land. This
same statewide outdoor recreation survey shows that residents view the protection of
natural landscapes and natural areas as highly important management objectives. About
71 percent felt that setting aside natural areas from development was either a very or
most important management objective of the state. Seventy-six percent felt it was very or
most important to protect typical examples of New Hampshire’s natural regions.
Planning for Resource Protection. Open space planning is an important aspect of
identifying key parcels and developing strategies for their protection and these efforts can
also be incorporated into larger town master planning efforts. Identifying major resource
protection needs, setting priorities, and producing a plan for addressing these needs are
all important aspects of planning for how the community wants to use its natural resource
67
base. An important tool for assessing key parcels is the NH Wildlife Action Plan (2006).
It includes mapping that prioritizes wildlife habitat based on the ecological condition of
the habitat.
When planning for resource and land conservation, consideration should be given to
identifying and seeking protection on land that adjoins existing conservation land, in-fill
land that helps bridge two conserved areas, and land that helps to create open space
corridors and networks of green space.
It is also important to give consideration to lands that can act as buffers around
ecologically significant resources (e.g. upland buffers around wetlands, riparian buffers,
etc.). Many of these lands and buffers not only protect significant resources themselves,
but can also provide important opportunities for recreation. For instance, a riparian
buffer could help protect important natural resources while also offering an opportunity
for a riverbank walking trail or shore bank fishing.
A historic example of this is the Rivers Management and Protection Program (RMPP).
The RMPP is a partnership that includes state designation of a river corridor and enables
the development of a corridor management plan for the corridor communities. The
RMPP enables multiple communities to communicate about the ecological significance
of the riparian resource and affords an opportunity for communities to develop riverbank-
walking trails.
Public and Private Conservation. Resource conservation efforts in New Hampshire
have a long tradition in both the public and private arena. Likewise, land under public
and private ownership both offer important outdoor recreation opportunities. Different
types of ownership often bring different management objectives. This, in turn, brings
different opportunities for outdoor recreation and varying levels of public access.
Parks, for example, often provide opportunities for a wide range of activities such as
picnicking, swimming, camping, or mountain biking, while many conservation easements
or privately held tracts of open space may only offer access for traditional activities such
as hiking, bird-watching, and cross-country skiing. A main function and purpose of
many public park lands is to provide and promote opportunities for public recreation
while maintaining important green space. While the primary focus of many private lands
or lands under easement may be on maintaining a working forest or protecting water
supply land, provisions are often made to permit (or guarantee) certain forms of public
access.
Public lands in New Hampshire are owned and managed by a range of federal, state,
regional and local agencies. Other undeveloped lands, though not permanently protected,
include those that qualify for important tax incentives to remain undeveloped (e.g.
Current Use). Private lands with permanent protection include those owned by private
conservation organizations such as the Society for the Protection of New Hampshire
Forests (SPNHF) or The Nature Conservancy, and those under easement with a private or
public organization.
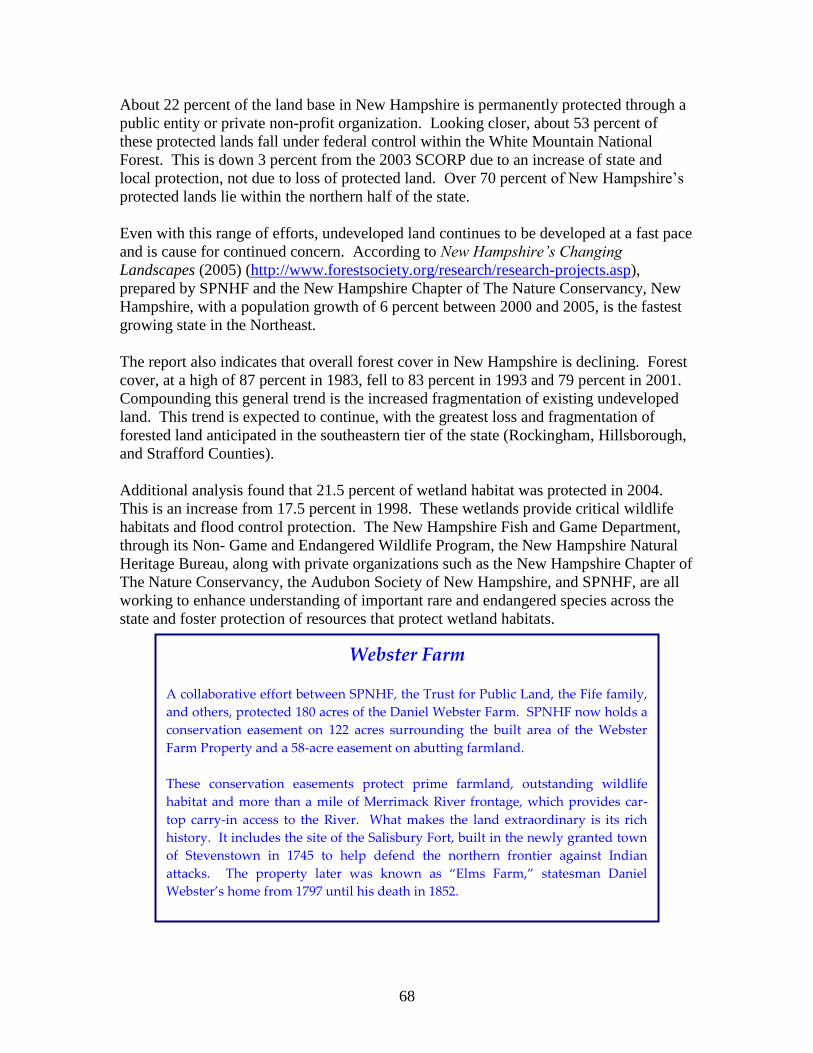
68
About 22 percent of the land base in New Hampshire is permanently protected through a
public entity or private non-profit organization. Looking closer, about 53 percent of
these protected lands fall under federal control within the White Mountain National
Forest. This is down 3 percent from the 2003 SCORP due to an increase of state and
local protection, not due to loss of protected land. Over 70 percent of New Hampshire’s
protected lands lie within the northern half of the state.
Even with this range of efforts, undeveloped land continues to be developed at a fast pace
and is cause for continued concern. According to New Hampshire’s Changing
Landscapes (2005) (http://www.forestsociety.org/research/research-projects.asp),
prepared by SPNHF and the New Hampshire Chapter of The Nature Conservancy, New
Hampshire, with a population growth of 6 percent between 2000 and 2005, is the fastest
growing state in the Northeast.
The report also indicates that overall forest cover in New Hampshire is declining. Forest
cover, at a high of 87 percent in 1983, fell to 83 percent in 1993 and 79 percent in 2001.
Compounding this general trend is the increased fragmentation of existing undeveloped
land. This trend is expected to continue, with the greatest loss and fragmentation of
forested land anticipated in the southeastern tier of the state (Rockingham, Hillsborough,
and Strafford Counties).
Additional analysis found that 21.5 percent of wetland habitat was protected in 2004.
This is an increase from 17.5 percent in 1998. These wetlands provide critical wildlife
habitats and flood control protection. The New Hampshire Fish and Game Department,
through its Non- Game and Endangered Wildlife Program, the New Hampshire Natural
Heritage Bureau, along with private organizations such as the New Hampshire Chapter of
The Nature Conservancy, the Audubon Society of New Hampshire, and SPNHF, are all
working to enhance understanding of important rare and endangered species across the
state and foster protection of resources that protect wetland habitats.
Webster Farm A collaborative effort between SPNHF, the Trust for Public Land, the Fife family,
and others, protected 180 acres of the Daniel Webster Farm. SPNHF now holds a
conservation easement on 122 acres surrounding the built area of the Webster
Farm Property and a 58-acre easement on abutting farmland.
These conservation easements protect prime farmland, outstanding wildlife
habitat and more than a mile of Merrimack River frontage, which provides car-
top carry-in access to the River. What makes the land extraordinary is its rich
history. It includes the site of the Salisbury Fort, built in the newly granted town
of Stevenstown in 1745 to help defend the northern frontier against Indian
attacks. The property later was known as “Elms Farm,” statesman Daniel
Webster’s home from 1797 until his death in 1852.
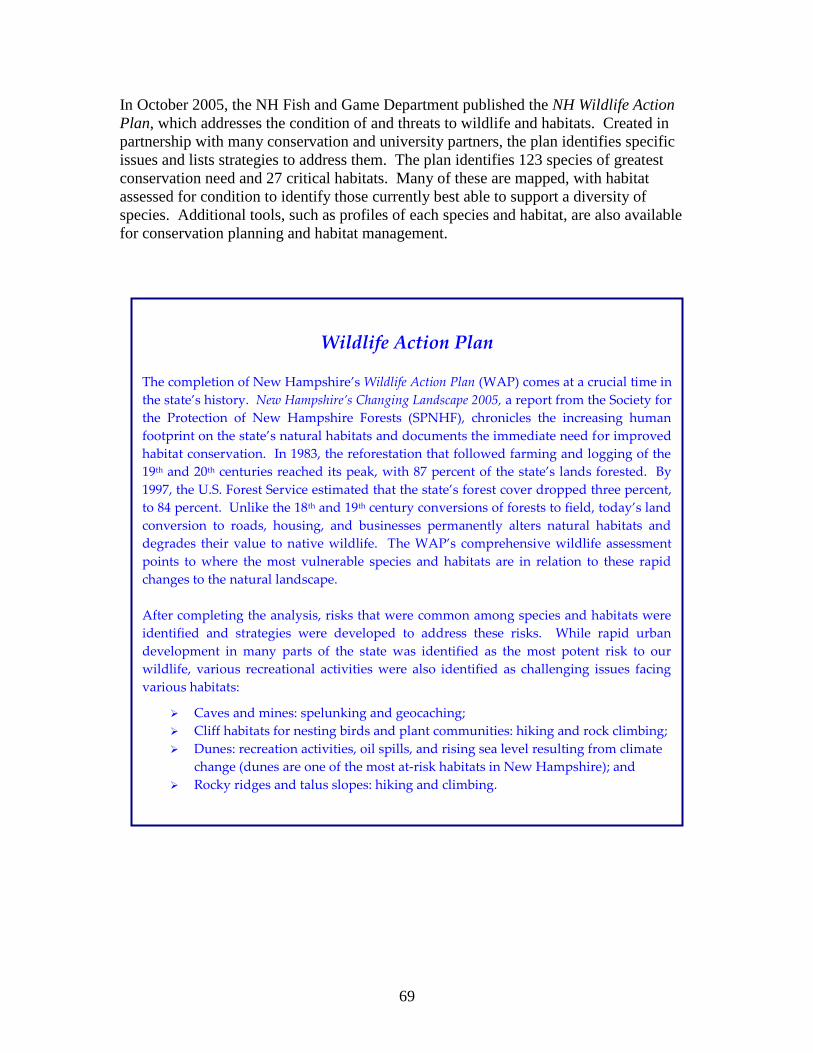
69
In October 2005, the NH Fish and Game Department published the NH Wildlife Action
Plan, which addresses the condition of and threats to wildlife and habitats. Created in
partnership with many conservation and university partners, the plan identifies specific
issues and lists strategies to address them. The plan identifies 123 species of greatest
conservation need and 27 critical habitats. Many of these are mapped, with habitat
assessed for condition to identify those currently best able to support a diversity of
species. Additional tools, such as profiles of each species and habitat, are also available
for conservation planning and habitat management.
Wildlife Action Plan
The completion of New Hampshire’s Wildlife Action Plan (WAP) comes at a crucial time in
the state’s history. New Hampshire’s Changing Landscape 2005, a report from the Society for
the Protection of New Hampshire Forests (SPNHF), chronicles the increasing human
footprint on the state’s natural habitats and documents the immediate need for improved
habitat conservation. In 1983, the reforestation that followed farming and logging of the
19th and 20th centuries reached its peak, with 87 percent of the state’s lands forested. By
1997, the U.S. Forest Service estimated that the state’s forest cover dropped three percent,
to 84 percent. Unlike the 18th and 19th century conversions of forests to field, today’s land
conversion to roads, housing, and businesses permanently alters natural habitats and
degrades their value to native wildlife. The WAP’s comprehensive wildlife assessment
points to where the most vulnerable species and habitats are in relation to these rapid
changes to the natural landscape.
After completing the analysis, risks that were common among species and habitats were
identified and strategies were developed to address these risks. While rapid urban
development in many parts of the state was identified as the most potent risk to our
wildlife, various recreational activities were also identified as challenging issues facing
various habitats:
Caves and mines: spelunking and geocaching;
Cliff habitats for nesting birds and plant communities: hiking and rock climbing;
Dunes: recreation activities, oil spills, and rising sea level resulting from climate
change (dunes are one of the most at-risk habitats in New Hampshire); and
Rocky ridges and talus slopes: hiking and climbing.
70
LCHIP. Concerns about these trends are underscored by the creation of the Land and
Community Heritage Investment Program (LCHIP). Leaders in New Hampshire
recognized the important role natural and cultural resources play in promoting a good
quality of life in New Hampshire, and the need to support statewide funding efforts to
help communities and non-profit organizations make a difference at a local or regional
level. This program, established in 2000 under RSA 227-A, has provided $24.5 million
in grants (to date) aimed at protecting important natural, historical, and cultural resources
across the state. LCHIP has awarded its appropriated funds to 150 projects in 103
communities across the state.
The level of future funding for LCHIP remains in question. The Land and Community
Heritage Authority, created by the legislature in 1998, recommended that LCHIP be
permanently funded at $12 million annually to meet the growing and pressing needs for
resource protection in New Hampshire. Thus far, LCHIP has received annual funding far
short of this recommended level. Recent state budget shortfalls and expected economic
tightening makes LCHIP an important topic in this legislative and budget session.
Governor John Lynch included $12 million in his 2008-2009 biennium budget, a level
that the legislature ultimately approved for this program.
Total appropriations were significantly less in 2007 than in recent history. In 2003, at the
peak of funding state matching grants through LCHIP, town meeting voters approved
more than $35 million for land conservation. In 2004 the total dropped to $25.9 million;
in 2005, to $24 million; and in 2006 it dropped again to $8.2 million. SPNHF suggests
that the downward trend in town funding indicates that LCHIP may have a strong
leveraging effect when adequately funded.
Conservation Efforts. In 2003, New Hampshire succeeded in protecting large tracts of
land in northern New Hampshire through a mix of federal, state, and private efforts and
in-kind contributions. The largest and best example is represented by the Connecticut
Lakes Headwaters project in the northern part of the state. This significant conservation
effort consists of 146,400 acres of private timberland encumbered by a state-held
conservation easement, a 25,000 acre natural area owned by the state and encumbered by
a Nature Conservancy easement, as well as a 100 acre piece that will be added to an
existing DRED-operated campground.
This large-scale conservation effort will benefit the entire state. In addition to preserving
important landscape-scale natural habitats, the headwaters of the Connecticut River, and
productive forestlands, these lands will retain deeded rights to public access in perpetuity.
Management or stewardship plans will be developed for forestry, as well as recreation, to
help ensure this significant area will be well managed into the future.
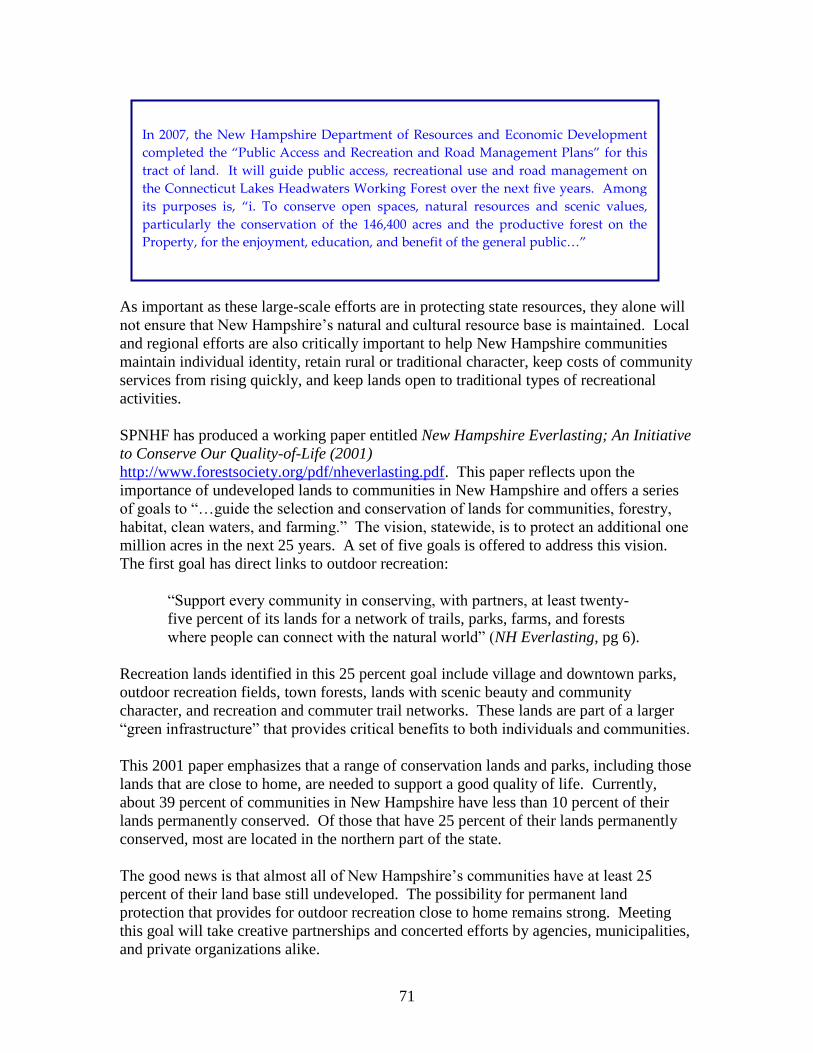
71
As important as these large-scale efforts are in protecting state resources, they alone will
not ensure that New Hampshire’s natural and cultural resource base is maintained. Local
and regional efforts are also critically important to help New Hampshire communities
maintain individual identity, retain rural or traditional character, keep costs of community
services from rising quickly, and keep lands open to traditional types of recreational
activities.
SPNHF has produced a working paper entitled New Hampshire Everlasting; An Initiative
to Conserve Our Quality-of-Life (2001)
http://www.forestsociety.org/pdf/nheverlasting.pdf. This paper reflects upon the
importance of undeveloped lands to communities in New Hampshire and offers a series
of goals to “…guide the selection and conservation of lands for communities, forestry,
habitat, clean waters, and farming.” The vision, statewide, is to protect an additional one
million acres in the next 25 years. A set of five goals is offered to address this vision.
The first goal has direct links to outdoor recreation:
“Support every community in conserving, with partners, at least twenty-
five percent of its lands for a network of trails, parks, farms, and forests
where people can connect with the natural world” (NH Everlasting, pg 6).
Recreation lands identified in this 25 percent goal include village and downtown parks,
outdoor recreation fields, town forests, lands with scenic beauty and community
character, and recreation and commuter trail networks. These lands are part of a larger
“green infrastructure” that provides critical benefits to both individuals and communities.
This 2001 paper emphasizes that a range of conservation lands and parks, including those
lands that are close to home, are needed to support a good quality of life. Currently,
about 39 percent of communities in New Hampshire have less than 10 percent of their
lands permanently conserved. Of those that have 25 percent of their lands permanently
conserved, most are located in the northern part of the state.
The good news is that almost all of New Hampshire’s communities have at least 25
percent of their land base still undeveloped. The possibility for permanent land
protection that provides for outdoor recreation close to home remains strong. Meeting
this goal will take creative partnerships and concerted efforts by agencies, municipalities,
and private organizations alike.
In 2007, the New Hampshire Department of Resources and Economic Development
completed the “Public Access and Recreation and Road Management Plans” for this
tract of land. It will guide public access, recreational use and road management on
the Connecticut Lakes Headwaters Working Forest over the next five years. Among
its purposes is, “i. To conserve open spaces, natural resources and scenic values,
particularly the conservation of the 146,400 acres and the productive forest on the
Property, for the enjoyment, education, and benefit of the general public…”
72
Partnerships. Regional and local land trusts, as well as local conservation commissions,
are becoming increasingly important players in protecting critical habitats and open space
lands in New Hampshire communities. On a local level, there is an increase in
community leaders partnering with a local or regional land trust to protect local lands or
secure conservation easements on lands of significance. This partnership takes advantage
of a land trust’s expertise in both completing sometimes complicated land transactions
and holding conservation lands in perpetuity while utilizing local knowledge, planning
efforts, and financial resources of the community.
In general, public/private partnerships are critical to protecting natural resources.
Limited funds and staffing of public agencies and municipalities limit the ability of
government to not only protect lands, but also weave together networks of conservation
lands. Private organizations, be it on a national, state, regional or local level, all play key
roles in both identifying and protecting important natural resources.
One good regional example of public/private partnerships is the Great Bay Resource
Protection Partnership (GBRPP), formed in 1994. The Partnership is a group of
organizations committed to protecting the important habitats of the Great Bay region. It
is comprised of state and regional private non-profit conservation organizations and land
trusts, federal and state public agencies, and municipalities. The Partnership has
undertaken a successful comprehensive, landscape-scale approach to conservation and
habitat protection. Habitat protection strategies are developed and implemented through
the integration of scientific field studies and ongoing communication with local, regional,
state and national conservation representatives.
A collaborative effort is key to the Partnership’s successful conservation activities which
include promoting creative solutions for habitat protection, building upon the
conservation efforts of already protected and restored lands, coordinating resources,
identifying and pursuing a variety of funding opportunities, and promoting
communication and cooperation between partnering entities.
Over the last several years, the GBRPP has produced a “Habitat Protection Plan” that
identifies over 14,000 acres of important habitat organized into 25 Significant Habitat
Areas. These Significant Habitat Areas range from 400 to 10,000 acres in size. In
addition, the completion of ecological studies for Significant Habitat Areas has provided
valuable field data that helps to direct the conservation activities of the Partnership.
Center for Land Conservation Assistance
The Center for Land Conservation Assistance, a resource
center located in Concord, serves to build the capacity of
New Hampshire land trusts and acts as an information and
resource center for local and regional land protection efforts.
Contact the Society for the Protection of New Hampshire
Forests (www.spnhf.org/) for more information.
73
The information is available for regional and community planning efforts, as well as for
use in the long-term stewardship and management of protected conservation lands. As of
January 2007, this public/private partnership has protected over 5,000 acres through fee
purchase, easements, and donations.
Local Financing. Communities are using a range of methods to help fund their
conservation goals. Over half of New Hampshire communities (at least 141 in 2007, up
from 117 in 2003) are currently taking advantage of RSA 36-A:5.1, which allows a town
to dedicate a portion or all of the Land Use Change Tax (RSA 79-A:7) to a local
Conservation Fund. Land use change tax monies are derived from penalties assessed on
lands taken out of Current Use. Funds placed in the conservation fund are allowed to
accumulate from year to year and may be expended by the Conservation Commission
without further approval of the town meeting. A current list of communities that allocate
some or all of the land use change tax monies to the local conservation fund can be found
on the Department of Revenue Administration’s web site (http://www.revenue.nh.gov/).
These land use change tax monies, while often substantial, do not always provide the
necessary funds at the necessary times to secure important tracts of undeveloped lands.
Land values in many parts of the state are skyrocketing and undeveloped, buildable
parcels are often on the market for only a short time. Even conservation-minded
landowners cannot always wait for a town vote in March to sell their property.
Communities in the more populated areas in the southern part of the state have chosen to
pursue open space bonds as a means of addressing this issue. In 2007, the communities
of Gilford, Hinsdale and Kensington passed open space bonds for a total of $1,213,000.
These measures allow communities to pay back the bond over a period of years at a set
interest rate while providing present day access to funds that can be used to help purchase
important natural lands or conservation easements over the next few years. Given
escalating land values, many communities have been successful in securing broad-based
resident support.
Local Efforts. The overall number of towns with land conservation measures on their
warrants has been consistent over the last five years.
In 2007, there were 35 towns with conservation appropriation articles on their
warrants, 30 passed.
In 2006, 33 towns had articles, 30 passed.
In 2005, 35 towns had articles, 20 passed.
In 2004, 32 towns had articles, 23 passed.
In 2003, 34 towns had articles, 28 passed conservation appropriations.
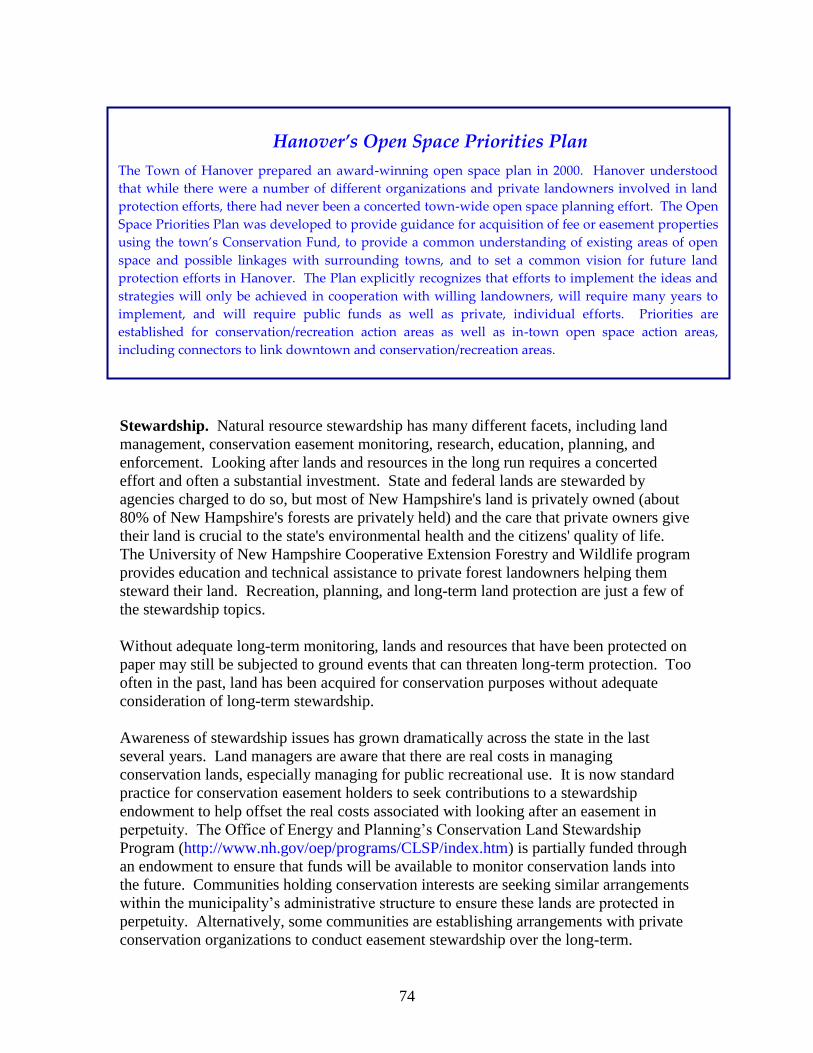
74
Stewardship. Natural resource stewardship has many different facets, including land
management, conservation easement monitoring, research, education, planning, and
enforcement. Looking after lands and resources in the long run requires a concerted
effort and often a substantial investment. State and federal lands are stewarded by
agencies charged to do so, but most of New Hampshire's land is privately owned (about
80% of New Hampshire's forests are privately held) and the care that private owners give
their land is crucial to the state's environmental health and the citizens' quality of life.
The University of New Hampshire Cooperative Extension Forestry and Wildlife program
provides education and technical assistance to private forest landowners helping them
steward their land. Recreation, planning, and long-term land protection are just a few of
the stewardship topics.
Without adequate long-term monitoring, lands and resources that have been protected on
paper may still be subjected to ground events that can threaten long-term protection. Too
often in the past, land has been acquired for conservation purposes without adequate
consideration of long-term stewardship.
Awareness of stewardship issues has grown dramatically across the state in the last
several years. Land managers are aware that there are real costs in managing
conservation lands, especially managing for public recreational use. It is now standard
practice for conservation easement holders to seek contributions to a stewardship
endowment to help offset the real costs associated with looking after an easement in
perpetuity. The Office of Energy and Planning’s Conservation Land Stewardship
Program (http://www.nh.gov/oep/programs/CLSP/index.htm) is partially funded through
an endowment to ensure that funds will be available to monitor conservation lands into
the future. Communities holding conservation interests are seeking similar arrangements
within the municipality’s administrative structure to ensure these lands are protected in
perpetuity. Alternatively, some communities are establishing arrangements with private
conservation organizations to conduct easement stewardship over the long-term.
Hanover’s Open Space Priorities Plan
The Town of Hanover prepared an award-winning open space plan in 2000. Hanover understood
that while there were a number of different organizations and private landowners involved in land
protection efforts, there had never been a concerted town-wide open space planning effort. The Open
Space Priorities Plan was developed to provide guidance for acquisition of fee or easement properties
using the town’s Conservation Fund, to provide a common understanding of existing areas of open
space and possible linkages with surrounding towns, and to set a common vision for future land
protection efforts in Hanover. The Plan explicitly recognizes that efforts to implement the ideas and
strategies will only be achieved in cooperation with willing landowners, will require many years to
implement, and will require public funds as well as private, individual efforts. Priorities are
established for conservation/recreation action areas as well as in-town open space action areas,
including connectors to link downtown and conservation/recreation areas.
75
While these are all positive aspects of resource management, there is a continuous need
to improve awareness. Public agencies and private organizations alike often face issues
of inadequate staffing and resources needed for management, stewardship, research,
education and enforcement. In addition, there is some concern that as private landholders
(including land trusts and conservation organizations), who are faced with increasing
costs associated with allowing public use of their lands, there will be a trend towards
further restricting or prohibiting public use.
Clearly public use of the resource base, whether publicly or privately held, can bring with
it management and stewardship challenges. It is important to expand and broaden the
discussion about shared concerns and recognize that both public and private entities face
many of the same challenges. Sharing knowledge about stewardship concerns is a first
step. Concerted efforts should be made to continue a statewide discussion about this
topic and develop better ways of promoting information exchange.
Surface Water. Protecting both the quality and the health of our wetlands and surface
waters remains a high priority in the state. The New Hampshire Comparative Risk
Project in 1996 found that three of the top five environmental risks involve water
resources of the state. Surface waters provide important sources of drinking water,
important habitat for a variety of species, and abundant opportunities for recreation for
local residents and tourists alike. As water-based or water-enhanced recreation continues
to rise, it becomes increasingly important to consider efforts to protect these water
resources.
Both public and private organizations are deeply involved in protecting the quality of the
state’s water resources. The Department of Environmental Services (DES) is the agency
with the main responsibility for protecting the state’s water resources. A mission of DES
is, “…to ensure that New Hampshire's lakes and ponds, rivers and streams, coastal
waters, groundwater and wetlands are clean and support healthy ecosystems, provide
habitats for a diversity of plant and animal life, and support appropriate uses.” Several
programs, including the New Hampshire Lakes Management and Protection Program and
the Rivers Management and Protection Program, are in place to help coordinate efforts to
protect water resources. DES also enforces existing laws aimed at protecting water
resources, including The Comprehensive Shoreland Protection Act.
The DES Volunteer Lake Assessment Program (VLAP) is a cooperative program
between DES and lake residents and lake associations. Currently about 165 lakes are
monitored under this program. In addition to taking samples from the lake, volunteers
sample the streams and rivers that act as tributaries to the lake. Because of VLAP, New
Hampshire can better assess the surface waters of the state through the Section 305-B
Surface Water Quality Report to Congress. VLAP also helps limnologists evaluate water
quality trends. The result is the production of watershed protection programs and best
management practices that help protect our lakes.
The University of New Hampshire Cooperative Extension coordinates the volunteer
Lakes Lay Monitoring Program. Through this joint effort between UNH Cooperative
Extension, the UNH Center for Freshwater Biology, and the State of New Hampshire,
over 100 lakes are sampled each year using citizen volunteers. This coordinated
76
volunteer effort helps scientists understand water quality trends over time as well as
diagnose individual lake problems. Water samples are taken on a weekly, biweekly or
monthly basis and analyzed for chlorophyll-a and total phosphorus, as well as monitoring
of water clarity and dissolved oxygen. The Great Bay Watch, in existence for over 10
years, involves volunteers in monitoring water quality in Great Bay and its tributaries.
With increased recreational use of surface water, resource managers are continually
focused on preventing the introduction of exotic species such as milfoil, fanwort, and
zebra mussels. Currently, $5.00 for each boat registration is divided into three programs:
Clean Lakes, Exotic Aquatic Plant Control, and Prevention Programs. Prevention
programs support projects to help educate recreational users about the spread of exotic
plants and on-site prevention efforts such as “Lake Hosts,” whose functions are to
conduct courtesy boat inspections and educate boaters about exotic species and ways to
prevent introduction. New Hampshire leads the nation in efforts to research new control
mechanisms to mitigate variable milfoil infestations. A recent $1 million dollar federal
grant obtained by Senator Judd Gregg will help those states suffering from this noxious
plant better understand the plant’s morphologic characteristics and be better equipped
with new tools to control variable milfoil.
The DES Exotic Species Program provides information on different types of exotics that
have been found in New Hampshire and those that have been found in neighboring states.
The Program also oversees a volunteer Weed Watcher Program to encourage
recreationists, lakes and river associations, and others to monitor lakes and rivers as an
early detection method. Figures 4a and 4b show maps depicting locations where exotic
species have already been identified and the changes since 2002.
Recognizing the important role surface waters play in the state’s economy, the NH Lakes
Association, NH Rivers Council, NH Department of Environmental Services, NH Fish
and Game, and several other agencies and organizations have collaborated over the last
five years to examine the economic impacts of lakes, rivers, streams and ponds in New
Hampshire. Over the past five years, the value of swimming, fishing, and boating on the
state’s economy, as well as the economic impacts of shorefront property and drinking
water supplies, has been determined to be $1.8 billion dollars (2002 dollars) annually to
the state’s economy. In addition, through a phone survey of NH residents, researchers
determined that people would change their behavior if they perceive a change in water
quality. Through one-on-one interviews, researchers calculated that the state will lose
$51 million in sales, $18 million in income and more than 800 jobs statewide if boaters,
swimmers and anglers decide to leave the state because of a change in water quality
(DES, 2007).
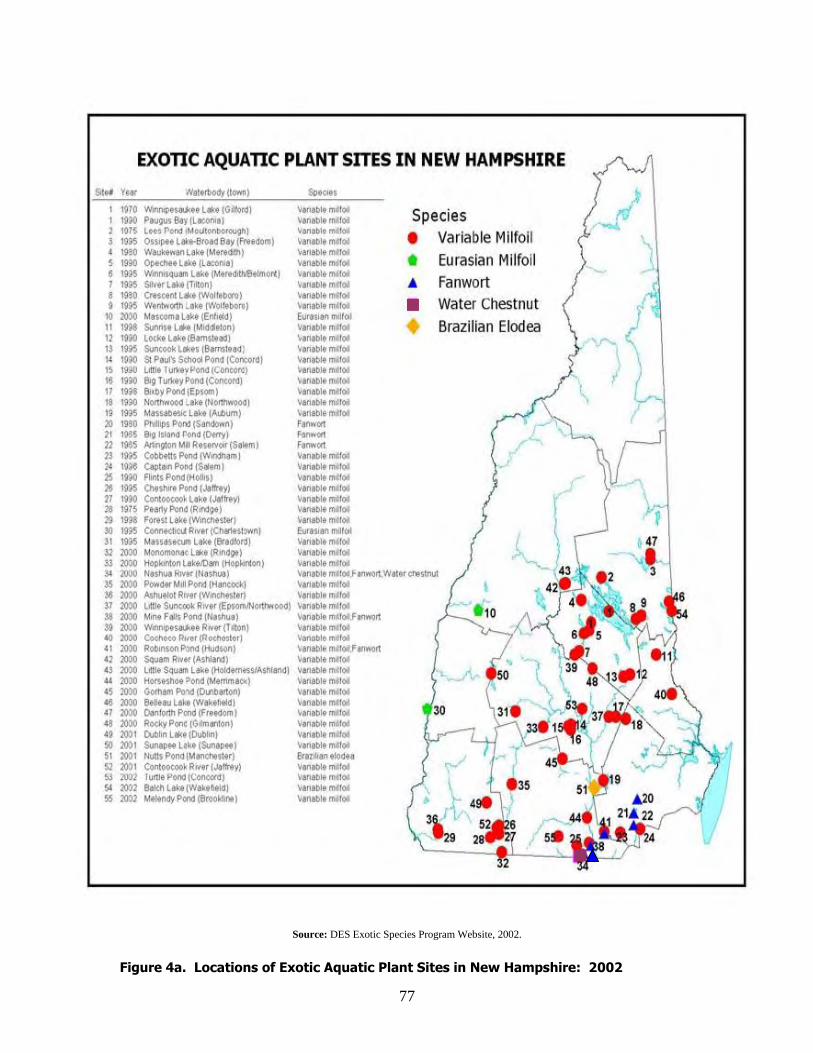
77
Source: DES Exotic Species Program Website, 2002.
Figure 4a. Locations of Exotic Aquatic Plant Sites in New Hampshire: 2002
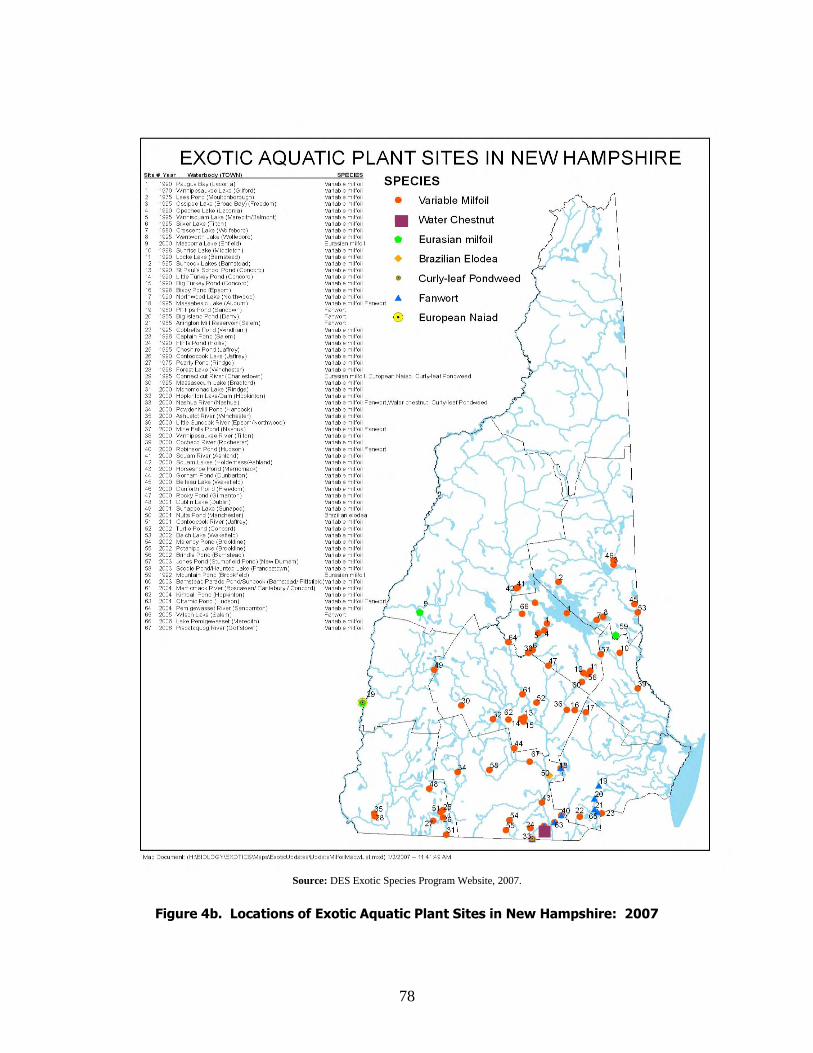
78
Source: DES Exotic Species Program Website, 2007.
Figure 4b. Locations of Exotic Aquatic Plant Sites in New Hampshire: 2007

79
Air Quality. Air quality can also have impacts on outdoor recreation and tourism. In
1996, New Hampshire’s Comparative Risk Project examined issues pertaining to regional
air quality. Pollutants include particulate matter, ground level ozone, acid deposition,
nitrogen, and sulfur oxides. The report highlighted that, as air quality decreases, there
will be greater impacts on public health, our economy, ecological integrity, and on our
quality of life. Currently there are increasing issues and environmental indicators
pointing to correlations between air pollution (specifically greenhouse gases) and climate
change. With regard to outdoor recreation and quality of life, there are concerns over the
negative effects of smog on visibility and aesthetics and the health of the population.
Visibility is an issue for tourism. New Hampshire is currently involved in the
development of the regional haze State Implementation Plan (SIP). A recent cooperative
project relating to visibility was undertaken by the Appalachian Mountain Club, NH
Department of Environmental Services, and NH Department of Resources and Economic
Development in an effort to educate the public, raise awareness of air quality and monitor
visibility at Miller State Park.
The shorter winters typical of our changing climate have an impact on tourism-related
activities, i.e., a shorter skiing season, ice-fishing, snowmobiling and all forms of winter
recreation as well as foliage viewing and maple sugaring. Negative impacts on
recreational and scenic qualities (i.e., decreased visibility and aesthetics) and growing
concern over health risks could also translate into real economic impacts. Worsening
outdoor air quality could reduce the tourism appeal of some of our most popular
destinations. Decisions about air quality take place well beyond state boundaries.
Federal air quality and emission standards and the actions of power plants in other parts
of the country have direct impacts on New Hampshire’s air quality. This is a growing
topic of concern as discussions about federal air quality standards and air quality
problems in the Northeast continue.
There are also concerns over human health, particularly for children, the elderly, and
those with respiratory problems during poor air quality days in the White Mountains and
along the Seacoast.
Climate Change. Mounting evidence indicates that the impacts of climate change are
characterized by marked alterations in the region’s seasonal cycle, weather patterns, and
extreme events such as floods and nor’easters. In the northeast, temperatures have been
rising, particularly in winter, and the number of extremely hot days during the summer
months has been increasing. Snow cover is decreasing and spring is arriving earlier in
the year (Climate Change in the U.S. Northeast, 2006).
Outdoor recreation is a very important component of the winter economy in New
Hampshire. On an annual basis, data from the Travel Industry Association of America,
the nation’s largest tourism research organization, has shown that tourists in New
Hampshire are twice as likely to engage in outdoor recreation as those nationally.
Because of the state’s location and climate, outdoor recreation during the winter months
includes skiing, snowmobiling and ice fishing (Winter Recreation and Climate
Variability in New Hampshire: 1984-2006). This research paper further cites a spectrum
80
of research that documents an average decrease in winter temperatures of 4.4 degrees
over the last 30 years and data that shows a concurrent decrease in snow cover.
Currently, the direct effects of these winter weather-related changes not only impact
winter recreational activities but also impact water-related recreational facilities. For
instance, without the blanketing cover of snow, the ice layer on water bodies gets thicker
and as pressure from this process builds, the forces reverberate back to shore and damage
boat docks and boat ramps.
The Climate Change in the U.S. Northeast (2006) report estimates that the temperatures
in New Hampshire will be similar to Connecticut by 2010 to 2039 with a 9 percent
increase in precipitation. While no research is available in New Hampshire on the
recreational impacts of these changes, other regions of the country have begun
researching the impacts of global warming on recreation; i.e., Great Lakes Regional
Assessment Group; Center for Environmental Policy, Economics and Science, Ann Arbor
Michigan; and the Department of Forest, Range and Wildlife Science, Utah State
University.
Recreational Vehicle Emissions. There are also concerns about the impact of motorized
recreational engines on air quality (as well as water quality). Marine gasoline engines
and non-road recreational engines and vehicles (including boats, snowmobiles, off-
highway motorcycles, and ATVs) contribute to regional haze and visibility problems in
high use areas (e.g. parks, marinas), as well as to ozone formation and particulate matter
and carbon monoxide levels. The Environmental Protection Agency (EPA) has issued
guidelines for marine gasoline engines and non-road recreational engines. Manufacturers
continue to improve design and production of less-polluting models.
An effort is underway in New Hampshire to meet these new requirements for outboard
marine engines. Prior to the EPA’s 2006 mandate, New Hampshire’s Clean Marine
Engine Initiative, a public/private partnership between DES and the Marine Trades
Association, aimed at phased-in low-pollution engines.
The partnership and voluntary agreement is a good model for other types of recreational
engines. The state should explore the feasibility of forging a similar partnership with
boat, snowmobile and ATV recreational equipment dealers. Such a partnership would
help to phase in these upcoming federal requirements in a proactive manner and send a
positive message about the commitment of riders to cleaner burning recreational engines.
Along with the efforts of the marine dealers, the state has been converting its fleet of
watercraft to be outfitted with low pollution outboard engines. DES, Fish and Game, and
particularly the Marine Patrol, deserve praise for their efforts to put cleaner outboard
engines on their watercraft. Over the last several years, these agencies have been
replacing old carbureted engines with new 4-stroke and 2-stroke engines. In the state
fleet with outboard engines, 80 percent are running cleaner, low polluting engines.
81
Health and Wellness. Concerned individuals and groups in New Hampshire
representing health, environment, education, media and culture, and the built
environment have entered into partnerships to address this issue through the children and
outdoor initiative. Working groups are developing a media campaign and message, a
website clearinghouse of opportunities, and annual events including summits for
continued discussion and work. Dr. Susan Lynch, First Lady and pediatrician
specializing in childhood obesity, has championed this effort.
GOAL: Insure that the quality and quantity of the natural resource base is
maintained or enhanced as recreation pressures increase.
I. Objective: Continue to support efforts to identify and protect open space lands.
Strategy:
A. Give priority to land acquisition efforts focused on natural areas/lands identified
in existing local, regional, or state plans (e.g. wildlife habitats identified in the NH
Wildlife Action Plan habitat mapping as Highest Ranked Statewide or Highest
Ranked in the Biological Region should be prioritized for protection for low
impact recreational uses and should be avoided for high-use recreation. Lands
might include forests, wetlands, rare natural communities, coastal areas,
agricultural lands, etc.). (LWCF)
B. Support efforts to secure permanent state funding for LCHIP (e.g. encourage
groups to endorse and support Citizens for Land and Community Heritage).
C. Support efforts to secure continued funding for federal programs (e.g. statewide
LWCF funding, Forest Legacy, SAFETEA-LU, EPA Brownfields, Farm Bill,
etc.).
D. Support comprehensive statewide, regional and local planning for open space,
recreation corridors, and greenways, and implementation of existing plans (e.g.
state, regional, and local open space plans, trail plans, Designated River Corridor
& Watershed Management Plans, NH Wildlife Action Plan, etc.).
E. Educate the public on plans that currently exist (e.g. NH Wildlife Action Plan,
Designated River Corridor & Watershed Management Plans, Hanover Open
Space Plan, etc.).
F. Expand efforts to fund conservation for outdoor recreation at the local level (e.g.
encourage communities to consider open space bonds and/or earmarking all or a
portion of the local land use change tax for conservation purposes).
G. Encourage state, regional, and municipal partnerships with non-profits and land
trusts to acquire and protect locally significant open space lands (e.g. New
Hampshire Association of Conservation Commissions, Center for Land
Conservation Assistance).
82
H. Target specific purchases in areas of the state where the fastest growth and usage
is taking place (e.g. protect lands near areas experiencing increased development
pressure to protect open space lands and recreational opportunities close to home).
I. Target purchases that protect hydrological units or create or link large contiguous
blocks of land for wildlife and people.
J. Support efforts to protect scenic views (e.g. encourage and give incentives to
landowners to keep fields mowed - examples might include the NH Fish and
Game small grants programs for wildlife or establishing incentives through
existing programs like Current Use).
K. Encourage communities to include recommendations from the NH Wildlife Action
Plan in their planning efforts. (NH Fish and Game)
L. Encourage communities to include Designated River Corridor & Watershed
Management Plans in their Master Plans as authorized by RSA 483:8-a, III (c).
II. Objective: Address environmental and cultural resource impacts from existing
recreational facilities and when new recreation facilities/opportunities are developed.
Strategy:
A. Give priority to projects that help redistribute recreational use away from
ecologically sensitive areas. (LWCF)
B. Address impacts to important resources such as wildlife, water quality, rare or
endangered species, cultural/historic resources, and sensitive areas when planning
and designing trails/facilities, and coordinate with affected agencies early in the
planning process (e.g. coordinate efforts with NH Natural Heritage Inventory,
Division of Historical Resources, NH Fish and Game Department, etc.).
C. Evaluate the role tourism and outdoor recreation marketing and development play
in creating both positive and negative environmental and cultural resource
impacts (e.g. Institute for New Hampshire Studies, UNH Cooperative Extension,
Northern Forest Center, etc.).
D. Expand coordinated state review efforts of new development plans on state lands
and implement Long Range Management plans for state owned lands within
designated river corridors and their tributary drainage areas (RSA 483:10-a) (e.g.
State Land Management Team).
E. Continue existing programs focused on resource protection (e.g. Volunteer Lake
Assessment Program, Volunteer River Assessment Program, Lakes Lay
Monitoring Program, DES Exotic Species Program, State Conservation & Rescue
Archaeology Program, etc.).
83
F. Expand partnerships and initiatives aimed at promoting the use of recreational
equipment that utilize cleaner, more environmentally friendly technologies (e.g.
NH Clean Marine Initiative).
III. Objective: Address long-term stewardship issues on existing parcels and when parcels are
protected or developed.
Strategy:
A. Give priority to projects that have a prepared stewardship plan in place. (LWCF)
B. Continue to address enforcement and enforceability of existing environmental
laws (e.g. support increased enforcement by state agencies and examine existing
limitations given current staff and funding levels).
C. Encourage and assist landowners in preparing stewardship plans on existing
parcels.
D. Emphasize the importance of stewardship when lands are protected by the state,
municipalities and other organizations (e.g. LCHIP requires a stewardship plan to
be developed in order to receive grant funding for fee-owned lands and
easements).
E. Utilize and promote technical assistance programs for providing consultation
when parcels are protected (e.g. Center for Land Conservation Assistance, local
land trusts, NH Coalition for Sustaining Agriculture, NH Office of Energy and
Planning).
F. Develop partnerships with recreational user groups to steward lands.
G. Improve information and educational efforts aimed at addressing stewardship
concerns and issues faced by both public and private entities.
Selected Contacts and Information Resources
National Center for Recreation & Conservation (www.ncrc.nps.gov/)
National Park Service, Rivers Trails and Conservation Assistance Program
(www.ncrc.nps.gov/programs/rtca/)
Land and Community Heritage Investment Program (www.lchip.org/)
New Hampshire Department of Resources and Economic Development –
Division of Parks and Recreation (www.nhparks.state.nh.us/)
New Hampshire Fish and Game Department (www.wildlife.state.nh.us/)
New Hampshire Department of Environmental Services (www.des.state.nh.us/)
Society for the Protection of New Hampshire Forests (www.spnhf.org/)
The New Hampshire Association of Conservation Commissions
(www.nhacc.org/nhacc.htm)
84
New Hampshire Fish and Game Department Non Game and Endangered Wildlife
Program (www.wildlife.state.nh.us/nongame_page.htm)
New Hampshire Natural Heritage Inventory
(www.nhdfl.org/formgt/nhiweb/index.htm)
New Hampshire Chapter of The Nature Conservancy (http://nature.org)
Audubon Society of New Hampshire (www.nhaudubon.org/)
New Hampshire Lakes Association (www.nhlakes.org/)
New Hampshire Recreation and Park Association (www.nhrpa.com)
New Hampshire Department of Resources and Economic Development –
Division of Forest and Lands
(http://www.dred.state.nh.us/divisions/forestandlands/)
Appalachian Mountain Club (http://www.outdoors.org/) Conservation Law Foundation (www.clf.org) University of New Hampshire Cooperative Extension (www.extension.unh.edu) New Hampshire Rivers Council (http://www.nhrivers.org/)
2. PROVIDING DIFFERENT, SOMETIMES COMPETING, RECREATIONAL
OPPORTUNITIES
Summary
New Hampshire needs local, close-to-home recreational opportunities, especially
alternatives to those opportunities marketed as tourist destinations.
Issues and conflicts can arise when multiple activities compete for the same
resources. This is particularly evident along trails and on public waterways.
There is a tendency to place restrictions on use as pressure increases or conflicts
develop.
The resource and recreation management concerns may vary depending on
location. Concerns may be more related to impacts of tourism in the northern
half of the state, and more related to increased development pressure and
population growth in the south.
Universal Design is required under state and federal law when recreational
opportunities are developed or improved.
According to the Statewide Outdoor Recreation Needs Assessment (UNH, 1997)
some of the most broadly popular activities in the state include wildlife viewing,
walking/jogging/running, picnicking, day hiking, and swimming. These
activities tend to be globally popular because they are unstructured, require little
facility “development”, require no specialized gear or skills, and can be enjoyed
by young and old alike. Many of these activities take place close to home.
U.S. data shows that participation in most outdoor recreational activities is on the
rise, either due to population increases, increases in popularity or both (Outdoor
Industry Foundation, 2006). This suggests that both recreational facilities and
acquisition of lands for a range of activities are needed.
New equipment and technology are expanding the type and range of activities
people enjoy (Cordell et. al, 1999).
85
Wheeled OHRV registrations by New Hampshire residents have more than
doubled in the last 10 years and tripled for non-residents in the same time period
(NHFG, 2006).
Nearly 50 percent of respondents to the Statewide Outdoor Recreation Needs
Assessment (UNH, 1997) agreed or strongly agreed that outdoor recreation areas
in New Hampshire are too crowded.
Forty six percent of respondents in this same 1997 survey indicated that they
would be willing to pay higher user fees if the increase would be dedicated to
maintenance, acquisition and development of recreation programs and properties.
The 1997 Comprehensive Statewide Trails Study completed by OEP found that
existing trails are inadequate to meet the current range of recreational activities.
Overview
Planning for recreation requires the consideration of many factors, including an
understanding of changing environmental, cultural, economic, social, and technological
conditions and trends. A number of sources explore these trends and changing
conditions. According to Park, Recreation, Open Space and Greenway Guidelines
(1996) published by the National Recreation and Park Association and the American
Academy for Park and Recreation Administration, there are numerous trends that impact
outdoor recreation planning. Examples include a greater focus on preserving natural
resources, increased citizen participation in decision making, an aging society, great
strides in information technology (e.g. internet), and increased focus on growth
management.
Outdoor Recreation in American Life, A National Assessment of Demand and Supply
Trends (Cordell et. al, 1999) underscores the need to address increased recreational use,
changing participation patterns, and the potential for greater conflicts of use. This report
states that recreation providers should expect that the most popular sites will experience
greater congestion in the future and that there will likely be more conflicts among
recreationists as they vie for use of the same areas at the same times. Pressure is
expected to be particularly heavy at already popular water sites, especially with advances
in technology. Travel and tourism should continue to grow as long as transportation and
access to resources remains affordable and available.
Other predicted trends identified in this report include the following: access to both
developed sites and dispersed areas will become an even more important management
issue; cultural and socio-economic changes will continue to change the type of demand
for recreation opportunities; and the number of organized groups (representing a wider
variety of outdoor recreation interests) will continue to grow and have an increasingly
large voice in public land management.
Universal Design and Accessibility. Beyond general trends, recreational providers, by
law, must consider the universal accessibility of recreational opportunities. With the
passage of the Americans with Disabilities Act (ADA) in 1990, communities were given
the legal responsibility to provide a reasonable level of access to all users of public
facilities and programs. This includes access to public park and recreation facilities.
86
Guidance for facility design is available from the U.S. Department of Justice, the U.S.
Access Board, the U.S. Forest Service, and the Center for Universal Design, in addition
to accessibility standards that are published by the International Code Council. More
general information about the Americans with Disabilities Act can be found at the U.S.
Department of Justice (DOJ) website (http://www.usdoj.gov/crt/ada/adahom1.htm) which
provides access to a wide range of information and technical assistance about the ADA,
including a link to ADA Standards for Accessible Design
(http://www.usdoj.gov/crt/ada/stdspdr.htm). Additional resources of interest to
communities are the ADA Guide for Small Towns
(http://www.usdoj.gov/crt/ada/smtown.htm) and the ADA Best Practices Tool Kit for
State and Local Governments (http://www.usdoj.gov/crt/ada/pcatoolkit/toolkitmain.htm).
These provide overviews of basic ADA requirements with cost-effective tips on how
small towns can comply with the ADA.
In New Hampshire, the Governor’s Commission on Disability provides information and
education about the Americans with Disability Act and other regulations that affect the
lives of citizens with disabilities. The Commission’s stated mission is to “remove the
barriers, architectural or attitudinal, which bar persons with disabilities from participating
in the mainstream of society.”
The Architectural Barrier-Free Design Committee of the Governor's Commission on
Disability (under RSA 275-C and RSA 155:39) writes, distributes and enforces the
Architectural Barrier-Free Design Code for New Hampshire (ABFDC-NH). This code
incorporates by reference the accessibility guidelines, “Accessible and Usable Buildings
and Facilities ANSI A117.1-1998” – from the American National Standards Institute, Inc.
For assistance with disabilities, contact the Commission at 1-800-852-3405 (in NH) or
603-271-2773.
In September 2002, the State of New Hampshire adopted the State Building Code, which
incorporates accessibility standards for all new construction, additions, and alterations
that apply to all facilities including recreation facilities.
New Hampshire Conditions and Trends
As population grows, tourism remains strong, and participation rates for many activities
continue to rise, New Hampshire and its communities must consider how to provide for
an increasingly diverse range of outdoor recreational activities. This includes providing
outdoor recreation experiences in tourist destinations along with more localized efforts
that provide residents with opportunities close to home. According to the Statewide
Outdoor Recreation Needs Assessment conducted by the University of New Hampshire in
1997, about 50 percent of all outdoor recreation activities take place within 10 miles of
home.
Local opportunities for outdoor recreation, particularly human powered recreation, can be
important aspects of encouraging physical activity and promoting a healthy lifestyle.
Providing close-to-home, convenient opportunities for walking or biking, for instance,
helps to incorporate outdoor recreation into people’s daily lives instead of just as a
weekend or occasional hobby. This helps ensure that participation takes place not only
when one travels to a destination, but also when one walks down the street or out the
87
front door. This type of activity is one way to address the obesity epidemic and meet the
needs of our aging population. Trails, paths, and bikeways have dual impacts. Pathways
serve as a recreational opportunity in and of themselves and provide important connector
or transportation linkages between other local resources.
According to a 1995 National Park Service report titled Economic Impacts of Protecting
Rivers, Trails, and Greenway Corridors, 11
there are numerous economic benefits of
trails and greenways, such as increased property value of nearby homes. In addition to
property value increases, studies have shown that trail users spend money on food,
beverages, camping, hotels, and bike rentals, which stimulates the local economy.
Greenways also reduce flood damage and costs related to damage. Throughout the state,
dozens of regional and community-based trail groups have sprung up. Local
conservation commissions are also increasingly becoming involved in the development of
trails and greenways.
Tourism and Recreational Use. Outdoor recreation areas marketed as destinations
provide an important source of tourism-related income for the state. Tourism-related
dollars are generated both from in-state visitors as well as out-of-state visitors and are an
important part of the economy. These destinations, such as the trails and scenery of the
White Mountain National Forest and Mount Monadnock, the beaches of the Seacoast,
and the clear lakes of the Lakes Region, help define the character of the state and are an
important reason why residents call New Hampshire home.
A forum sponsored by the NH Historical Society, SPNHF and the NH Distance Learning
Network was held in 2003 to discuss the history and future of the state’s tourism industry.
In particular, there was discussion about tourism promotion and the importance of
managing for potential impacts of tourism growth and development. There was broad
awareness and recognition of the important role our natural and cultural resources play in
the continued health of our state’s tourism industry. If these resources are ignored, our
tourism industry and our quality of life will be impacted.
The importance of the topic was underscored by the broad organizational representation
at the table. The Business and Industry Association, Lodging and Restaurant
Association, Monadnock Conservancy, Plymouth State University, University of New
Hampshire, and North Country Resource Conservation and Development made
presentations to an audience of agency, non-profit and business interests.
A fair number of state residents are concerned about existing use levels of recreational
areas and a substantial number would pay higher fees to alleviate pressure and impacts
of use. Nearly one-half of respondents in a Statewide Outdoor Recreation Needs
Assessment (UNH, 1997) agreed or strongly agreed that outdoor recreation areas in New
Hampshire are too crowded. Forty-six percent, in this same survey, indicated that they
would be willing to pay higher user fees if the increase would be dedicated to
maintenance, acquisition, and development of recreation programs and properties.
11
National Park Service, Economic Impacts of Protecting Rivers, Trails, and Greenway Corridors (1995)
is the most recent national survey regarding the economic impact of protecting rivers, trails and greenways.
88
In this 1997 study, three destination areas in the state, White Mountain National Forest,
Lakes Region, and Seacoast, were examined individually to explore perceptions of
crowding and use. Almost 89 percent of residents have visited the White Mountain
National Forest (WMNF). While almost all (96 percent) still rate their last visit as good
or excellent, about 23 percent said the environmental conditions in the WMNF are
declining and almost 32 percent said crowding and congestion are becoming a bigger
problem. Nearly 19 percent indicated that they use the WMNF less now in response to
crowding.
Almost 81 percent of state residents have visited the Lakes Region of New Hampshire.
Most ranked their last visit as either good (55 percent) or excellent (33 percent). Similar
to the WMNF, about 24 percent of respondents said the environmental condition of the
Lakes Region is declining. Almost 43 percent indicated that crowding and congestion
are becoming a bigger problem in this area, with about 17 percent saying they visit the
Lakes Region less in response to crowding or congestion.
Approximately 84 percent of respondents have visited the Seacoast. About 53 percent
rated their last visit as good and 27 percent excellent. Again, similar to the other two
areas, about 22 percent indicated that environmental conditions of the Seacoast are
declining. Nearly 44 percent said that crowding and congestion are becoming more of a
problem in this area and 25 percent of residents visit the Seacoast less now because of
this.
These three profiles suggest that while residents still view these experiences positively, a
significant number of state residents are becoming sensitive to crowding and congestion,
in some cases changing their visitation patterns. As use continues to grow or expand in
these areas, these issues could become more pronounced and will pose challenges to
recreation providers. These trends also suggest that the visitor profiles of these regions
may be changing as well.
While many resource and recreation management concerns may be statewide, some may
be more evident in one area of the state than another. For example, many communities
towards the northern part of the state tend to be dominated by large tracts of publicly
owned lands such as the White Mountain National Forest, or large tracts of un-
fragmented privately held lands. Tourism promotion, the impacts of recreational use, and
the management decisions made on these lands are all of great importance to local
communities. Comparatively, there is much less publicly held conservation land in the
southeastern part of the state, and the sheer number of large un-fragmented parcels is
dwindling. Communities in the southeast must increasingly deal with issues surrounding
growth, including loss of open space, loss of community character, and increased
development pressure.
Keeping Lands Open to the Public. The 1996 New Hampshire Forest Resources Plan,
produced by the Forest Resources Plan Steering Committee and the DRED Division of
Forests and Lands, identified a host of action strategies aimed at sustaining New
Hampshire’s forests and forest economy. (DRED is working on a plan revision to be
completed in 2008.) One specific action step identified in the plan focuses on continuing
the tradition of keeping lands open to the public. Public use generally includes low-
89
impact activities such as hiking, bird watching, fishing, hunting, snowshoeing, and cross-
country skiing.
The plan recognizes that New Hampshire has a long held tradition of public use of
private lands for recreation, but changes in land use and liability concerns are restricting
these opportunities. Smaller parcel sizes and increased posting due to fear of liability
raised concern that these trends would increase pressure on existing public lands, some of
which already experience a great deal of use. This increased use of public lands, in turn,
may negatively impact both the natural resource base and the recreational experience.
The plan suggests the continued promotion of recreational use of private lands by
addressing landowner concerns and statewide recreational opportunities. Sample action
steps identified in the 1996 plan include continuing efforts to build coalitions between
forest landowners and people who recreate on private lands, provide information about
the rights and responsibilities of forest landowners in education programs, and develop
programs on responsible use. These concerns mirror those identified by the SCORP
Public Advisory Committee and give credence to continuing efforts to address issues
related to public use of private lands in the SCORP.
This emphasis is supported by a 2001 survey completed for the Statewide Program of
Action to Conserve our Environment (SPACE) by the University of New Hampshire
Survey Center. This survey found that 55 percent of Current Use landowners cite
recreational use as the number one public benefit they provide (a 19 percent increase
from the 1993 survey). About 59 percent of Current Use landowners indicated that their
land is not posted against hunting, fishing, hiking, snowshoeing, skiing, or nature
observation. Forty-four percent indicated their land is being used most frequently for
“recreational uses,” compared to 37 percent who indicated their land is primarily used for
“extractive uses” (e.g. forestry) and 19 percent who indicated “passive uses” (e.g. wildlife
habitat).
As background, the Current Use Taxation Program, under RSA 79-A, was established in
1972 to:
“…encourage the preservation of open space, thus providing a
healthful and attractive outdoor environment for work and
recreation, maintaining the character of the state’s landscape,
and conserving the land, water, forest, agricultural and wildlife
resources.”
Under this program, parcels of land (10 acre minimum) are taxed based on their current
use value as open space (e.g. active farm or forest land) rather than on their potential
value for development purposes.
Under New Hampshire’s Current Use Program landowners can also accept an additional
20 percent “recreation adjustment” to their taxes. This recreation adjustment lowers a
landowner’s tax burden by an additional 20 percent if the land is kept open to the public
for traditional forms of recreation. As defined by RSA 79-A:4,II, the six traditional
forms of recreation consist of skiing, snowshoeing, fishing, hunting, hiking, and nature
90
observation; available year-round unless these activities are detrimental to crops on
agricultural lands or active forestry operations.
During the 2005 Legislative Session, New Hampshire’s landowner liability statute RSA
212:34 “Duty of Care” was amended to include paragraph IV, effective January 1, 2006.
Prior to the amendment, the statute provided liability protection for landowners if action
was taken against them but did not preclude them from being taken to court. The
legislature responded to landowner concerns with the following new provision:
IV. Except as provided in paragraph III, a person using the premises as provided in paragraph I
or given permission as provided in paragraph II, shall not maintain an action against the owner,
occupant, or lessee of the premises for any injury which resulted while on the premises.
Water Access. In 1991 OEP developed and published the Public Access Plan for New
Hampshire's Lakes, Ponds, and Rivers in conjunction with the then-called Public Access
Advisory Committee. It includes an evaluation of past and future access efforts and
provides a series of recommended strategies for identifying priority sites and sources of
funding for improving public access in the state. The plan provided a detailed set of
recommendations related to administrative needs, funding, and 10 different goals for
improving water-related access. Some examples of main goals include: to provide and
improve year-round access, including for those who are disabled; to provide access for
boaters and non-boaters alike; to minimize abutter conflicts; to identify, analyze and
minimize environmental impacts associated with public access; and clearly define roles
of public and private access providers.
Two recommendations identified in the Public Access Plan have since become law. In
1992, the New Hampshire legislature passed RSA 233-A, which established the New
Hampshire Boat Access Program. The legislation also provides a non-lapsing dedicated
fund for public access development taken from a $5 surcharge on boat registrations. The
law allowed the NH Fish and Game Department to use the funding for the acquisition of
lands for access, development of access facilities, and staffing. Another recommendation
of the Public Access Plan, also an important aspect of RSA 233-A, is the establishment of
a Public Water Access Advisory Board (PWAAB). The Board is comprised of 20
members representing state agencies, legislators, hunters, fishermen, lake and river
associations, and various boating groups. This Board is charged with advising and
monitoring all state agencies in their efforts to increase and expand access to New
Hampshire's public waters. Public access includes not just boat access but any
opportunity for the public to access these water bodies for recreational purposes including
swimming, shore-bank walking and fishing and picnicking.
The PWAAB meets regularly to review and make recommendations that impact water
access. Currently, a subcommittee is addressing the issue of accessibility, capacity and
stewardship of public waters.
Over 15 years have passed since the Public Access Plan was developed. Given the
changes that occur over time, the priorities, recommendations and strategies set forth in
this 1991 plan should be reviewed by the New Hampshire Fish and Game Department
and the Public Water Access Advisory Board (PWAAB) to determine accomplishments
91
to date and reaffirm or revise priorities, goals and strategies.
Trails Issues. OEP, in cooperation with DRED, produced a Comprehensive Statewide
Trails Study in 1997. This study served as an update to the 1974 Trails Study and was an
outgrowth of the 1993-1999 SCORP. This study was completed with input and guidance
from the Statewide Trails Advisory Committee. The New Hampshire Statewide Trails
Advisory Committee, authorized under RSA 216-A, was established to advise DRED and
the Commissioner on matters related to state trails. Membership includes a variety of
interests from state agencies, motorized and non-motorized trail user groups, and non-
profit organizations. This Committee helps improve coordination between agencies and
recreational trail user groups and inform state decisions related to trails planning and
development.
An important part of the Comprehensive Statewide Trails Study planning effort included
the development of statewide issues, goals, and recommendations related to trails. Issues
identified related to several main categories including the protection of resources, user
needs, compatibility of trail activities, trail maintenance, funding, laws, and municipal
trails. Some main recommendations of this 1997 study included: encourage the
development of trail corridors to accommodate the needs of different trail users;
encourage trail organizations and towns to work with land trusts to protect trail and
greenway corridors; encourage links between places where people work, live and play;
encourage towns and communities to develop trails within 15 minutes of home; and
develop trail monitoring plans for evaluating trail maintenance needs on trail systems.
These examples, along with others identified in the plan, remain pertinent today and
serve as an important foundation for addressing trail issues in the SCORP.
Issues related to trails are not always about competing recreational uses. For instance,
many tracts of undeveloped land in New Hampshire are working forestlands. These
lands provide forestry-related income to landowners and many also offer public
recreational opportunities. Active forestry on lands open to the public can sometimes
impact recreational experiences. Trails may be closed for a period of time during active
harvesting, or harvesting along existing trails can change the look and aesthetic appeal of
an area. Issues can arise on publicly and privately held lands.
For example, in a municipality in southern New Hampshire, it was decided it was time to
harvest timber in the town forest and a forest management plan was developed.
However, in the ten years since the town acquired the parcel, the town forest had been
used primarily for public recreation: hiking, bird watching and cross-country skiing, etc.
Trails were developed and marked for recreational use. When harvesting began, little
explicit consideration was given to the existing recreational use of the property. The
resulting cut had significant visual impacts on the property, especially as viewed from
these public trails. This created conflict and disagreement in town over the purpose and
management objectives of the land.
While no single prescription exists, some interested landowners are giving consideration
to trail buffers as a way (management strategy) to help protect recreational corridors.
Trail buffers might, for instance, limit or restrict forestry along existing trails or planned
trails. Under such a scenario, a landowner could, for example, agree to maintain a buffer

92
of 50’ or 100’ along an existing recreational corridor and limit forestry within this buffer
zone to salvage cuts only. Such a tool helps protect the existing recreational
opportunities (e.g. hiking, cross-country skiing, etc.) by protecting the aesthetic appeal
while still maintaining a majority of a property’s use as a working forest.
Motorized Access. In 2001 the State of New Hampshire recognized that All Terrain
Vehicle use, as a recognized recreational activity, was on the rise in the state. With
registrations increasing 150 percent over the prior 10 years, a way to address the issues
brought about by the legitimate use, and abuse, of these machines was paramount. Over
the following years, a number of legislative initiatives were undertaken to try to do so.
One of these initiatives was the increase in registration fees with a portion of those fees
dedicated to buying land to develop ATV trails.
While a relatively small proportion of people participate in wheeled OHRV activities as
compared to non-motorized activities, its increasing popularity and its relatively large
impact on other use or interests demands increased attention from managers. Ignoring
the growth of these recreational uses would only create greater management challenges
and greater controversy in the future. Compounding this increase in resident interest is
the growing trend towards restricting wheeled OHRV use in Massachusetts and Vermont.
Managers feel that wheeled OHRV policies in other states may be diverting additional
use into New Hampshire.
A wide variety of opinions about wheeled OHRV management exist in New Hampshire.
Some view existing trail and wheeled OHRV area access as insufficient given the
growing demand and substantial registration fees paid by OHRV users. They feel that
more state resources and wheeled OHRV fees should be directed to expanding and
improving access for wheeled motorized access.
Others view wheeled OHRV use as a growing statewide problem and concern. Existing
use is seen as detrimental to the environment (wetlands, wildlife, air pollution) and trail
conditions, and negatively impacts other interests (other trail users, abutters). There is
also growing concern over trespass, litter, safety, and problems with enforcement on
privately and publicly held lands. There is concern that the state is paying too much
attention to this use and will ultimately promote and expand OHRV use across the state.
Several communities, especially in the southern part of the state, are expressing concern
and frustration over growing OHRV use and their lack of control over this use. There is
also a concern over the lack of state enforcement (NH Fish and Game) available to
address trespass and safety issues, among others. This lack of state funding for
enforcement is seen as placing a disproportionate burden on local law enforcement.
There is a fear that growing recreational use and continued lack of local control will only
exacerbate already problematic local issues in the future.
DRED has begun to address this demand with the purchase of land and the development
of Jericho State Park in Berlin for ATV use as a destination park for OHRV riding.
(Fifteen miles of the proposed trails were opened in August 2006 in Jericho State Park.)
In addition, the Bureau of Trails, in collaboration with more than twenty ATV clubs
across the state and the NH Off Highway Vehicle Association, are working together on
93
an education program that informs riders of state laws, rider ethics, and responsible trail
usage.
Legislation. Increased use and demand for motorized trail access heightens the need to
better understand the needs of these users, the relationship of ATV/Trail Bike use to other
uses, impacts on existing trails, other trail users, and the resource base.
House Bill 1273 (Chapter 233 of the Laws of 2002) provides legislative guidance for
planning and procedures related to state-owned or leased trails ATV as well as OHRV
registrations. A key aspect of the law includes a mandated ATV and Trail Bike Trails
Plan. The plan, completed in 2003, is scheduled for updates every five years. The plan
must emphasize self-contained trails and include the following components:
a. Provides an inventory of the ATV and trail bike trails open to the public in the
state, including the length and condition of the trails, persons or organizations
responsible for maintenance, funding levels for maintenance, and estimated ATV
and trail bike use.
b. Provides an assessment of the amount of ATV and trail bike trail expansion
required to reasonably accommodate the public need in the next five years.
c. Proposes additional sites of strategically located lands where public/private
partnerships will allow development of ATV and trail bike trails.
d. Proposes sites for the acquisition by the state of strategically located lands for the
development of ATV and trail bike trails.
e. Assesses the level of funding necessary for grants-in-aid and purchases of land,
easements, and rights-of-way for the purposes of the 5-year plan, and makes
recommendations for fee structure changes to the legislature.
The Plan is available on-line.
http://www.nhtrails.org/Trailspages/ATVpages/ATVTrailSystemPlan.pdf
Fee and Non-Fee Activities. This discussion about the state’s management of OHRV
use brings to light a larger issue: how to manage for recreational activities with user fees
versus those without user fees. Some feel that the state's attention and focus on these two
broad classes of activities is out of balance, though there are perspectives on both sides of
the issue. There is one general perspective that the silent majority (e.g. wildlife watchers,
hikers, bicyclists, non-motorized boaters, etc.) has too small of a voice in resource
management decisions. The feeling is that more attention should be placed on preserving
the more popular non-fee activities instead of the less popular fee-based activities
(OHRV, motor boating, etc.).
Some feel the state focuses attention on supplying opportunities for fee-based activities
but does not fully recognize the negative impact these activities can have on other uses.
Some feel the state is even promoting fee-based use because it is a revenue source. The
concern is that continued promotion of certain fee-based activities could ultimately
damage the majority’s ability to enjoy these other more popular (non-fee) activities.

94
There is another broad perspective, however, that recreationists who pay fees to
participate in their activities should be given more state time and attention. Their fees
should be used expressly to enhance and improve their ability to participate in these
activities and state resource managers must be responsive to their needs. Some feel there
still is not enough consideration given, based on the high fee rates charged. Perspectives
vary and discussions and debate about state management of fee and non-fee activities will
likely increase in the future as recreation pressures and demands grow.
Local Open Space and Trail Planning. Many communities already identify, inventory,
and plan for recreation needs such as ball fields, playgrounds and bicycle paths, through
their master planning process. In addition to this important planning effort, communities
may also want to consider conducting an open space trails plan to identify and plan for
open space (and trails) more explicitly. A manual, produced by the Central New
Hampshire Regional Planning Commission (CNHRPC), is available to provide guidance.
The Guide to the Development of a Municipal Open Space Trail System Plan helps
communities plan for a municipal trail system and to promote the conservation of lands
of special significance. The guide provides recommendations for how to protect open
space and create a trail system in a community. This is useful on a municipal level and
can also help neighboring communities develop a more regional approach to open space
and trails development. Central New Hampshire Regional Planning Commission assisted
eight communities in completing an open space trail plan between 1999 and 2001. It is
not known how many communities have taken advantage of the on-line guide.
An open space trails plan consists of an inventory and maps of a town’s existing
conservation easements, public lands, right-of-ways, and privately conserved lands, along
with an inventory and maps of existing formal trails and informal trails. Examples
include preserved private and public lands, lands that abut Class VI roads, snowmobile
trails on private land, railroad corridors, and utility easements. Inventories and maps help
a community decide upon new trails and provide a holistic view of the town’s existing
resources to aid the creation of an open space and trails network. The planning process is
sensitive to issues of private property and landowner liability and attempts to minimize
individual concerns over certain lands being identified in the plan.
Open Space Trail Plans can be adapted to meet the needs of individual communities and
can be used alongside an existing master plan or adopted as part of a master plan. Such a
plan can also provide recommendations for changes to a municipality’s site plan review
regulations or subdivision regulations. This guidebook is available on-line through the
Central NH Regional Planning Commission (www.cnhrpc.org).
95
GOAL: Ensure that a variety of recreational opportunities are provided, even as
pressures and potential conflicts arise.
I. Objective: Support, protect, and maintain existing outdoor recreation opportunities.
Strategy:
A. Focus efforts on renovating eroded or deteriorated facilities (e.g. boat ramps,
playgrounds, etc.) and recreational areas (e.g. beaches, parks, trails, etc.).
(LWCF)
B. Protect existing access (e.g. water access, trails, trailheads, etc.) and preserve and
maintain existing recreational areas (e.g. parks, playfields, etc.).
C. Work with recreational clubs, organizations, and the Department of
Environmental Services to produce and promote best management practices
(BMPs) for different recreational uses (e.g. work with different trails groups to
develop BMPs for trail development/maintenance).
D. Encourage stewardship of recreation areas/facilities through local initiatives.
II. Objective: Support additional recreational opportunities to address existing
problems or deficiencies.
Strategy:
A. Give priority to projects that provide for identified public recreational needs
and/or unavailable recreational opportunities. (LWCF)
B. Give priority to projects that identify and address existing problems with overuse
or mitigate conflicts of use. (LWCF)
C. Encourage the state and local communities to use an opportunity spectrum
method 12
to determine recreational needs based on desired levels of service,
resource availability and maintenance capacity.
D. Educate communities about existing legislation that can promote and designate
local recreational opportunities (e.g. Class A and B Trails and 20 percent
recreational adjustment under Current Use).
12
The Recreation Opportunity Spectrum (ROS) is a framework now commonly used as the basis for
recreation and open space planning. The basis of ROS is that the varied needs, tastes and preferences of the
community are most likely to be satisfied if a wide range of experiences are provided through a range of
recreational settings (Clarke and Stankey, 1979).
96
III. Objective: Encourage keeping private lands open to the public.
Strategy:
A. Build coalitions between landowners and people who recreate on private lands
(e.g. SPACE, NH Timberland Owners Association, state agencies, trail groups,
etc.).
B. Continue to encourage private landowners to keep their lands open to recreational
uses via Current Use and its 20 percent Recreational Adjustment.
C. Encourage interested landowners to properly post signage on their property based
on acceptable uses (e.g. encourage an organization to provide landowners with
signs that post for specific uses. Often landowners can only find, and therefore
post, generic ‘No Trespassing’ signs though the intent is to only limit a particular
use. Making use-specific signs more readily available will help keep lands from
being posted against all public access. Also encourage participation in the NH
Fish and Game sign program).
D. Better enforcement of laws to support landowners’ rights on lands held in
easement (e.g. regarding hiking, hunting, snowmobiles, ATVs, etc.).
IV. Objective: Promote the use of education and information-based strategies to manage
or avoid conflict.
Strategy:
A. Encourage shared use and cooperation among different recreationists by
incorporating educational messages into maps, guides, and public information
sources (e.g. NH Fish and Game Public Access Sites map, NH Horse Council
brochure, “Share with Care” program, etc.).
B. Support ongoing public education efforts focused on enforcement of existing
recreation-related laws and penalties (e.g. continue mandatory education
programs on boating laws, OHRV laws, hunting laws, etc.).
C. Improve public access to recreational information, especially via the web, to
increase awareness of available recreational opportunities statewide (e.g. examine
the feasibility of placing OEP’s Inventory of Outdoor Recreation Facilities or
Public Water Access sites on the web).
D. Develop a resource directory that provides information about which agencies are
responsible on a statewide level for different recreation programs and
enforcement.
97
V. Objective: Insure that recreational opportunities are available to those with
disabilities.
Strategy:
A. Involve persons with disabilities in the planning of new and/or the rehabilitation
or modification of existing outdoor recreation facilities and programs (e.g. DOT,
Governor’s Commission on Disability, Granite State Independent Living, etc.).
B. Develop a guidebook to outdoor recreation facilities that provides information for
persons with disabilities about accessibility levels.
C. Provide technical assistance and incentives to recreation providers to improve
accessibility of recreational facilities and lands (e.g. U.S. Fish and Wildlife
Service enforcement of ADA accessibility, Governor’s Commission on
Disability).
D. Identify funding sources that can be used to improve accessibility and universal
design (e.g. SAFETEA-LU, LWCF, etc.).
E. Work with partners to support and encourage universal design.
Selected Contacts and Information Resources
New Hampshire Department of Resources and Economic Development –
Division of Parks and Recreation (www.nhparks.state.nh.us/)
New Hampshire Department of Resources and Economic Development – Trails
Bureau (www.nhtrails.org) - also provides links to many trail clubs
Governor’s Commission on Disability (www.state.nh.us/disability/index.html)
Granite State Independent Living (www.gsil.org/)
New Hampshire Department of Transportation – Bicycle/Pedestrian Program
(www.NHBikePed.com/)
New Hampshire Fish and Game Department (www.wildlife.state.nh.us/)
New Hampshire Recreation and Park Association (www.nhrpa.com/)
New Hampshire Office of Energy and Planning (www.nh.gov/oep)
Regional Planning Commissions
(www.nh.gov/oep/resourcelibrary/regions.home.htm)
White Mountain National Forest (www.fs.fed.us/r9/white)
Appalachian Mountain Club (www.outdoors.org/)
US Department of Justice – ADA information
(www.usdoj.gov/crt/ada/adahom1.htm)
New Hampshire Recreation and Park Association (www.nhrpa.com)
98
3. APPLY LIMITED FINANCIAL AND HUMAN RESOURCES TO ADDRESS A
RANGE OF RECREATION NEEDS
Summary
Funding is needed to support a wide range of local and state recreational opportunities.
These needs include facility rehabilitation, new facility development, land acquisition for
both organized (e.g. ball fields) and unorganized recreational opportunities (e.g. open
space for hiking, bird-watching), as well as efforts focused on protecting important
natural and cultural resources.
Funding is needed to support statewide open space and greenway planning efforts.
Enforcement and stewardship costs are often not fully considered when lands are
protected.
Human resources (partnerships, volunteerism), in addition to financial capital, are
fundamental to successful local recreational efforts.
In a 2002 DRED survey of state park managers, rehabilitation and facility
construction were listed as a more pressing funding need than new acquisition.
Funding for natural and cultural resource protection is an important topic
statewide and locally as underscored by the broad-based support for LCHIP,
increased role of local/regional land trusts, and increased emphasis locally on land
protection (open space bonds, local conservation funds).
In the Statewide Outdoor Recreation Needs Assessment completed by the
University of New Hampshire in 1997, survey respondents listed programs and
initiatives aimed at land, water and species protection as higher overall funding
priorities than those related to recreation development.
In this same survey, funding for non-motorized recreation was listed as a higher
priority statewide than funding for motorized recreation or recreation
opportunities that require a high level of development.
The 1997 Statewide Outdoor Recreation Needs Assessment is out of date. A new
survey of recreation consumers should be undertaken to reflect current trends.
Overview
High quality recreation requires an investment of both financial and social capital.
Resources are needed for adequate planning, new acquisitions, ongoing maintenance, or
facility refurbishment, as well as long-term stewardship and enforcement. All of these
are legitimate needs and have merit. However, external grant funds are always limited
and often target only certain needs or priorities. The challenge remains to find ways of
creatively financing recreation in communities and making use of a wide range of
volunteer and non-financial resources that has the potential to be tapped.
99
Federal Funding
LWCF. The Land and Water Conservation Fund (LWCF) Act of 1965 (Public Law 88-
578, 78 Stat 897) was enacted “...to assist in preserving, developing, and assuring
accessibility for all Americans” to outdoor recreation resources. The LWCF program
provides matching grants to states and through the states to local governments for the
acquisition and development of public outdoor recreation areas and facilities. At the
federal level, the National Park Service of the Department of the Interior administers the
program. At the state level, the New Hampshire Department of Resources and Economic
Development (DRED), Office of Recreation Services, administers the LWCF. This
program provides matching grant funding to state parks and communities.
The LWCF represents the major source of federal funding for outdoor recreation and land
acquisition. Enacted by Congress in 1965, the Act contains two components: (1) it is the source
of federal funding for additions of lands to the National Park System, National Forests, Wildlife
Refuges, Trails, Wild and Scenic River systems, and public lands administered by the Bureau of
Land Management (federal side); and (2) it is a source of federal grants to state and local
governments (statewide program) for open space and recreation planning, land acquisition, and
the development of outdoor recreation facilities.
SAFETEA-LU. The Safe, Accountable, Flexible, Efficient, Transportation Equity Act:
A Legacy for Users, signed into law in 2005 is a continuation of the Intermodal Surface
Transportation Efficiency Act of 1991 (ISTEA). Administered federally through the
Federal Highway Administration, SAFETEA-LU continues and improves upon programs
of ISTEA and provides new initiatives aimed at both enhancing communities and the
natural environment.
Several programs within SAFETEA-LU provide funds focused on enhancing recreation
opportunities and/or transportation alternatives. The Transportation Enhancements (TE)
program, administered in New Hampshire by the Department of Transportation, provides
funding to promote alternative transportation and more livable communities. Projects
include a variety of initiatives including sidewalks, multi-use paths, bicycle lanes,
acquisition of rail line, and the renovation and reuse of historic transportation buildings
(depots, etc.).
Examples include a project in Lincoln where 2.5 miles of sidewalk and multi-use path
were constructed along the Kancamagus Highway; a project in Nashua (Manchester
Street) that connected sidewalks from schools to surrounding neighborhoods and
improved safety for pedestrians of all ages, and the acquisition of 43.2 miles of the
Cheshire Branch Railroad corridor in the towns of Fitzwilliam, Troy, Marlborough,
Swanzey, Keene, Surrey, and Walpole.
The Recreational Trails Program, administered in New Hampshire through the Bureau of
Trails in the Department of Resources and Economic Development, provides funding for
motorized, diversified, and non-motorized trails. Projects can focus on new construction,
maintenance and restoration, fee acquisition, or easements for new trail corridors.
100
In order to receive funding, all states must establish a state recreational trails advisory
committee that represents both motorized and non-motorized recreational trail users.
Federal requirements mandate that states administer funds so that 30 percent are used for
motorized use, 30 percent for non-motorized use, and 40 percent are used for diversified
trail uses. The program provides 80 percent of the total project cost and soft match or in-
kind match is allowed. New Hampshire received approximately $844,316 in 2007. Trail
grants range from a minimum of $1,000 to a maximum of $30,000.
The National Scenic Byways Program is coordinated in New Hampshire through the
Scenic and Cultural Byways Program at the Department of Transportation. The New
Hampshire Scenic and Cultural Byways Program was established in 1992 under RSA
238:19,
"... to provide the opportunity for residents and visitors to travel a system
of byways which feature the scenic and cultural qualities of the state
within the existing highway system, promote retention of rural and urban
scenic byways, support the cultural, recreational and historic attributes
along these byways and expose the unique elements of the state's beauty,
culture and history."
New Hampshire has over 1,000 miles of road designated as Scenic Byways, including the
White Mountain Trail/Kancamagus National Byways and a bi-state national byway (with
Vermont), the Connecticut River Byway. Designation to this national or statewide
network makes a byway eligible for federal SAFETEA-LU funds that provide funding to
byways for projects such as upgrading bicycle or pedestrian facilities, protecting byway
resources, or developing promotional material. Sample projects in New Hampshire
include byway gateway centers in North Conway and Lincoln, a corridor management
and promotion project for the Connecticut River Byway, and the production of byway
maps and brochures.
Forest Legacy. The Forest Legacy Program is administered through the USDA Forest
Service in cooperation with State Foresters. The DRED - Division of Forests and Lands
is the main contact in New Hampshire. The program protects important working
forestlands threatened by conversion to non-forest uses by purchasing rights to restrict
development of the land, or through outright purchase from willing sellers.
Forest Legacy funds have been leveraged with other funds and contributions to protect
large tracts of working forest land in the state, including the 141,400 acre Connecticut
Lakes Headwaters easement and the 10,000 + acre Pond of Safety lands in Randolph.
This program continues to play an important role in funding the protection of working
forestlands and un-fragmented open space in New Hampshire.
New Hampshire Coastal Program. The New Hampshire Coastal Program is
administered through the Department of Environmental Services. The program’s stated
mission is to “balance the preservation of natural resources of the coast with the social
and economic needs of this and succeeding generations.” Providing for public access to
coastal lands and waters is listed as one of five major goals of the program.
101
Technical assistance grants are available to the Rockingham Planning Commission and
the Strafford Regional Planning Commission to provide assistance to the 17 coastal
communities in planning efforts such as master plan updates, local development
ordinances, and open space plans. Competitive grants are also available to coastal
communities for resource planning and management, education and outreach, and small
construction projects or land acquisition. One recreation-related example includes a
$50,000 grant to the town of Hampton Falls. Grant funds were used to acquire a 14-acre
wooded lot that abuts the Taylor River Salt Marsh and is adjacent to another large
conservation parcel known as the Marsh Lane Conservation Preserve. The new lot will
expand the preserve and offer passive recreation such as hiking, picnicking, snowshoeing
and cross-country skiing.
New Hampshire Estuaries Project. The New Hampshire Estuaries Project, also
administered through the University of New Hampshire, is a joint local/state/federal
program established under the Clean Water Act. The main goal is the protection and
enhancement of estuarine resources identified to be of national significance by
formulating and implementing a realistic management plan for the area. Grants are
focused on implementing high priority aspects of the management plan, a number of
which deal with open space and shore land protection efforts. These grants are available
to municipalities, local community groups, environmental/watershed associations, non-
profit organizations, schools and educational institutions, county conservation districts,
and regional planning commissions within the coastal watershed.
State Funding
Land and Community Heritage Investment Program (LCHIP). The stated intent of
the program is to:
“…conserve and preserve this state’s most important natural, cultural, and
historical resources, through the acquisition of lands, and cultural and
historical resources, or interests therein, of local, regional and statewide
significance, in partnership with the state’s municipalities and the private
sector, for the primary purposes of protecting and ensuring the perpetual
contribution of these resources to the state’s economy, environment, and
overall quality of life”.
LCHIP was instituted in May 2000, (RSA 227-M) establishing a competitive grants
program that provides a 50/50 match to communities and non-profit organizations for
natural, cultural and historic resource protection. The legislature has appropriated
$24.5 million to date. LCHIP has awarded all the appropriated funds to 150 projects
throughout the state. Project examples include a grant to the town of Merrimack to
support the acquisition of 544 acres of open space, one of the last remaining open space
areas in town, and a grant to the town of Boscawen to rehabilitate and restore the 1866
Penacook Academy.
Moose Plate. The New Hampshire General Court, under RSA 261:97-c, established the
Conservation License Plate Program, also know as the Moose Plate Program, in 1998.
The purpose of this volunteer program is to enhance existing conservation and
102
preservation efforts via the sale of special license plates. Revenues are used by state
agencies for the following purposes:
Preserve or purchase significant publicly owned historic properties,
archaeological sites, artifacts or articles.
Research and manage non-game wildlife species as well as native plant species.
Efforts also focus on public education relative to these species.
Grants for county, municipal or non-profit conservation projects.
Expand the roadside wildflower program.
Assist in administering the Land and Community Heritage Investment Program
(LCHIP).
Beyond providing critical funding needed to administer LCHIP, a portion of the license
plate receipts is used for a small grants program. The Conservation License Plate Grants
Program utilizes a portion of the conservation license plate funds for local and regional
conservation projects. Funds are available for resource conservation, education and
outreach, and improvements to conservation areas. Applicants are pooled into one of two
categories. The first category grants awards to communities, conservation related non-
profits, and schools. The second grants awards to conservation districts and county
extension offices.
In 2002, the State Conservation Committee through the Rockingham County
Conservation District awarded its first allocation of funding from the conservation license
plate program. In all, about $90,000 worth of grants were awarded in 2002. The
Committee estimates approximately $150,000 may be awarded in 2008. Eligible projects
vary widely and reflect a broad range of conservation-related initiatives. While some
projects focus strictly on resource protection efforts, others relate to enhancing low
impact recreation opportunities on conserved lands. Two specific projects funded in
2006 include developing a public water access and resource guide to a watershed in
southeastern New Hampshire, and a trail/boardwalk design and construction project on
school property. Grants tend to be small and focus on specific conservation projects that
improve conservation land management or enhance conservation education rather than
provide direct funding for land or easement purchases.
DRED also uses Moose Plate funds for recreation-related projects. An existing project is
a series of “Visiting New Hampshire’s Biodiversity” interpretive trail guides. This series
of guides interprets places where people can view unusual and high-quality natural plant
communities. Brochures are developed in collaboration with willing landowners. Sites
are chosen that have facilities such as parking and trails, allowing people an easy way of
experiencing the state’s diverse and unusual natural habitats. They are available for free
download at the Natural Heritage Bureau’s website
(www.nh.gov/dred/divisions/forestlands/bureaus/naturalheritage).
Grant-in-Aid Program. The Bureau of Trails, under DRED, administers a grant-in-aid
program to provide assistance to organized, non-profit off highway recreational vehicle
(OHRV) clubs and municipalities. The stated purpose of this program is to encourage

103
development, maintenance, construction, grooming, and safety of OHRV trails in the
State of New Hampshire. Monies may be used for the development and maintenance of
OHRV trails on private, state, federal, and municipal lands. Grant-in-Aid funding for
major trail construction and maintenance requires written landowner permission.
Local Funding
Parks, recreational facilities, and open space are important components of retaining
community character, promoting health and wellness, and making a community livable.
Communities have many tools available to help finance parks and open space, beyond
external grant funds. The few discussed in more detail below are offered as options, or
potential strategies, to be considered.
Capital Reserve Funds. Authorized under RSA 35, Capital Reserve Funds can be used
to help communities to appropriate money for construction, reconstruction, or acquisition
of capital improvements related to recreation or equipment.
Recreation Revolving Loan Funds. Authorized under RSA 35-B:2 II, Recreation
Revolving Loan Funds allow communities to charge fees for recreation services and
facilities, with all generated revenue then deposited into a special non-lapsing fund. The
revolving loan fund must be established by the municipality’s legislative body but can be
expended by the recreation commission or other designated board without further
approval.
Impact Fees. Impact fees, authorized under RSA 674:21,V, allow communities to assess
fees on new developments and construction to help cover the costs associated with this
new growth (this includes the development of public recreational facilities). The fee
must be directly proportional to the capital improvement needs related to the new growth.
Fees cannot be charged to correct existing deficiencies. Refer to OEP’s on-line reference
library for additional information about impact fees:
http://www.nh.gov/oep/resourcelibrary/referencelibrary/SubjectListing.htm.
Open Space Bonds. Open space bonds are receiving increased attention among New
Hampshire communities, particularly the southern tier. In areas of fast growth, land
protection efforts are often outpaced by development. When a tract of open space goes
on the market, the local conservation commission does not always have the resources or
the time to purchase the land or an easement outright. This is compounded by the fact
that many landowners, who might be willing sellers and interested in conservation, do not
have the luxury of waiting until the next Town Meeting to see whether the town can
purchase the property.
Open space bonds can help to bridge this time gap by providing substantial, and more
readily available, funds for pressing land conservation efforts. In 2007, several towns
passed open space bonds. Gilford passed a bond in the amount of $990,000 to purchase
an easement on the Bean property; Hinsdale, $60,000 for acquisition of a
conservation/park property; and Kensington, $1,163,000, for an easement on Kimball
Farm. Every year there are a few communities that pass similar bonds. The sums are
impressive and mark a new chapter in local land conservation efforts. While land
protection efforts have many goals in mind beyond recreation, traditional recreational
104
activities (hiking, cross-country skiing, hunting, fishing, etc.) are often preserved along
with the land itself. Conservation of open space is central to many popular outdoor
recreation pursuits.
Land Use Change Tax – Conservation Fund. Under RSA 79-A communities can elect,
by majority vote, to place a percentage or all of land use change tax monies into a
conservation fund in accordance with RSA 36-A:5, III. Currently, about half of New
Hampshire communities have tapped into this funding option. The land use change tax is
applied when lands enrolled in Current Use opt out of the program. Some communities
cap the percentage or total dollar value that can be added to the local conservation fund;
others dedicate 100 percent of these local land use change penalties to conservation.
Human Resources. A great deal can be done with limited funds if in-kind human
resources can be organized to make a project happen. For example, Volunteer Friends of
Recreation groups can be helpful to local recreation departments or commissions in
fundraising efforts and in providing local recreation programs. These groups operate
independent of town government and have more flexibility to initiate programs or special
events and raise money for special recreation facilities or projects. These “friends of”
groups are also important for state parks. According to DRED’s 2002 state park
managers survey, about 50 percent of state parks have a friends group or other volunteers
associated with the park such as snowmobile clubs, Boy Scouts, and garden clubs.
Volunteer action and public/private partnerships are central in making local and statewide
conservation goals a reality. Local land protection efforts are often based upon
partnerships between local land trusts, local residents, community groups, and elected
officials alike. Beyond making good practical sense by building upon individual
strengths, these partnerships are often attractive to external funding agencies/entities (e.g.
LCHIP, LWCF). Many grant programs look for local collaborative efforts and
partnerships as a sign of community commitment. Partnership and broad based support
increase the likelihood that a project will be successful over the long term and will be
money well spent.
This also rings true for larger-scale statewide efforts. The Connecticut Lakes Headwaters
project reflects an effort that involves the collaboration of state agencies, legislators, the
Governor’s office, local communities, and a variety of private non-profit organizations.
This impressive project protects 171,500 acres of land in the northern reaches of the state.
These lands protect habitat for 67 rare species, protect large tracts of working forest, and
protect opportunities for outdoor recreation. The state purchased an easement on 146,400
acres of land to be owned and managed by a timber company. The state also purchased
25,000 acres of the most sensitive habitat to be set aside as a natural area. The Nature
Conservancy holds an easement on these lands. Finally, the remaining 100 acres has
been added to the state-run Deer Mountain Campground to expand recreational facilities.
The success of this project is credited to both public and private efforts. Substantial
public funds were secured through state and federal sources. Private fundraising raised
money to complete the project and fund endowments. The Nature Conservancy, SPNHF,
and the Trust for Public Lands jointly spearheaded this campaign. Private foundations,
major donors, and supporters all contributed to this effort.
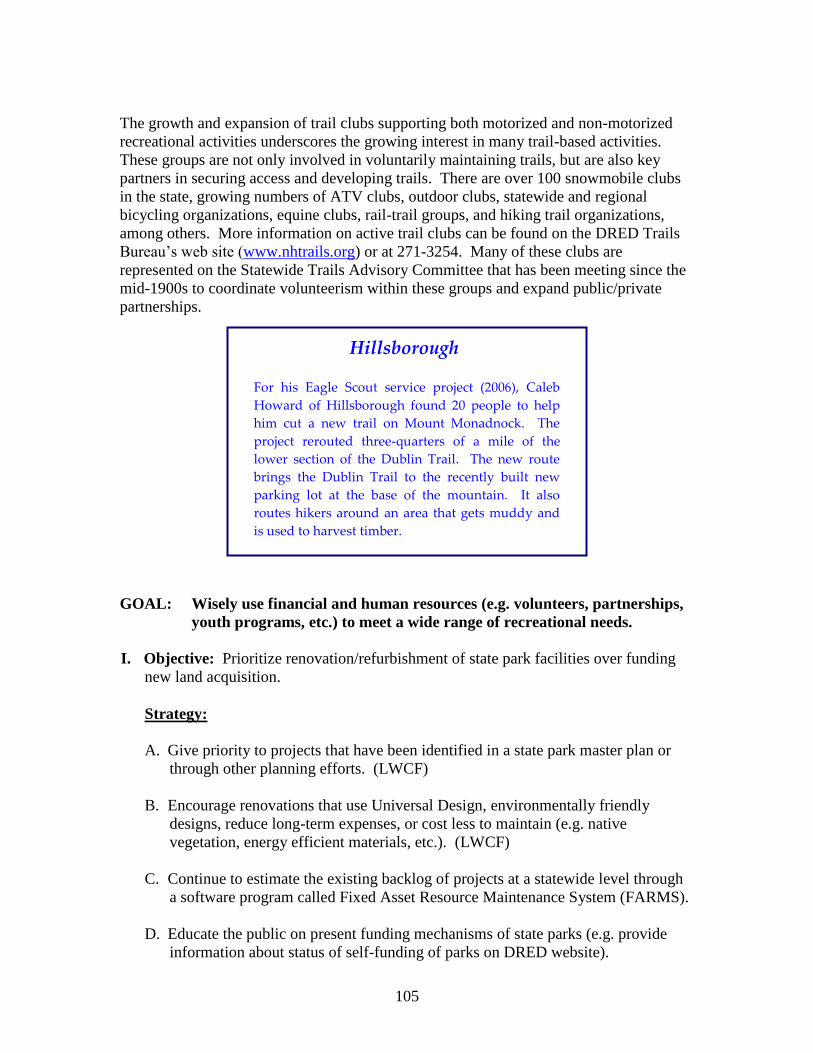
105
The growth and expansion of trail clubs supporting both motorized and non-motorized
recreational activities underscores the growing interest in many trail-based activities.
These groups are not only involved in voluntarily maintaining trails, but are also key
partners in securing access and developing trails. There are over 100 snowmobile clubs
in the state, growing numbers of ATV clubs, outdoor clubs, statewide and regional
bicycling organizations, equine clubs, rail-trail groups, and hiking trail organizations,
among others. More information on active trail clubs can be found on the DRED Trails
Bureau’s web site (www.nhtrails.org) or at 271-3254. Many of these clubs are
represented on the Statewide Trails Advisory Committee that has been meeting since the
mid-1900s to coordinate volunteerism within these groups and expand public/private
partnerships.
Hillsborough For his Eagle Scout service project (2006), Caleb
Howard of Hillsborough found 20 people to help
him cut a new trail on Mount Monadnock. The
project rerouted three-quarters of a mile of the
lower section of the Dublin Trail. The new route
brings the Dublin Trail to the recently built new
parking lot at the base of the mountain. It also
routes hikers around an area that gets muddy and
is used to harvest timber.
GOAL: Wisely use financial and human resources (e.g. volunteers, partnerships,
youth programs, etc.) to meet a wide range of recreational needs.
I. Objective: Prioritize renovation/refurbishment of state park facilities over funding
new land acquisition.
Strategy:
A. Give priority to projects that have been identified in a state park master plan or
through other planning efforts. (LWCF)
B. Encourage renovations that use Universal Design, environmentally friendly
designs, reduce long-term expenses, or cost less to maintain (e.g. native
vegetation, energy efficient materials, etc.). (LWCF)
C. Continue to estimate the existing backlog of projects at a statewide level through
a software program called Fixed Asset Resource Maintenance System (FARMS).
D. Educate the public on present funding mechanisms of state parks (e.g. provide
information about status of self-funding of parks on DRED website).
106
II. Objective: Continue to provide renovation/refurbishment funding to improve local
land and water based recreational facilities/areas.
Strategy:
A. Give priority to projects that have an operations and maintenance plan and have
shown sound stewardship on existing facilities. (LWCF)
B. Give priority to projects that use Universal Design, environmentally friendly
designs, reduce long-term expenses, or cost less to maintain (e.g. native
vegetation, energy efficient materials, etc.). (LWCF)
III. Objective: Continue to provide acquisition funding to support new local land and
water based recreational lands/facilities.
Strategy:
A. Give priority to projects that have been specifically identified in local or regional
plans. (LWCF)
B. Continue to give priority to communities that have had less benefit from LWCF
funding in the past. (LWCF)
C. Give priority to projects that use Universal Design, environmentally friendly
designs, reduce long-term expenses, or cost less to maintain (e.g. native
vegetation, energy efficient materials, etc.). (LWCF)
D. Give priority to projects that consider stewardship costs in new projects and
initiatives. (LWCF)
E. Consider methods of giving priority to projects with a higher level of use, even in
low population areas (e.g. OEP will consider possible methods and provide
suggestions to DRED and the OPSP Advisory Panel for review). (LWCF)
IV. Objective: Encourage leaders to support financing and implementation of local,
regional, and statewide plans for open space, recreation trails, and greenways.
Strategy:
A. Educate the public about the benefits of open space, recreation trails, and
greenways (e.g. Dollars and Sense of Open Space, economic impacts of trails in
communities, etc.).
B. Investigate expanding efforts of the Regional Environmental Planning Program
(REPP) through the Regional Planning Commissions.
C. Encourage local and state public/private financing of these efforts (e.g. LCHIP,
etc.).
107
D. Encourage the adoption and increased support for the development of designated
river corridor and watershed management plans (Rivers Management and
Protection Program, RSA 483:8-a, III(c)).
V. Objective: Promote the importance of collaboration and volunteerism in developing
and maintaining local recreation projects.
Strategy:
A. Give priority to projects that show local partnerships and commitment to not only
developing but also maintaining land and water-based recreational facilities.
(LWCF)
B. Promote volunteerism with school-aged youth in communities (e.g. Boys and
Girls Clubs, Americorps, Scouts, university interns, Vista volunteer programs,
etc.).
VI. Objective: Work on implementing dedicated user fees for other recreational uses
such as non-motorized trail funds.
Strategy:
A. Educate the public and recreational users about possible benefits of user fee
programs and about how money generated from fee programs would be used (e.g.
proper fund management would mean that money would go towards supporting
the specific recreational use).
B. Review successful programs from other states.
Selected Contacts and Information Resources
NH Department of Resources and Economic Development – Division of Parks
and Recreation (www.nhparks.state.nh.us/)
NH Department of Resources and Economic Development - Division of Forests
and Lands (www.nhdfl.org/)
New Hampshire Fish and Game Department (www.wildlife.state.nh.us/)
The New Hampshire Association of Conservation Commissions
(www.nhacc.org/nhacc.htm)
New Hampshire Department of Transportation – TE Program
(www.state.nh.us/dot/municipalhighways/tehome.htm)
New Hampshire Department of Environmental Services (www.des.state.nh.us/)
New Hampshire Office of Energy and Planning (www.nh.gov/oep)
New Hampshire Charitable Foundation (www.nhcf.org/)
Volunteer NH (www.volunteernh.org)
Appalachian Mountain Club (www.outdoors.org)
New Hampshire Recreation and Park Association (www.nhrpa.com)
Bureau of Trails (www.nhtrails.org)
108
4. EDUCATION OF RECREATIONAL USERS, MUNICIPALITIES AND
LANDOWNERS ABOUT RESPONSIBLE BEHAVIOR, LAWS, AND LIABILITY
Summary
Private landowners fear liability when opening up lands to recreational use.
Communities do not fully understand their liability or rights in providing
recreational opportunities.
Users are not fully aware of their impacts on the environment or on other users.
Users and providers do not always fully understand existing laws.
Education should be an important part of early efforts to manage conflict and
concerns about overuse/crowding.
Forty-four percent of respondents in the 1997 Statewide Outdoor Recreation
Needs Assessment completed by the University of New Hampshire said that
enforcement of environmental laws should be a high funding priority in the state.
Overview
Outdoor recreation management brings with it a range of education and information
needs. Some information needs are focused on educating the recreational user while
others are aimed at the recreation provider. As participation across a widening set of
activities continues to rise, recreation-related education and information will become an
increasingly important tool.
Information and education can target many different needs and be either voluntary or
legally mandatory. They include but are not limited to:
Disseminating information about recreational opportunities that are available
across different parts of the state;
Providing information about outdoor ethics and responsible behavior;
Building existing skills or teaching new skills;
Informing landowners about current laws and their liability in allowing public
access; and
Informing municipalities about their rights and responsibilities regarding public
recreational use.
Pressure on the existing resource base can potentially result in more user conflict as more
people compete for the same recreational resources. Education can help stave off
potential conflicts and mitigate existing problems as they arise.
Resource managers are faced with the simultaneous tasks of maintaining user safety,
protecting natural resources, and providing high-quality experiences. Heightened public
use, as well as expansion of types of use, can present many challenges, especially along
trails. This can be especially prevalent in areas that appeal to a broad range of motorized
and non-motorized uses. Often problems arise when participation in one activity distracts
from another’s ability to participate in, or enjoy, a different activity.
109
Examples might include crowding or perceived overuse among hikers on a hiking trail or
problems with motorized and non-motorized boats using the same lake and access area.
Of course, determining when something becomes a problem can be subjective. Not
everyone holds the same standard for determining when an area is ‘too’ crowded or when
they feel there are too many ‘incompatible’ uses in an area. There are often no singularly
right or wrong perspectives. Recreational providers must balance different perspectives
with the more essential need to maintain safety, maintain quality recreational
experiences, and protect the resources upon which these activities depend. Using an
opportunity spectrum-type analysis can assist federal, state and local authorities in
assessing the appropriate location of facilities.
A 1994 report from the Federal Highway Administration, Conflicts of Multiple Use
Trails,13
examined the known research and state of practice on managing multiple use
trails. This report provides rules of practice for multiple-use trail opportunities as well as
suggestions for minimizing conflicts. When exploring options for managing conflicts,
the rule of thumb is to start small. Signage, peer pressure and education are all preferable
to automatically placing limits on use or erecting barriers.
New Hampshire Conditions and Trends
Recreation-based education and information programs are sponsored by public agencies
and private organizations alike. Many programs are undertaken through partnerships that
connect the strengths of different entities (e.g. snowmobile clubs and Fish and Game
Department). State law mandates participation in a number of recreation-based education
programs. These include boater education, hunting education, and youth OHRV
education.
Boater Education. As of January 1, 2002, the State of New Hampshire requires that
anyone 16 years or older have a valid safe boating certificate before they operate a power
boat on public waters with an engine in excess of 25 horsepower. There is a sliding scale
for compliance until 2008 that is based on year of birth. For instance, those born between
1977 and 1987 had to comply by 2003. Those born before 1957 must comply by 2008.
The boating safety course is a one-time requirement and, once certified, there is no
requirement to take the course again. Courses are available through the NH Department
of Safety, U.S. Power Squadrons, and U.S. Coast Guard Auxiliary. Courses are also
available in all 50 states, on-line (www.boat-ed.com/nh/nh_internet.htm), and as a home
study course.
Hunting Education. Mandatory hunter education classes are taught through the New
Hampshire Fish and Game Department. State law requires that the first time a person
plans to buy a basic hunting license, archery hunting license, or trapping license, they
must first complete the respective hunter, bow-hunter, or trapper education course.
The most widely offered program, Fish and Game's Basic Hunter Education Course, is
taught by trained, certified volunteer instructors and the local conservation officer.
13
Federal Highway Administration, Conflicts of Multiple Use Trails (1994) remains the most
comprehensive overview of the subject. Other publications deal with specific conflicts such as bicycles
and traffic, etc.
110
The course contains both classroom instruction and field experiences. Topics include
safety, hunter ethics and responsibility, outdoor safety and survival skills, and New
Hampshire hunting laws and regulations.
OHRV Registrations. Off-highway motorized vehicle safety classes are required for all
persons over the age of 12 who do not have a valid drivers license. An adult with a valid
drivers license must accompany children under the age of 14. OHRV Safety Education
Classes have proven useful in minimizing accidents on problem trails, even as the sport
increases in popularity. Accident rates for youth have remained stable in the last six
years even as the number of youth registrations has increased. As a comparison, accident
numbers among older users (e.g. 20-29 and 30-39 year olds) increased with registration
numbers. Between 2,200 and 2,500 children complete the safety course each year.
Resident snowmobile registrations have remained relatively stable. Non-resident
snowmobile registrations had shown a steady increase, from 8,824 in 1995/1996 to
20,880 in 2002/2003, but dropped down to 13,567 in 2005/2006. Wheeled vehicle
registration had also shown substantial increase since the mid 1990’s. In 1995/1996 there
were 10,556 in-state wheeled vehicle registrations; in 2005/2006 there were 21,462
registrations. Out-of-state registrations have shown a marked increase as well. New
Hampshire reported 1,362 out-of-state registrations in 1995/1996 and 4,771 in
2005/2006. As the popularity of motorized recreation increases, so will the demand for
trails and riding opportunities. This increased use continues to require attention to
enforcement and education efforts.
Partnerships. Public/private partnerships between state agencies and trail organizations
remain crucial in promoting responsible use and managing impacts of use. One existing
partnership is with the New Hampshire Snowmobile Association (NHSA) and its
network of 115 clubs. Individual clubs work to develop positive relationships with
private landowners by doing trail maintenance, policing trails, implementing “Carry In,
Carry Out” trash policies, and posting trails on private lands as landowners request. The
NHSA also works with the New Hampshire Fish and Game Department to conduct youth
safety courses and champion “Zero Tolerance for Alcohol” policies.
As pressures on existing trails, recreational areas and lands increase, managers should
also increase educational efforts that focus on responsible behavior and user ethics or
etiquette. Recreationists and recreational groups are important partners in this effort.
The Statewide Trails Advisory Committee encourages independent peer-education efforts
as well as promoting public/private partnerships to promote responsible use. Some
groups already undertake peer education efforts individually. For instance, the New
Hampshire Horse Council publishes a brochure aimed at educating fellow trail riders
about safety, trail etiquette, and personal responsibility, and the New Hampshire Mushers
Association has adopted the NHMA Trail Safety Guidelines & Trail Etiquette.
Promotional efforts to educate the public about different recreational opportunities should
be undertaken in conjunction with efforts to develop awareness of possible impacts of
these uses. The New Hampshire Fish and Game Department, for example, publishes a
map and guide to public water access sites in New Hampshire. In addition to providing
specific information about access sites, including level of accessibility, the map also
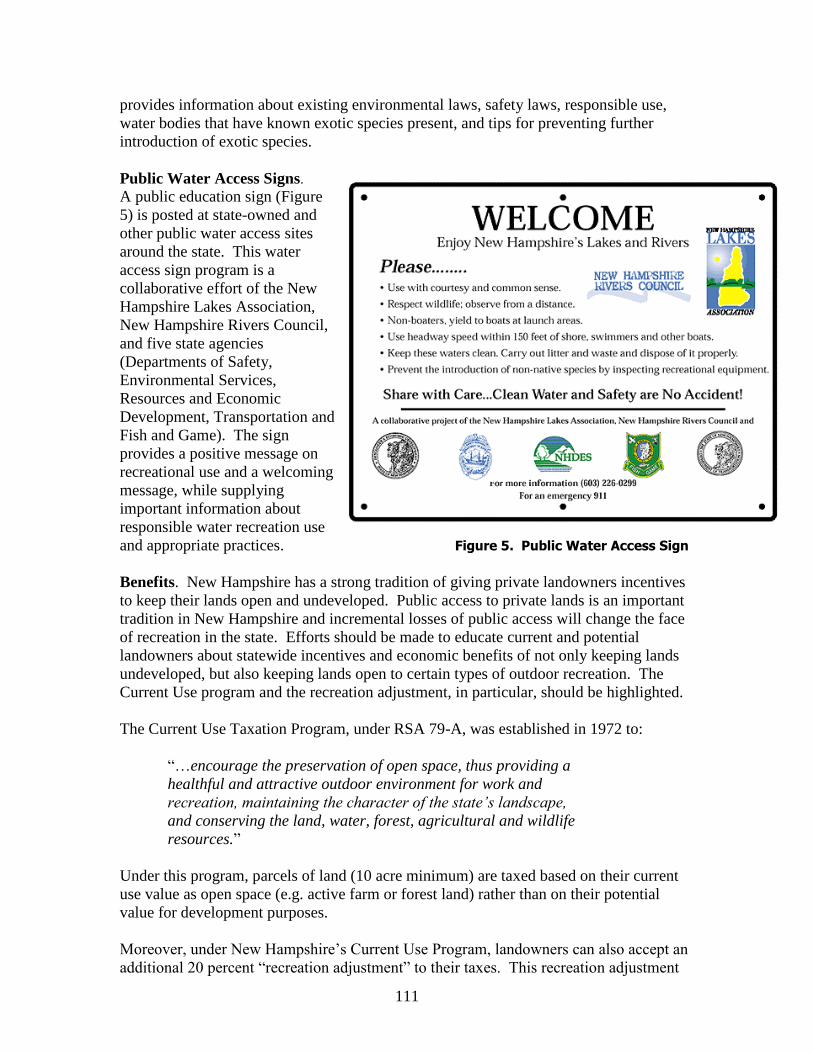
111
provides information about existing environmental laws, safety laws, responsible use,
water bodies that have known exotic species present, and tips for preventing further
introduction of exotic species.
Public Water Access Signs.
A public education sign (Figure
5) is posted at state-owned and
other public water access sites
around the state. This water
access sign program is a
collaborative effort of the New
Hampshire Lakes Association,
New Hampshire Rivers Council,
and five state agencies
(Departments of Safety,
Environmental Services,
Resources and Economic
Development, Transportation and
Fish and Game). The sign
provides a positive message on
recreational use and a welcoming
message, while supplying
important information about
responsible water recreation use
and appropriate practices. Figure 5. Public Water Access Sign
Benefits. New Hampshire has a strong tradition of giving private landowners incentives
to keep their lands open and undeveloped. Public access to private lands is an important
tradition in New Hampshire and incremental losses of public access will change the face
of recreation in the state. Efforts should be made to educate current and potential
landowners about statewide incentives and economic benefits of not only keeping lands
undeveloped, but also keeping lands open to certain types of outdoor recreation. The
Current Use program and the recreation adjustment, in particular, should be highlighted.
The Current Use Taxation Program, under RSA 79-A, was established in 1972 to:
“…encourage the preservation of open space, thus providing a
healthful and attractive outdoor environment for work and
recreation, maintaining the character of the state’s landscape,
and conserving the land, water, forest, agricultural and wildlife
resources.”
Under this program, parcels of land (10 acre minimum) are taxed based on their current
use value as open space (e.g. active farm or forest land) rather than on their potential
value for development purposes.
Moreover, under New Hampshire’s Current Use Program, landowners can also accept an
additional 20 percent “recreation adjustment” to their taxes. This recreation adjustment
112
lowers a landowner’s tax burden by an additional 20 percent if the land is kept open to
the public for traditional forms of recreation. As defined by RSA 79-A:4,II, the six
traditional forms of recreation consist of skiing, snowshoeing, fishing, hunting, hiking,
and nature observation year-round unless these activities are detrimental to crops on
agricultural lands or active forestry operations.
Liability. While it is important to educate landowners about the benefits of keeping
lands open to the public, it is also important to educate landowners about their liability in
allowing public use. Liability is of concern to both private landowners and municipal
providers, and landowners are not always aware of their protections under state law.
Moreover, information on this topic is not always easy to find.
In New Hampshire, private landowners have liability protection based on a number of
state laws (RSA 215A:34, RSA 212:34, RSA 508:14). Specifically, RSA 215A:34 states
that landowners are not required to post their property against OHRV use. Therefore, if a
parcel of land is not posted it does not mean that OHRVs are allowed as a matter of
course. Riders must have landowner permission. This statute also states that riders
recognize that motorized recreational use may have higher levels of risk and as such they
accept that risk and shall not hold landowners responsible for injuries they may receive
on their lands. RSA 212:34 or ‘Duty of Care’ states that landowners are not responsible
for keeping their land safe for use by others who may use it for recreational purposes
such as hunting, fishing, hiking or operating OHRVs. Finally, RSA 508:14 limits the
liability of landowners. This law states that landowners who do not charge for the
recreational use of their property shall not be liable for unintentional personal injury or
property damage. Beyond these legislative protections, the Department of Resources and
Economic Development - Bureau of Trails, through the use of OHRV fees, supports a
landowner liability insurance policy for those landowners who sign OHRV trail
agreements.
These protections are important and should be communicated widely in the state, given
the substantial acreage privately held but open to the public for low impact uses. In 2005,
about 51.3 percent of lands under Current Use claimed the additional 20 percent tax
dedication by allowing traditional recreational uses. This is up from 39 percent in 2001.
Given the importance of privately held lands to recreation in this state, it is important that
education programs continue to build knowledge and awareness of liability among
landowners and recreationists.
Communities can regulate the use of OHRVs on town-owned property under RSA 41:11-
a. This statute allows the selectmen to manage or regulate the use of town-owned
property, including recreational or conservation lands, and can, therefore, decide upon
allowed or restricted uses on these lands. Another statute, RSA 215-A:6, prohibits
OHRV operation on any portion of the right-of-way on public roads, including traveled
sections of maintained roads unless specifically permitted. RSA 215-A:15 allows
municipalities to regulate OHRV use via local ordinances as long as they are in line with
all provisions of RSA 215-A. This information is provided only as a general reference
point. Refer to the statutes themselves for specific guidance.
113
GOAL: Improve and increase educational opportunities and outreach
targeted to all recreation providers and all recreational users.
I. Objective: Educate landowners about the benefits of leaving lands open to the
public and the liability protections provided by existing laws.
Strategy:
A. Produce and promote a standard statewide brochure about landowner rights
and liability protection that would be made available through multiple
agencies and organizations (e.g. involve Attorney General’s office, state
agencies, non-profit organizations).
B. Target messages to a diverse audience (e.g. realtors, outdoor recreation clubs,
condo associations, etc.).
C. Hold a statewide symposium to promote benefits of keeping private lands
open to the public and build awareness of existing liability protection.
II. Objective: Educate municipalities on their liability issues and their municipal
rights and obligations related to recreational use.
Strategy:
A. Work with the municipal insurance providers to develop a municipal
workshop explaining legal rights related to recreational use and municipal
liability (e.g. municipal law lecture series, NHACC annual meeting, New
Hampshire Local Government Center).
B. OEP should update the local guide to recreation financing and include
legislative information about liability and recreational use.
III. Objective: Expand education programs aimed at recreationists targeting
responsible behavior, environmental ethics, and knowledge of existing laws and
penalties.
Strategy:
A. Establish a statewide clearinghouse of recreation-based education
information and utilize a variety of media and methods to disseminate
information (e.g. TV, radio, point of sale, brochures, water access sites, trail-
head information, Institute for NH Studies, Center for the Environment, UNH
Cooperative Extension, Northern Forest Center, Statewide Trails Advisory
Committee, etc.).
B. Encourage local recreation and conservation groups to play a leadership role
in presenting education programs (e.g. lakes associations, trail groups, land
trusts).
114
C. Increase use of existing campaigns/programs such as Tread Lightly, Leave No
Trace, Carry In/Carry Out (e.g. target retailers as well as recreation and
conservation groups).
D. Incorporate responsible use messages into school and youth programs (e.g.
involve service organizations such as Rotary and Lions Clubs to help deliver
messages to Boy/Girl Scouts and other youth groups).
E. Build capacity of outdoor recreational organizations to provide peer
education.
IV. Objective: Minimize the need for enforcement and use restrictions by
promoting education-based strategies.
Strategy:
A. Address user conflicts and safety issues through education and outreach
efforts focused on responsible use (e.g. New Hampshire Snowmobile
Association, AMC, White Mountain National Forest, etc.).
B. Involve stakeholders in discussions about use concerns and potential conflicts
early on in the process.
C. Encourage outdoor recreation and conservation organizations to conduct
monitoring, volunteer patrols, trail watches (e.g. lakes associations, OHRV
clubs, Upper Valley Trails Alliance, etc.).
Selected Contacts and Information Resources
Appalachian Mountain Club (www.outdoors.org)
NH Department of Resources and Economic Development – Trails Bureau
(www.nhtrails.org) - also provides links to many trail clubs
New Hampshire Department of Environmental Services
(www.des.state.nh.us/)
New Hampshire Fish and Game Department (www.wildlife.state.nh.us/)
New Hampshire Department of Safety (www.nh.gov/safety/)
New Hampshire Office of Energy and Planning (www.nh.gov/oep/)
Volunteer NH (www.volunteernh.org/)
New Hampshire Charitable Foundation (www.nhcf.org/)
New Hampshire Lakes Association (www.nhlakes.org/)
New Hampshire Local Government Center (www.nhlgc.org)
University of New Hampshire Cooperative Extension
(http://extension.unh.edu/)
New Hampshire Recreation and Park Association (www.nhrpa.com)
UNH Cooperative Extension (www.extension.unh.edu)
115
5. IMPACTS OF EXISTING LAND USE PATTERNS ON RECREATIONAL
OPPORTUNITIES
Summary
Sprawl promotes automobile use and decreases the amount of available open
space in communities.
Our existing car-based society negatively impacts efforts to promote close-to-
home or neighborhood recreation opportunities.
Current land use development patterns negatively impact local and regional
opportunities for trails and recreation corridors.
Respondents in the Statewide Outdoor Recreation Needs Assessment (UNH,
1997) said that about 50 percent of their outdoor recreational activity takes place
within 10 miles of home.
Seventy-one (71) percent of respondents in this same 1997 statewide survey
agreed or strongly agreed that continued commercial development represents a
serious threat to New Hampshire’s natural and cultural resources.
In 2003, eight New Hampshire communities were considered urban. It is
estimated that by 2025, 12 communities will be considered urban and rural New
Hampshire will be restricted to the North Country with isolated pockets in the
west (SPNHF, New Hampshire’s Changing Landscape, 2005).
Recreation corridors can also serve as alternative transportation corridors.
Nationwide Smart Growth initiatives and an OEP report called Achieving Smart
Growth in New Hampshire provide principles and tools aimed at improving how
our communities develop and grow “smarter.”
An important part of growing smarter includes preserving open space and parks,
creating networks of trails and greenways that link community resources, and
promoting bicycle/pedestrian-friendly communities. All of these goals have a
positive effect on local recreational opportunities and have solid links to
transportation, health and land use planning goals.
Overview
State governments and communities across the country recognize potential pitfalls of
unmanaged growth and are searching for strategies to grow “smarter.” Sprawl and
unmanaged growth conjure up images of sprawling suburban development, loss of open
space, and the deterioration of community character. While there is no concise, single
definition of sprawl, OEP’s Report to Governor Shaheen on Sprawl (1999) discusses
sprawl as representing patterns of development when more and more land is consumed
for various human activities, when the places where we conduct activities are farther
apart and homogeneous rather than mixed-use groupings, and when we rely on
automobiles to connect us to those places (“Sprawl Report,” pg. 4).
In relation to recreation, increased dependence on the automobile and loss of open space
negatively impact both the quantity and quality of local outdoor recreation opportunities.
116
Under this type of scenario, walking or biking to a local park or store is replaced by
driving to a park, school, or office on the outskirts of town. Where once stood a large
tract of un-fragmented forestland available for hiking and cross-country skiing, now
stands a new subdivision or shopping plaza. Parks, open space, trails and greenways are
important community resources and an important part of making a community livable.
Greenways connect people, communities and countrysides; provide for hiking, strolling,
biking, picnicking and other recreational activities; provide important open space
resources; link important cultural and historic sites; provide alternative transportation
routes; soften urban and suburban landscapes; improve water quality by buffering
streams and trapping pollutants; reduce flood damage and costs related to damage; and
provide close-to-home access to a greater proportion of the population than traditional
parks, improving the overall quality of life (The Virginia Greenways and Trails Toolbox,
2000).
A wide range of federal and state agencies and organizations, including the National
Recreation and Park Association (NRPA), support concepts of “smart growth”. While
not every organization shares a single definition, there are many common threads. Some
overriding themes include encouraging a mix of land uses, protecting the environment
and open space, community involvement in development decisions, providing a variety
of transportation options, and fostering distinctive communities.
Ultimately, smart growth efforts offer choices that can help communities grow and
develop wisely. Not every tool will fit every community and there is no single solution
for growing smarter. Likewise, there is no single set of standards or sole prescription that
will improve outdoor recreation in local communities. Communities must consider local
needs and community character when making land use, transportation and recreation-
related decisions.
New Hampshire Conditions and Trends
There are several smart growth efforts underway, specifically in New Hampshire, which
add increased meaning to these concepts. OEP conducted a study in 2000 entitled
Managing Growth in New Hampshire: Changes and Challenges. This study found that
the population of the state increased by an estimated 60 percent from 1970 to 1998, and,
during this same time period, the number of housing units increased by nearly 95 percent.
The study not only explored the amount of growth in the state but, through case studies,
also explored the physical pattern of this growth. In each of the 10 communities
examined, the increase in developed land exceeded the population increase. So while
these 10 municipalities on average saw a 71 percent increase in population, they saw a
137 percent increase in developed land. This pattern means that recent increases in
population are expressed on the ground by even larger increases in developed land.
Development is becoming more spread out (less infill development) and more open space
is being consumed in the process.
New Hampshire is clearly a desirable place to live and people from all walks of life can
enjoy a high quality of life within its borders. This “quality of life” has strong roots in
New Hampshire’s abundance of natural, historic and cultural resources, and to some
degree, in the ability to access and appreciate these resources. Working forests and
agricultural lands, clean rivers and lakes, traditional town greens and historic buildings all
117
help define the state’s character. Conserving these resources is vital to our economy,
health, and well-being.
Beyond defining the state and community character, these resources provide
opportunities for a range of outdoor recreational pursuits. Loss of un-fragmented open
space and sprawl diminish both the quality and quantity of outdoor recreational
opportunities. This, paired with a growing population base, growing tourism market, and
increase in outdoor recreation participation make discussions about outdoor recreation
and its connection with land use planning and smart growth initiatives that much more
important.
Current Initiatives. On a policy level, state decision makers passed legislation in 2002
that focuses state, regional and local efforts on promoting sound development patterns.
RSA 9-A:1 IV aims to coordinate land use planning efforts by improving consistency
among master plans developed on a state, regional and community level. OEP and the
Regional Planning Commissions are charged with developing goals consistent with
principles of smart growth and providing guidance and assistance to communities as they
develop and revise local master plans.
As part of its charge, OEP is instructed to assist the Governor in the creation of a
comprehensive State Development Plan. In the past, the State Development Plan was
limited to serving as an economic policy statement but these statutory changes
considerably broaden its scope, making its content similar to that of a local master plan.
The State Development Plan endeavors to reflect the “desires of the public relative to the
future,” and its overarching goal is to guide plans and programs of state agencies and to
coordinate state agencies’ action and projects.
Recreation is specifically identified as one of the main topic areas for the State
Development Plan and will be considered alongside other broad topics such as
transportation, land use, economic development, and natural resources. Together, these
topics combine to establish a comprehensive vision, goals and strategies directing future
development in the state.
OEP also developed a toolkit entitled Achieving Smart Growth in New Hampshire that
provides a host of local examples and success stories. This toolkit’s foundation is based
on eight principles, “Principles of Smart Growth for New Hampshire,” that reflect the
state’s definition of smart growth as enacted by the legislature in RSA 9-B. These
principles have a strong basis in nationwide smart growth principles but target New
Hampshire’s individual character. The principles and examples are available on-line,
(www.nh.gov/oep/programs/SmartGrowth). They are to:
Maintain traditional compact settlement patterns to efficiently use land,
resources and infrastructure investments.
Foster the traditional character of New Hampshire downtowns, villages, and
neighborhoods by encouraging a human scale of development that is comfortable
for pedestrians and conducive to community life.
118
Incorporate a mix of uses to provide variety of housing, employment, shopping,
services and social opportunities for all members of the community.
Preserve New Hampshire’s working landscape by sustaining farm and forest
land and other rural resource lands to maintain contiguous tracts of open land and
to minimize land use conflicts.
Provide choices and safety in transportation to create livable, walkable
communities that increase accessibility for people of all ages, whether on foot,
bicycle, or in motor vehicles.
Protect environmental quality by minimizing impacts from human activities
and planning for and maintaining natural areas that contribute to the health and
quality of life of communities and people in New Hampshire.
Involve the community in planning and implementation to ensure that
development retains and enhances the sense of place, traditions, goals, and values
of the local community.
Manage growth locally in the New Hampshire tradition, but work with
neighboring towns to achieve common goals and more effectively address
common problems.
These principles reflect the strong links between recreation and other planning efforts
related to land use, transportation, and health. Take for example the fifth principle, aimed
at providing choices and safety in transportation to create livable, walkable communities.
This one principle simultaneously works towards fulfilling recreational goals, land use
goals, transportation goals, and health goals.
If a community strives to improve its transportation options and expand alternative
transportation, it will improve the ability of people to move about the community using
multiple modes of transportation. Improving sidewalks, trails, and bike paths and
creating trail linkages between important community focal points (i.e. schools, the local
library, businesses, residences, and community green spaces) helps refocus the
community towards the village or downtown area. This planning effort simultaneously
improves recreational opportunities close to home for human-powered activities such as
walking, bicycling, running, etc. As more people bike or walk around town instead of
driving, they spend less time in their car and more time exercising out in their
community. This increase in activity, in turn, fulfills a health and wellness goal of
increasing exercise and promoting a healthier lifestyle.
The interconnectedness of these broad principles underscores the need for collaboration
of recreation planners/providers with local land use, transportation, and health officials at
a state, regional and local level. While much of this may seem simple and almost self-
evident in concept, the challenge lies in establishing policies and programs that can have
on-the-ground impacts.
119
One opportunity for collaboration is with the Department of Transportation’s Statewide
Bicycle and Pedestrian Plan. This plan, produced in 2000, provides a list of objectives
aimed at meeting the goal of supporting and encouraging bicycling and walking as
alternatives to motorized forms of transportation and as an element of the state’s inter-
modal transportation system. Several objectives stated in DOT’s plan could also meet
statewide recreation-related goals.
Below are some examples:
DOT will promote bicycling and walking as viable modes of transportation.
DOT will cooperate with other state agencies in initiating, developing, and
implementing programs that encourage bicycling and walking.
DOT, in cooperation with the Department of Resources and Economic
Development (DRED), will propose a statewide plan for the integration of
recreational trails with other bicycle/pedestrian facilities, set standards for their
development, and encourage and support their improvement to all season
conditions.
These “alternative transportation” goals and proposed initiatives also serve to improve
recreation corridors in the state, including bicycle and pedestrian opportunities for
recreational use as well as for transportation. Recognizing and building on the linkages
between transportation planning efforts and recreation planning efforts will strengthen
both. In addition, in 2006, DOT established A Safe Routes to School Program supported
by SAFTEA-LU funds. This program encourages children, kindergarten through the
eighth grade, who live within approximately two miles to school, to walk or ride bicycles
to school.
Historic and Cultural Resources. New Hampshire’s identity is defined as much by its
cultural landscape as by its natural beauty. The integrity of New Hampshire’s future
character will largely derive from the identification and protection of the legacy left to us
by centuries of human enterprise.
New Hampshire is a museum of its own history. Covered bridges, stonewalls, historic
buildings, ancient farmsteads, and quintessential New England villages are a part of New
Hampshire’s fabric. New Hampshire is also a place of mills and factories, of powerful
streams harnessed in the service of industry. Together, these landscapes of social and
civic life, business, manufacturing, agriculture and forestry define the real New
Hampshire. The cherished nature of our cultural landscape is reflected in New
Hampshire’s popular Land and Community Heritage Investment Program (LCHIP) and
the Conservation License Plate Program, two grant programs that support the protection
of historic and cultural resources.
A new form of tourism is making itself felt in New Hampshire. Our visitors have always
appreciated the state’s natural beauty. Now, people also come to see our history, the
things we have built, and the ways we have used our natural resources and changed our
landscape. We call this new form of tourism “heritage tourism.”
120
Responding to this interest, New Hampshire’s Scenic and Cultural Byways program
celebrates our natural and cultural landscapes, offering scenic routes and destinations,
whether one drives by car or bus, or travels by bicycle. Many communities have
published walking tours, offering understanding and enjoyment of the local landscape.
The New Hampshire Heritage Trail is a network of locally designated routes that will
extend from the Massachusetts border to the Canadian border along our principal rivers,
telling the unique story of diverse communities while defining the state’s broader
heritage. New Hampshire’s two Shaker communities, in Canterbury and Enfield, have
joined with others and with the National Park Service to create a regional Shaker Historic
Trail. And centers of manufacturing history along the Merrimack, Connecticut,
Winnipesaukee, and Androscoggin Rivers have begun to study the possibility of defining
themselves as industrial heritage corridors.
The Division of Historical Resources updated New Hampshire’s Preservation Plan in
2006. This plan emphasizes the need for enhanced survey and study of New
Hampshire’s cultural landscape, for public education and outreach to promote greater
awareness and appreciation of the state’s cultural resources, and for fuller integration of
preservation planning into decision-making at state, regional and local levels.
Other Initiatives. The eight principles discussed above are often advocated by
organizations and businesses in New Hampshire, alongside government. An initiative
representing another opportunity for collaboration is the New Hampshire Smart Growth
and Development Roundtable, funded in part through the New Hampshire Charitable
Foundation, which aims to “build cross sector linkages and identify an agreed-upon
agenda for action on smart growth issues in New Hampshire.”
The Roundtable consists of representatives from a range of organizations and interests
including planning, tourism, energy, business and industry, public health, housing,
cultural/historical, transportation, conservation, and financial resources. The emphasis of
this initiative is the importance of building partnerships, collaboration, and linkages with
a focus on a common agenda to help New Hampshire grow smarter in the future. This
broad-based, public-private collaboration met in a yearlong forum to help define issues,
identify leverage points and build agreement. It identified the need for workforce
housing and land preservation in our communities and sought political support for an
initiative to support these two goals. The Housing and Conservation Planning Program,
as it was known, was endorsed by Governor Lynch and enacted by the legislature in
2007. Funding is $200,000/year for the first two years.
Local Examples. Communities in New Hampshire are already undertaking a number of
initiatives to help protect open space, enhance traditional community character, and
improve transportation options. Many have direct links to recreation. OEP has smart
growth resources available at http://www.nh.gov/oep/programs/SmartGrowth/index.htm.
Some communities have implemented open space or cluster development as a way of
both accommodating growth and protecting open space. In this zoning provision, plans
for new housing development start with protecting important open space and
incorporating housing into smaller lot sizes. Crockett Farm in Stratham is one example.
This open space or cluster project allows for smaller lot sizing with open space
121
surrounding the housing to provide habitat for wildlife and maintain natural areas for low
impact recreational activities. In addition, areas of working forestland and open farm
fields have been maintained through conservation easements.
Many communities are encouraging use and appreciation of their waterfront and
downtown area by establishing trails and parks and linkages within central areas of town.
This larger community improvement effort also improves recreational opportunities. In
one example, the town of Littleton is working to enhance and link a series of riverfront
pocket parks including one in front of the Littleton Area Senior Center and facing
downtown. These sites provide open access to the river, including swimming in the
summer months. Using DOT Transportation Enhancement funds, efforts are underway to
develop a river walk and pedestrian bridge across the Ammonoosuc River to enhance
connections to downtown.
In downtown Plymouth, the NH Fish and Game Department has developed a boat access
facility to provide river access for boating as well as riverfront access for pedestrians.
This site is situated in the heart of the town near the Plymouth Area Senior Citizens
Center and the Plymouth District Court. Boaters can also rent kayaks from a nearby shop
and walk to the access site. Additionally, in 2007, Fish and Game expanded on this
recreational opportunity, completing a car-top put-in on the Baker River. This put-in
provides a nice paddle into downtown Plymouth where they can take out, visit the
downtown and paddle back or hitch a ride to their original location.
Laconia Downtown
The Winnipesaukee River winds its way through downtown Laconia. It is the focus of
planning for an integrated riverwalk that has been years in the making. The City of Laconia has
recently completed Phase I of their multi-phase Downtown Riverwalk. In Phase I, a public-
private partnership on a private Riverfront Mill redevelopment parcel provided the City with
the right-of-way along the river. The private partners also helped the City with some
construction services. Together, with City-allocated funds for materials and additional
construction services, landscaping, benches and lighting provide a new recreational amenity for
young and old to enjoy.
An additional benefit is that Phase I links the Main Street area of downtown to a mixed
residential/commercial neighborhood along a street where a NH Fish and Game program plans
to put in a public boat launch on Lake Winnisquam.
The addition of a car-top put-in this autumn (2007) on an existing portion of the riverwalk will
make the urban downtown accessible by car-top, boat, car, bicycle and foot. The City is
currently exploring additional private partnerships and funding mechanisms for phases II and
III of the riverwalk project that will link the area of the car-top boat launch with Paugus Bay.
122
Planning for Outdoor Recreation. Local decisions that impact community outdoor
recreation opportunities are made by a variety of different entities. While many
communities have a recreation director or recreation commission in charge of community
recreation, this entity (entities) is not solely responsible for providing or looking after all
community-based recreational opportunities.
Community outdoor recreation can involve a range of local leaders and staff. Often a
conservation commission is responsible for managing a town forest or town natural areas,
both of which can provide outdoor recreation opportunities and a variety of trail uses.
Together with the board of selectmen, a planning board may make decisions about Class
VI roads, sidewalks, and recreation features of new developments. It is important to
support efforts to improve communication between these decision-makers in both the
town master planning process and in the management and discussions about municipal
recreational resources.
In addition, changes could be made on a statewide policy level to improve how recreation
is defined or discussed under state law. One specific suggestion is to clarify and improve
upon the reference to recreation in RSA 674:2, the state statute on local master planning.
At this time, communities are encouraged to develop a chapter on recreation that “…
shows existing recreation areas and addresses future recreation needs.” There is a
concern that this definition provides communities with little guidance for developing a
high-quality recreation chapter within their local master plan, one that would truly
consider the broad range of recreational features in a community. Given this concern,
OEP will take a lead role exploring and suggesting legislative changes to this statute.
GOAL: Promote growth and development patterns that encourage local
recreational opportunities and preserve undeveloped lands for future
recreational use.
I. Objective: Integrate outdoor recreation within larger discussions of “smart
growth.”
Strategy:
A. Develop statewide, regional, and local partnerships between recreation planning
efforts and those related to land use, transportation, and health (e.g. DOT, OEP,
DRED, DHR, DHHS).
B. Emphasize to communities the benefits of conducting natural resource inventories
and developing conservation/open space plans as part of larger community
planning efforts.
C. Broaden enabling legislation for impact fees that would expand allowable uses to
include open space and recreation infrastructure.
D. Improve cross-links between the land use, open space, cultural and historic
resources, transportation, and recreation chapters of local master plans (e.g.
123
encourage communities to include a key at the end of each chapter explaining
links with other chapters).
E. Promote interagency coordination to address regional recreation, trail and open
space needs (e.g. explore expanding the role of the Statewide Trails Advisory
Committee in addressing regional trail needs).
F. Encourage Regional Planning Commissions to coordinate and develop multi-
community recreation and open space plans (e.g. Central New Hampshire
Regional Planning Commission open space and trail planning assistance).
G. Improve upon existing references to recreation in state statutes (e.g. OEP will
work to revise reference to recreation in RSA 674:2).
II. Objective: Encourage local development that is sensitive to protecting and
enhancing local land and water-based recreation and natural and cultural resource
protection opportunities.
Strategy:
A. Give priority to projects that provide community linkages/improve connectivity
(e.g. trails, bicycle/pedestrian linkages between residences, boat access,
recreational fields, schools, library, etc.). (LWCF)
B. Give priority to land acquisition projects that protect resources most threatened by
land use changes. (LWCF)
C. Support efforts to create local, regional and statewide networks of trails and
greenways (e.g. New England National Scenic Trail, Winnipesaukee River Trail,
Sunapee Ragged Kearsarge Greenway, etc).
D. Support efforts that link community resources via trails and improve the overall
connectivity of trails (Derry Pathways, etc.).
E. Better incorporate open space and trails planning efforts into local and regional
planning and land use decisions.
F. Develop a joint education program targeted towards recreation departments,
conservation commissions, and other appropriate boards focused on building
awareness of the linkages between recreation and conservation.
G. Support DOT’s Safe Routes to School Program and other “Walk to” or “Ride to”
programs.
124
III. Objective: Educate communities about the importance and economic/non-economic
benefits of local, close-to-home recreational opportunities.
Strategy:
A. Educate the public about the economic value of recreational opportunities in local
communities (e.g. education and outreach efforts focused on promoting the values
of trails, clean surface water, open space, and non-motorized travel within a
community, etc.).
B. Identify and promote existing strategies that successfully integrate recreation
resource protection and community economic development.
C. Support projects that address community character; social, cultural and quality of
life issues; and promote the value of trails close to home.
Selected Contacts and Information Resources
New Hampshire Office of Energy and Planning (www.nh.gov/oep)
New Hampshire Department of Transportation – Bicycle/Pedestrian Program
(www.NHBikePed.com/)
Regional Planning Commissions
(www.nh.gov/oep/resourcelibrary/regions.home.htm)
New Hampshire Charitable Foundation (www.nhcf.org/)
New Hampshire Main Street Program (www.nhcdfa.org/mainstreet.html)
Appalachian Mountain Club (www.outdoors.org)
New Hampshire Local Government Center (www.nhlgc.org)
New Hampshire Minimum Impact Development Partnership (www.nhmid.org/)
Smart Growth Network (www.smartgrowth.org/default.asp)
New Hampshire Recreation and Park Association (www.nhrpa.com)
6. IMPORTANCE OF LOCAL OUTDOOR RECREATION OPPORTUNITIES AND
OPEN SPACE PROTECTION IN PROMOTING INCREASED HEALTH AND
WELLNESS
Summary
Obesity in children and adults has been labeled as an epidemic in the U.S.
Trends are similar in New Hampshire.
Physical activity levels among adults and children in New Hampshire are
below national recommendations.
Providing open space, parks, trails, and greenways for “recreation” can be an
important part of larger community efforts to develop more livable/walkable
communities.
125
Partnerships and links between health and recreation are being developed on the
national level. The Center for Disease Control sponsors an initiative (Active
Community Environments) to promote walking, bicycling and the development
of accessible recreation facilities. One of the major initiatives consists of a
partnership among 11 federal programs in 4 different federal agencies (including
the National Park Service and U.S. Forest Service) to promote healthier lifestyles
through recreation and physical activity.
Providing outdoor recreation opportunities within neighborhoods and
communities and providing better access to information about recreational
opportunities have been identified as important tools to address obesity and lack
of physical activity.
Nationwide initiatives and partnerships are also in place to promote use of trails
as ‘pathways to health’ and to promote community partnerships aimed at
encouraging physical fitness. Promoting trails and trail use is seen as a way of
reaching the largest segments of the community. Walking/trail activities are the
most popular recreational pursuits in the U.S., even among those 60 + years of
age.
The Department of Health and Human Services’ Healthy New Hampshire 2010, is
a statewide agenda to improve health in New Hampshire. Increasing physical
activity and lowering overweight and obesity are part of this effort.
Overview
Recreation plays an important role in promoting individual wellness and supporting
healthy communities. Lack of exercise and poor diet are two main factors contributing to
obesity. The U.S. Department of Health and Human Services reports that 61 percent of
adults were overweight or obese as measured in the 2005 Behavioral Risk Factor
Surveillance System (BRFSS). Of particular concern is the fact that 13 percent of NH
students in grades 9-12 were overweight and 16 percent were at risk for being overweight
according to the 2005 Yearly Risk Factor Surveillance System (YRFSS). Nationally,
childhood overweight and obesity rates have tripled since 1980. According to the 2001
U.S. Surgeon General’s Report, adult obesity rates have doubled since 1980. In 2005,
fifty percent of U.S. adults engaged in 30 minutes of moderate physical activity, five or
more times a week (federal recommendations) while 24 percent participate in no leisure-
related physical activities (BRFSS).
A recent Surgeon General report highlights a number of community-based strategies
aimed at encouraging healthier lifestyles and promoting physical activity. Some are
aimed specifically at promoting physical activity locally and make a strong case for
partnering with recreation providers and planners. One identified strategy is to make
community facilities available for physical activity for all people, including on the
weekends. Another is to create more opportunities for physical activity at work sites.
These broad recommendations are important from a health and wellness perspective and
from a recreation perspective.
126
The Robert Wood Johnson Foundation published a report entitled Healthy Places,
Healthy People: Promoting Public Health & Physical Activity through Community
Design (2001). This report stresses the importance of community design and the way our
built environments are constructed to either promote or impede physical activity.
Existing environments too often focus exclusively on the automobile, and communities
are losing open space and good access for walking or bicycling. They fund numerous
programs that follow-up on their research findings. One effective program is the Local
Initiative Funding Partners that is supporting projects such as the Neighborhood M.A.P.
(More Active People) in West Virginia to combat the health hazards of pervasive obesity
and lack of physical activity; the EXTREME Health Challenge in Florida to promote
healthy nutrition and exercise in children grades K-5; and the Students Run Philly Style
in Pennsylvania where at-risk teens improve health, self-esteem and school performance
in a running program.
Nationwide Conditions
Healthy People 2010, a publication of the U.S. Department of Health and Human
Services, provides information about a range of leading health indicators (LHI). Physical
activity and obesity are both specifically identified in the report as LHIs. The report
highlights that only 15 percent of adults performed the recommended amount of physical
activity in 1997, and 40 percent of adults participated in no leisure-time physical activity.
Outdoor recreation provides an important outlet for promoting physical activity.
The benefits of physical activity have long been known. Regular physical activity can
control weight, improve psychological well-being, and reduce symptoms of depression
and anxiety. A range of socio-demographic characteristics can influence activity levels.
Research has shown that adults in northeastern and southern states tend to be less active
than adults in western and north central states. Women tend to be less active than men,
across all adult age groups, and adults with lower education and income tend to be less
active than average. Reasons people cite for not increasing activity levels include both
personal and environmental factors such as lack of time, lack of access to convenient
facilities, and lack of a safe environment where they can engage in physical activity.
Programs and Partnerships. In response, the U.S. Department of Health and Human
Services, Centers for Disease Control (CDC) is developing programs and partnerships to
combat these trends. One such program is the CDC- sponsored Active Community
Environments (ACEs). This initiative promotes walking and bicycling, as well as widely
accessible recreational facilities. Two of ACE’s main goals include encouraging bicycle-
and pedestrian-friendly environments and promoting self-powered forms of
transportation (walking, bicycling). Community characteristics, such as housing density,
road/street design, availability of public transportation, and availability of bicycle and
pedestrian opportunities, among others, are important factors behind promoting or
hindering physical activity locally.
An important ACE initiative consists of a new partnership among 11 federal programs in
4 different federal agencies (including the National Park Service and U.S. Forest
Service) to promote healthier lifestyles through recreation and physical activity.
Providing outdoor recreation opportunities within neighborhoods and communities and
providing better access to information about recreational opportunities were identified as
127
important tools to address obesity and lack of physical activity. Two interesting
programs are the GreenStyles Survey, (www.cdc.gov/nccdphp/dnpa/aces.htm) that
assesses the effects of environmental, social and personal variables on walking and
cycling, and the “National Blueprint: Increasing Physical Activity among Adults Aged
50 and Older” (www.cdc.gov/nccdphp/dnpa/press/archive/blueprint.htm).
Other nationwide initiatives and partnerships are also in place to promote use of trails as
exercise and to support community partnerships aimed at encouraging physical fitness.
The Department of the Interior, of which the National Park Service is a part, is promoting
the use of trails as “Pathways to Health.” Promoting trails and trail use is seen as a way
of reaching the largest segments of the community. Walking/trail activities are some of
the most popular recreational pursuits in the U.S., even among older segments of the
population.
Public-private partnerships are critical at a national level and serve as a model for
developing similar initiatives at a state or local level. The National Recreation and Park
Association (NRPA) has entered into a memorandum of understanding with the U.S.
Department of Health and Human Services to develop a strategic partnership that
promotes physical activity. The purpose is to reach goals proposed in Healthy People
2010 as they relate to physical activity, obesity and overweight. Goals include increasing
the level of physical activity among youth and adults, reducing levels of obesity among
youth and adults, and reducing environmental barriers to physical activity at the
community level with special emphasis on removing barriers for the disabled. Selected
strategies set forth include the following:
Population and community-based health education and health promotion
activities;
Activities that utilize technology to increase awareness of the local access and
opportunities for physical activity;
Coordination of public awareness and media activities that include the
Leading Health Indicators (LHIs) and that address the imperative of
increasing physical activity, promoting healthy behaviors, and increasing
quality and years of healthy living;
Joint efforts to promote professional education and training, dissemination
of best practices, and joint efforts to mobilize communities around the
Healthy People 2010 objectives and the Leading Health Indicators;
Activities designed to reach the community level, including but not
limited to encouraging partnerships locally;
Activities that augment data collection efforts;
Increased collegiality, recognition, support, and resource sharing; and
Strategic leveraging of resources among organizations.
128
Safety. Safety at recreational areas is also part of promoting health and wellness. The
U.S. Consumer Product Safety Commission (CPSC) revised its Handbook for Public
Playground Safety, 1997. The purpose is to help communities, schools, day care centers,
corporations, and other groups build safe playgrounds. The publication provides
information detailing technical safety guidelines for designing, constructing, operating,
and maintaining public playgrounds. This guide is available on-line at
(www.cpsc.gov/CPSCPUB/PUBS/325.pdf).
New Hampshire Conditions and Trends
In 2005, 60 percent of New Hampshire adults were overweight or obese, up from 50
percent in 1999 (BRFSS). The Healthy NH 2010 goal is to reduce New Hampshire’s
adult overweight and obesity rate to 40 percent by 2010. In 2005, 24 percent of New
Hampshire students in grades 9-12 were either overweight or at risk for becoming
overweight. The 2010 goal is to reduce the overweight rate and risk for overweight in 9-
12 grade students to 5 percent. New Hampshire has already met the 2010 goal to
increase physical activity rates for adults and students in grades 9-12 to 50 percent. In
2005, 56 percent of adults and 57 percent of 9-12 grade students met the physical activity
recommendations.
A steering committee facilitated by New Hampshire Fish and Game hosted a “Leave No
Child Inside” Summit in May 2007 to kick off a New Hampshire initiative to combat the
“nature-deficit disorder” trend. Dr. Susan Lynch, New Hampshire’s First Lady, served as
honorary chair, and participants represented the fields of education, health, recreation,
environment, media and culture, and the built environment. Working groups have formed
to address the top priorities identified at the Summit, including messaging, networking,
and providing an Internet clearinghouse of existing programs, activities, and locations for
engaging children and their families with the outdoors.
State Parks has begun to implement the “Leave No Child Inside” initiative with a six-week
initiative, “The Great Park Pursuit”. Teams of two or more participated in three self-
guided challenges and three activity-driven events at a different state park each week to
earn points and win prizes. During this six-week adventure, eighty-five teams competed in
three-legged and wheel barrow races, created origami birds and built bird houses,
inspected specimens netted from ponds, went on hikes, learned how to tie knots and fish,
built castles and creatures in the sand, kayaked, and explored the Flume.
GOAL: Promote health/wellness benefits gained from improving recreational
opportunities and bicycle and pedestrian linkages in communities.
I. Objective: Broaden and strengthen partnerships.
Strategy:
A. Build connections with the NH Department of Transportation, local public works
departments, and local boards to promote bicycling and pedestrian connectivity
and non-motorized transportation networks.
129
B. Focus health/wellness education and outreach efforts on local recreation
providers (e.g. target recreation directors, recreation commissions, and involve
the Governor’s Council on Physical Education, Department of Education,
Healthy Communities Foundation, etc.).
C. Promote local participation in statewide health promotion and education activities
(e.g. Great American Smoke Out, Great American Work Out).
D. Partner with hospitals, local wellness teams, and schools to coordinate education
efforts and develop cross-promotion efforts.
II. Objective: Increase public awareness of access and opportunities for recreation and
physical activity locally.
Strategy:
A. Cross-promote health programs as aspects of other initiatives and incorporate
physical activity within other organizations’ activities (e.g. establish historic
walking tours in conjunction with the local historical society or historic
commission).
B. Work with business and industry to promote understanding of the importance of
recreational opportunities for employee health (e.g. Business and Industry
Association, etc.).
III. Objective: Consider special needs of youth, elderly and disabled populations in
promoting health and wellness through outdoor recreation.
Strategy:
A. Improve existing and new recreation areas by enhancing non-motorized
(bicycle/pedestrian) accessibility and connectivity. Non-motorized access is
particularly important to youth, elderly and disabled populations.
B. Encourage lifetime recreation and physical activity curriculum in school
programs (e.g. Safe Routes to School, bicycling, walking, etc.).
C. Encourage the Department of Resources and Economic Development and the
Fish and Game Department to develop long-term handicap accessible plans for
public lands and implement universal designs.
IV. Objective: Promote health and wellness messages in existing recreation areas.
Strategy:
A. Encourage the state and communities to adopt no-smoking policies in high-
density recreation areas (e.g. state and community parks, and emphasize
awareness of cigarette butts as litter).
130
B. Encourage health food concession alternatives at parks and sporting events (e.g.
beaches, swimming pools, football games, etc.).
C. Encourage communities to post the health benefits of physical activity in existing
recreation areas (e.g. post health messages and mileage markers along a town
pathway or trail).
D. Encourage use of appropriate equipment in parks (e.g. RSA 265:144 requires use
of helmets by youths under 16 bicycling on any public way, etc.).
E. Encourage parks to promote safe playground standards.
Selected Contacts and Information Resources New Hampshire Department of Health and Human Services
(www.dhhs.state.nh.us/DHHS/DHHS_SITE/default.htm)
University of New Hampshire Cooperative Extension (www.ceinfo.unh.edu)
U.S. Department of Health and Human Services (www.hhs.gov/)
U.S. Centers for Disease Control (www.cdc.gov/)
Appalachian Mountain Club (www.outdoors.org/)
New Hampshire Recreation and Park Association (www.nhrpa.com)
131
CHAPTER 4. PLAN IMPLEMENTATION
Overview
While emphasis must be placed on addressing these six individual issue areas, there is an
overarching need to improve upon the way outdoor recreation planning is incorporated
into larger, broader decision-making in the state. Improving upon this process will help
improve overall plan implementation and is critical to making these suggested
recommendations more viable and feasible. With this in mind, improving overall
coordination will be the first step in moving towards SCORP implementation.
The SCORP Steering Committee emphasized, and the SCORP Public Advisory
Committee concurred, that SCORP planning should be an ongoing effort with emphasis
on implementation and progress. The goal is to keep the SCORP alive and up to date.
Discussion focused on revamping collaboration and joint outdoor recreation planning
efforts to produce a more consistent, yearly process.
To foster plan implementation, the SCORP Steering Committee recommended that the
first plan of action should be to establish a more permanent outdoor recreation review
committee or oversight committee. Such a committee is deemed critical to facilitating
plan implementation and addressing critical recreation issues. Because a wide variety of
agencies and organizations are involved in outdoor recreation provision in New
Hampshire, it stands that a wide range of perspectives should be included in ongoing,
coordinated discussions about priorities and strategies.
The SCORP Steering Committee felt that a statewide recreation committee could
respond, as an established entity, to statewide recreation-related challenges, research
needs, and issues that arise in the ensuing five years before another SCORP plan is
developed. Establishing a permanent committee that meets at least on an annual basis
will make a better planning process than one that starts when a new plan is needed and
stops when the plan is finalized.
In addition, efforts should be made to increase the awareness of the SCORP and its
recommendations among state agencies, possibly through the Council on Resources and
Development (CORD), as well as via other legislatively mandated and organized
committees. OEP will work to improve these linkages, identify possible partnerships and
promote understanding of how other initiatives, missions, and goals relate to the wide-
reaching subject of outdoor recreation.
Next Steps
Oversight Committee. To aid implementation of individual strategies set forth in this
plan, OEP, in conjunction with DRED, will work to establish an outdoor recreation
oversight committee as specifically recommended by the current SCORP Steering
Committee. In the interim, the existing SCORP Steering Committee will continue to
meet until this more permanent committee can be established. The current committee
will work with OEP and DRED to develop specific strategies for establishing the role and
membership of an oversight committee and establish initial goals and priorities.
132
While specifics are yet to be determined, the SCORP Steering Committee felt that it is
important that the state leadership be involved in identifying this new committee. In
addition, this group also suggested several starting points for discussion. Two potential
alternatives mentioned would make use of existing committees. One suggestion is to
utilize the existing Open Project Selection Process Advisory Panel. Another suggestion
is to reappoint, in a more permanent fashion, the existing SCORP Steering Committee.
While the exact makeup is still unknown, the new committee is envisioned to meet at
least on an annual basis and focus on plan progress, partnership development, and
implementation strategies.
The current SCORP Steering Committee felt it important to allow this new entity to
establish SCORP priorities and a more formal action plan. Therefore, an action plan will
not be included in this phase of the SCORP planning process, but will be included in the
next phase. This will be an important early task for the formalized oversight committee.
OEP’s Role. Beyond early efforts to work with state leadership in the development of an
outdoor recreation oversight committee, OEP will also continue to oversee the SCORP
and promote plan implementation. In general:
OEP, through an ongoing agreement with DRED, will be responsible for
measuring progress and coordinating planning efforts for SCORP maintenance in
the interim before the next SCORP is developed.
OEP will utilize an oversight committee to identify yearly goals and priorities
based on the list of established SCORP recommendations and will review annual
progress and success. A SCORP action plan will be produced to provide
guidance and direction about the priorities and potential partners.
Under the review of the committee, OEP will evaluate the possibility of
developing a coordinated outdoor recreation research plan to identify statewide
recreation-related research needs, as well as identify priorities, partnerships, and
potential funding sources for completing such research.