Embed Size (px)
Citation preview

1
New Growth Phase
August 2017
www.aspermont.com
Alex Kent (Group Managing Director) Nishil Khimasia (Group Chief Financial Officer)
2 Why invest
Investment Summary
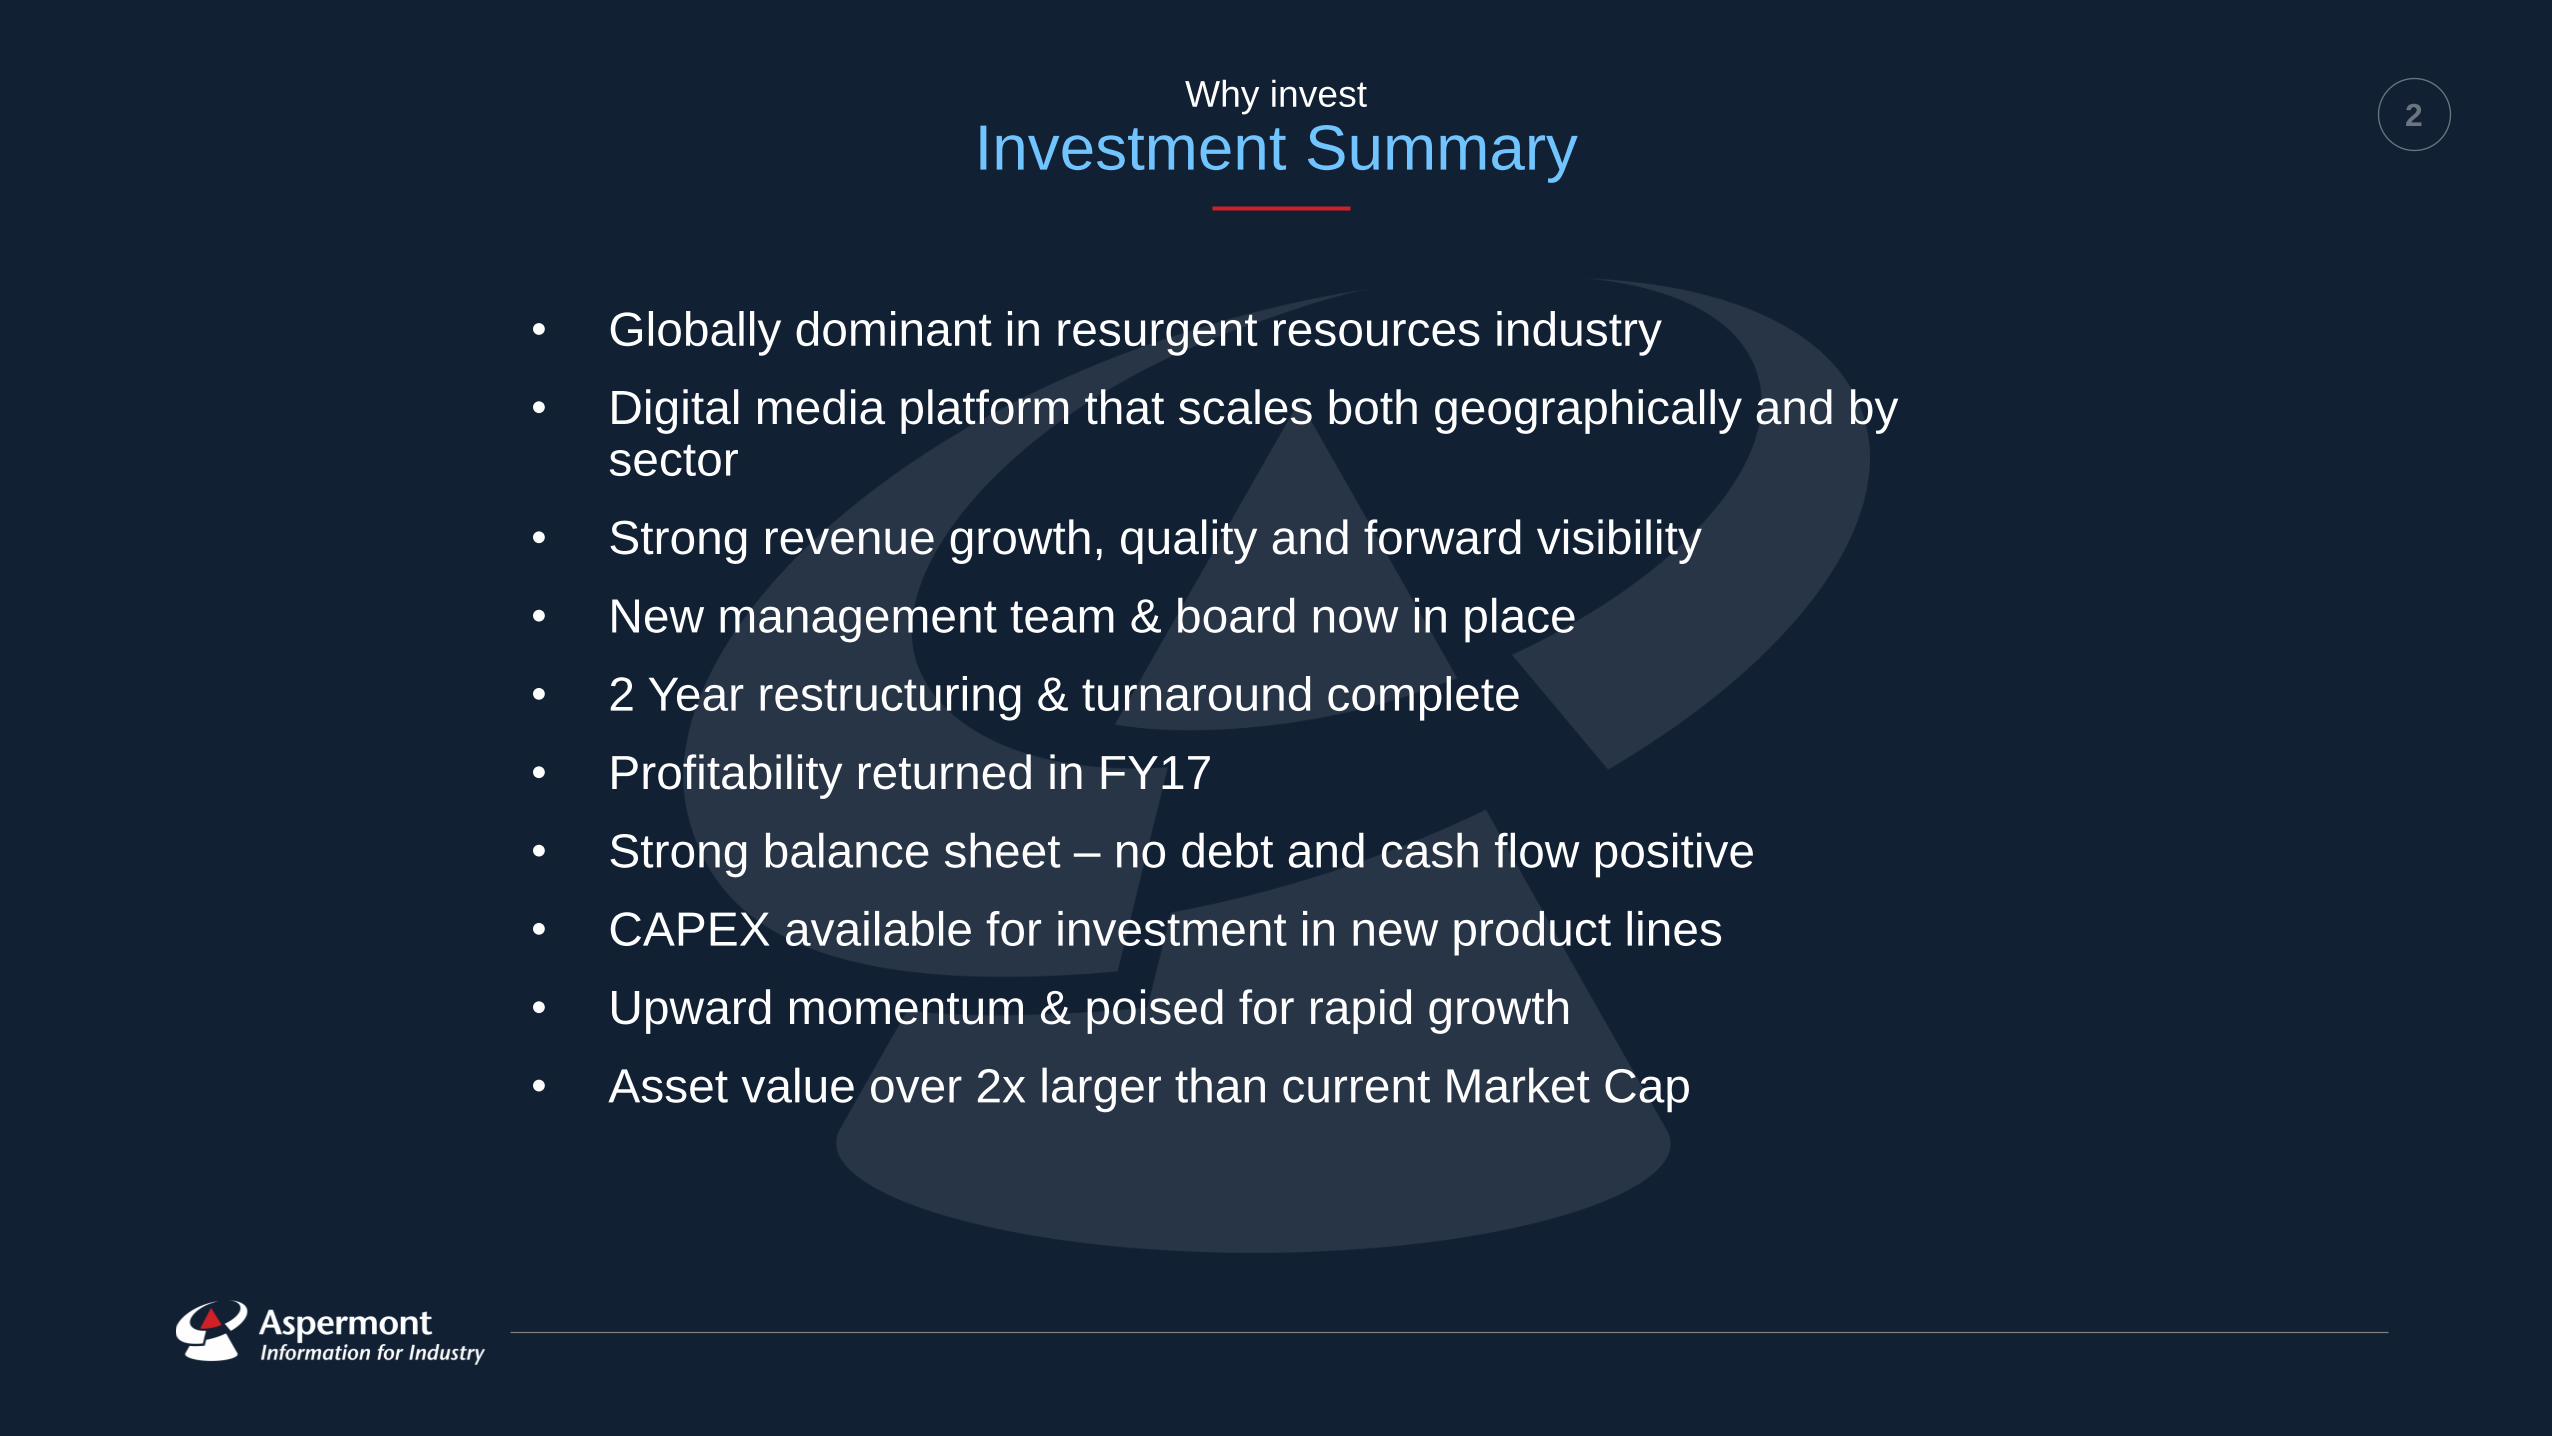
• Globally dominant in resurgent resources industry
• Digital media platform that scales both geographically and by sector
• Strong revenue growth, quality and forward visibility
• New management team & board now in place
• 2 Year restructuring & turnaround complete
• Profitability returned in FY17
• Strong balance sheet – no debt and cash flow positive
• CAPEX available for investment in new product lines
• Upward momentum & poised for rapid growth
• Asset value over 2x larger than current Market Cap
3 Who we are
Leading Digital Media Services Provider to Industry
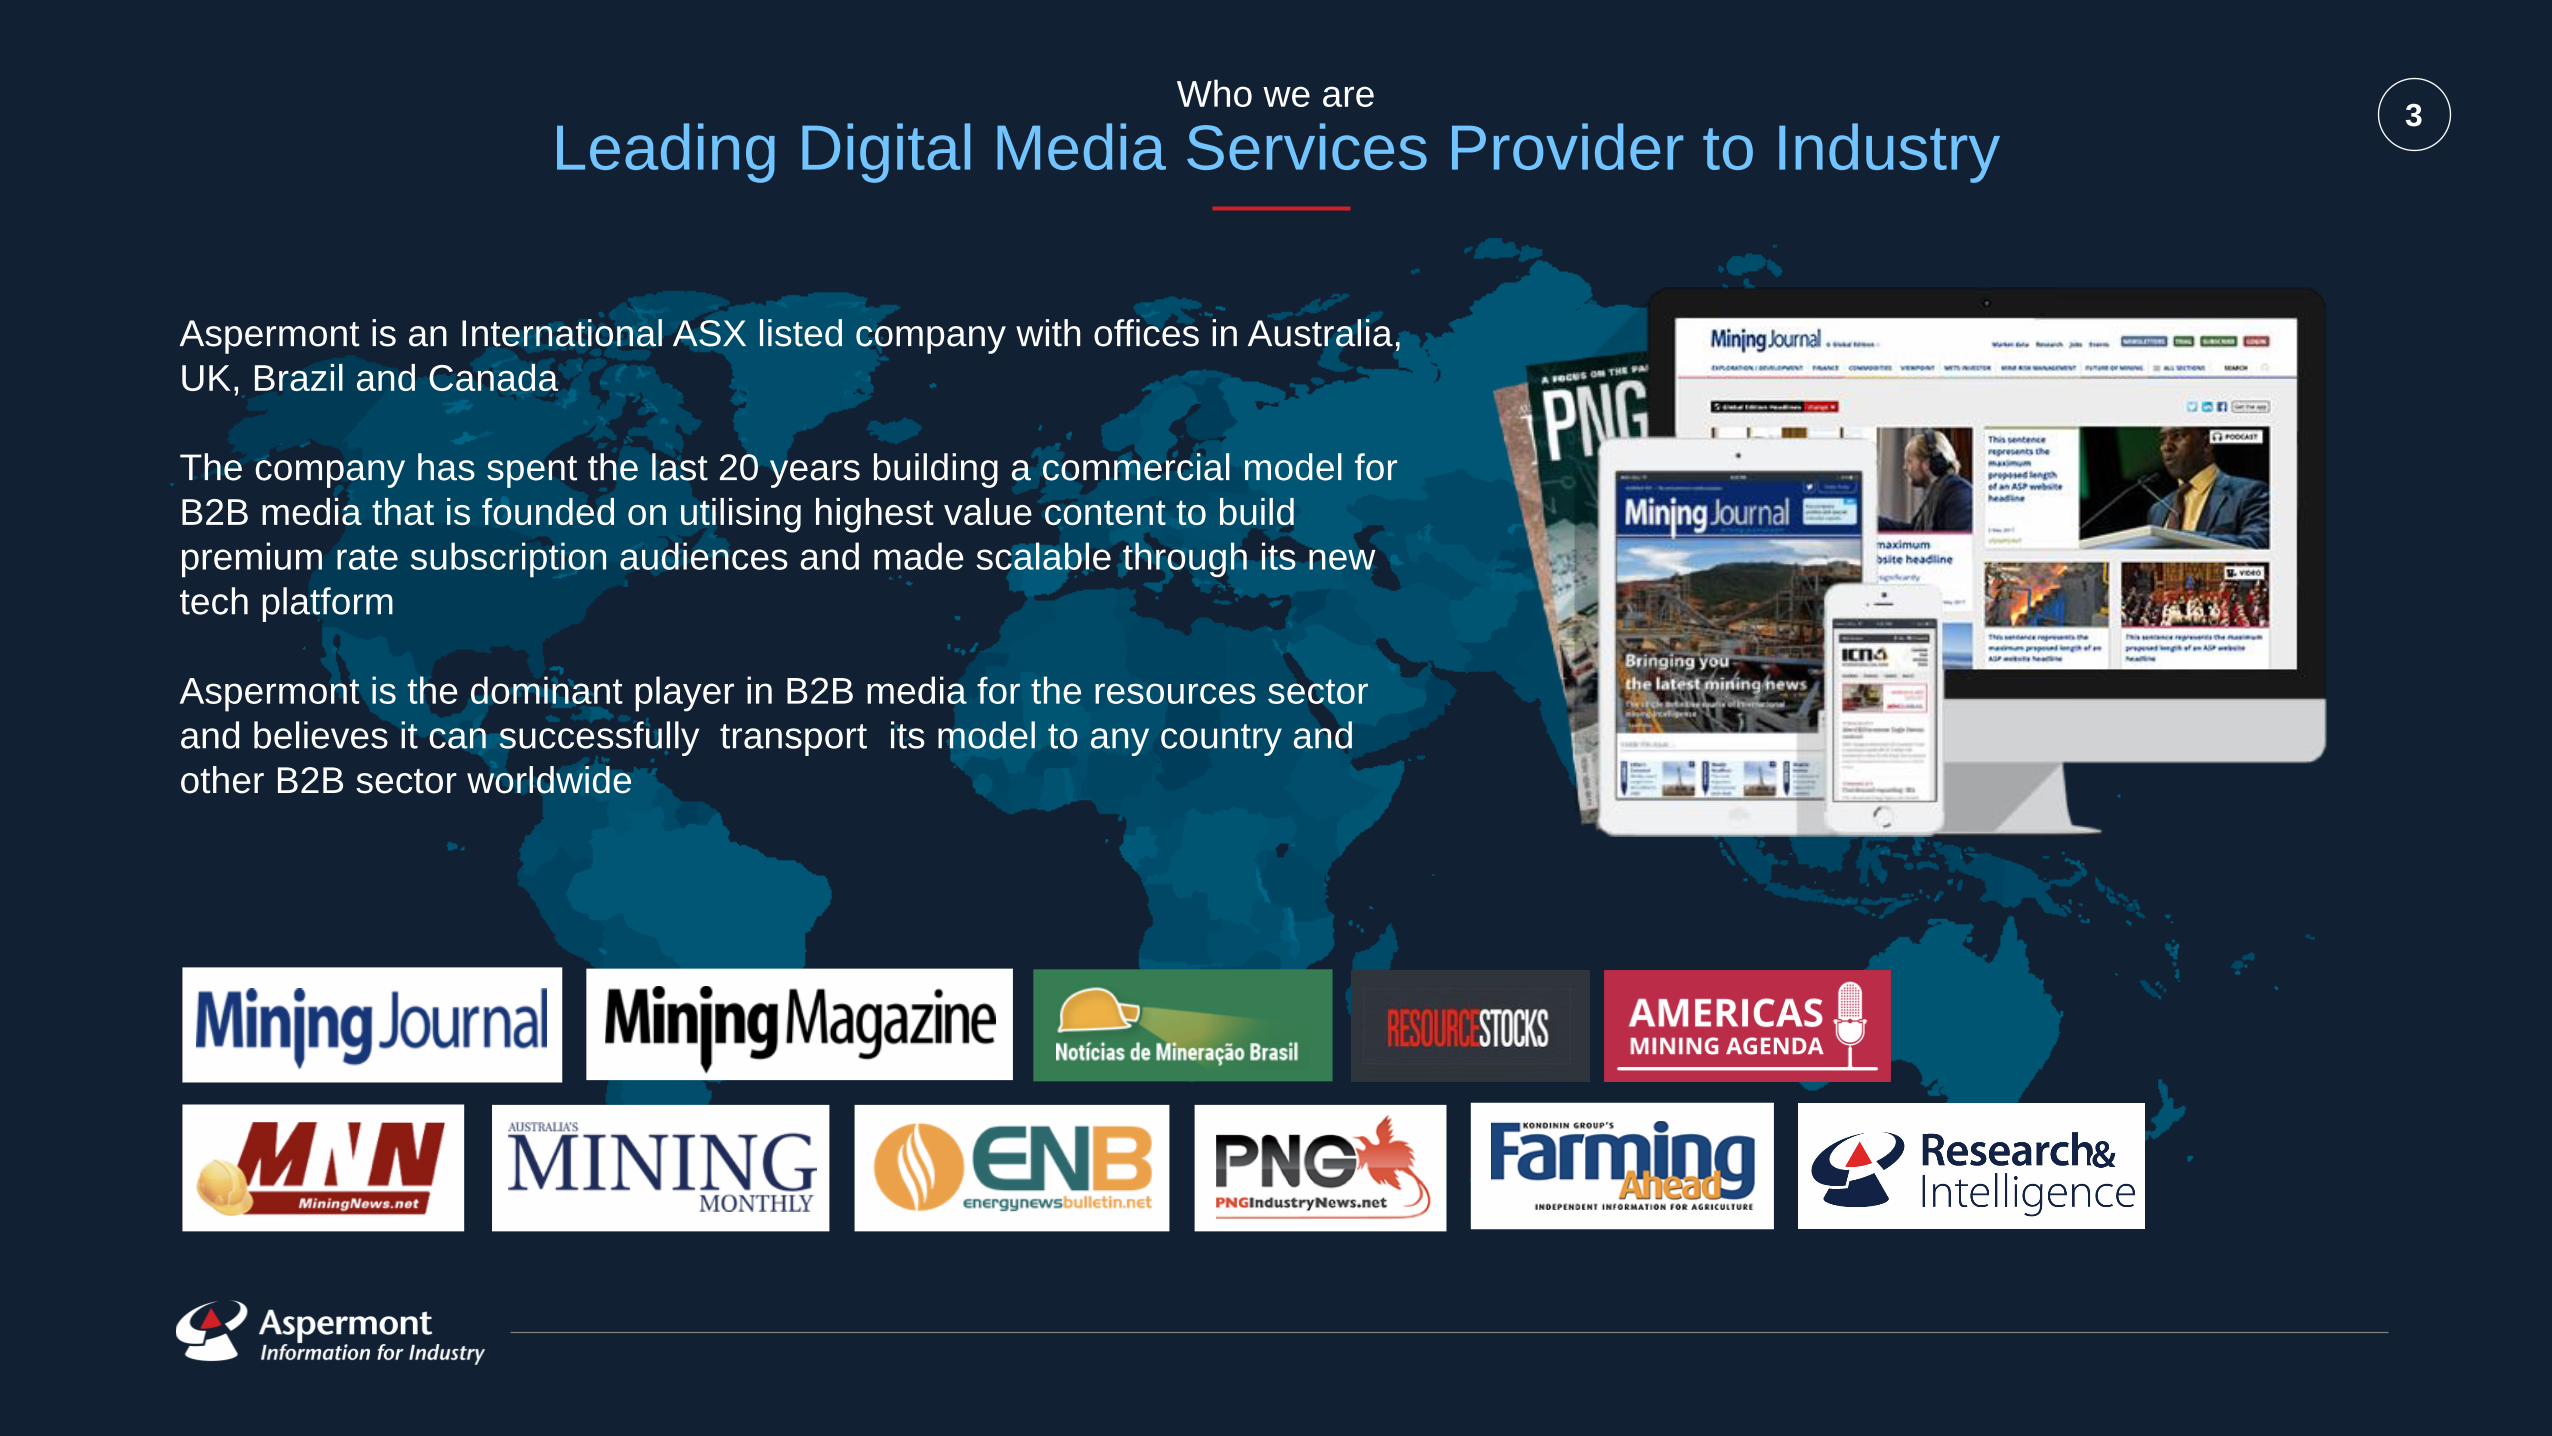
Aspermont is an International ASX listed company with offices in Australia,
UK, Brazil and Canada
The company has spent the last 20 years building a commercial model for
B2B media that is founded on utilising highest value content to build
premium rate subscription audiences and made scalable through its new
tech platform
Aspermont is the dominant player in B2B media for the resources sector
and believes it can successfully transport its model to any country and
other B2B sector worldwide

4 Our history
Company Timeline
2000 2008
2003 2015 2017
New Management
Team
New management team
appointed with significant blue
chip media-tech experience and
change management expertise.
ASX Listing
Aspermont lists on the
Australian Stock Exchange
and commences a new digital
era & growth phase
Project Horizon
ASP begins phased roll out of
next generation platform. Large
internal efficiencies alongside a
focus on deep data and
marketing automation.
Paywall Disruption &
Semantic Search
Aspermont disrupt the Australian
B2B media market in becoming
the first company to launch online
paywall and develops vertical
search engines for its industries.
Beacon Events
Disposal
Posts a 12 month turn around
Aspermont sells Beacon Events
for $11m consideration and
reforms its balance sheet.
Global Positioning
Acquisition of 200 year-old
brand icon Mining Journal.
Cements dominance in
global B2B media for the
resources sector.
New Business Lines
Multiple new business launches
in Data, Research Intelligence
and Events.
Today
New Board Appointed
New board appointed with
significant industry networks and
strong skills sets in operational
efficiency, mergers & acquisition
and corporate finance.
2016
Brand extension , New Markets & Scalability
PHASE 1
PHASE 1: Develop digital model;
Exchange listing PHASE 2: Geo expansion;
Competitive build
PHASE 3: Structure,
Platform, People
PHASE 4: Brand extension,
New markets, Scalability
5 2 Year Turnaround
Transformation Complete
[[INSERT usines
tansforation image]]
FY15 Current
Financial:
EBITDA $3.5m Positive
Annual Cash flow $6m Positive
Balance Sheet Debt $8.4m $nil
PY Revenue Loss -28% Flat
Competitiveness:
Media range Publishing/Events Publishing/Events/Research/Data
Tech Platform Legacy / Disparate Next Gen/Integrated
Marketing Systems Manual Automation
Group Services In House Low cost offshoring
Centralisation
Operational Structure Decentraliszed Centralised
Exec Team Located Globally spread London
Board Located Globally spread London/Perth
Knowledge Capital:
Publishing Skills Print Digital
Sales Skills Product focus Solution selling
Restructuring:
Staff numbers** 250 93
Cost Base Fixed Scalable
Top 2 shareholders 65% 49% Financial FY15 FY17
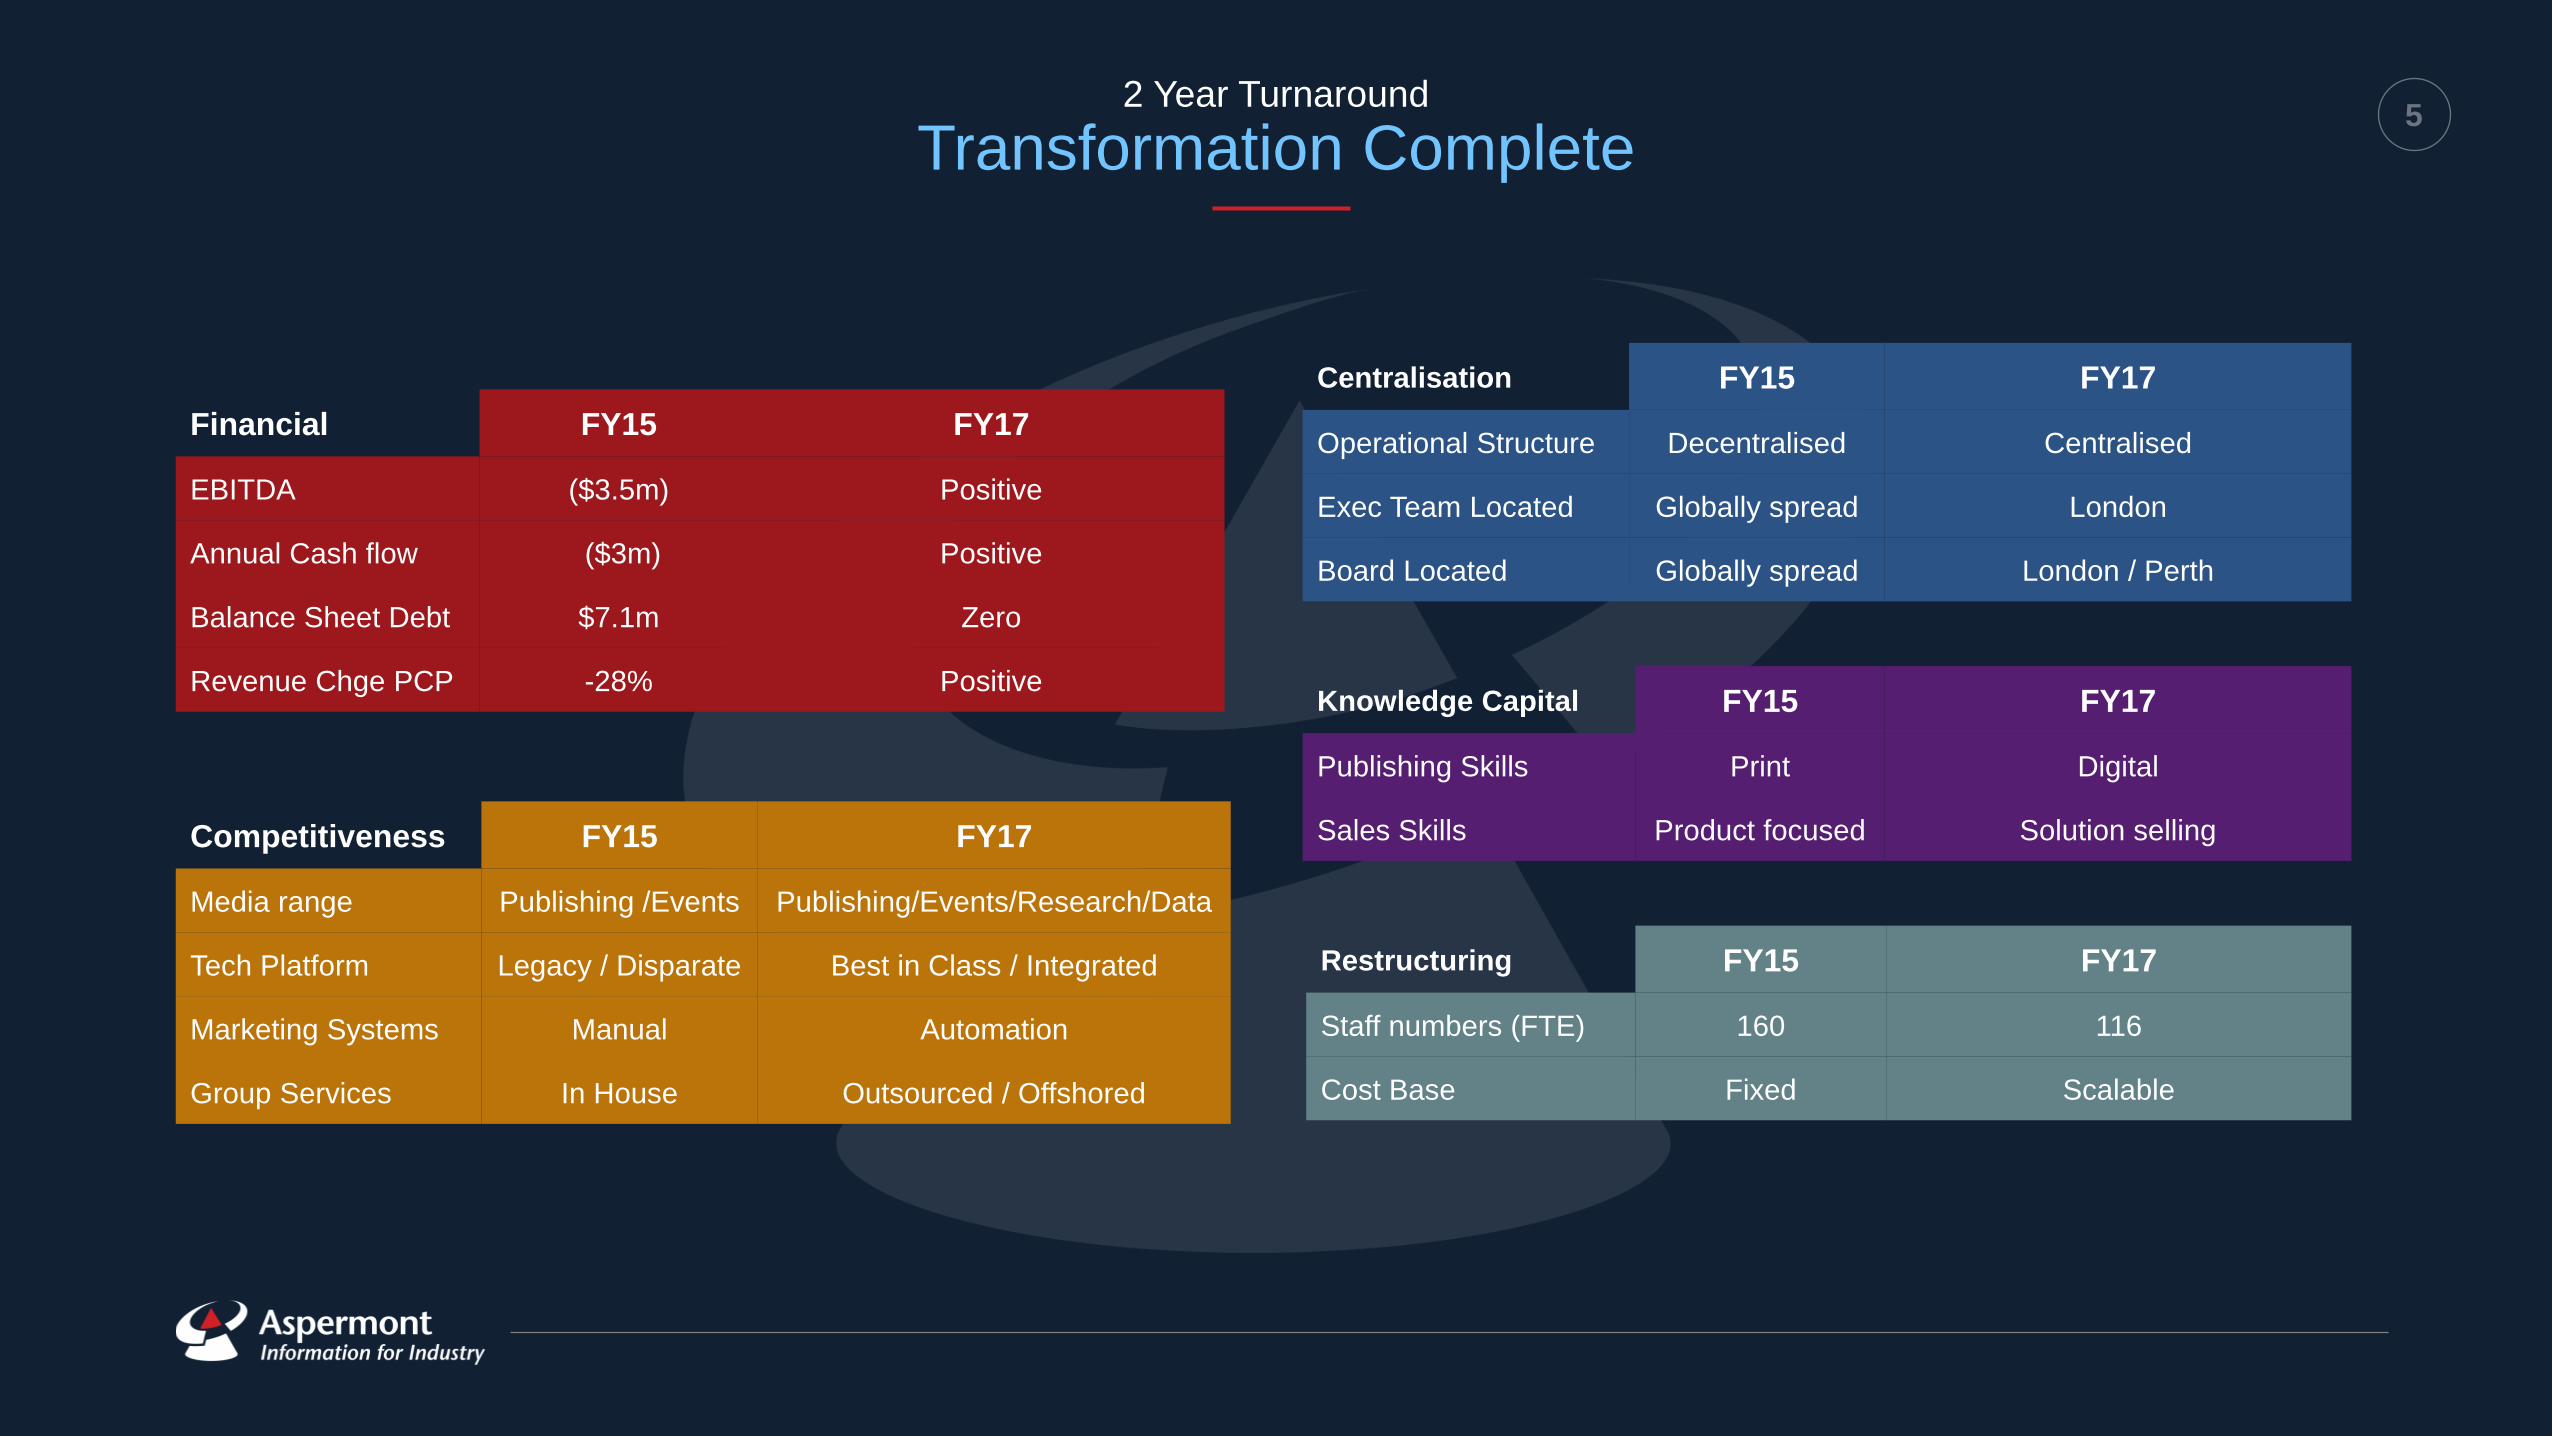
EBITDA ($3.5m) Positive
Annual Cash flow ($3m) Positive
Balance Sheet Debt $7.1m Zero
Revenue Chge PCP -28% Positive
FY15 Current
Financial:
EBITDA $3.5m Positive
Annual Cash flow $6m Positive
Balance Sheet Debt $8.4m $nil
PY Revenue Loss -28% Flat
Competitiveness:
Media range Publishing/Events Publishing/Events/Research/Data
Tech Platform Legacy / Disparate Next Gen/Integrated
Marketing Systems Manual Automation
Group Services In House Low cost offshoring
Centralisation
Operational Structure Decentraliszed Centralised
Exec Team Located Globally spread London
Board Located Globally spread London/Perth
Knowledge Capital:
Publishing Skills Print Digital
Sales Skills Product focus Solution selling
Restructuring:
Staff numbers** 250 93
Cost Base Fixed Scalable
Top 2 shareholders 65% 49%
Competitiveness FY15 Current
Media range Publishing/Events Publishing/Events/Research/Data
Tech Platform Legacy / Disparate Next Gen/Integrated
Marketing Systems Manual Automation
Group Services In House Low cost offshoring
Centralisation FY15 Current
Operational Structure Decentraliszed Centralised
Exec Team Located Globally spread London
Board Located Globally spread London/Perth
Knowledge Capital: FY15 Current
Publishing Skills Print Digital
Sales Skills Product focus Solution selling
Restructuring: FY15 Current
Staff numbers** 250 93
Cost Base Fixed Scalable
Top 2 shareholders 65% 49%
Competitiveness FY15 FY17
Media range Publishing /Events Publishing/Events/Research/Data
Tech Platform Legacy / Disparate Best in Class / Integrated
Marketing Systems Manual Automation
Group Services In House Outsourced / Offshored
Centralisation FY15 FY17
Operational Structure Decentralised Centralised
Exec Team Located Globally spread London
Board Located Globally spread London / Perth
Knowledge Capital FY15 FY17
Publishing Skills Print Digital
Sales Skills Product focused Solution selling
Restructuring FY15 FY17
Staff numbers (FTE) 160 116
Cost Base Fixed Scalable
6
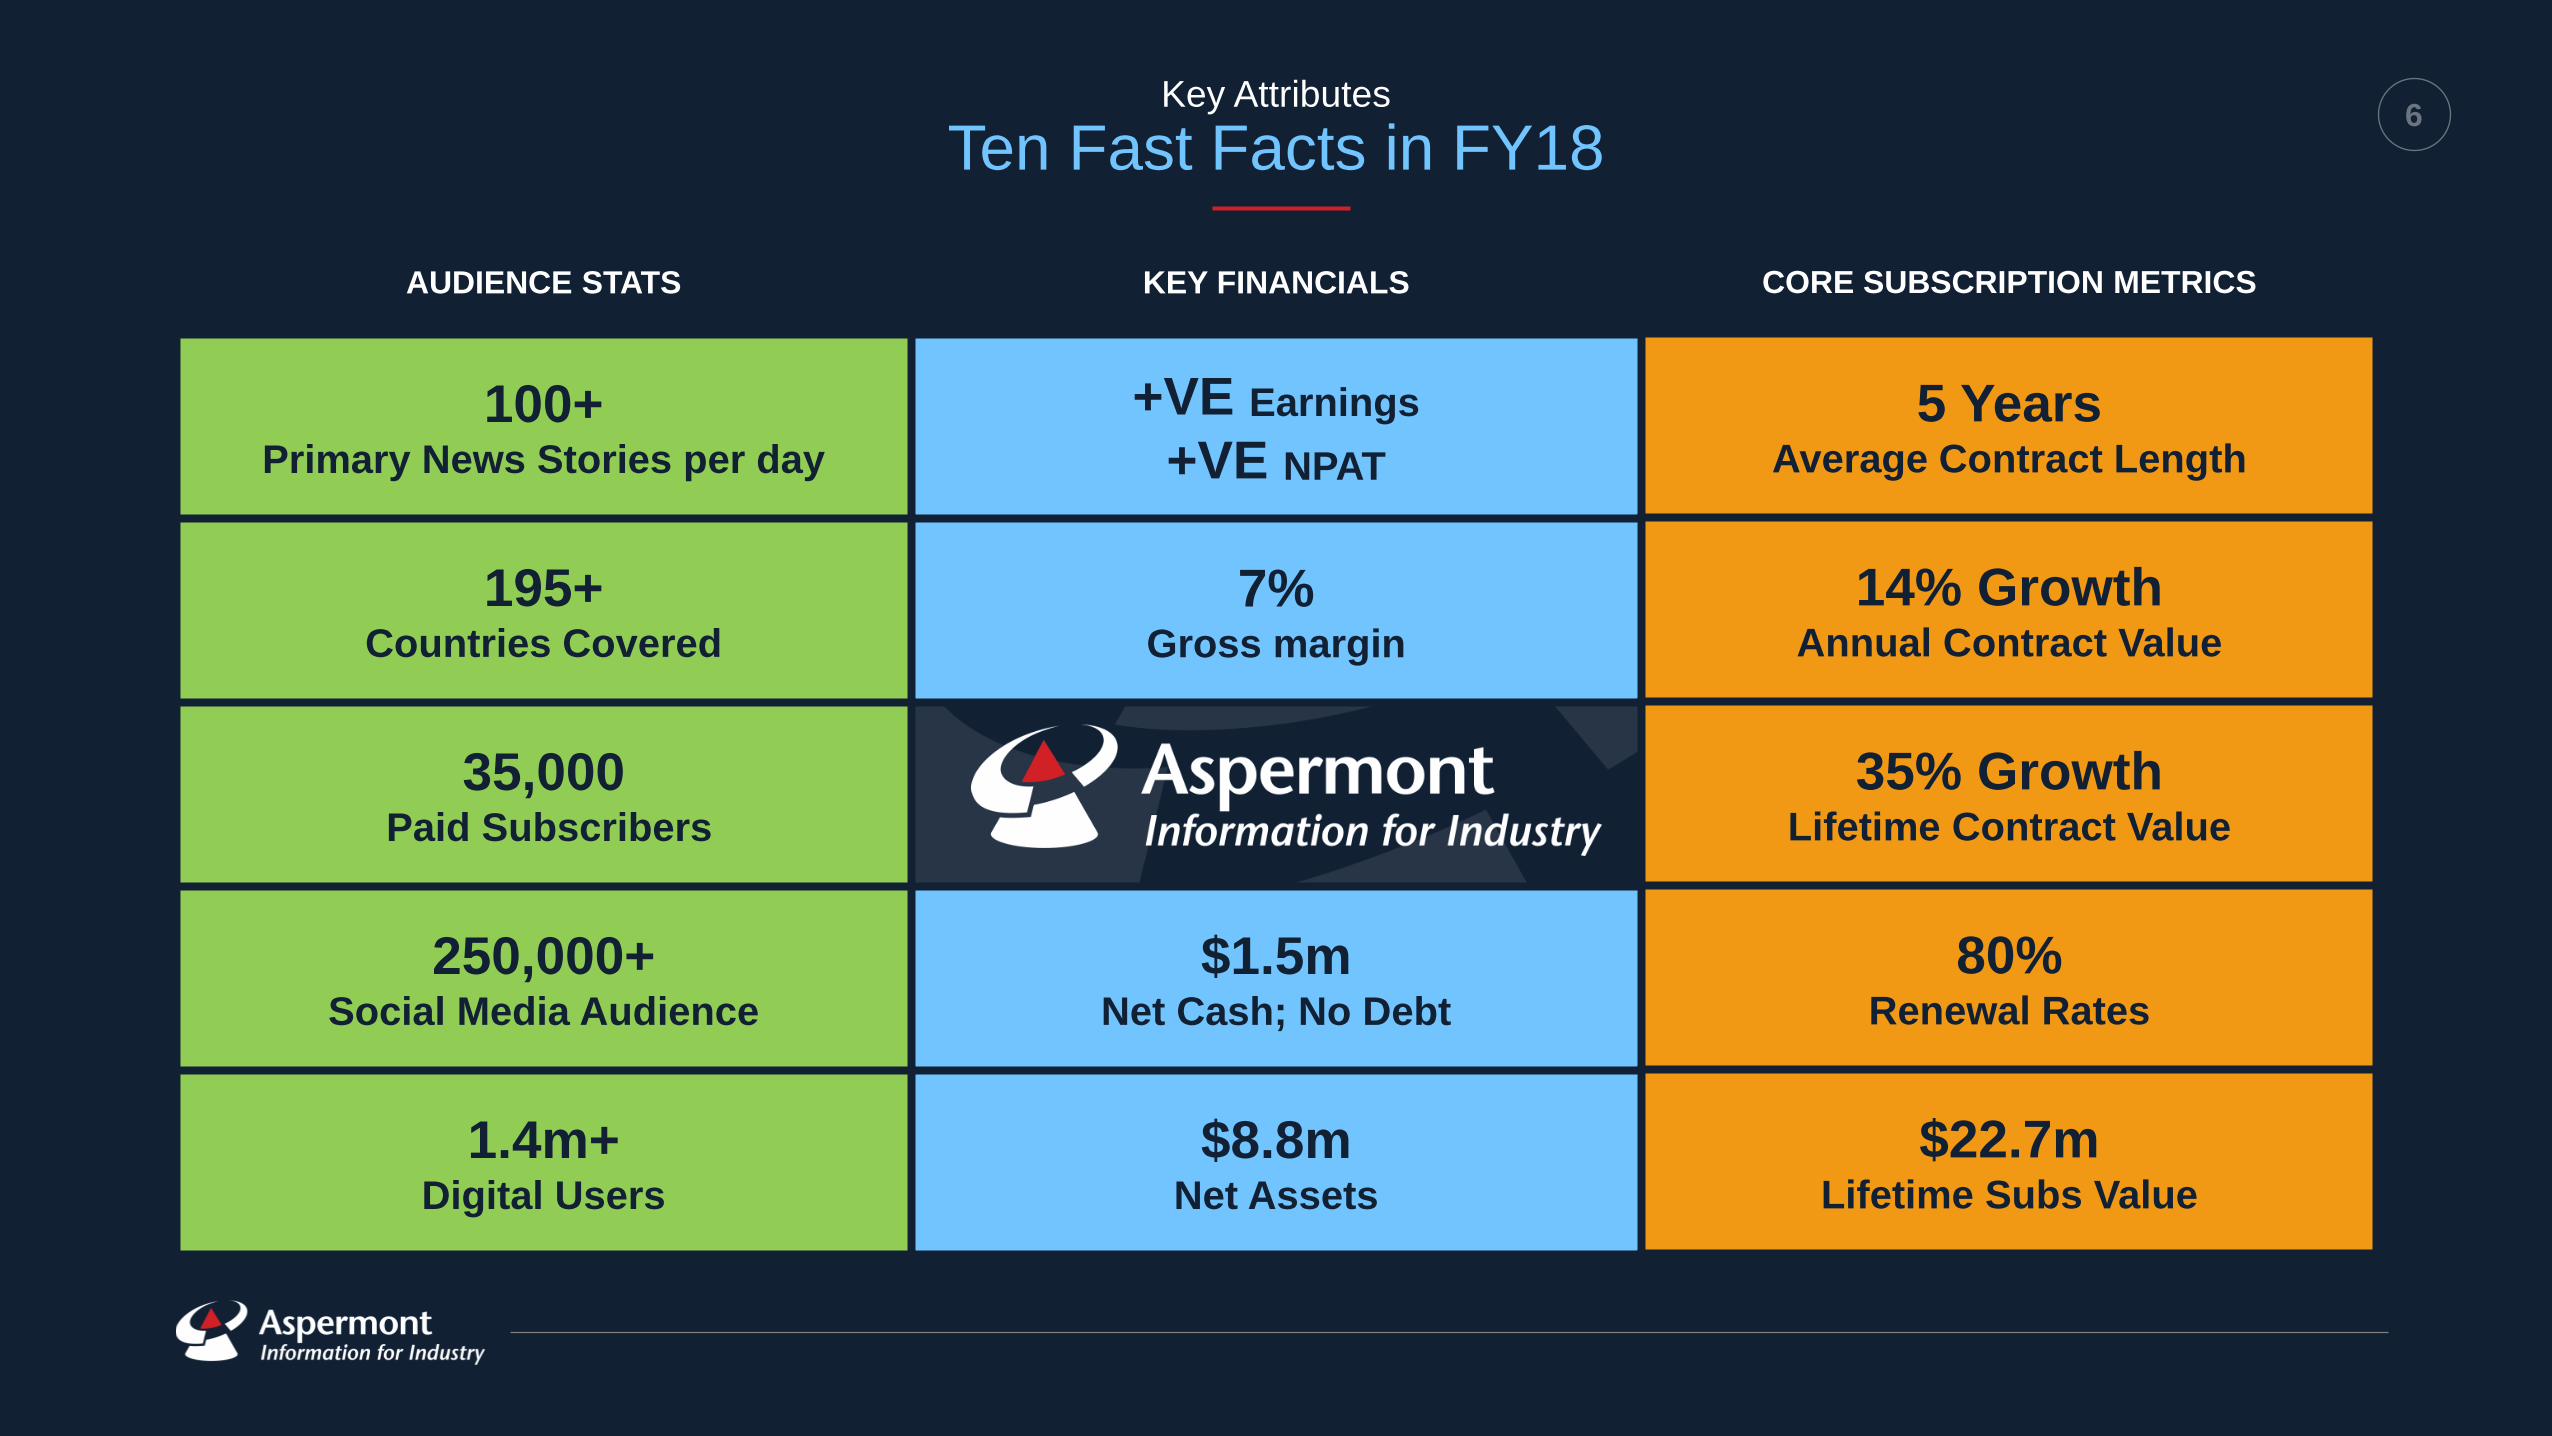
KEY FINANCIALS
+VE Earnings
+VE NPAT
7% Gross margin
$1.5m Net Cash; No Debt
$8.8m Net Assets
Key Attributes
Ten Fast Facts in FY18
35,000
Paid Subscribers
AUDIENCE
195 Countries covered
3500 Paid Subscribers
2500+ Social Media Audience
1.5m+ Digital Users 35,000
Paid Subscribers
KEY FINANCIALS
+VE Earnings
+VE NPAT
XX% Margin Increase
1.5m Net Cash; No Debt
16.6m Net Assets 35,000
Paid Subscribers
KEY FINANCIALS
5 Years Average Contract
14% Annual Contract Growth
35% Lifetime Contract Growth
78% Renewal Rates
22.5m Lifetime Subs Value
100 Primary news stories
AUDIENCE STATS
100+ Primary News Stories per day
195+ Countries Covered
35,000 Paid Subscribers
250,000+ Social Media Audience
1.4m+ Digital Users
CORE SUBSCRIPTION METRICS
5 Years Average Contract Length
14% Growth Annual Contract Value
35% Growth Lifetime Contract Value
80% Renewal Rates
$22.7m Lifetime Subs Value

7 Hybrid Media Model
Industry Landscape
Hybrid Model
Content Quality & Volume Focus
Investing in Key Talent
Print & Digital Revenue Based
In-House Sales Team
Premium rate Cards
Ahead Tech Curve
Systems Automation
Paid Only Content Model
Niche Audience Growth
Growing Profitability
Scalable Cost Base
Quality Content Focus
Retrenching Key Talent
Print Revenue Based
In-House Sales Team
Premium Rate Cards
Behind Tech Curve Manual
Systems
Controlled Circulation
Audience Declining
Value / Declining
Declining Profitability
High Fixed Cost
Print risk mitigated and repositioned as a premium product
Subscriptions and Digital advertising the main drivers of revenue
Direct client relationships maintained and fostered
Technology and systems in place to deliver quantum and scalable growth
Content Volume Focus
Freelancer Model
Digital Revenue Based Ad
Network Based
Low Value Rate Cards
Ahead Tech Curve Systems
Automation
Free / Metered Content
Model
High Growth Audience
Loss Leaders
Scalable Cost Base
Old B2B Media New B2B Media

8 Capability and Positioning
Competitive Strengths
Aspermont’s digital products have established leadership in a highly competitive field over the last 20 years. Our highly
regarded content has supported paywall technology to differentiate a range of products and services
Our 560 years brand heritage
supports successful product,
channel and brand extensions
Brand Strength
Early adopters in paywall
technology; disruptors in semantic
search; pioneers in marketing
automation
Innovation Leaders
Leading content provider to global
resources sector with direct
access to all CEOs within the
industry and supply chain
Market Leadership
Next generation platform gives
multi-medium competitive
advantage and deep behavioral
data analysis capabilities
Technology Platform
Tier 1 Executive and management
team with strong skills sets and
experience in media-tech industry
Leadership Team
Content stretch, expertise and
common platform creates
accelerated new market entrance
at low cost and short payback
Scalability

9 Aspermont Business Model
Integrated Customer Journey
Identify target market
(Editorial Coverage Ratio)
Re-architect existing portal site structure
Hire content freelancers
(Quality/Volume)
Digitally market daily newsletter
Generate free trial leads from paywall
Lead nurturing & sales conversion
Onboarding and engagement
Minimize retention risk
Multiple member loading
Position for upsell
Retain and Upsell Scale content value
proposition
Monitor subscriber usage patterns &
refine product
Activate re-engagement engine & win back process
for lost clients
10 SAAS Metrics
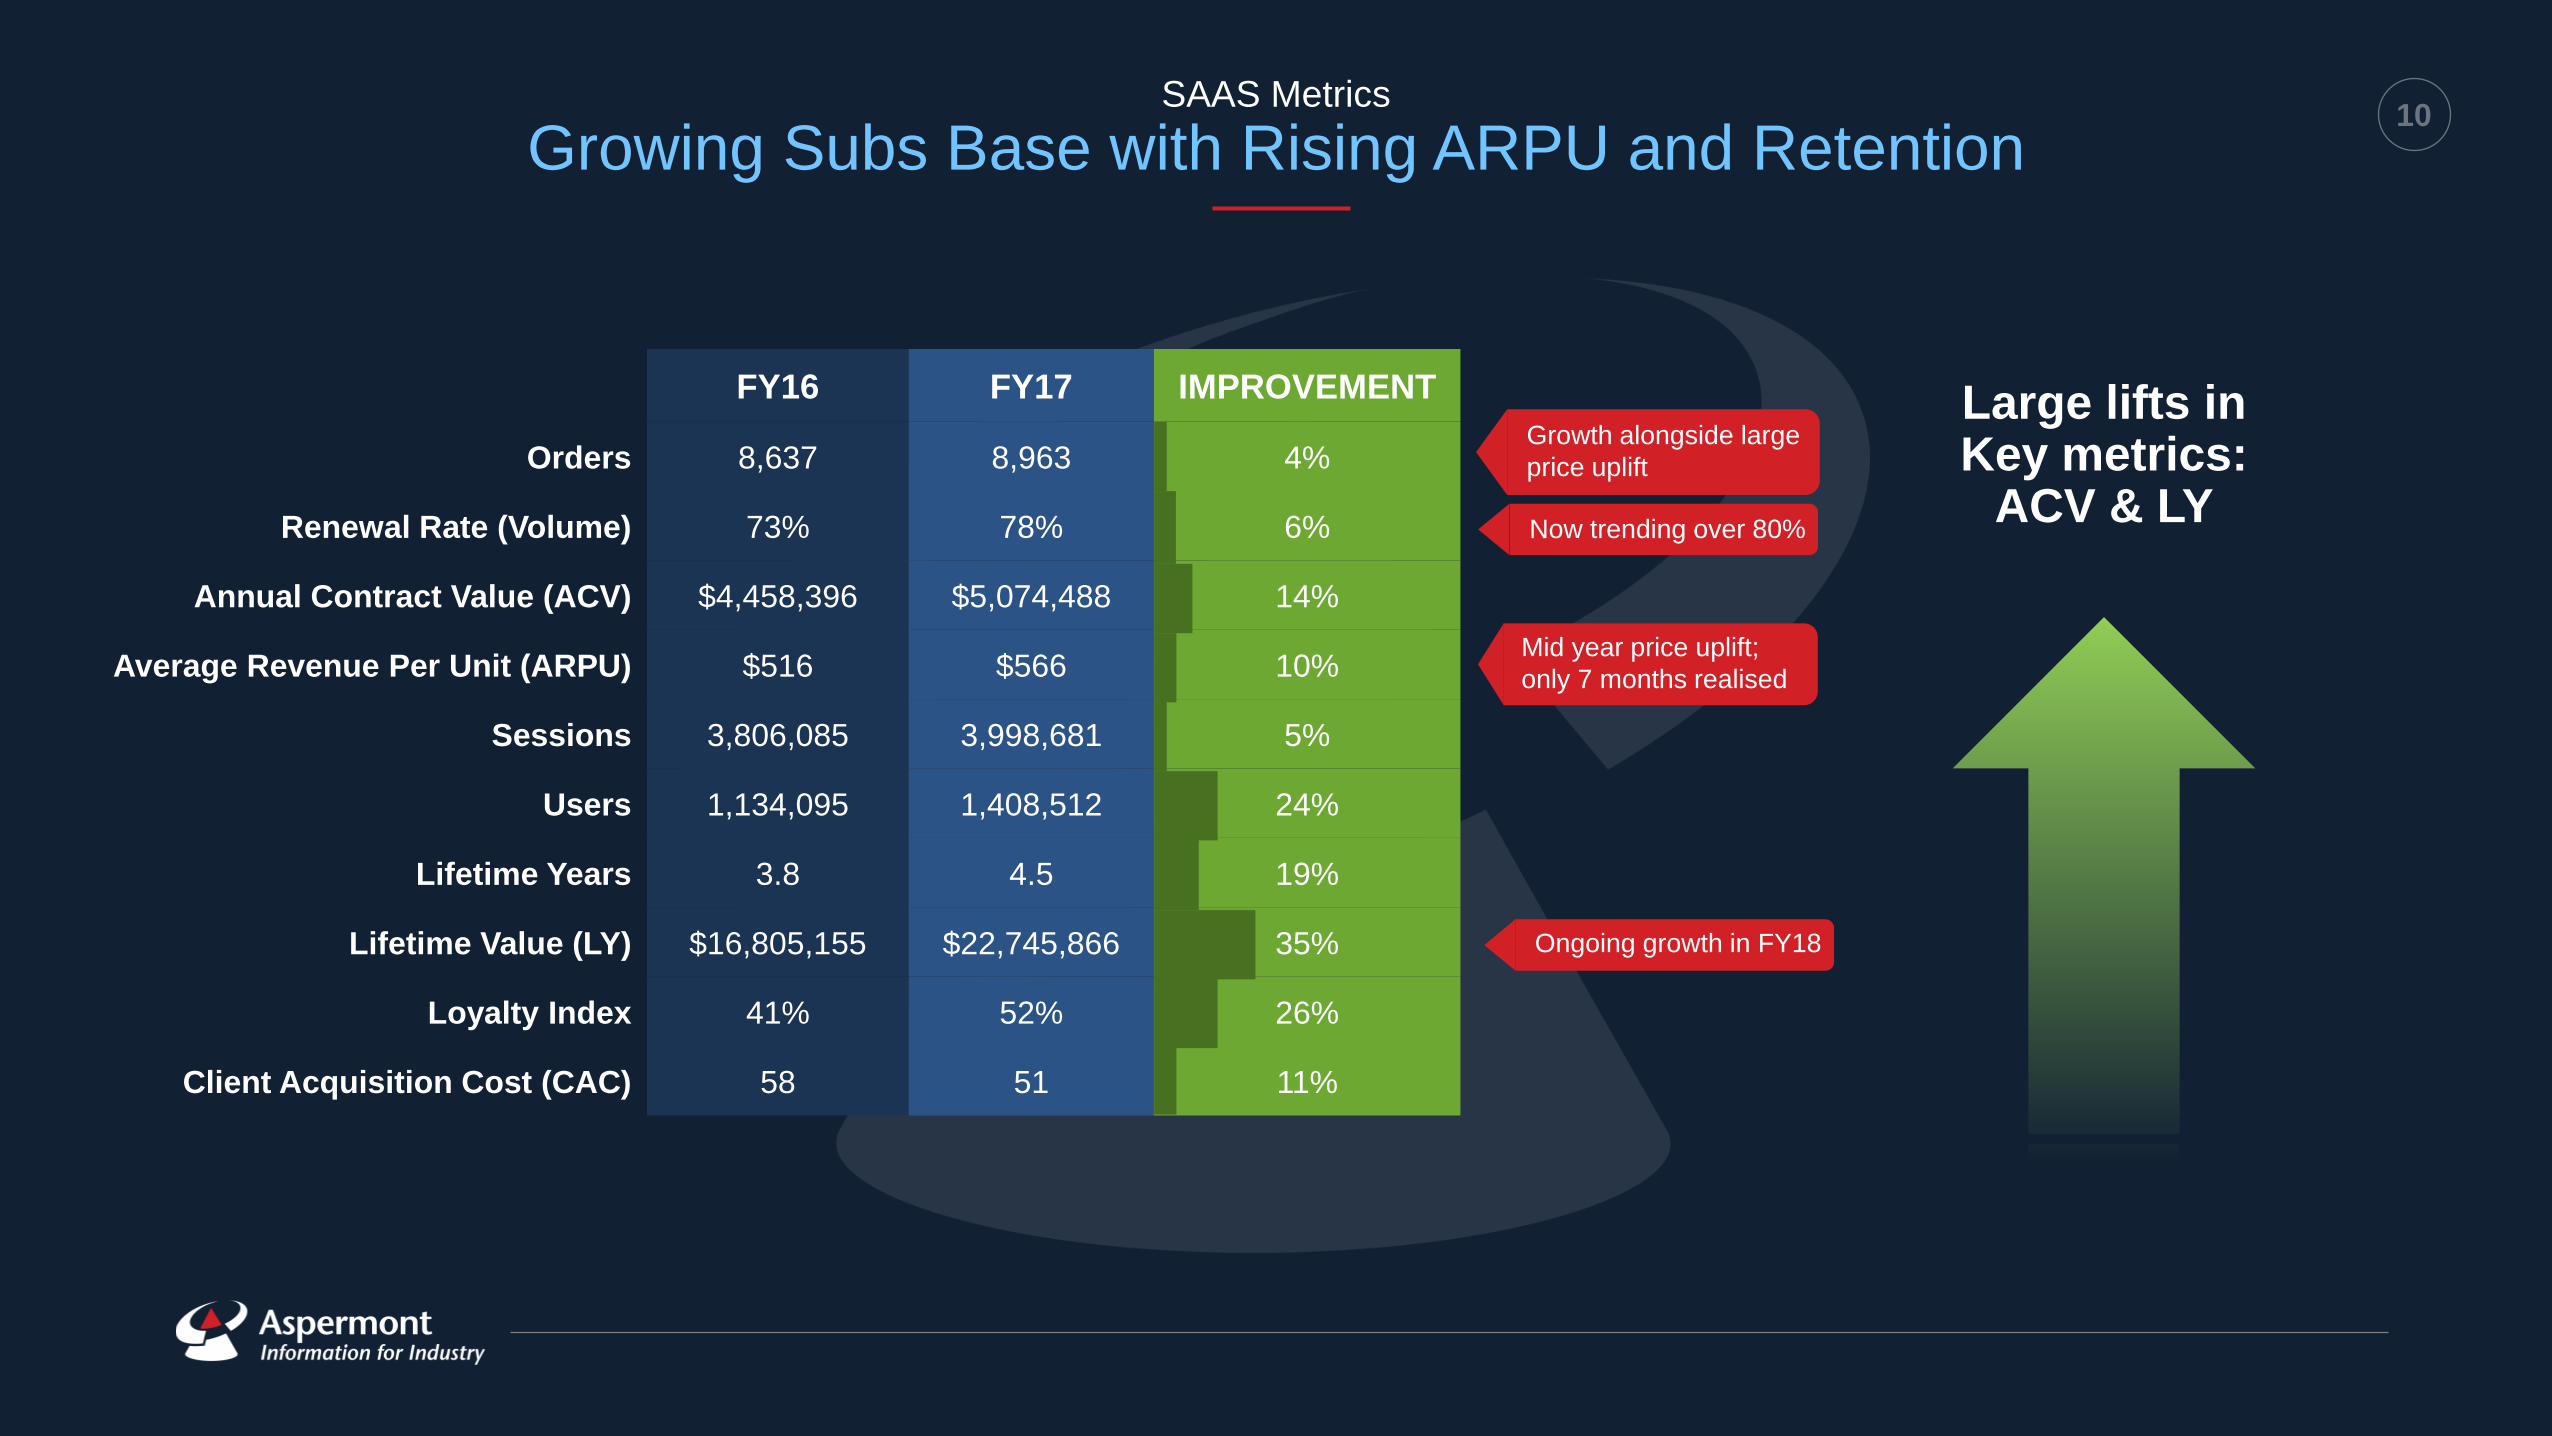
Growing Subs Base with Rising ARPU and Retention
FY16 FY17 IMPROVEMENT
Orders 8,637 8,963 4%
Renewal Rate (Volume) 73% 78% 6%
Annual Contract Value (ACV) $4,458,396 $5,074,488 14%
Average Revenue Per Unit (ARPU) $516 $566 10%
Sessions 3,806,085 3,998,681 5%
Users 1,134,095 1,408,512 24%
Lifetime Years 3.8 4.5 19%
Lifetime Value (LY) $16,805,155 $22,745,866 35%
Loyalty Index 41% 52% 26%
Client Acquisition Cost (CAC) 58 51 11%
Growth alongside large
price uplift
Ongoing growth in FY18
Now trending over 80%
Large lifts in Key metrics:
ACV & LY
Mid year price uplift;
only 7 months realised

11 Brand validation & cross-sector reach
Key Clients
STEEL
ENERGY
MINING
MANAGEMENT CONSULTANT
LEGAL
ACCOUNTING
TECHNOLOGY
ENGINEERING
MACHINERY / EQUIPMENT
INSURANCE
INVESTMENT SERVICES
BANKING
COMPANIES SUPPLY CHAIN FINANCIAL SERVICE SERVICES

12 Stabilisation; Turnaround; Growth
Financial Metrics
Revenue stabilised during transformation period *$0.7m+ subscriptions cash
Centralization, Digitalization and Offshoring
Revenues (A$’m)
Gross Profit (A$’m)
Operational margins growing
OPEX (A$’m)
Gross Profit %
14.8
11.7 12.1
0
5
10
15
20
FY 15 FY 16 FY 17
*
19.5
13.4 12.8
0
5
10
15
20
FY 15 FY 16 FY 17
0.4 0.6
0.8
00.20.40.60.8
1
FY 15 FY 16 FY 17
3% 5%
7%
0%
2%
4%
6%
8%
FY 15 FY 16 FY 17

13 Diversification and quality
Revenue Analysis
Australasia
North America
Europe
South America
Africa
57% 44% 35%
17% 18%
26%
25% 34% 38%
1% 3% 1%
FY15 FY16 FY17
Other
Subscriptions
DigitalAdvertising
PrintAdvertising
Global business with Australian heartland
1,500,000
1,700,000
1,900,000
2,100,000
2,300,000
2,500,000
2,700,000
2,900,000
3,100,000
H1-15/16 H2-15/16 H1-16/17 H2-16/17
INSERT Revenue by Brand
Pie chart – MJ/MM/MNN etc
Revenue by Source
Subscriptions cash collected ($AUD)
Digitally transformed w/ increased recurring revenue
Revenue by Geography Revenue by Source
35%
Upward momentum & technical break-out
Revenue by Product
Significant New Revenue Sources Coming in FY18: Research; Data & Events
Mining Journal
Mining Magazine
Geo Drilling
Australia's Mining Monthly
Energy News Bulletin
MiningNews.Net
PNG Report
International Coal News
Farming Ahead
Australian heartland; with increasing globalization
Low concentration & single product risk

14 Key Growth Strategy 1 – Build Core
Keystone Revenue & Cross Monetization
Lead Generation Engines Sponsorship opportunities around
our core audience
Content Marketing Content Hubs, Webinars, Surveys,
Client Profiles, List rental Research & Intelligence Launch of new research business
for open market and client
bespoke
Display Advertising Print, Online, Tablet & Newsletters
Subscriptions Various subscription models to upsell and
bundle content and brands
$$
38%
35%
Events
Data Build new data hub product & drive additional
content into core product
$$
Jobs Professional Placements & Job boards 2%
Launch of new events business to
build on top of existing products in
Ag sector
23%
2%
Keystone revenue
1. Aggressive growth of
subscriptions volumes
2. Development and cross-
sell of other revenue
branches
3. Margin maximization
through scalability
Training & Education Paid learning modules and accreditations
for industry professionals

15 Key Growth Strategy 2 – New Sector, New Geographies
Leveraging Model & Expertise
Scale existing brands
to new geographies 1
Leverage multi-lingual
platform capabilities 2
Build/launch new
brands in new sectors 3

16 Growth Strategy 3 – Disciplined Acquisitions
Targeted Assets, Cost Synergy & Digitalization
Target acquisitions
Restructure and deliver cost synergies
Transition to ASP platform, digitalize and
develop product extension
Cross-sell
1
2
3
4

17 What we are doing in the next 12 months
Execution Plan
Launch New
Business Lines
Commercially
Data
Research
Events
Launch
V4 Technology
Platform
Further develop
Our marketing
automation
solution
Accelerate
Subscriptions
Growth
Order Volume
ARPU
Lifetime Value
Integrated
Sponsorship
Solutions
Raising overall
client spend and
cross sell ratio

18
Conclusion
• 2 year transformation complete
• Aspermont is now the worlds leading media services provider to global resources industry
• Company has clear and substantial growth strategies to leverage its content platform and digital expertise; to aggressively expand the business across geographies and sectors
• High performance SAAS based subscription model with • Growing profitability;
• High quality revenues and
• World leading customer endorsements
• Relentless focus on executing growth opportunities with highly capable and aligned board and management team
19
For further information
4th floor, Vintners Place
68 Upper Thames Street
London, EC4V 3BJ
Email: [email protected]
Office Phone: +44 (0) 207 216 6060
Address
Contact Info
Telephone

20 Why we can win
Highly Experienced Leadership Team
Sean McKeown General Manager;
Australia
Alex Kent Group Managing
Director
Ajit Patel Chief Operating
Officer
Nishil Khimasia Chief Financial
Officer
Robin Booth Group General Manager
Sean has more than 20 years’
experience in digital media industry
and the events industry . Before
joining Aspermont in 2015 Sean
was the founding commercial
director of the successful digital
media start-up Mumbrella
Australia, and launched its sister
company in Singapore. He
specialises in business
development and commercial
management with emphasis on
developing and implementing new
revenue models led through
content marketing.
At Aspermont Sean is General
Manager of the Australia
Since joining in April 2014 as UK
General Manager, Robin has
already seen a major turnaround in
the UK brands. He is now the
Group General Manager
Previously, Robin was Group
Publishing Director at Incisive
Media, where he transformed both
the Business Finance Group and
Institutional Investment Groups, led
the company’s digital transition for
several of its established brands
and managed a largescale events
portfolio.
Robin brings specialist skills
change management, digital
transformation and technology
Nishil has significant and relevant
experience in financial
management, business
development and transformation in
entrepreneurial growing companies
in the global B2B sector. Over the
past 8 years Nishil held CFO and
General Management positions at
Equifax UK & Ireland, part of
Equifax Inc., one of the world’s
largest information solutions
providers, with responsibility for
developing UK & Ireland business.
Ajit has more than 30 years of
experience in technology; working
across digital media, events and
research. Previously Ajit was the
CTO for Incisive Media, where he
was responsible for infrastructure,
software development, online
strategy and large scale systems
implementation.
Ajit came to Aspermont to help
deliver the technological base to
enable the company to deliver on
its long-term solution. He is now
responsible for all services
departments including marketing.
Alex joined Aspermont in 2007
having spent the early part of his
career at Microsoft.
Starting with the creation of a
semantic search division for the
company he has since worked in
all areas of the Aspermont Group.
His prime skills sets of technology
and marketing saw him hold the
role of Group CMO prior to
becoming Managing Director.
Alex has BSc degrees in
Economics, Accounting and
Business Law. He has been a key
driver of the overall vision for the
company and its deep-seated
technological focus.

21 Why we can win
Board of Directors
Clayton Witter Non-executive Director
Christian West Non-executive Director
Andrew Kent Chairman and
Executive Director
Geoff Donohue Lead Independent Director
Clayton Witter has over 20 years’
experience in advising large and
medium size organisations on
implementation of new
technologies to transform business
processes across a number of
sectors including FMCG (consumer
goods), Manufacturing, Banking,
Information Technology and
Electrical household appliances.
He was previously Managing
Director at Beko Plc, the UK home
appliance manufacturer where
under his management, Beko
became market leader across
multiple product categories.
Mr. Geoff Donohue has over 29
years experience at both board and
senior management level within
public companies and the
securities industry. Mr. Donohue
holds a Bachelor of Commerce
from James Cook University of
North Queensland, Graduate
Diploma in Financial Analysis from
the Securities Institute of Australia
and is a Certified Practicing
Accountant.
Andrew Kent, Chairman and
Executive Director, is an
experienced Business Manager
and Corporate Advisor with over 40
years experience in international
equities and media. Mr. Kent was
the CEO of Aspermont from 2000
to 2005 and holds considerable
knowledge of its products and the
market landscape. He is a member
of the Australian Institute of
Company Directors.
Christian West has over 16 years’
experience in advising public
companies on portfolio structure
and in deal origination,
development and financing for
private companies. Christian has a
successful track record investing in
global equities, through public
market, venture capital and private
equity investment channels across
media, technology and natural
resource sectors. He is currently a
Director of RDP Limited, a venture
capital group specialist in the
natural resources sector
Group Managing
Director
Alex joined Aspermont in 2007
having spent the early part of his
career at Microsoft.
Starting with the creation of a
semantic search division for the
company he has since worked in
all areas of the Aspermont Group.
His prime skills sets of technology
and marketing saw him hold the
role of Group CMO prior to
becoming Managing Director.
Alex has BSc degrees in
Economics, Accounting and
Business Law. He has been a key
driver of the overall vision for the
company and its deep-seated
technological focus.
Alex Kent
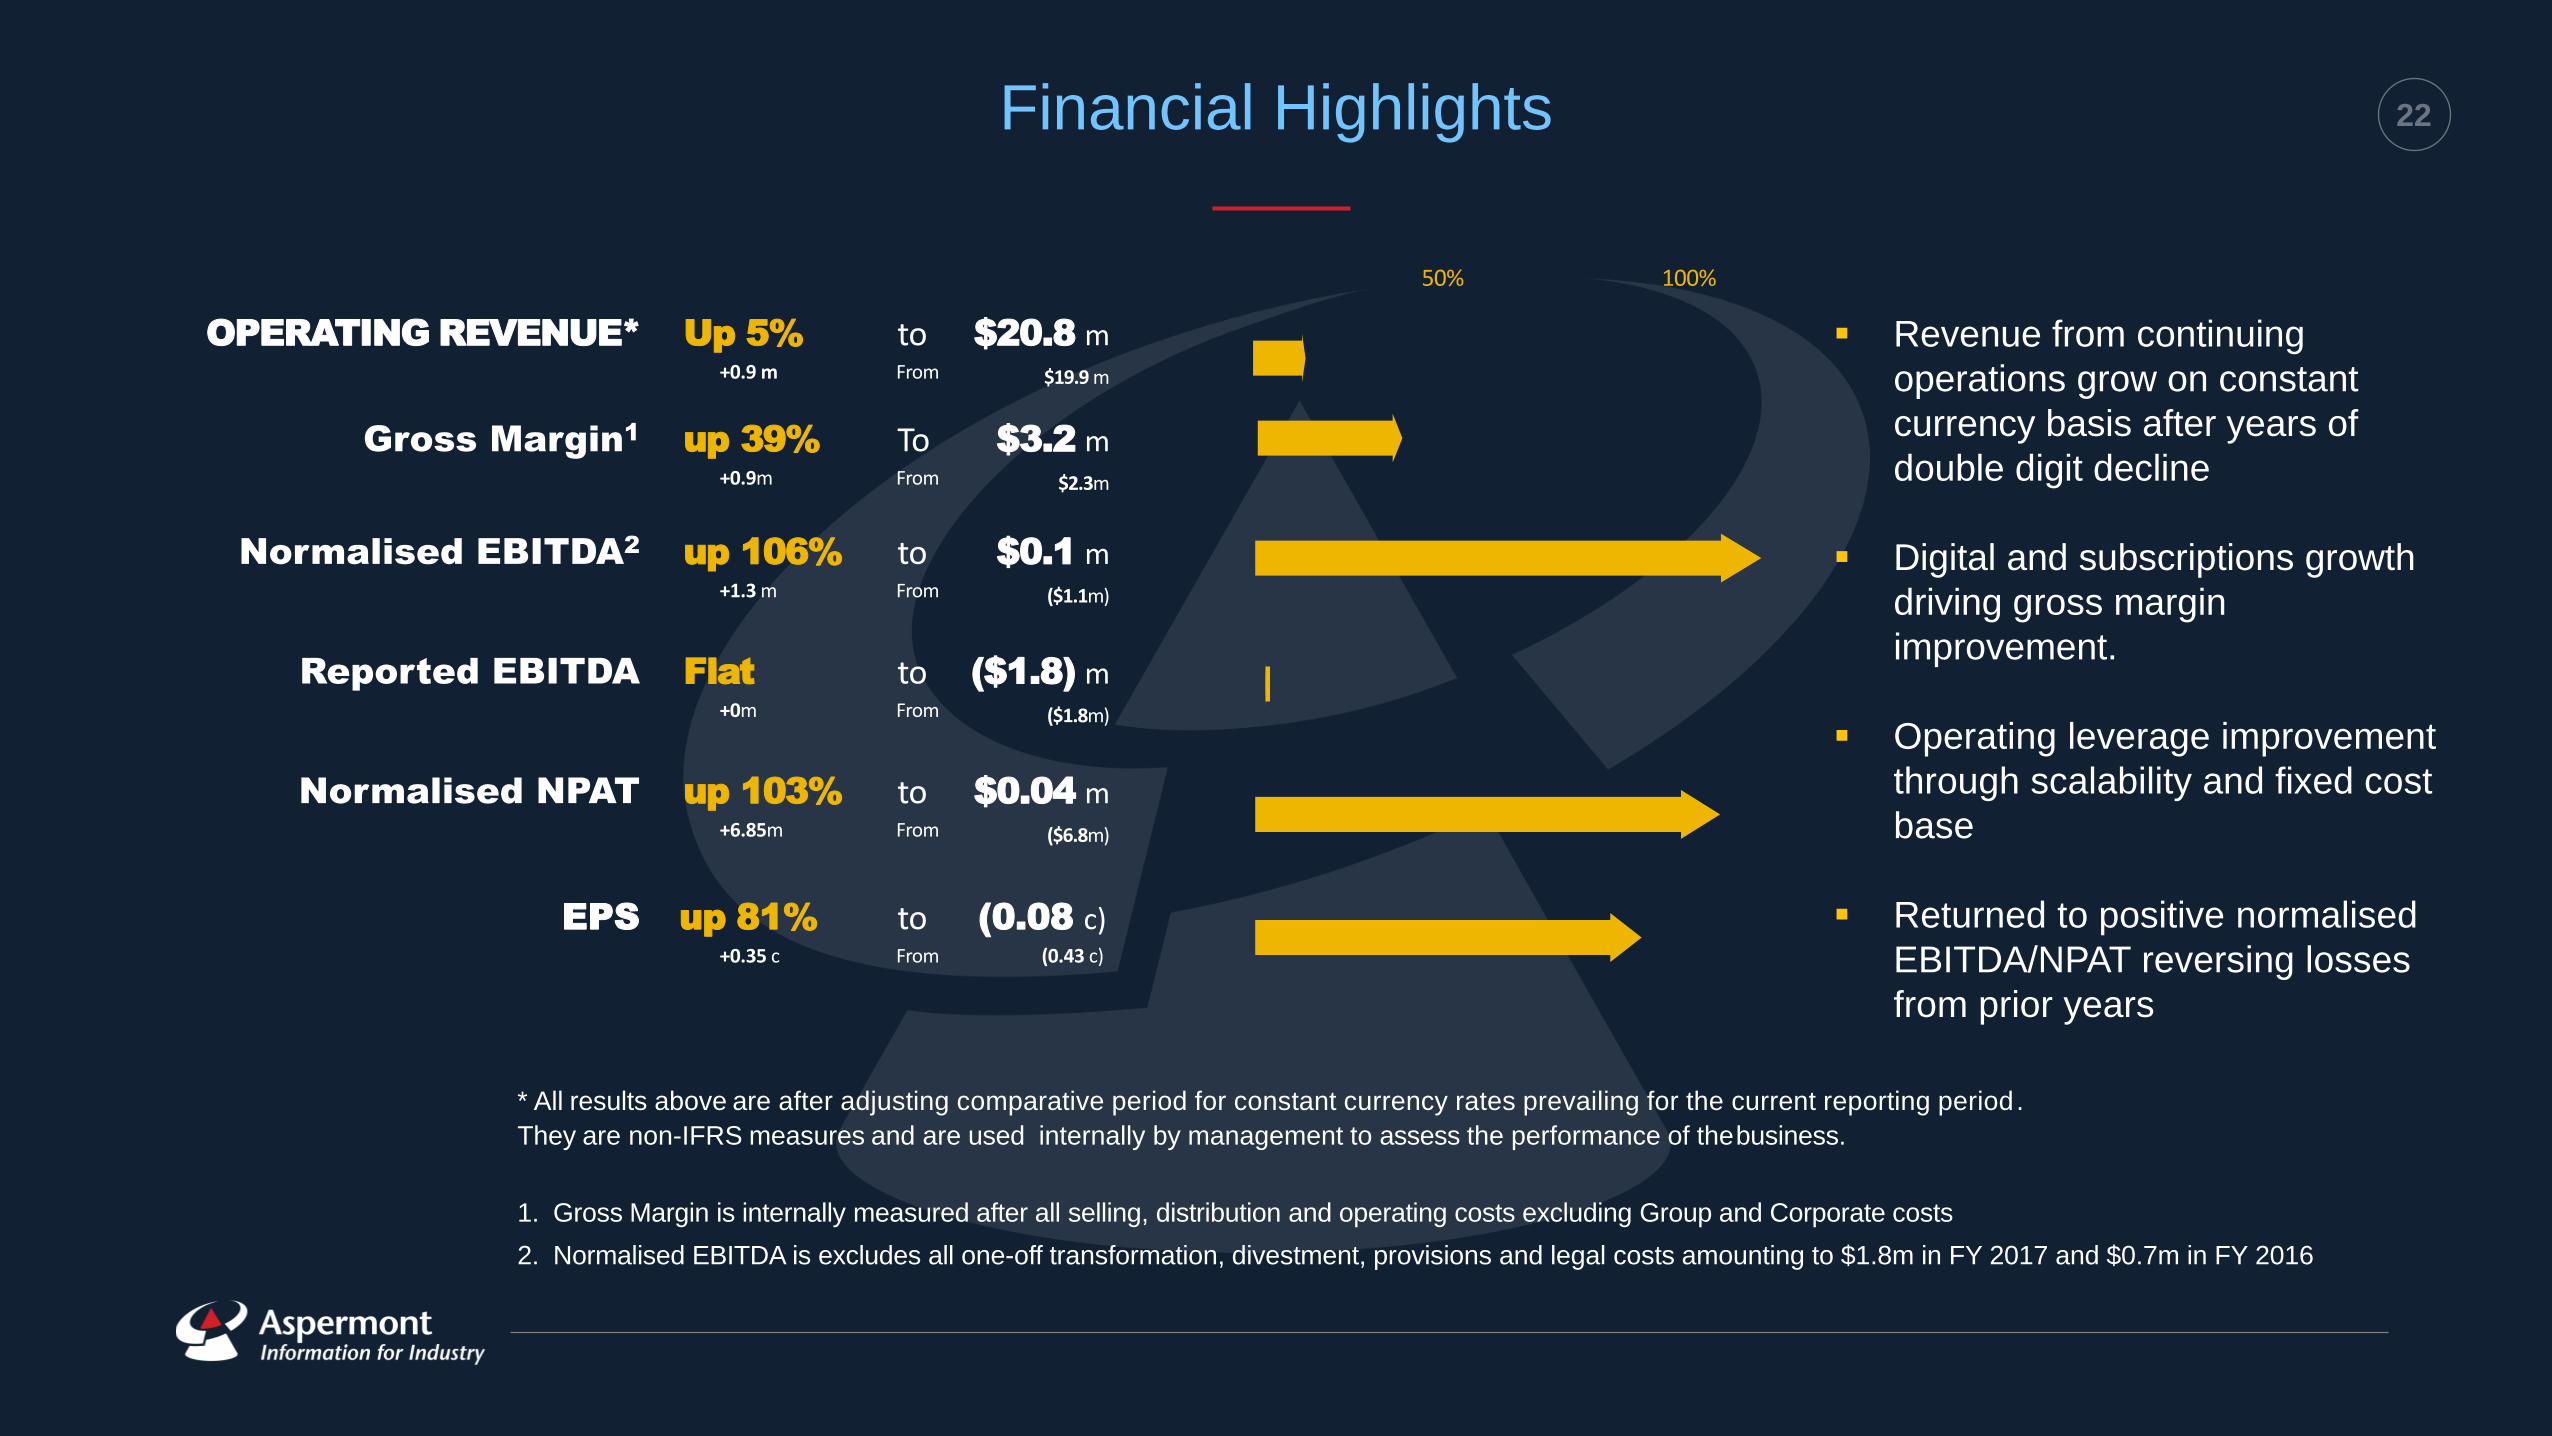
22 Financial Highlights
OPERATING REVENUE*
Up 5%
+0.9 m
to From
$20.8 m $19.9 m
Gross Margin1
up 39% +0.9m
To From
$3.2 m $2.3m
Normalised EBITDA2
up 106% +1.3 m
to From
$0.1 m ($1.1m)
Reported EBITDA Flat +0m
to From
($1.8) m ($1.8m)
Normalised NPAT up 103%
+6.85m
to From
$0.04 m ($6.8m)
EPS up 81%
+0.35 c
to From
(0.08 c) (0.43 c)
50% 100%
Revenue from continuing
operations grow on constant
currency basis after years of
double digit decline
Digital and subscriptions growth
driving gross margin
improvement.
Operating leverage improvement
through scalability and fixed cost
base
Returned to positive normalised
EBITDA/NPAT reversing losses
from prior years
* All results above are after adjusting comparative period for constant currency rates prevailing for the current reporting period.
They are non-IFRS measures and are used internally by management to assess the performance of the business.
1. Gross Margin is internally measured after all selling, distribution and operating costs excluding Group and Corporate costs
2. Normalised EBITDA is excludes all one-off transformation, divestment, provisions and legal costs amounting to $1.8m in FY 2017 and $0.7m in FY 2016

23 Continuing Operations
Summary P&L and Key Operating Metrics
Global business with Australian heartland
Upward momentum & break out
New Revenue Sources FY18; Launch of Research; Data & Events
businesses
INSERT Revenue by Brand
Pie chart – MJ/MM/MNN etc
30%
Revenue by Source
$’000 FY15 FY16 FY17
Revenue from Continuing Operations1 16,350 11,710 11,401
Costs of undertaking business excl.
exceptionals2 (19,407) (12,733) (12,210)
Discontinued operations - (76) 869
Normalised EBITDA3 (3,057) (1,099) 60
Exceptional non recurring3 - (710) (1,845)
EBITDA (3,057) (1,809) (1,785)
Depreciation/Amortisation (880) (544) (545)
Financing Costs (585) (509) (160)
Revaluations/Impairments/Divestments (6,364) (3,974) 4,049
NPBT (10,886) (6,836) 1,559
Income tax (expense) / benefit 1,082 7 (1,516)
Normalised NPAT (9,804) (6,829) 43
Fair value adjustment Loan receivable - - (1,274)
Reported NPAT (9,804) (6,829) (1,231)
$’000 FY15 FY16 FY17
Gross Profit margin (% of revenue)4 3% 5% 7%
Normalised EBITDA margin (% of revenue) (19%) (9%) 0.5%
Recurring Revenue % of Total Revenue5 55% 58% 61%
Client acquisition costs (% of subs revenue) 1% 1% 1%
1. Excludes revenues from discontinued operations in prior year at constant exchange
rates prevailing FY17
2. FY 17 costs include investment made in rolling out new products and sales upskilling
3. Normalised EBITDA excludes all one-off transformation, divestment and legal costs
4. Gross Profit margin includes all costs other than Group Management & Corporate
costs
5. Recurring revenue is based on retained subscriptions and any revenue from
Advertising from customers who have bought services for two years or more
6. Client Acquisition costs relates to marketing and associated acquisition costs for new
subscription
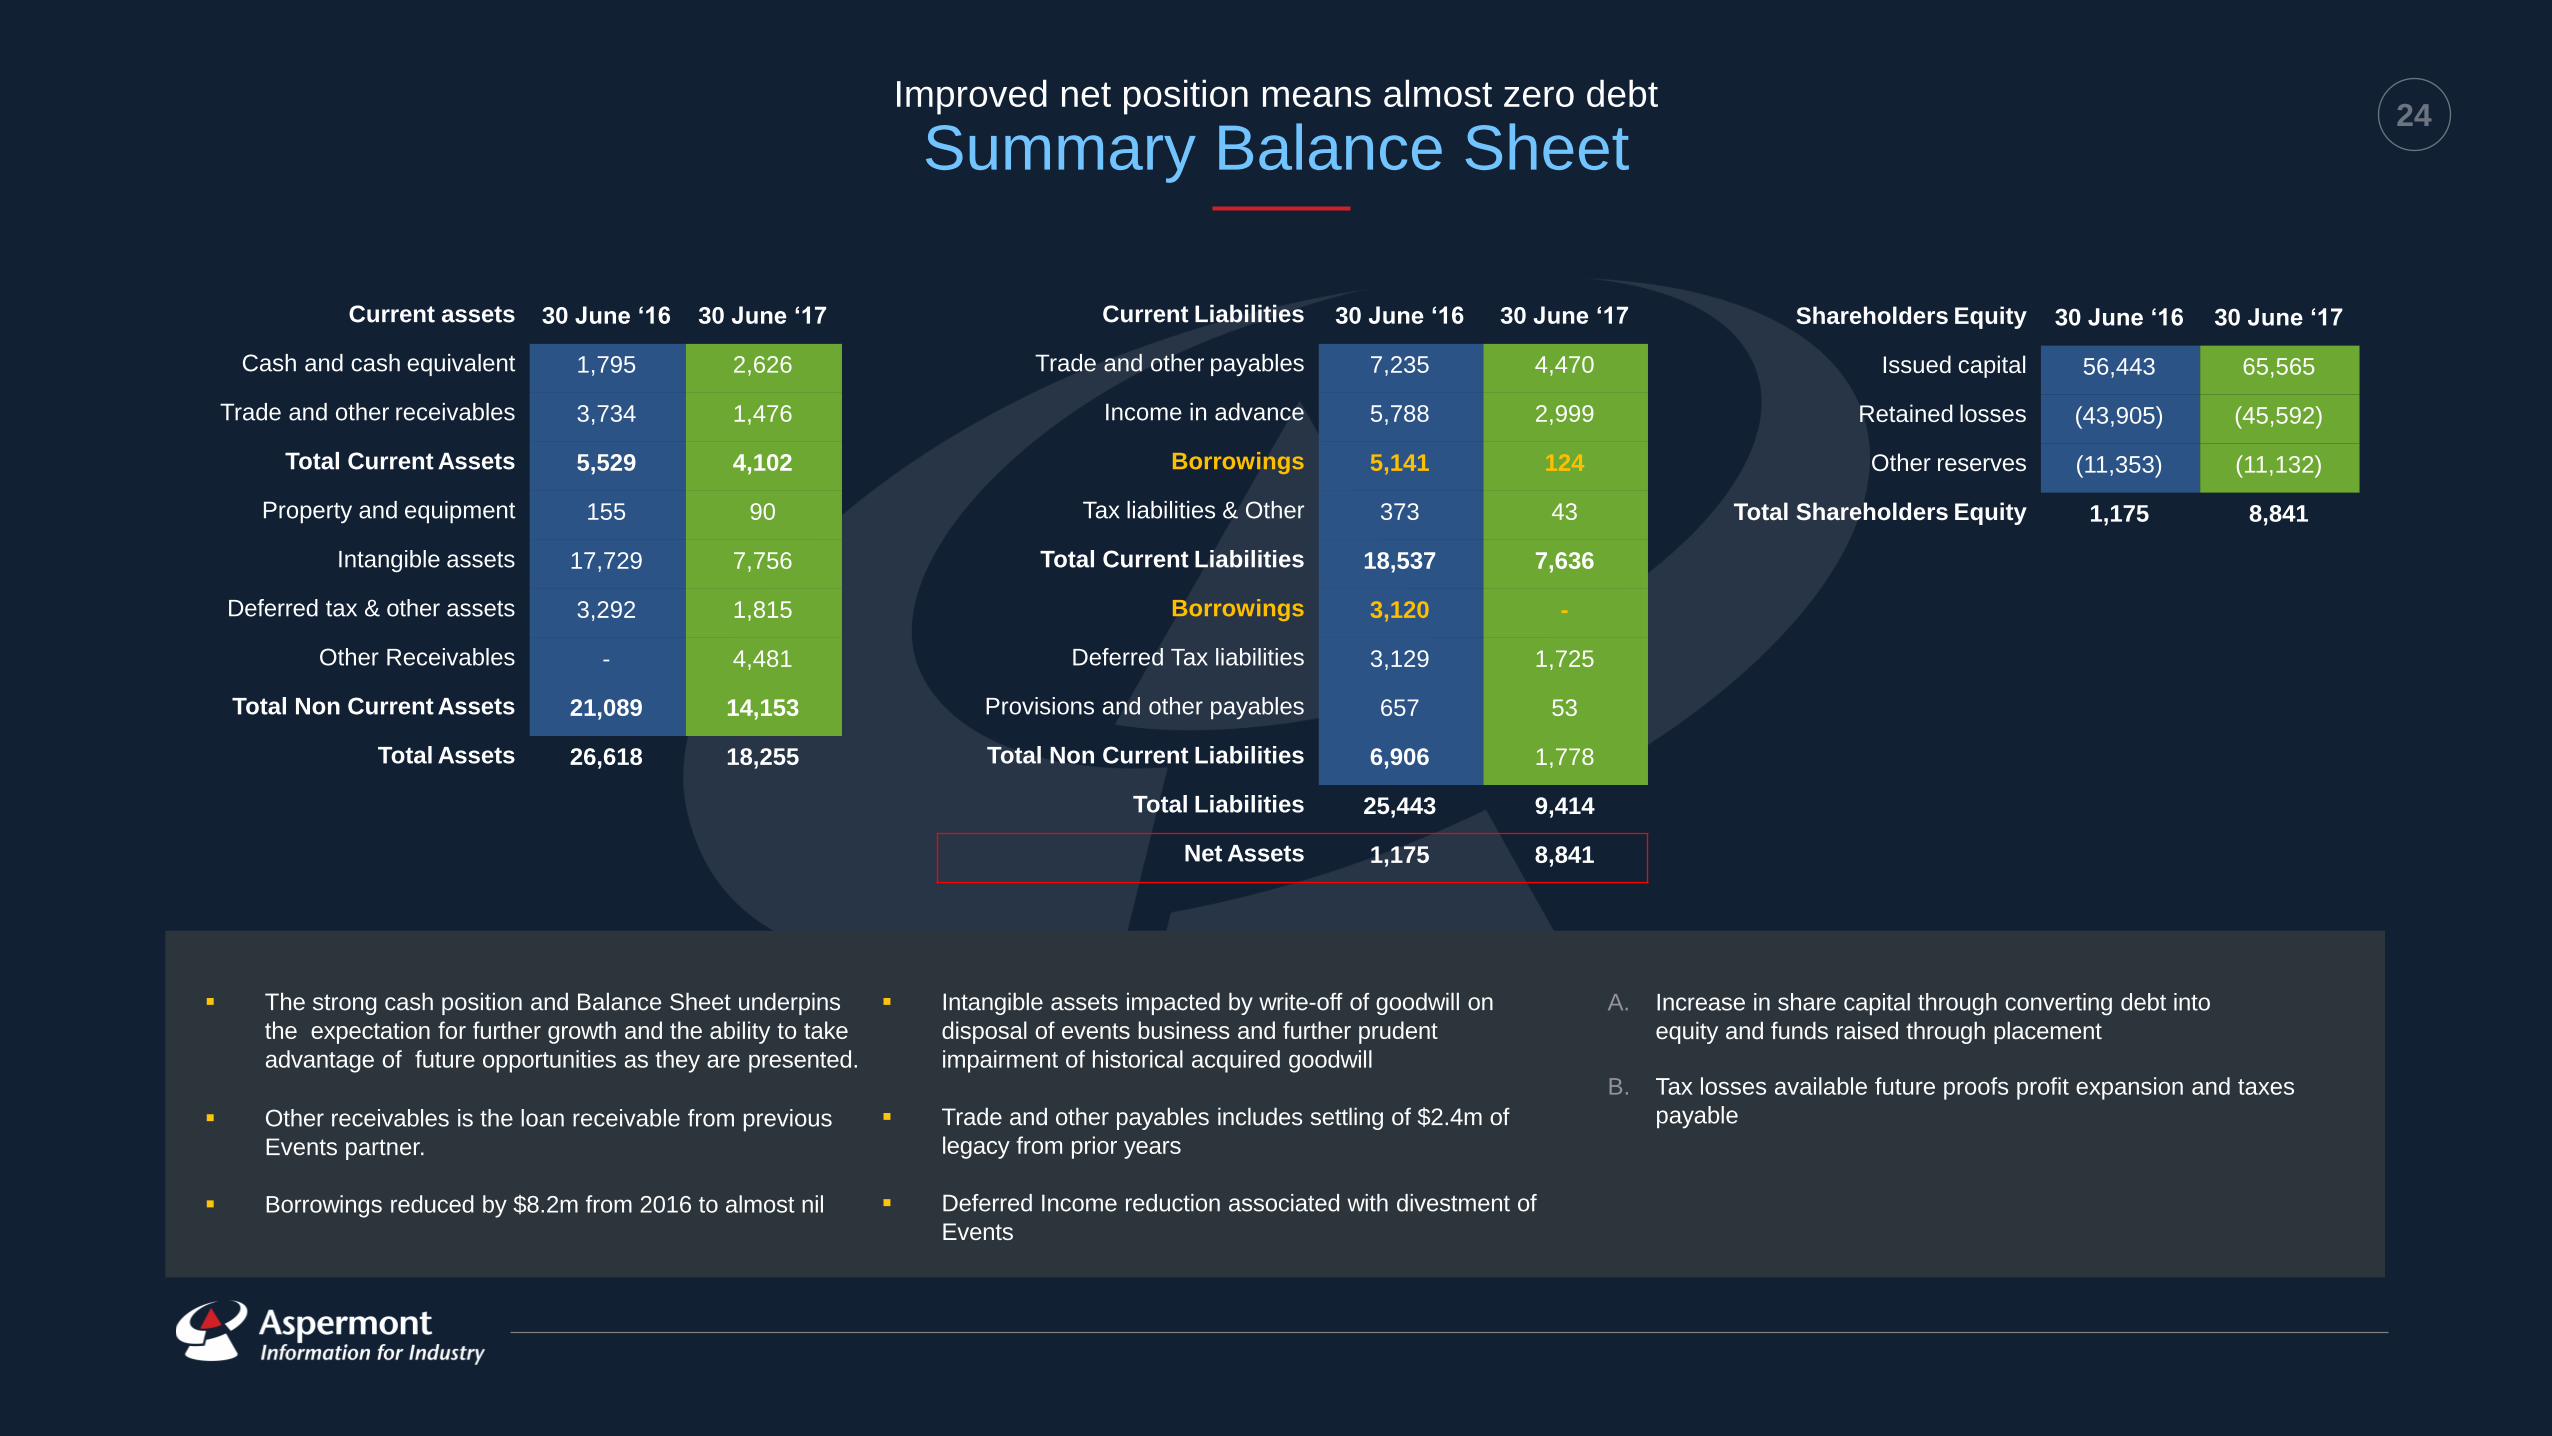
24 Improved net position means almost zero debt
Summary Balance Sheet
Global business with Australian heartland
Upward momentum & break out
New Revenue Sources FY18; Launch of Research; Data & Events
businesses
INSERT Revenue by Brand
Pie chart – MJ/MM/MNN etc
30%
Revenue by Source
Current assets 30 June ‘16 30 June ‘17
Cash and cash equivalent 1,795 2,626
Trade and other receivables 3,734 1,476
Total Current Assets 5,529 4,102
Property and equipment 155 90
Intangible assets 17,729 7,756
Deferred tax & other assets 3,292 1,815
Other Receivables - 4,481
Total Non Current Assets 21,089 14,153
Total Assets 26,618 18,255
Current Liabilities 30 June ‘16 30 June ‘17
Trade and other payables 7,235 4,470
Income in advance 5,788 2,999
Borrowings 5,141 124
Tax liabilities & Other 373 43
Total Current Liabilities 18,537 7,636
Borrowings 3,120 -
Deferred Tax liabilities 3,129 1,725
Provisions and other payables 657 53
Total Non Current Liabilities 6,906 1,778
Total Liabilities 25,443 9,414
Net Assets 1,175 8,841
Shareholders Equity 30 June ‘16 30 June ‘17
Issued capital 56,443 65,565
Retained losses (43,905) (45,592)
Other reserves (11,353) (11,132)
Total Shareholders Equity 1,175 8,841
A. Increase in share capital through converting debt into
equity and funds raised through placement
B. Tax losses available future proofs profit expansion and taxes
payable
The strong cash position and Balance Sheet underpins
the expectation for further growth and the ability to take
advantage of future opportunities as they are presented.
Other receivables is the loan receivable from previous
Events partner.
Borrowings reduced by $8.2m from 2016 to almost nil
Intangible assets impacted by write-off of goodwill on
disposal of events business and further prudent
impairment of historical acquired goodwill
Trade and other payables includes settling of $2.4m of
legacy from prior years
Deferred Income reduction associated with divestment of
Events

25 Improved cash flow conversion
$’000 FY 16 FY 17
Cash Receipts from Suppliers1
24,889 19,435
Cash Payments to suppliers* (24,550) (19,220)
Financing/Other (496) (45)
Normalised cash flow from
Operations2
(pre exceptionals/divestment adjustments)
204 469
Non recurring one off payments3 - (2,316)
Divestment adjustment - (2,225)
Reported Cash flow from
Operations
204 (4,072)
Notes:
1. 2016 Cashflows include revenues of $1.4m from
discountinued products
2. Normalised Operating Cashflow reflects the true
underlying cashflow from operations excluding non
recurring one-off payments incurred
3. Non recurring one-off cash payments relate to mainly
historic legacy aged creditors and restructuring
transformation costs

26 Cost composition and scalability
Margin expansion while increasing investment
Global business with Australian heartland
Upward momentum & break out
New Revenue Sources FY18; Launch of Research; Data & Events
businesses
INSERT Revenue by Brand
Pie chart – MJ/MM/MNN etc
30%
Revenue by Source
3%
9%
15%
0%
2%
4%
6%
8%
10%
12%
14%
16%
-
5.0
10.0
15.0
20.0
25.0
30.0
35.0
40.0
FY 2015 FY 2016 FY 2017
Direct Costs GP %
Direct costs / Gross Profit
Transformation and restructuring has led to 18% reduction or $10m takeout of costs in
the business over last two years. Total expenses down 14% year on year:
• reinvestment of sales restructure savings into upskilling digital and
subscriptions sales;
• continued improvement in productivity through outsourcing and capacity
management in services, support and product; and
• reduction in general office & corporate
Total expenditure ($ Millions)
FY15 FY16 FY17
160 123 116
Headcount
Cost Of Sales 54%
Distribution 2%
Sales & Marketing
10%
Support & Services
6%
Corporate, Occupancy &
Admin 28%

27 NPAT bridge
Continuing improvement in profitability
Global business with Australian heartland
Upward momentum & break out
New Revenue Sources FY18; Launch of Research; Data & Events
businesses
INSERT Revenue by Brand
Pie chart – MJ/MM/MNN etc
30%
Revenue by Source
$’000 Reported Attributable
to parent
NPAT FY16 (6,829) (6,470)
Improvement in operational profit 626
Divestment related 5,915
Impairment/Revaluations (19)
Reduced Financing costs 350
Normalised NPAT FY17 43
Fair value adjustment Loan receivable (1,274)
NPAT FY 17 (1,231) (1,687)
Key Improvements
• EBITDA expansion +$0.6m YoY
• Divestment +$5.9m
• Gain from Sale of Beacon Events
business; less balance sheet adjustments
associated with divestment
• Financing & Revaluations +$0.4m
• Business improvement and cash flow
visibility has reduced the level of
impairments and negative revaluations
• Lower financing costs as debt reduced to
nil
Notes:
After adjusting for net profit/(loss) attributable to non-controlling
interest

28 Clear Responsibility
Functional Structure – Board & Exec
ASPERMONT
COO
IT
Production
Marketing
Subscriptions
Data
General Manager
Advertising
Events
Research
Content
Human Resources
CFO
Finance
Premises
Insurance
Administration
Managing Director
IR / Funding
Vision & Strategy
Legal
JV / M&A
Board
Audit
Remuneration
Corporate Governance
Company Secretary

29
Glossary
Lifetime value based on average revenue per unit (ARPU) and renewal rates
Gross Profit and Margin has been calculated as contribution from revenue less direct costs excluding Group Management and Corporate costs and margin as gross profit divided by revenue
Normalized EBITDA has been calculated by excluding one-off restructuring and exceptional non recurring costs from reported EBITDA
EBITDA margin has been calculated by dividing EBITDA by revenue.
NPAT margin has been calculated by dividing NPAT by revenue.
Client Acquisition Cost (CAC) cost of acquiring new customers divided by the number of new customers

30
Disclaimer
Important notice disclaimer
Forward-looking standard elements
This presentation may include forward-looking statements. Such statements can generally be identified by the use of words such as 'may', 'will', 'expect', 'intend', 'plan', 'estimate', 'anticipate', 'believe', 'continue', 'objectives', 'outlook', 'guidance‘, ‘forecast’ and similar expressions. Indications of plans, strategies, management objectives, sales and financial performance are also forward-looking statements.
Such statements are not guarantees of future performance, and involve known and unknown risks, uncertainties, assumptions, contingencies and other factors, many of which are outside the control of Aspermont Limited (Aspermont or Company). No representation is made or will be made that any forward-looking statements will be achieved or will prove to be correct. Actual results, performance, operations or achievements may vary materially from any forward-looking statements. Circumstances may change and the contents of this presentation may become outdated as a result. Readers are cautioned not to place undue reliance on forward-looking statements and Aspermont assumes no obligation to update such statements.
No representation or warranty, expressed or implied, is made as to the accuracy, reliability, adequacy or completeness of the information contained in this presentation.
Past performance
Past performance information given in this presentation is given for illustrative purposes only and should not be relied upon as (and is not) an indication of future performance.
Information is not advice or offer of securities
This presentation is not, and is not intended to constitute, financial advice, or an offer or an invitation, solicitation or recommendation to acquire or sell Aspermont shares or any other financial products in any jurisdiction and is not a prospectus, product disclosure statement, disclosure document or other offering document under Australian law or any other law. This presentation also does not form the basis of any contract or commitment to sell or apply for securities in Aspermont or any of its subsidiaries. It is for information purposes only.
Aspermont does not warrant or represent that the information in this presentation is free from errors, omissions or misrepresentations or is suitable for your intended use. The information contained in this presentation has been prepared without taking account of any person’s investment objectives, financial situation or particular needs and nothing contained in this presentation constitutes investment, legal, tax or other advice. The information provided in this presentation may not be suitable for your specific needs and should not be relied up on by you in substitution of you obtaining independent advice. Subject to any terms implied by law and which cannot be excluded, Aspermont accepts no responsibility for any loss, damage, cost or expense (whether direct, or indirect, consequential, exceptional or special damages including but not limited to loss of revenue, profits, time, goodwill, data, anticipated savings, opportunity, business reputation, future reputation, production or profit, any delay costs, economic loss or damage) incurred by you as a result of any error, omission or misrepresentation in this
presentation.
Preparation of information
All financial information has been prepared and reviewed in accordance with Australian Accounting Standards. Certain financial data included in this presentation is ‘non-IFRS financial information’. The Company believes that this non-IFRS financial information provides useful insight in measuring the financial performance and condition of Aspermont. Readers are cautioned not to place undue reliance on any non-IFRS financial information including ratios included in this presentation.
Presentation of information
Currency All amounts in this presentation are in Australian dollars unless otherwise stated.
FY refers to the full year to 30 June.
Rounding Amounts in this document have been rounded to the nearest $0.1m. Any differences between this document and the accompanying financial statements are due to rounding.
Third party information and market data
The views expressed in this presentation contain information that has been derived from publicly available sources that have not been independently verified. No representation or warranty is made as to the accuracy, completeness or reliability of the information. This presentation should not be relied upon as a recommendation or forecast by Aspermont. Market share information is based on management estimates except where explicitly identified.
No liability or responsibility
The information in this presentation is general in nature and is provided in summary form and is therefore does not purport to be complete.
To the maximum extent permitted by law, Aspermont and each of its affiliates, directors, employees, officers, partners, agents and advisers and any other person involved in the preparation of this presentation disclaim all liability and responsibility (including without limitation, any liability arising from fault or negligence) for any direct or indirect loss or damage which may arise or be suffered through use or reliance on anything contained in, or omitted from, this presentation. Aspermont accepts no responsibility or obligation to inform you of any matter arising or coming to their notice, after the date of this presentation, which may affect any matter referred to in this presentation.
This presentation should be read in conjunction with Aspermont’s other periodic and continuous disclosure announcements lodged with ASX.


![Corporate Overviewcontent.equisolve.net/genvec/media/cf148f344865a9ffc78789c610f0… · Corporate Overview 3 Discovery Preclinical Phase 1 Phase 2 Phase 3 Approved Hearing Loss [Novartis]](https://img.pdfslide.us/doc/110x75/5fca5b3f8e04314b3a003de9/corporate-corporate-overview-3-discovery-preclinical-phase-1-phase-2-phase-3-approved.jpg)