Embed Size (px)
Citation preview

New functional genomics technologies and their analysis
Wolfgang HuberEuropean Molecular Biology Laboratory
European Bioinformatics Institute

OverviewWhole genome arrays – from levels of known
transcripts to the complete architecture of the transcriptome
ChIP arrays – protein-DNA interactions
Functional assays – from correlation to causality

Tiling microarrays• Oligonucleotide
microarrays• probes cover not only
known genes but whole genome
• length, distance and overlap between probes varies
• hybridize cDNA from complete poly-A-RNA in cell

Tiling arrays: possibilities
Unbiased view on transcription since no focus on or restriction to know genes
refine annotated genesconfirm predicted genesdiscover novel genes

Recent tiling array studies
Drosophila melanogaster
Poly-A-RNA from 6 developmental stages
Synthesized 36mersStolc et al.
Arabidopsis thalianaPoly-A-RNA from 4-6 samples
Synthesized 25mersYamada et al.
E. coliStationary and growth phase total RNA
Synthesized 25mers
Selinger & Church
H. sapiens (Chr. 22)Placental poly-A-RNASpotted PCR productsRinn et al.
H. sapiens (Chr. 21-22)
ds-cDNA from poly-A-RNA of 11 cell lines
Synthesized 25mers
Kapranov et al.
Species, chromosomesSamplesMicroarray typeStudy

Genechip S. cerevisiae Tiling Array
4 bp tiling path over complete genome(12 Mio basepairs, 16 chromosomes)
Sense and Antisense strands6.5·106 oligonucleotides5 mm feature size
Chips manufactured by AffymetrixApplication + analysis by L. Steinmetz (EMBL/Stanford Genome Center) and W. Huber (EMBL/EBI)
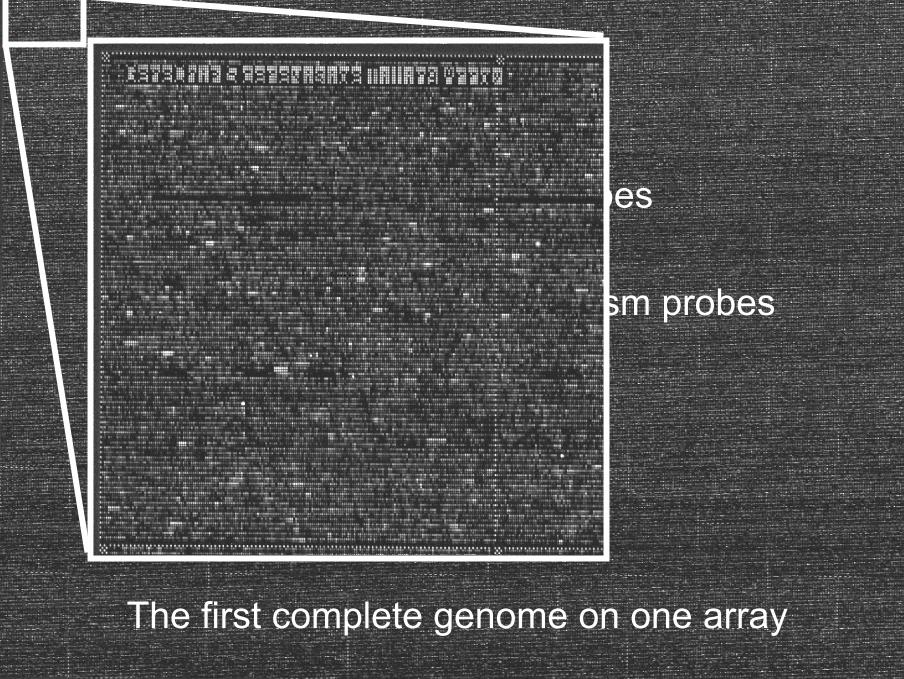
3,039,046 perfect match probes7,359 splice junction probes127,813 YJM789 polymorphism probes16,271 Tag3 barcode probes
The first complete genome on one array
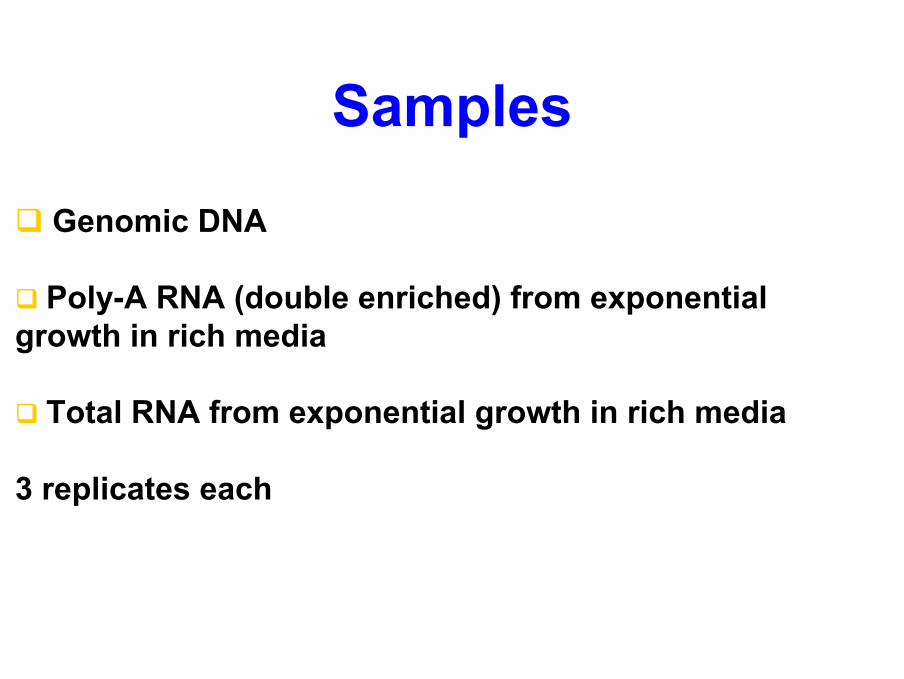
Genomic DNA
Poly-A RNA (double enriched) from exponential growth in rich media
Total RNA from exponential growth in rich media
3 replicates each
Samples
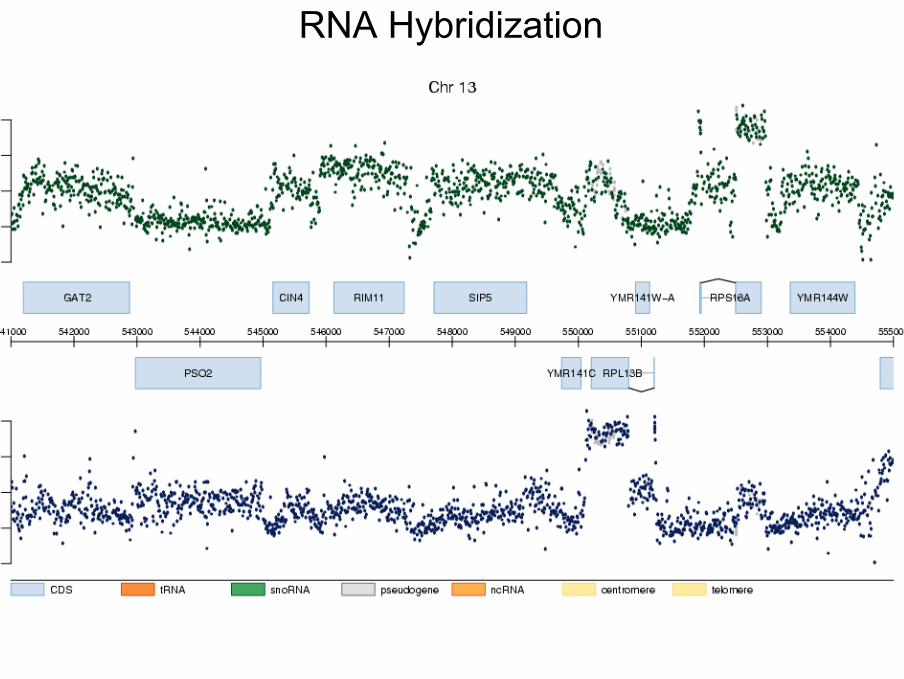
RNA Hybridization

Probe specific affinity normalization
beforebefore
afterafter
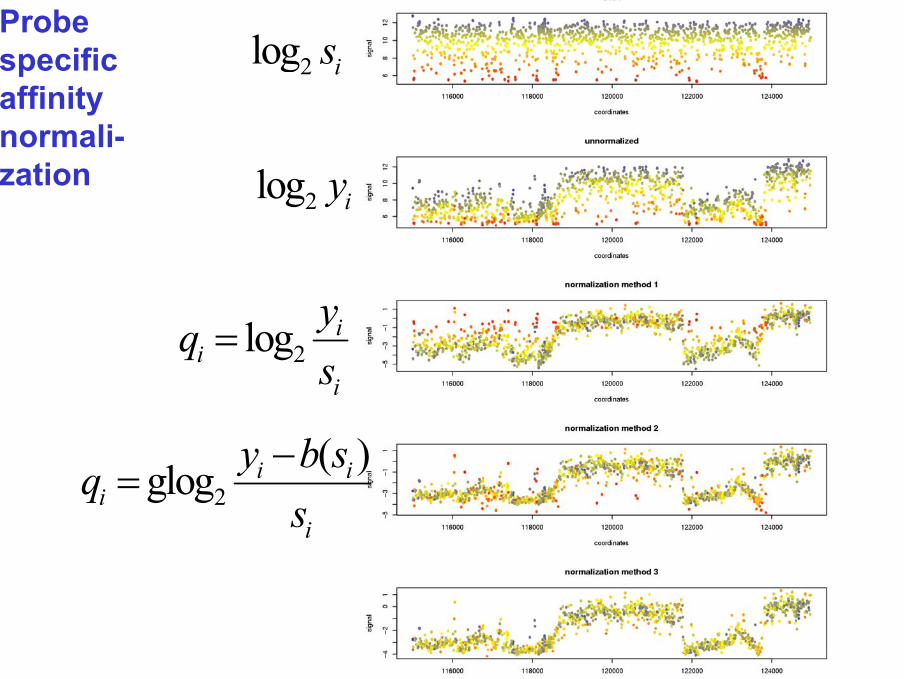
Probe specific affinity normali-zation
2log ii
i
yqs
=
2( )glog i i
ii
y b sqs−
=
2log iy
2log is

Two obvious options:
Smoothing (e.g. running median) and thresholding: simple, but estimates of change points will be biased and depend on expression level!
Hidden Markov Model (HMM): but our “states” come from a continuum! Fiddly.
Our solution:
Fit a piecewise constant function
Segmentation
change point

Segmentation
( )1 2
11 1
( , , )s
s
i tS J
S ij sjs j i t
G t t y y+<
= = >=
= −∑∑∑…
t1,…, tS: change points
J: number of replicate arrays
Minimize

Segmentation
Naïve optimization has complexity ns, where n≈105
and s≈103.
Fortunately, there is a dynamic programmingalgorithm with complexity ≈n2:
Theory: F. Picard, S.Robin, M. Lavielle, C. Vaisse, G. Celeux, JJ Daudin, INRIA (2004)
Software: W. Huber, package tilingArray, www.bioconductor.org (2005)
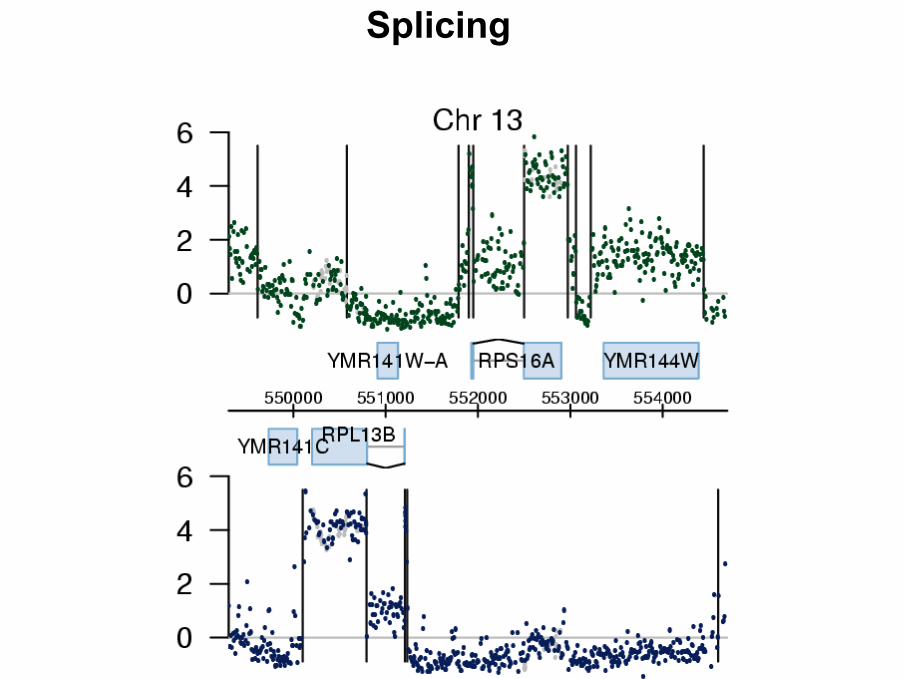
Splicing

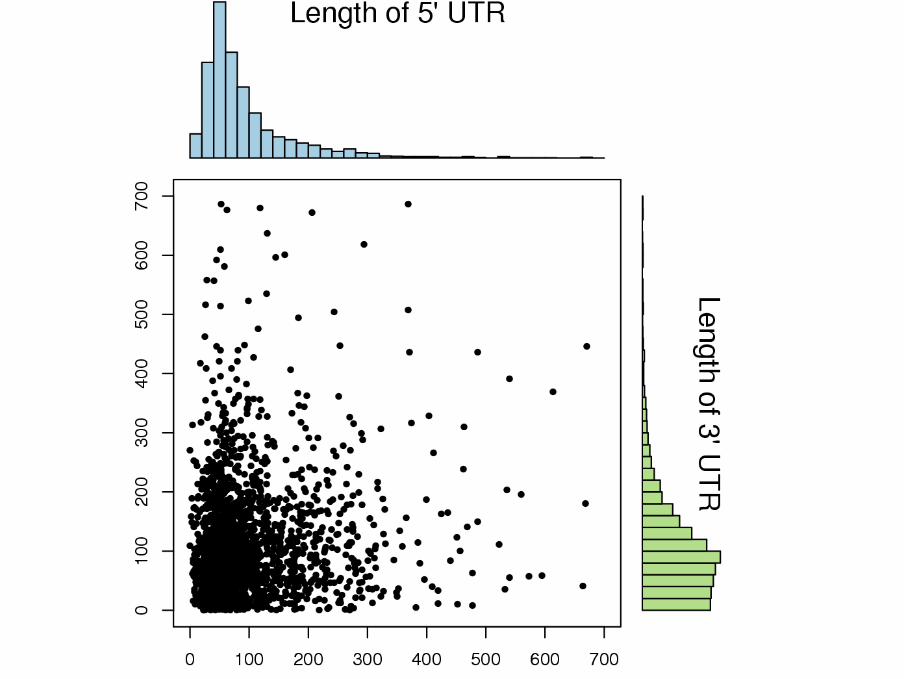
Mapping of UTRs:
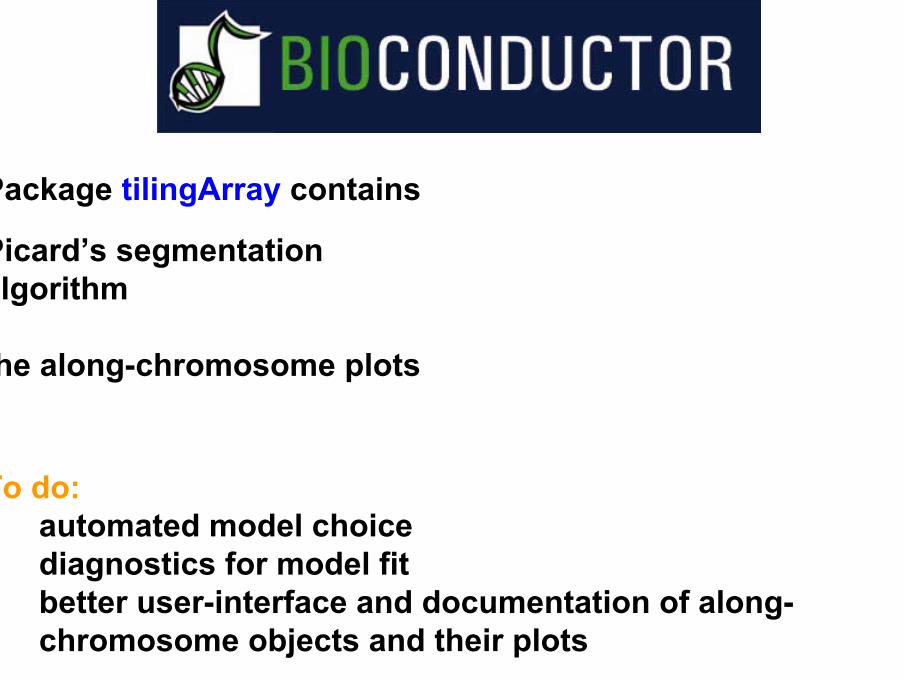
BioconductorPackage tilingArray contains
Picard’s segmentation algorithm
the along-chromosome plots
To do: automated model choicediagnostics for model fitbetter user-interface and documentation of along-chromosome objects and their plots

Conclusionso Conventional microarrays: measure transcript levels
o High resolution tiling arrays: also measure transcript structure
introns, exons,partial degradationnovel transcriptsannotation errors
o DNA normalization: increase signal/noise by 1.5-2
o Accurate and simple segmentation algorithm
o Existing bioconductor data structures and packages (e.g. affy, vsn, geneplotter) were instrumental
o Current packages and data structures are mostly gene-centric, we still need more infrastructure for data that consists of features along genomic coordinates
Acknowledgements
Oleg Sklyar
EMBL-GE & Stanford:Lior DavidMarina Granovskaia
Jörn Tödling Raeka Aiyar
Lars Steinmetz
Robert GentlemanRafael IrizarryVince CareyBen Bolstad

ChIP-on-chipChromatin ImmunoPrecipitation
What? Systematic detection of protein-DNA interactionsin vivoin vitro
What for? Protein-DNA interactions play a role intranscriptionDNA replicationDNA recombinationDNA repair
Why? Efforts to computationally extrapolate the binding sites of a protein with DNA (“motifs”) that were observed with traditional methods, to obtain all sites active in vivo, have had rather limited success.
Reference: Minireview by MJ Buck, JD Lieb, Genomics 83 (2004) 349-360
ApplicationsLee TI, Rinaldi NJ, Robert F, ...Young RA. Transcriptional regulatory networks in Saccharomyces cerevisiae.Science, 2002, 298(5594):799-804.In vivo binding sites of 106 yeast proteins
Harbison CT, Gordon DB, Lee TI,..., Young RA. Transcriptional regulatory code of a eukaryotic genome. Nature, 2004, 431(7004):99-104. ... some with multiple conditions
Mukherjee S, Berger MF, Jona G, ..., Bulyk ML. Rapid analysis of the DNA-binding specificities of transcription factors with DNA microarrays. Nat Genet. 2004, 36(12):1331-9. In vitro binding sites of 3 yeast TFs Abf1, Rap1, Mig1

Lee et al. (2002)
regulator := a transcription factor (TF) or a ligand of a TFtag: c-myc epitope
106 microarrayssamples: enriched (tagged-regulator + DNA-promoter)probes: cDNA of all promoter regionsspot intensity ~ affinity of a promotor to a certain regulator

Transcriptional regulatory networksbipartite graph
1
1
1
1
1
1
1
106 regulators (TFs)
6270
pro
mot
er re
gion
s
regulators
promoters
Experimental designIdeal control
Cells lacking the antibody epitope, but otherwise identical
Mock control
ChIP protocol repeated exactly, but the antibody is omitted (no DNA should be pulled down)
Reference (two colors)
"Input" = the input chromatin (before ChIP)
You can look at several quantities:
Sample / InputSample / MockSample / Input | (Mock small)

Pre-processingMostly similar to the corresponding transcription-microarray technology (e.g. spotted two-color)
Also need some kind of normalization assumption, e.g. known set of negative control DNA sequences, or "most sites are not binding".
Distribution of (g)log-ratios is usually skewed (a probe will give positive signal above background if its target is pulled down, but there is no mechanism for reducing its signal) -estimators in the normalization should take this into account, need to use robust methods.

Functional assays
(cell-based assays,phenotype screens,
RNAi screens)
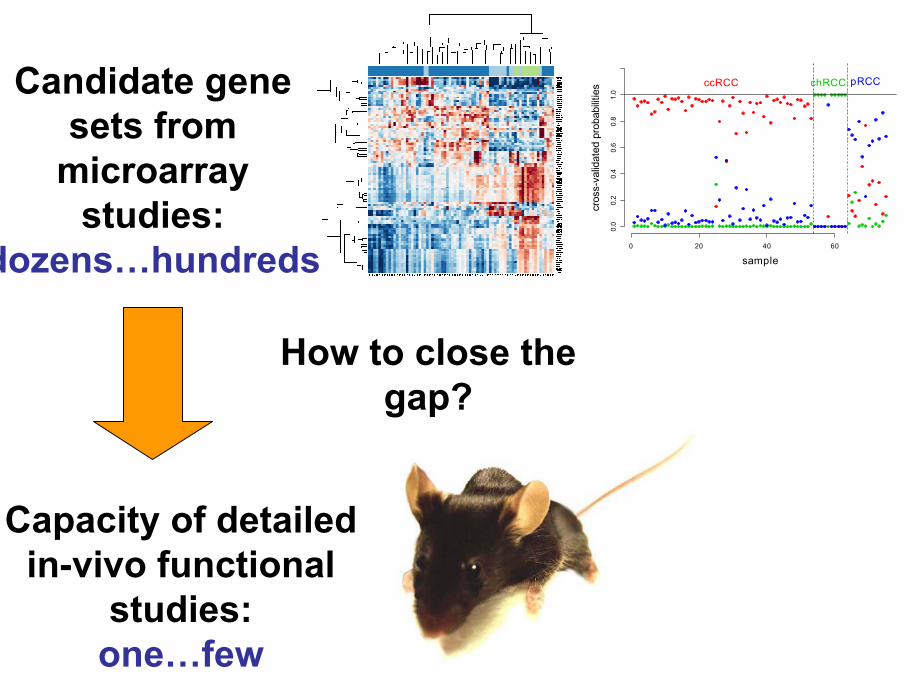
Candidate gene sets from
microarraystudies:
dozens…hundreds
Capacity of detailed in-vivo functional
studies: one…few
How to close the gap?
sample
cros
s-va
lidat
ed p
roba
bilit
ies
0 20 40 60
0.0
0.2
0.4
0.6
0.8
1.0
ccRCC chRCC pRCC

Drowning by numbers
How to separate a flood of ‘significant’ secondary effects from causally relevant ones?
VHL: tumor suppressor with “gatekeeper” role in kidney cancers
Boer, Huber, et al. Genome Res. 2001: kidney tumor/normal profiling study

Drowning by numbers
Boer, Huber, et al. Genome Res. 2001

From association to intervention
mRNA profiling studies: association of genes with diseases
gene 1disease
gene 2
or or…
the dilemma
oror ?the next step: directed intervention
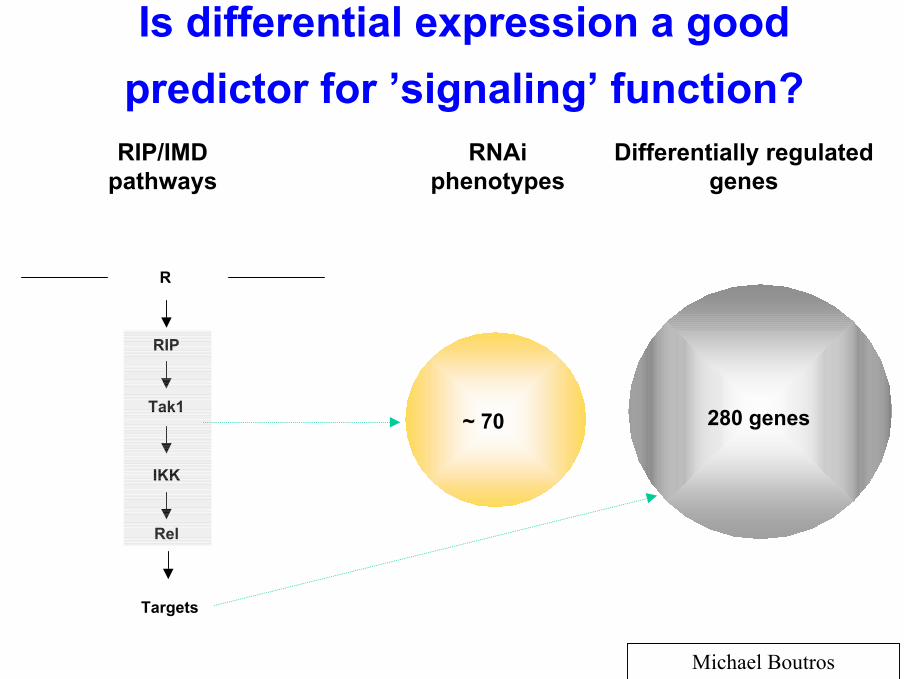
Is differential expression a good predictor for ’signaling’ function?
RNAiphenotypes
Differentially regulatedgenes
~ 70 280 genes
RIP/IMDpathways
RIP
Tak1
IKK
Rel
R
Targets
Michael Boutros
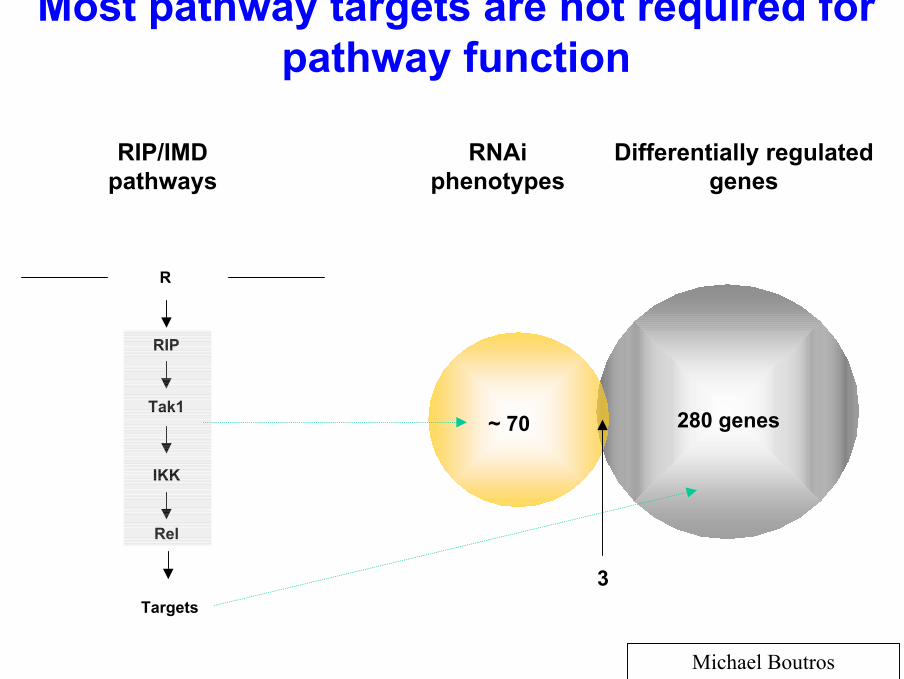
Most pathway targets are not required for pathway function
RNAiphenotypes
Differentially regulatedgenes
~ 70 280 genes
3
RIP/IMDpathways
RIP
Tak1
IKK
Rel
R
Targets
Michael Boutros

Signaling pathways
Drosophila antibacterial signalling The Drosophila Toll/antifungal
signaling pathway
Pictures from N. Silverman
UMass
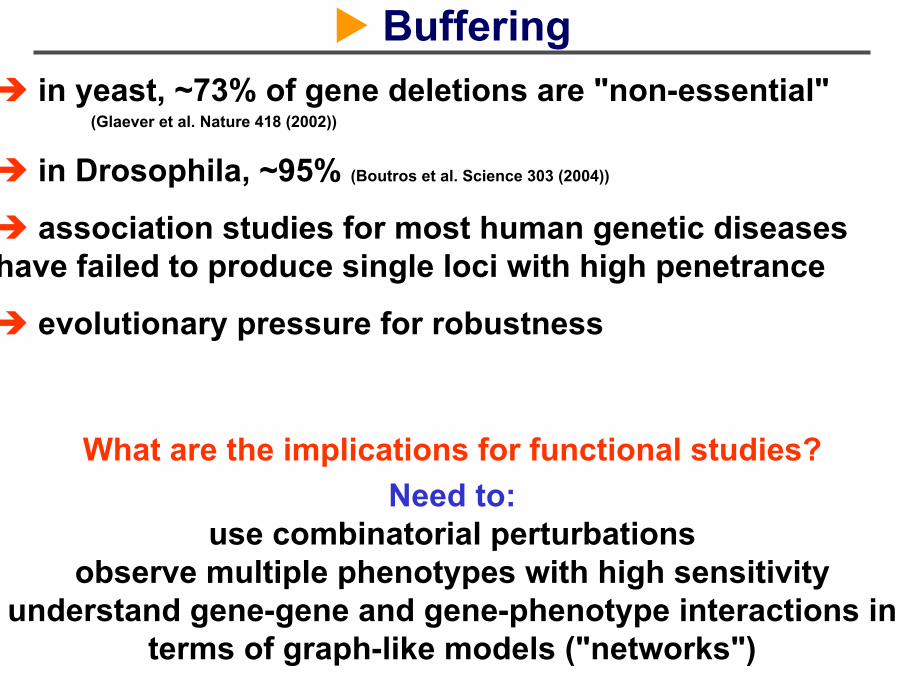
Bufferingin yeast, ~73% of gene deletions are "non-essential"
(Glaever et al. Nature 418 (2002))
in Drosophila, ~95% (Boutros et al. Science 303 (2004))
association studies for most human genetic diseases have failed to produce single loci with high penetrance
evolutionary pressure for robustness
What are the implications for functional studies?Need to:
use combinatorial perturbationsobserve multiple phenotypes with high sensitivity
understand gene-gene and gene-phenotype interactions in terms of graph-like models ("networks")

RNAi+ genome wideo specificity- efficiency / monitoring?
Transfection (expression)+ 100% specific+ monitoring- library size, €€€
Small compounds…
Interference/Perturbation tools

Probe the role of a protein by increasing its abundance and measuring the effect in terms of changes in a cellular process or pathway activity.
Transfect cells with a vector that contains encoding DNA sequence and a short sequence for Green Fluorescent Protein (GFP)
The protein’s overabundance in each individual cell can be monitored through its fluorescence.
Avoid artifacts caused by non-specificor cross-reactive effects: work in small-perturbation regime
Transfection assays

He and Hannon, 2004
Initiation
Execution
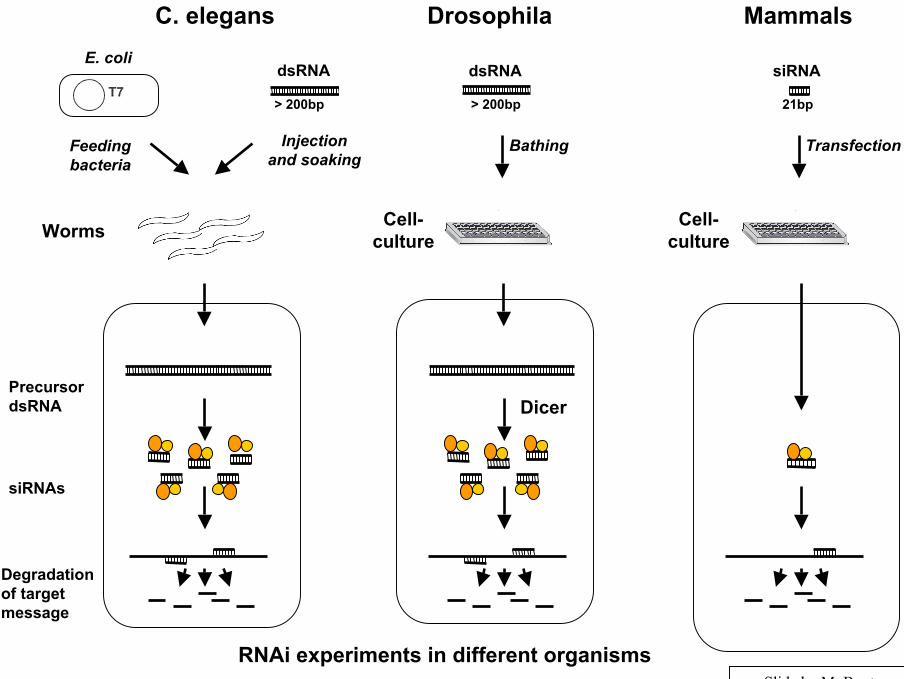
RNAi
T7
Precursor dsRNA
siRNAs
Degradation of target message
C. elegans Drosophila Mammals
Injection and soaking
Feeding bacteria
Worms Cell-culture
Bathing Transfection
> 200bp> 200bp 21bp
Cell-culture
dsRNA dsRNA siRNAE. coli
RNAi experiments in different organisms
Dicer
Slide by M. Boutros

• Identification by Elbashir et al., 2001– Size is critical– siRNA (21-22nt) mediate mammalian RNAi– Introducing siRNA instead of dsRNA prevents non-
specific effects
• Application via transient transfection– No persistent or propagative effect as in C. elegans– Can be chemically synthesized or generated by in
vitro transcription
siRNAs
Slide by M. Boutros

Any cellular process (in principle) can be probed. E.g.
- (de-)activation of a certain pathway- differentiation,- changes in the cell cycle dynamics- morphological changes- activation of apoptosis
Similarly, for organisms (e.g. fly embryos, worms)
Effects are sometimes also called phenotypes
Phenotypes can be registered at various levels of detail
- yes/no alternative- single quantitative variable- image- time series
The effect - it all depends on the assay
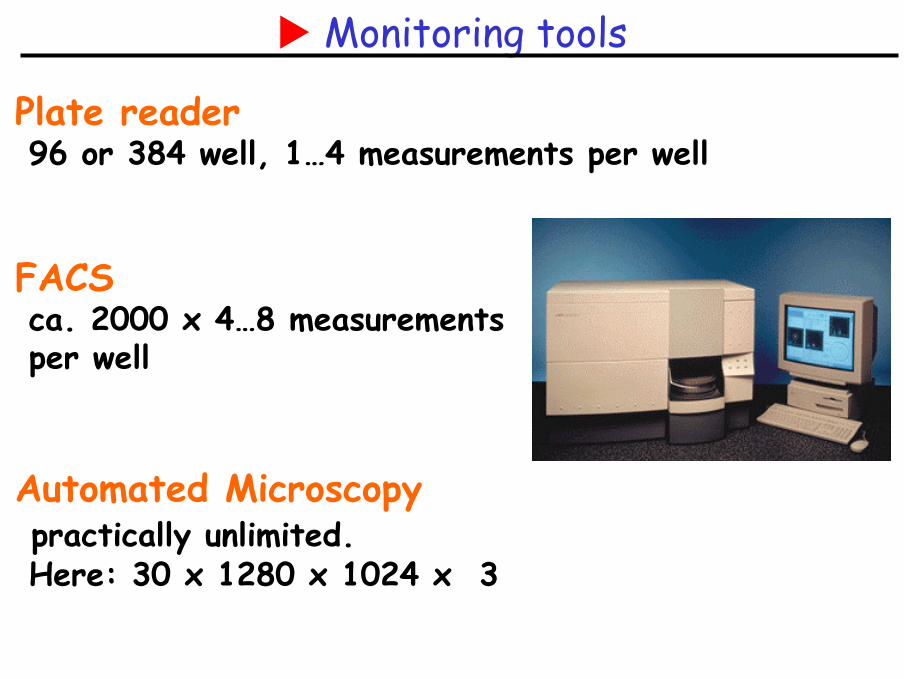
Plate reader96 or 384 well, 1…4 measurements per well
FACSca. 2000 x 4…8 measurements per well
Automated Microscopypractically unlimited.Here: 30 x 1280 x 1024 x 3
Monitoring tools

Plate reader96 or 384 well, 1…4 measurements per well
FACS4…8 measurements per cell, thousands of cellsper well
Automated Microscopyunlimited
Monitoring tools

Normalization
Boutros, Kiger, et al. Science 2004
Viability screen each dot corresponds to one gene, shown is cell viability after knock-down.

Normalization
Boutros, Kiger, et al. Science 2004

Normalization
Boutros, Kiger, et al. Science 2004

(linear) regression models for normalization
kcdi p w k c d kd kc kciy P W G C D F X ε= + + + + + + +
y: observed signalP: plate effectW: well effect (e.g. spatial)G: probe effectC: condition effectD: overall dye effectF: probe-specific dye effectε: noise
X: gene-specific condition effect
k: probe / genec: treatment, conditiond: dyei: replicatep=p(kci): plate indexw=w(kc): plate index
Similar problems/solutions as for microarrays: Small no. of replicates - moderation of the variancesLarge dynamic range / heteroskedasticity - scale transformations
Example:
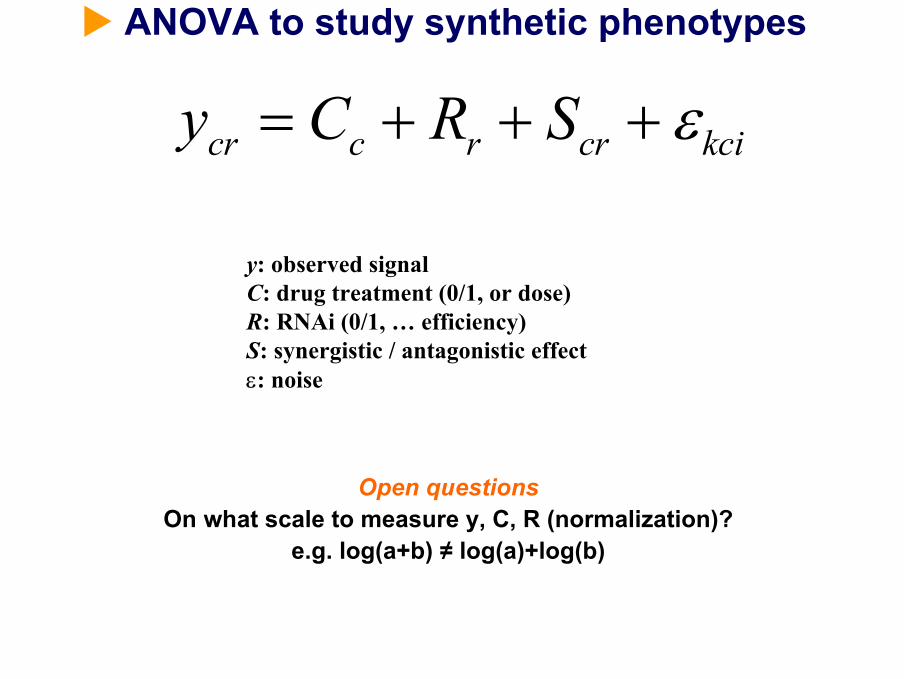
ANOVA to study synthetic phenotypes
cr c r cr kciy C R S ε= + + +
y: observed signalC: drug treatment (0/1, or dose) R: RNAi (0/1, … efficiency)S: synergistic / antagonistic effectε: noise
Open questionsOn what scale to measure y, C, R (normalization)?
e.g. log(a+b) ≠ log(a)+log(b)
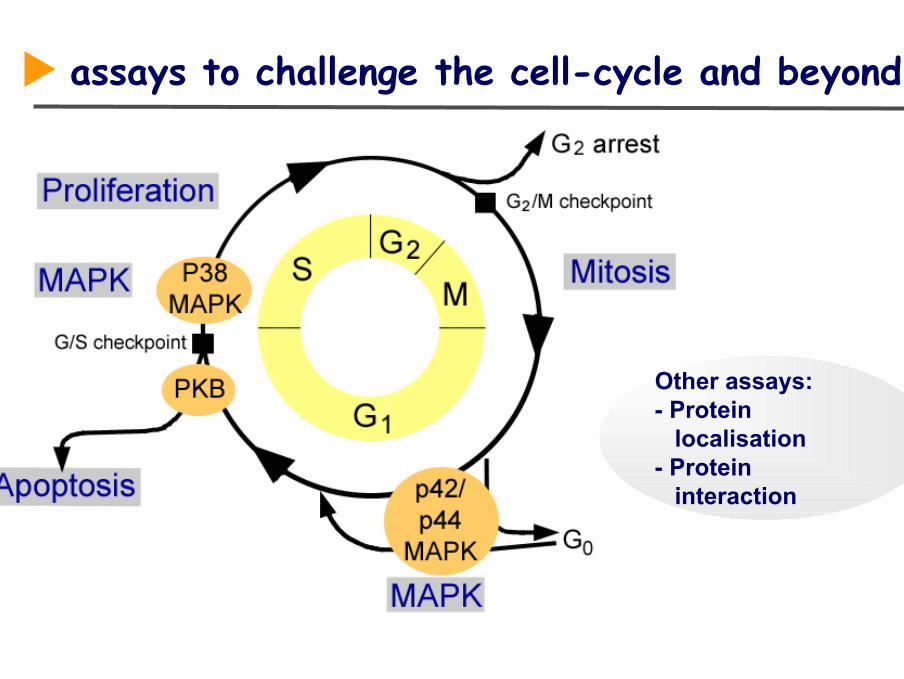
assays to challenge the cell-cycle and beyond
Other assays: - Protein
localisation- Protein
interaction

HT functional assays
cDNA library(>100 clones)
expression clonesBrdU
incorporation
GFP-ORF- protein
DAPI: identification
CFP: expression
BrdU: proliferation
Data analysis
effect on proliferation
automatedmicroscope

Liquid handlingTransfection & antibody incubation
Transfectionreagents
Expressionplasmids
Chamberslides
Transfectionmixing plate
Buffers &antibodies
Sterilehousing
Christian Schmitt

High Content Screening Microscope
- Cube -
Urban Liebel EMBL
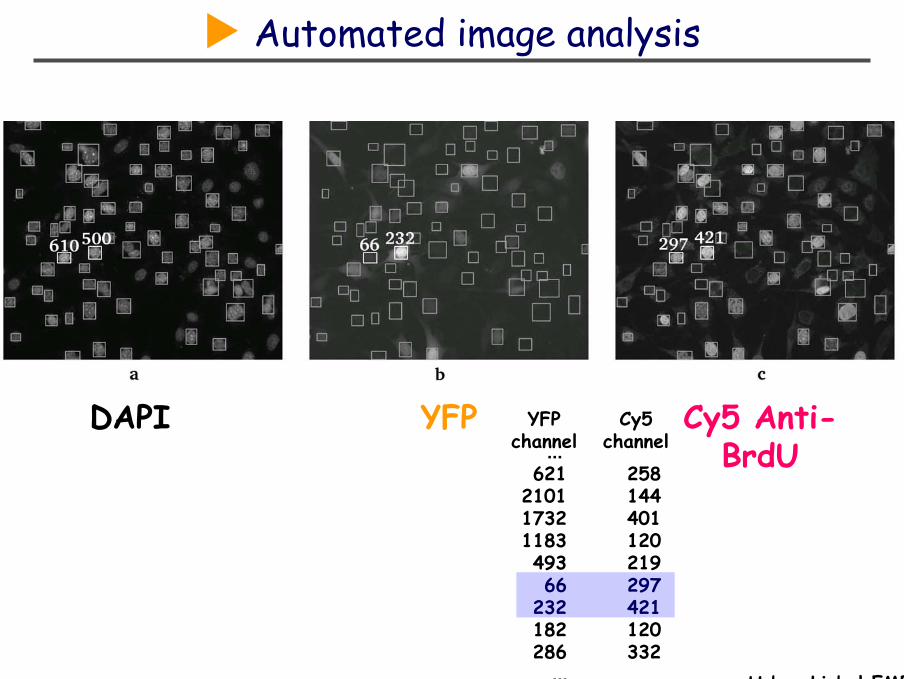
Automated image analysis
DAPI YFP Cy5 Anti-BrdU
Urban Liebel EMBL
...621 258
2101 1441732 4011183 120493 21966 297
232 421182 120286 332
...
YFPchannel
Cy5channel

raw data
expression clones
plates
propertiesx 19
cells2,263,287
Images (ca. 350 GB)3 x 42,294
non-empty wells2,437
289
27
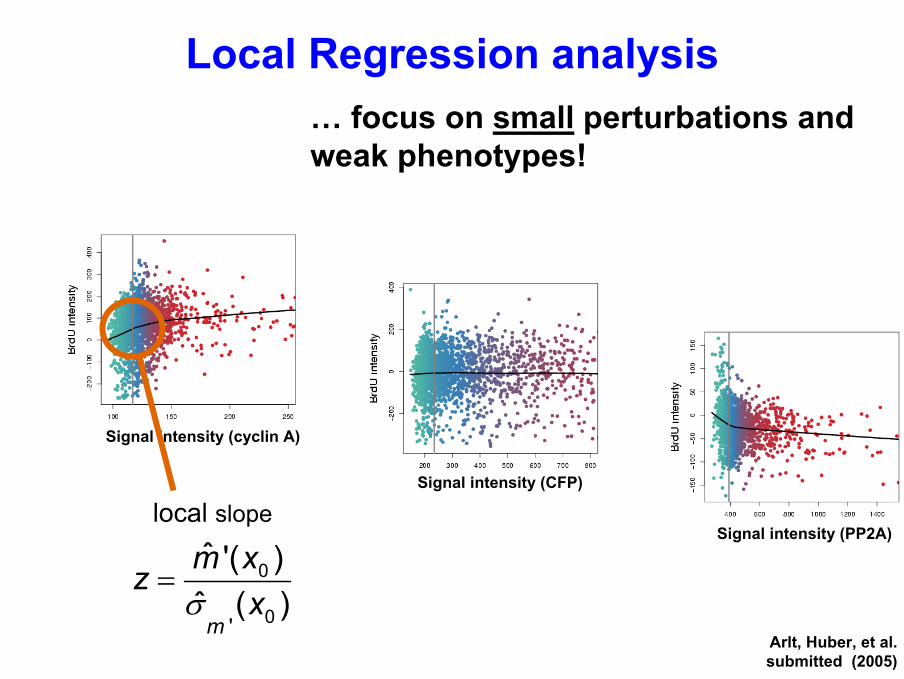
Local Regression analysis
Signal intensity (cyclin A)
… focus on small perturbations and weak phenotypes!
local slope
σ= 0
0'
ˆ '( )ˆ ( )
m
m xzx
Arlt, Huber, et al. submitted (2005)
Signal intensity (PP2A)
Signal intensity (CFP)
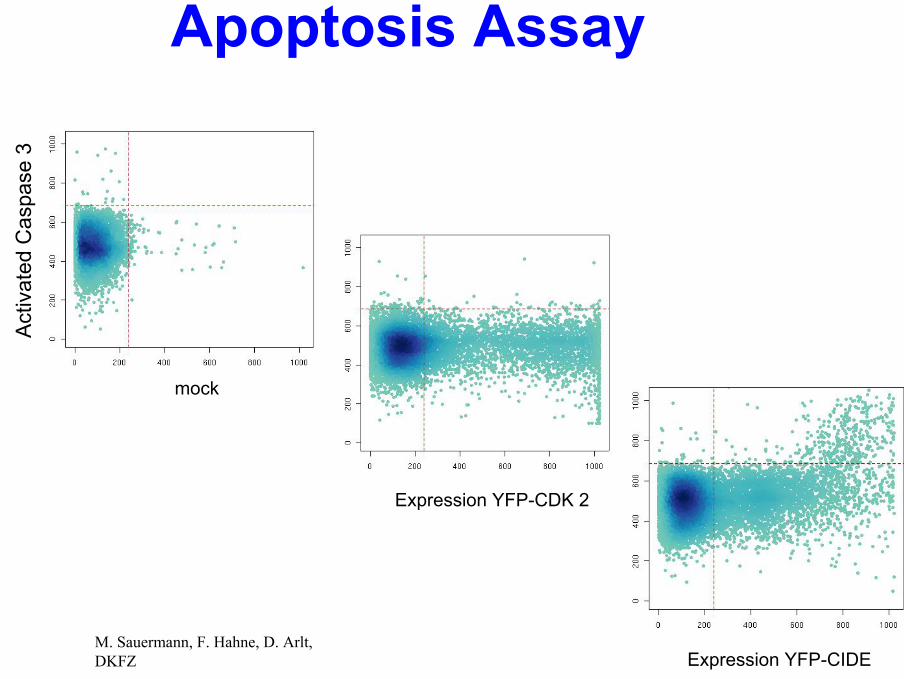
Act
ivat
edC
aspa
se3
mock
Expression YFP-CDK 2
Expression YFP-CIDE
Apoptosis Assay
M. Sauermann, F. Hahne, D. Arlt, DKFZ
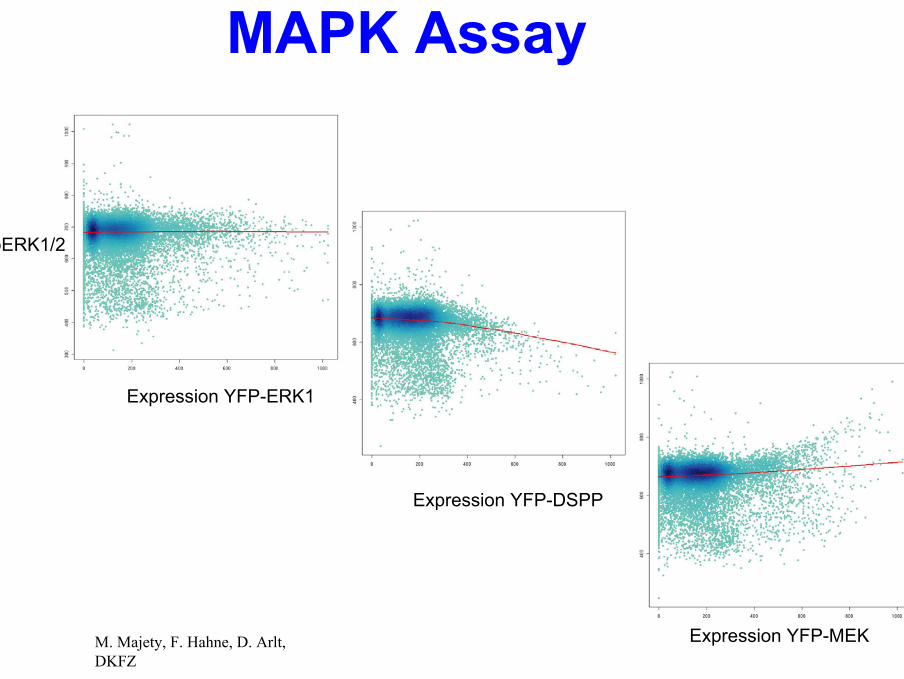
pERK1/2
Expression YFP-ERK1
Expression YFP-DSPP
Expression YFP-MEK
MAPK Assay
M. Majety, F. Hahne, D. Arlt, DKFZ

YFP
PP2-YFPCyclinA-YFPYFP
Within Well Analysis - Plate Plot
CFP
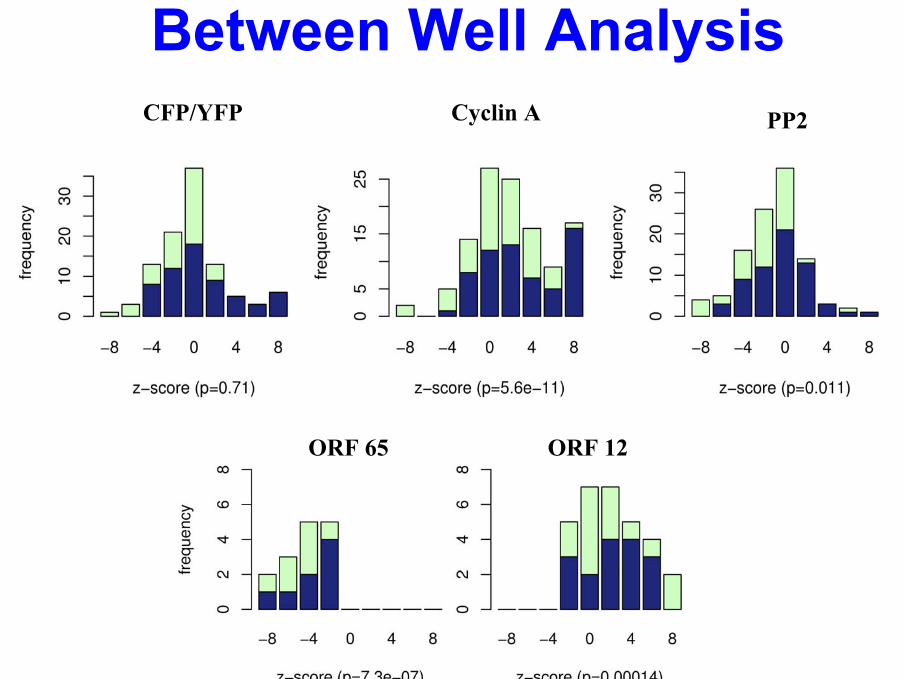
Between Well AnalysisCFP/YFP PP2Cyclin A
ORF 65 ORF 12
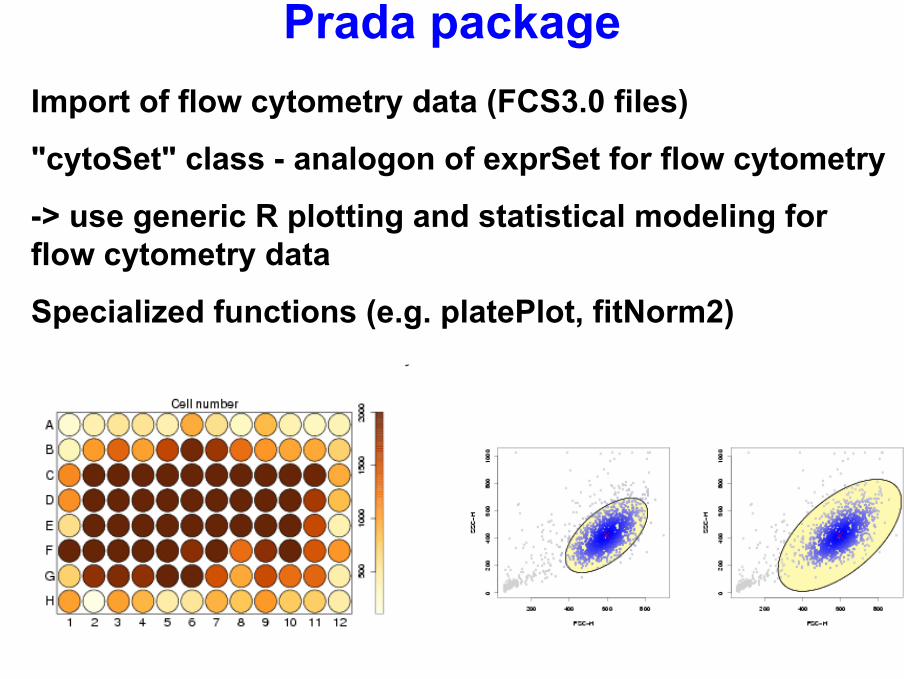
Prada packageImport of flow cytometry data (FCS3.0 files)
"cytoSet" class - analogon of exprSet for flow cytometry
-> use generic R plotting and statistical modeling for flow cytometry data
Specialized functions (e.g. platePlot, fitNorm2)

AcknowledgementsDKFZ Heidelberg -Molecular Genome AnalysisDorit ArltAnnemarie PoustkaStefan WiemannHolger SültmannAndreas BunessMarkus RuschhauptFlorian Hahne… & many others
DKFZ - SignalingMichael Boutros
DFCI / HarvardRobert Gentleman
The R project
Leiden UMCJudith Boer
EMBLRainer PepperkokPhilippe BastiaensUrban LiebelHolger Erfle
MPI Mol. Genetics, BerlinAnja von HeydebreckMartin Vingron
Uni HeidelbergGünther Sawitzki
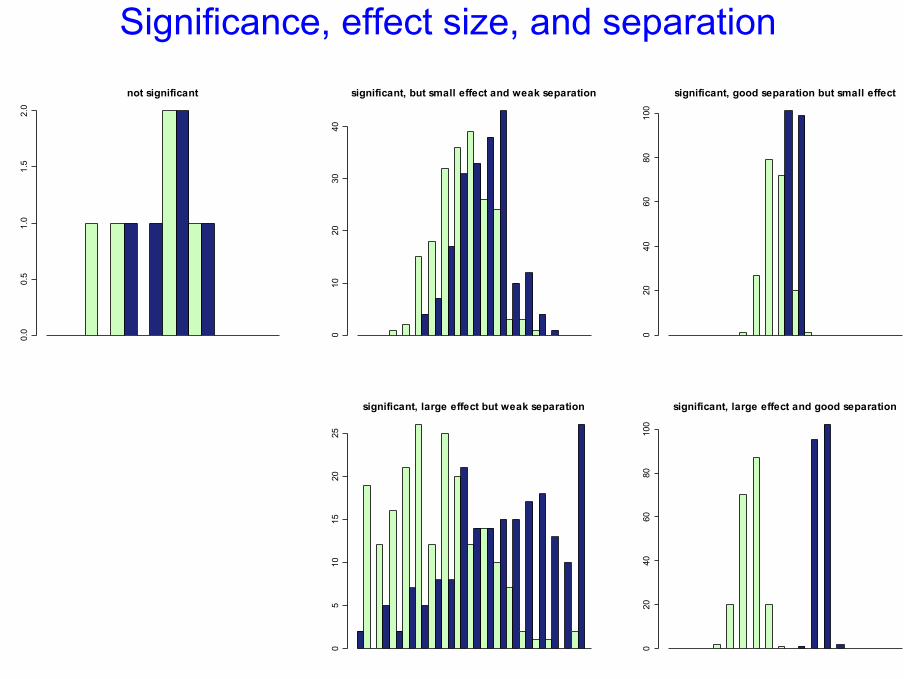
Significance, effect size, and separation
not significant
0.0
0.5
1.0
1.5
2.0
significant, but small effect and weak separation
010
2030
40
significant, good separation but small effect
020
4060
8010
0
significant, large effect but weak separation
05
1015
2025
significant, large effect and good separation
020
4060
8010
0