Embed Size (px)
Citation preview
1
Paper SAS127-2017
New for SAS® 9.4: Including Text and Graphics in Your Microsoft Excel Workbooks, Part 2
Vincent DelGobbo, SAS Institute Inc.
ABSTRACT A new ODS destination for creating Microsoft Excel workbooks is available starting in the third maintenance release for SAS® 9.4. This destination creates native Microsoft Excel XLSX files, supports graphic images, and offers other advantages over the older ExcelXP tagset. In this presentation you will learn step-by-step techniques for quickly and easily creating attractive multi-sheet Excel workbooks that contain your SAS® output. The techniques can be used regardless of the platform on which SAS software is installed. You can even use them on a mainframe! Creating and delivering your workbooks on-demand and in real-time using SAS server technology is discussed. Although the title is similar to previous presentations by this author, this presentation contains new and revised material not previously presented. Using earlier versions of SAS to create multi-sheet workbooks is also discussed.
INTRODUCTION
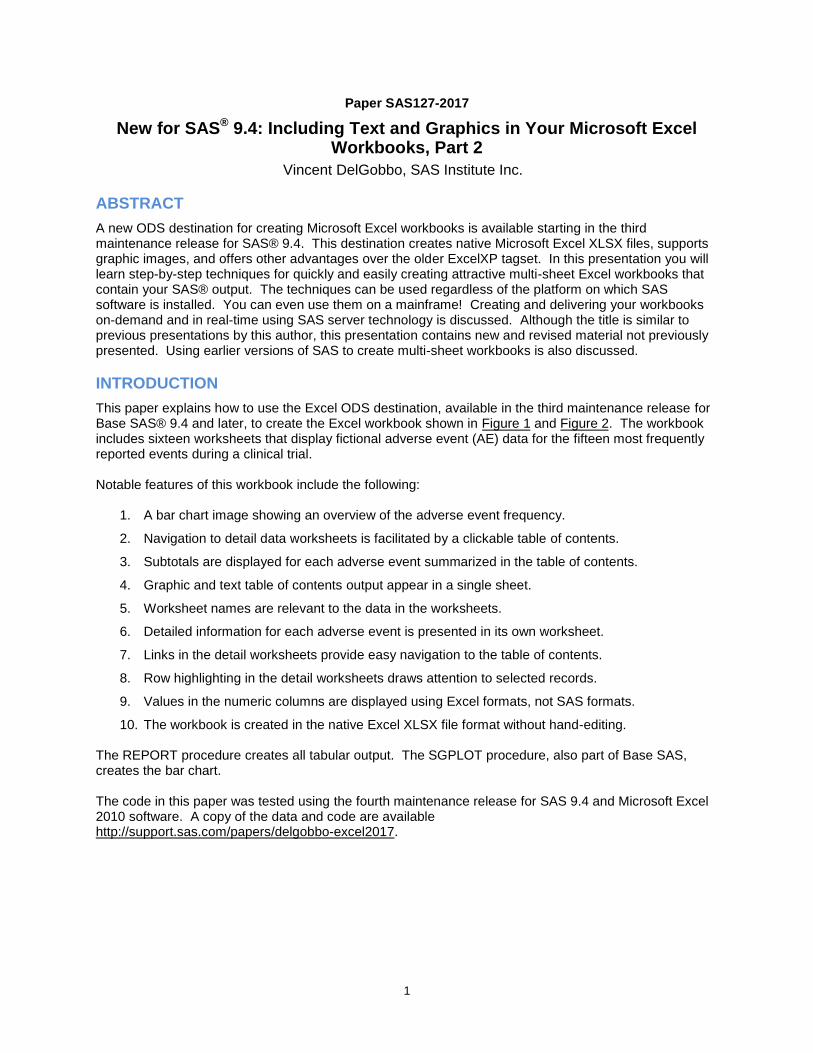
This paper explains how to use the Excel ODS destination, available in the third maintenance release for Base SAS® 9.4 and later, to create the Excel workbook shown in Figure 1 and Figure 2. The workbook includes sixteen worksheets that display fictional adverse event (AE) data for the fifteen most frequently reported events during a clinical trial.
Notable features of this workbook include the following:
1. A bar chart image showing an overview of the adverse event frequency.
2. Navigation to detail data worksheets is facilitated by a clickable table of contents.
3. Subtotals are displayed for each adverse event summarized in the table of contents.
4. Graphic and text table of contents output appear in a single sheet.
5. Worksheet names are relevant to the data in the worksheets.
6. Detailed information for each adverse event is presented in its own worksheet.
7. Links in the detail worksheets provide easy navigation to the table of contents.
8. Row highlighting in the detail worksheets draws attention to selected records.
9. Values in the numeric columns are displayed using Excel formats, not SAS formats.
10. The workbook is created in the native Excel XLSX file format without hand-editing.
The REPORT procedure creates all tabular output. The SGPLOT procedure, also part of Base SAS, creates the bar chart.
The code in this paper was tested using the fourth maintenance release for SAS 9.4 and Microsoft Excel 2010 software. A copy of the data and code are available http://support.sas.com/papers/delgobbo-excel2017.
2
Figure 1. Table of Contents Worksheet of the Excel Workbook Generated by the Excel ODS Destination
REQUIREMENTS
To use the techniques described in this paper, you must have the following software:
The third maintenance release for Base SAS 9.4 and later on any supported operating system (z/OS, UNIX, and so on) and hardware.
Microsoft Excel 2007 and later.
The Excel destination is available only in the third maintenance release for SAS 9.4 and later. If you have an earlier version of SAS you must use the ExcelXP tagset instead of the Excel ODS destination. The ExcelXP tagset creates a Microsoft Excel XML Spreadsheet file (XML) for use with Excel 2002 and later, and not an XLSX file like the new Excel destination. Instructions for using the old tagset are discussed in
3
each example in this paper. Other papers on the ExcelXP tagset are available from this author (DelGobbo 2015). You can find information about requesting a maintenance release for SAS at http://support.sas.com/software/maintenance.
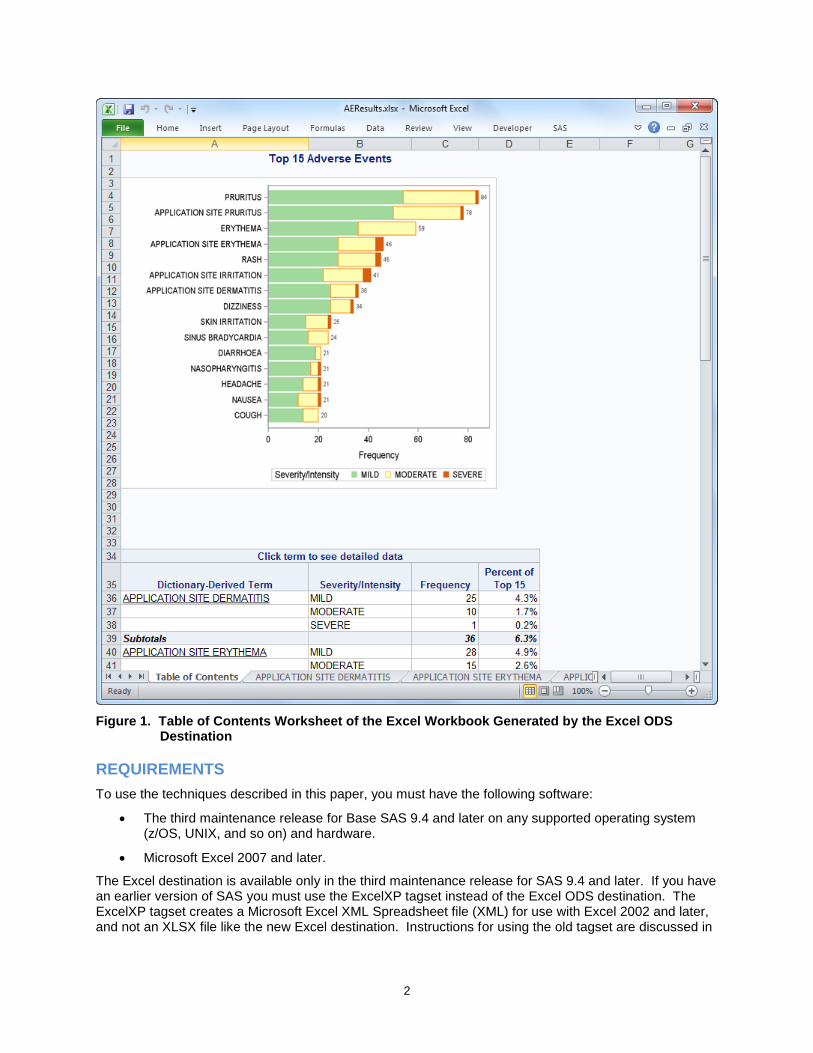
Figure 2. Detail Data Worksheet of the Excel Workbook Generated by the Excel ODS Destination
LIMITATIONS
You can use the Excel destination options with all procedure output, but ODS style overrides apply only to the PRINT, REPORT, and TABULATE procedures. Excel destination options and ODS style overrides are discussed in the "Understanding and Using the Excel Destination Options" and "Understanding and Using ODS Style Overrides" sections, respectively.
4
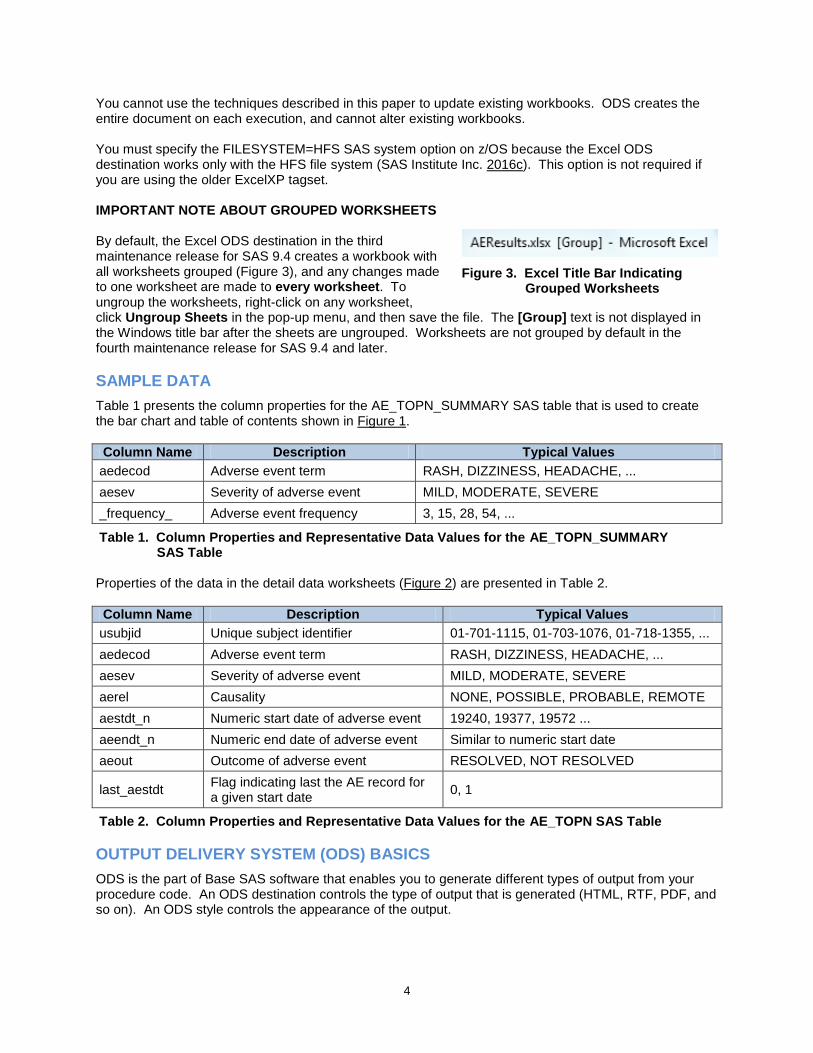
You cannot use the techniques described in this paper to update existing workbooks. ODS creates the entire document on each execution, and cannot alter existing workbooks. You must specify the FILESYSTEM=HFS SAS system option on z/OS because the Excel ODS destination works only with the HFS file system (SAS Institute Inc. 2016c). This option is not required if you are using the older ExcelXP tagset. IMPORTANT NOTE ABOUT GROUPED WORKSHEETS By default, the Excel ODS destination in the third maintenance release for SAS 9.4 creates a workbook with all worksheets grouped (Figure 3), and any changes made to one worksheet are made to every worksheet. To ungroup the worksheets, right-click on any worksheet, click Ungroup Sheets in the pop-up menu, and then save the file. The [Group] text is not displayed in the Windows title bar after the sheets are ungrouped. Worksheets are not grouped by default in the fourth maintenance release for SAS 9.4 and later.
SAMPLE DATA
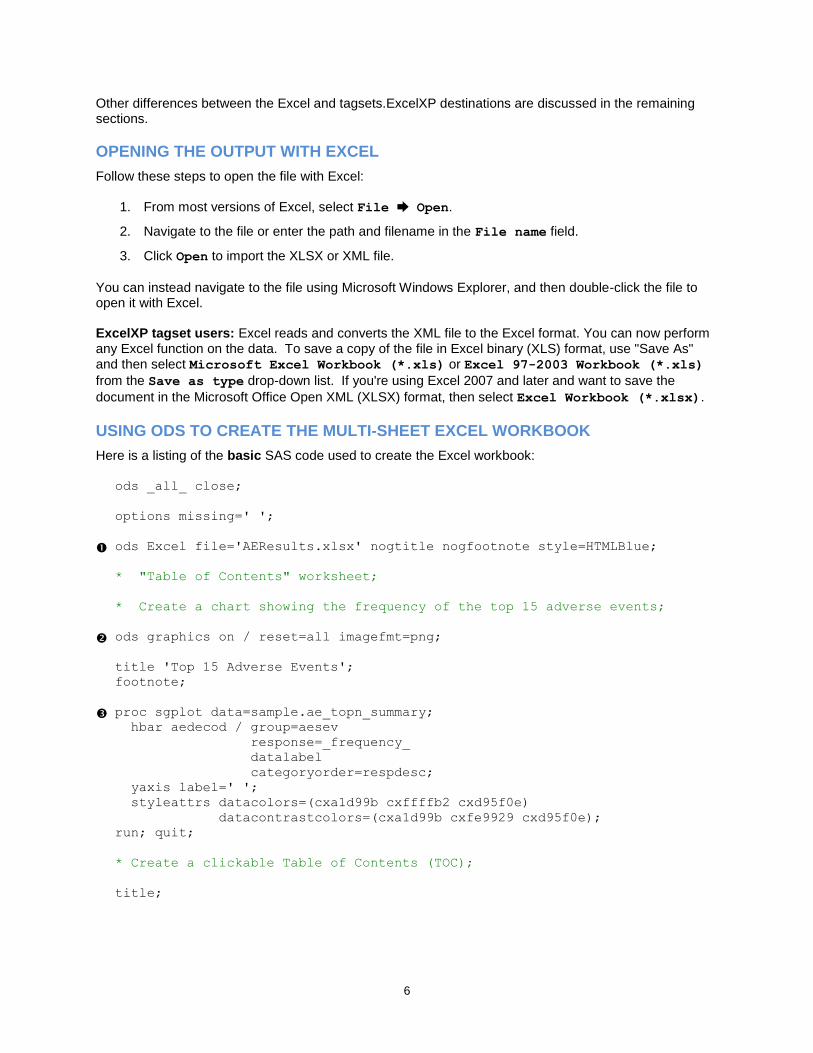
Table 1 presents the column properties for the AE_TOPN_SUMMARY SAS table that is used to create the bar chart and table of contents shown in Figure 1.
Column Name Description Typical Values
aedecod Adverse event term RASH, DIZZINESS, HEADACHE, ...
aesev Severity of adverse event MILD, MODERATE, SEVERE
_frequency_ Adverse event frequency 3, 15, 28, 54, ...
Table 1. Column Properties and Representative Data Values for the AE_TOPN_SUMMARY SAS Table
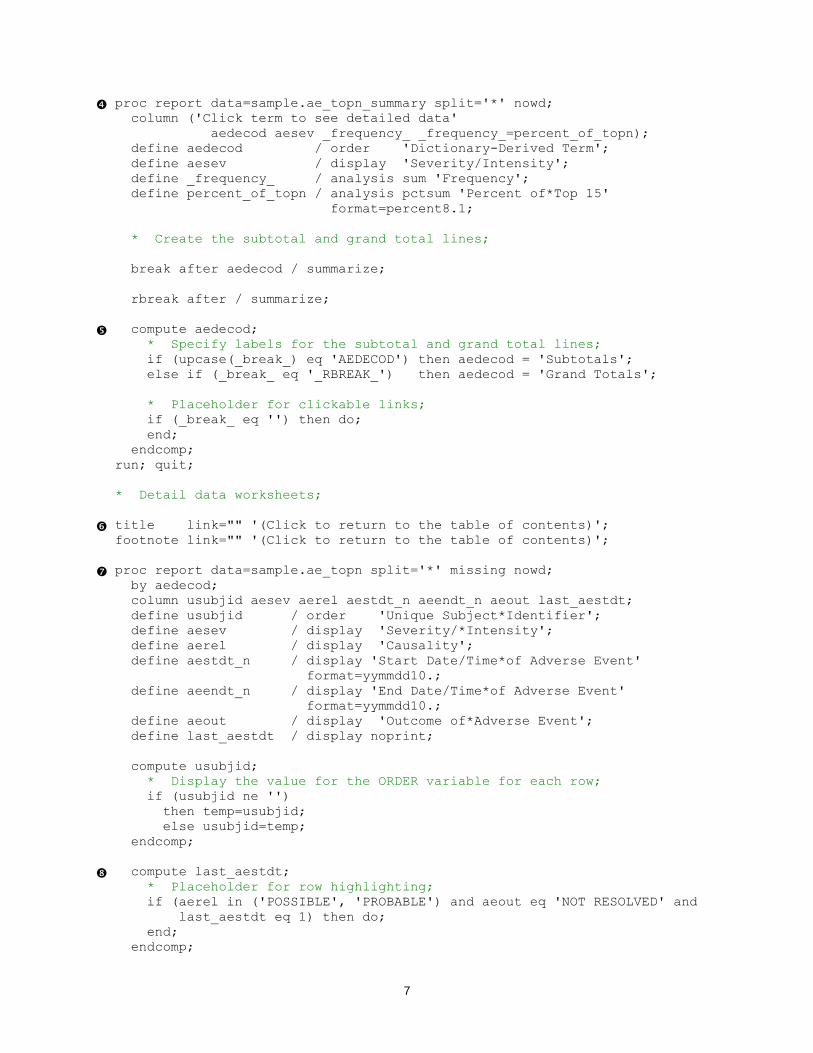
Properties of the data in the detail data worksheets (Figure 2) are presented in Table 2.
Column Name Description Typical Values
usubjid Unique subject identifier 01-701-1115, 01-703-1076, 01-718-1355, ...
aedecod Adverse event term RASH, DIZZINESS, HEADACHE, ...
aesev Severity of adverse event MILD, MODERATE, SEVERE
aerel Causality NONE, POSSIBLE, PROBABLE, REMOTE
aestdt_n Numeric start date of adverse event 19240, 19377, 19572 ...
aeendt_n Numeric end date of adverse event Similar to numeric start date
aeout Outcome of adverse event RESOLVED, NOT RESOLVED
last_aestdt Flag indicating last the AE record for a given start date
0, 1
Table 2. Column Properties and Representative Data Values for the AE_TOPN SAS Table
OUTPUT DELIVERY SYSTEM (ODS) BASICS
ODS is the part of Base SAS software that enables you to generate different types of output from your procedure code. An ODS destination controls the type of output that is generated (HTML, RTF, PDF, and so on). An ODS style controls the appearance of the output.
Figure 3. Excel Title Bar Indicating Grouped Worksheets

5
The Excel workbook in Figure 1 and Figure 2 was created using the Excel ODS destination and the HTMLBlue ODS style supplied by SAS. All formatting and layout are performed by SAS; there is no need to hand-edit the Excel workbook. You simply use Excel to open the file created by ODS. Here are the general ODS statements to generate XLSX output that is compatible with Excel 2007 and later: ods _all_ close;
ods Excel file='file-name.xlsx' style=style-name ... ;
* Your SAS procedure code here;
ods Excel close;
The first ODS statement () closes all destinations that are open because we want to generate only XLSX output for use with Excel. The second ODS statement () uses the Excel destination to generate the XLSX output and then store the output in a file. The STYLE option controls the appearance of the output, such as the font and color scheme. To see a list of ODS styles that are available for use at your site, submit the following SAS code:
ods _all_ close;
ods listing;
proc template; list styles; run; quit;
To find the SAS code that generates sample output for the ODS styles available on your system, click the Full Code tab in SAS Sample 36900 (SAS Institute Inc. 2009). The third ODS statement () closes the Excel destination and releases the XLSX file so that it can be opened with Excel. Note: If you place the files where users can access them over a network, you should set file permissions
to prevent accidental alteration. If you are using SAS 9.1.3 SP4 through SAS 9.4 M2, you must instead use the ExcelXP tagset to create an XML output file that, when opened by Excel, is rendered as a multi-sheet workbook. Here are the general ODS statements to generate XML output that is compatible with Excel 2002 and later:
ods _all_ close;
ods tagsets.ExcelXP file='file-name.xml' style=style-name ... ;
* Your SAS procedure code here;
ods tagsets.ExcelXP close;
If you are using the ExcelXP tagset you must also use the XML extension instead of XLS or XLSX because Excel 2007 and later display a warning if the XML extension is not used (Microsoft Corporation 2017). Most of the techniques and options discussed in this paper work with both the Excel destination and the tagsets.ExcelXP destination, except that the ExcelXP tagset does not support images. Because the ExcelXP tagset creates files that conform to the Microsoft XML Spreadsheet Specification, and the Microsoft XML Spreadsheet Specification does not support images, the output from graphics procedures cannot be used (Microsoft Corporation 2001).
6
Other differences between the Excel and tagsets.ExcelXP destinations are discussed in the remaining sections.
OPENING THE OUTPUT WITH EXCEL
Follow these steps to open the file with Excel:
1. From most versions of Excel, select File Open.
2. Navigate to the file or enter the path and filename in the File name field.
3. Click Open to import the XLSX or XML file.
You can instead navigate to the file using Microsoft Windows Explorer, and then double-click the file to open it with Excel. ExcelXP tagset users: Excel reads and converts the XML file to the Excel format. You can now perform any Excel function on the data. To save a copy of the file in Excel binary (XLS) format, use "Save As" and then select Microsoft Excel Workbook (*.xls) or Excel 97-2003 Workbook (*.xls)
from the Save as type drop-down list. If you're using Excel 2007 and later and want to save the
document in the Microsoft Office Open XML (XLSX) format, then select Excel Workbook (*.xlsx).
USING ODS TO CREATE THE MULTI-SHEET EXCEL WORKBOOK
Here is a listing of the basic SAS code used to create the Excel workbook:
ods _all_ close;
options missing=' ';
ods Excel file='AEResults.xlsx' nogtitle nogfootnote style=HTMLBlue;
* "Table of Contents" worksheet;
* Create a chart showing the frequency of the top 15 adverse events;
ods graphics on / reset=all imagefmt=png;
title 'Top 15 Adverse Events';
footnote;
proc sgplot data=sample.ae_topn_summary;
hbar aedecod / group=aesev
response=_frequency_
datalabel
categoryorder=respdesc;
yaxis label=' ';
styleattrs datacolors=(cxa1d99b cxffffb2 cxd95f0e)
datacontrastcolors=(cxa1d99b cxfe9929 cxd95f0e);
run; quit;
* Create a clickable Table of Contents (TOC);
title;
7
proc report data=sample.ae_topn_summary split='*' nowd;
column ('Click term to see detailed data'
aedecod aesev _frequency_ _frequency_=percent_of_topn);
define aedecod / order 'Dictionary-Derived Term';
define aesev / display 'Severity/Intensity';
define _frequency_ / analysis sum 'Frequency';
define percent_of_topn / analysis pctsum 'Percent of*Top 15'
format=percent8.1;
* Create the subtotal and grand total lines;
break after aedecod / summarize;
rbreak after / summarize;
compute aedecod;
* Specify labels for the subtotal and grand total lines;
if (upcase(_break_) eq 'AEDECOD') then aedecod = 'Subtotals';
else if (_break_ eq '_RBREAK_') then aedecod = 'Grand Totals';
* Placeholder for clickable links;
if (_break_ eq '') then do;
end;
endcomp;
run; quit;
* Detail data worksheets;
title link="" '(Click to return to the table of contents)';
footnote link="" '(Click to return to the table of contents)';
proc report data=sample.ae_topn split='*' missing nowd;
by aedecod;
column usubjid aesev aerel aestdt_n aeendt_n aeout last_aestdt;
define usubjid / order 'Unique Subject*Identifier';
define aesev / display 'Severity/*Intensity';
define aerel / display 'Causality';
define aestdt_n / display 'Start Date/Time*of Adverse Event'
format=yymmdd10.;
define aeendt_n / display 'End Date/Time*of Adverse Event'
format=yymmdd10.;
define aeout / display 'Outcome of*Adverse Event';
define last_aestdt / display noprint;
compute usubjid;
* Display the value for the ORDER variable for each row;
if (usubjid ne '')
then temp=usubjid;
else usubjid=temp;
endcomp;
compute last_aestdt;
* Placeholder for row highlighting;
if (aerel in ('POSSIBLE', 'PROBABLE') and aeout eq 'NOT RESOLVED' and
last_aestdt eq 1) then do;
end;
endcomp;
8
compute after usubjid;
* Add white space between subjects;
line ' ';
endcomp;
run; quit;
ods Excel close;
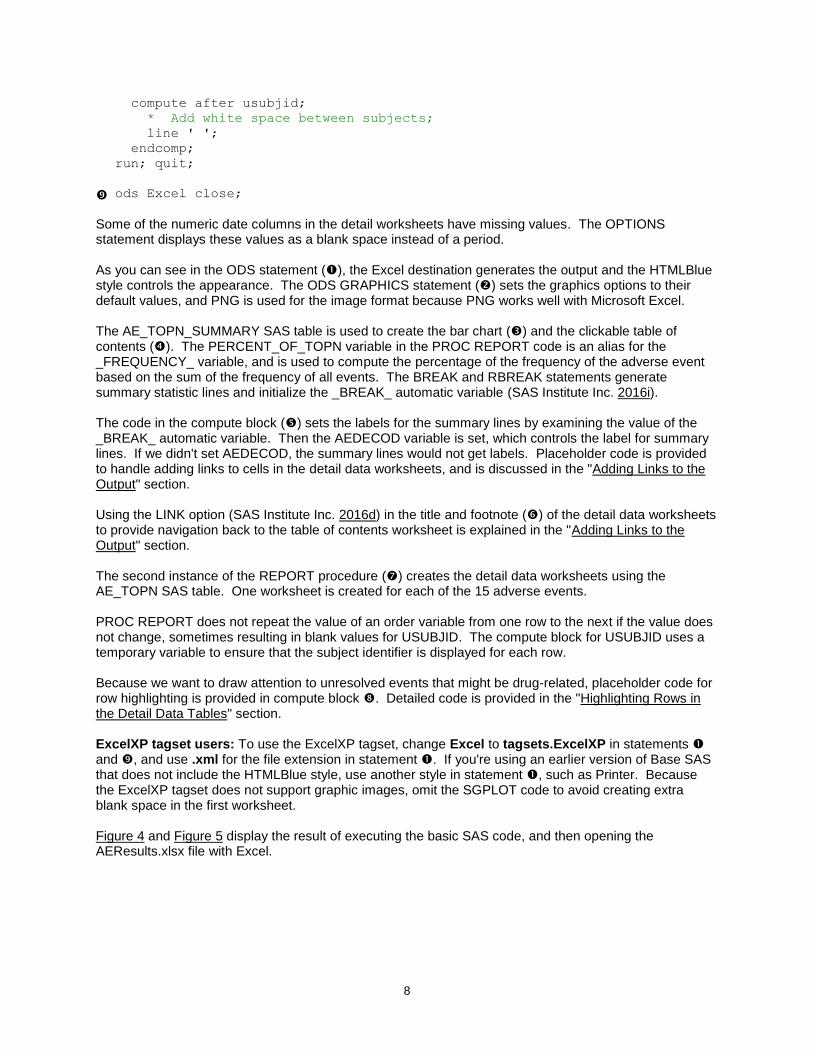
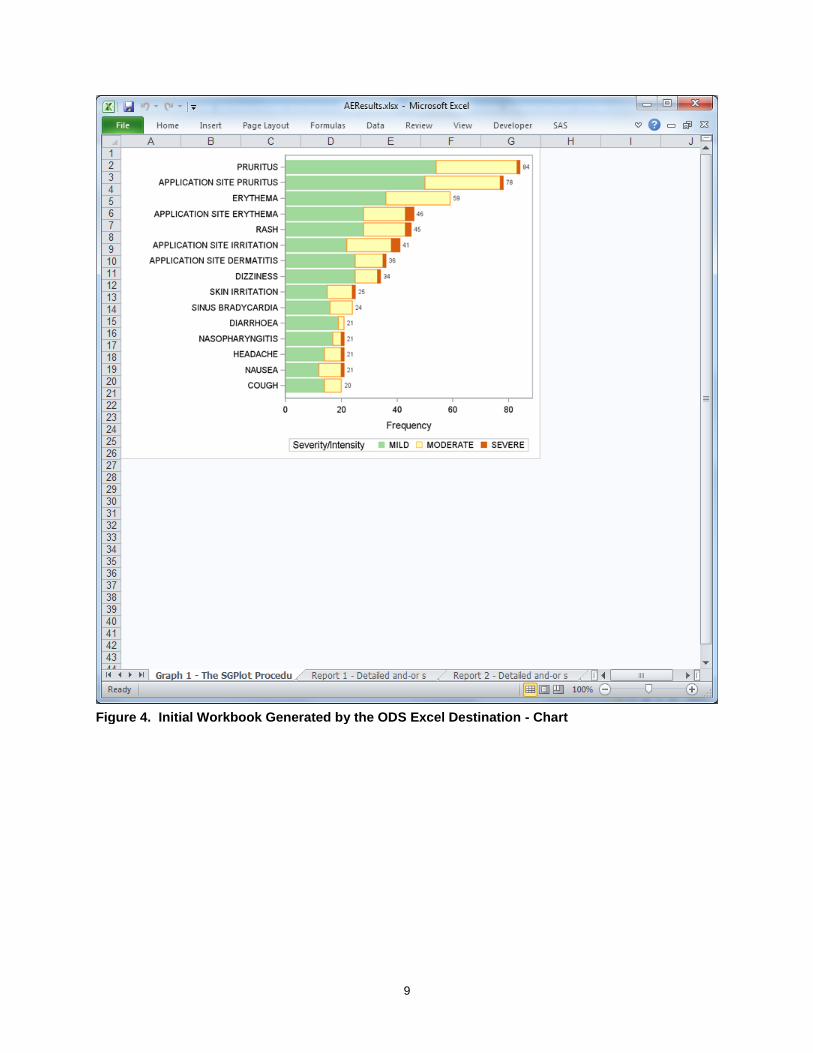
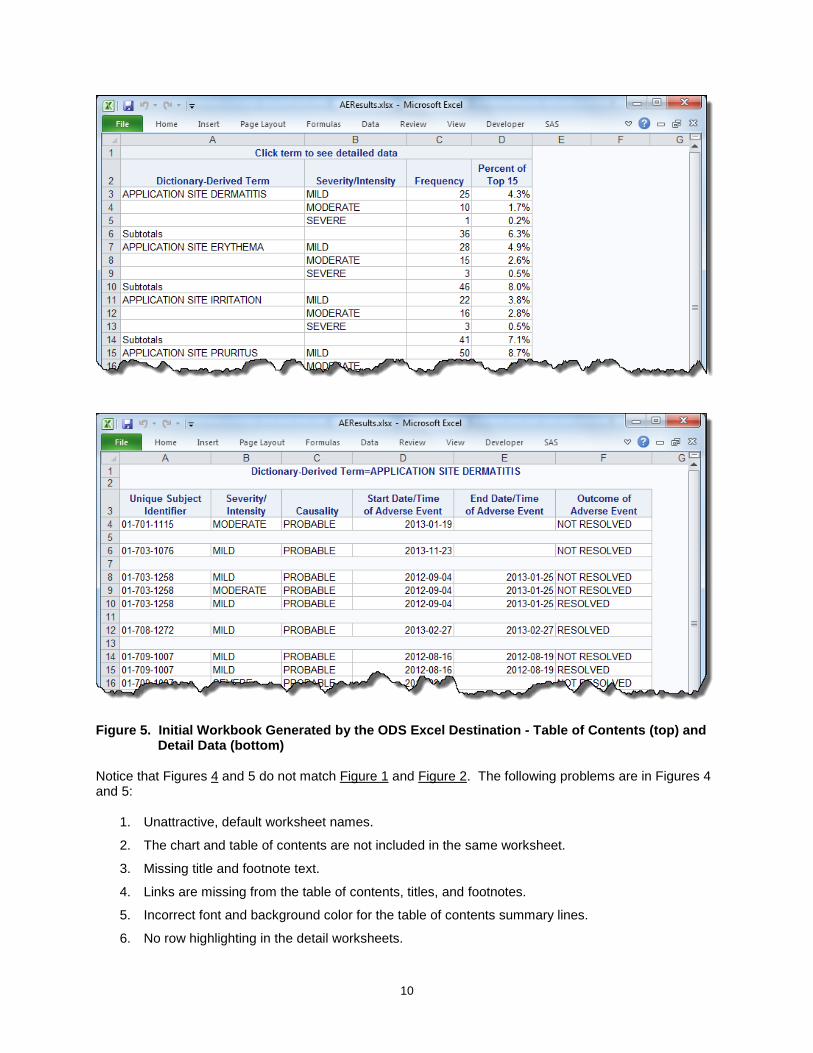
Some of the numeric date columns in the detail worksheets have missing values. The OPTIONS statement displays these values as a blank space instead of a period. As you can see in the ODS statement (), the Excel destination generates the output and the HTMLBlue style controls the appearance. The ODS GRAPHICS statement () sets the graphics options to their default values, and PNG is used for the image format because PNG works well with Microsoft Excel. The AE_TOPN_SUMMARY SAS table is used to create the bar chart () and the clickable table of contents (). The PERCENT_OF_TOPN variable in the PROC REPORT code is an alias for the _FREQUENCY_ variable, and is used to compute the percentage of the frequency of the adverse event based on the sum of the frequency of all events. The BREAK and RBREAK statements generate summary statistic lines and initialize the _BREAK_ automatic variable (SAS Institute Inc. 2016i). The code in the compute block () sets the labels for the summary lines by examining the value of the _BREAK_ automatic variable. Then the AEDECOD variable is set, which controls the label for summary lines. If we didn't set AEDECOD, the summary lines would not get labels. Placeholder code is provided to handle adding links to cells in the detail data worksheets, and is discussed in the "Adding Links to the Output" section. Using the LINK option (SAS Institute Inc. 2016d) in the title and footnote () of the detail data worksheets to provide navigation back to the table of contents worksheet is explained in the "Adding Links to the Output" section. The second instance of the REPORT procedure () creates the detail data worksheets using the AE_TOPN SAS table. One worksheet is created for each of the 15 adverse events. PROC REPORT does not repeat the value of an order variable from one row to the next if the value does not change, sometimes resulting in blank values for USUBJID. The compute block for USUBJID uses a temporary variable to ensure that the subject identifier is displayed for each row. Because we want to draw attention to unresolved events that might be drug-related, placeholder code for row highlighting is provided in compute block . Detailed code is provided in the "Highlighting Rows in the Detail Data Tables" section. ExcelXP tagset users: To use the ExcelXP tagset, change Excel to tagsets.ExcelXP in statements and , and use .xml for the file extension in statement . If you're using an earlier version of Base SAS that does not include the HTMLBlue style, use another style in statement , such as Printer. Because the ExcelXP tagset does not support graphic images, omit the SGPLOT code to avoid creating extra blank space in the first worksheet. Figure 4 and Figure 5 display the result of executing the basic SAS code, and then opening the AEResults.xlsx file with Excel.
9
Figure 4. Initial Workbook Generated by the ODS Excel Destination - Chart
10
Figure 5. Initial Workbook Generated by the ODS Excel Destination - Table of Contents (top) and Detail Data (bottom)
Notice that Figures 4 and 5 do not match Figure 1 and Figure 2. The following problems are in Figures 4 and 5:
1. Unattractive, default worksheet names.
2. The chart and table of contents are not included in the same worksheet.
3. Missing title and footnote text.
4. Links are missing from the table of contents, titles, and footnotes.
5. Incorrect font and background color for the table of contents summary lines.
6. No row highlighting in the detail worksheets.
11
In the remaining sections we change the basic SAS code to correct these problems. The complete SAS code used to create the workbook shown in Figure 1 and Figure 2 is listed in the section "The Final SAS Code".
UNDERSTANDING AND USING THE EXCEL DESTINATION OPTIONS
The Excel destination supports many options that control both the appearance and functionality of the Excel workbook. Many of these options are simply tied directly into existing Excel options or features. For example, the SHEET_NAME option specifies the worksheet name. Options are specified in an ODS statement using the OPTIONS keyword:
ods Excel options(option-name1='value1'
option-name2='value2' ...) ... ;
Note that the value that you specify for an option remains in effect until the Excel destination is closed or the option is set to another value. Because multiple ODS statements are allowed, it is good practice, in terms of functionality and code readability, to explicitly reset an option to its default value when you are finished using it. For example:
ods Excel file='file-name.xlsx' style=style-name ... ;
ods Excel options(option-name='some-value');
* Some SAS procedure code here;
ods Excel options(option-name='default-value');
* Other SAS procedure code here;
ods Excel close;
When specifying multiple ODS statements as shown above, specify the FILE, STYLE, or any other keyword or option that is supported by ODS only in the initial ODS statement. Refer to the ODS documentation for a list of available options (SAS Institute Inc. 2016e). All of the options work with any SAS procedure. However, ODS style overrides, discussed in the "Understanding and Using ODS Style Overrides" section, work only with the PRINT, REPORT, and TABULATE procedures. ExcelXP tagset users: In the preceding ODS statements, specify tagsets.ExcelXP instead of Excel, and use .xml for the file extension instead of .xlsx. To see a listing of the supported options printed to the SAS log, submit the following SAS code:
filename temp temp;
ods tagsets.ExcelXP file=temp options(doc='help');
ods tagsets.ExcelXP close;
filename temp clear;
SPECIFYING WORKSHEET NAMES
ODS generates a unique name for each worksheet, as required by Excel. Figure 4 shows some of the worksheet names that result from running the initial SAS code. Use the SHEET_NAME option to specify a worksheet name. We hardcode the name for the table of contents worksheet, and then use #BYVAL (SAS Institute Inc. 2016a) to automatically name the detail
12
data worksheets based on the value of the AEDECOD variable:
ods Excel file='AEResults.xlsx' nogtitle nogfootnote style=HTMLBlue;
* "Table of Contents" worksheet;
ods Excel options(sheet_name='Table of Contents');
* Create a chart showing the frequency of the top 15 adverse events;
proc sgplot . . . ; run; quit;
* Create a clickable Table of Contents (TOC);
proc report . . . ; run; quit;
* Detail data worksheets;
ods Excel options(sheet_name='#byval(aedecod)');
title link="" '(Click to return to the table of contents)';
footnote link="" '(Click to return to the table of contents)';
proc report data=sample.ae_topn split='*' missing nowd;
by aedecod;
. . . ;
run; quit;
ods Excel close;
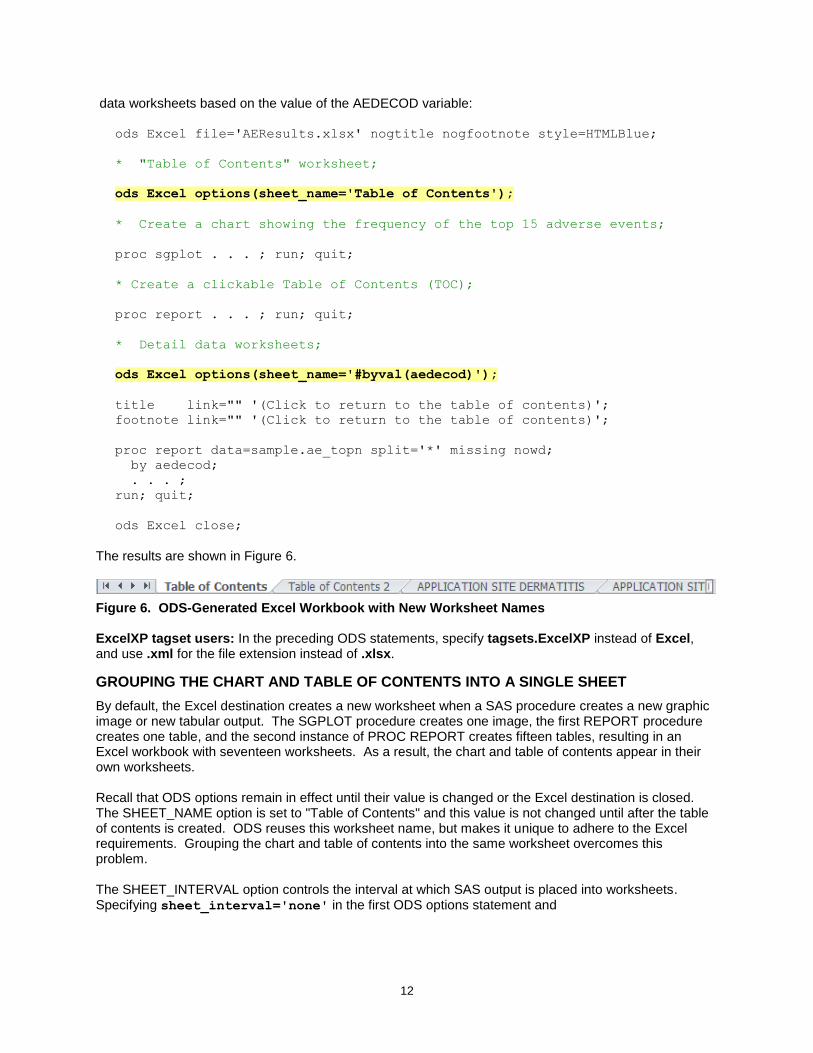
The results are shown in Figure 6.
Figure 6. ODS-Generated Excel Workbook with New Worksheet Names ExcelXP tagset users: In the preceding ODS statements, specify tagsets.ExcelXP instead of Excel, and use .xml for the file extension instead of .xlsx.
GROUPING THE CHART AND TABLE OF CONTENTS INTO A SINGLE SHEET
By default, the Excel destination creates a new worksheet when a SAS procedure creates a new graphic image or new tabular output. The SGPLOT procedure creates one image, the first REPORT procedure creates one table, and the second instance of PROC REPORT creates fifteen tables, resulting in an Excel workbook with seventeen worksheets. As a result, the chart and table of contents appear in their own worksheets. Recall that ODS options remain in effect until their value is changed or the Excel destination is closed. The SHEET_NAME option is set to "Table of Contents" and this value is not changed until after the table of contents is created. ODS reuses this worksheet name, but makes it unique to adhere to the Excel requirements. Grouping the chart and table of contents into the same worksheet overcomes this problem. The SHEET_INTERVAL option controls the interval at which SAS output is placed into worksheets. Specifying sheet_interval='none' in the first ODS options statement and
13
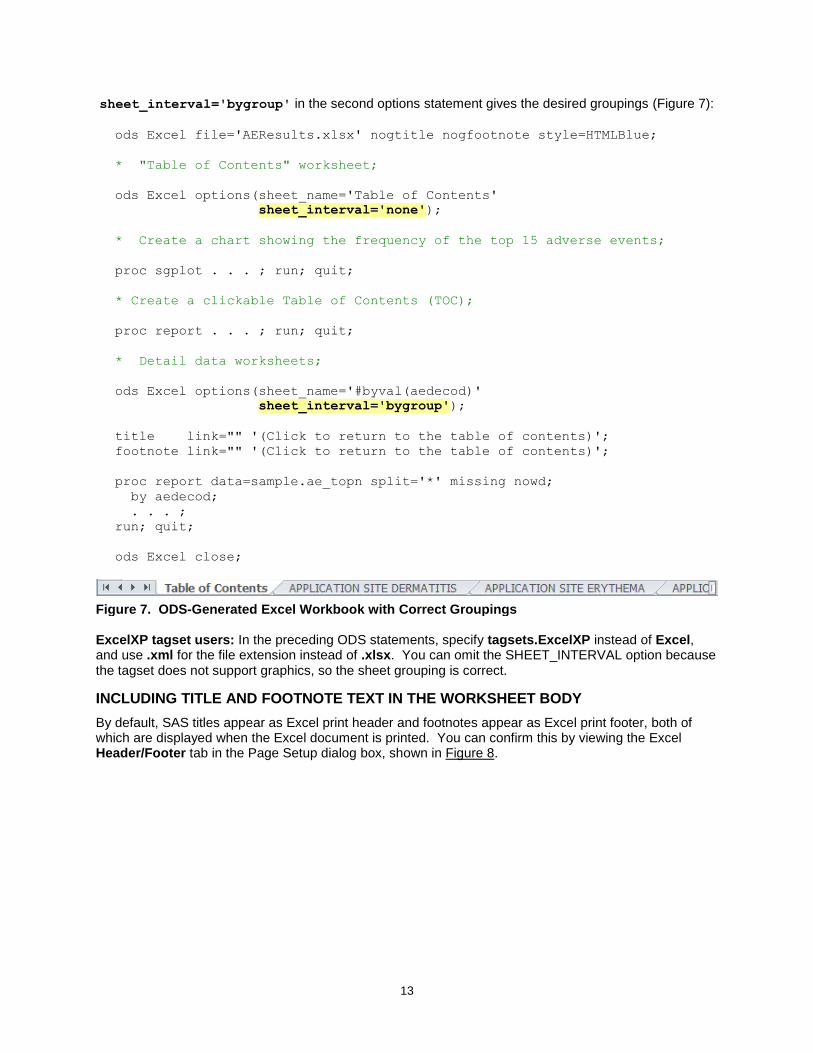
sheet_interval='bygroup' in the second options statement gives the desired groupings (Figure 7):
ods Excel file='AEResults.xlsx' nogtitle nogfootnote style=HTMLBlue;
* "Table of Contents" worksheet;
ods Excel options(sheet_name='Table of Contents'
sheet_interval='none');
* Create a chart showing the frequency of the top 15 adverse events;
proc sgplot . . . ; run; quit;
* Create a clickable Table of Contents (TOC);
proc report . . . ; run; quit;
* Detail data worksheets;
ods Excel options(sheet_name='#byval(aedecod)'
sheet_interval='bygroup');
title link="" '(Click to return to the table of contents)';
footnote link="" '(Click to return to the table of contents)';
proc report data=sample.ae_topn split='*' missing nowd;
by aedecod;
. . . ;
run; quit;
ods Excel close;
Figure 7. ODS-Generated Excel Workbook with Correct Groupings ExcelXP tagset users: In the preceding ODS statements, specify tagsets.ExcelXP instead of Excel, and use .xml for the file extension instead of .xlsx. You can omit the SHEET_INTERVAL option because the tagset does not support graphics, so the sheet grouping is correct.
INCLUDING TITLE AND FOOTNOTE TEXT IN THE WORKSHEET BODY
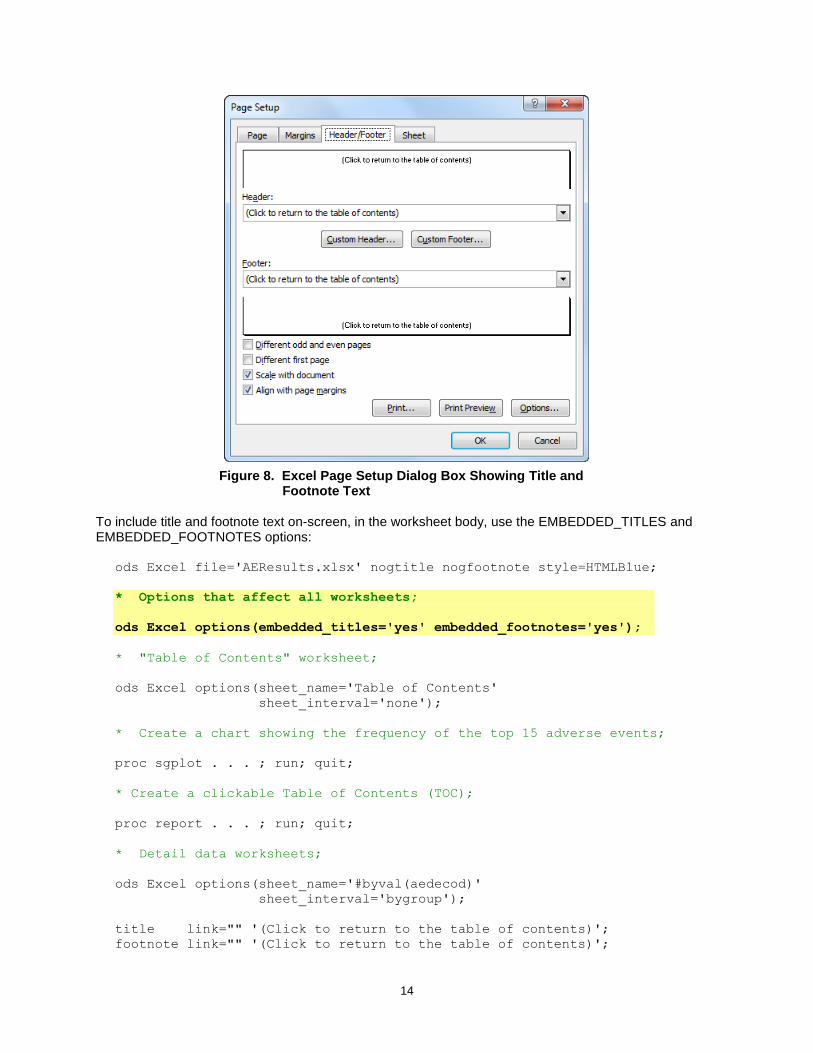
By default, SAS titles appear as Excel print header and footnotes appear as Excel print footer, both of which are displayed when the Excel document is printed. You can confirm this by viewing the Excel Header/Footer tab in the Page Setup dialog box, shown in Figure 8.
14
Figure 8. Excel Page Setup Dialog Box Showing Title and Footnote Text
To include title and footnote text on-screen, in the worksheet body, use the EMBEDDED_TITLES and EMBEDDED_FOOTNOTES options:
ods Excel file='AEResults.xlsx' nogtitle nogfootnote style=HTMLBlue;
* Options that affect all worksheets;
ods Excel options(embedded_titles='yes' embedded_footnotes='yes');
* "Table of Contents" worksheet;
ods Excel options(sheet_name='Table of Contents'
sheet_interval='none');
* Create a chart showing the frequency of the top 15 adverse events;
proc sgplot . . . ; run; quit;
* Create a clickable Table of Contents (TOC);
proc report . . . ; run; quit;
* Detail data worksheets;
ods Excel options(sheet_name='#byval(aedecod)'
sheet_interval='bygroup');
title link="" '(Click to return to the table of contents)';
footnote link="" '(Click to return to the table of contents)';
15
proc report data=sample.ae_topn split='*' missing nowd;
by aedecod;
. . . ;
run; quit;
ods Excel close;
Because these options are placed at the beginning of the code and are not changed later, they affect all worksheets. The title and footnote text is now included in the body of all worksheets. ExcelXP tagset users: In the preceding ODS statements, specify tagsets.ExcelXP instead of Excel, and use .xml for the file extension instead of .xlsx.
ADDING LINKS TO THE OUTPUT
We want to display detailed adverse event information when we click on an event name in the table of contents worksheet. This is accomplished by attaching Excel cell reference links to the event names. The general syntax to link to a cell in an Excel workbook is:
file-name#'worksheet-name'!cell-reference
When linking to a cell in the same workbook, as we are, it is best to omit the file name. This prevents errors if the Excel file is renamed from "AEResults.xlsx" to some other name. The #BYVAL code in the "Specifying Worksheet Names" section specifies that the AEDECOD variable value be used for the detail data worksheet names. We add code to the existing COMPUTE block to construct the link to these worksheets using the AEDECOD variable:
compute aedecod;
* Specify labels for the subtotal and grand total lines;
if (upcase(_break_) eq 'AEDECOD') then aedecod = 'Subtotals';
else if (_break_ eq '_RBREAK_') then aedecod = 'Grand Totals';
* Placeholder for clickable links;
if (_break_ eq '') then do;
urlstring = "#'" || strip(aedecod) || "'!A1";
call define(_col_, 'url', urlstring);
end;
endcomp;
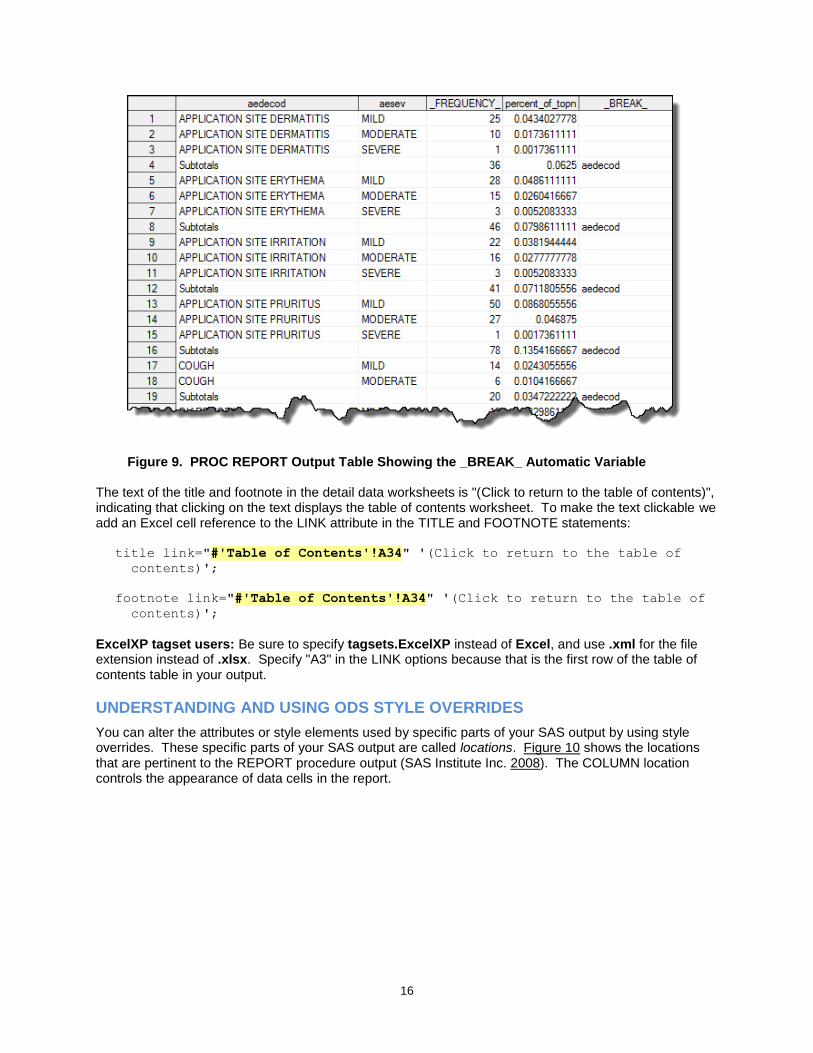
The PROC REPORT output table in Figure 9, created by the OUT= option, contains one record for each row in our report (SAS Institute Inc. 2016f). The automatic _BREAK_ variable is blank for cells containing the adverse event name, and we apply the Excel link only to these cells (). The link text is constructed and stored in the URLSTRING temporary variable (). A typical value is "#'APPLICATION SITE DERMATITIS'!A1". The link is then associated with the AEDECOD column using the CALL DEFINE statement (). Here is the syntax of the CALL DEFINE statement (SAS Institute Inc. 2016b):
call define(column-id | _ROW_, 'attribute-name', 'attribute-value');
The _COL_ automatic variable references the column associated with the COMPUTE block, and the URL attribute creates the link. Clicking on an adverse event name in the table of contents displays the detail data worksheet for that event.
16
Figure 9. PROC REPORT Output Table Showing the _BREAK_ Automatic Variable The text of the title and footnote in the detail data worksheets is "(Click to return to the table of contents)", indicating that clicking on the text displays the table of contents worksheet. To make the text clickable we add an Excel cell reference to the LINK attribute in the TITLE and FOOTNOTE statements:
title link="#'Table of Contents'!A34" '(Click to return to the table of
contents)';
footnote link="#'Table of Contents'!A34" '(Click to return to the table of
contents)';
ExcelXP tagset users: Be sure to specify tagsets.ExcelXP instead of Excel, and use .xml for the file extension instead of .xlsx. Specify "A3" in the LINK options because that is the first row of the table of contents table in your output.
UNDERSTANDING AND USING ODS STYLE OVERRIDES
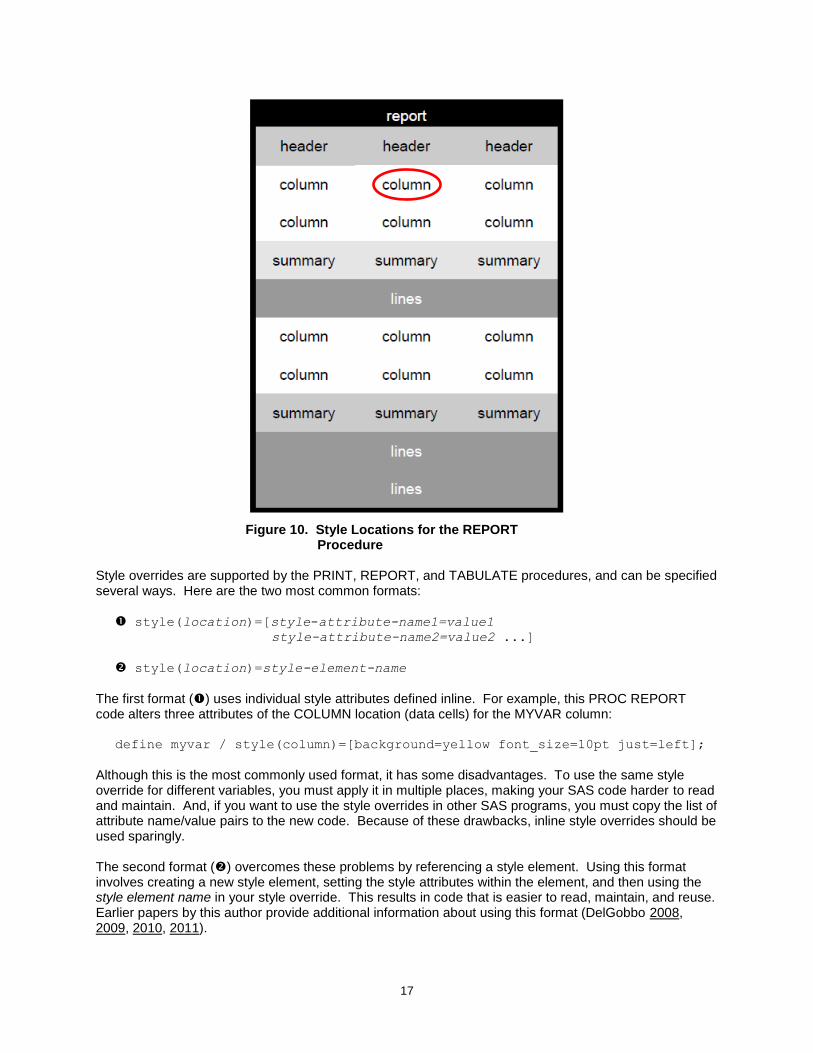
You can alter the attributes or style elements used by specific parts of your SAS output by using style overrides. These specific parts of your SAS output are called locations. Figure 10 shows the locations that are pertinent to the REPORT procedure output (SAS Institute Inc. 2008). The COLUMN location controls the appearance of data cells in the report.
17
Figure 10. Style Locations for the REPORT Procedure
Style overrides are supported by the PRINT, REPORT, and TABULATE procedures, and can be specified several ways. Here are the two most common formats: style(location)=[style-attribute-name1=value1
style-attribute-name2=value2 ...]
style(location)=style-element-name
The first format () uses individual style attributes defined inline. For example, this PROC REPORT code alters three attributes of the COLUMN location (data cells) for the MYVAR column:
define myvar / style(column)=[background=yellow font_size=10pt just=left];
Although this is the most commonly used format, it has some disadvantages. To use the same style override for different variables, you must apply it in multiple places, making your SAS code harder to read and maintain. And, if you want to use the style overrides in other SAS programs, you must copy the list of attribute name/value pairs to the new code. Because of these drawbacks, inline style overrides should be used sparingly. The second format () overcomes these problems by referencing a style element. Using this format involves creating a new style element, setting the style attributes within the element, and then using the style element name in your style override. This results in code that is easier to read, maintain, and reuse. Earlier papers by this author provide additional information about using this format (DelGobbo 2008, 2009, 2010, 2011).
18
You can also use the CALL DEFINE statement in PROC REPORT to implement style overrides. For example:
compute myvar;
call define(column-id | _ROW_,
'style',
'style=[attribute-name=attribute-value]');
endcomp;
Refer to the ODS documentation for a full listing of style attributes (SAS Institute Inc. 2016h).
UNDERLINING THE LINKS IN THE TABLE OF CONTENTS CELLS
When you hover your mouse over a cell with a link, Excel changes the mouse pointer and displays a pop-up dialog showing the link location. We want to underline the link text to provide a better visual cue that the cell contains a link. This is accomplished by applying a style override using CALL DEFINE inside the compute block:
compute aedecod;
* Specify labels for the subtotal and grand total lines;
if (upcase(_break_) eq 'AEDECOD') then aedecod = 'Subtotals';
else if (_break_ eq '_RBREAK_') then aedecod = 'Grand Totals';
* Placeholder for clickable links;
if (_break_ eq '') then do;
urlstring = "#'" || strip(aedecod) || "'!A1";
call define(_col_, 'url', urlstring);
call define(_col_, 'style', 'style=[textdecoration=underline]');
end;
endcomp;
ExcelXP tagset users: This feature is not supported by the tagset.
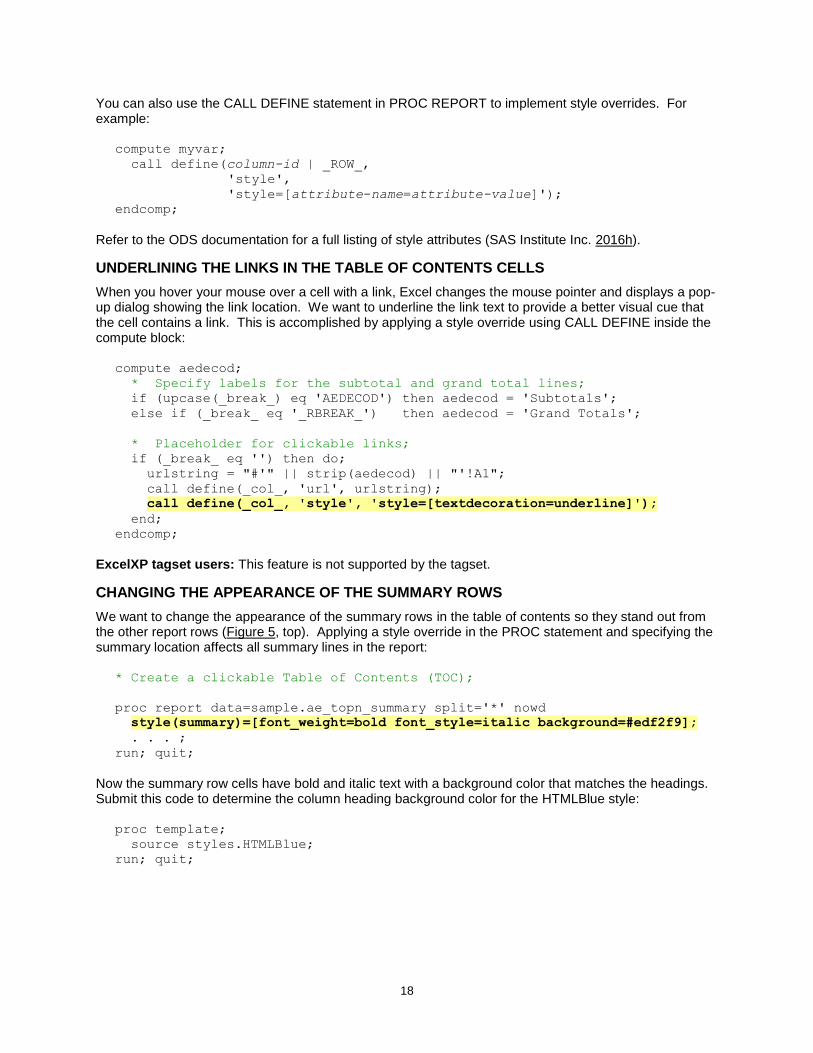
CHANGING THE APPEARANCE OF THE SUMMARY ROWS
We want to change the appearance of the summary rows in the table of contents so they stand out from the other report rows (Figure 5, top). Applying a style override in the PROC statement and specifying the summary location affects all summary lines in the report:
* Create a clickable Table of Contents (TOC);
proc report data=sample.ae_topn_summary split='*' nowd
style(summary)=[font_weight=bold font_style=italic background=#edf2f9];
. . . ;
run; quit;
Now the summary row cells have bold and italic text with a background color that matches the headings. Submit this code to determine the column heading background color for the HTMLBlue style:
proc template;
source styles.HTMLBlue;
run; quit;
19
The definition for the Header style element is displayed in the SAS log:
class Header /
bordercolor = cxB0B7BB
backgroundcolor = cxEDF2F9
color = cx112277;
ODS supports specifying RGB color values using CX or number sign (#) notation (SAS Institute Inc. 2016g).
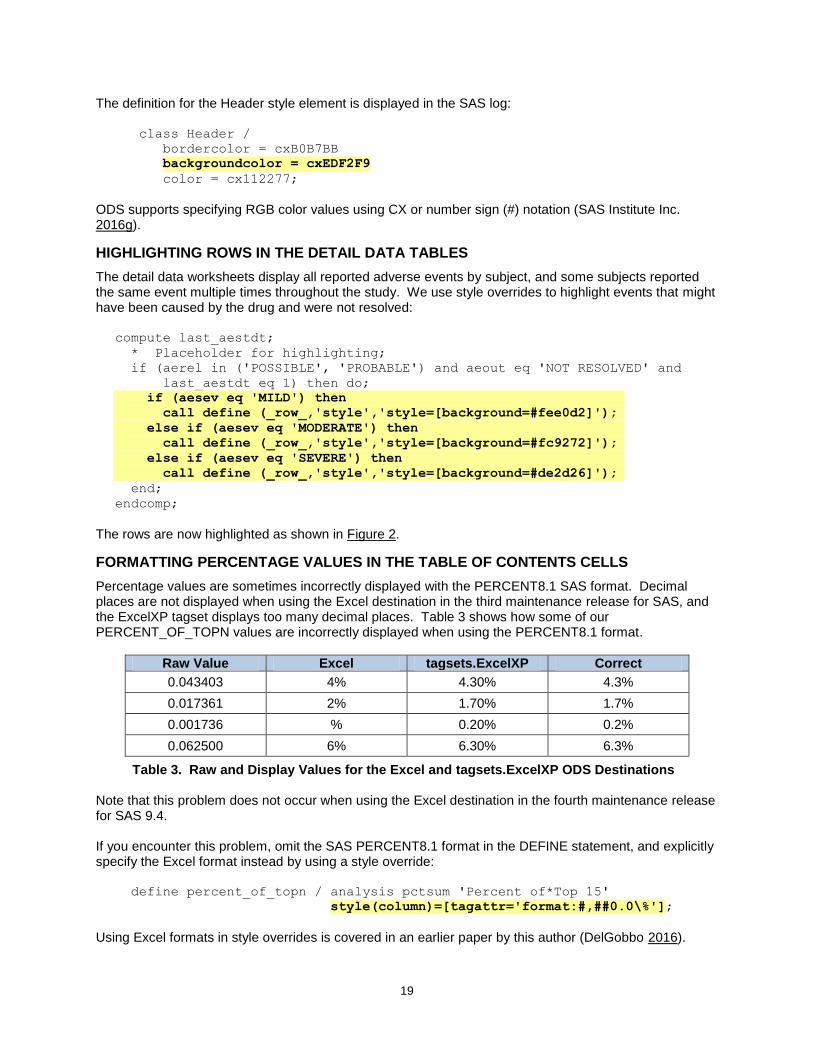
HIGHLIGHTING ROWS IN THE DETAIL DATA TABLES
The detail data worksheets display all reported adverse events by subject, and some subjects reported the same event multiple times throughout the study. We use style overrides to highlight events that might have been caused by the drug and were not resolved:
compute last_aestdt;
* Placeholder for highlighting;
if (aerel in ('POSSIBLE', 'PROBABLE') and aeout eq 'NOT RESOLVED' and
last_aestdt eq 1) then do;
if (aesev eq 'MILD') then
call define (_row_,'style','style=[background=#fee0d2]');
else if (aesev eq 'MODERATE') then
call define (_row_,'style','style=[background=#fc9272]');
else if (aesev eq 'SEVERE') then
call define (_row_,'style','style=[background=#de2d26]');
end;
endcomp;
The rows are now highlighted as shown in Figure 2.
FORMATTING PERCENTAGE VALUES IN THE TABLE OF CONTENTS CELLS
Percentage values are sometimes incorrectly displayed with the PERCENT8.1 SAS format. Decimal places are not displayed when using the Excel destination in the third maintenance release for SAS, and the ExcelXP tagset displays too many decimal places. Table 3 shows how some of our PERCENT_OF_TOPN values are incorrectly displayed when using the PERCENT8.1 format.
Raw Value Excel tagsets.ExcelXP Correct
0.043403 4% 4.30% 4.3%
0.017361 2% 1.70% 1.7%
0.001736 % 0.20% 0.2%
0.062500 6% 6.30% 6.3%
Table 3. Raw and Display Values for the Excel and tagsets.ExcelXP ODS Destinations Note that this problem does not occur when using the Excel destination in the fourth maintenance release for SAS 9.4. If you encounter this problem, omit the SAS PERCENT8.1 format in the DEFINE statement, and explicitly specify the Excel format instead by using a style override:
define percent_of_topn / analysis pctsum 'Percent of*Top 15'
style(column)=[tagattr='format:#,##0.0\%'];
Using Excel formats in style overrides is covered in an earlier paper by this author (DelGobbo 2016).
20
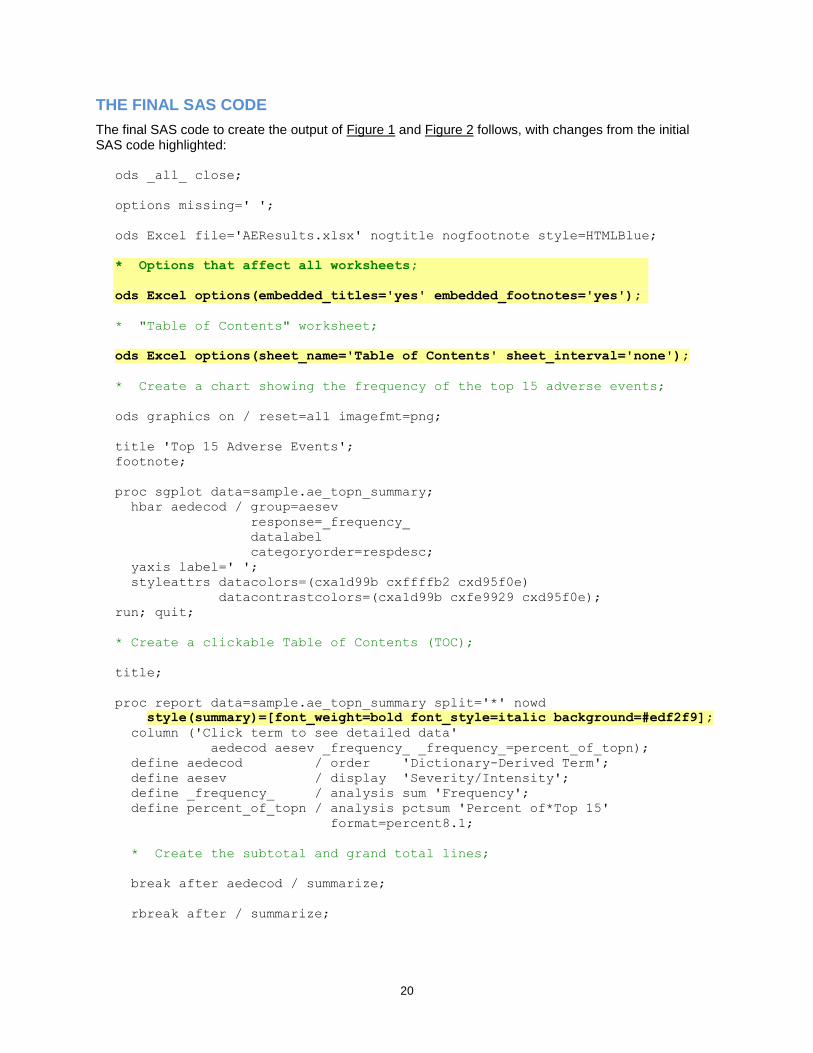
THE FINAL SAS CODE
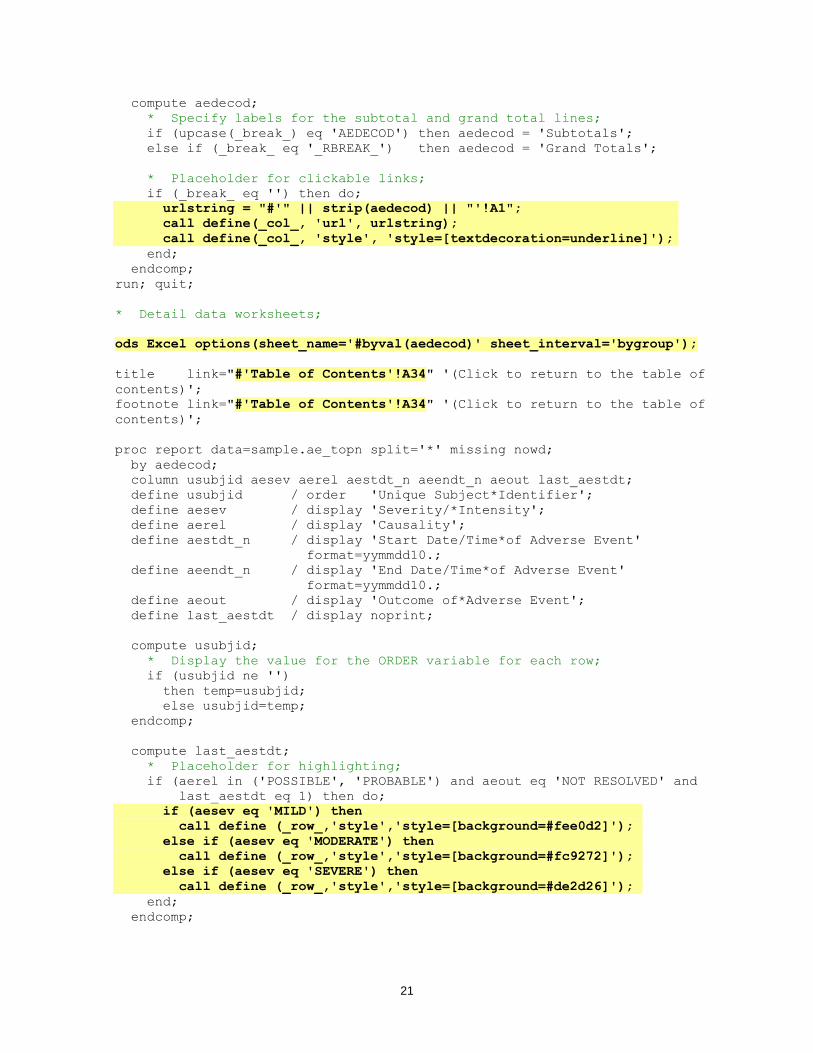
The final SAS code to create the output of Figure 1 and Figure 2 follows, with changes from the initial SAS code highlighted:
ods _all_ close;
options missing=' ';
ods Excel file='AEResults.xlsx' nogtitle nogfootnote style=HTMLBlue;
* Options that affect all worksheets;
ods Excel options(embedded_titles='yes' embedded_footnotes='yes');
* "Table of Contents" worksheet;
ods Excel options(sheet_name='Table of Contents' sheet_interval='none');
* Create a chart showing the frequency of the top 15 adverse events;
ods graphics on / reset=all imagefmt=png;
title 'Top 15 Adverse Events';
footnote;
proc sgplot data=sample.ae_topn_summary;
hbar aedecod / group=aesev
response=_frequency_
datalabel
categoryorder=respdesc;
yaxis label=' ';
styleattrs datacolors=(cxa1d99b cxffffb2 cxd95f0e)
datacontrastcolors=(cxa1d99b cxfe9929 cxd95f0e);
run; quit;
* Create a clickable Table of Contents (TOC);
title;
proc report data=sample.ae_topn_summary split='*' nowd
style(summary)=[font_weight=bold font_style=italic background=#edf2f9];
column ('Click term to see detailed data'
aedecod aesev _frequency_ _frequency_=percent_of_topn);
define aedecod / order 'Dictionary-Derived Term';
define aesev / display 'Severity/Intensity';
define _frequency_ / analysis sum 'Frequency';
define percent_of_topn / analysis pctsum 'Percent of*Top 15'
format=percent8.1;
* Create the subtotal and grand total lines;
break after aedecod / summarize;
rbreak after / summarize;
21
compute aedecod;
* Specify labels for the subtotal and grand total lines;
if (upcase(_break_) eq 'AEDECOD') then aedecod = 'Subtotals';
else if (_break_ eq '_RBREAK_') then aedecod = 'Grand Totals';
* Placeholder for clickable links;
if (_break_ eq '') then do;
urlstring = "#'" || strip(aedecod) || "'!A1";
call define(_col_, 'url', urlstring);
call define(_col_, 'style', 'style=[textdecoration=underline]');
end;
endcomp;
run; quit;
* Detail data worksheets;
ods Excel options(sheet_name='#byval(aedecod)' sheet_interval='bygroup');
title link="#'Table of Contents'!A34" '(Click to return to the table of
contents)';
footnote link="#'Table of Contents'!A34" '(Click to return to the table of
contents)';
proc report data=sample.ae_topn split='*' missing nowd;
by aedecod;
column usubjid aesev aerel aestdt_n aeendt_n aeout last_aestdt;
define usubjid / order 'Unique Subject*Identifier';
define aesev / display 'Severity/*Intensity';
define aerel / display 'Causality';
define aestdt_n / display 'Start Date/Time*of Adverse Event'
format=yymmdd10.;
define aeendt_n / display 'End Date/Time*of Adverse Event'
format=yymmdd10.;
define aeout / display 'Outcome of*Adverse Event';
define last_aestdt / display noprint;
compute usubjid;
* Display the value for the ORDER variable for each row;
if (usubjid ne '')
then temp=usubjid;
else usubjid=temp;
endcomp;
compute last_aestdt;
* Placeholder for highlighting;
if (aerel in ('POSSIBLE', 'PROBABLE') and aeout eq 'NOT RESOLVED' and
last_aestdt eq 1) then do;
if (aesev eq 'MILD') then
call define (_row_,'style','style=[background=#fee0d2]');
else if (aesev eq 'MODERATE') then
call define (_row_,'style','style=[background=#fc9272]');
else if (aesev eq 'SEVERE') then
call define (_row_,'style','style=[background=#de2d26]');
end;
endcomp;
22
compute after usubjid;
* Add white space between subjects;
line ' ';
endcomp;
run; quit;
ods Excel close;
SAS SERVER TECHNOLOGY
You can deliver dynamically generated SAS output in Excel using the Application Dispatcher or the SAS®
Stored Process Server. The Application Dispatcher is part of SAS/IntrNet® software. The SAS Stored
Process Server is available starting with SAS®9 as part of SAS® Integration Technologies, and is included
with server offerings that use the SAS Business Analytics infrastructure (for example, SAS® BI Server and
SAS® Enterprise BI Server).
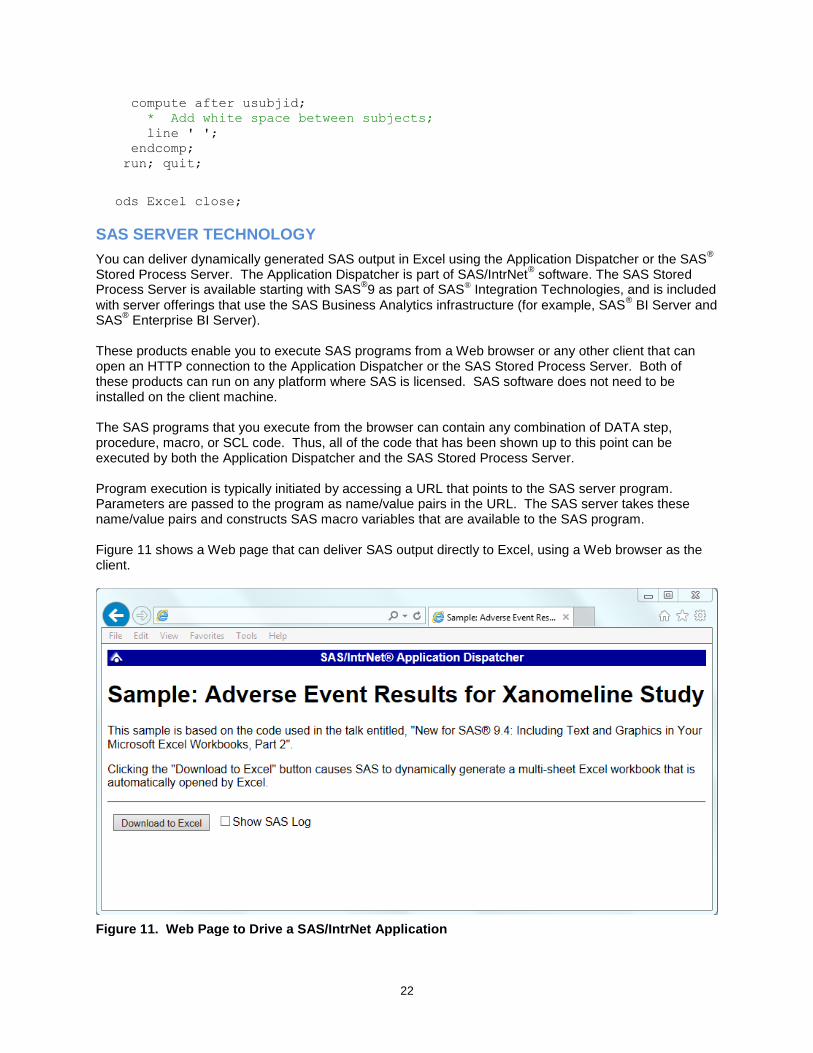
These products enable you to execute SAS programs from a Web browser or any other client that can open an HTTP connection to the Application Dispatcher or the SAS Stored Process Server. Both of these products can run on any platform where SAS is licensed. SAS software does not need to be installed on the client machine. The SAS programs that you execute from the browser can contain any combination of DATA step, procedure, macro, or SCL code. Thus, all of the code that has been shown up to this point can be executed by both the Application Dispatcher and the SAS Stored Process Server. Program execution is typically initiated by accessing a URL that points to the SAS server program. Parameters are passed to the program as name/value pairs in the URL. The SAS server takes these name/value pairs and constructs SAS macro variables that are available to the SAS program. Figure 11 shows a Web page that can deliver SAS output directly to Excel, using a Web browser as the client.
Figure 11. Web Page to Drive a SAS/IntrNet Application
23
Clicking Download to Excel executes a slightly modified version of the SAS code that we have been working on. The modifications are as follows:
%let RV=%sysfunc(appsrv_header(Content-type,application/vnd.ms-excel));
%let RV=%sysfunc(appsrv_header(Content-disposition,attachment; filename=
"AEResults.xlsx")); * Ignore line wrapping;
ods _all_ close;
ods Excel file=_webout style=HTMLBlue;
* Remainder of the "final" SAS code;
ods Excel close;
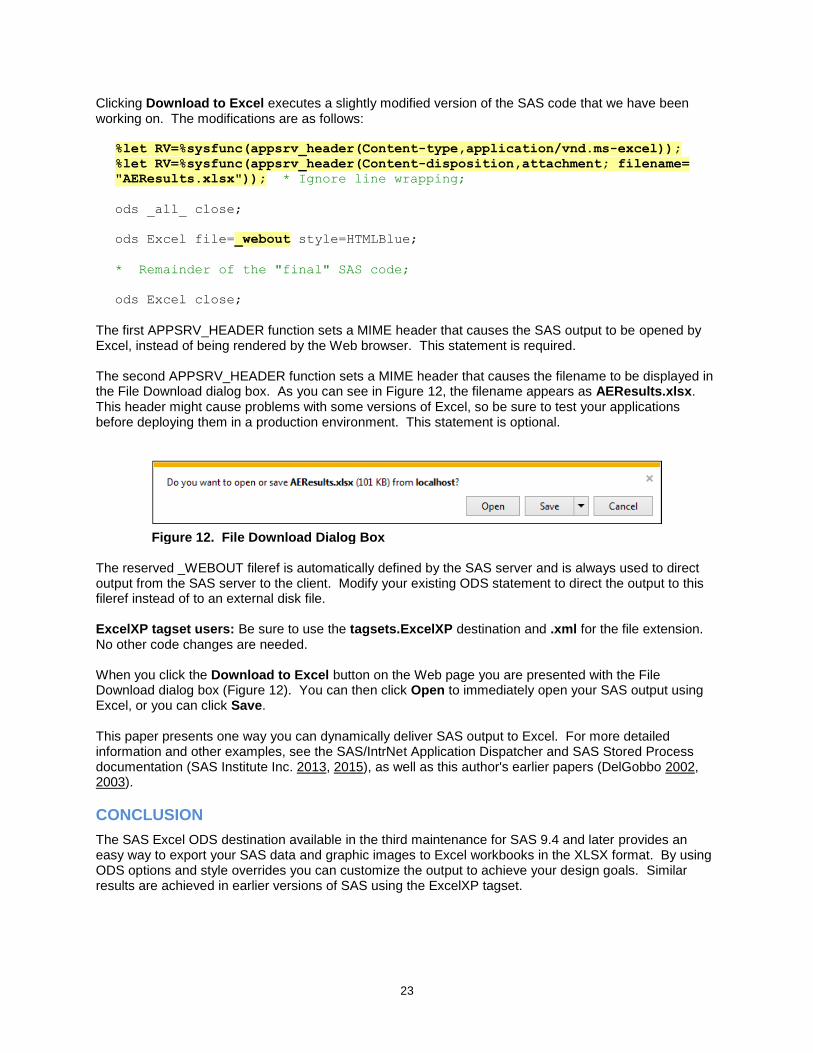
The first APPSRV_HEADER function sets a MIME header that causes the SAS output to be opened by Excel, instead of being rendered by the Web browser. This statement is required. The second APPSRV_HEADER function sets a MIME header that causes the filename to be displayed in the File Download dialog box. As you can see in Figure 12, the filename appears as AEResults.xlsx. This header might cause problems with some versions of Excel, so be sure to test your applications before deploying them in a production environment. This statement is optional.
Figure 12. File Download Dialog Box The reserved _WEBOUT fileref is automatically defined by the SAS server and is always used to direct output from the SAS server to the client. Modify your existing ODS statement to direct the output to this fileref instead of to an external disk file. ExcelXP tagset users: Be sure to use the tagsets.ExcelXP destination and .xml for the file extension. No other code changes are needed. When you click the Download to Excel button on the Web page you are presented with the File Download dialog box (Figure 12). You can then click Open to immediately open your SAS output using Excel, or you can click Save. This paper presents one way you can dynamically deliver SAS output to Excel. For more detailed information and other examples, see the SAS/IntrNet Application Dispatcher and SAS Stored Process documentation (SAS Institute Inc. 2013, 2015), as well as this author's earlier papers (DelGobbo 2002, 2003).
CONCLUSION
The SAS Excel ODS destination available in the third maintenance for SAS 9.4 and later provides an easy way to export your SAS data and graphic images to Excel workbooks in the XLSX format. By using ODS options and style overrides you can customize the output to achieve your design goals. Similar results are achieved in earlier versions of SAS using the ExcelXP tagset.

24
REFERENCES
DelGobbo, Vincent. 2002. "Techniques for SAS® Enabling Microsoft Office in a Cross-Platform
Environment". Proceedings of the Twenty-Seventh Annual SAS Users Group International Conference. Cary, NC: SAS Institute Inc. Available at http://www2.sas.com/proceedings/sugi27/p174-27.pdf. DelGobbo, Vincent. 2003. "A Beginner’s Guide to Incorporating SAS
® Output in Microsoft Office
Applications". Proceedings of the Twenty-Eighth Annual SAS Users Group International Conference. Cary, NC: SAS Institute Inc. Available at http://www2.sas.com/proceedings/sugi28/052-28.pdf. DelGobbo, Vincent. 2008. "Tips and Tricks for Creating Multi-Sheet Microsoft Excel Workbooks the Easy Way with SAS
®". Proceedings of the SAS Global Forum 2008 Conference. Cary, NC: SAS Institute Inc.
Available at http://www2.sas.com/proceedings/forum2008/192-2008.pdf. DelGobbo, Vincent. 2009. "More Tips and Tricks for Creating Multi-Sheet Microsoft Excel Workbooks the Easy Way with SAS
®". Proceedings of the SAS Global Forum 2009 Conference. Cary, NC: SAS Institute
Inc. Available at http://support.sas.com/resources/papers/proceedings09/152-2009.pdf. DelGobbo, Vincent. 2010. "Traffic Lighting Your Multi-Sheet Microsoft Excel Workbooks the Easy Way with SAS
®". Proceedings of the SAS Global Forum 2010 Conference. Cary, NC: SAS Institute Inc.
Available at http://support.sas.com/resources/papers/proceedings10/153-2010.pdf. DelGobbo, Vincent. 2011. "Creating Stylish Multi-Sheet Microsoft Excel Workbooks the Easy Way with SAS
®". Proceedings of the SAS Global Forum 2011 Conference. Cary, NC: SAS Institute Inc.
Available at http://support.sas.com/resources/papers/proceedings11/170-2011.pdf. DelGobbo, Vincent. 2015. "Vince DelGobbo's ExcelXP Tagset Paper Index". Available at http://support.sas.com/community/events/sastalks/presentations/ExcelXPPaperIndex.pdf. DelGobbo, Vincent. 2016. "New for SAS
® 9.4: A Technique for Including Text and Graphics in Your
Microsoft Excel Workbooks, Part 1". Proceedings of the SAS Global Forum 2016 Conference. Cary, NC: SAS Institute Inc. Available at http://support.sas.com/resources/papers/proceedings16/SAS2940-2016.pdf. Microsoft Corporation. 2001. "XML Spreadsheet Reference". Available at http://msdn.microsoft.com/en-us/library/aa140066(office.10).aspx. Microsoft Corporation. 2017. "Error opening file: 'The file format differs from the format that the file name extension specifies'". Available at http://support.microsoft.com/kb/948615. SAS Institute Inc. 2008. "SAS
® 9 Reporting Procedure Styles Tip Sheet".
Available at http://support.sas.com/rnd/base/ods/scratch/reporting-styles-tips.pdf. SAS Institute Inc. 2009. "Sample 36900: Instructions for viewing all of the style templates that are shipped with SAS®". Available at http://support.sas.com/techsup/notes/v8/36/900.html. SAS Institute Inc. 2013. SAS/IntrNet
® 9.4: Application Dispatcher. Cary, NC: SAS Institute Inc.
Available at http://support.sas.com/documentation/cdl/en/dispatch/64895/HTML/default/viewer.htm#p06h82ux8glu1pn16k9dxw8tjpyz.htm. SAS Institute Inc. 2015. SAS
® 9.4 Stored Processes: Developer's Guide, Third Edition. Cary, NC: SAS
Institute Inc. Available at http://support.sas.com/documentation/cdl/en/stpug/67499/HTML/default/viewer.htm#n180km1hadyuton13gx4bzlqhpwr.htm.
25
SAS Institute Inc. 2016a. "#BYVALn | #BYVAL(variable-name)." SAS® 9.4 Statements: Reference, Fifth Edition. Cary, NC: SAS Institute Inc. Available at https://support.sas.com/documentation/cdl/en/lestmtsref/69738/HTML/default/viewer.htm#p10gcmrmf83iaxn1ilrx4pra969n.htm. SAS Institute Inc. 2016b. "CALL DEFINE Statement". Base SAS® 9.4 Procedures Guide, Sixth Edition. Cary, NC: SAS Institute Inc. Available at http://support.sas.com/documentation/cdl/en/proc/69850/HTML/default/viewer.htm#n1b1be5822k8nnn1s1ucv8fvpg3d.htm. SAS Institute Inc. 2016c. "FILESYSTEM= System Option: z/OS". SAS® 9.4 Companion for z/OS, Sixth Edition. Cary, NC: SAS Institute Inc. Available at http://support.sas.com/documentation/cdl/en/hosto390/68955/HTML/default/viewer.htm#n0b7vr7xilcwccn13bv8r2fk9yco.htm. SAS Institute Inc. 2016d. "LINK='url'". SAS® 9.4 Statements: Reference, Fifth Edition. Cary, NC: SAS Institute Inc. Available at https://support.sas.com/documentation/cdl/en/lestmtsref/69738/HTML/default/viewer.htm#p10gcmrmf83iaxn1ilrx4pra969n.htm. SAS Institute Inc. 2016e. "ODS EXCEL Statement". SAS® 9.4 Output Delivery System: User’s Guide, Fifth Edition. Cary, NC: SAS Institute Inc. Available at http://support.sas.com/documentation/cdl/en/odsug/67921/HTML/default/viewer.htm#p09n5pw9ol0897n1qe04zeur27rv.htm. SAS Institute Inc. 2016f. "OUT=SAS-data-set". Base SAS® 9.4 Procedures Guide, Sixth Edition. Cary, NC: SAS Institute Inc. Available at http://support.sas.com/documentation/cdl/en/proc/69850/HTML/default/viewer.htm#n1dz7jdasx5t56n1rmlx346dyk6n.htm#n0uhmwyz65cqj2n1v3xrfi4uqe97. SAS Institute Inc. 2016g. "Style Attribute Values". SAS
® 9.4 Output Delivery System: User's Guide, Fifth
Edition. Cary, NC: SAS Institute Inc. Available at http://support.sas.com/documentation/cdl/en/odsug/69832/HTML/default/viewer.htm#p1nyocfo146uzpn1801ibif0wg6g.htm. SAS Institute Inc. 2016h. "Style Attributes Detailed Information". SAS
® 9.4 Output Delivery System: User's
Guide, Fifth Edition. Cary, NC: SAS Institute Inc. Available at http://support.sas.com/documentation/cdl/en/odsug/69832/HTML/default/viewer.htm#p0xi2cygmfk0wkn1ei625zq5r488.htm. SAS Institute Inc. 2016i. "The Automatic Variable _BREAK_". Base SAS® 9.4 Procedures Guide, Sixth Edition. Cary, NC: SAS Institute Inc. Available at http://support.sas.com/documentation/cdl/en/proc/69850/HTML/default/viewer.htm#n0jann0dticnpbn1woe95yuphoaz.htm.
ACKNOWLEDGEMENTS
The author would like to thank Chris Barrett of SAS Institute for his valuable contributions to this paper.
26
CONTACT INFORMATION
Your comments and questions are valued and encouraged. Contact the author at:
Vincent DelGobbo SAS Institute Inc. 100 SAS Campus Drive Cary, NC 27513 [email protected] http://www.sas.com/reg/gen/corp/867226?page=Resources
If your registered in-house or local SAS users group would like to request this presentation as your annual SAS presentation (as a seminar, talk, or workshop) at an upcoming meeting, please submit an online User Group Request Form (from support.sas.com/sasusersupport/usergroups/support) at least eight weeks in advance.
SAS and all other SAS Institute Inc. product or service names are registered trademarks or trademarks of SAS Institute Inc. in the USA and other countries. ® indicates USA registration.
Other brand and product names are trademarks of their respective companies.