Embed Size (px)
Citation preview

New findings from OCT PCI-guidance and evaluation of vulnerable plaque
Osaka Saiseikai Nakatsu Hospital
Junya Shite
Long Pullback Survey-mode (S-mode) By S-mode able to scan coronary of 75mm length with one pull back(almost 12~ 23 of one vessel)
bull Useful for pre-PCI lesion assessment to select the stent landing zone
bull Useful for three vessel scanning for unstable plaque detection
Improvement of OCT machine in ILUMIEN OPTIS (C8) New 2 modes for pull back
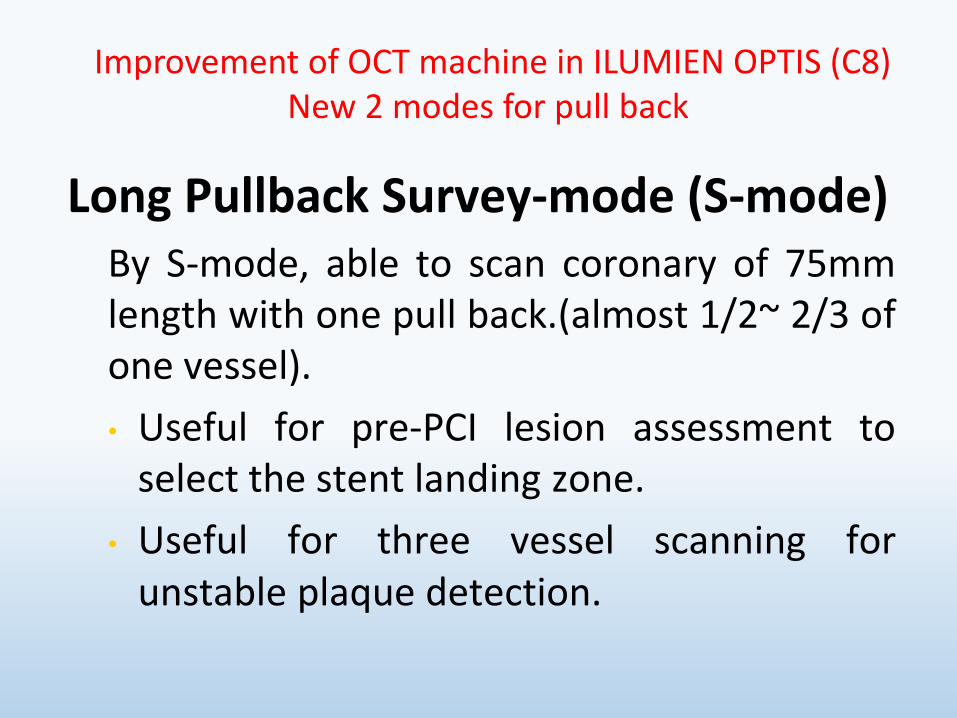
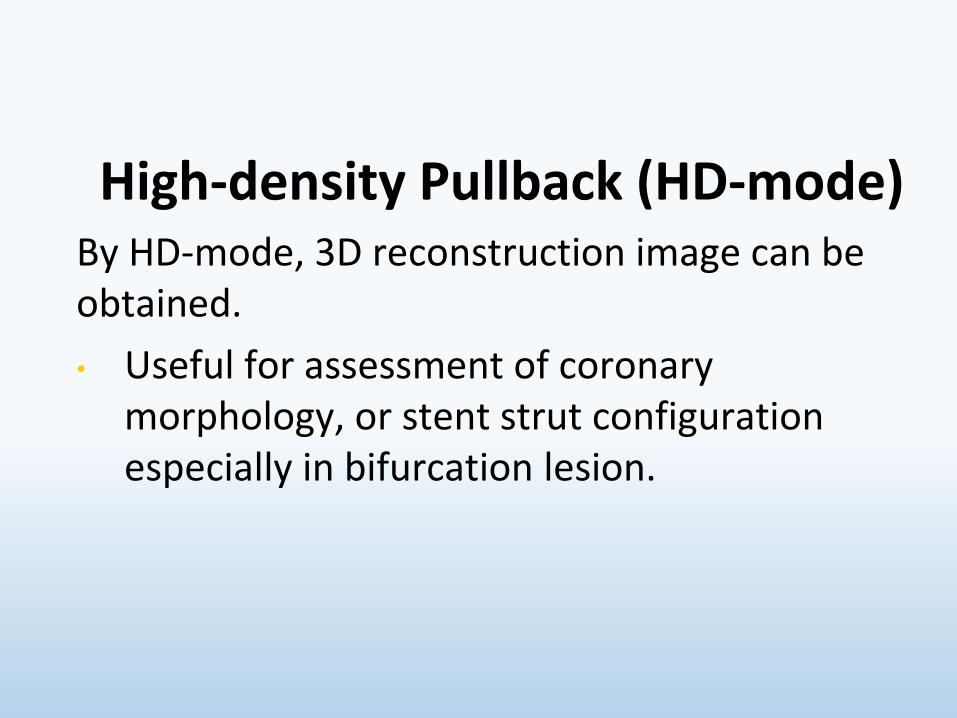
High-density Pullback (HD-mode) By HD-mode 3D reconstruction image can be obtained
bull Useful for assessment of coronary morphology or stent strut configuration especially in bifurcation lesion
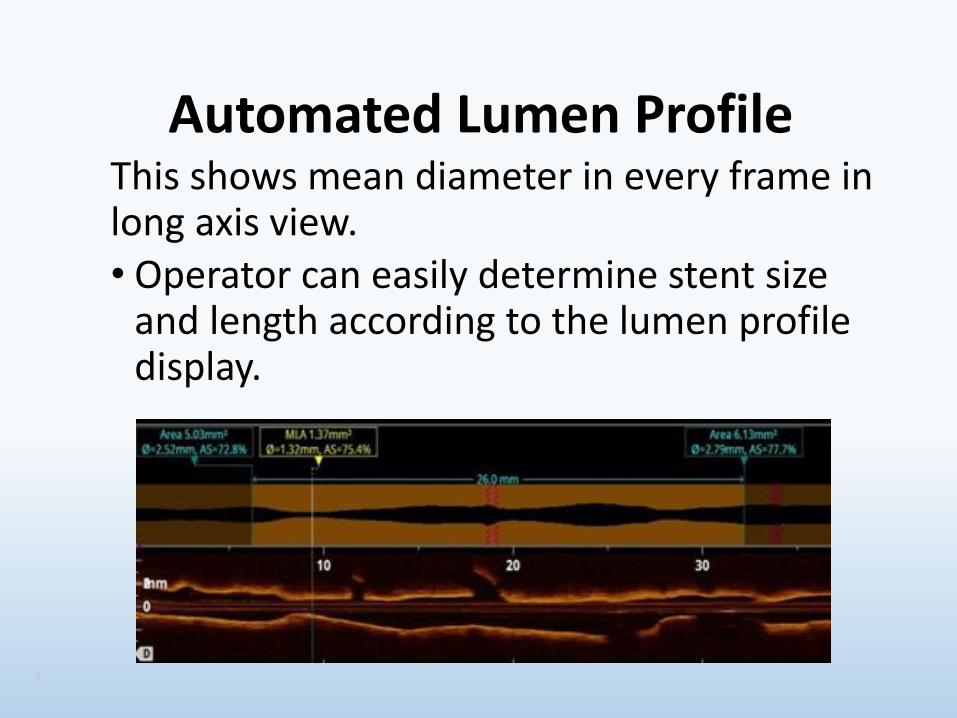
Automated Lumen Profile This shows mean diameter in every frame in long axis view bull Operator can easily determine stent size
and length according to the lumen profile display
4
OCT-guided PCI
783
Number of catheterization in our hospital 20121001~20130930
NO
CAG 1074
PCI 451
OCT 353
IVUS 77
others 21
To get clear OCT image
Power injecter is useful
Flow rate
RCA 25~40mlsec
LCA 30~40mlsec
Volume limit
Flow rate x 4 sec (10~16ml)
To minimize contrast volume in OCT procedure
bullDo simultaneous procedure of angiography and OCT image aquisition
bullStop contrast injection if the OCT lens just cross the lesion of interest
bullTo evaluate stent expansion OCT scanning without flushing is useful
OCT is Useful for PCI guide especially in 1 Bifurcation stenting 2 Rotablation for calcified lesion 3 Guide for ACS PCI
OCT is Useful for PCI guide especially in 1 Bifurcation stenting 2 Rotablation for calcified lesion 3 Guide for ACS PCI
OCT 3D reconstruction is useful to guide PCI in bifurcation lesion
How should we treat for bifurcation lesion
For bifurcation most of the lesions should be finished with single stenting with KBT Otherwise culotte or T-stenting In these lesions stent full expansion well apposition with side branch orifice opening is important
Side branch Side branch
If the GW cross the side branch proximally jailed struts remain at carina
If the GW cross distally jailed struts shift to opposite site of side branch
GW should cross the side branch distally close to the carina
The case of single stenting with KBT
A case of single stenting with KBT OCT 3D reconstruction guide
Pre PCI Stent implantation and
GW re-cross to Dx
3-D OCT shows GW crossing proximal part of the link
Link
Wire
After bigger size POBA GW can cross distal part of the link
Link Wire
Prox
Dis
KBT Final
3-D OCT images after KBT showing wide open D2
LAD
D2
LAD
D2
LAD
D2
3-D reconstruction OCT image is useful to make sure the GW recrossing point after stenting resulting in optimal kissing balloon technique
This procedure should be applied to stenting to bifurcation involving major side branch
OCT is Useful for PCI guide especially in 1 Bifurcation stenting 2 Rotablation for calcified lesion 3 Guide for ACS PCI
OCT can show the thickness of calcium
After Rota After Stenting After POBA
If the ablation area is not enough even the crack is made
stent will not well expand and sometimes becomes irregular
shape
Post rota 20mm Post rota 225mm
084mm
If the ablation area is not enough and all circular thick
calcium remains stent should not be implanted Further bigger size rotablation recommended
Before Rota After Rota
If the ablation area is wide enough stent will
well expand
After Stenting
OCT can show the thickness of calcium and is useful for rotablation guide
OCT is Useful for PCI guide especially in 1 Bifurcation stenting 2 Rotablation for calcified lesion 3 Guide for ACS PCI
At ER
62 yo Male Syncope during car driving
Blood Examination WBC 16500
GOT 87 UL LDH 442 UL CPK 493 UL
Pre-PCI
OCT scanning to LCX
LCX
OCT scanning to LAD
LAD
In this case LAD lesion must be a culprit lesion of ACS
OCT is useful to determine the culprit lesion of ACS
In autopsy studies at least 25 of thrombotic coronary occlusions are caused by plaque erosion without disruption of the fibrous cap This lesion may not require stent implantation
OCT-based diagnosis and management of STEMI associated with intact fibrous cap Prati F Uemura S Souteyrand G Virmani R Motreff P Di Vito L Biondi-Zoccai G Halperin J Fuster V Ozaki Y Narula J
JACC Cardiovasc Imaging 2013 Mar6(3)283-7
doi 101016jjcmg201212007
Abstract
After aspiration thrombectomy OCT identified plaque erosion as the cause in 31 STEMI 40 patients with subcritically occlusive plaque were treated with dual antiplatelet therapy without percutaneous revascularization (group 1) and the remaining 60 of patients underwent angioplasty and stenting (group 2) At a median follow-up of 753 days all patients were asymptomatic regardless of stent implantation
These observations support an alternative treatment strategy for patients with acute coronary events OCT-verified intact fibrous cap (or plaque erosion) where non-obstructive lesions might be managed without stenting
Challenge to estimate the coronary plaque tissue characterization 1 Prediction of the stenosis progression and future ACS events 2 Evaluation of the treatment effect for vulnerable plaque
Challenge to estimate the coronary plaque tissue characterization 1 prediction of the stenosis progression and future ACS events 2 evaluation of the treatment effect for vulnerable plaque
Thin-cap fibroatheroma and microchannel findings in optical coherence tomography correlate with subsequent progression
of coronary atheromatous plaques Shiro Uemura Ken-ichi Ishigami Tsunenari Soeda Satoshi Okayama Ji Hee Sung Hitoshi Nakagawa Satoshi Somekawa Yukiji Takeda Hiroyuki Kawata Manabu Horii and Yoshihiko Saito European Heart Journal (2012) 33 78ndash85
Figure 1 (A) Eccentric plaque distribution (B) concave lumen shape (C) intimal laceration (D) ruptured plaque (E) microchannel (F) lipid pool (G) thin fibrous cap covering lipid pool (H) macrophage image (I ) calcium deposition (J ) thrombus formation
Table 4 Association of 10 OCT-based plaque characteristics and subsequent progression Univariate analysis OR (95 CI) P-value Eccentric 330 (073ndash144) 0230 Concave shape 383 (085ndash167) 0160 Intimal laceration 1020 (277ndash378) 0001 Rupture 490 (078ndash3123) 0325 Microchannel 2000 (478ndash826) 0001 Lipid pool 216 (057ndash806) 0222 TCFA 2000 (478ndash826) 0001 Macrophage 960 (260ndash356) 0001 Calcium 133 (041ndash430) 0890 Thrombus 1200 (218ndash6432) 0002
OCT-based complex characteristics of TCFA and microchannel were the potential predictors of subsequent progression of non-significant coronary plaques and or future ACS events
Distal Proximal
Distal Proximal
Challenge to estimate the coronary plaque tissue characterization 1 prediction of the stenosis progression and future ACS events 2 evaluation of the treatment effect for vulnerable plaque
Statin+EPA may be effective for stabilizing vulnerable plaque
Impact of EPA and statin
therapy on coronary thin-cap
fibroatheroma Assessment by
optical coherence tomography
Kobe University Graduate school of medicine
Ryo Nishio Junya Shite Toshiro Shinke Hiromasa Otake
Masayuki Nakagawa Ryoji Nagoshi Amane Kozuki
Takumi Inoue Hirotoshi Hariki Tsuyoshi Osue Yu Taniguchi
Masamichi Iwasaki Noritoshi Hiranuma
Akihide Konishi Hiroto Kinutani Ken-ichi Hirata
Methods
Patients with untreated dyslipidemia (LDL gt 100 mgdl)
who had non-culprit TCFA lesion detected by OCT
Statin group
Rosuvastatin
EPA+Statin group
EPA1800 mgday
Rosuvastatin
Blood analysis and OCT examination were performed
Before and 9 months after treatment
Random assignment
Baseline Profile
EPA+Statin group (n=13)
Statin group (n=12)
P value
EPAAA 033plusmn016 030plusmn015 062
T-Cho (mgdl) 2113plusmn402 2034plusmn417 064
HDL (mgdl) 417plusmn125 417plusmn75 099
LDL (mgdl) 1403plusmn367 1349plusmn374 072
hs-CRP (mgdl) 023plusmn019 026plusmn015 067
PTX3 (mgdl) 418plusmn207 525plusmn285 032
Lipid profile at 9 months after
EPA+Statin group (n=13)
Statin group (n=12)
P value
EPAAA 127plusmn062 049plusmn036 0006
T-Cho (mgdl) 1511plusmn344 1457plusmn229 065
HDL (mgdl) 467plusmn94 441plusmn99 051
LDL (mgdl) 852plusmn285 812plusmn210 069
hs-CRP (mgdl) 006plusmn005 010plusmn008 020
PTX3 (mgdl) 270plusmn127 447plusmn059 002
Fibrous-cap thickness
0
20
40
60
80
100
120
Baseline Follow-up
EPA+Statin
group (n=20)
Statin
group (n=21)
481plusmn750
1035plusmn307
476plusmn114
686plusmn111
P=00001
(microm)
90
120
150
180
210
Baseline Follow-up
EPA+Statin
group (n=20)
Statin group
(n=21)
1655plusmn652
1527plusmn513
1603plusmn663
1289plusmn478
P=014
(degree)
Lipid arc
Macrophages accumulation
650
100
714
429
0
20
40
60
80
100
Baseline Follow-up
P=003
EPA+Statin
group (n=20)
Statin group
(n=21)
RCA (Rosuvastatin 25mg+EPA1800mg)
Before 9 month treatment
RCA (Rosuvastatin 25mg+EPA1800mg)
Before After treatment
OCT may show the treatment effect in vulnerable plaque increase in fibrous cap thickness disappearance of macrophage accumulation decrease in lipid contents
Useful for PCI guide especially in 1 Bifurcation stenting 2 Rotablation for calcified lesion 3 Guide for ACS PCI Useful for coronary plaque tissue characterization risk assessment for future ACS events and evaluation of treatment effect
Role of OCT
Thank you for your attention
GW to LCx
Proximal
Distal
Single stenting (Nobori) to LMT-LAD First rewiring to LCX
First rewiring
Second rewiring
Post KBT
Comparison between
ILUMIEN(C7) and ILUMIEN OPTIS(C8)
66
Parameter
ILUMIEN ILUMIEN OPTIS
Long Pullback
S mode
High-density Pullback
HD mode
Frame rate 100 framessec 180 framessec 180 framessec
Pull back speed 20 mmsec 36 mmsec 18 mmsec
Frame interval 5 framesmm 5 framesmm 10 framesmm
Pull back length 54 mm 75 mm 54 mm
Pull back time 27 sec 21 sec 30 sec
Long Pullback Survey-mode (S-mode) By S-mode able to scan coronary of 75mm length with one pull back(almost 12~ 23 of one vessel)
bull Useful for pre-PCI lesion assessment to select the stent landing zone
bull Useful for three vessel scanning for unstable plaque detection
Improvement of OCT machine in ILUMIEN OPTIS (C8) New 2 modes for pull back
High-density Pullback (HD-mode) By HD-mode 3D reconstruction image can be obtained
bull Useful for assessment of coronary morphology or stent strut configuration especially in bifurcation lesion
Automated Lumen Profile This shows mean diameter in every frame in long axis view bull Operator can easily determine stent size
and length according to the lumen profile display
4
OCT-guided PCI
783
Number of catheterization in our hospital 20121001~20130930
NO
CAG 1074
PCI 451
OCT 353
IVUS 77
others 21
To get clear OCT image
Power injecter is useful
Flow rate
RCA 25~40mlsec
LCA 30~40mlsec
Volume limit
Flow rate x 4 sec (10~16ml)
To minimize contrast volume in OCT procedure
bullDo simultaneous procedure of angiography and OCT image aquisition
bullStop contrast injection if the OCT lens just cross the lesion of interest
bullTo evaluate stent expansion OCT scanning without flushing is useful
OCT is Useful for PCI guide especially in 1 Bifurcation stenting 2 Rotablation for calcified lesion 3 Guide for ACS PCI
OCT is Useful for PCI guide especially in 1 Bifurcation stenting 2 Rotablation for calcified lesion 3 Guide for ACS PCI
OCT 3D reconstruction is useful to guide PCI in bifurcation lesion
How should we treat for bifurcation lesion
For bifurcation most of the lesions should be finished with single stenting with KBT Otherwise culotte or T-stenting In these lesions stent full expansion well apposition with side branch orifice opening is important
Side branch Side branch
If the GW cross the side branch proximally jailed struts remain at carina
If the GW cross distally jailed struts shift to opposite site of side branch
GW should cross the side branch distally close to the carina
The case of single stenting with KBT
A case of single stenting with KBT OCT 3D reconstruction guide
Pre PCI Stent implantation and
GW re-cross to Dx
3-D OCT shows GW crossing proximal part of the link
Link
Wire
After bigger size POBA GW can cross distal part of the link
Link Wire
Prox
Dis
KBT Final
3-D OCT images after KBT showing wide open D2
LAD
D2
LAD
D2
LAD
D2
3-D reconstruction OCT image is useful to make sure the GW recrossing point after stenting resulting in optimal kissing balloon technique
This procedure should be applied to stenting to bifurcation involving major side branch
OCT is Useful for PCI guide especially in 1 Bifurcation stenting 2 Rotablation for calcified lesion 3 Guide for ACS PCI
OCT can show the thickness of calcium
After Rota After Stenting After POBA
If the ablation area is not enough even the crack is made
stent will not well expand and sometimes becomes irregular
shape
Post rota 20mm Post rota 225mm
084mm
If the ablation area is not enough and all circular thick
calcium remains stent should not be implanted Further bigger size rotablation recommended
Before Rota After Rota
If the ablation area is wide enough stent will
well expand
After Stenting
OCT can show the thickness of calcium and is useful for rotablation guide
OCT is Useful for PCI guide especially in 1 Bifurcation stenting 2 Rotablation for calcified lesion 3 Guide for ACS PCI
At ER
62 yo Male Syncope during car driving
Blood Examination WBC 16500
GOT 87 UL LDH 442 UL CPK 493 UL
Pre-PCI
OCT scanning to LCX
LCX
OCT scanning to LAD
LAD
In this case LAD lesion must be a culprit lesion of ACS
OCT is useful to determine the culprit lesion of ACS
In autopsy studies at least 25 of thrombotic coronary occlusions are caused by plaque erosion without disruption of the fibrous cap This lesion may not require stent implantation
OCT-based diagnosis and management of STEMI associated with intact fibrous cap Prati F Uemura S Souteyrand G Virmani R Motreff P Di Vito L Biondi-Zoccai G Halperin J Fuster V Ozaki Y Narula J
JACC Cardiovasc Imaging 2013 Mar6(3)283-7
doi 101016jjcmg201212007
Abstract
After aspiration thrombectomy OCT identified plaque erosion as the cause in 31 STEMI 40 patients with subcritically occlusive plaque were treated with dual antiplatelet therapy without percutaneous revascularization (group 1) and the remaining 60 of patients underwent angioplasty and stenting (group 2) At a median follow-up of 753 days all patients were asymptomatic regardless of stent implantation
These observations support an alternative treatment strategy for patients with acute coronary events OCT-verified intact fibrous cap (or plaque erosion) where non-obstructive lesions might be managed without stenting
Challenge to estimate the coronary plaque tissue characterization 1 Prediction of the stenosis progression and future ACS events 2 Evaluation of the treatment effect for vulnerable plaque
Challenge to estimate the coronary plaque tissue characterization 1 prediction of the stenosis progression and future ACS events 2 evaluation of the treatment effect for vulnerable plaque
Thin-cap fibroatheroma and microchannel findings in optical coherence tomography correlate with subsequent progression
of coronary atheromatous plaques Shiro Uemura Ken-ichi Ishigami Tsunenari Soeda Satoshi Okayama Ji Hee Sung Hitoshi Nakagawa Satoshi Somekawa Yukiji Takeda Hiroyuki Kawata Manabu Horii and Yoshihiko Saito European Heart Journal (2012) 33 78ndash85
Figure 1 (A) Eccentric plaque distribution (B) concave lumen shape (C) intimal laceration (D) ruptured plaque (E) microchannel (F) lipid pool (G) thin fibrous cap covering lipid pool (H) macrophage image (I ) calcium deposition (J ) thrombus formation
Table 4 Association of 10 OCT-based plaque characteristics and subsequent progression Univariate analysis OR (95 CI) P-value Eccentric 330 (073ndash144) 0230 Concave shape 383 (085ndash167) 0160 Intimal laceration 1020 (277ndash378) 0001 Rupture 490 (078ndash3123) 0325 Microchannel 2000 (478ndash826) 0001 Lipid pool 216 (057ndash806) 0222 TCFA 2000 (478ndash826) 0001 Macrophage 960 (260ndash356) 0001 Calcium 133 (041ndash430) 0890 Thrombus 1200 (218ndash6432) 0002
OCT-based complex characteristics of TCFA and microchannel were the potential predictors of subsequent progression of non-significant coronary plaques and or future ACS events
Distal Proximal
Distal Proximal
Challenge to estimate the coronary plaque tissue characterization 1 prediction of the stenosis progression and future ACS events 2 evaluation of the treatment effect for vulnerable plaque
Statin+EPA may be effective for stabilizing vulnerable plaque
Impact of EPA and statin
therapy on coronary thin-cap
fibroatheroma Assessment by
optical coherence tomography
Kobe University Graduate school of medicine
Ryo Nishio Junya Shite Toshiro Shinke Hiromasa Otake
Masayuki Nakagawa Ryoji Nagoshi Amane Kozuki
Takumi Inoue Hirotoshi Hariki Tsuyoshi Osue Yu Taniguchi
Masamichi Iwasaki Noritoshi Hiranuma
Akihide Konishi Hiroto Kinutani Ken-ichi Hirata
Methods
Patients with untreated dyslipidemia (LDL gt 100 mgdl)
who had non-culprit TCFA lesion detected by OCT
Statin group
Rosuvastatin
EPA+Statin group
EPA1800 mgday
Rosuvastatin
Blood analysis and OCT examination were performed
Before and 9 months after treatment
Random assignment
Baseline Profile
EPA+Statin group (n=13)
Statin group (n=12)
P value
EPAAA 033plusmn016 030plusmn015 062
T-Cho (mgdl) 2113plusmn402 2034plusmn417 064
HDL (mgdl) 417plusmn125 417plusmn75 099
LDL (mgdl) 1403plusmn367 1349plusmn374 072
hs-CRP (mgdl) 023plusmn019 026plusmn015 067
PTX3 (mgdl) 418plusmn207 525plusmn285 032
Lipid profile at 9 months after
EPA+Statin group (n=13)
Statin group (n=12)
P value
EPAAA 127plusmn062 049plusmn036 0006
T-Cho (mgdl) 1511plusmn344 1457plusmn229 065
HDL (mgdl) 467plusmn94 441plusmn99 051
LDL (mgdl) 852plusmn285 812plusmn210 069
hs-CRP (mgdl) 006plusmn005 010plusmn008 020
PTX3 (mgdl) 270plusmn127 447plusmn059 002
Fibrous-cap thickness
0
20
40
60
80
100
120
Baseline Follow-up
EPA+Statin
group (n=20)
Statin
group (n=21)
481plusmn750
1035plusmn307
476plusmn114
686plusmn111
P=00001
(microm)
90
120
150
180
210
Baseline Follow-up
EPA+Statin
group (n=20)
Statin group
(n=21)
1655plusmn652
1527plusmn513
1603plusmn663
1289plusmn478
P=014
(degree)
Lipid arc
Macrophages accumulation
650
100
714
429
0
20
40
60
80
100
Baseline Follow-up
P=003
EPA+Statin
group (n=20)
Statin group
(n=21)
RCA (Rosuvastatin 25mg+EPA1800mg)
Before 9 month treatment
RCA (Rosuvastatin 25mg+EPA1800mg)
Before After treatment
OCT may show the treatment effect in vulnerable plaque increase in fibrous cap thickness disappearance of macrophage accumulation decrease in lipid contents
Useful for PCI guide especially in 1 Bifurcation stenting 2 Rotablation for calcified lesion 3 Guide for ACS PCI Useful for coronary plaque tissue characterization risk assessment for future ACS events and evaluation of treatment effect
Role of OCT
Thank you for your attention
GW to LCx
Proximal
Distal
Single stenting (Nobori) to LMT-LAD First rewiring to LCX
First rewiring
Second rewiring
Post KBT
Comparison between
ILUMIEN(C7) and ILUMIEN OPTIS(C8)
66
Parameter
ILUMIEN ILUMIEN OPTIS
Long Pullback
S mode
High-density Pullback
HD mode
Frame rate 100 framessec 180 framessec 180 framessec
Pull back speed 20 mmsec 36 mmsec 18 mmsec
Frame interval 5 framesmm 5 framesmm 10 framesmm
Pull back length 54 mm 75 mm 54 mm
Pull back time 27 sec 21 sec 30 sec

OCT is Useful for PCI guide especially in 1 Bifurcation stenting 2 Rotablation for calcified lesion 3 Guide for ACS PCI
OCT is Useful for PCI guide especially in 1 Bifurcation stenting 2 Rotablation for calcified lesion 3 Guide for ACS PCI
OCT 3D reconstruction is useful to guide PCI in bifurcation lesion
How should we treat for bifurcation lesion
For bifurcation most of the lesions should be finished with single stenting with KBT Otherwise culotte or T-stenting In these lesions stent full expansion well apposition with side branch orifice opening is important
Side branch Side branch
If the GW cross the side branch proximally jailed struts remain at carina
If the GW cross distally jailed struts shift to opposite site of side branch
GW should cross the side branch distally close to the carina
The case of single stenting with KBT
A case of single stenting with KBT OCT 3D reconstruction guide
Pre PCI Stent implantation and
GW re-cross to Dx
3-D OCT shows GW crossing proximal part of the link
Link
Wire
After bigger size POBA GW can cross distal part of the link
Link Wire
Prox
Dis
KBT Final
3-D OCT images after KBT showing wide open D2
LAD
D2
LAD
D2
LAD
D2
3-D reconstruction OCT image is useful to make sure the GW recrossing point after stenting resulting in optimal kissing balloon technique
This procedure should be applied to stenting to bifurcation involving major side branch
OCT is Useful for PCI guide especially in 1 Bifurcation stenting 2 Rotablation for calcified lesion 3 Guide for ACS PCI
OCT can show the thickness of calcium
After Rota After Stenting After POBA
If the ablation area is not enough even the crack is made
stent will not well expand and sometimes becomes irregular
shape
Post rota 20mm Post rota 225mm
084mm
If the ablation area is not enough and all circular thick
calcium remains stent should not be implanted Further bigger size rotablation recommended
Before Rota After Rota
If the ablation area is wide enough stent will
well expand
After Stenting
OCT can show the thickness of calcium and is useful for rotablation guide
OCT is Useful for PCI guide especially in 1 Bifurcation stenting 2 Rotablation for calcified lesion 3 Guide for ACS PCI
At ER
62 yo Male Syncope during car driving
Blood Examination WBC 16500
GOT 87 UL LDH 442 UL CPK 493 UL
Pre-PCI
OCT scanning to LCX
LCX
OCT scanning to LAD
LAD
In this case LAD lesion must be a culprit lesion of ACS
OCT is useful to determine the culprit lesion of ACS
In autopsy studies at least 25 of thrombotic coronary occlusions are caused by plaque erosion without disruption of the fibrous cap This lesion may not require stent implantation
OCT-based diagnosis and management of STEMI associated with intact fibrous cap Prati F Uemura S Souteyrand G Virmani R Motreff P Di Vito L Biondi-Zoccai G Halperin J Fuster V Ozaki Y Narula J
JACC Cardiovasc Imaging 2013 Mar6(3)283-7
doi 101016jjcmg201212007
Abstract
After aspiration thrombectomy OCT identified plaque erosion as the cause in 31 STEMI 40 patients with subcritically occlusive plaque were treated with dual antiplatelet therapy without percutaneous revascularization (group 1) and the remaining 60 of patients underwent angioplasty and stenting (group 2) At a median follow-up of 753 days all patients were asymptomatic regardless of stent implantation
These observations support an alternative treatment strategy for patients with acute coronary events OCT-verified intact fibrous cap (or plaque erosion) where non-obstructive lesions might be managed without stenting
Challenge to estimate the coronary plaque tissue characterization 1 Prediction of the stenosis progression and future ACS events 2 Evaluation of the treatment effect for vulnerable plaque
Challenge to estimate the coronary plaque tissue characterization 1 prediction of the stenosis progression and future ACS events 2 evaluation of the treatment effect for vulnerable plaque
Thin-cap fibroatheroma and microchannel findings in optical coherence tomography correlate with subsequent progression
of coronary atheromatous plaques Shiro Uemura Ken-ichi Ishigami Tsunenari Soeda Satoshi Okayama Ji Hee Sung Hitoshi Nakagawa Satoshi Somekawa Yukiji Takeda Hiroyuki Kawata Manabu Horii and Yoshihiko Saito European Heart Journal (2012) 33 78ndash85
Figure 1 (A) Eccentric plaque distribution (B) concave lumen shape (C) intimal laceration (D) ruptured plaque (E) microchannel (F) lipid pool (G) thin fibrous cap covering lipid pool (H) macrophage image (I ) calcium deposition (J ) thrombus formation
Table 4 Association of 10 OCT-based plaque characteristics and subsequent progression Univariate analysis OR (95 CI) P-value Eccentric 330 (073ndash144) 0230 Concave shape 383 (085ndash167) 0160 Intimal laceration 1020 (277ndash378) 0001 Rupture 490 (078ndash3123) 0325 Microchannel 2000 (478ndash826) 0001 Lipid pool 216 (057ndash806) 0222 TCFA 2000 (478ndash826) 0001 Macrophage 960 (260ndash356) 0001 Calcium 133 (041ndash430) 0890 Thrombus 1200 (218ndash6432) 0002
OCT-based complex characteristics of TCFA and microchannel were the potential predictors of subsequent progression of non-significant coronary plaques and or future ACS events
Distal Proximal
Distal Proximal
Challenge to estimate the coronary plaque tissue characterization 1 prediction of the stenosis progression and future ACS events 2 evaluation of the treatment effect for vulnerable plaque
Statin+EPA may be effective for stabilizing vulnerable plaque
Impact of EPA and statin
therapy on coronary thin-cap
fibroatheroma Assessment by
optical coherence tomography
Kobe University Graduate school of medicine
Ryo Nishio Junya Shite Toshiro Shinke Hiromasa Otake
Masayuki Nakagawa Ryoji Nagoshi Amane Kozuki
Takumi Inoue Hirotoshi Hariki Tsuyoshi Osue Yu Taniguchi
Masamichi Iwasaki Noritoshi Hiranuma
Akihide Konishi Hiroto Kinutani Ken-ichi Hirata
Methods
Patients with untreated dyslipidemia (LDL gt 100 mgdl)
who had non-culprit TCFA lesion detected by OCT
Statin group
Rosuvastatin
EPA+Statin group
EPA1800 mgday
Rosuvastatin
Blood analysis and OCT examination were performed
Before and 9 months after treatment
Random assignment
Baseline Profile
EPA+Statin group (n=13)
Statin group (n=12)
P value
EPAAA 033plusmn016 030plusmn015 062
T-Cho (mgdl) 2113plusmn402 2034plusmn417 064
HDL (mgdl) 417plusmn125 417plusmn75 099
LDL (mgdl) 1403plusmn367 1349plusmn374 072
hs-CRP (mgdl) 023plusmn019 026plusmn015 067
PTX3 (mgdl) 418plusmn207 525plusmn285 032
Lipid profile at 9 months after
EPA+Statin group (n=13)
Statin group (n=12)
P value
EPAAA 127plusmn062 049plusmn036 0006
T-Cho (mgdl) 1511plusmn344 1457plusmn229 065
HDL (mgdl) 467plusmn94 441plusmn99 051
LDL (mgdl) 852plusmn285 812plusmn210 069
hs-CRP (mgdl) 006plusmn005 010plusmn008 020
PTX3 (mgdl) 270plusmn127 447plusmn059 002
Fibrous-cap thickness
0
20
40
60
80
100
120
Baseline Follow-up
EPA+Statin
group (n=20)
Statin
group (n=21)
481plusmn750
1035plusmn307
476plusmn114
686plusmn111
P=00001
(microm)
90
120
150
180
210
Baseline Follow-up
EPA+Statin
group (n=20)
Statin group
(n=21)
1655plusmn652
1527plusmn513
1603plusmn663
1289plusmn478
P=014
(degree)
Lipid arc
Macrophages accumulation
650
100
714
429
0
20
40
60
80
100
Baseline Follow-up
P=003
EPA+Statin
group (n=20)
Statin group
(n=21)
RCA (Rosuvastatin 25mg+EPA1800mg)
Before 9 month treatment
RCA (Rosuvastatin 25mg+EPA1800mg)
Before After treatment
OCT may show the treatment effect in vulnerable plaque increase in fibrous cap thickness disappearance of macrophage accumulation decrease in lipid contents
Useful for PCI guide especially in 1 Bifurcation stenting 2 Rotablation for calcified lesion 3 Guide for ACS PCI Useful for coronary plaque tissue characterization risk assessment for future ACS events and evaluation of treatment effect
Role of OCT
Thank you for your attention
GW to LCx
Proximal
Distal
Single stenting (Nobori) to LMT-LAD First rewiring to LCX
First rewiring
Second rewiring
Post KBT
Comparison between
ILUMIEN(C7) and ILUMIEN OPTIS(C8)
66
Parameter
ILUMIEN ILUMIEN OPTIS
Long Pullback
S mode
High-density Pullback
HD mode
Frame rate 100 framessec 180 framessec 180 framessec
Pull back speed 20 mmsec 36 mmsec 18 mmsec
Frame interval 5 framesmm 5 framesmm 10 framesmm
Pull back length 54 mm 75 mm 54 mm
Pull back time 27 sec 21 sec 30 sec
OCT is Useful for PCI guide especially in 1 Bifurcation stenting 2 Rotablation for calcified lesion 3 Guide for ACS PCI
OCT 3D reconstruction is useful to guide PCI in bifurcation lesion
How should we treat for bifurcation lesion
For bifurcation most of the lesions should be finished with single stenting with KBT Otherwise culotte or T-stenting In these lesions stent full expansion well apposition with side branch orifice opening is important
Side branch Side branch
If the GW cross the side branch proximally jailed struts remain at carina
If the GW cross distally jailed struts shift to opposite site of side branch
GW should cross the side branch distally close to the carina
The case of single stenting with KBT
A case of single stenting with KBT OCT 3D reconstruction guide
Pre PCI Stent implantation and
GW re-cross to Dx
3-D OCT shows GW crossing proximal part of the link
Link
Wire
After bigger size POBA GW can cross distal part of the link
Link Wire
Prox
Dis
KBT Final
3-D OCT images after KBT showing wide open D2
LAD
D2
LAD
D2
LAD
D2
3-D reconstruction OCT image is useful to make sure the GW recrossing point after stenting resulting in optimal kissing balloon technique
This procedure should be applied to stenting to bifurcation involving major side branch
OCT is Useful for PCI guide especially in 1 Bifurcation stenting 2 Rotablation for calcified lesion 3 Guide for ACS PCI
OCT can show the thickness of calcium
After Rota After Stenting After POBA
If the ablation area is not enough even the crack is made
stent will not well expand and sometimes becomes irregular
shape
Post rota 20mm Post rota 225mm
084mm
If the ablation area is not enough and all circular thick
calcium remains stent should not be implanted Further bigger size rotablation recommended
Before Rota After Rota
If the ablation area is wide enough stent will
well expand
After Stenting
OCT can show the thickness of calcium and is useful for rotablation guide
OCT is Useful for PCI guide especially in 1 Bifurcation stenting 2 Rotablation for calcified lesion 3 Guide for ACS PCI
At ER
62 yo Male Syncope during car driving
Blood Examination WBC 16500
GOT 87 UL LDH 442 UL CPK 493 UL
Pre-PCI
OCT scanning to LCX
LCX
OCT scanning to LAD
LAD
In this case LAD lesion must be a culprit lesion of ACS
OCT is useful to determine the culprit lesion of ACS
In autopsy studies at least 25 of thrombotic coronary occlusions are caused by plaque erosion without disruption of the fibrous cap This lesion may not require stent implantation
OCT-based diagnosis and management of STEMI associated with intact fibrous cap Prati F Uemura S Souteyrand G Virmani R Motreff P Di Vito L Biondi-Zoccai G Halperin J Fuster V Ozaki Y Narula J
JACC Cardiovasc Imaging 2013 Mar6(3)283-7
doi 101016jjcmg201212007
Abstract
After aspiration thrombectomy OCT identified plaque erosion as the cause in 31 STEMI 40 patients with subcritically occlusive plaque were treated with dual antiplatelet therapy without percutaneous revascularization (group 1) and the remaining 60 of patients underwent angioplasty and stenting (group 2) At a median follow-up of 753 days all patients were asymptomatic regardless of stent implantation
These observations support an alternative treatment strategy for patients with acute coronary events OCT-verified intact fibrous cap (or plaque erosion) where non-obstructive lesions might be managed without stenting
Challenge to estimate the coronary plaque tissue characterization 1 Prediction of the stenosis progression and future ACS events 2 Evaluation of the treatment effect for vulnerable plaque
Challenge to estimate the coronary plaque tissue characterization 1 prediction of the stenosis progression and future ACS events 2 evaluation of the treatment effect for vulnerable plaque
Thin-cap fibroatheroma and microchannel findings in optical coherence tomography correlate with subsequent progression
of coronary atheromatous plaques Shiro Uemura Ken-ichi Ishigami Tsunenari Soeda Satoshi Okayama Ji Hee Sung Hitoshi Nakagawa Satoshi Somekawa Yukiji Takeda Hiroyuki Kawata Manabu Horii and Yoshihiko Saito European Heart Journal (2012) 33 78ndash85
Figure 1 (A) Eccentric plaque distribution (B) concave lumen shape (C) intimal laceration (D) ruptured plaque (E) microchannel (F) lipid pool (G) thin fibrous cap covering lipid pool (H) macrophage image (I ) calcium deposition (J ) thrombus formation
Table 4 Association of 10 OCT-based plaque characteristics and subsequent progression Univariate analysis OR (95 CI) P-value Eccentric 330 (073ndash144) 0230 Concave shape 383 (085ndash167) 0160 Intimal laceration 1020 (277ndash378) 0001 Rupture 490 (078ndash3123) 0325 Microchannel 2000 (478ndash826) 0001 Lipid pool 216 (057ndash806) 0222 TCFA 2000 (478ndash826) 0001 Macrophage 960 (260ndash356) 0001 Calcium 133 (041ndash430) 0890 Thrombus 1200 (218ndash6432) 0002
OCT-based complex characteristics of TCFA and microchannel were the potential predictors of subsequent progression of non-significant coronary plaques and or future ACS events
Distal Proximal
Distal Proximal
Challenge to estimate the coronary plaque tissue characterization 1 prediction of the stenosis progression and future ACS events 2 evaluation of the treatment effect for vulnerable plaque
Statin+EPA may be effective for stabilizing vulnerable plaque
Impact of EPA and statin
therapy on coronary thin-cap
fibroatheroma Assessment by
optical coherence tomography
Kobe University Graduate school of medicine
Ryo Nishio Junya Shite Toshiro Shinke Hiromasa Otake
Masayuki Nakagawa Ryoji Nagoshi Amane Kozuki
Takumi Inoue Hirotoshi Hariki Tsuyoshi Osue Yu Taniguchi
Masamichi Iwasaki Noritoshi Hiranuma
Akihide Konishi Hiroto Kinutani Ken-ichi Hirata
Methods
Patients with untreated dyslipidemia (LDL gt 100 mgdl)
who had non-culprit TCFA lesion detected by OCT
Statin group
Rosuvastatin
EPA+Statin group
EPA1800 mgday
Rosuvastatin
Blood analysis and OCT examination were performed
Before and 9 months after treatment
Random assignment
Baseline Profile
EPA+Statin group (n=13)
Statin group (n=12)
P value
EPAAA 033plusmn016 030plusmn015 062
T-Cho (mgdl) 2113plusmn402 2034plusmn417 064
HDL (mgdl) 417plusmn125 417plusmn75 099
LDL (mgdl) 1403plusmn367 1349plusmn374 072
hs-CRP (mgdl) 023plusmn019 026plusmn015 067
PTX3 (mgdl) 418plusmn207 525plusmn285 032
Lipid profile at 9 months after
EPA+Statin group (n=13)
Statin group (n=12)
P value
EPAAA 127plusmn062 049plusmn036 0006
T-Cho (mgdl) 1511plusmn344 1457plusmn229 065
HDL (mgdl) 467plusmn94 441plusmn99 051
LDL (mgdl) 852plusmn285 812plusmn210 069
hs-CRP (mgdl) 006plusmn005 010plusmn008 020
PTX3 (mgdl) 270plusmn127 447plusmn059 002
Fibrous-cap thickness
0
20
40
60
80
100
120
Baseline Follow-up
EPA+Statin
group (n=20)
Statin
group (n=21)
481plusmn750
1035plusmn307
476plusmn114
686plusmn111
P=00001
(microm)
90
120
150
180
210
Baseline Follow-up
EPA+Statin
group (n=20)
Statin group
(n=21)
1655plusmn652
1527plusmn513
1603plusmn663
1289plusmn478
P=014
(degree)
Lipid arc
Macrophages accumulation
650
100
714
429
0
20
40
60
80
100
Baseline Follow-up
P=003
EPA+Statin
group (n=20)
Statin group
(n=21)
RCA (Rosuvastatin 25mg+EPA1800mg)
Before 9 month treatment
RCA (Rosuvastatin 25mg+EPA1800mg)
Before After treatment
OCT may show the treatment effect in vulnerable plaque increase in fibrous cap thickness disappearance of macrophage accumulation decrease in lipid contents
Useful for PCI guide especially in 1 Bifurcation stenting 2 Rotablation for calcified lesion 3 Guide for ACS PCI Useful for coronary plaque tissue characterization risk assessment for future ACS events and evaluation of treatment effect
Role of OCT
Thank you for your attention
GW to LCx
Proximal
Distal
Single stenting (Nobori) to LMT-LAD First rewiring to LCX
First rewiring
Second rewiring
Post KBT
Comparison between
ILUMIEN(C7) and ILUMIEN OPTIS(C8)
66
Parameter
ILUMIEN ILUMIEN OPTIS
Long Pullback
S mode
High-density Pullback
HD mode
Frame rate 100 framessec 180 framessec 180 framessec
Pull back speed 20 mmsec 36 mmsec 18 mmsec
Frame interval 5 framesmm 5 framesmm 10 framesmm
Pull back length 54 mm 75 mm 54 mm
Pull back time 27 sec 21 sec 30 sec
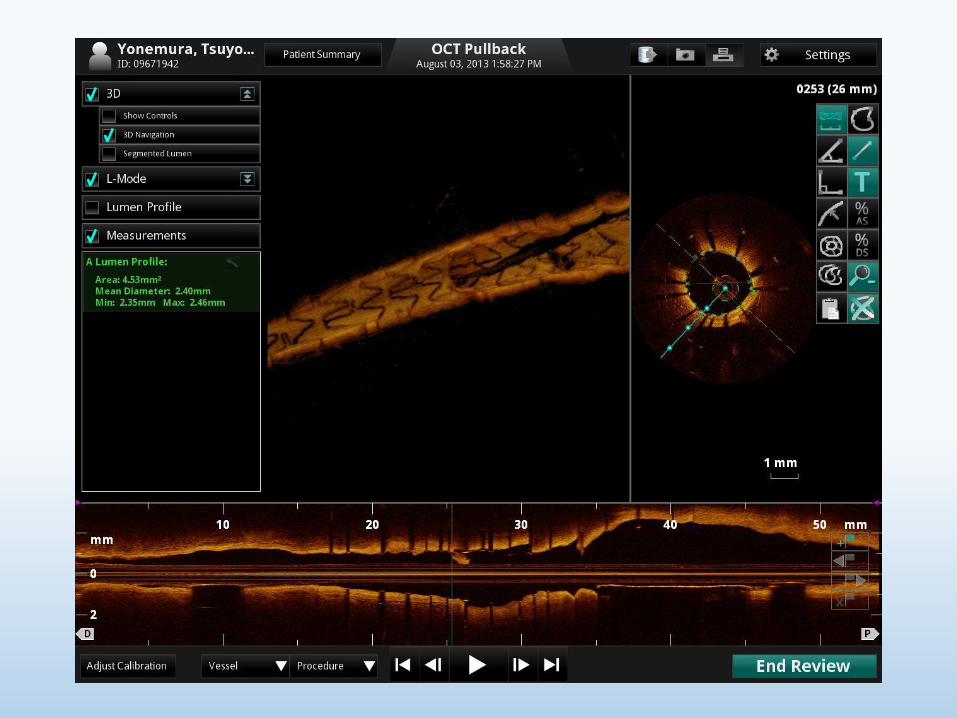

OCT is Useful for PCI guide especially in 1 Bifurcation stenting 2 Rotablation for calcified lesion 3 Guide for ACS PCI
OCT can show the thickness of calcium
After Rota After Stenting After POBA
If the ablation area is not enough even the crack is made
stent will not well expand and sometimes becomes irregular
shape
Post rota 20mm Post rota 225mm
084mm
If the ablation area is not enough and all circular thick
calcium remains stent should not be implanted Further bigger size rotablation recommended
Before Rota After Rota
If the ablation area is wide enough stent will
well expand
After Stenting
OCT can show the thickness of calcium and is useful for rotablation guide
OCT is Useful for PCI guide especially in 1 Bifurcation stenting 2 Rotablation for calcified lesion 3 Guide for ACS PCI
At ER
62 yo Male Syncope during car driving
Blood Examination WBC 16500
GOT 87 UL LDH 442 UL CPK 493 UL
Pre-PCI
OCT scanning to LCX
LCX
OCT scanning to LAD
LAD
In this case LAD lesion must be a culprit lesion of ACS
OCT is useful to determine the culprit lesion of ACS
In autopsy studies at least 25 of thrombotic coronary occlusions are caused by plaque erosion without disruption of the fibrous cap This lesion may not require stent implantation
OCT-based diagnosis and management of STEMI associated with intact fibrous cap Prati F Uemura S Souteyrand G Virmani R Motreff P Di Vito L Biondi-Zoccai G Halperin J Fuster V Ozaki Y Narula J
JACC Cardiovasc Imaging 2013 Mar6(3)283-7
doi 101016jjcmg201212007
Abstract
After aspiration thrombectomy OCT identified plaque erosion as the cause in 31 STEMI 40 patients with subcritically occlusive plaque were treated with dual antiplatelet therapy without percutaneous revascularization (group 1) and the remaining 60 of patients underwent angioplasty and stenting (group 2) At a median follow-up of 753 days all patients were asymptomatic regardless of stent implantation
These observations support an alternative treatment strategy for patients with acute coronary events OCT-verified intact fibrous cap (or plaque erosion) where non-obstructive lesions might be managed without stenting
Challenge to estimate the coronary plaque tissue characterization 1 Prediction of the stenosis progression and future ACS events 2 Evaluation of the treatment effect for vulnerable plaque
Challenge to estimate the coronary plaque tissue characterization 1 prediction of the stenosis progression and future ACS events 2 evaluation of the treatment effect for vulnerable plaque
Thin-cap fibroatheroma and microchannel findings in optical coherence tomography correlate with subsequent progression
of coronary atheromatous plaques Shiro Uemura Ken-ichi Ishigami Tsunenari Soeda Satoshi Okayama Ji Hee Sung Hitoshi Nakagawa Satoshi Somekawa Yukiji Takeda Hiroyuki Kawata Manabu Horii and Yoshihiko Saito European Heart Journal (2012) 33 78ndash85
Figure 1 (A) Eccentric plaque distribution (B) concave lumen shape (C) intimal laceration (D) ruptured plaque (E) microchannel (F) lipid pool (G) thin fibrous cap covering lipid pool (H) macrophage image (I ) calcium deposition (J ) thrombus formation
Table 4 Association of 10 OCT-based plaque characteristics and subsequent progression Univariate analysis OR (95 CI) P-value Eccentric 330 (073ndash144) 0230 Concave shape 383 (085ndash167) 0160 Intimal laceration 1020 (277ndash378) 0001 Rupture 490 (078ndash3123) 0325 Microchannel 2000 (478ndash826) 0001 Lipid pool 216 (057ndash806) 0222 TCFA 2000 (478ndash826) 0001 Macrophage 960 (260ndash356) 0001 Calcium 133 (041ndash430) 0890 Thrombus 1200 (218ndash6432) 0002
OCT-based complex characteristics of TCFA and microchannel were the potential predictors of subsequent progression of non-significant coronary plaques and or future ACS events
Distal Proximal
Distal Proximal
Challenge to estimate the coronary plaque tissue characterization 1 prediction of the stenosis progression and future ACS events 2 evaluation of the treatment effect for vulnerable plaque
Statin+EPA may be effective for stabilizing vulnerable plaque
Impact of EPA and statin
therapy on coronary thin-cap
fibroatheroma Assessment by
optical coherence tomography
Kobe University Graduate school of medicine
Ryo Nishio Junya Shite Toshiro Shinke Hiromasa Otake
Masayuki Nakagawa Ryoji Nagoshi Amane Kozuki
Takumi Inoue Hirotoshi Hariki Tsuyoshi Osue Yu Taniguchi
Masamichi Iwasaki Noritoshi Hiranuma
Akihide Konishi Hiroto Kinutani Ken-ichi Hirata
Methods
Patients with untreated dyslipidemia (LDL gt 100 mgdl)
who had non-culprit TCFA lesion detected by OCT
Statin group
Rosuvastatin
EPA+Statin group
EPA1800 mgday
Rosuvastatin
Blood analysis and OCT examination were performed
Before and 9 months after treatment
Random assignment
Baseline Profile
EPA+Statin group (n=13)
Statin group (n=12)
P value
EPAAA 033plusmn016 030plusmn015 062
T-Cho (mgdl) 2113plusmn402 2034plusmn417 064
HDL (mgdl) 417plusmn125 417plusmn75 099
LDL (mgdl) 1403plusmn367 1349plusmn374 072
hs-CRP (mgdl) 023plusmn019 026plusmn015 067
PTX3 (mgdl) 418plusmn207 525plusmn285 032
Lipid profile at 9 months after
EPA+Statin group (n=13)
Statin group (n=12)
P value
EPAAA 127plusmn062 049plusmn036 0006
T-Cho (mgdl) 1511plusmn344 1457plusmn229 065
HDL (mgdl) 467plusmn94 441plusmn99 051
LDL (mgdl) 852plusmn285 812plusmn210 069
hs-CRP (mgdl) 006plusmn005 010plusmn008 020
PTX3 (mgdl) 270plusmn127 447plusmn059 002
Fibrous-cap thickness
0
20
40
60
80
100
120
Baseline Follow-up
EPA+Statin
group (n=20)
Statin
group (n=21)
481plusmn750
1035plusmn307
476plusmn114
686plusmn111
P=00001
(microm)
90
120
150
180
210
Baseline Follow-up
EPA+Statin
group (n=20)
Statin group
(n=21)
1655plusmn652
1527plusmn513
1603plusmn663
1289plusmn478
P=014
(degree)
Lipid arc
Macrophages accumulation
650
100
714
429
0
20
40
60
80
100
Baseline Follow-up
P=003
EPA+Statin
group (n=20)
Statin group
(n=21)
RCA (Rosuvastatin 25mg+EPA1800mg)
Before 9 month treatment
RCA (Rosuvastatin 25mg+EPA1800mg)
Before After treatment
OCT may show the treatment effect in vulnerable plaque increase in fibrous cap thickness disappearance of macrophage accumulation decrease in lipid contents
Useful for PCI guide especially in 1 Bifurcation stenting 2 Rotablation for calcified lesion 3 Guide for ACS PCI Useful for coronary plaque tissue characterization risk assessment for future ACS events and evaluation of treatment effect
Role of OCT
Thank you for your attention
GW to LCx
Proximal
Distal
Single stenting (Nobori) to LMT-LAD First rewiring to LCX
First rewiring
Second rewiring
Post KBT
Comparison between
ILUMIEN(C7) and ILUMIEN OPTIS(C8)
66
Parameter
ILUMIEN ILUMIEN OPTIS
Long Pullback
S mode
High-density Pullback
HD mode
Frame rate 100 framessec 180 framessec 180 framessec
Pull back speed 20 mmsec 36 mmsec 18 mmsec
Frame interval 5 framesmm 5 framesmm 10 framesmm
Pull back length 54 mm 75 mm 54 mm
Pull back time 27 sec 21 sec 30 sec
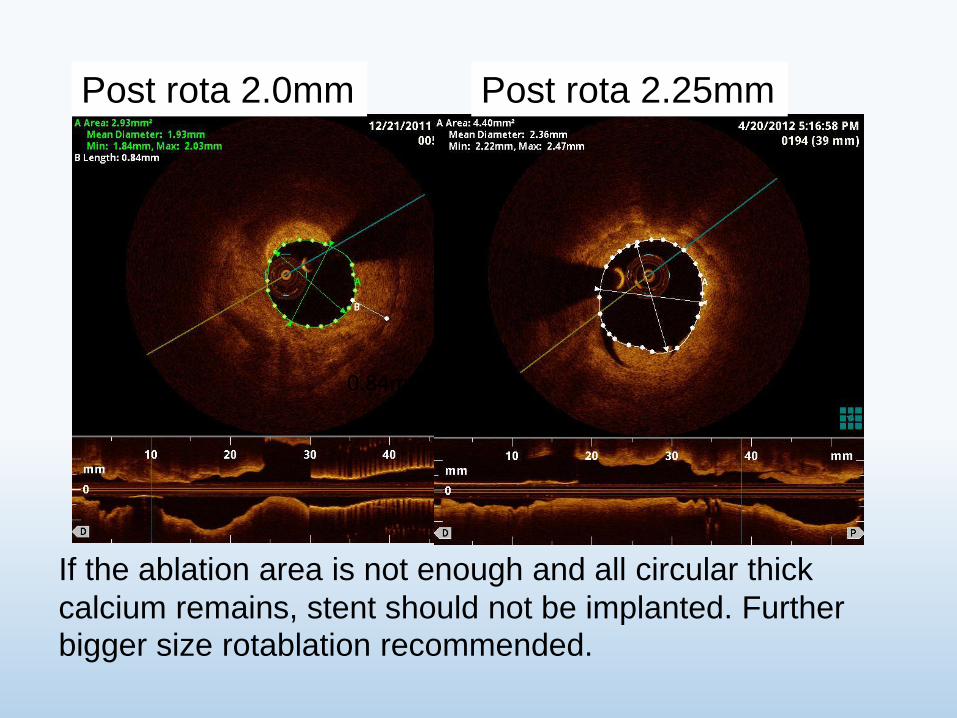
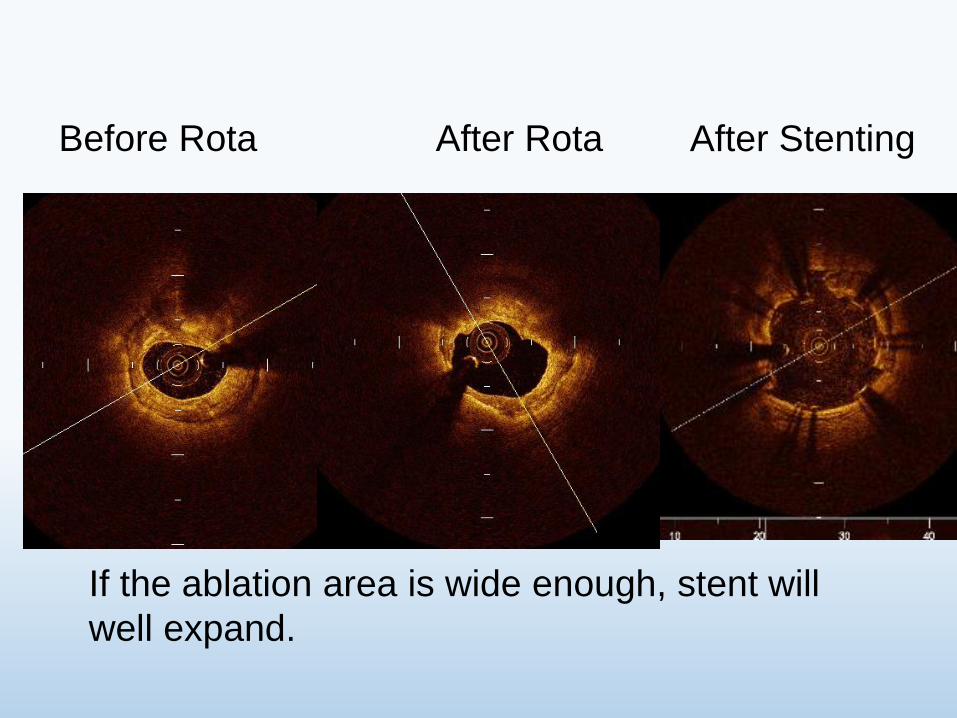
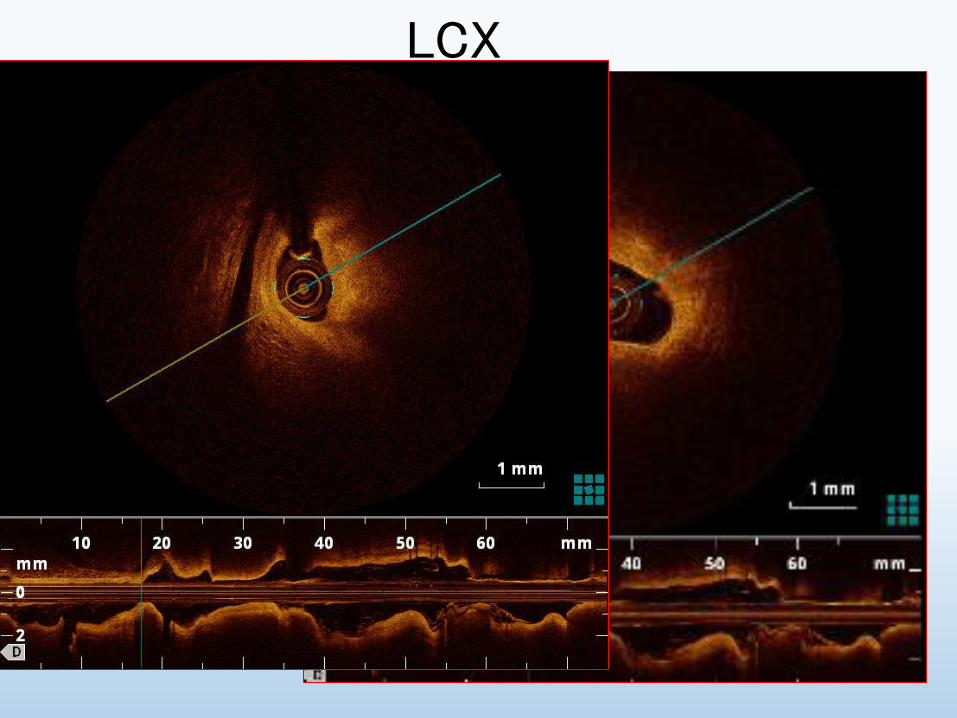
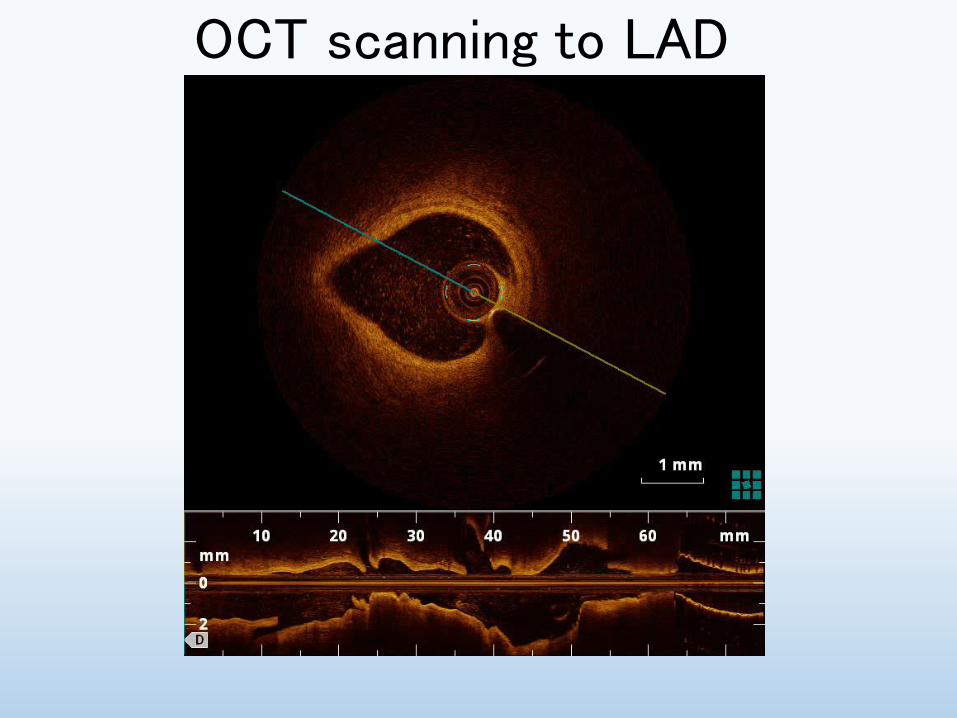
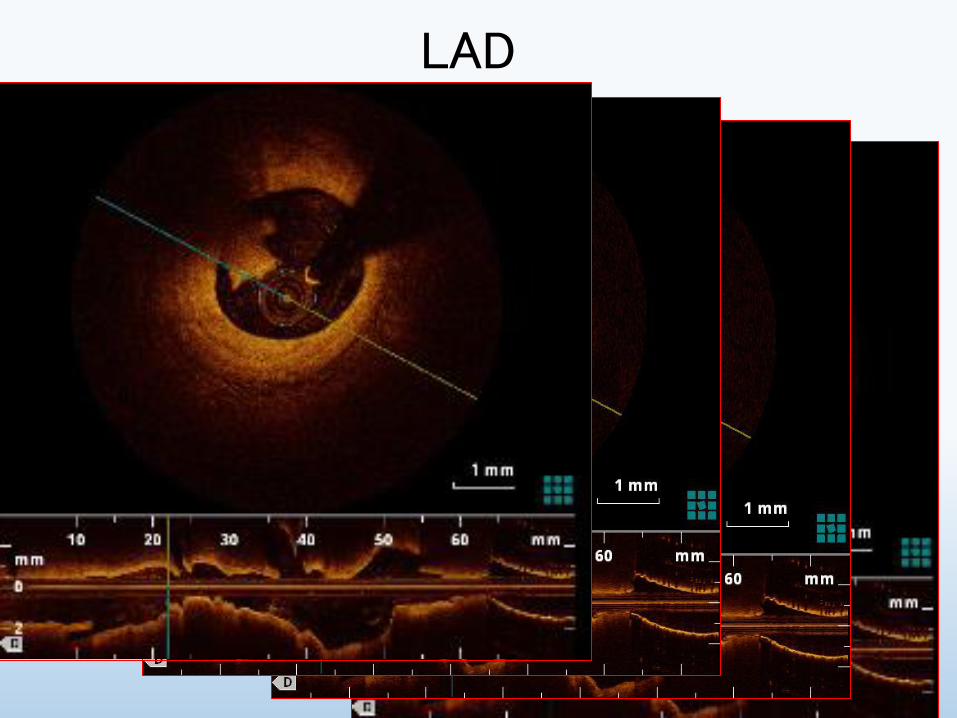
Challenge to estimate the coronary plaque tissue characterization 1 prediction of the stenosis progression and future ACS events 2 evaluation of the treatment effect for vulnerable plaque
Thin-cap fibroatheroma and microchannel findings in optical coherence tomography correlate with subsequent progression
of coronary atheromatous plaques Shiro Uemura Ken-ichi Ishigami Tsunenari Soeda Satoshi Okayama Ji Hee Sung Hitoshi Nakagawa Satoshi Somekawa Yukiji Takeda Hiroyuki Kawata Manabu Horii and Yoshihiko Saito European Heart Journal (2012) 33 78ndash85
Figure 1 (A) Eccentric plaque distribution (B) concave lumen shape (C) intimal laceration (D) ruptured plaque (E) microchannel (F) lipid pool (G) thin fibrous cap covering lipid pool (H) macrophage image (I ) calcium deposition (J ) thrombus formation
Table 4 Association of 10 OCT-based plaque characteristics and subsequent progression Univariate analysis OR (95 CI) P-value Eccentric 330 (073ndash144) 0230 Concave shape 383 (085ndash167) 0160 Intimal laceration 1020 (277ndash378) 0001 Rupture 490 (078ndash3123) 0325 Microchannel 2000 (478ndash826) 0001 Lipid pool 216 (057ndash806) 0222 TCFA 2000 (478ndash826) 0001 Macrophage 960 (260ndash356) 0001 Calcium 133 (041ndash430) 0890 Thrombus 1200 (218ndash6432) 0002
OCT-based complex characteristics of TCFA and microchannel were the potential predictors of subsequent progression of non-significant coronary plaques and or future ACS events
Distal Proximal
Distal Proximal
Challenge to estimate the coronary plaque tissue characterization 1 prediction of the stenosis progression and future ACS events 2 evaluation of the treatment effect for vulnerable plaque
Statin+EPA may be effective for stabilizing vulnerable plaque
Impact of EPA and statin
therapy on coronary thin-cap
fibroatheroma Assessment by
optical coherence tomography
Kobe University Graduate school of medicine
Ryo Nishio Junya Shite Toshiro Shinke Hiromasa Otake
Masayuki Nakagawa Ryoji Nagoshi Amane Kozuki
Takumi Inoue Hirotoshi Hariki Tsuyoshi Osue Yu Taniguchi
Masamichi Iwasaki Noritoshi Hiranuma
Akihide Konishi Hiroto Kinutani Ken-ichi Hirata
Methods
Patients with untreated dyslipidemia (LDL gt 100 mgdl)
who had non-culprit TCFA lesion detected by OCT
Statin group
Rosuvastatin
EPA+Statin group
EPA1800 mgday
Rosuvastatin
Blood analysis and OCT examination were performed
Before and 9 months after treatment
Random assignment
Baseline Profile
EPA+Statin group (n=13)
Statin group (n=12)
P value
EPAAA 033plusmn016 030plusmn015 062
T-Cho (mgdl) 2113plusmn402 2034plusmn417 064
HDL (mgdl) 417plusmn125 417plusmn75 099
LDL (mgdl) 1403plusmn367 1349plusmn374 072
hs-CRP (mgdl) 023plusmn019 026plusmn015 067
PTX3 (mgdl) 418plusmn207 525plusmn285 032
Lipid profile at 9 months after
EPA+Statin group (n=13)
Statin group (n=12)
P value
EPAAA 127plusmn062 049plusmn036 0006
T-Cho (mgdl) 1511plusmn344 1457plusmn229 065
HDL (mgdl) 467plusmn94 441plusmn99 051
LDL (mgdl) 852plusmn285 812plusmn210 069
hs-CRP (mgdl) 006plusmn005 010plusmn008 020
PTX3 (mgdl) 270plusmn127 447plusmn059 002
Fibrous-cap thickness
0
20
40
60
80
100
120
Baseline Follow-up
EPA+Statin
group (n=20)
Statin
group (n=21)
481plusmn750
1035plusmn307
476plusmn114
686plusmn111
P=00001
(microm)
90
120
150
180
210
Baseline Follow-up
EPA+Statin
group (n=20)
Statin group
(n=21)
1655plusmn652
1527plusmn513
1603plusmn663
1289plusmn478
P=014
(degree)
Lipid arc
Macrophages accumulation
650
100
714
429
0
20
40
60
80
100
Baseline Follow-up
P=003
EPA+Statin
group (n=20)
Statin group
(n=21)
RCA (Rosuvastatin 25mg+EPA1800mg)
Before 9 month treatment
RCA (Rosuvastatin 25mg+EPA1800mg)
Before After treatment
OCT may show the treatment effect in vulnerable plaque increase in fibrous cap thickness disappearance of macrophage accumulation decrease in lipid contents
Useful for PCI guide especially in 1 Bifurcation stenting 2 Rotablation for calcified lesion 3 Guide for ACS PCI Useful for coronary plaque tissue characterization risk assessment for future ACS events and evaluation of treatment effect
Role of OCT
Thank you for your attention
GW to LCx
Proximal
Distal
Single stenting (Nobori) to LMT-LAD First rewiring to LCX
First rewiring
Second rewiring
Post KBT
Comparison between
ILUMIEN(C7) and ILUMIEN OPTIS(C8)
66
Parameter
ILUMIEN ILUMIEN OPTIS
Long Pullback
S mode
High-density Pullback
HD mode
Frame rate 100 framessec 180 framessec 180 framessec
Pull back speed 20 mmsec 36 mmsec 18 mmsec
Frame interval 5 framesmm 5 framesmm 10 framesmm
Pull back length 54 mm 75 mm 54 mm
Pull back time 27 sec 21 sec 30 sec

Distal Proximal
Distal Proximal
Challenge to estimate the coronary plaque tissue characterization 1 prediction of the stenosis progression and future ACS events 2 evaluation of the treatment effect for vulnerable plaque
Statin+EPA may be effective for stabilizing vulnerable plaque
Impact of EPA and statin
therapy on coronary thin-cap
fibroatheroma Assessment by
optical coherence tomography
Kobe University Graduate school of medicine
Ryo Nishio Junya Shite Toshiro Shinke Hiromasa Otake
Masayuki Nakagawa Ryoji Nagoshi Amane Kozuki
Takumi Inoue Hirotoshi Hariki Tsuyoshi Osue Yu Taniguchi
Masamichi Iwasaki Noritoshi Hiranuma
Akihide Konishi Hiroto Kinutani Ken-ichi Hirata
Methods
Patients with untreated dyslipidemia (LDL gt 100 mgdl)
who had non-culprit TCFA lesion detected by OCT
Statin group
Rosuvastatin
EPA+Statin group
EPA1800 mgday
Rosuvastatin
Blood analysis and OCT examination were performed
Before and 9 months after treatment
Random assignment
Baseline Profile
EPA+Statin group (n=13)
Statin group (n=12)
P value
EPAAA 033plusmn016 030plusmn015 062
T-Cho (mgdl) 2113plusmn402 2034plusmn417 064
HDL (mgdl) 417plusmn125 417plusmn75 099
LDL (mgdl) 1403plusmn367 1349plusmn374 072
hs-CRP (mgdl) 023plusmn019 026plusmn015 067
PTX3 (mgdl) 418plusmn207 525plusmn285 032
Lipid profile at 9 months after
EPA+Statin group (n=13)
Statin group (n=12)
P value
EPAAA 127plusmn062 049plusmn036 0006
T-Cho (mgdl) 1511plusmn344 1457plusmn229 065
HDL (mgdl) 467plusmn94 441plusmn99 051
LDL (mgdl) 852plusmn285 812plusmn210 069
hs-CRP (mgdl) 006plusmn005 010plusmn008 020
PTX3 (mgdl) 270plusmn127 447plusmn059 002
Fibrous-cap thickness
0
20
40
60
80
100
120
Baseline Follow-up
EPA+Statin
group (n=20)
Statin
group (n=21)
481plusmn750
1035plusmn307
476plusmn114
686plusmn111
P=00001
(microm)
90
120
150
180
210
Baseline Follow-up
EPA+Statin
group (n=20)
Statin group
(n=21)
1655plusmn652
1527plusmn513
1603plusmn663
1289plusmn478
P=014
(degree)
Lipid arc
Macrophages accumulation
650
100
714
429
0
20
40
60
80
100
Baseline Follow-up
P=003
EPA+Statin
group (n=20)
Statin group
(n=21)
RCA (Rosuvastatin 25mg+EPA1800mg)
Before 9 month treatment
RCA (Rosuvastatin 25mg+EPA1800mg)
Before After treatment
OCT may show the treatment effect in vulnerable plaque increase in fibrous cap thickness disappearance of macrophage accumulation decrease in lipid contents
Useful for PCI guide especially in 1 Bifurcation stenting 2 Rotablation for calcified lesion 3 Guide for ACS PCI Useful for coronary plaque tissue characterization risk assessment for future ACS events and evaluation of treatment effect
Role of OCT
Thank you for your attention
GW to LCx
Proximal
Distal
Single stenting (Nobori) to LMT-LAD First rewiring to LCX
First rewiring
Second rewiring
Post KBT
Comparison between
ILUMIEN(C7) and ILUMIEN OPTIS(C8)
66
Parameter
ILUMIEN ILUMIEN OPTIS
Long Pullback
S mode
High-density Pullback
HD mode
Frame rate 100 framessec 180 framessec 180 framessec
Pull back speed 20 mmsec 36 mmsec 18 mmsec
Frame interval 5 framesmm 5 framesmm 10 framesmm
Pull back length 54 mm 75 mm 54 mm
Pull back time 27 sec 21 sec 30 sec

Distal Proximal
Challenge to estimate the coronary plaque tissue characterization 1 prediction of the stenosis progression and future ACS events 2 evaluation of the treatment effect for vulnerable plaque
Statin+EPA may be effective for stabilizing vulnerable plaque
Impact of EPA and statin
therapy on coronary thin-cap
fibroatheroma Assessment by
optical coherence tomography
Kobe University Graduate school of medicine
Ryo Nishio Junya Shite Toshiro Shinke Hiromasa Otake
Masayuki Nakagawa Ryoji Nagoshi Amane Kozuki
Takumi Inoue Hirotoshi Hariki Tsuyoshi Osue Yu Taniguchi
Masamichi Iwasaki Noritoshi Hiranuma
Akihide Konishi Hiroto Kinutani Ken-ichi Hirata
Methods
Patients with untreated dyslipidemia (LDL gt 100 mgdl)
who had non-culprit TCFA lesion detected by OCT
Statin group
Rosuvastatin
EPA+Statin group
EPA1800 mgday
Rosuvastatin
Blood analysis and OCT examination were performed
Before and 9 months after treatment
Random assignment
Baseline Profile
EPA+Statin group (n=13)
Statin group (n=12)
P value
EPAAA 033plusmn016 030plusmn015 062
T-Cho (mgdl) 2113plusmn402 2034plusmn417 064
HDL (mgdl) 417plusmn125 417plusmn75 099
LDL (mgdl) 1403plusmn367 1349plusmn374 072
hs-CRP (mgdl) 023plusmn019 026plusmn015 067
PTX3 (mgdl) 418plusmn207 525plusmn285 032
Lipid profile at 9 months after
EPA+Statin group (n=13)
Statin group (n=12)
P value
EPAAA 127plusmn062 049plusmn036 0006
T-Cho (mgdl) 1511plusmn344 1457plusmn229 065
HDL (mgdl) 467plusmn94 441plusmn99 051
LDL (mgdl) 852plusmn285 812plusmn210 069
hs-CRP (mgdl) 006plusmn005 010plusmn008 020
PTX3 (mgdl) 270plusmn127 447plusmn059 002
Fibrous-cap thickness
0
20
40
60
80
100
120
Baseline Follow-up
EPA+Statin
group (n=20)
Statin
group (n=21)
481plusmn750
1035plusmn307
476plusmn114
686plusmn111
P=00001
(microm)
90
120
150
180
210
Baseline Follow-up
EPA+Statin
group (n=20)
Statin group
(n=21)
1655plusmn652
1527plusmn513
1603plusmn663
1289plusmn478
P=014
(degree)
Lipid arc
Macrophages accumulation
650
100
714
429
0
20
40
60
80
100
Baseline Follow-up
P=003
EPA+Statin
group (n=20)
Statin group
(n=21)
RCA (Rosuvastatin 25mg+EPA1800mg)
Before 9 month treatment
RCA (Rosuvastatin 25mg+EPA1800mg)
Before After treatment
OCT may show the treatment effect in vulnerable plaque increase in fibrous cap thickness disappearance of macrophage accumulation decrease in lipid contents
Useful for PCI guide especially in 1 Bifurcation stenting 2 Rotablation for calcified lesion 3 Guide for ACS PCI Useful for coronary plaque tissue characterization risk assessment for future ACS events and evaluation of treatment effect
Role of OCT
Thank you for your attention
GW to LCx
Proximal
Distal
Single stenting (Nobori) to LMT-LAD First rewiring to LCX
First rewiring
Second rewiring
Post KBT
Comparison between
ILUMIEN(C7) and ILUMIEN OPTIS(C8)
66
Parameter
ILUMIEN ILUMIEN OPTIS
Long Pullback
S mode
High-density Pullback
HD mode
Frame rate 100 framessec 180 framessec 180 framessec
Pull back speed 20 mmsec 36 mmsec 18 mmsec
Frame interval 5 framesmm 5 framesmm 10 framesmm
Pull back length 54 mm 75 mm 54 mm
Pull back time 27 sec 21 sec 30 sec
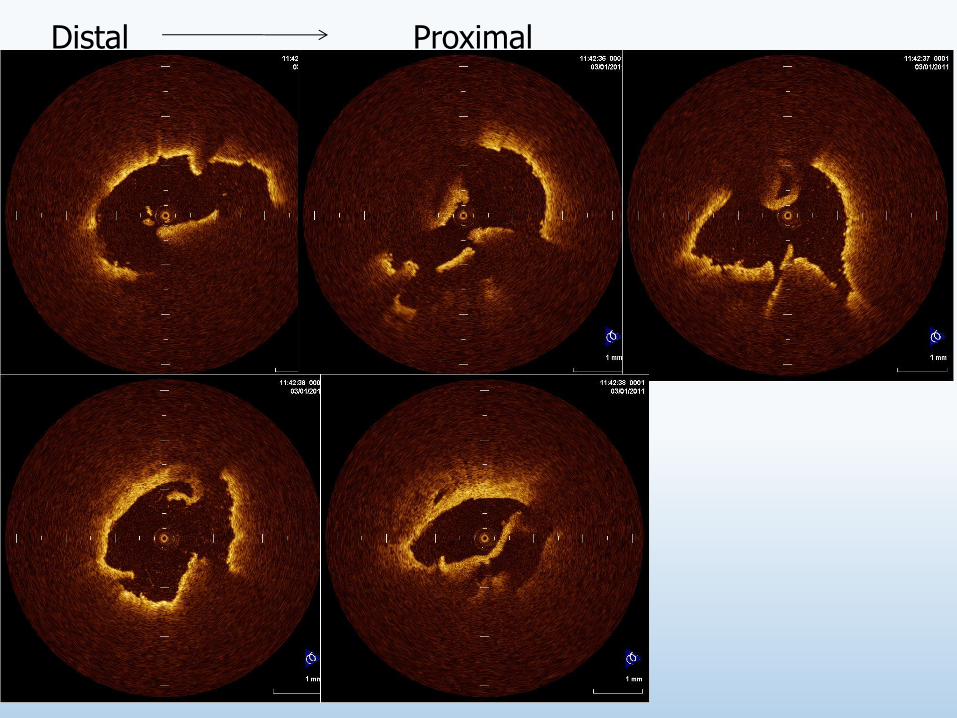
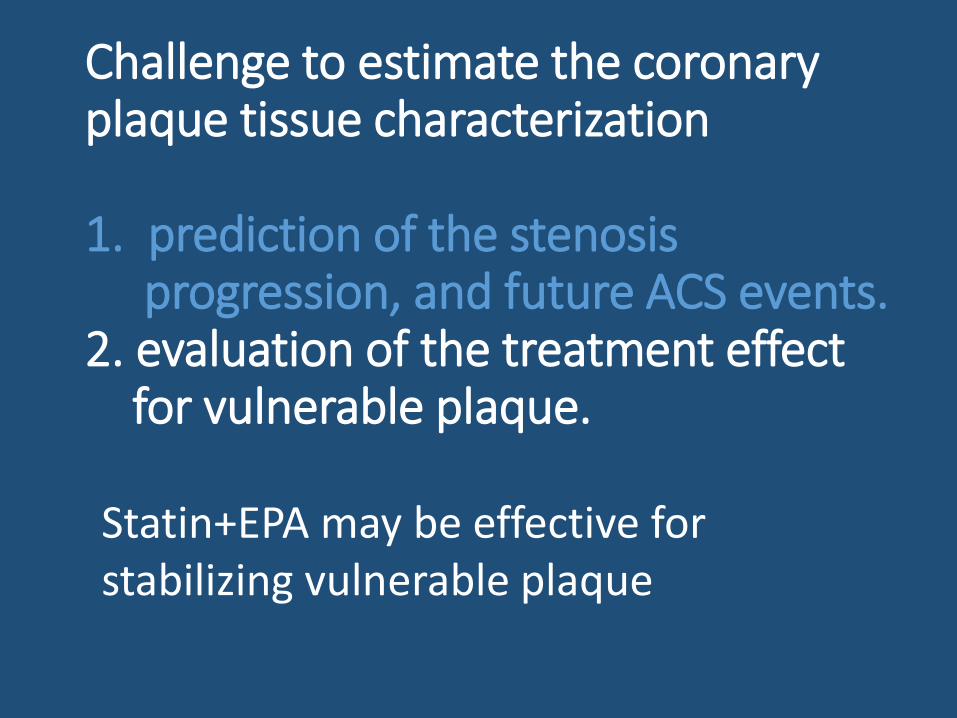
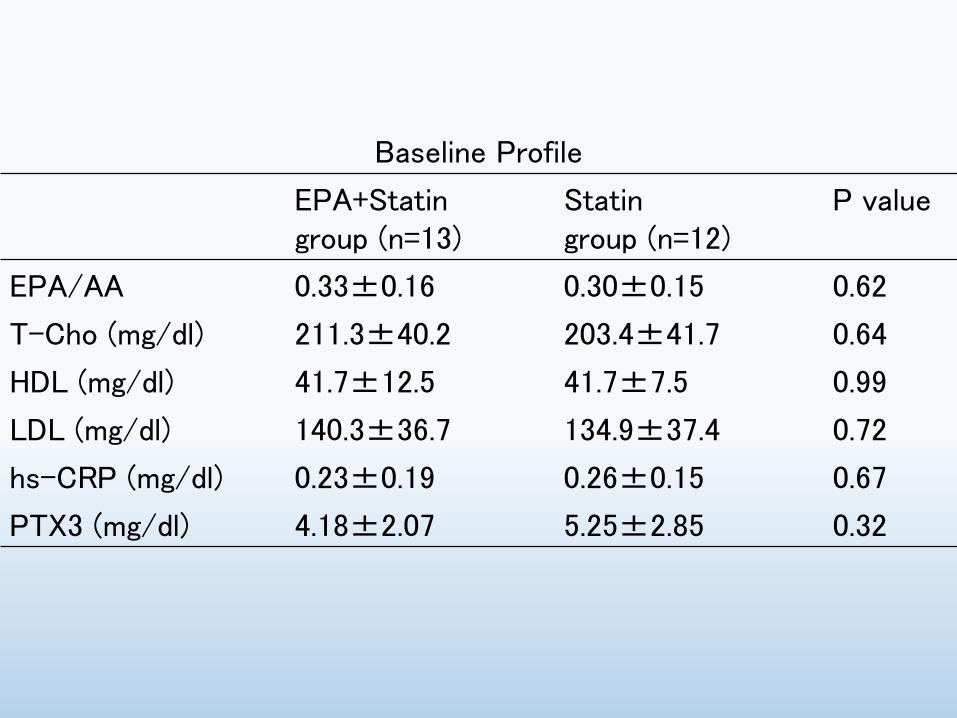
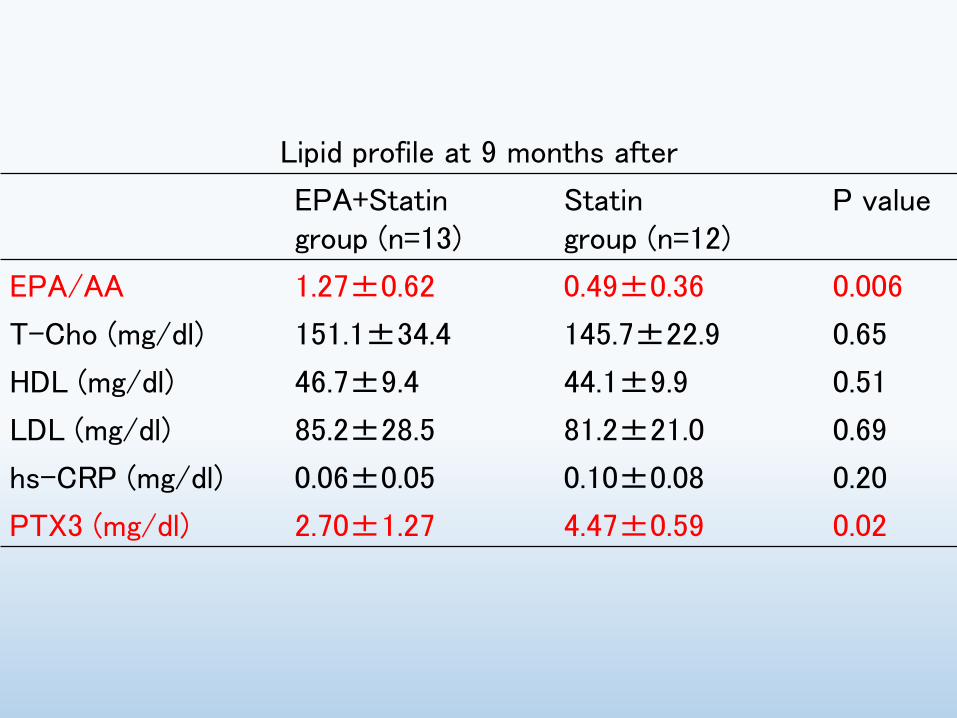
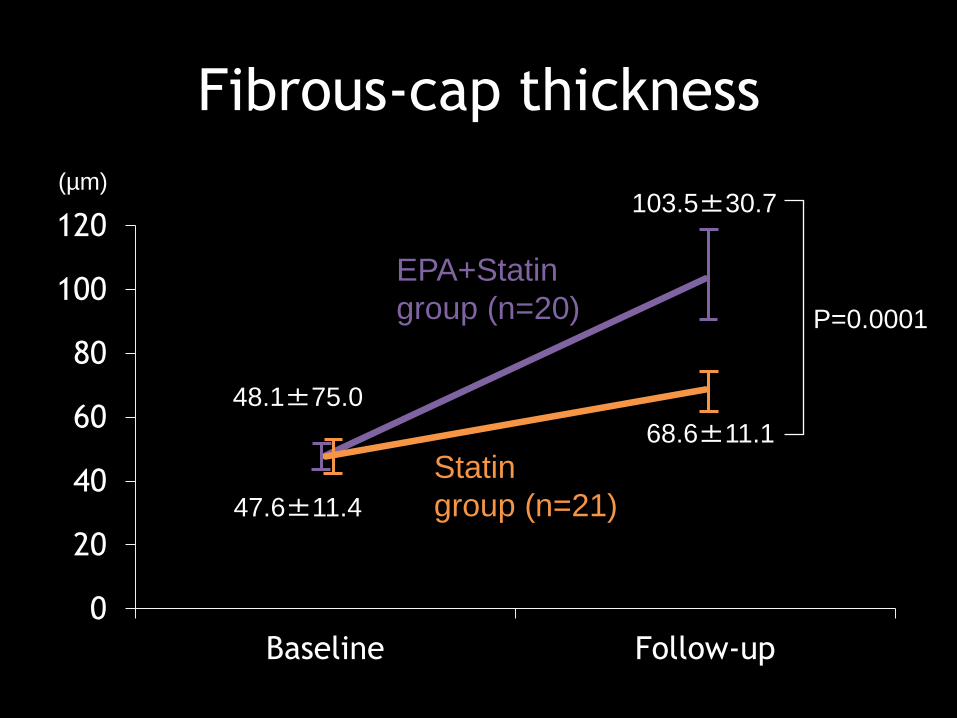
RCA (Rosuvastatin 25mg+EPA1800mg)
Before After treatment
OCT may show the treatment effect in vulnerable plaque increase in fibrous cap thickness disappearance of macrophage accumulation decrease in lipid contents
Useful for PCI guide especially in 1 Bifurcation stenting 2 Rotablation for calcified lesion 3 Guide for ACS PCI Useful for coronary plaque tissue characterization risk assessment for future ACS events and evaluation of treatment effect
Role of OCT
Thank you for your attention
GW to LCx
Proximal
Distal
Single stenting (Nobori) to LMT-LAD First rewiring to LCX
First rewiring
Second rewiring
Post KBT
Comparison between
ILUMIEN(C7) and ILUMIEN OPTIS(C8)
66
Parameter
ILUMIEN ILUMIEN OPTIS
Long Pullback
S mode
High-density Pullback
HD mode
Frame rate 100 framessec 180 framessec 180 framessec
Pull back speed 20 mmsec 36 mmsec 18 mmsec
Frame interval 5 framesmm 5 framesmm 10 framesmm
Pull back length 54 mm 75 mm 54 mm
Pull back time 27 sec 21 sec 30 sec
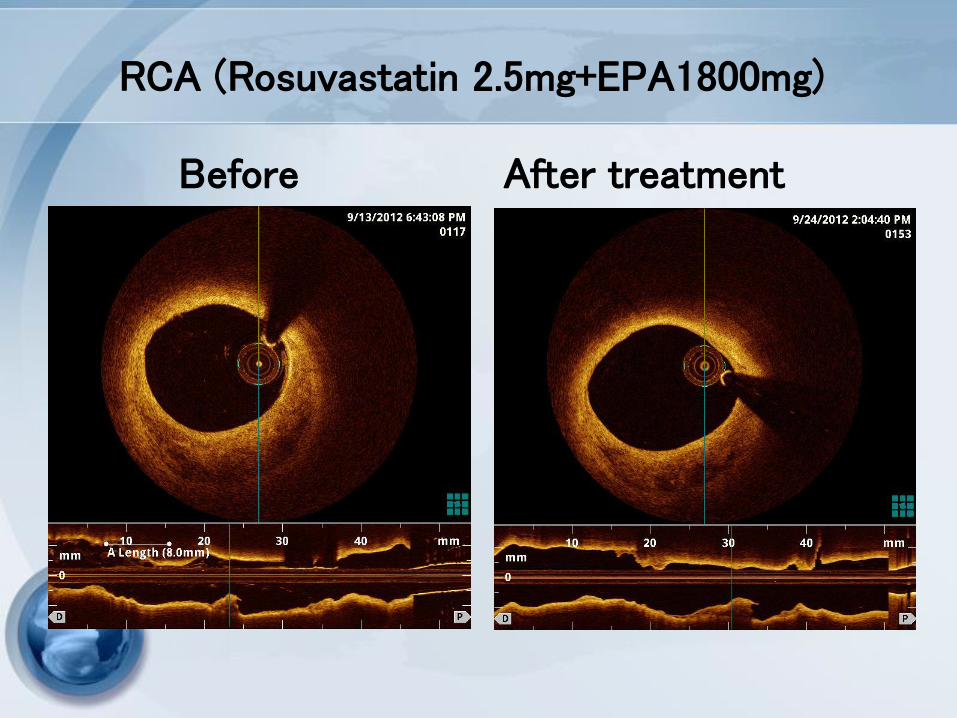
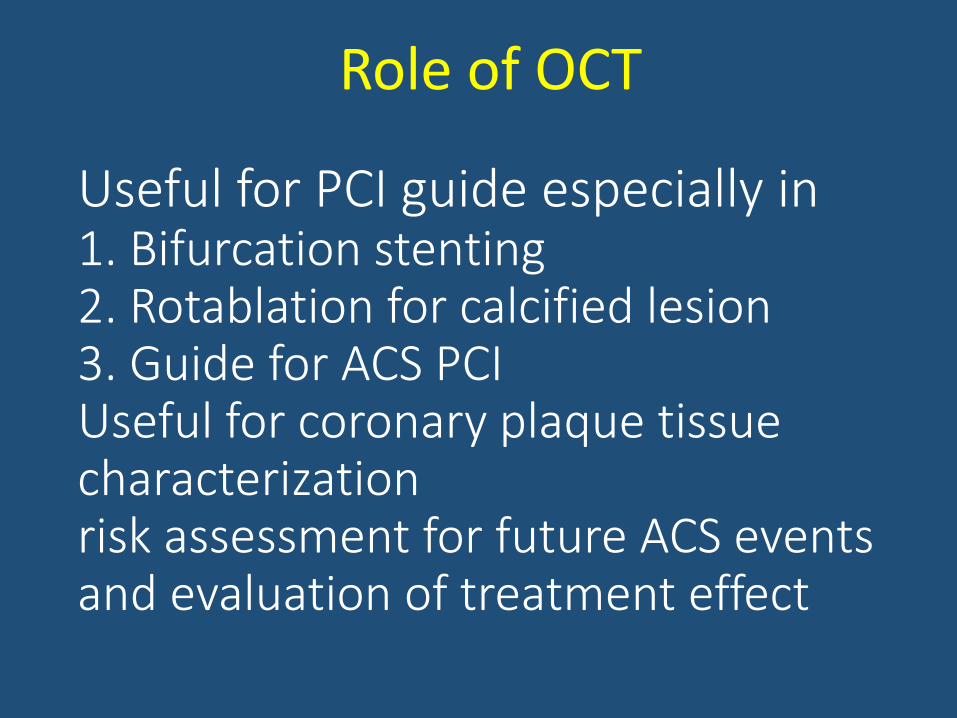
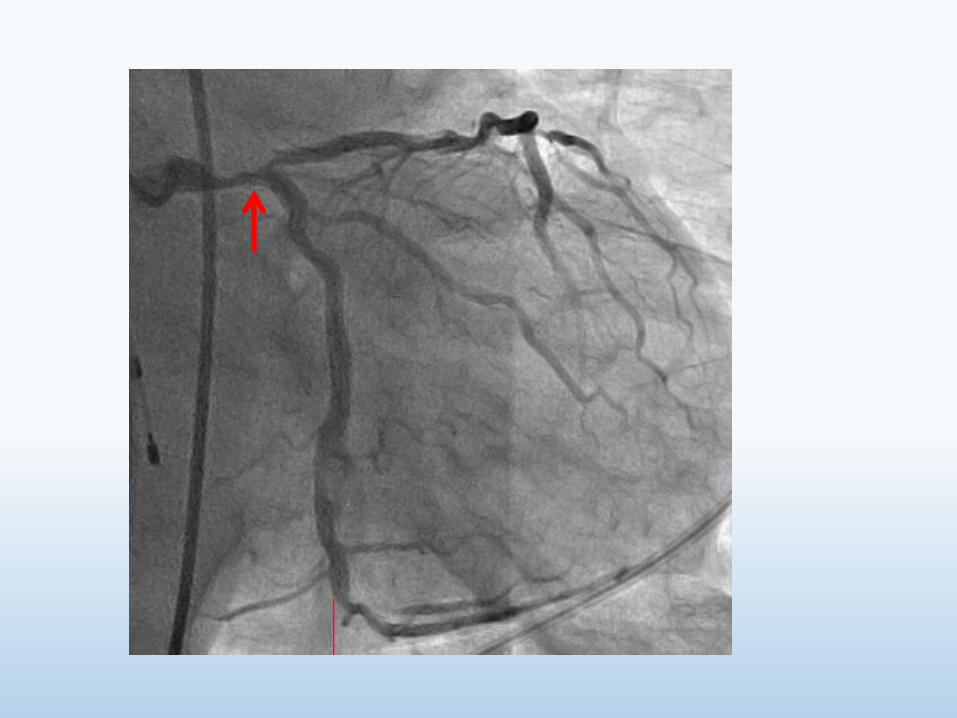
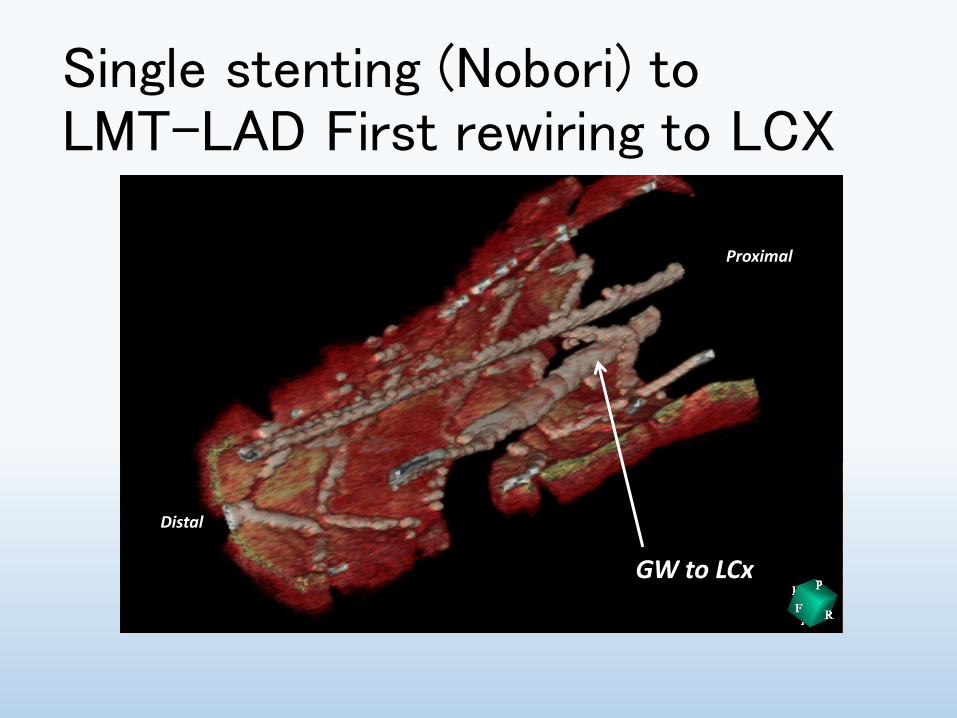


![download.xbox.comdownload.xbox.com/content/4343081e/360_DMCC_PC2.pdf · Xbox 360 D HD AV '—7JRXbox 360 HD AV '—7JÞsXbox 360 VGA HD AV ... one/ 13 Devil May cry 3] rGOLD MODE]](https://img.pdfslide.us/doc/110x75/5f02c5017e708231d405ebed/xbox-360-d-hd-av-a7jrxbox-360-hd-av-a7jsxbox-360-vga-hd-av-one-13-devil.jpg)


![Pullback and Pushout Constructions in C*- Algebra Theorymueger/ped2.pdf · K-theory of a pullback (the Mayer Vietoris sequence), occurs in book III of Schochet’s magnum opus [45]](https://img.pdfslide.us/doc/110x75/5e81db24dbcf5e029846f939/pullback-and-pushout-constructions-in-c-algebra-muegerped2pdf-k-theory-of.jpg)