Embed Size (px)
Citation preview

Financial Statements 2020
ROHM Co., Ltd.

CONTENTS
Management Policies........................................ 1
Eleven-Year Summary ....................................... 10
Consolidated Balance Sheet.................................... 12
Consolidated Statement of Income ................................ 14
Consolidated Statement of Comprehensive Income....................... 15
Consolidated Statement of Changes in Equity.......................... 16
Consolidated Statement of Cash Flows.............................. 17
Notes to Consolidated Financial Statements........................... 18
Independent Auditors’ Report................................... 44

(1) ROHM’s Basic Management Policy
The ROHM Group believes that, in creating and improving our overall corporate value, promoting the development
of innovative products and high-quality manufacturing within our corporate business activities will both improve
customer satisfaction and contribute to society. Those results will in turn boost employee confidence and pride, and
inspire new challenges. Moreover, the added-values created by these business activities should be allocated in
appropriate proportions to all constituents, including shareholders, employees, and stakeholders of local communities,
while retained earnings should be allotted to business investment and efforts to increase competitive strength. To
pursue this objective, it is also crucial to obtain the understanding and cooperation of all those with a stake in the
company’s performance.
Therefore, since making the ROHM Group more attractive to stakeholders is one of the important missions of
company management, these activities are incorporated into operations throughout the ROHM Group and seriously
undertaken for the CSV (Created Shared Value) they deliver.
With these perspectives, the ROHM Group has committed itself to developing market-leading products. As a
fundamental policy, the Group pursues a stable supply of high quality, cost-competitive products in high volume
through optimal utilization of its distinctive production technologies that will help to maintain a leading position in
the global semiconductor and electronic components market.
(2) Mid-to Long-term Corporate Strategies <1> Focus Market
①The Automotive, Industrial Equipment Markets
The automotive market and the industrial equipment market which is seeing increased computerization and energy
saving, require high quality, high reliability, stable supply – all of which the ROHM Group can extremely provide.
②Overseas Market
ROHM is strengthening sales activities to capture and keep overseas customers not only in Europe and the USA but
also in China and other emerging countries where markets are growing and globalizing rapidly. We are building
systems to cover the full gamut of services from product configuration to development, sales and technical support,
which will enable us to meet a wide range of needs of overseas customers and promote increasing both sales and shares
of overseas markets.
<2> Focus Products
①Power
Because of the growing needs to conserve and more efficiently use energy, the ROHM Group had been developing and
strengthening lineups of SiC devices(*1) of smaller sizes and greatly reduced power loss compared to conventional Si
semiconductors. These products have been adopted for a variety of applications centered around the automotive and
industrial equipment markets. Besides SiC devices, we will continue promoting the best power solutions for customers
by combining our core power devices and module technologies with high-performance power ICs, driver ICs,
IGBT(*2)s, power MOSFETs, etc.
*1. SiC (Silicon carbide) device
A compound semiconductor composed of Si (silicon) and C (carbon). SiC devices exponentially improve electrical
power conversion efficiency over earlier Si (silicon) devices because of a higher withstand voltage, lower ON
resistance and faster operating speed. They also operate stably at high temperatures.
*2. IGBT (Insulated gate bipolar transistor)
A power semiconductor device that integrates a MOSFET and a bipolar transistor. As IGBTs offer both low ON
resistance and fast switching, they are widely used to control the voltage of large power supplies.
Management Policies
1

②Analog
With accelerating automotive digitization and progressing energy saving in the automotive and industrial equipment
markets, the ROHM Group will be developing advanced analog solutions, such as high-performance power
management ICs and motor driver ICs, LED driver ICs.
③Standard Products
About resistor and small signal semiconductor, general purpose IC, we supply high quality and high reliability products
mainly for automotive and industrial equipment markets stably.
<3> Enhancement of Manufacturing
To stably grow our business over the mid- to long-term, the ROHM Group will be strengthening its production system
to stably supply products all around the world. We will also be using RPS activities(*3) to reduce waste and enhance
efficiency, and will be looking to strengthen cost competitiveness by shortening lead-times and further improving
quality in all aspects of operations. Moreover, to make “Zero Defects” a reality, we will be developing technologies and
investing in equipment needed to build a state-of-the-art quality management system.
*3 RPS (ROHM Production System) activities
A production system centered on improvement activities for integrating higher quality into products, shortening lead
time and thoroughly eliminating waste in inventory and other operations at all Group plants. ROHM believes that
establishing production systems of unparalleled efficiency and quality is essential for strengthening the Group’s
earning structure.
(3) Status of Corporate Governance
Corporate System and Policies of ROHM Group ①Corporate System to Ensure Proper Operation (Internal Control System) Regarding the reinforcement of the internal control system as one of the major corporate missions, ROHM Group
intends to carry out its corporate social responsibilities by maintaining compliance of the operational processes of the
entire Group. The Board of Directors of the Company has resolved the basic policies to build the internal control
system and the improvement of the system, as listed below:
ROHM made a transition to a company with an Audit and Supervisory Committee on the Ordinary General
Shareholders Meeting on June 27, 2019 and the detail mentioned below is the system after the transition, but even
before the transition, we operated the same system about Company Auditors.
1)The system to ensure the compliance of the execution of duties of the Directors under applicable laws as well as the
Articles of Incorporation
(a)In order to promote further progress of globalization, ROHM Group will not only comply with laws and regulations
but also support the 10 principles of the United Nations Global Compact for a wide range of problems in the areas of
human rights, labor, the environment, anti-corruption, etc. and contribute to solve these social challenges
(Sustainable Development Goals) through ROHM’s products, technology, and services. And the Company will
promote the management focusing on CSR by complying with “ISO26000” the international standards for social
responsibility, as well as the Code of Conduct of the Responsible Business Alliance (RBA).
(b)Directors should perform their duties based on the in-house regulations such as “ROHM Group Business Conduct
Guidelines” and the Basic Rules of the Board of Directors and ensure the compliance with all applicable laws and
regulations as well as the Articles of Incorporation.
(c)The Director or Directors who are highly informed in a specific field should be responsible for the duties related to
such field, while all Directors should hold discussions and monitor each other on a daily basis concerning the
Management Policies
2

respective individual fields.
(d)Should a Director be found having committed an illegal act by another Director, it should be promptly reported to
the Board of Directors and the Audit and Supervisory Committee.
(e)Independent Outside Directors should regularly hold the meeting to exchange information and opinions with each
other and constantly check that Directors perform their duties in compliance with all applicable laws and regulations
as well as the Articles of Incorporation.
(f)The Compliance Hotline (the internal hotline system (including the case where the hotline system independent from
the management is set up at an outside law firm) and hotline system for suppliers) should be deployed to the entire
ROHM Group including overseas entities to discover any illegal conduct of a Director and to prevent recurrence
thereof.
(g)The Company establish the independent internal audit division and monitor and evaluate the effectiveness of the
internal control system.
2)System to save and control information related to Directors’ performance of duties
(a)Decisions regarding Directors’ performance of their duties, such as the minutes of general shareholders meetings,
the minutes of the meetings of the Board of Directors, executive proposals, business plans for individual fiscal years,
etc., should be saved in writing. The documents should be saved and controlled in compliance with all applicable
laws and regulations as well as all in-house regulations.
(b)The directions and notices provided to Group companies or in-house divisions concerned shall be issued via email
or in writing as a rule. The directions and notices shall be saved so as to be inspected at any time by Directors and
Company Auditors.
(c)Information related to Directors’ performance of duties should be kept and controlled duly by relevant sections or
divisions concerned, and the leak and unjust use of such information must be prevented by giving internal notice and
information security training to all employees to ensure that they are fully aware of and comply with such rule.
3)Rules and other systems to control the risk of loss
(a)Under the CSR Committee chaired by the President himself, Committees of Corporate Safety and Health, Risk
Management/BCM, Compliance, Information Disclosure, Environmental Conservation, etc. should be established as
company-wide cross-sectional committees. These committees will appropriately respond to various management
issues and risks in each responsible area by taking necessary measures, giving directions and solving problems.
(b)The Risk Management/BCM Committee should be organized to identify, analyze and control major risks that may
occur in the course of the performance of business operations. In order to avoid or minimize the effect of
unforeseeable circumstances such as sudden natural disasters as much as possible and enable the survival of our
business as a consequence, the Risk Management/BCM Committee will verify the activities of each section in
charge of risk management, establish a business continuity plan and take any and all possible preliminary measures
or preparations across ROHM Group.
(c)As a corporate effort to eradicate antisocial groups, a Risk Management Office should be established in the
Department of General Affairs. The Office should cooperate and exchange information with external specialist
organizations such as the police department, promote specific actions and perform them thoroughly, to eradicate
antisocial groups. In-house regulations should be established to eradicate antisocial groups and should be strictly
observed. All ROHM Group employees should be informed by way of the “ROHM Group Business Conduct
Guidelines”, as distributed to all employees, or by other means, that they must take a firm stand against antisocial
groups. Further, the necessity of taking a firm stand against antisocial groups should be communicated to all
employees through various in-house training sessions.
Management Policies
3

4)System to ensure that Directors perform their duties efficiently
(a)By narrowing down the number of Directors and introducing Corporate Officer System, the Company perform the
specific duties based on the segregation of duties and to realize prompt executive decision-making.
(b)To assist the President’s decision-making, the Company establish the Executive Meeting consists of Corporate
Officers.
(c)Issues that may have a considerable influence on corporate management should be examined, analyzed and reported
by in-house project teams established separately for individual issues. Upon completion of such examination,
prompt decisions should be made by way of a meeting of Board of Directors or executive proposals, as appropriate,
based on the Articles of Incorporation and in-house regulations.
(d)The in-house written standards of in-house control procedures regarding various managerial issues such as risk
control and information control should be strictly observed.
(e)To increase the competitiveness of ROHM Group and to ensure a fair amount of profits, business performance
targets should be established as part of annual profit-raising projects for the entire ROHM Group and individual
divisions, and progress and achievement status of such projects and targets should be controlled.
5)System to ensure that employees perform their duties in compliance with all applicable laws and regulations as well
as the Articles of Incorporation
(a)The Compliance Committee should be organized and across-the-group compliance actions should be taken by
implementing the “ROHM Group Business Conduct Guidelines”. A compliance system of the Group companies
should be created based on the system of our company, and a leader for each division should be nominated as a
leader to raise the awareness of the importance of compliance and to ensure the ongoing compliance of each
division.
(b)To appropriately comply with proprietary laws and regulations in a proper manner, not only the CSR Committee but
also the Corporate Safety and Health Committee, Compliance Committee, Information Disclosure Committee, and
Environmental Conservation Committee, should be committed to such actions as checking the status of compliance
for the entire Group and performing ongoing educational activities.
(c)Under the control of the Information Disclosure Committee, individual sections and divisions should properly
control insider information and educate employees in the interest of and raising awareness of the importance of strict
information handling, to prevent insider trading.
(d)The Compliance Hotline (the internal hotline system (including the case where the hotline system independent from
the management is set up at an outside law firm) and hotline system for suppliers) should be deployed to the entire
ROHM Group including overseas entities, to uncover any illegal conduct of an employee and to prevent any
recurrence thereof.
6)System to ensure compliance of the Group’s corporate operations
(a)ROHM Group shares the corporate mission and policy, which are the basis of the founding spirit of the Company,
and carries out the business activities with the concerted efforts as the Group in order to enhance the corporate
values of the entire Group.
(b)Each Committee under the Company’s CSR Committee should supervise and control Group companies
comprehensively to ensure proper execution of duties in each responsible area.
(c)Written standards applicable to the entire ROHM Group should be established and implemented.
(d)As a parent company, the Company appropriately associate with nominations of Directors of the group companies
by establishing “The Group Company Officer Nomination Council” in the Company. Furthermore, the Company
monitor appropriateness of their business executions by properly appointing Directors and Auditors in Group
companies.
(e)As for important matters of Group companies, approvals of the Board of Directors of the Company or through
executive proposals are required as well as reports are regularly made to each section of the Company, thereby the
Management Policies
4

Company controls the Group companies.
(f)An internal control system that includes the Company and significant Group companies should be established and
reinforced through a framework that ensures financial reporting compliance and through efforts to conform to the
auditing system.
(g)The Company’s internal auditing division under the direct control of the President should perform internal audits to
check each Group company’s situations of execution of duties, compliance with all applicable laws and regulations
as well as in-house regulations, risk management, etc.
7)Directors and employees to assist the Audit and Supervisory Committee’s duties, independence of the Directors and
employees from Directors (except the Company Director who are Audit and Supervisory Committee) and to ensure
effectiveness of the instruction to such Directors and employees
(a)The Company can appoint staff employees with necessary practical capabilities.
(b)The staff employees should not do duties related to the business execution. In the employment, transfer and
evaluation of performance of those staffs, opinions from the Audit and Supervisory Committee shall be respected.
8)System of report to the Audit and Supervisory Committee, and system for employees not to be treated
disadvantageously by the reason of such reports
(a)Should a Director be found having committed an illegal conduct in the performance of Directors’ duties or neglected
the obligation of being duly conscious as good Directors, or any fact be found having a threat to damage the
Company considerably, etc. by another Director, it should be promptly reported to the Audit and Supervisory
Committee.
(b)The meetings of committees, not only the CSR Committee but also the Risk Management/BCM Committee,
Compliance Committee, and Information Disclosure Committee should be attended by full-time Audit and
Supervisory Committee Member as observers, and individual committees should make periodical reports on their
activities to the Audit and Supervisory Committee by submitting meeting minutes or by other appropriate means.
(c)A system should be retained whereby the status and results of business operations can be properly reported to the
Audit and Supervisory Committee through executive proposals and reports.
(d)Directors and employees of the Company and Group companies should promptly make a necessary report if they
are asked by the Audit and Supervisory Committee to make a report of their business operations.
(e)A section in charge of the Compliance Hotline should make periodical reports on situations and results thereof to the
Audit and Supervisory Committee.
(f)If each Director or Auditor of the group company find violation of laws or the Articles of Incorporation or other
in-house regulations or any fact that may damage the ROHM Group considerably regarding the execution of
business, it should be promptly reported to the Audit and Supervisory Committee by those or a person who received
a report from those.
(g)Employees that have reported to the Audit and Supervisory Committee shall not disadvantageously treated by the
reason of such reports according to applicable laws and regulations as well as in-house regulations.
9)Other systems to ensure that the audits by the Audit and Supervisory Committee are performed effectively
(a)Concerning the status of the operation of the internal control system, Directors should report to the Audit and
Supervisory Committee where requested.
(b)The internal audit division should strengthen the collaboration with the Audit and Supervisory Committee and
report the results of audit periodically.
(c)The Audit and Supervisory Committee should be all Outside Directors. the Audit and Supervisory Committee
should be a strongly independent group consisting of diversified experts, including legal specialists, accounting
specialists, and those who used to work for financial institutions.
(d)The Audit and Supervisory Committee should exchange opinions with Directors who are not Audit and Supervisory
Management Policies
5

Committee Members whenever necessary.
(e)The expenses that the Audit and Supervisory Committee deem to be necessary when they perform their duties
should be borne by the Company.
②Outline of the Status of the Operation of the Corporate System to Ensure Proper Operation
ROHM Group is striving to build the internal control system and properly operate it based on the aforementioned
basic policies. The outline of the status of the operation of the internal control system during the fiscal year ended
March 31, 2020 is as follows:
1)Compliance system
・ROHM Group not only makes all Directors and employees fully aware of the “ROHM Group Business Conduct
Guidelines” as their codes of conduct to comply with when they practice the mission and policy such as “Company
Mission” and “Management Policy” but also thoroughly ensures that they act according to such Guidelines.
・ROHM Group regularly holds the Compliance Committee in order to formulate a plan to reinforce the compliance
system, implement education by rank and by role in accordance with the plan, send the message from the top
concerning the compliance with the “ROHM Group Business Conduct Guidelines,” etc.
・ROHM Group operates the internal hotline system to prevent compliance violations, discover violations early, and
take appropriate measures. ROHM Group also regularly reports the status of the operation to the Board of Directors
and Company Auditors.
・The Company establish the internal audit division which is independent from business execution division and the
division monitor/evaluate the effectiveness of the internal control system, and that improves transparence and
effectiveness of the work.
2)Risk management system
・ROHM Group holds the Risk Management/BCM Committee as needed to identify, analyze and control major risks
that may occur in the course of the performance of business operations. Also, in order to avoid or minimize the effect
of unforeseeable circumstances such as sudden natural disasters as much as possible and enable the survival of our
business as a consequence, the Risk Management/BCM Committee verifies the activities of each section in charge of
risk management, establishes a business continuity plan (BCP) and takes any and all possible preliminary measures
or preparations across ROHM Group.
3)Subsidiary management system
・ROHM Group manages Group companies by operating the system that requires the approval of the Company’s
Board of Directors and final decision on executive proposals regarding important projects in Group companies, and
also by each division of the Company regularly receiving the report with respect to the status of its operation.
・Based on an annual plan, the Company’s internal auditing division under the direct control of the President performs
internal audits to check each Group company’s situations of execution of duties, compliance with all applicable laws
and regulations as well as in-house regulations, risk management, etc., and confirms the compliance of business.
Also, the results of audits are periodically reported to Directors and the Audit and Supervisory Committee.
4)Directors’ performance of duties
・The regular meetings of Board of Directors are held according to the annual plan and extraordinary meetings of
Board of Directors are held where necessary to resolve matters stipulated in laws and regulations or Articles of
Incorporation as well as matters which are important for management and to mutually supervise the performance of
Directors’ duties.
・Matters to be delegated to each Director are made clear in the Basic Rules of the Board of Directors and in the
in-house regulations and introducing Corporate Officer System to ensure Directors’ efficient and agile performance
Management Policies
6

of their duties.
・In the Executive Meeting, the Company deliberate primary management policies, plans, and business operations in
order to assist the President’s decision-making.
・Information related to Directors’ performance of duties is properly kept and controlled duly according to the
in-house regulations, and the leak and unjust use of such information are prevented.
5)Performance of duties of the Audit and Supervisory Committee Members selected by the Audit and Supervisory
Committee
・Such selected members attend not only the meetings of Board of Directors but also other important meetings such as
those of the CSR Committee to offer opinions as needed.
・Such selected members visit each division of the Company and Group companies for auditing and confirm the
legality and compliance of business operations.
・Such selected members regularly exchange information and opinions with Directors, Independent Auditor and the
internal auditing division to improve effectiveness of auditing.
③Basic Policies Related to the Company’s Ownership Control
The Company’s Mission has been to contribute to the advancement and progress of our culture through a consistent
supply, under all circumstances, of high quality products in large volumes to the global market. We believe that
fulfilling this mission creates and enhances total long-term corporate value, and at the same time promotes the common
interests of all of our stakeholders including our shareholders. We understand that the Board of Directors, delegated by
the shareholders, is responsible for further enhancing corporate value by fulfilling the above mission and making
consistent managerial efforts for sustainable growth.
As for so-called takeover defenses, the Company believes that the best strategy is to achieve a higher stock price as
well as to gain, to the fullest extent, the confidence of its shareholders by mutual communications through ongoing and
comprehensive investor relations activities. And if a takeover proposal is put forward, we consider that the ultimate
decision as to whether or not to accept the takeover proposal should be made by the shareholders of that time. The
Company considers that, in the process of the ultimate decision making, it is not acceptable that the Board of Directors
make arbitrary judgments in order to protect their own interests, for instance. Moreover, the Company has determined
that, when a takeover is proposed, it is necessary to have our shareholders be able to make an appropriate decision
based on sufficient information and within a reasonable time period for the purpose of securing and improving the
corporate value and the common interests of the shareholders.
Overview of Contents of Liability Limitation Agreement ROHM and its outside directors have entered into a liability limitation agreement, in accordance with the provisions of
Article 427-1 of the Companies Act of Japan and the Articles of Incorporation of the Company, regarding liability for
damages as covered in Article 423-1 of the same Act, stipulating minimum total liability as per the provisions of Article
425-1 of the same Act.
Status of Outside Officers ①Number of Outside Directors, Interpersonal Relationships with Submitting Company Members, Capital
Relationships or Business Relationships, and Other Potential Conflicts of Interest ROHM appoints five Outside Directors (four out of five are Audit and Supervisory Committee members) to enhance
supervisory functions by Board of Directors. In order to ensure the effectiveness of the audit with regards to the
execution of management duties, all Audit and Supervisory Committee members are Outside Directors. It should be
noted that outside directors own shares of Company stock but may not have conflicts of interest, including
interpersonal relationships, shareholding, capital relationships, and business relationships, that interfere with their
independence.
Management Policies
7

②Criteria and Policy for Independence, and Functions and Roles of Outside Directors
We strengthen our supervisory and audit functions by asking the Outside Directors to provide advice and
recommendations on company management, etc. from an independent standpoint and based on the wealth of
experience and wide range of insight cultivated from their careers, and by having them attend Board Meetings and
other important meetings.
As for the relationship between the Outside Directors and audits, status reports are made in writing by the internal audit
division to the Outside Directors on a monthly basis or as necessary.
Regarding the collaboration between the Outside Directors and the Internal Control Division, the status of business
execution, progress of profit planning, etc. are reported in writing by the Internal Audit Division to the Outside
Directors monthly or whenever necessary.
ROHM believe that Outside Directors should be highly independent, and with regard to the selection of Outside
Directors, we determines their independence on the basis of the provisions of the Company’s “Independence Standards
for Outside Officers”.
The Company’s “Independence Standards for Outside Officers” are as follows:
<Independence Standards for Outside Officers>
The Company appoints only persons who do not fall into any of the following categories of persons as its Outside
Officers.
1. A major shareholder1 of the Company or a person who executes the business of the Company2;
2. A person who executes the business of a company of which the Company is a major shareholder;
3. A major customer3 of the Group or a person who executes the business of that major customer;
4. An organization for whom the Group is a major customer4 or a person who executes the business of said
organization;
5. A consultant, accounting expert or legal expert who, in addition to director's remuneration, receives money exceeding
a certain amount or other assets5 from the Group (or an organization that receives the said assets or a person who
belongs to the said organization);
6. A person who receives donations or grants exceeding a certain amount6 from the Group (or an organization that
receives the said grants is, or a director of that organization or a person who executes the business of that
organization);
7. A partner, member or employee of the accounting auditors of the Company;
8. A person who executes the business of a major lender of the Company7;
9. A person who fell into any of the categories described in 1 to 8 above in the last three years;
10. An organization to whom a director of the Group is transferred or a person who executes the business of said
organization, or;
11. The spouse of an important person who executes the business of the Group8 or a relative of that person within the
second degree of relationship.
1 A major shareholder means a shareholder holding at least 10% of the total voting rights of the Company. 2 A person who executes business means a director, an executive officer, a member or an employee. 3 A major customer means a company whose payments account for over 2% of annual consolidated sales of the
Company. 4 An organization for whom the Group is a major customer means a company with over 2% in annual sales coming
from the Company. 5 A certain amount means ten million yen per year for an individual and over 2% of total revenue for an organization. 6 A certain amount means over ten million yen per year. 7 A major lender of the Company means a lender from which an amount exceeding 2% of total consolidated assets of
Management Policies
8

the Company is borrowed. 8 An important person who executes business means a director (excluding outside directors) or a person in the senior
management position of general manager or above.
Management Policies
9

2010 2011 2012 2013
For the Year:
Net sales.............................................................................. ¥ 335,641 ¥ 341,886 ¥ 304,653 ¥ 292,411
Cost of sales........................................................................ 229,831 219,150 209,046 213,276
Selling, general and administrative expenses..................... 87,000 89,999 89,254 80,056
Operating income (loss)...................................................... 18,810 32,737 6,353 (921 )
Income (loss) before income taxes...................................... 10,836 19,400 (2,697 ) (52,414 )
Income taxes....................................................................... 4,001 9,524 13,374 10
Net income (loss) attributable to owners of the parent....... 7,134 9,633 (16,107 ) (52,464 )
Capital expenditures............................................................ 30,216 40,042 51,117 42,818
Depreciation and amortization............................................ 48,446 39,019 34,925 38,857
Per Share Information (in Yen and U.S. Dollars):
Basic net income (loss)....................................................... ¥ 65.10 ¥ 88.07 ¥ (149.41 ) ¥ (486.63 )
Diluted net income..............................................................
Cash dividends applicable to the year................................. 130.00 130.00 60.00 30.00
At Year-End:
Current assets...................................................................... ¥ 462,435 ¥ 436,247 ¥ 434,457 ¥ 423,064
Current liabilities................................................................. 68,850 64,334 74,337 55,750
Equity.................................................................................. 707,719 668,779 634,280 613,647
Total assets.......................................................................... 807,340 759,989 737,326 699,014
Number of employees......................................................... 21,005 21,560 21,295 20,203
Notes: 1. U.S. Dollar amounts are provided solely for convenience at the rate of ¥109 to U.S. $1, the approximate exchange rate at March 31, 2020. 2. Certain reclassifications of previously reported amounts have been made to conform with the classifications in the 2020 financial statements.3. Diluted net income per share for 2019, 2018, 2017, 2016, 2015, 2014, 2011 and 2010 is not disclosed because there were no outstanding
potentially dilutive securities and ROHM CO., LTD., was in a net loss position for the years ended March 31, 2013 and 2012.4. Effective April 1, 2010, ROHM CO., LTD., and its consolidated subsidiaries applied a new accounting standard for asset retirement obligations.
The effect of this change was to decrease “Operating Income” by ¥73 million and “Income before income taxes” by ¥784 million for the yearended March 31, 2011.
5. From the beginning of the year ended March 31, 2019, we are applying the Partial Amendments to Accounting Standards for Tax EffectAccounting (Accounting Standards Board of Japan Statement No.28, February 16, 2018). As a result, deferred tax assets appear under investments and other assets, and deferred tax liabilities appear under non-current liabilities.
Eleven-Year Summary
10

Millions of Yen Thousands ofU.S. Dollars
2014 2015 2016 2017 2018 2019 2020 2020
¥ 331,088 ¥ 362,773 ¥ 352,398 ¥ 352,010 ¥ 397,107 ¥ 398,989 ¥ 362,885 $ 3,329,220
227,015 235,043 230,663 234,967 252,592 254,727 251,126 2,303,908
80,437 88,929 88,100 85,215 87,510 88,353 82,269 754,762
23,636 38,801 33,635 31,828 57,005 55,909 29,490 270,550
40,179 55,240 31,537 32,378 46,513 60,923 38,018 348,789
8,056 9,898 5,835 5,928 9,248 15,454 12,362 113,413
32,092 45,297 25,686 26,432 37,249 45,442 25,633 235,165
31,755 48,739 56,687 42,183 55,911 57,291 38,942 357,266
25,560 34,467 38,338 40,801 43,407 45,416 44,328 406,679
¥ 297.65 ¥ 420.16 ¥ 241.91 ¥ 249.88 ¥ 352.14 ¥ 431.29 ¥ 247.66 $ 2.27
244.90 2.25
50.00 130.00 130.00 130.00 240.00 150.00 150.00 1.38
¥ 461,746 ¥ 523,376 ¥ 473,570 ¥ 495,958 ¥ 504,183 ¥ 511,002 ¥ 517,888 $ 4,751,266
52,955 69,660 62,352 69,050 78,056 76,174 62,368 572,183
663,388 752,434 706,251 725,453 751,878 766,754 715,479 6,564,028
754,408 864,380 804,134 834,504 864,072 874,428 848,873 7,787,826
19,985 20,843 21,171 21,308 23,120 22,899 22,191
Eleven-Year Summary
11

ASSETSMillions of
Yen
Thousands ofU.S. Dollars
(Note 1)
2020 2019 2020
Current Assets:Cash and cash equivalents (Note 15)....................................... ¥ 275,540 ¥ 228,065 $ 2,527,890Marketable securities (Notes 5 and 15)................................... 7,626 10,901 69,963Short-term investments (Notes 6 and 15)................................ 32,558 50,779 298,697Notes and accounts receivable (Note 15):
Trade.................................................................................... 80,433 89,836 737,917Unconsolidated subsidiaries and associated companies...... 6 19 55Other.................................................................................... 2,591 3,068 23,771Allowance for doubtful accounts......................................... (124 ) (70 ) (1,137 )
Inventories (Note 7)................................................................. 111,723 120,968 1,024,982Income taxes receivable (Note 15).......................................... 488 481 4,477Prepaid expenses and other...................................................... 7,047 6,955 64,651
Total current assets.............................................................. 517,888 511,002 4,751,266
Property, Plant and Equipment:Land (Note 8).......................................................................... 66,594 66,973 610,954Buildings and structures (Note 8)........................................... 241,086 241,974 2,211,798Machinery, equipment and vehicles (Notes 8)........................ 586,018 583,155 5,376,312Furniture and fixtures (Notes 8).............................................. 51,268 52,054 470,349Construction in progress (Note 8)........................................... 26,207 22,334 240,431Other (Notes 8)........................................................................ 4,037 37,037
Total..................................................................................... 975,210 966,490 8,946,881Accumulated depreciation....................................................... (731,426 ) (714,845 ) (6,710,330 )
Net property, plant and equipment...................................... 243,784 251,645 2,236,551
Investments and Other Assets:Investment securities (Notes 5 and 15)................................... 65,558 87,003 601,450Investments in and advances to unconsolidated subsidiaries and associated companies (Note 15)....................................... 680 680 6,238Asset for retirement benefits (Note 10)................................... 1,341 1,772 12,303Goodwill (Note 8).................................................................... 1,392 12,771Other intangible assets (Note 8)............................................... 3,208 4,098 29,431Deferred tax assets (Note 14).................................................. 4,863 6,718 44,615Other........................................................................................ 10,232 12,213 93,871Allowance for doubtful accounts............................................. (73 ) (703 ) (670 )
Total investments and other assets....................................... 87,201 111,781 800,009Total.............................................................................................................. ¥ 848,873 ¥ 874,428 $ 7,787,826
See notes to consolidated financial statements.
Consolidated Balance Sheet
12

LIABILITIES AND EQUITYMillions of
Yen
Thousands ofU.S. Dollars
(Note 1)
2020 2019 2020
Current Liabilities:Notes and accounts payable (Note 15):
Trade.................................................................................... ¥ 14,863 ¥ 16,126 $ 136,358Construction and other......................................................... 24,066 30,691 220,789
Income taxes payable (Note 15).............................................. 3,990 8,138 36,605Accrued expenses.................................................................... 15,065 17,689 138,211Other (Note 9).......................................................................... 4,384 3,530 40,220
Total current liabilities......................................................... 62,368 76,174 572,183
Long-term Liabilities:Bonds (Note 9 and 15)............................................................ 40,935 375,550Liability for retirement benefits (Note 10).............................. 10,909 10,689 100,083Deferred tax liabilities (Note 14)............................................ 17,430 19,965 159,909Other (Note 9)......................................................................... 1,752 846 16,073
Total long-term liabilities.................................................... 71,026 31,500 651,615
Commitments and Contingent Liabilities (Notes 16, 17 and 18)
Equity (Notes 11, 19 and 21):Common stock―authorized, 300,000,000 shares
issued, 110,000,000 shares.......................... 86,969 86,969 797,881Capital surplus......................................................................... 102,404 102,404 939,486Retained earnings.................................................................... 644,563 634,607 5,913,422Treasury stock―at cost 10,504,865 shares in 2020
and 5,493,365 shares in 2019...................... (88,726 ) (47,431 ) (814,000 )Accumulated other comprehensive income
Unrealized gain on available-for-sale securities (Note 5)... 22,015 28,850 201,972Foreign currency translation adjustments............................ (47,518 ) (35,487 ) (435,945 )Accumulated adjustments for retirement benefits(Note 10).............................................................................. (4,716 ) (3,645 ) (43,266 )
Total................................................................................. 714,991 766,267 6,559,550Noncontrolling interests.......................................................... 488 487 4,478
Total equity...................................................................... 715,479 766,754 6,564,028Total.............................................................................................................. ¥ 848,873 ¥ 874,428 $ 7,787,826
Consolidated Balance Sheet
13

Millions ofYen
Thousands ofU.S. Dollars
(Note 1)
2020 2019 2018 2020
Net Sales............................................................................................ ¥ 362,885 ¥ 398,989 ¥ 397,107 $ 3,329,220Cost of sales...................................................................................... 251,126 254,727 252,592 2,303,908
Gross profit................................................................................. 111,759 144,262 144,515 1,025,312Selling, general and administrative expenses(Notes 12 and 13).............................................................................. 82,269 88,353 87,510 754,762
Operating Income...................................................................... 29,490 55,909 57,005 270,550
Other Income (Expenses):Interest and dividend income....................................................... 4,858 4,825 3,861 44,569Foreign currency exchange gains (losses)―net........................... 401 3,927 (7,248 ) 3,679Settlement package....................................................................... (163 ) (1,201 ) (213 ) (1,495 )Gain on sales of property, plant and equipment........................... 352 138 502 3,229Loss on sales and disposal of property, plant and equipment..................................................................................... (511 ) (378 ) (742 ) (4,688 )Loss on impairment of long-lived assets (Note 8)....................... (430 ) (1,398 ) (7,047 ) (3,945 )Loss on impairment of investment securities (Note 5)................ (936 ) (1 ) (82 ) (8,587 )Gain on sales of investment securities (Note 4)........................... 5,020 222 0 46,055Loss on business liquidation........................................................ (254 )Special severance benefits (Note 10)........................................... (1,251 ) (2,094 ) (332 ) (11,477 )Other―net................................................................................... 1,188 1,228 809 10,899
Total other income (expenses)―net.................................... 8,528 5,014 (10,492 ) 78,239Income before Income Taxes.......................................................... 38,018 60,923 46,513 348,789
Income Taxes (Note 14):Current......................................................................................... 9,822 16,480 13,573 90,110Deferred....................................................................................... 2,540 (1,026 ) (4,325 ) 23,303
Total income taxes............................................................... 12,362 15,454 9,248 113,413Net Income........................................................................................ 25,656 45,469 37,265 235,376Net Income Attributable to Noncontrolling Interests................... (23 ) (27 ) (16 ) (211 )Net Income Attributable to Owners of the Parent....................... ¥ 25,633 ¥ 45,442 ¥ 37,249 $ 235,165
Yen U.S. DollarsPer Share Information (Note 2. (s) and 20):
Basic net income.......................................................................... ¥ 247.66 ¥ 431.29 ¥ 352.14 $ 2.27Diluted net income....................................................................... 244.90 2.25Cash dividends applicable to the year.......................................... 150.00 150.00 240.00 1.38
See notes to consolidated financial statements.
Consolidated Statement of Income
14

Millions ofYen
Thousands ofU.S. Dollars
(Note 1)
2020 2019 2018 2020
Net Income........................................................................................ ¥ 25,656 ¥ 45,469 ¥ 37,265 $ 235,376
Other Comprehensive Income (loss) (Note 19):Unrealized gain (loss) on available-for-sale securities................ (6,835 ) (5,082 ) 8,493 (62,706 )Foreign currency translation adjustments.................................... (12,024 ) 5,190 248 (110,312 )Adjustments for retirement benefits............................................. (1,071 ) (69 ) 1,587 (9,826 )
Total other comprehensive income (loss)............................. (19,930 ) 39 10,328 (182,844 )
Comprehensive Income................................................................... ¥ 5,726 ¥ 45,508 ¥ 47,593 $ 52,532
Total Comprehensive Income Attributable to:Owners of the parent.................................................................... ¥ 5,696 ¥ 45,471 ¥ 47,605 $ 52,257Noncontrolling interests............................................................... 30 37 (12 ) 275
See notes to consolidated financial statements.
Consolidated Statement of Comprehensive Income
15

Millions of Yen
Number of shares of
common stock outstanding
Common stock
Capital surplus
Retained earnings
Treasury stock
Accumulated other comprehensive income
Total Noncontrolling interests Total equity
Unrealized gain on
available-for -sale securities
Foreign currency
translation adjustments
Accumulated adjustments
for retirement benefits
Balance at April 1, 2017..................... 105,775,185 ¥ 86,969 ¥ 102,404 ¥ 604,057 ¥ (47,778 ) ¥ 25,439 ¥ (40,942) ¥ (5,163 ) ¥ 724,986 ¥ 467 ¥ 725,453
Net income attributable to owners of the parent.......................................... 37,249 37,249 37,249
Cash dividends, ¥200.00 per share.... (21,154 ) (21,154 ) (21,154 )
Purchase of treasury stock................. (1,033 ) (10 ) (10 ) (10 )
Disposal of treasury stock................. 11 0 0 0
Net change in the year....................... 8,493 275 1,587 10,355 (15) 10,340
Balance at March 31, 2018................ 105,774,163 86,969 102,404 620,152 (47,788 ) 33,932 (40,667 ) (3,576 ) 751,426 452 751,878 Net income attributable to owners of the parent........................................... 45,442 45,442 45,442 Cash dividends, ¥195.00 per share.... (20,626 ) (20,626 ) (20,626 )
Purchase of treasury stock................. (1,267,565 ) (10,004 ) (10,004 ) (10,004 )
Disposal of treasury stock................. 37 (0 ) 0 0 0
Retirement of treasury stock............. (10,361 ) 10,361 Transfer from retained earnings to capital surplus.................................... 10,361 (10,361 )
Net change in the year....................... (5,082 ) 5,180 (69) 29 35 64
Balance at March 31, 2019................ 104,506,635 86,969 102,404 634,607 (47,431 ) 28,850 (35,487 ) (3,645 ) 766,267 487 766,754 Net income attributable to owners of the parent........................................... 25,633 25,633 25,633
Cash dividends, ¥150.00 per share.... (15,677 ) (15,677 ) (15,677 )
Purchase of treasury stock................. (5,011,500 ) (41,295 ) (41,295 ) (41,295 )
Net change in the year....................... (6,835 ) (12,031 ) (1,071 ) (19,937 ) 1 (19,936 )
Balance at March 31, 2020................ 99,495,135 ¥ 86,969 ¥ 102,404 ¥ 644,563 ¥ (88,726 ) ¥ 22,015 ¥ (47,518) ¥ (4,716 ) ¥ 714,991 ¥ 488 ¥ 715,479
Thousands of U.S. Dollars (Note 1)
Common stock
Capital surplus
Retained earnings
Treasury stock
Accumulated other comprehensive income
Total Noncontrolling interests Total equity
Unrealized
gain on available-for
-sale securities
Foreign currency
translation adjustments
Accumulated adjustments
for retirement benefits
Balance at March 31, 2019......................................... $ 797,881 $ 939,486 $ 5,822,083 $ (435,147 ) $ 264,679 $ (325,569 ) $ (33,440 ) $ 7,029,973 $ 4,468 $ 7,034,441
Net income attributable to owners of the parent......... 235,165 235,165 235,165
Cash dividends, $ 1.38 per share................................ (143,826 ) (143,826 ) (143,826 )
Purchase of treasury stock.......................................... (378,853 ) (378,853 ) (378,853 )
Net change in the year................................................. (62,707 ) (110,376 ) (9,826 ) (182,909 ) 10 (182,899 )
Balance at March 31, 2020......................................... $ 797,881 $ 939,486 $ 5,913,422 $ (814,000 ) $ 201,972 $ (435,945 ) $ (43,266 ) $ 6,559,550 $ 4,478 $ 6,564,028
See notes to consolidated financial statements.
Consolidated Statement of Changes in Equity
16

Millions of Yen
Thousands of U.S. Dollars
(Note 1)
2020 2019 2018 2020
Operating Activities: Income before income taxes.................................................................. ¥ 38,018 ¥ 60,923 ¥ 46,513 $ 348,789 Adjustments for:
Income taxes – paid............................................................................ (12,954 ) (19,180 ) (6,153 ) (118,844 ) Depreciation and amortization........................................................... 44,328 45,416 43,407 406,679 Amortization of goodwill................................................................... 99 392 908 (Decrease) increase in allowance for doubtful accounts..................... (572 ) (313 ) 148 (5,248 ) Gain on sales of property, plant and equipment―net........................ (290 ) (80 ) (424 ) (2,661 ) Gain on sales of short-term and long-term investment securities (Note 4)............................................................................................... (5,020 ) (222 ) (0 ) (46,055 ) Foreign currency exchange losses (gains)―net................................. 1,544 (1,340 ) 1,582 14,165 (Decrease) increase in liability for retirement benefits....................... (833 ) 467 496 (7,642 ) Decrease in asset for retirement benefits............................................ 121 350 151 1,110 Special severance benefits.................................................................. 1,251 2,094 332 11,477 Loss on impairment of long-lived assets............................................. 430 1,398 7,047 3,945 Loss on impairment of investment securities and investments in unconsolidated subsidiaries and associated companies...................... 936 1 82 8,587 Changes in assets and liabilities:
Decrease (increase) in notes and accounts receivable – trade........ 8,150 1,275 (9,434 ) 74,771 Decrease (increase) in inventories.................................................. 7,091 (21,847 ) (11,737 ) 65,055 Decrease in notes and accounts payable – trade............................ (703 ) (2,764 ) (1,430 ) (6,450 ) Increase (decrease) in accounts payable – other............................ 164 (1,706 ) 513 1,505
Other―net......................................................................................... (2,629 ) 1,519 3,242 (24,119 )
Total adjustments....................................................................... 41,113 5,068 28,214 377,183
Net cash provided by operating activities...................................... 79,131 65,991 74,727 725,972
Investing Activities: Decrease (increase) in time deposits―net............................................ 17,737 (3,358 ) 10,469 162,725 Purchases of marketable and investment securities.............................. (6,909 ) (13,404 ) (19,363 ) (63,385 ) Proceeds from sales and redemption of marketable and investment securities............................................................................................... 25,422 20,550 5,219 233,229 Purchases of property, plant and equipment......................................... (41,880 ) (54,273 ) (49,863 ) (384,220 ) Proceeds from sales of property, plant and equipment........................ 653 157 1,006 5,991 Other―net............................................................................................ (3,698 ) (3,670 ) (1,986 ) (33,927 )
Net cash used in investing activities............................................. (8,675 ) (53,998 ) (54,518 ) (79,587 )
Financing Activities: Proceeds from issuance of bonds......................................................... 40,918 375,394 Purchase of treasury stock.................................................................... (41,295 ) (10,004 ) (10 ) (378,853 ) Dividends paid...................................................................................... (15,677 ) (20,626 ) (21,154 ) (143,826 ) Other―net............................................................................................ (1,022 ) (18 ) (23 ) (9,376 )
Net cash used in financing activities............................................ (17,076 ) (30,648 ) (21,187 ) (156,661 )
Foreign Currency Translation Adjustments on Cash and Cash Equivalents................................................................................................ (5,905 ) 2,746 (1,063 ) (54,174 ) Net Increase (Decrease) in Cash and Cash Equivalents........................ 47,475 (15,909 ) (2,041 ) 435,550 Cash and Cash Equivalents at Beginning of Year................................. 228,065 243,974 246,015 2,092,340
Cash and Cash Equivalents at End of Year........................................... ¥ 275,540 ¥ 228,065 ¥ 243,974 $ 2,527,890
See notes to consolidated financial statements.
Consolidated Statement of Cash Flows
17

1. Basis of Presentation of Consolidated Financial StatementsThe accompanying consolidated financial statements have been prepared in accordance with the provisions set forth
in the Japanese Financial Instruments and Exchange Act and its related accounting regulations, and in accordance with accounting principles generally accepted in Japan (“Japanese GAAP”), which are different in certain respects as to application and disclosure requirements of International Financial Reporting Standards (“IFRS”).
In preparing these consolidated financial statements, certain reclassifications and rearrangements have been made to the consolidated financial statements issued domestically in order to present them in a form which is more familiar to readers outside Japan.
In addition, certain reclassifications have been made to the previously reported amounts to conform with current classifications. The consolidated financial statements are stated in Japanese yen, the currency of the country in which ROHM CO., LTD. (the “Company”) is incorporated and operates. The translations of Japanese yen amounts into U.S. dollar amounts are included solely for the convenience of readers outside Japan and have been made at the rate of ¥109 to $1, the approximate rate of exchange at March 31, 2020. Such translations should not be construed as representations that the Japanese yen amounts could be converted into U.S. dollars at that or any other rate.
2. Summary of Significant Accounting Policies(a) Consolidation
The consolidated financial statements as of March 31, 2020, include the accounts of the Company and its 43 (44 in2019) significant subsidiaries (together, the “Group”).
Under the control concept, those companies in which the Company, directly or indirectly, is able to exercise control over operations are fully consolidated.
Investments in unconsolidated subsidiaries and associated companies are stated at cost. If the equity method of accounting had been applied to the investments in these companies, the effect on the accompanying consolidated financial statements would not be material.
The excess of the cost of acquisition over the fair value of the net assets of an acquired subsidiary at the date of acquisition is being amortized over reasonable periods (within 20 years).
All significant intercompany balances and transactions have been eliminated in consolidation. All material unrealized profit included in assets resulting from transactions within the Group is also eliminated.
The fiscal year end date of 6 (7 in 2019) subsidiaries, including ROHM SEMICONDUCTOR CHINA CO., LTD., is December 31, which is different from the consolidated balance sheet date of March 31. For those subsidiaries, the Group consolidates the financial statements as of the provisional closing date of March 31.
(b) Unification of Accounting Policies Applied to Foreign Subsidiaries for the Consolidated Financial StatementsUnder Accounting Standards Board of Japan (“ASBJ”) Practical Issues Task Force (“PITF”) No. 18, “Practical
Solution on Unification of Accounting Policies Applied to Foreign Subsidiaries for the Consolidated Financial Statements,” the accounting policies and procedures applied to a parent company and its subsidiaries for similar transactions and events under similar circumstances should in principle be unified for the preparation of the consolidated financial statements. However, financial statements prepared by foreign subsidiaries in accordance with either IFRS or generally accepted accounting principles in the United States of America tentatively may be used for the consolidation process, except for the following items that should be adjusted in the consolidation process so that net income is accounted for in accordance with Japanese GAAP, unless they are not material: (a) amortization of goodwill; (b) scheduled amortization of actuarial gain or loss of pensions that has been recorded in equity through othercomprehensive income; (c) expensing capitalized development costs of R&D; and (d) cancellation of the fair valuemodel of accounting for property, plant and equipment and investment properties and incorporation of the cost modelof accounting.
(c) Cash EquivalentsCash equivalents are short-term investments that are readily convertible into cash and that are exposed to
insignificant risk of changes in value. Cash equivalents include time deposits and certificates of deposit, all of which mature or become due within three months of the date of acquisition.
Notes to Consolidated Financial Statements
18

(d) Marketable and Investment Securities Marketable and investment securities are classified and accounted for, depending on management’s intent, as
available-for-sale securities, which are not classified as either trading securities or held-to-maturity debt securities, and are reported at fair value, with unrealized gains and losses, net of applicable taxes, reported in a separate component of equity.
The Group classifies all marketable and investment securities as available-for-sale securities. Nonmarketable available-for-sale securities are stated at cost, principally determined by the moving-average method. For other-than-temporary declines in fair value, investment securities are reduced to net realizable value by a charge
to income.
(e) Allowance for Doubtful Accounts The allowance for doubtful accounts is stated in amounts considered to be appropriate based on the companies' past
credit loss experience and an evaluation of potential losses in the receivables outstanding.
(f) Inventories Inventories are mainly stated at the lower of cost, determined by the moving-average method for merchandise,
finished products, work in process and raw materials and by the last purchase cost method for supplies, or net selling value.
(g) Property, Plant and Equipment Property, plant and equipment are stated at cost. Depreciation of property, plant and equipment is computed
principally by the declining-balance method based on the estimated useful lives of the assets while the straight-line method is applied to buildings of the Company and its consolidated domestic subsidiaries acquired after April 1, 1998. Right-of-use assets are depreciated by the straight-line method over the respective lease periods.
Estimated useful lives of the assets are principally as follows: Buildings and structures……............…. 3 to 50 years
Machinery, equipment and vehicles....... 2 to 10 years
(h) Intangible Assets Intangible assets are stated at cost less accumulated amortization, which is calculated by the straight-line method.
(i) Long-lived Assets The Group reviews its long-lived assets for impairment whenever events or changes in circumstance indicate the
carrying amount of an asset or asset group may not be recoverable. An impairment loss is recognized if the carrying amount of an asset or asset group exceeds the sum of the undiscounted future cash flows expected to result from the continued use and eventual disposition of the asset or asset group. The impairment loss would be measured as the amount by which the carrying amount of the asset exceeds its recoverable amount, which is the higher of the discounted cash flows from the continued use and eventual disposition of the asset or the net selling price at disposition.
(j) Retirement and Pension Plans The Company and certain consolidated subsidiaries have defined benefit plans for employees, and account for the
liability for retirement benefits based on the projected benefit obligations and plan assets at the balance sheet date. The projected benefit obligations are attributed to the respective periods on a benefit formula basis. Actuarial gains and losses and prior service costs that are yet to be recognized in profit or loss are recognized within equity (accumulated other comprehensive income), after adjusting for tax effects and actuarial gains and losses are amortized on a straight-line basis over 10-13 years within the average remaining service period. Prior service costs are amortized on a straight-line basis over 10-13 years within the average remaining service period. The discount rate is determined using a single weighted-average discount rate reflecting the estimated timing and amount of the benefit payment.
The Company and certain consolidated subsidiaries also have defined contribution pension plans.
Notes to Consolidated Financial Statements
19

(k) Asset Retirement Obligations An asset retirement obligation is recorded for a legal obligation imposed either by law or contract that results from
the acquisition, construction, development and normal operation of a tangible fixed asset and is associated with the retirement of such tangible fixed asset. The asset retirement obligation is recognized as the sum of the discounted cash flows required for the future asset retirement and is recorded in the period in which the obligation is incurred if a reasonable estimate can be made. If a reasonable estimate of the asset retirement obligation cannot be made in the period the asset retirement obligation is incurred, the liability should be recognized when a reasonable estimate of the asset retirement obligation can be made. Upon initial recognition of a liability for an asset retirement obligation, an asset retirement cost is capitalized by increasing the carrying amount of the related fixed asset by the amount of the liability. The asset retirement cost is subsequently allocated to expense through depreciation over the remaining useful life of the asset. Over time, the liability is accreted to its present value each period. Any subsequent revisions to the timing or the amount of the original estimate of undiscounted cash flows are reflected as an adjustment to the carrying amount of the liability and the capitalized amount of the related asset retirement cost.
(l) Research and Development Costs Research and development costs are charged to “Selling, general and administrative expenses” as incurred.
(m) Leases Finance lease transactions are capitalized to recognize right-of-use assets and lease obligations in the balance sheet. All other leases are accounted for as operating leases.
(n) Bonuses to Directors Board Members Bonuses to Directors Board members are accrued at the year-end to which such bonuses are attributable.
(o) Income Taxes The provision for income taxes is computed based on the pretax income included in the consolidated statement of
income. The asset and liability approach is used to recognize deferred tax assets and liabilities for the expected future tax consequences of temporary differences between the carrying amounts and the tax bases of assets and liabilities. Deferred taxes are measured by applying currently enacted tax laws to the temporary differences.
(p) Foreign Currency Transactions All short-term and long-term monetary receivables and payables denominated in foreign currencies are translated
into Japanese yen at exchange rates in effect at the balance sheet date. The foreign exchange gains and losses from translation are recognized in the consolidated statement of income.
(q) Foreign Currency Financial Statements The balance sheet accounts of consolidated foreign subsidiaries are translated into Japanese yen at the current
exchange rates as of the balance sheet date, except for equity, which is translated at the historical rate. Differences arising from such translation were shown as “Foreign currency translation adjustments” under accumulated other comprehensive income in a separate component of equity.
Revenue and expense accounts of consolidated foreign subsidiaries are translated into Japanese yen at the average exchange rates.
(r) Derivatives and Hedging Activities The Group uses derivative financial instruments to manage its exposures to fluctuations in foreign exchange. Foreign
exchange forward contracts are utilized by the Group to reduce foreign currency exchange risk. The Group does not enter into derivatives for trading or speculative purposes.
Derivative financial instruments and foreign currency transactions are classified and accounted for as follows: (1) all derivatives are recognized as either assets or liabilities and measured at fair value, and gains or losses on derivative transactions are recognized in the statement of income and (2) for derivatives used for hedging purposes, if derivatives qualify for hedge accounting because of high correlation and effectiveness between the hedging instruments and the hedged items, gains or losses on derivatives are deferred until maturity of the hedged transactions.
Notes to Consolidated Financial Statements
20
(s) Per Share Information Basic net income per share is computed by dividing net income available to common shareholders by the weighted-
average number of common shares outstanding for the period, retroactively adjusted for stock splits. The average number of shares used to compute basic net income per share for the years ended March 31, 2020, 2019
and 2018 were 103,359 thousand shares, 105,316 thousand shares and 105,775 thousand shares, respectively. Cash dividends per share presented in the accompanying consolidated statement of income are dividends applicable
to the respective years, including dividends to be paid after the end of the year. Diluted net income per share reflects the potential dilution that could occur if securities were exercised or converted
into common stock. Diluted net income per share of common stock assumes full conversion of the outstanding convertible notes and bonds at the beginning of the year (or at the time of issuance) with an applicable adjustment for related interest expense, net of tax, and full exercise of outstanding warrants.
(t) New Accounting Pronouncements Revenue recognition―On March 30, 2018, the ASBJ issued ASBJ Statement No. 29, “Accounting Standard for
Revenue Recognition,” and ASBJ Guidance No. 30, “Implementation Guidance on Accounting Standard for Revenue Recognition.” The core principle of the standard and guidance is that an entity should recognize revenue to depict the transfer of promised goods or services to customers in an amount that reflects the consideration to which the entity expects to be entitled in exchange for those goods or services. An entity should recognize revenue in accordance with that core principle by applying the following steps:
Step 1: Identify the contracts with a customer Step 2: Identify the performance obligations in the contract Step 3: Determine the transaction price Step 4: Allocate the transaction price to the performance obligations in the contract Step 5: Recognize revenue when (or as) the entity satisfies a performance obligation
The accounting standard and guidance are effective for annual periods beginning on or after April 1, 2021. Earlier application is permitted for annual periods beginning on or after April 1, 2018.
The Group expects to apply the accounting standard and guidance for annual periods beginning on or after April 1, 2021, and is in the process of measuring the effects of applying the accounting standard and guidance in future applicable periods.
Fair value measurement―On July 4, 2019, the ASBJ issued ASBJ Statement No. 30, "Accounting Standard for Fair Value Measurement" and ASBJ Guidance No. 31, "Implementation Guidance on Accounting Standard for Fair Value Measurement," and revised related ASBJ Statements and ASBJ Guidance (the "New Accounting Standards"). Under the New Accounting Standards, nonmarketable available-for-sale equity securities are stated at cost, while under the current accounting standards, nonmarketable available-for-sale securities are stated at cost. The New Accounting Standards are effective for the annual periods beginning on or after April 1, 2021.
Notes to Consolidated Financial Statements
21

3. Change in Accounting Policy IFRS 16 Leases―Japanese GAAP allows an entity to use IFRS or the accounting principles generally accepted in
the United States of America ("US GAAP") to prepare the financial statements of its subsidiaries located in foreign countries for group reporting purposes. As such, the Company has adopted IFRS 16 for some foreign consolidated subsidiaries of the Company from the current fiscal year and recognized the cumulative effects of initially applying the standard as an adjustments to the opening balance of retained earnings of the current fiscal year following the transition requirements.
The standard introduces a single lease accounting model and in principal requires that the right-of-use assets representing the right to use an underlying asset and lease liabilities representing the obligation to make lease payments be recognized on the consolidated balance sheet for all leases. The standard also requires that depreciation of the right-of-use assets and interests on the lease liabilities be recognized in the consolidated statement of income.
As a result of applying the standard, as of March 31, 2020, assets and liabilities increased by ¥2,156 million ($19,780 thousand) and ¥2,294 million ($21,046 thousand), respectively. The impact on the opening balance of retained earnings was immaterial.
4. Changes in Presentation Prior to April 1, 2019, “Gain on sales of investment securities” was included in “Other―net” among the other
income (expenses) section of the consolidated statement of income. Since the amount became quantitatively material during this fiscal year ended March 31, 2020, such amount is disclosed separately in the other income (expenses) section of the consolidated statement of income for the year ended March 31, 2020. In accordance with this change in presentation, the consolidated statement of income for the years ended March 31, 2019 and 2018, have been reclassified. The amounts included in “Other―net” for the years ended March 31, 2019 and 2018, were ¥222 million of increase and ¥0 million of increase, respectively.
Prior to April 1, 2019, “Gain on sales of short-term and long-term investment securities” was included in “Other―net” among the operating activities section of the consolidated statement of cash flows. Since the amount became quantitatively material during this fiscal year ended March 31, 2020, such amount is disclosed separately in the operating activities section of the consolidated statement of cash flows for the year ended March 31, 2020. In accordance with this change in presentation, the consolidated statement of cash flows for the years ended March 31, 2019 and 2018, have been reclassified. The amounts included in “Other―net” for the years ended March 31, 2019 and 2018, were ¥222 million of decrease and ¥0 million of decrease, respectively.
5. Marketable and Investment Securities Marketable and investment securities as of March 31, 2020 and 2019, consisted of the following:
Millions of Yen Thousands of U.S. Dollars
2020 2019 2020 Current:
Government and corporate bonds............................................. ¥ 7,572 ¥ 10,874 $ 69,468 Other.......................................................................................... 54 27 495
Total...................................................................................... ¥ 7,626 ¥ 10,901 $ 69,963
Millions of Yen Thousands of U.S. Dollars
2020 2019 2020 Non Current:
Marketable equity securities..................................................... ¥ 46,484 ¥ 62,782 $ 426,459 Government and corporate bonds............................................. 18,809 22,748 172,560 Other.......................................................................................... 265 1,473 2,431
Total...................................................................................... ¥ 65,558 ¥ 87,003 $ 601,450
Notes to Consolidated Financial Statements
22

The costs and aggregate fair values of marketable and investment securities at March 31, 2020 and 2019, were as follows: Millions of Yen 2020
Securities classified as: Available-for-sale:
Cost Unrealized
gains Unrealized
losses Fair Value
Equity securities......................................... ¥ 15,020 ¥ 31,532 ¥ (68 ) ¥ 46,484 Debt securities............................................ 26,374 206 (199 ) 26,381 Other........................................................... 54 (0 ) 54
Total........................................................ ¥ 41,448 ¥ 31,738 ¥ (267 ) ¥ 72,919
Millions of Yen 2019
Securities classified as: Available-for-sale:
Cost Unrealized
gains Unrealized
losses Fair Value
Equity securities......................................... ¥ 21,941 ¥ 40,976 ¥ (135 ) ¥ 62,782 Debt securities............................................ 33,390 367 (135 ) 33,622 Other........................................................... 947 260 (19 ) 1,188
Total........................................................ ¥ 56,278 ¥ 41,603 ¥ (289 ) ¥ 97,592
Thousands of U.S. Dollars 2020
Securities classified as: Available-for-sale:
Cost Unrealized
gains Unrealized
losses Fair Value
Equity securities......................................... $ 137,799 $ 289,284 $ (624 ) $ 426,459 Debt securities............................................ 241,964 1,890 (1,826 ) 242,028 Other........................................................... 495 (0 ) 495
Total........................................................ $ 380,258 $ 291,174 $ (2,450 ) $ 668,982
Any marketable and investment securities whose fair values cannot be readily determinable are not included in the table above.
The proceeds, realized gains and realized losses of the available-for-sale securities, which were sold during the years ended March 31, 2020, 2019 and 2018, were as follows: Millions of Yen 2020
Available-for-sale: Proceeds Realized
gains Realized
losses
Equity securities....................................................................... ¥ 10,801 ¥ 5,096 ¥ (319 ) Other......................................................................................... 1,161 266 (23 )
Total...................................................................................... ¥ 11,962 ¥ 5,362 ¥ (342 )
Millions of Yen 2019
Available-for-sale: Proceeds Realized
gains Realized
losses
Equity securities........................................................................ ¥ 727 ¥ 222 ¥ (0 )
Total...................................................................................... ¥ 727 ¥ 222 ¥ (0 )
Notes to Consolidated Financial Statements
23

Millions of Yen 2018
Available-for-sale: Proceeds Realized
gains Realized
losses
Equity securities........................................................................ ¥ 0 ¥ 0
Total...................................................................................... ¥ 0 ¥ 0
Thousands of U.S. Dollars 2020
Available-for-sale: Proceeds Realized
gains Realized
losses
Equity securities....................................................................... $ 99,092 $ 46,752 $ (2,927 ) Other......................................................................................... 10,651 2,441 (211 )
Total...................................................................................... $ 109,743 $ 49,193 $ (3,138 )
The losses on valuation of available-for-sale securities for the years ended March 31, 2020, 2019 and 2018, were ¥936 million ($8,587 thousand), ¥1 million and ¥82 million, respectively.
6. Short-term Investments Short-term investments at March 31, 2020 and 2019, consisted of time deposits.
7. Inventories Inventories at March 31, 2020 and 2019, consisted of the following:
Millions of Yen Thousands of U.S. Dollars
2020 2019 2020 Merchandise and finished products............................................... ¥ 27,617 ¥ 30,262 $ 253,367 Work in process............................................................................. 48,352 56,592 443,596 Raw materials and supplies........................................................... 35,754 34,114 328,019
Total.......................................................................................... ¥ 111,723 ¥ 120,968 $ 1,024,982
8. Long-lived Assets The Group reviewed its long-lived assets for impairment during the years ended March 31, 2020, 2019 and 2018. In
recognizing impairment loss on fixed assets held for use, the Group identifies asset groups according to the units of management accounting for which revenue and expenditures are managed on a continuous basis, and for idle assets, each property is deemed an asset group. As a result, the Group recognized an impairment loss of ¥430 million ($3,945 thousand), ¥1,398 million and ¥7,047 million as other expense for the years ended March 31, 2020, 2019 and 2018, respectively.
The components of impairment loss for the year ended March 31, 2020 were as follows: (a) The Group recognized an impairment loss of ¥180 million ($1,651 thousand) for assets held for use located in
Thailand, United States of America, and Japan as the estimated future cash flows fell below the carrying amounts of some asset groups due to the deterioration of the revenue environment. The carrying amounts of the relevant assets held for use were reduced to the recoverable amounts which were measured at their value in use, using the discount rate of 10.1% for computation of present value of future cash flows or measured at their net selling value which were based on a reasonable estimation in consideration of market value.
(b) The Group recognized an impairment loss of ¥250 million ($2,294 thousand) for idle assets located in Japan, the Philippines, Thailand and China, and determined that the idle assets were not likely to be used in the future. The carrying amounts of the relevant idle assets were written down to their recoverable amounts. The recoverable amounts were measured at their net selling value which were based on reasonable estimations in consideration of market value of the relevant assets.
Notes to Consolidated Financial Statements
24

The components of impairment loss for the year ended March 31, 2019 were as follows: (a) The Group recognized an impairment loss of ¥1,069 million for assets held for use located in United States of
America, Thailand and Japan as the estimated future cash flows fell below the carrying amounts of some asset groups due to the deterioration of the revenue environment. The carrying amounts of the relevant assets held for use were reduced to the recoverable amounts which were measured at their value in use, using the discount rate of 9.0% for computation of present value of future cash flows or measured at their net selling value which were based on a reasonable estimation in consideration of market value.
(b) The Group recognized an impairment loss of ¥329 million for idle assets located in Japan, the Philippines, Thailand and China, and determined that the idle assets were not likely to be used in the future. The carrying amounts of the relevant idle assets were written down to their recoverable amounts. The recoverable amounts were measured at their net selling value which were based on reasonable estimations in consideration of market value of the relevant assets.
The components of impairment loss for the year ended March 31, 2018 were as follows: (a) The Group recognized an impairment loss of ¥6,697 million for assets held for use located in Ireland since the
Group estimated that they likely generate profit less than expected at the time of the business acquisition. The carrying amounts of the relevant goodwill and other intangible assets were reduced to the recoverable amounts, which were based on third-party assessment.
(b) The Group recognized an impairment loss of ¥350 million for idle assets located in Japan, the Philippines, Thailand and China, and determined that the idle assets were not likely to be used in the future. The carrying amounts of the relevant idle assets were written down to their recoverable amounts. The recoverable amounts were measured at their net selling value which were based on reasonable estimations in consideration of market value of the relevant assets.
9. Short-term Debt and Long-term Debt Short-term debt and long-term debt at March 31, 2020 and 2019, consisted of the following:
Millions of Yen Thousands of U.S. Dollars Yield Due date
2020 2019 2020 2020 2020 Current portion of lease liabilities....................... ¥ 872 ¥ 19 $ 8,000 4.3%
Zero coupon Convertible Bonds due 2024.......... 40,935 375,550 December 2024
Lease liabilities(Excluding current portion)...... 1,418 32 13,009 4.1% From April 2021
to December 2028 Total............................................................... ¥ 43,225 ¥ 51 $ 396,559
The details of the convertible bonds were as follows:
Zero Coupon Convertible Bonds due 2024
Class of shares to be issued.................... Common stock Issue price of stock acquisition rights.... Zero Initial conversion price.......................... ¥ 13,593 ($ 125) Total issue price..................................... ¥ 40,000 million ($ 366,972 thousand) Conversion ratio..................................... 100%
Exercise period....................................... December 19, 2019, through November 21, 2024
If all the outstanding stock acquisition rights in convertible bonds had been exercised at March 31, 2020, 2,942,691 shares of common stock would have been issued. The conversion price is subject to reflect stock splits and certain other events.
Notes to Consolidated Financial Statements
25

Annual maturities of long-term debt as of March 31, 2020 for the next five years were as follows:
Millions of Yen
Due after
1 year through 2 years
Due after
2 years through 3 years
Due after
3 years through 4 years
Due after
4 years through 5 years
Zero coupon Convertible Bonds due 2024.......... ¥ 40,000 Lease liabilities(Excluding current portion)...... ¥ 705 ¥ 329 ¥ 164 118
Total............................................................... ¥ 705 ¥ 329 ¥ 164 ¥ 40,118
Thousands of U.S. Dollars
Due after
1 year through 2 years
Due after
2 years through 3 years
Due after
3 years through 4 years
Due after
4 years through 5 years
Zero coupon Convertible Bonds due 2024.......... $ 366,972 Lease liabilities(Excluding current portion)...... $ 6,468 $ 3,018 $ 1,505 1,083
Total............................................................... $ 6,468 $ 3,018 $ 1,505 $ 368,055
10. Retirement and Pension Plans The Company and certain domestic consolidated subsidiaries have a defined benefit pension plan, termination
allowance plan and defined contribution plan for employees. The defined benefit plan (funded type plan) provides lump-sum and annuity payments calculated by the cumulative
number of points to be given mainly based on official position, as well as rank and length of service. In addition, certain domestic consolidated subsidiaries have cash balance plans. Under the cash balance plans, the amount of pension benefits on each employee's personal account are calculated based on points given depending on official position and rank of employee, and points determined based on the revaluation rate of the plans. Under the termination allowance plan (unfunded type plan), lump-sum payments are calculated by the cumulative number of points given based on official position and rank.
Certain foreign consolidated subsidiaries have a defined benefit plan (funded or unfunded type plan) and a defined contribution plan. Under the defined benefit plan (funded or unfunded type plan), lump-sum and annuity payments are calculated by salary and length of service.
(1) The changes in defined benefit obligation for the years ended March 31 2020 and 2019, were as follows:
Millions of Yen Thousands of U.S. Dollars
2020 2019 2020 Balance at beginning of year......................................................... ¥ 41,577 ¥ 39,346 $ 381,440
Current service cost.................................................................. 2,750 2,645 25,229 Interest cost............................................................................... 326 346 2,991 Actuarial losses......................................................................... 1,085 605 9,954 Benefits paid............................................................................. (3,191 ) (1,415 ) (29,275 ) Prior service cost...................................................................... 332 3,046 Others........................................................................................ (194 ) 51 (1,780 )
Balance at end of year................................................................... ¥ 42,685 ¥ 41,578 $ 391,605
Notes to Consolidated Financial Statements
26

(2) The changes in plan assets for the years ended March 31 2020 and 2019, were as follows:
Millions of Yen Thousands of U.S. Dollars
2020 2019 2020 Balance at beginning of year......................................................... ¥ 32,661 ¥ 31,283 $ 299,642
Expected return on plan assets................................................. 822 817 7,541 Actuarial losses........................................................................ (695 ) (367 ) (6,376 ) Contributions from the employer............................................ 1,880 1,875 17,248 Benefits paid............................................................................ (1,416 ) (1,022 ) (12,991 ) Others....................................................................................... (134 ) 75 (1,229 )
Balance at end of year................................................................... ¥ 33,118 ¥ 32,661 $ 303,835
(3) Reconciliation between the liability recorded in the consolidated balance sheet and the balances of defined benefit obligation and plan assets were as follows:
Millions of Yen Thousands of U.S. Dollars
2020 2019 2020 Funded defined benefit obligation.............................................. ¥ 33,036 ¥ 31,377 $ 303,083 Plan assets................................................................................... (33,118 ) (32,661 ) (303,835 ) (82 ) (1,284 ) (752 )
Unfunded defined benefit obligation........................................... 9,650 10,201 88,532 Net liability arising from defined benefit obligation................... ¥ 9,568 ¥ 8,917 $ 87,780
Millions of Yen Thousands of U.S. Dollars
2020 2019 2020 Liability for retirement benefits................................................... ¥ 10,909 ¥ 10,689 $ 100,083 Asset for retirement benefits........................................................ (1,341 ) (1,772 ) (12,303 ) Net liability arising from defined benefit obligation................... ¥ 9,568 ¥ 8,917 $ 87,780
(4) The components of net periodic benefit costs for the years ended March 31, 2020, 2019 and 2018, were as follows:
Millions of Yen Thousands of U.S. Dollars
2020 2019 2018 2020 Service cost................................................... ¥ 2,750 ¥ 2,645 ¥ 2,605 $ 25,229 Interest cost................................................... 326 346 335 2,991 Expected return on plan assets...................... (822 ) (817 ) (707 ) (7,541 ) Recognized actuarial losses........................... 466 729 1,148 4,275 Amortization of prior service cost................ 211 175 183 1,936
Net periodic benefit costs......................... ¥ 2,931 ¥ 3,078 ¥ 3,564 $ 26,890
In addition to the above net periodic benefit costs, the costs for the defined contribution pension plan recorded as operating expense were ¥816 million ($7,486 thousand), ¥808 million and ¥740 million for the years ended March 31, 2020, 2019 and 2018, respectively. The Group also recorded “Special severance benefits” for the year ended March 31, 2020, 2019 and 2018, in the amount of ¥1,251 million ($11,477 thousand), ¥2,094 million and ¥332 million as other expense.
Notes to Consolidated Financial Statements
27

(5) Amounts recognized in other comprehensive income (before income tax effect) in respect of adjustments for retirement benefits for the years ended March 31, 2020, 2019 and 2018, were as follows:
Millions of Yen Thousands of U.S. Dollars
2020 2019 2018 2020 Prior service cost........................................... ¥ (122 ) ¥ 174 ¥ 175 $ (1,119 ) Actuarial (gains) losses................................. (1,300 ) (242 ) 1,783 (11,927 )
Total........................................................... ¥ (1,422 ) ¥ (68 ) ¥ 1,958 $ (13,046 )
(6) Amounts recognized in accumulated other comprehensive income (before income tax effect) in respect of accumulated adjustments for retirement benefits as of March 31, 2020 and 2019, were as follows:
Millions of Yen Thousands of U.S. Dollars
2020 2019 2020 Unrecognized prior service cost................................................... ¥ (775 ) ¥ (653 ) $ (7,110 ) Unrecognized actuarial (gains) losses.......................................... (5,045 ) (3,745 ) (46,284 )
Total.......................................................................................... ¥ (5,820 ) ¥ (4,398 ) $ (53,394 )
(7) Plan assets (a) Components of plan assets
Plan assets consisted of the following: 2020 2019 Debt investments..................................................................................................... 81% 76%
Equity investments.................................................................................................. 8% 13%
Others....................................................................................................................... 11% 11%
Total..................................................................................................................... 100% 100%
(b) Method of determining the expected rate of return on plan assets The expected rate of return on plan assets is determined considering the long-term rates of return which are
expected currently and in the future from the various components of the plan assets.
(8) Assumptions used for the years ended March 31, 2020, 2019 and 2018, were set forth as follows: 2020 2019 2018 Discount rate................................................................................. 0.0 - 0.2% (0.0)- 0.2% 0.1 - 0.4%
Expected rate of return on plan assets........................................... 2.0 - 2.5% 2.0 - 3.0% 2.0 - 3.0%
The salary increase rate is not reflected in calculation of the projected benefit obligations of the main retirement and pension plans.
Notes to Consolidated Financial Statements
28
11. Equity Japanese companies are subject to the Companies Act of Japan (the “Companies Act”). The significant provisions in
the Companies Act that affect financial and accounting matters are summarized below:
(a) Dividends Under the Companies Act, companies can pay dividends at any time during the fiscal year in addition to the year-end
dividend upon resolution at the general shareholders’ meeting. Additionally, for companies that meet certain criteria including (1) having a Board of Directors, (2) having independent auditors, (3) having an Audit & Supervisory Board, and (4) the term of service of the directors being prescribed as one year rather than the normal two-year term by its articles of incorporation, the Board of Directors may declare dividends (except for dividends-in-kind) at any time during the fiscal year if the company has prescribed so in its articles of incorporation. However, the Company does not meet all the above criteria.
Semiannual interim dividends may also be paid once a year upon resolution by the Board of Directors if the articles of incorporation of the company so stipulate. The Companies Act provides certain limitations on the amounts available for dividends or the purchase of treasury stock. The limitation is defined as the amount available for distribution to the shareholders, but the amount of net assets after dividends must be maintained at no less than ¥3 million.
(b) Increases / decreases and transfer of common stock, reserve and surplus The Companies Act requires that an amount equal to 10% of dividends must be appropriated as a legal reserve (a
component of retained earnings) or as additional paid-in capital (a component of capital surplus) depending on the equity account that was charged upon the payment of such dividends, until the aggregate amount of legal reserve and additional paid-in capital equals 25% of the common stock. Under the Companies Act, the total amount of additional paid-in capital and legal reserve may be reversed without limitation. The Companies Act also provides that common stock, legal reserve, additional paid-in capital, other capital surplus and retained earnings can be transferred among the accounts within equity under certain conditions upon resolution of the shareholders.
(c) Treasury stock and treasury stock acquisition rights The Companies Act also provides for companies to purchase treasury stock and dispose of such treasury stock by
resolution of the Board of Directors. The amount of treasury stock purchased cannot exceed the amount available for distribution to the shareholders which is determined by a specific formula. Under the Companies Act, stock acquisition rights are presented as a separate component of equity. The Companies Act also provides that companies can purchase both treasury stock acquisition rights and treasury stock. Such treasury stock acquisition rights are presented as a separate component of equity or deducted directly from stock acquisition rights.
12. Research and Development Costs Research and development costs charged to income were ¥33,384 million ($306,275 thousand), ¥39,578 million and
¥38,852 million for the years ended March 31, 2020, 2019 and 2018, respectively.
13. Amortization of Goodwill Amortization of goodwill was ¥99 million ($908 thousand) and ¥392 million for the years ended March 31, 2020 and
2018, respectively.There is no relevant information for the year ended March 31, 2019.
14. Income Taxes The Company and its domestic consolidated subsidiaries are subject to Japanese national and local income taxes
which, in the aggregate, resulted in normal effective statutory tax rates of approximately 30.5% for the years ended March 31, 2020 and 2019, and 30.7% for the year ended March 31,2018. Foreign consolidated subsidiaries are subject to income taxes of the countries in which they operate.
Notes to Consolidated Financial Statements
29

The tax effects of significant temporary differences and tax loss carryforwards which resulted in deferred tax assets and liabilities at March 31, 2020 and 2019, were as follows:
Millions of Yen Thousands of U.S. Dollars
2020 2019 2020 Deferred tax assets:
Marketable and investment securities....................................... ¥ 651 ¥ 958 $ 5,972 Inventories................................................................................. 3,835 5,088 35,184 Depreciation and amortization.................................................. 3,909 3,894 35,862 Tax loss carryforwards.............................................................. 14,372 13,910 131,853 Accrued expenses...................................................................... 2,598 2,754 23,835 Liability for retirement benefits................................................ 2,800 2,961 25,688 Loss on impairment of long-lived assets................................... 4,616 5,040 42,349 Investments in subsidiaries and associated companies............. 7,254 7,254 66,550 Others........................................................................................ 3,302 3,637 30,294 Total of tax loss carryforwards and temporary differences....... 43,337 45,496 397,587 Less valuation allowance for tax loss carryforwards................ (13,842 ) (12,731 ) (126,991 ) Less valuation allowance for temporary differences................. (12,898 ) (12,425 ) (118,330 ) Total valuation allowance......................................................... (26,740 ) (25,156 ) (245,321 )
Deferred tax assets........................................................................ 16,597 20,340 152,266
Deferred tax liabilities:
Undistributed earnings of foreign subsidiaries......................... (18,462 ) (19,507 ) (169,376 ) Asset for retirement benefits..................................................... (411 ) (539 ) (3,771 ) Depreciation and amortization.................................................. (497 ) (387 ) (4,560 ) Net unrealized gain on available-for-sale securities................. (9,245 ) (12,445 ) (84,816 ) Other.......................................................................................... (549 ) (709 ) (5,037 )
Deferred tax liabilities................................................................... (29,164 ) (33,587 ) (267,560 )
Net deferred tax liabilities............................................................. ¥ (12,567 ) ¥ (13,247 ) $ (115,294 )
The expiration of tax loss carryforwards, the related valuation allowances and the resulting net deferred tax assets as of March 31, 2020 and 2019 were as follows:
Millions of Yen
2020
1 Year or Less After 1 Year
through 2 Years After 2 Years
through 3 Years After 3 Years
through 4 Years After 4 Years
through 5 Years After 5 Years Total
Deferred tax assets relating to tax loss carryforwards................. ¥ 598 ¥ 1,886 ¥ 1,035 ¥ 114
¥ 640
¥ 10,099
¥ 14,372
Less valuation allowances for tax loss carryforwatds................. (598 ) (1,882 ) (1,032 ) (60 ) (640 ) (9,630 ) (13,842 ) Net deferred tax assets relating to tax loss carryforwards................. ¥ 0 ¥ 4 ¥ 3 ¥ 54
¥ 469
¥ 530
Notes to Consolidated Financial Statements
30

Millions of Yen
2019
1 Year or Less After 1 Year
through 2 Years After 2 Years
through 3 Years After 3 Years
through 4 Years After 4 Years
through 5 Years After 5 Years Total
Deferred tax assets relating to tax loss carryforwards................. ¥ 1,189 ¥ 673 ¥ 1,883 ¥ 1,032
¥ 205
¥ 8,928
¥ 13,910
Less valuation allowances for tax loss carryforwatds................. (853 ) (570 ) (1,810 ) (1,032 ) (162 ) (8,304 ) (12,731 ) Net deferred tax assets relating to tax loss carryforwards................. ¥ 336 ¥ 103 ¥ 73
¥ 43
¥ 624
¥ 1,179
Thousands of U.S. Dollars
2020
1 Year or Less After 1 Year
through 2 Years After 2 Years
through 3 Years After 3 Years
through 4 Years After 4 Years
through 5 Years After 5 Years Total
Deferred tax assets relating to tax loss carryforwards................. $ 5,486 $ 17,303 $ 9,495 $ 1,046
$ 5,872
$ 92,651
$ 131,853
Less valuation allowances for tax loss carryforwatds................. (5,486 ) (17,266 ) (9,468 ) (550 ) (5,872 ) (88,349 ) (126,991 ) Net deferred tax assets relating to tax loss carryforwards................. $ 0 $ 37 $ 27 $ 496
$ 4,302
$ 4,862
The reconciliation between the normal effective statutory tax rate and the actual effective tax rate reflected in the accompanying consolidated statement of income for the years ended March 31, 2020, 2019 and 2018, were as follows: 2020 2019 2018 Normal effective statutory tax rate............................................................... 30.5 % 30.5 % 30.7 %
Changes in valuation allowance................................................................... 4.5 (14.9 ) (6.4 ) Tax effect of investment in subsidiary.......................................................... (0.2 ) (1.2 ) (6.3 ) Tax credit for research and development expenses....................................... (2.0 ) (2.3 ) (3.4 ) Lower income tax rates applicable to income in certain foreign countries... (3.2 ) (0.8 ) (0.6 ) Difference of tax rate used for tax effect accounting.................................... (0.2 ) 1.4 Loss on impairment of goodwill................................................................... 3.5 Expiration of tax loss carryforwards............................................................. 3.1 14.4 0.1 Other – net..................................................................................................... (0.2 ) (0.1 ) 0.9
Actual effective tax rate................................................................................. 32.5 % 25.4 % 19.9 %
15. Financial Instruments and Related Disclosures (1) Group policy for financial instruments
The Group manages surplus funds with low-risk financial assets and uses derivatives only as a means to hedge the foreign currency exchange rate risk of trade receivables. The Group does not conduct any speculative transactions.
Notes to Consolidated Financial Statements
31

(2) Nature and extent of risks arising from financial instruments and risk management Receivables, such as notes receivable―trade and accounts receivable―trade, are exposed to customer credit risk.
Regarding the relevant risks, the Group controls due dates and the receivable balances by customer pursuant to the internal rules of the Group, and, at the same time, promotes the early identification and reduction of bad debt risk due to financial deterioration. Foreign currency trade receivables are exposed to market risk resulting from fluctuations in foreign currency exchange rates. Such foreign currency exchange rate risks are partially hedged by forward foreign currency contracts. Securities and investment securities, such as stocks and bonds, are exposed to the risk of market price fluctuations. The Group continually reviews the status of possessing such securities and monitoring the fair value and the financial positions of issuers and others on a regular basis. The Group purchases only highly rated bonds pursuant to the internal policy approved by the Board of Directors, thereby being subject to minimal credit risks.
Payment terms of payables, such as notes payable―trade and accounts payable―trade, are primarily less than one year. These payables are exposed to liquidity risk and the Group manages the risk by preparing and updating financing plans as appropriate.
The Company issued the Bonds in order to fund to repurchase treasury stock. The Group enters into derivative transactions pursuant to the internal policy approved by the Board of Directors and
reports the status of the derivative transactions once or more every half year to the Board of Directors. Furthermore, in order to reduce credit risks, the Group only conducts derivative transactions with highly rated financial institutions.
(3) Supplemental information to fair value of financial instruments Fair values of financial instruments are measured based on quoted market prices or those calculated by other rational
valuation techniques in the case a quoted price is not available. Since variation factors are incorporated to calculate this fair value, the use of different preconditions may change this value.
(4) Fair values of financial instruments Carrying amounts of financial instruments in the consolidated balance sheet, their fair values, and differences as of
March 31, 2020 and 2019, are shown in the table in (a) below. Any financial instruments whose fair values cannot be readily determinable are not included (see the table in (b) below).
(a) Fair value of financial instruments Millions of Yen 2020
Carrying amount Fair value
Unrealized gain/loss
Cash and cash equivalents......................................................... ¥ 275,540 ¥ 275,540
Marketable securities................................................................. 7,626 7,626
Short-term investments............................................................. 32,558 32,558
Notes and accounts receivable – trade....................................... 80,439
Allowance for doubtful receivable........................................ (119 )
Notes and accounts receivable – trade net............................ 80,320 80,320
Investment securities................................................................. 65,293 65,293
Income taxes receivable............................................................ 488 488
Total.......................................................................................... ¥ 461,825 ¥ 461,825
Bonds........................................................................................ ¥ 40,935 ¥ 40,526 ¥ (409 ) Notes and accounts payable – trade.......................................... 14,863 14,863
Notes and accounts payable – construction and other.............. 24,066 24,066
Income taxes payable................................................................ 3,990 3,990
Total.......................................................................................... ¥ 83,854 ¥ 83,445 ¥ (409 )
Notes to Consolidated Financial Statements
32

Millions of Yen 2019
Carrying amount Fair value
Unrealized gain/loss
Cash and cash equivalents......................................................... ¥ 228,065 ¥ 228,065
Marketable securities................................................................. 10,901 10,901
Short-term investments............................................................. 50,779 50,779
Notes and accounts receivable – trade....................................... 89,855
Allowance for doubtful receivable........................................ (60 )
Notes and accounts receivable – trade net............................ 89,795 89,795
Investment securities................................................................. 86,691 86,691
Income taxes receivable............................................................ 481 481
Total.......................................................................................... ¥ 446,712 ¥ 466,712
Notes and accounts payable – trade.......................................... ¥ 16,126 ¥ 16,126
Notes and accounts payable – construction and other.............. 30,691 30,691
Income taxes payable................................................................ 8,138 8,138
Total.......................................................................................... ¥ 54,955 ¥ 54,955
Thousands of U.S. Dollars 2020
Carrying amount Fair value
Unrealized gain/loss
Cash and cash equivalents......................................................... $ 2,527,890 $ 2,527,890
Marketable securities................................................................. 69,963 69,963
Short-term investments............................................................. 298,697 298,697
Notes and accounts receivable – trade....................................... 737,972
Allowance for doubtful receivable........................................ (1,091 )
Notes and accounts receivable – trade net............................ 736,881 736,881
Investment securities................................................................. 599,019 599,019
Income taxes receivable............................................................ 4,477 4,477
Total.......................................................................................... $ 4,236,927 $ 4,236,927
Bonds........................................................................................ $ 375,550 $ 371,798 $ (3,752 ) Notes and accounts payable – trade.......................................... 136,358 136,358
Notes and accounts payable – construction and other.............. 220,789 220,789
Income taxes payable................................................................ 36,605 36,605
Total.......................................................................................... $ 769,302 $ 765,550 $ (3,752 )
Cash and cash equivalents, Short-term investments, Notes and accounts receivable―trade, and Income taxes receivable The carrying values of these assets approximate fair value because of their short maturities.
Marketable securities and Investment securities The fair values of marketable securities and investment securities are measured at the quoted market price of the
stock exchange for equity instruments, and at the quoted price obtained from the financial institution for certain debt instruments. The fair value information for the marketable and investment securities by classification is included in Note 5.
Notes and accounts payable―trade, Notes and accounts payable―construction and other, and Income taxes payable The carrying values of these liabilities approximate fair value because of their short maturities.
Notes to Consolidated Financial Statements
33

Bonds The fair value of Bonds is measured at the quoted price obtained from financial institutions.
Derivatives Fair value information for derivatives is included in Note 16.
(b) Carrying amount of financial instruments whose fair values cannot be readily determinable
Carrying amount
Millions of Yen Thousands of U.S. Dollars
2020 2019 2020 Unlisted stock............................................................................... ¥ 195 ¥ 228 $ 1,789 Rights under limited partnership agreement for investment......... 70 84 642 Investments in unconsolidated subsidiaries and associated companies......................................................................................
680 680 6,238
(c) Maturity analysis for financial assets and securities with contractual maturities Millions of Yen 2020
Due in
1 year or less Due after
1 year through 5 years
Due after
5 years through 10 years
Due after 10 years
Cash and cash equivalents............................. ¥ 275,540
Marketable securities:
Government and local government bonds.. 231
Corporate bonds......................................... 7,341
Other........................................................... 39
Short-term investments................................... 32,558
Notes and accounts receivable – trade............ 80,439
Investment securities:
Government and local government bonds.. ¥ 291
Corporate bonds......................................... 18,425
Income taxes receivable................................. 488
Total................................................................ ¥ 396,636 ¥ 18,716
Millions of Yen 2019
Due in
1 year or less Due after
1 year through 5 years
Due after
5 years through 10 years
Due after 10 years
Cash and cash equivalents............................. ¥ 228,065
Marketable securities:
Government and local government bonds.. 311
Corporate bonds......................................... 10,580
Other........................................................... 29
Short-term investments................................... 50,779
Notes and accounts receivable – trade............ 89,855
Investment securities:
Corporate bonds......................................... ¥ 22,846
Income taxes receivable................................. 481
Total................................................................ ¥ 380,100 ¥ 22,846
Notes to Consolidated Financial Statements
34

Thousands of U.S. Dollars 2020
Due in
1 year or less Due after
1 year through 5 years
Due after
5 years through 10 years
Due after 10 years
Cash and cash equivalents............................. $ 2,527,890
Marketable securities:
Government and local government bonds.. 2,119
Corporate bonds......................................... 67,349
Other........................................................... 358
Short-term investments................................... 298,697
Notes and accounts receivable – trade............ 737,972
Investment securities:
Government and local government bonds.. $ 2,670
Corporate bonds......................................... 169,036
Income taxes receivable................................. 4,477
Total................................................................ $ 3,638,862 $ 171,706
16. Derivatives The Group enters into foreign exchange forward contracts to hedge foreign currency exchange rate risk associated
with certain assets denominated in foreign currencies. All derivative transactions are entered into to hedge foreign currency exposures incorporated within the Group’s
business. Accordingly, market risk in these derivatives is generally offset by opposite movements in the value of the hedged assets. The Group does not hold or issue derivatives for trading purposes.
Because the counterparties to these derivatives are limited to major international financial institutions, the Group does not anticipate any losses arising from credit risk.
Derivative transactions entered into by the Group have been made in accordance with internal policies which regulate the authorization and credit limit amount.
Derivative transactions to which hedge accounting was not applied were as follows: Millions of Yen 2020
Contract amount
Contract amount due after 1 year
Fair value Unrealized gain/loss
Foreign currency forward contracts:
Selling U.S.$................................................... ¥ 7,528 ¥ 38 ¥ 38 Selling Euros................................................... 2,520 11 11
Millions of Yen 2019
Contract amount
Contract amount due after 1 year
Fair value Unrealized gain/loss
Foreign currency forward contracts:
Selling U.S.$................................................... ¥ 10,569 ¥ (41 ) ¥ (41 ) Selling Euros................................................... 1,896 27 27
Notes to Consolidated Financial Statements
35

Thousands of U.S. Dollars 2020
Contract amount
Contract amount due after 1 year
Fair value Unrealized gain/loss
Foreign currency forward contracts:
Selling U.S.$................................................... $ 69,064 $ 349 $ 349 Selling Euros................................................... 23,119 101 101
17. Leases Operating leases
Future minimum payment under operating leases were as follows:
Millions of Yen Thousands of U.S. Dollars
2020 2019 2020 Due within 1 year.......... ¥ 235 ¥ 1,202 $ 2,156 Due after 1 year............. 492 1,828 4,514 Total.............................. ¥ 727 ¥ 3,030 $ 6,670
18. Contingent Liabilities The Group was contingently liable for guarantees of housing loans of employees amounting to ¥27 million ($248
thousand) at March 31, 2020.
19. Comprehensive Income (Loss) The components of other comprehensive income for the years ended March 31, 2020, 2019 and 2018, were as
follows:
Millions of Yen Thousands of U.S. Dollars
2020 2019 2018 2020 Unrealized gain (loss) on available-for-sale securities:
Adjustments arising during the year......................... ¥ (5,347 ) ¥ (5,388 ) ¥ 12,127 $ (49,055 ) Reclassification adjustments to profit or loss........... (4,489 ) (1,162 ) (4 ) (41,183 ) Amount before income tax effect............................. (9,836 ) (6,550 ) 12,123 (90,238 ) Income tax effect...................................................... 3,001 1,468 (3,630 ) 27,532 Total.......................................................................... ¥ (6,835 ) ¥ (5,082 ) ¥ 8,493 $ (62,706 )
Foreign currency translation adjustments:
Adjustments arising during the year......................... ¥ (11,853 ) ¥ 5,229 ¥ (47 ) $ (108,743 ) Reclassification adjustments to profit or loss........... (157 ) (41 ) (1,440 ) Amount before income tax effect............................. (12,010 ) 5,188 (47 ) (110,183 ) Income tax effect...................................................... (14 ) 2 295 (129 ) Total.......................................................................... ¥ (12,024 ) ¥ 5,190 ¥ 248 $ (110,312 )
Notes to Consolidated Financial Statements
36

Millions of Yen Thousands of U.S. Dollars
Adjustments for retirement benefits:
Adjustments arising during the year......................... ¥ (2,099 ) ¥ (972 ) ¥ 628 $ (19,257 ) Reclassification adjustments to profit or loss........... 678 904 1,330 6,220 Amount before income tax effect............................. (1,421 ) (68 ) 1,958 (13,037 ) Income tax effect...................................................... 350 (1 ) (371 ) 3,211 Total.......................................................................... ¥ (1,071 ) ¥ (69 ) ¥ 1,587 $ (9,826 )
Total other comprehensive income (loss)..................... ¥ (19,930 ) ¥ 39 ¥ 10,328 $ (182,844 )
20. Net Income Per Share Reconciliation of the differences between basic and diluted net income per share ("EPS") for the year ended March
31, 2020 was as follows:
Millions of
Yen Thousands of
Shares Yen U.S. Dollars
Net income Attributable to
Owners of the Parent
Weighted- Average Shares
EPS
Basic net income................................................... ¥ 25,597 103,359 ¥ 247.66 $ 2.27
Effect of dilutive securities:
Convertible bonds............................................ (45 ) 981
Diluted net income............................................... ¥ 25,552 104,340 ¥ 244.90 $ 2.25
21. Subsequent Event (1) Appropriation of retained earnings
On June 12, 2020, the Board of Directors decided to retire a portion of the Company's treasury stock in accordance with Article 178 of the Companies Act and retired it on June 24, 2020.
(a) Reason for retirement The Company will retain its treasury stock of approximately 5 percent of total shares issued at maximum, and, in
principle, the excess portion of the treasury stock will be retired each year. (b) Class of shares to be retired Common stock (c) Number of shares to be retired 7,000,000 shares (d) Amount of shares to be retired ¥57,462 million ($527,174 thousand)
(2) Appropriation of retained earnings The following appropriation of retained earnings at March 31, 2020, was approved at the Company’s general
shareholders’ meeting held on June 26, 2020.
Millions of
Yen Thousands of U.S. Dollars
Year-end cash dividends, ¥75.00 ($0.69) per share..................................................... ¥ 7,462 $ 68,459
Notes to Consolidated Financial Statements
37

22. Segment Information Under ASBJ Statement No. 17 “Accounting Standard for Segment Information Disclosures,” and ASBJ Guidance
No. 20 “Guidance on Accounting Standard for Segment Information Disclosures,” an entity is required to report financial and descriptive information about its reportable segments. Reportable segments are operating segments or aggregations of operating segments that meet specified criteria.
Operating segments are components of an entity about which separate financial information is available and such information is evaluated regularly by the chief operating decisionmaker in deciding how to allocate resources and in assessing performance. Generally, segment information is required to be reported on the same basis as is used internally for evaluating operating segment performance and deciding how to allocate resources to operating segments.
(a) Description of reportable segments The Group’s reportable segments are those for which separate financial information is available and regular
evaluation by the Company’s Board of Directors is being performed in order to decide how resources are allocated among the Group.
The Group is a comprehensive manufacturer of electronic components, and sets up operational divisions by individual product category at its headquarters. Each operational division draws up comprehensive production plans and business strategies for both domestic and overseas operations, and develops global production activities. Therefore, from a management standpoint, the Group places great importance on monitoring profits and losses by operating segments organized as operational divisions of individual product categories. For this reason, the Group aggregates operating segments in consideration of characteristics of the products that each operational division manufactures and similarities of production processes, and has three reportable segments “ICs”, “Discrete semiconductor devices” and “Modules.” In the ICs segment, products such as analog ICs, logic ICs, memory ICs and MEMS are manufactured. Products manufactured in the Discrete semiconductor devices segment include diodes, transistors, light-emitting diodes, and laser diodes. Products manufactured in the Modules segment include print-heads, optical modules, and power modules.
(b) Methods of measurement for the amounts of sales, profit (loss), assets and other items for each reportable segment The accounting policies of each reportable segment are basically consistent with those disclosed in Note 2,
“Summary of Significant Accounting Policies.” Operating income is applied in “Segment profit.” “Intersegment sales or transfers” are calculated based on the
market price. Although assets of common divisions, such as sales and administrative divisions, are included in “Reconciliations,”
depreciation and amortization expense of these assets are allocated to each operating segment according to in-house criteria to calculate the profit of each segment.
(c) Information about sales, profit (loss), assets and other items is as follows: Millions of Yen
2020
Reportable segments Other
Total
Reconcili-
ations
Consolidated
ICs Discrete
semiconductor devices
Modules Total
Sales:
Sales to external customers........... ¥ 170,432 ¥ 139,038 ¥ 33,276 ¥ 342,746 ¥ 20,139 ¥ 362,885 ¥ 362,885
Intersegment sales or transfers...... 1,948 5,915 0 7,863 63 7,926 ¥ (7,926 )
Total............................................ 172,380 144,953 33,276 350,609 20,202 370,811 (7,926 ) 362,885
Segment profit.................................... 12,578 10,407 3,492 26,477 1,949 28,426 1,064 29,490
Segment assets.................................... 109,396 130,825 15,064 255,285 18,368 273,653 575,220 848,873
Other
Depreciation and amortization....... 18,165 21,129 2,989 42,283 2,485 44,768 (440 ) 44,328
Amortization of goodwill................ 99 99 99 99 Increase in property, plant and
equipment and intangible assets...... 8,550 22,002 1,923 32,475 2,736 35,211 3,731 38,942
Notes to Consolidated Financial Statements
38

Millions of Yen
2019
Reportable segments Other
Total
Reconcili-
ations
Consolidated
ICs Discrete
semiconductor devices
Modules Total
Sales:
Sales to external customers........... ¥ 183,313 ¥ 152,862 ¥ 40,159 ¥ 376,334 ¥ 22,655 ¥ 398,989 ¥ 398,989
Intersegment sales or transfers...... 2,559 6,933 43 9,535 61 9,596 ¥ (9,596 )
Total............................................ 185,872 159,795 40,202 385,869 22,716 408,585 (9,596 ) 398,989
Segment profit.................................... 15,990 30,054 5,918 51,962 4,094 56,056 (147 ) 55,909
Segment assets.................................... 129,030 126,836 17,157 273,023 19,316 292,339 582,089 874,428
Other
Depreciation and amortization....... 20,908 20,055 3,279 44,242 2,006 46,248 (832 ) 45,416
Amortization of goodwill................
Increase in property, plant and
equipment and intangible assets...... 17,119 30,407 1,980 49,506 4,695 54,201 3,090 57,291
Millions of Yen
2018
Reportable segments Other
Total
Reconcili-
ations
Consolidated
ICs Discrete
semiconductor devices
Modules Total
Sales:
Sales to external customers........... ¥ 183,431 ¥ 149,915 ¥ 41,830 ¥ 375,176 ¥ 21,931 ¥ 397,107 ¥ 397,107
Intersegment sales or transfers...... 2,875 9,218 91 12,184 53 12,237 ¥ (12,237 )
Total............................................ 186,306 159,133 41,921 387,360 21,984 409,344 (12,237 ) 397,107
Segment profit.................................... 20,182 32,193 3,794 56,169 2,968 59,137 (2,132 ) 57,005
Segment assets.................................... 122,043 103,058 18,581 243,682 15,151 258,833 605,239 864,072
Other
Depreciation and amortization....... 20,293 18,638 3,725 42,656 1,598 44,254 (847 ) 43,407
Amortization of goodwill................ 392 392 392 392 Increase in property, plant and
equipment and intangible assets...... 25,078 23,149 1,185 49,412 4,407 53,819 2,092 55,911
Thousands of U.S. Dollars
2020
Reportable segments
Other
Total
Reconcili- ations
Consolidated ICs
Discrete semiconductor
devices Modules Total
Sales:
Sales to external customers........... $ 1,563,596 $ 1,275,578 $ 305,285 $ 3,144,459 $ 184,761 $ 3,329,220 $ 3,329,220
Intersegment sales or transfers...... 17,872 54,266 0 72,138 578 72,716 $ (72,716 )
Total............................................ 1,581,468 1,329,844 305,285 3,216,597 185,339 3,401,936 (72,716 ) 3,329,220
Segment profit.................................... 115,394 95,477 32,037 242,908 17,881 260,789 9,761 270,550
Segment assets.................................... 1,003,633 1,200,229 138,202 2,342,064 168,514 2,510,578 5,277,248 7,787,826
Other
Depreciation and amortization....... 166,652 193,844 27,422 387,918 22,798 410,716 (4,037 ) 406,679
Amortization of goodwill................ 908 908 908 908 Increase in property, plant and
equipment and intangible assets...... 78,441 201,853 17,642 297,936 25,101 323,037 34,229 357,266
“Other” includes operating segments that are not included in the reportable segments, consisting of business in resistors and tantalum capacitors and others.
Notes to Consolidated Financial Statements
39

“Reconciliations” were as follows: (1) The adjusted amount of the segment profit for the year ended March 31, 2020, ¥1,064 million ($9,761 thousand),
mainly includes general and administrative expenses of ¥(577) million ($(5,294) thousand) not attributable to the operating segments, and the settlement adjustment of ¥1,641 million ($15,055 thousand) not allocated to the operating segments (such as periodic pension cost).
The adjusted amount of the segment profit for the year ended March 31, 2019, ¥(147) million, mainly includes general and administrative expenses of ¥(773) million not attributable to the operating segments, and the settlement adjustment of ¥626 million not allocated to the operating segments (such as periodic pension cost).
The adjusted amount of the segment profit for the year ended March 31, 2018, ¥(2,132) million, mainly includes general and administrative expenses of ¥(806) million not attributable to the operating segments, and the settlement adjustment of ¥(1,326) million not allocated to the operating segments (such as periodic pension cost).
(2) The adjusted amount of the segment assets for the year ended March 31, 2020, ¥575,220 million ($5,277,248 thousand), mainly includes corporate assets of ¥576,100 million ($5,285,321 thousand) not allocated to the operating segments, and the adjustments of fixed asset of ¥(880) million ($(8,073) thousand). Corporate assets not attributable to the operating segments mainly consist of cash and cash equivalents of ¥275,540 million ($2,527,890 thousand), notes and accounts receivable-trade of ¥80,439 million ($737,972 thousand), and investment securities of ¥65,558 million ($601,450 thousand).
The adjusted amount of the segment assets for the year ended March 31, 2019, ¥582,089 million, mainly includes corporate assets of ¥583,366 million not allocated to the operating segments, and the adjustments of fixed asset of ¥(1,277) million. Corporate assets not attributable to the operating segments mainly consist of cash and cash equivalents of ¥228,065 million, notes and accounts receivable-trade of ¥89,855 million, and investment securities of ¥87,033 million.
The adjusted amount of the segment assets for the year ended March 31, 2018, ¥605,239 million, mainly includes corporate assets of ¥607,183 million not allocated to the operating segments, and the adjustments of fixed asset of ¥(1,944) million. Corporate assets not attributable to the operating segments mainly consist of cash and cash equivalents of ¥243,974 million, investment securities of ¥93,935 million, and notes and accounts receivable-trade of ¥90,702 million.
(3) The adjusted amount of depreciation and amortization relates to the settlement adjustment not allocated to the operating segments (such as unrealized profit or loss on fixed assets).
(4) The adjusted amount of increase in property, plant and equipment and intangible fixed assets relates to common divisions, such as sales and administrative divisions.
(d) Relevant information For the years ended March 31, 2020, 2019 and 2018 (1) Information about products and services
The classification of products and services has been omitted as it is identical to the segment classification.
(2) Information about geographical areas (i) Sales
Millions of Yen 2020
Japan China Other Total ¥ 129,440 ¥ 101,773 ¥ 131,672 ¥ 362,885
Millions of Yen 2019
Japan China Other Total ¥ 136,392 ¥ 116,342 ¥ 146,255 ¥ 398,989
Notes to Consolidated Financial Statements
40

Millions of Yen 2018
Japan China Other Total ¥ 125,505 ¥ 123,990 ¥ 147,612 ¥ 397,107
Thousands of U.S. Dollars 2020
Japan China Other Total $ 1,187,523 $ 933,697 $ 1,208,000 $ 3,329,220
Sales are classified by country or region based on the location of customers.
(ii) Property, plant and equipment Millions of Yen
2020 Japan China Thailand Philippines Other Total ¥ 156,152 ¥ 16,578 ¥ 23,598 ¥ 26,286 ¥ 21,170 ¥ 243,784
Millions of Yen 2019
Japan China Thailand Philippines Other Total ¥ 155,461 ¥ 17,911 ¥ 26,679 ¥ 28,963 ¥ 22,631 ¥ 251,645
Thousands of U.S. Dollars 2020
Japan China Thailand Philippines Other Total $ 1,432,587 $ 152,092 $ 216,496 $ 241,156 $ 194,220 $ 2,236,551
(3) Information about major customers Since there are no customers who accounted for more than 10% of sales to external customers in the consolidated
statement of income, the information has been omitted.
(e) Information regarding loss on impairment of long-lived assets of reportable segments Millions of Yen
2020
Reportable segments
Other
Reconcili-
ations
Consolidated
Loss on impairment of
long-lived assets................
ICs Discrete
semiconductor devices
Modules Total
¥ 236 ¥ 39 ¥ 10 ¥ 285 ¥ 143 ¥ 2 ¥ 430
Millions of Yen
2019
Reportable segments
Other
Reconcili-
ations
Consolidated
Loss on impairment of
long-lived assets................
ICs Discrete
semiconductor devices
Modules Total
¥ 487 ¥ 217 ¥ 20 ¥ 724 ¥ 662 ¥ 12 ¥ 1,398
Notes to Consolidated Financial Statements
41
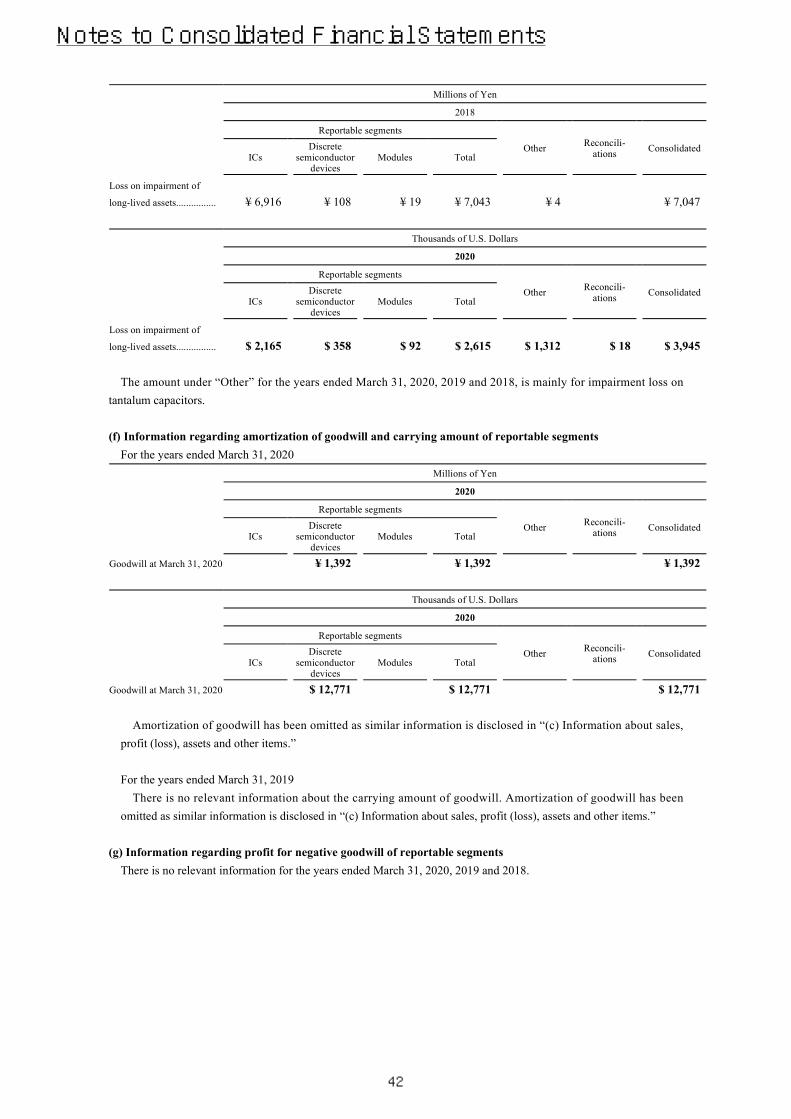
Millions of Yen
2018
Reportable segments
Other Reconcili- ations Consolidated
Loss on impairment of
long-lived assets................
ICs Discrete
semiconductor devices
Modules Total
¥ 6,916 ¥ 108 ¥ 19 ¥ 7,043 ¥ 4 ¥ 7,047
Thousands of U.S. Dollars
2020
Reportable segments
Other Reconcili- ations Consolidated
Loss on impairment of
long-lived assets................
ICs Discrete
semiconductor devices
Modules Total
$ 2,165 $ 358 $ 92 $ 2,615 $ 1,312 $ 18 $ 3,945
The amount under “Other” for the years ended March 31, 2020, 2019 and 2018, is mainly for impairment loss on tantalum capacitors.
(f) Information regarding amortization of goodwill and carrying amount of reportable segmentsFor the years ended March 31, 2020
Millions of Yen
2020
Reportable segments
Other Reconcili- ations Consolidated
Goodwill at March 31, 2020
ICs Discrete
semiconductor devices
Modules Total
¥ 1,392 ¥ 1,392 ¥ 1,392
Thousands of U.S. Dollars
2020
Reportable segments
Other Reconcili- ations Consolidated
Goodwill at March 31, 2020
ICs Discrete
semiconductor devices
Modules Total
$ 12,771 $ 12,771 $ 12,771
Amortization of goodwill has been omitted as similar information is disclosed in “(c) Information about sales, profit (loss), assets and other items.”
For the years ended March 31, 2019There is no relevant information about the carrying amount of goodwill. Amortization of goodwill has been
omitted as similar information is disclosed in “(c) Information about sales, profit (loss), assets and other items.”
(g) Information regarding profit for negative goodwill of reportable segmentsThere is no relevant information for the years ended March 31, 2020, 2019 and 2018.
Notes to Consolidated Financial Statements
42

23. Additional InformationAccounting estimates under the outbreak of COVID-19
As COVID-19 related restriction were imposed on our production and sales activities around the world, including China, the Philippines and Malaysia, the Group’s business activities were seriously restricted, resulting in temporary production suspensions or lower capacity utilization, but our operations are restored to normal at this stage.
However, it is very difficult for us to forecast the global economy and the market condition in which the Group operates because no one seems to be able to predict when the COVID-19 will end and how the economy will be affected.
Given such circumstances, we made accounting estimates for recoverability of deferred tax assets and fair value of long-lived assets based on assumption that the impact of a decrease in orders due to customers’ production adjustments will continue at least during the fiscal year ended March 31, 2021.
Notes to Consolidated Financial Statements
43


www.rohm.com