Embed Size (px)
Citation preview
Final Report
New profitable farming systems for the Lake Taupo catchment
Puketapu Group
Puketapu 3A Incorporation Oraukura No.3 Incorporation
Hauhungaroa 1C Incorporation Waihi Pukawa Trust
Waituhi Kuratau Trust
Prepared by Bruce Thorrold Dexcel, Hamilton Keith Betteridge AgResearch, Palmerston North
December 2006
Executive summary
1. In May 2000, Environment Waikato announced their intention to introduce a variation to the Waikato Regional Plan aimed at protecting the water quality of Lake Taupo. Research and monitoring indicated that increasing nitrogen (N) losses from pastoral and urban land to the lake were one component of water quality that was being adversely affected by human activity. Trends in land use apparent then (and now) indicated that there was a clear risk of further increases in N loss to the lake as farmers continued to increase production, forest owners investigated conversion of forests to pasture and sub-division for residential purposes continued without reticulated sewerage.
2. In response to the agreed need for new farm management options, AgResearch
worked with farmers to establish the objectives of a local research project. Resulting from this work, Puketapu Group was funded by the Ministry of Agriculture and Forestry Sustainable Farming Fund (SFF) to investigate new options for farmers in the Lake Taupo catchment. In addition to funding from Puketapu Group and SFF, the project was supported in cash and kind by; Taupo Lake Care, FertResearch, Dairy InSight, Environment Waikato, Meat and Wool NZ, Wrightsons Seeds and Genetic Technologies.
3. Discussion with local farmers came to the conclusion that the project needed to
investigate options that a. Had a proven ability to affect N cycling b. Were adoptable at a large scale, not a niche applicable only to a few farms.
On this basis the project set out to investigate the following options a. Growing of forage crops for sale off the farm. b. Removing winter grazing of cattle on pasture. c. Forestry.
4. Research has proven that the main source of N leaching under pastoral farms is from
stock urine patches. Nitrate leaches from these patches when high or prolonged rainfall causes water to drain through the soil. The period from late-autumn to mid-spring is the highest risk period for leaching. Based on this understanding, the work in this programme tested management options that aimed to remove urine patches from the system, or reduce the number of urine patches being deposited to the soil, particularly in the high-risk seasons.
5. One experiment examined the use of forage crops grown for harvest and sale rather
than grazing (cut forage crops). Field experiments with annual crops (triticale and maize) clearly demonstrated the risks to N leaching posed by a combination of high N fertiliser inputs and lack of perennial plant cover. Measured leaching losses were highest in these treatments (triticale 107 kg N/ha/yr, maize 226 kg N/ha/yr). Triticale yields (8,000 kg DM/ha) were below expectation, which contributed to N leaching as N fertiliser was applied for a 14 t DM/ha target. The climatic limits on yield potential at this site were illustrated by the 22 t DM/ha maize crop grown with plastic cover technology.
6. Perennial crops (pasture and lucerne) grown under continuous cutting and high
fertiliser inputs had measured N leaching levels similar to grazed pasture (pasture 18 kg N/ha/yr, lucerne 24 kg N/ha/yr). Pasture yield was below expectation, and high N fertiliser rates applied to address this contributed to N leaching. Better management of rates and timing would probably have improved the efficiency of this treatment. Lucerne yields were very low in the establishment year due to dry conditions, however once established lucerne was the highest yielding treatment (10,500 kg
2
DM/ha) other than maize. Measured leaching losses for lucerne were higher than expected, possibly due to a combination of a high rainfall site compared with other studies and high sensitivity of the N leached calculation to lucerne rooting depth. Given the yield potential of high quality forage and the possibility that leaching was overestimated, lucerne warrants further exploration as a cut forage crop.
7. A grazing experiment demonstrated the impact on N leaching of zero grazing with low
fertiliser inputs (3 kg N leached/ha/yr) compared to year round grazing of cattle (14 kg N/ha/yr). With pasture harvested only 13% below the grazing treatment, the zero grazing treatment was easily the most efficient system in terms of feed harvested per kg N leached. In an intermediate treatment, no grazing occurred in the April to September period. This treatment reduced N leaching to 6 kg N/ha/yr at the cost of 12% pasture yield compared to year round grazing. This experiment clearly demonstrated the controlling influence of grazing (urine patches) and winter drainage on N leaching in grazed systems. Leaching following high summer rainfall in one year reinforced these principles.
8. Farm systems modelling based on case study farms in the catchment studied the
financial impact and feasibility of a number of alternatives.
a. Improving stock performance through lambing percentage and growth rates emerged as a highly efficient option for farmers to improve profit without increasing N leaching.
b. Options designed to alter winter cattle management were not able to maintain profitability, although small reductions in N leaching were predicted. These reductions (10%) were well below the 55% reductions measured in the field studies. This was due to the fact that cattle comprised only 30% of stock units on the case study farm, and a shorter period of grazing off was used in the farm system case study compared to the experiment.
c. Use of DCD (nitrification inhibitor) products showed potential in the higher input dairy systems but was little value as a broadcast application in Sheep and Beef systems. The assumptions made about responses to DCD are critical in the analyses and these assumptions require further proof in order to optimise the role of DCD products in this environment.
d. Combinations of forestry with high performance Sheep and Beef farming provided increased long-term income, combined with reduced leaching losses. When the forestry income was expressed as an annuity, this was an attractive option, but in the absence of the annuity, farm cashflow was significantly reduced.
e. Wintering off and DCDs were the most promising options for dairy farmers. f. Comparison of the best Dairy and Sheep and Beef systems, when adjusted
for the capital costs of dairy conversion indicated that the two systems were similar in their efficiency (profit/kg N leached). However the best Dairy system still leached twice as much per hectare as the Sheep and Beef system.
9. Drawing on the overall results, this study indicates that
a. The efficiency of forestry and cut forage systems in terms of yield and profit per kg N leached suggests that they require further analysis to overcome issues around yield and feasibility.
b. The potential impact of DCD products similarly suggests that research into better predictions of responses and optimising their use especially on Sheep and Beef farms is warranted.
c. Improving stock performance emerges as the most profitable route for farmers in the short-term as they seek to improve profitability without increasing N leaching.
3
New Farm Management Options for the Lake Taupo Catchment Background In May 2000, Environment Waikato announced their intention to introduce a variation to the Waikato Regional Plan aimed at protecting the water quality of Lake Taupo. Research and monitoring indicated that increasing nitrogen (N) losses from pastoral and urban land to the lake were one component of water quality that was being adversely affected by human activity. Trends in land use apparent then (and now) indicated that there was a clear risk of further increases in N loss to the lake as farmers continued to increase production, forest owners investigated conversion of forests to pasture and sub-division for residential purposes continued without reticulated sewerage. AgResearch undertook initial research into the likely impacts of the Lake Taupo variation on farm profitability and land value, in association with Taupo Lake Care (the local farmers’ action group). This study showed that the variation was likely to have large impacts on profitability, land values and land use patterns. The farmers in the catchment identified that they needed new management options that would achieve reductions in N leaching and minimise the costs that N leaching restrictions will place on future farm development. This need was endorsed by Environment Waikato who saw that achieving the policy aims was going to be easier and less costly if farmers had viable management options. The project In response to the agreed need for new management options, AgResearch worked with farmers to establish the objectives of a local research project. Resulting from this work, Puketapu Group was funded by the Ministry of Agriculture and Forestry Sustainable Farming Fund (SFF) to investigate new options for farmers in the Lake Taupo catchment. In addition to funding from Puketapu Group and SFF, the project was supported in cash and kind at various stages by; Taupo Lake Care, FertResearch, Dairy InSight, Environment Waikato, Meat and Wool NZ, Wrightsons Seeds and Genetic Technologies. The problem and the path to a solution Research has proven that the main source of N leaching under pastoral farms is from stock urine patches. Nitrate leaches from these patches when high or prolonged rainfall causes water to drain through the soil. The period from late-autumn to mid-spring is the highest risk period for leaching. Based on this understanding, the work in this programme tested management options that aimed to remove urine patches from the system, or reduce the number of urine patches being deposited to the soil, particularly in the high-risk seasons. Options identified for study Discussion with local farmers came to the conclusion that the project needed to investigate options that
Had a proven ability to affect N cycling Were adoptable at a large scale, not as a niche applicable only to a few farmers
On this basis the project set out to investigate the following options
1. Growing of forage crops for sale off the farm. 2. Removing winter grazing of cattle off pasture. 3. Forestry.
These investigations were carried out using local field experiments combined with farm systems modelling based on case studies of local farms and research results from other projects. As the project progressed new options such as nitrification inhibitors came to the fore, and the project was adapted to include consideration of these options through case study modelling. This report contains the results of these investigations.
4
Part 1 Field Experiments Two field experiments were established to test the options of forage cropping for sale and changing winter grazing. The two trials were established on farms owned by members of the Puketapu group. The Cropping trial was carried out on the Waituhi Kuratau Trust farm. The trial site was on the Kuratau Hydro Rd. The Grazing trial was carried out at Rangiatea Station, owned by the Hauhungaroa 1C Incorporation. The trial site was located on the main station access off the Western Bays Rd (SH 32). Methods and Materials Treatments, on plots ranging in size from 0.7 – 1.1 ha, replicated 3 times at each of the 2 sites were established in spring 2002. Site history and preparation The Cropping site had been cultivated and sown in summer 2001 to short rotation ‘Flanker’ ryegrass that was sprayed out with Roundup and then cultivated in September 2002 in preparation for planting of the trial crops. The Grazing site had been cultivated in about 1995 and sown with new pasture species. This site was maintained in its current state. Cropping Treatments The cropping trial aimed to achieve high levels of forage crop production, without any grazing. The trial design and management was based around our understanding of N leaching and forage production under different farm systems.
Research has proven that the main source of N leaching under pastoral farms is from stock urine patches. So removing the animal from the system removed the urine patches, even though this was by shifting them to the farm the feed would be sold to.
Previous work had shown that leaching of N fertiliser is low in un-grazed pastures, so long as timing and amount of N fertiliser supply matches plant uptake. Therefore high rates of N fertiliser (up to 300 kg N/ha) were used to increase forage yields, without the same risk of leaching that these rates would pose in grazed systems.
Work has shown that cultivation releases N from soil organic matter and this is a major source of N leaching in cropping systems. As a consequence we sought to use either perennial species or direct drilling to minimise soil disturbance.
Legumes fix their own N from the atmosphere, and overseas work had shown that N leaching rates under lucerne crops are low (<10 kg N/ha/yr). Lucerne is a premium quality stock forage. Therefore we included lucerne as one option.
Maize is the highest yielding forage crop in New Zealand, and is widely traded between farms. The advent of technology to sow plants under plastic meant that the climatic limits to growing maize at Kuratau (late frosts) could be overcome.
Triticale has shown good potential as a cereal silage crop, and is better suited to the Kuratau climate than maize.
Annual ryegrass was used a cover crop sown after annual crops to take up residual soil N and increase annual forage yield.
Based on this knowledge the trial was set up to compare three treatments in the main design. These were
1. Perennial pasture 2. Lucerne 3. Triticale – annual ryegrass rotation.
5
A fourth treatment (maize sown under plastic, plus annual ryegrass) was included in adjacent plots for the first two years of the trial. In year 1 this was a single observational plot, while in year 2 the plots were replicated. Climate recording Automatic weather stations were set up at both sites to record rainfall, wind, solar radiation and temperature data. Drainage refers to the amount of water that drains past the root zone in the soil to ground water. It is this water that transfers the several forms of N (nitrate, ammonium, dissolved organic N) from the plant root zone to ground water. Drainage was estimated by water balance that takes into account rainfall, soil moisture levels and evapo-transpiration of water by plant leaves to the atmosphere. As soil moisture increases (typically in autumn and early winter) more water becomes available to the plants, but eventually rainfall exceeds evaporative losses and the soil’s capacity to store water and drainage commences. Most drainage occurred in winter and early spring when temperatures were low and rainfall high. Soil Fertility and Fertilisers The aim in this trial was to fertilise crops to their growth potential. Soil tests (Table 1) were taken prior to the experiments starting and each winter. The initial tests on the Cropping site indicated that soil pH and P levels were lower than optimal for high yielding crops, especially lucerne. Capital inputs of lime and P were applied as set out in Table 2. Fertiliser inputs in following years were based on a combination of soil testing, yield monitoring and nutrient budgeting of nutrients removed by harvesting. Pasture was fertilised with N (as urea) and K (as muriate of potash) following each cut in years 1 and 2. Lower than expected yields and visual signs of N deficiency led to monthly applications in year 3 at a rate of 30 kg N and 25 kg K/ha except in June and July when leaching potential was greatest and soils were too cold for plant growth. Lucerne received no N fertiliser in year 1 but in years 2 and 3, 20 kg N/ha was applied in early spring to kick-start growth. This strategy appeared to work well, as measured by an earlier first cut in the latter two years. Trace elements cobalt, selenium and boron were applied, along with the high potash and sulphur inputs in spring and summer each year. Fertiliser applied to the Triticale treatment included N and K applied once or twice after sowing and also applied to the annual ryegrass crop at sowing (February/March) and subsequently after harvest. In year 2 poor growth of the winter annual ryegrass was notable for patchy growth of areas, ranging from no growth in areas of one to several square metres to exceptionally high mass immediately adjacent to low-growth patches. Soil and plant tissue tests of these good and bad areas were unable to clearly pinpoint a cause for the patchiness, although it was thought possible that N was the limiting nutrient. As a result, more N was applied to the winter crop in year 3 and only in that year was there a useful crop to bale in spring. The double application of DAP at sowing of Triticale in 2003-04 (the crop was sown twice) accounts for the higher N use in the second year compared to year 1. Details of nutrients applied to all treatments are given in Table 2.
6
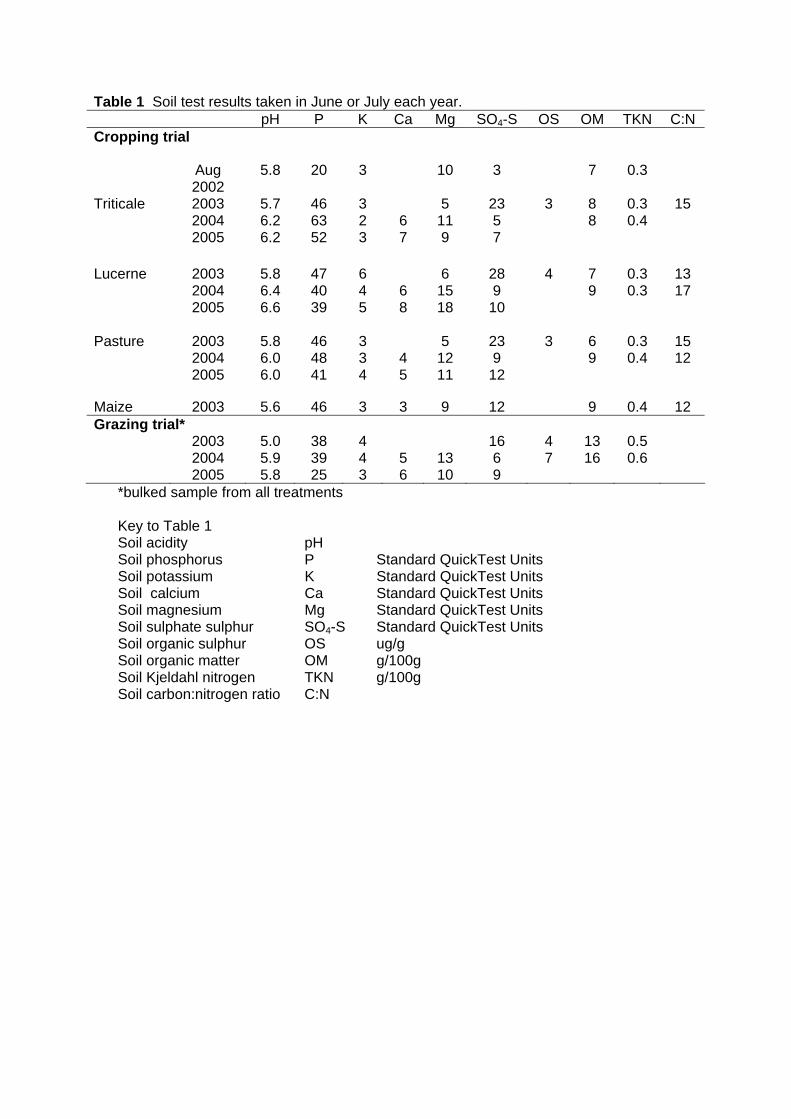
Table 1 Soil test results taken in June or July each year. pH P K Ca Mg SO4-S OS OM TKN C:N Cropping trial
Aug 2002
5.8 20 3 10 3 7 0.3
Triticale 2003 5.7 46 3 5 23 3 8 0.3 15 2004 6.2 63 2 6 11 5 8 0.4 2005 6.2 52 3 7 9 7
Lucerne 2003 5.8 47 6 6 28 4 7 0.3 13 2004 6.4 40 4 6 15 9 9 0.3 17 2005 6.6 39 5 8 18 10
Pasture 2003 5.8 46 3 5 23 3 6 0.3 15 2004 6.0 48 3 4 12 9 9 0.4 12 2005 6.0 41 4 5 11 12
Maize 2003 5.6 46 3 3 9 12 9 0.4 12 Grazing trial* 2003 5.0 38 4 16 4 13 0.5 2004 5.9 39 4 5 13 6 7 16 0.6 2005 5.8 25 3 6 10 9
*bulked sample from all treatments Key to Table 1 Soil acidity pH Soil phosphorus P Standard QuickTest Units Soil potassium K Standard QuickTest Units Soil calcium Ca Standard QuickTest Units Soil magnesium Mg Standard QuickTest Units Soil sulphate sulphur SO4-S Standard QuickTest Units Soil organic sulphur OS ug/g Soil organic matter OM g/100g Soil Kjeldahl nitrogen TKN g/100g Soil carbon:nitrogen ratio C:N
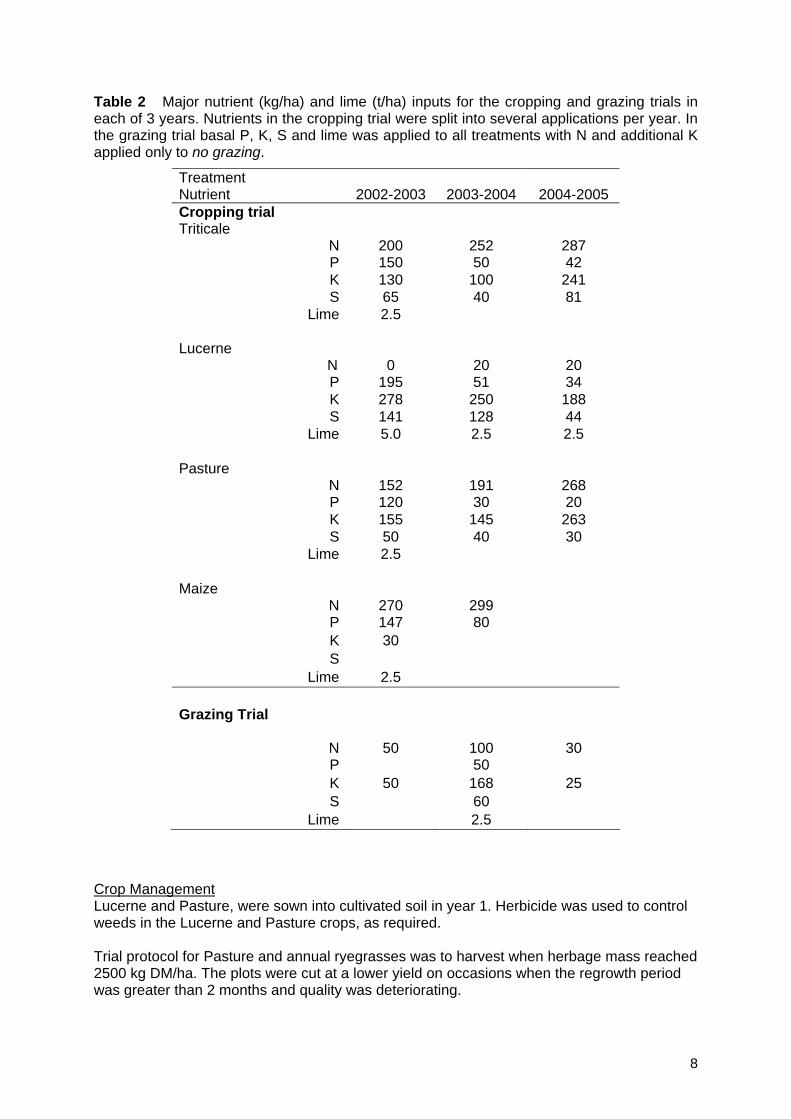
Table 2 Major nutrient (kg/ha) and lime (t/ha) inputs for the cropping and grazing trials in each of 3 years. Nutrients in the cropping trial were split into several applications per year. In the grazing trial basal P, K, S and lime was applied to all treatments with N and additional K applied only to no grazing.
Treatment Nutrient
2002-2003
2003-2004
2004-2005
Cropping trial Triticale
N
200
252
287 P 150 50 42 K 130 100 241 S 65 40 81
Lime 2.5
Lucerne N
0
20
20
P 195 51 34 K 278 250 188 S 141 128 44
Lime 5.0 2.5 2.5
Pasture N
152
191
268
P 120 30 20 K 155 145 263 S 50 40 30
Lime 2.5
Maize N
270
299
P 147 80 K 30 S
Lime 2.5
Grazing Trial
N
50
100
30 P 50 K 50 168 25 S 60
Lime 2.5 Crop Management Lucerne and Pasture, were sown into cultivated soil in year 1. Herbicide was used to control weeds in the Lucerne and Pasture crops, as required. Trial protocol for Pasture and annual ryegrasses was to harvest when herbage mass reached 2500 kg DM/ha. The plots were cut at a lower yield on occasions when the regrowth period was greater than 2 months and quality was deteriorating.
8
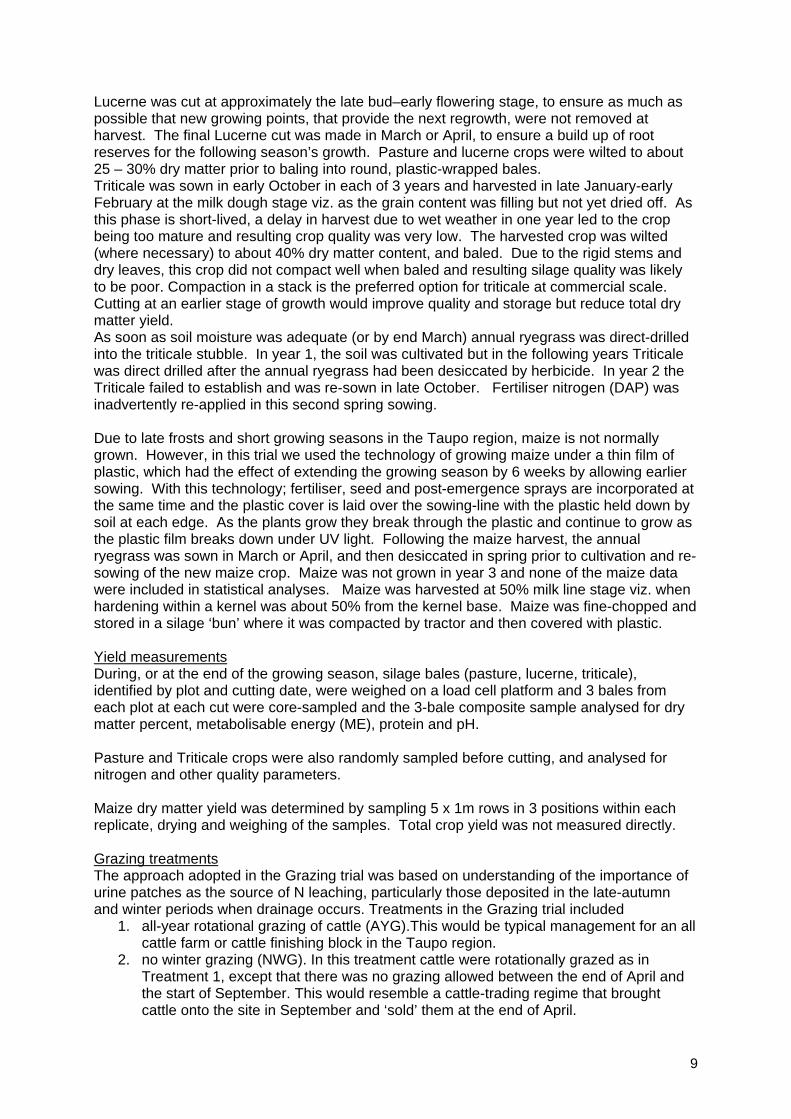
Lucerne was cut at approximately the late bud–early flowering stage, to ensure as much as possible that new growing points, that provide the next regrowth, were not removed at harvest. The final Lucerne cut was made in March or April, to ensure a build up of root reserves for the following season’s growth. Pasture and lucerne crops were wilted to about 25 – 30% dry matter prior to baling into round, plastic-wrapped bales. Triticale was sown in early October in each of 3 years and harvested in late January-early February at the milk dough stage viz. as the grain content was filling but not yet dried off. As this phase is short-lived, a delay in harvest due to wet weather in one year led to the crop being too mature and resulting crop quality was very low. The harvested crop was wilted (where necessary) to about 40% dry matter content, and baled. Due to the rigid stems and dry leaves, this crop did not compact well when baled and resulting silage quality was likely to be poor. Compaction in a stack is the preferred option for triticale at commercial scale. Cutting at an earlier stage of growth would improve quality and storage but reduce total dry matter yield. As soon as soil moisture was adequate (or by end March) annual ryegrass was direct-drilled into the triticale stubble. In year 1, the soil was cultivated but in the following years Triticale was direct drilled after the annual ryegrass had been desiccated by herbicide. In year 2 the Triticale failed to establish and was re-sown in late October. Fertiliser nitrogen (DAP) was inadvertently re-applied in this second spring sowing. Due to late frosts and short growing seasons in the Taupo region, maize is not normally grown. However, in this trial we used the technology of growing maize under a thin film of plastic, which had the effect of extending the growing season by 6 weeks by allowing earlier sowing. With this technology; fertiliser, seed and post-emergence sprays are incorporated at the same time and the plastic cover is laid over the sowing-line with the plastic held down by soil at each edge. As the plants grow they break through the plastic and continue to grow as the plastic film breaks down under UV light. Following the maize harvest, the annual ryegrass was sown in March or April, and then desiccated in spring prior to cultivation and re-sowing of the new maize crop. Maize was not grown in year 3 and none of the maize data were included in statistical analyses. Maize was harvested at 50% milk line stage viz. when hardening within a kernel was about 50% from the kernel base. Maize was fine-chopped and stored in a silage ‘bun’ where it was compacted by tractor and then covered with plastic. Yield measurements During, or at the end of the growing season, silage bales (pasture, lucerne, triticale), identified by plot and cutting date, were weighed on a load cell platform and 3 bales from each plot at each cut were core-sampled and the 3-bale composite sample analysed for dry matter percent, metabolisable energy (ME), protein and pH. Pasture and Triticale crops were also randomly sampled before cutting, and analysed for nitrogen and other quality parameters. Maize dry matter yield was determined by sampling 5 x 1m rows in 3 positions within each replicate, drying and weighing of the samples. Total crop yield was not measured directly. Grazing treatmentsThe approach adopted in the Grazing trial was based on understanding of the importance of urine patches as the source of N leaching, particularly those deposited in the late-autumn and winter periods when drainage occurs. Treatments in the Grazing trial included
1. all-year rotational grazing of cattle (AYG).This would be typical management for an all cattle farm or cattle finishing block in the Taupo region.
2. no winter grazing (NWG). In this treatment cattle were rotationally grazed as in Treatment 1, except that there was no grazing allowed between the end of April and the start of September. This would resemble a cattle-trading regime that brought cattle onto the site in September and ‘sold’ them at the end of April.
9
3. no grazing (NG). In this treatment all pasture was cut and baled. Soil fertility and fertilisers Initial soil testing (Table 1) showed that this site had generally adequate soil fertility levels for dry-stock farming. During the trial the farm’s standard fertiliser dressings of potassic super phosphate were applied each year to all treatments. In year 2, lime (2.5 tonnes/ha) was applied to all treatments. In addition, nitrogen and potassium were applied to the no-grazing plots after every second baleage cut to compensate for nutrients removed. Details of nutrients applied are given in Table 2. Grazing Management Initially sheep and cattle grazing was used but after 4 months this policy was changed to only cattle (steers or heifers) to ensure maximisation of the treatment differences, as cattle were considered to have a greater leaching potential than sheep. Eight or nine grazings occurred each year on the all-year-grazing treatment. Only seven grazings per year were achieved in the no-winter-grazing treatments. Pasture grown over winter was carried forward to September when it was grazed by cattle. A longer grazing period was used, if necessary, to ensure sufficiently low residual herbage mass to recondition pastures for good growth. Within the treatment guidelines, timing of grazing and cutting events was determined by local Taupo staff, based mainly on available pasture mass but also on quality and, to a small extent, on stock availability for grazing treatments. The three replicate paddocks of the two pasture treatments were grazed consecutively for 2 to 4 days to leave a residual pasture mass similar to that of other post-grazing residuals on the farm at that time of year. Three to four cuts of silage per year were taken from the no-grazing treatment. Management was similar to the Cropping site, with cuts being made at between 2,500 and 3,500 kg DM/ha pasture mass. Yield and quality measurements Before grazing and again after grazing, pasture mass was determined by rising plate meter, with 50–100 readings/ha being collected. Apparent pasture harvested was determined by difference. Pre grazing pasture quality was assessed on pasture hand-plucked at random within each plot. Nitrogen content and pre-grazing mass was used to estimate N available for grazing. The same N content and the post-grazing mass was used to estimate residual N. Nitrogen utilised was determined by difference. Nitrate leaching measurements Nitrate leaching was measured by a combination of soil solution sampling from ceramic suction cups (measuring drainage nitrate concentration) and water balance modelling based on climate data to estimate drainage volumes. Ceramic suction samplers were installed in autumn 2003 at both sites at a depth of 600 mm. Ten cups per plot were installed in the cropping trial and 20 cups per plot in the grazing trial. The higher density of ceramic cups in the grazing trial was deemed necessary to adequately sample the random distribution of urine patches that contribute most N leaching. Soil solution sampling was carried out once drainage since the last sampling exceeded 40mm. The extracted soil water was analysed for N in the form of nitrate-N, ammonium-N and dissolved organic N. For each sampling the drainage volume (estimated by water
10
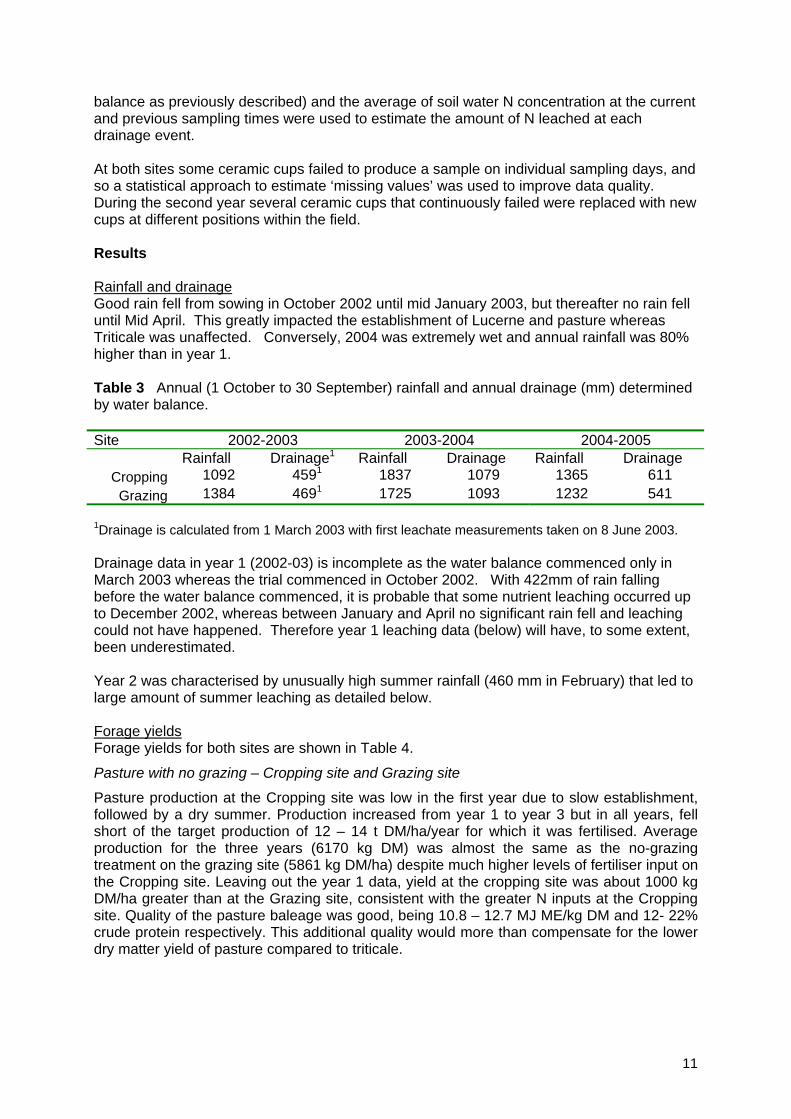
balance as previously described) and the average of soil water N concentration at the current and previous sampling times were used to estimate the amount of N leached at each drainage event. At both sites some ceramic cups failed to produce a sample on individual sampling days, and so a statistical approach to estimate ‘missing values’ was used to improve data quality. During the second year several ceramic cups that continuously failed were replaced with new cups at different positions within the field. Results Rainfall and drainage Good rain fell from sowing in October 2002 until mid January 2003, but thereafter no rain fell until Mid April. This greatly impacted the establishment of Lucerne and pasture whereas Triticale was unaffected. Conversely, 2004 was extremely wet and annual rainfall was 80% higher than in year 1. Table 3 Annual (1 October to 30 September) rainfall and annual drainage (mm) determined by water balance. Site 2002-2003 2003-2004 2004-2005 Rainfall Drainage1 Rainfall Drainage Rainfall Drainage
Cropping 1092 4591 1837 1079 1365 611 Grazing 1384 4691 1725 1093 1232 541
1Drainage is calculated from 1 March 2003 with first leachate measurements taken on 8 June 2003. Drainage data in year 1 (2002-03) is incomplete as the water balance commenced only in March 2003 whereas the trial commenced in October 2002. With 422mm of rain falling before the water balance commenced, it is probable that some nutrient leaching occurred up to December 2002, whereas between January and April no significant rain fell and leaching could not have happened. Therefore year 1 leaching data (below) will have, to some extent, been underestimated. Year 2 was characterised by unusually high summer rainfall (460 mm in February) that led to large amount of summer leaching as detailed below. Forage yields Forage yields for both sites are shown in Table 4.
Pasture with no grazing – Cropping site and Grazing site
Pasture production at the Cropping site was low in the first year due to slow establishment, followed by a dry summer. Production increased from year 1 to year 3 but in all years, fell short of the target production of 12 – 14 t DM/ha/year for which it was fertilised. Average production for the three years (6170 kg DM) was almost the same as the no-grazing treatment on the grazing site (5861 kg DM/ha) despite much higher levels of fertiliser input on the Cropping site. Leaving out the year 1 data, yield at the cropping site was about 1000 kg DM/ha greater than at the Grazing site, consistent with the greater N inputs at the Cropping site. Quality of the pasture baleage was good, being 10.8 – 12.7 MJ ME/kg DM and 12- 22% crude protein respectively. This additional quality would more than compensate for the lower dry matter yield of pasture compared to triticale.
11
Lucerne Performance increased each year with best production of 11.5 t DM/year in year 3 and slightly less in year 4. After the establishment year, lucerne had significantly higher annual production than other treatments. This increasing productivity over time reflected the establishment pattern of lucerne, whereby initial resources are directed to establishing a root system before forage yield is maximised. In addition, better weed control and general growth conditions (as seen in pasture yield in year 3) in the latter period of the trial probably contributed to increasing yield over time.
Quality of the resulting silage was generally good, ranging from 8.5 – 11.9 MJME/kg DM and 18 – 30% crude protein respectively. Only two cuts of baleage had ME values < 10. A black spot leaf disease was noted at the end of each growing season and this, coupled with herbicidal weed control at this time, resulted in leaf drop.
Triticale
The Triticale-Annual ryegrass combination had the highest and most consistent dry matter yield over the 3 years of the trial. This was mostly due to the relatively good performance of triticale in year 1, when slow establishment and a very dry summer affected both lucerne and perennial pasture. With good rain to December 2002 triticale growth was not limited by rainfall. The higher yield in year 3 compared to years 1 and 2 was due to the better performance of the annual ryegrass in that year rather than increased N inputs to the triticale.
Quality of Triticale was only 8 to 10 MJME/kg DM in each of the years and could not be considered as adequate, sometimes even for maintenance feeding of livestock. Protein content was also low, but this was expected given the late stage of growth when harvesting takes place.
Maize
The maize-under-plastic technology was used to gain 4 to 6 weeks extra growth at the start of the growing season in this cold environment. The very thin UV-degradable plastic film covered the plants until they were tall enough to break through. Average 75 mm depth soil temperatures were 5º to 6º warmer under the plastic than elsewhere and on the surface no frost was measured, whereas several frosts occurred between planting and early December. Good early growth was seen in both year 1 (observation only) and year 2 (replicated plots).
In year 1 half of the plastic blew away within the first 1 – 3 weeks and where it remained intact many dead plants were found. These were thought to have died from over-heating before they could break through the plastic. Only 11 t DM/ha was grown in that year. In year 2, with a different grade of plastic, none blew away, and no plants died from over-heating as they broke through the plastic. Excellent growth occurred and the 22 t DM/ha crop was achieved. As expected, crude protein content (7.3%) was low but ME was good (10.8 MJ ME/kg DM).
Grazing trial
At the Grazing site, the all year grazing produced most pasture (Table 4b), most likely due to the greater utilisation of pasture over the winter months, where the greater pasture mass carried in the other two treatments would have experienced some dry matter decay and disappearance. The no grazing treatment produced most dry matter in year 2, possibly due to a combination of higher N inputs and better timing of harvest decisions compared to other treatments.
The lower yield of the winter spelled pasture clearly represents a cost to this system that would need to be compensated by other benefits for it to be viable in comparison to year round grazing.
12
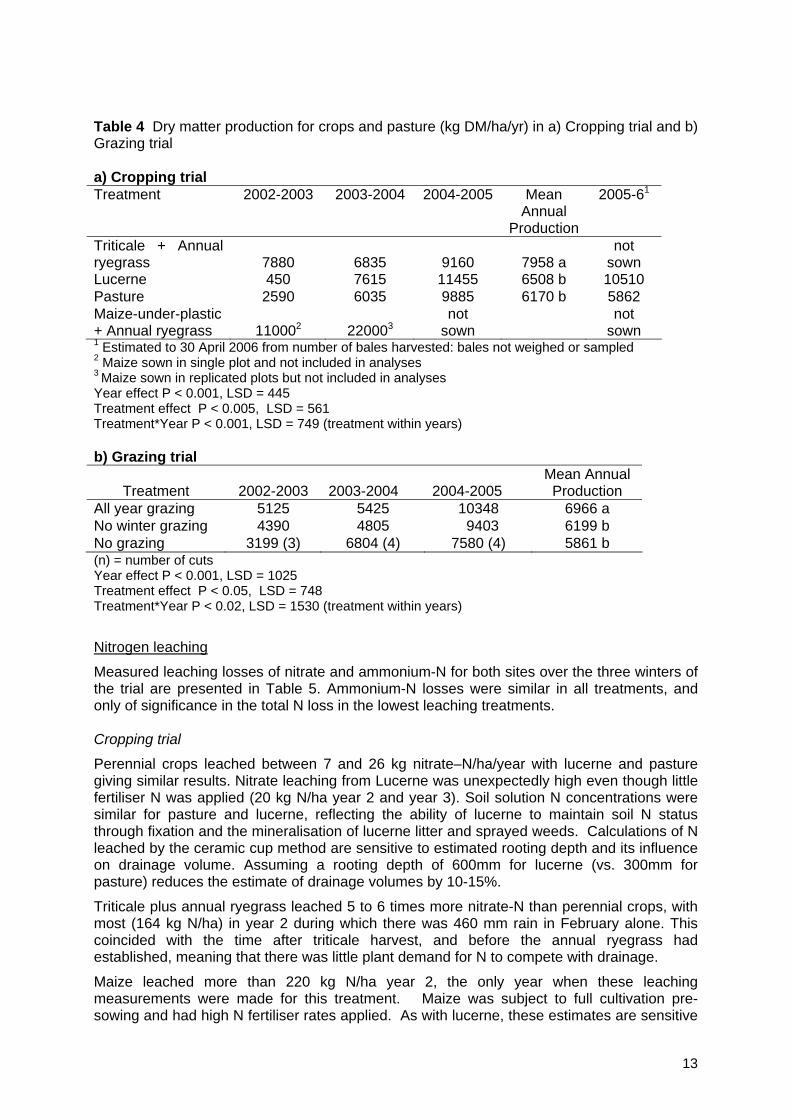
Table 4 Dry matter production for crops and pasture (kg DM/ha/yr) in a) Cropping trial and b) Grazing trial a) Cropping trial Treatment 2002-2003 2003-2004 2004-2005 Mean
Annual Production
2005-61
Triticale + Annual ryegrass
7880
6835
9160
7958 a
not sown
Lucerne 450 7615 11455 6508 b 10510 Pasture 2590 6035 9885 6170 b 5862 Maize-under-plastic + Annual ryegrass
110002
220003
not sown
not sown
1 Estimated to 30 April 2006 from number of bales harvested: bales not weighed or sampled 2 Maize sown in single plot and not included in analyses 3 Maize sown in replicated plots but not included in analyses Year effect P < 0.001, LSD = 445 Treatment effect P < 0.005, LSD = 561 Treatment*Year P < 0.001, LSD = 749 (treatment within years) b) Grazing trial
Treatment
2002-2003
2003-2004
2004-2005
Mean Annual Production
All year grazing 5125 5425 10348 6966 a No winter grazing 4390 4805 9403 6199 b No grazing 3199 (3) 6804 (4) 7580 (4) 5861 b (n) = number of cuts Year effect P < 0.001, LSD = 1025 Treatment effect P < 0.05, LSD = 748 Treatment*Year P < 0.02, LSD = 1530 (treatment within years)
Nitrogen leaching
Measured leaching losses of nitrate and ammonium-N for both sites over the three winters of the trial are presented in Table 5. Ammonium-N losses were similar in all treatments, and only of significance in the total N loss in the lowest leaching treatments. Cropping trial
Perennial crops leached between 7 and 26 kg nitrate–N/ha/year with lucerne and pasture giving similar results. Nitrate leaching from Lucerne was unexpectedly high even though little fertiliser N was applied (20 kg N/ha year 2 and year 3). Soil solution N concentrations were similar for pasture and lucerne, reflecting the ability of lucerne to maintain soil N status through fixation and the mineralisation of lucerne litter and sprayed weeds. Calculations of N leached by the ceramic cup method are sensitive to estimated rooting depth and its influence on drainage volume. Assuming a rooting depth of 600mm for lucerne (vs. 300mm for pasture) reduces the estimate of drainage volumes by 10-15%.
Triticale plus annual ryegrass leached 5 to 6 times more nitrate-N than perennial crops, with most (164 kg N/ha) in year 2 during which there was 460 mm rain in February alone. This coincided with the time after triticale harvest, and before the annual ryegrass had established, meaning that there was little plant demand for N to compete with drainage.
Maize leached more than 220 kg N/ha year 2, the only year when these leaching measurements were made for this treatment. Maize was subject to full cultivation pre-sowing and had high N fertiliser rates applied. As with lucerne, these estimates are sensitive
13
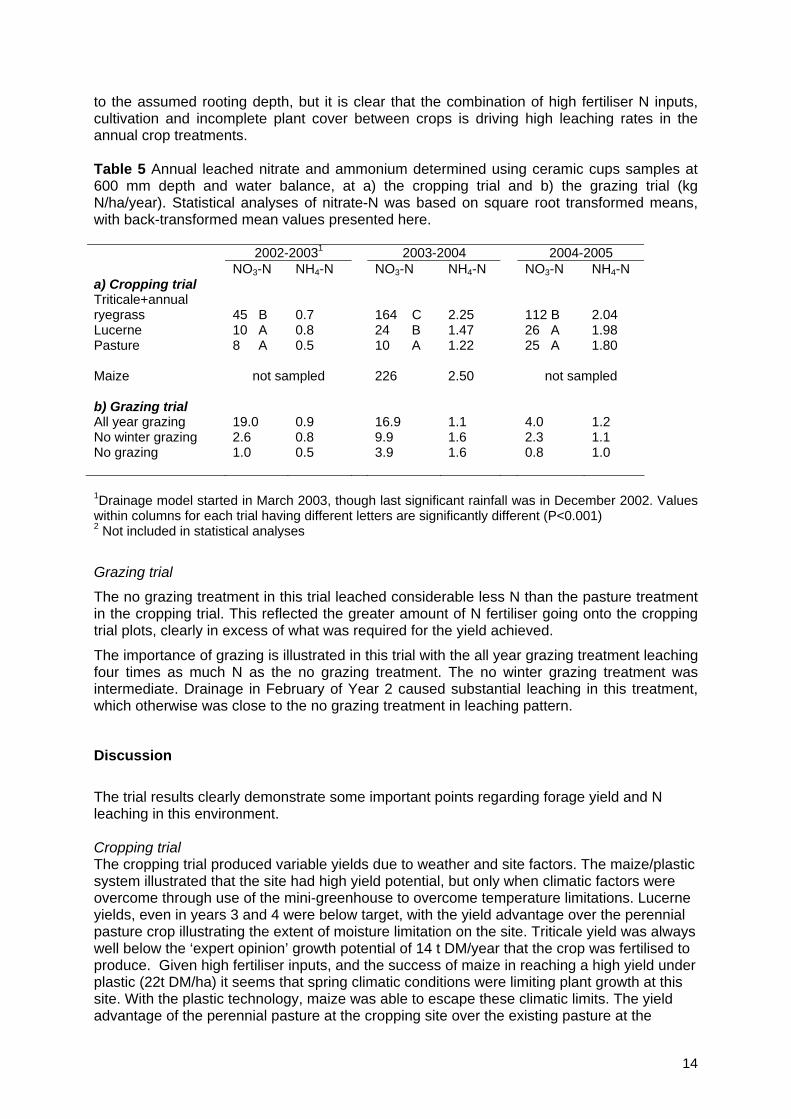
to the assumed rooting depth, but it is clear that the combination of high fertiliser N inputs, cultivation and incomplete plant cover between crops is driving high leaching rates in the annual crop treatments. Table 5 Annual leached nitrate and ammonium determined using ceramic cups samples at 600 mm depth and water balance, at a) the cropping trial and b) the grazing trial (kg N/ha/year). Statistical analyses of nitrate-N was based on square root transformed means, with back-transformed mean values presented here.
2002-20031 2003-2004 2004-2005 NO3-N NH4-N NO3-N NH4-N NO3-N NH4-N a) Cropping trial Triticale+annual ryegrass
45 B
0.7
164 C
2.25
112 B
2.04
Lucerne 10 A 0.8 24 B 1.47 26 A 1.98 Pasture 8 A 0.5 10 A 1.22 25 A 1.80
Maize not sampled 226 2.50 not sampled b) Grazing trial
All year grazing 19.0 0.9 16.9 1.1 4.0 1.2 No winter grazing 2.6 0.8 9.9 1.6 2.3 1.1 No grazing 1.0 0.5 3.9 1.6 0.8 1.0
1Drainage model started in March 2003, though last significant rainfall was in December 2002. Values within columns for each trial having different letters are significantly different (P<0.001) 2 Not included in statistical analyses
Grazing trial
The no grazing treatment in this trial leached considerable less N than the pasture treatment in the cropping trial. This reflected the greater amount of N fertiliser going onto the cropping trial plots, clearly in excess of what was required for the yield achieved.
The importance of grazing is illustrated in this trial with the all year grazing treatment leaching four times as much N as the no grazing treatment. The no winter grazing treatment was intermediate. Drainage in February of Year 2 caused substantial leaching in this treatment, which otherwise was close to the no grazing treatment in leaching pattern.
Discussion The trial results clearly demonstrate some important points regarding forage yield and N leaching in this environment. Cropping trial The cropping trial produced variable yields due to weather and site factors. The maize/plastic system illustrated that the site had high yield potential, but only when climatic factors were overcome through use of the mini-greenhouse to overcome temperature limitations. Lucerne yields, even in years 3 and 4 were below target, with the yield advantage over the perennial pasture crop illustrating the extent of moisture limitation on the site. Triticale yield was always well below the ‘expert opinion’ growth potential of 14 t DM/year that the crop was fertilised to produce. Given high fertiliser inputs, and the success of maize in reaching a high yield under plastic (22t DM/ha) it seems that spring climatic conditions were limiting plant growth at this site. With the plastic technology, maize was able to escape these climatic limits. The yield advantage of the perennial pasture at the cropping site over the existing pasture at the
14
grazed site can be explained by the difference in N inputs to the two sites. Rainfall was similar at both sites. Forage yields at the grazed site illustrated the importance of grazing management in achieving high forage harvested. Both the no graze and no-winter graze plots had lower yields due to losses in pasture over the winter period. The N leaching results showed the risks associated with high N fertiliser inputs combined with cropping systems lacking permanent plant cover. The maize and triticale treatments both showed high leaching losses as a result of unutilised soil and fertiliser N. Given the low yield of the triticale, leaching losses from this crop would have been reduced if we had adopted a fertiliser regime aimed at a 7 tonne yield rather than a 14 t yield. The lucerne crop gave higher than expected N leaching losses. At this site significant drainage occurred, leading to considerable leaching of N given the soil water N content supported by lucerne due to its N fixing ability. Given the good yields and high quality obtained from lucerne, further consideration of the effect of rooting depth and drainage volumes on leaching losses should be undertaken. The pasture crop gave moderate N leaching losses, certainly much lower than would have been seen if the pasture had been grazed rather than harvested. Similar to the triticale, N fertiliser inputs (rates and times) that were more closely matched to actual rather than target yields would have reduced N leaching with probably little impact on yield. This is illustrated by comparison with the results from the grazing trial where leaching losses were 80% less than those in the cropping trial, while yield was 12% less and N fertiliser inputs 70% less. Grazing trial At the grazing site the results clearly showed the impact of grazing animals on N leaching. Where the animals were removed, leaching was very low. With the animals removed over the winter period, leaching was substantially reduced – and the impact of summer drainage on N leaching in this treatment clearly illustrated the link between grazing, drainage and N leaching. The all year grazing treatment had the highest N losses in all seasons. While the no-winter graze treatment illustrates the importance of winter grazing, the level of reduction in N leaching should not be taken to represent the system level impact of this policy change. The trial essentially compared several paddocks within a farm rotation. Other paddocks that would have been subject to different timing of grazing would have produced different results. Leaching at the Grazing site in Year 3 was considerably lower than in Years 1 and 2 for the all year grazing treatment. This pattern was also observed in the Lincoln University lysimeter experiment located at Waihora Station, where urine patches were applied in May each year, but was not seen in the Cropping Trial. The most likely explanation for this seems to be that the timing of grazing in winter in relation to the time taken to convert urine N to nitrate and the timing of drainage events led to low leaching losses. This emphasises the point that this is a plot experiment not a system experiment. In a whole farm system, grazing of different paddocks at different times would have lead to leaching losses where the timing of grazing led to nitrate being in the soil when drainage occurred. Therefore the results of this study cannot be assumed to be the exact amount of N leached from a management system. However, the relative effects of each system were consistent between years.
Economics The changing nature of land use in the Taupo catchment requires us to take a different perspective on performance indicators. With the amount of N leached per hectare limiting
15
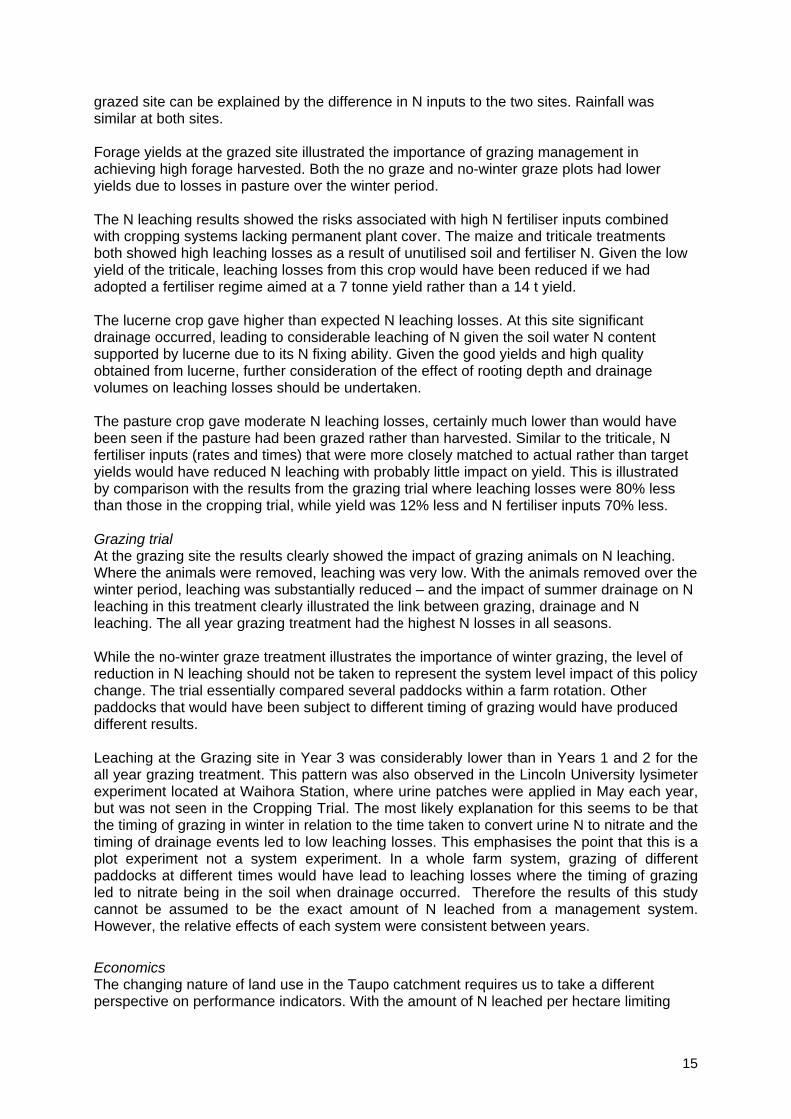
land management – it is useful to compare the various treatments on the basis of kg DM harvested (i.e. saleable product) per N leached. These results are shown in Table 6. Similar results are seen when yields are expressed on a MJME/kg N basis. For Table 6, yields were calculated from all available data to give the most accurate picture of likely yields over the four-year trial period. As such, they are not statistically comparable. Table 6 Calculated mean yield efficiencies (kg DM/kg N leached) and profit ($/kg N leached) for all treatments at two values of profit per kg DM harvested.
Total N Leached (kg N/ha)
Yield (kg DM/ha)
kgDM/kgN Profit $/kg N (3c/kg DM)
Profit $/kg N (8c/kg DM)
Triticale +annual ryegrass
109 7958 73 2.19 5.84
Lucerne 21 7508 351 10.73 28.60 Pasture 16 6093 393 11.42 30.47 Maize 229 22000 96 2.88 7.69
All year grazing 14 6966 485 14.93 39.81
No winter grazing 6 6199 1016 31.00 82.65
No grazing 3 5861 1998 58.61 156.29
The comparisons show that the No grazing permanent pasture at the grazing site was easily the most efficient treatment in terms of yield per kg N leached. This reflected no yield losses due to establishment years and N inputs that clearly matched plant demand. The no winter grazing treatment was next most efficient, with a group comprising the perennial crops (lucerne, pasture–cropping) and all year grazing having similar levels of efficiency. The annual crops were the least efficient, 95% less efficient than the no grazing treatment.
16
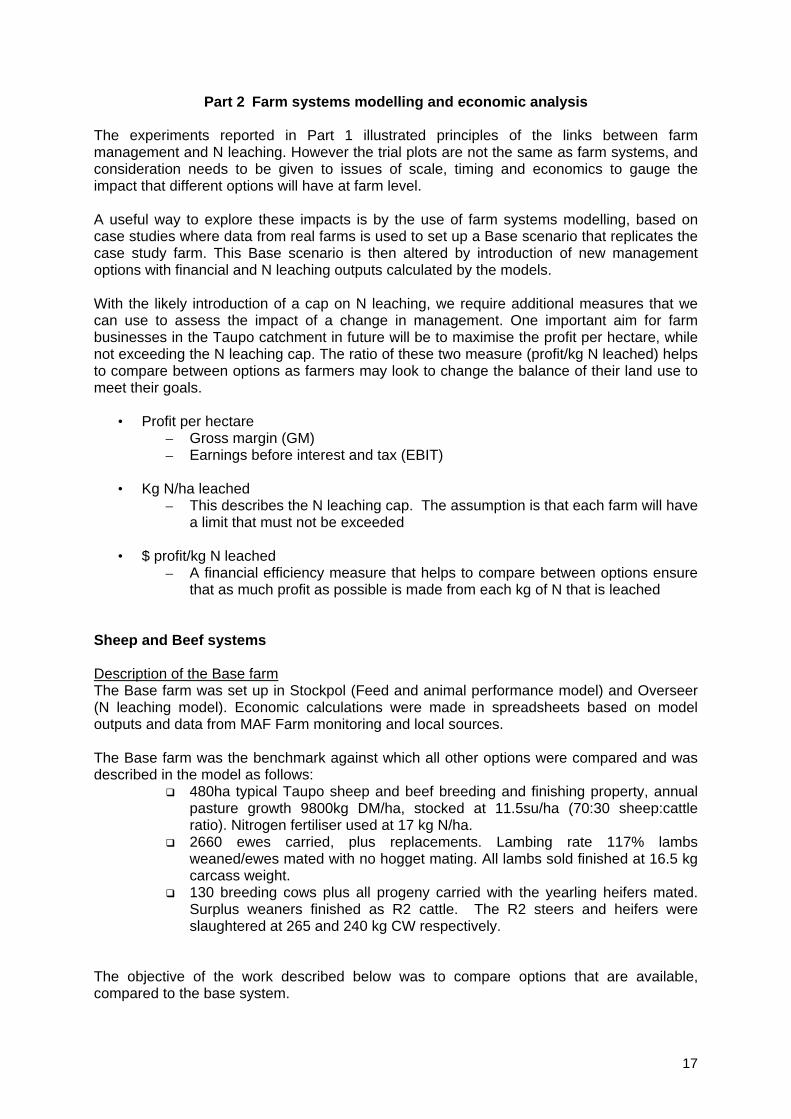
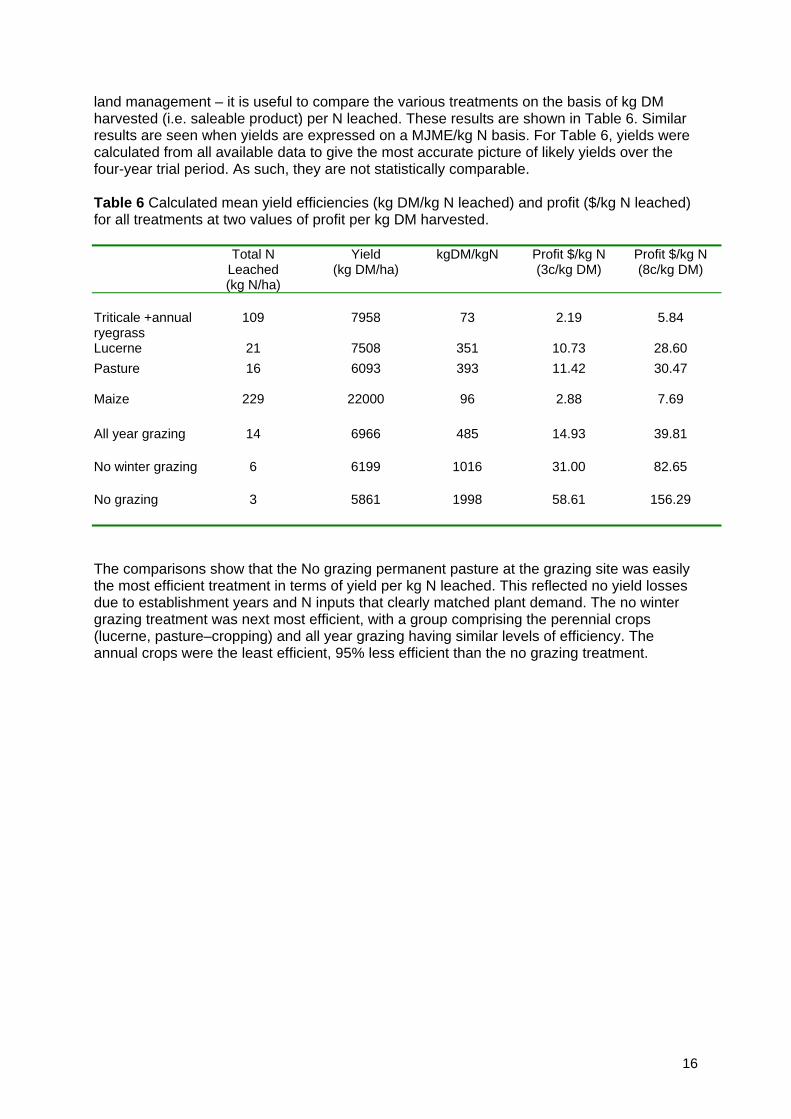
Part 2 Farm systems modelling and economic analysis The experiments reported in Part 1 illustrated principles of the links between farm management and N leaching. However the trial plots are not the same as farm systems, and consideration needs to be given to issues of scale, timing and economics to gauge the impact that different options will have at farm level. A useful way to explore these impacts is by the use of farm systems modelling, based on case studies where data from real farms is used to set up a Base scenario that replicates the case study farm. This Base scenario is then altered by introduction of new management options with financial and N leaching outputs calculated by the models. With the likely introduction of a cap on N leaching, we require additional measures that we can use to assess the impact of a change in management. One important aim for farm businesses in the Taupo catchment in future will be to maximise the profit per hectare, while not exceeding the N leaching cap. The ratio of these two measure (profit/kg N leached) helps to compare between options as farmers may look to change the balance of their land use to meet their goals.
• Profit per hectare – Gross margin (GM) – Earnings before interest and tax (EBIT)
• Kg N/ha leached
– This describes the N leaching cap. The assumption is that each farm will have a limit that must not be exceeded
• $ profit/kg N leached
– A financial efficiency measure that helps to compare between options ensure that as much profit as possible is made from each kg of N that is leached
Sheep and Beef systems Description of the Base farm The Base farm was set up in Stockpol (Feed and animal performance model) and Overseer (N leaching model). Economic calculations were made in spreadsheets based on model outputs and data from MAF Farm monitoring and local sources. The Base farm was the benchmark against which all other options were compared and was described in the model as follows:
480ha typical Taupo sheep and beef breeding and finishing property, annual pasture growth 9800kg DM/ha, stocked at 11.5su/ha (70:30 sheep:cattle ratio). Nitrogen fertiliser used at 17 kg N/ha.
2660 ewes carried, plus replacements. Lambing rate 117% lambs weaned/ewes mated with no hogget mating. All lambs sold finished at 16.5 kg carcass weight.
130 breeding cows plus all progeny carried with the yearling heifers mated. Surplus weaners finished as R2 cattle. The R2 steers and heifers were slaughtered at 265 and 240 kg CW respectively.
The objective of the work described below was to compare options that are available, compared to the base system.
17
Options for comparison with the Base farm Existing knowledge, supported by results from the Field experiments, pointed to several options for this farm. The following were tested:
Improved performance of existing stock: higher sheep fertility and improved pasture quality. Based on the known impact of improved lambing performance on profit, and the fact that most of the extra feed consumed to support this occurs in the low N leaching risk moths from September-February.
Increased sheep:cattle ratio. Based on data showing lower N leaching losses per sheep stock unit due to urine deposition pattern. Supported by currently greater financial returns to sheep over cattle farming.
Cattle wintering options. Based on research showing reduced leaching where cattle are on-off grazed or wintered off during winter. Supported by data from field experiments.
Use of DCD (nitrification inhibitor product). Based on research showing reduced N leaching and improved pasture growth with the use of DCD products (e.g. ecoN. N-care).
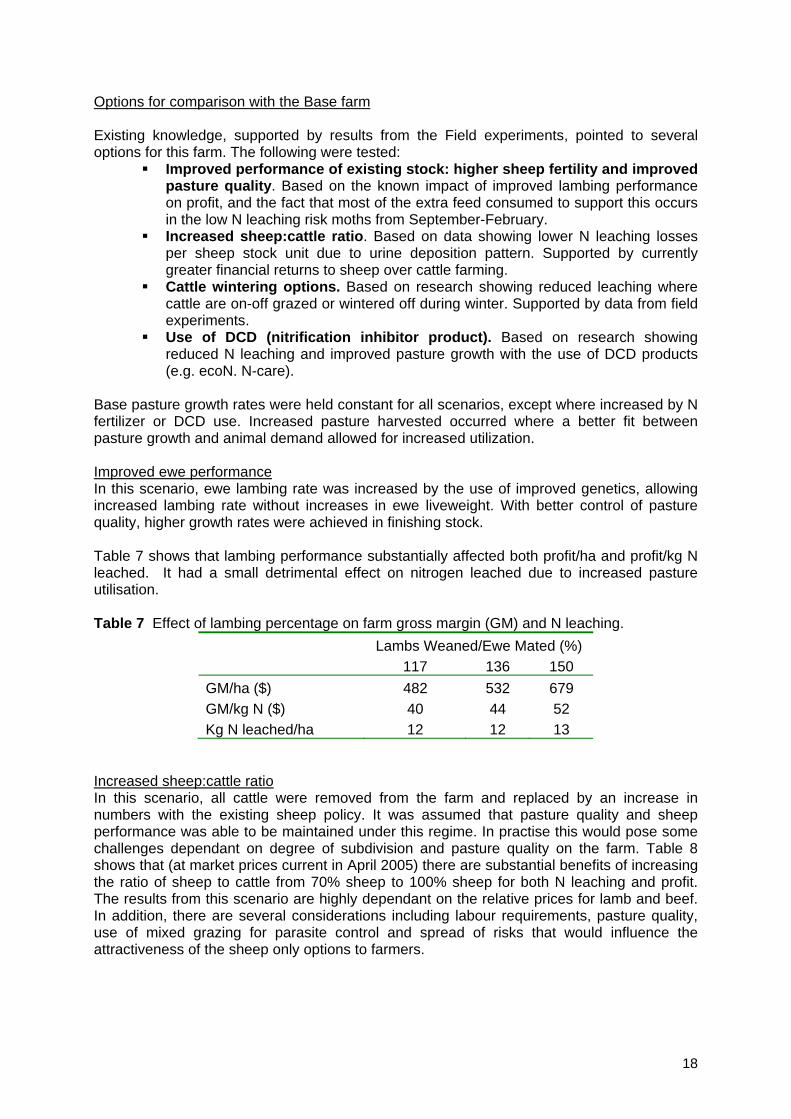
Base pasture growth rates were held constant for all scenarios, except where increased by N fertilizer or DCD use. Increased pasture harvested occurred where a better fit between pasture growth and animal demand allowed for increased utilization. Improved ewe performance In this scenario, ewe lambing rate was increased by the use of improved genetics, allowing increased lambing rate without increases in ewe liveweight. With better control of pasture quality, higher growth rates were achieved in finishing stock. Table 7 shows that lambing performance substantially affected both profit/ha and profit/kg N leached. It had a small detrimental effect on nitrogen leached due to increased pasture utilisation. Table 7 Effect of lambing percentage on farm gross margin (GM) and N leaching.
Lambs Weaned/Ewe Mated (%) 117 136 150 GM/ha ($) 482 532 679 GM/kg N ($) 40 44 52 Kg N leached/ha 12 12 13
Increased sheep:cattle ratio In this scenario, all cattle were removed from the farm and replaced by an increase in numbers with the existing sheep policy. It was assumed that pasture quality and sheep performance was able to be maintained under this regime. In practise this would pose some challenges dependant on degree of subdivision and pasture quality on the farm. Table 8 shows that (at market prices current in April 2005) there are substantial benefits of increasing the ratio of sheep to cattle from 70% sheep to 100% sheep for both N leaching and profit. The results from this scenario are highly dependant on the relative prices for lamb and beef. In addition, there are several considerations including labour requirements, pasture quality, use of mixed grazing for parasite control and spread of risks that would influence the attractiveness of the sheep only options to farmers.
18
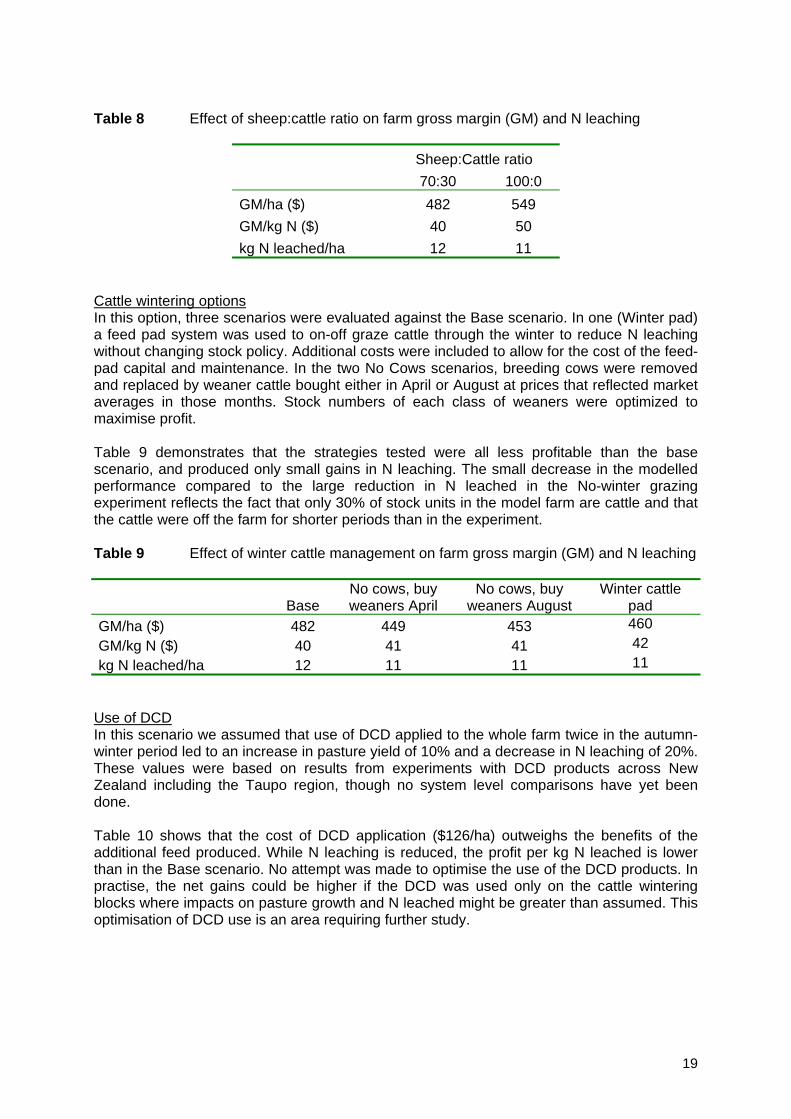
Table 8 Effect of sheep:cattle ratio on farm gross margin (GM) and N leaching
Sheep:Cattle ratio 70:30 100:0 GM/ha ($) 482 549 GM/kg N ($) 40 50 kg N leached/ha 12 11
Cattle wintering options In this option, three scenarios were evaluated against the Base scenario. In one (Winter pad) a feed pad system was used to on-off graze cattle through the winter to reduce N leaching without changing stock policy. Additional costs were included to allow for the cost of the feed-pad capital and maintenance. In the two No Cows scenarios, breeding cows were removed and replaced by weaner cattle bought either in April or August at prices that reflected market averages in those months. Stock numbers of each class of weaners were optimized to maximise profit. Table 9 demonstrates that the strategies tested were all less profitable than the base scenario, and produced only small gains in N leaching. The small decrease in the modelled performance compared to the large reduction in N leached in the No-winter grazing experiment reflects the fact that only 30% of stock units in the model farm are cattle and that the cattle were off the farm for shorter periods than in the experiment. Table 9 Effect of winter cattle management on farm gross margin (GM) and N leaching
Base No cows, buy weaners April
No cows, buy weaners August
Winter cattle pad
GM/ha ($) 482 449 453 460 GM/kg N ($) 40 41 41 42 kg N leached/ha 12 11 11 11
Use of DCD In this scenario we assumed that use of DCD applied to the whole farm twice in the autumn-winter period led to an increase in pasture yield of 10% and a decrease in N leaching of 20%. These values were based on results from experiments with DCD products across New Zealand including the Taupo region, though no system level comparisons have yet been done. Table 10 shows that the cost of DCD application ($126/ha) outweighs the benefits of the additional feed produced. While N leaching is reduced, the profit per kg N leached is lower than in the Base scenario. No attempt was made to optimise the use of the DCD products. In practise, the net gains could be higher if the DCD was used only on the cattle wintering blocks where impacts on pasture growth and N leached might be greater than assumed. This optimisation of DCD use is an area requiring further study.
19
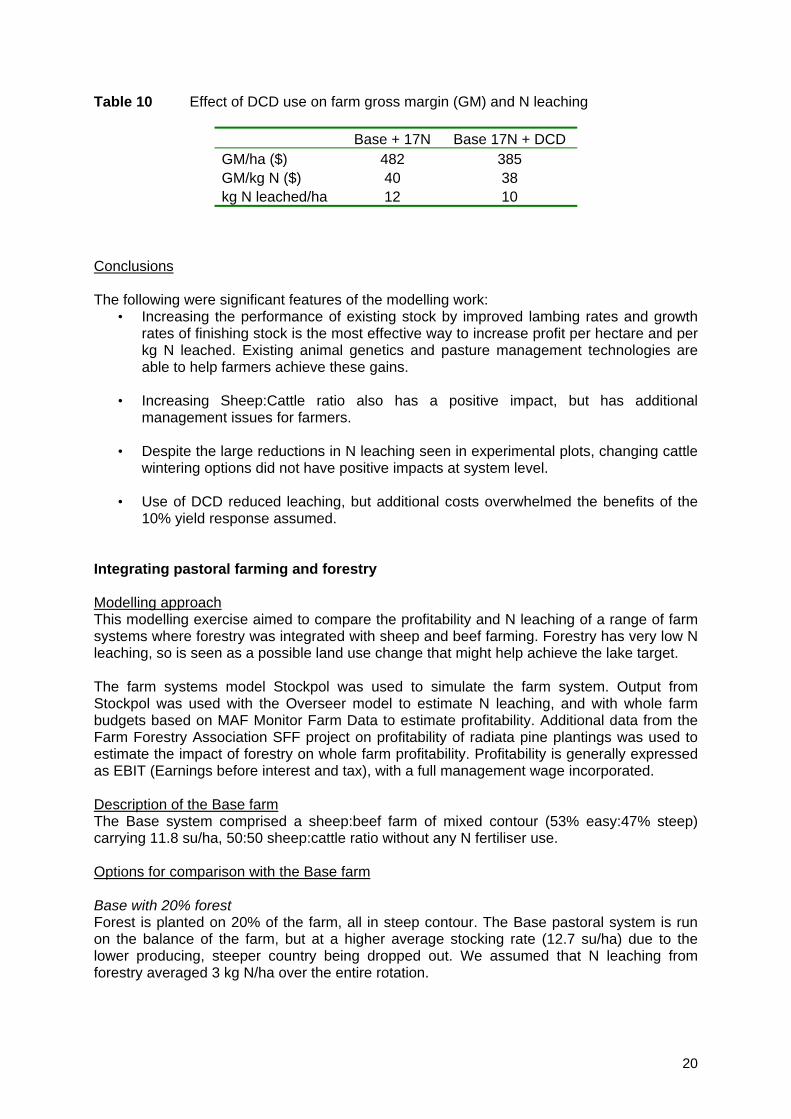
Table 10 Effect of DCD use on farm gross margin (GM) and N leaching
Base + 17N Base 17N + DCD GM/ha ($) 482 385 GM/kg N ($) 40 38 kg N leached/ha 12 10
Conclusions The following were significant features of the modelling work:
• Increasing the performance of existing stock by improved lambing rates and growth rates of finishing stock is the most effective way to increase profit per hectare and per kg N leached. Existing animal genetics and pasture management technologies are able to help farmers achieve these gains.
• Increasing Sheep:Cattle ratio also has a positive impact, but has additional
management issues for farmers.
• Despite the large reductions in N leaching seen in experimental plots, changing cattle wintering options did not have positive impacts at system level.
• Use of DCD reduced leaching, but additional costs overwhelmed the benefits of the
10% yield response assumed. Integrating pastoral farming and forestry Modelling approach This modelling exercise aimed to compare the profitability and N leaching of a range of farm systems where forestry was integrated with sheep and beef farming. Forestry has very low N leaching, so is seen as a possible land use change that might help achieve the lake target. The farm systems model Stockpol was used to simulate the farm system. Output from Stockpol was used with the Overseer model to estimate N leaching, and with whole farm budgets based on MAF Monitor Farm Data to estimate profitability. Additional data from the Farm Forestry Association SFF project on profitability of radiata pine plantings was used to estimate the impact of forestry on whole farm profitability. Profitability is generally expressed as EBIT (Earnings before interest and tax), with a full management wage incorporated. Description of the Base farm The Base system comprised a sheep:beef farm of mixed contour (53% easy:47% steep) carrying 11.8 su/ha, 50:50 sheep:cattle ratio without any N fertiliser use. Options for comparison with the Base farm Base with 20% forest Forest is planted on 20% of the farm, all in steep contour. The Base pastoral system is run on the balance of the farm, but at a higher average stocking rate (12.7 su/ha) due to the lower producing, steeper country being dropped out. We assumed that N leaching from forestry averaged 3 kg N/ha over the entire rotation.
20
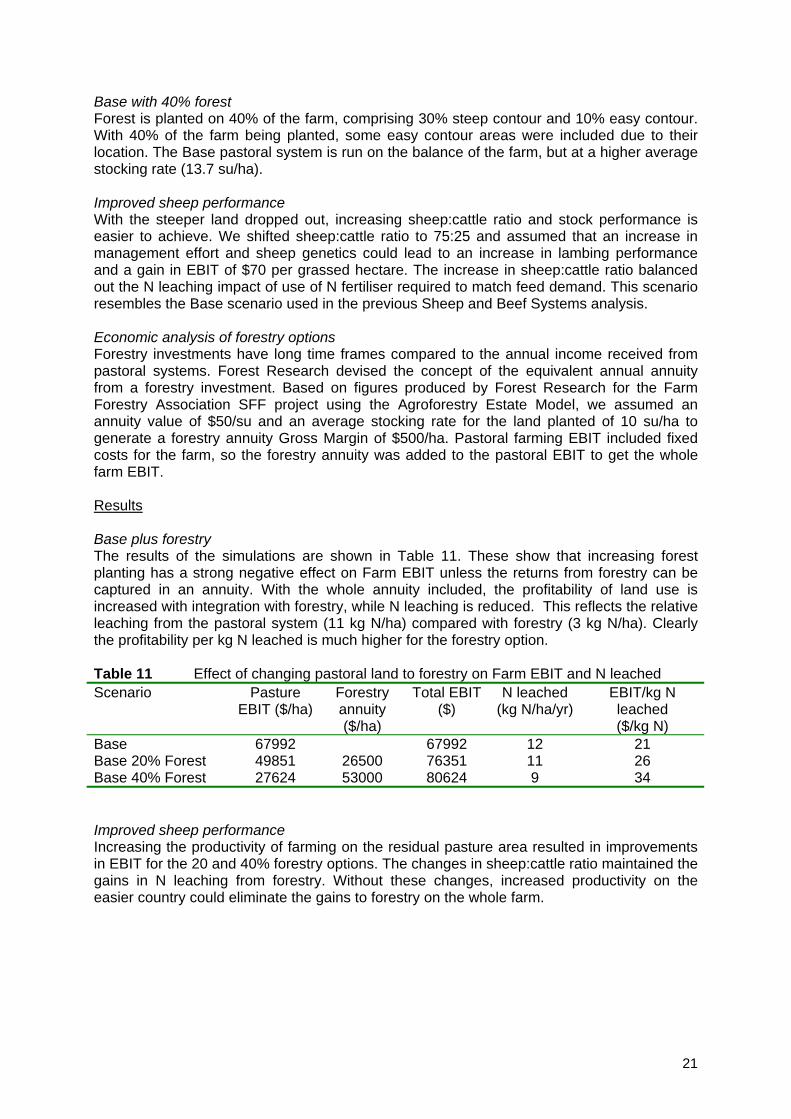
Base with 40% forest Forest is planted on 40% of the farm, comprising 30% steep contour and 10% easy contour. With 40% of the farm being planted, some easy contour areas were included due to their location. The Base pastoral system is run on the balance of the farm, but at a higher average stocking rate (13.7 su/ha). Improved sheep performance With the steeper land dropped out, increasing sheep:cattle ratio and stock performance is easier to achieve. We shifted sheep:cattle ratio to 75:25 and assumed that an increase in management effort and sheep genetics could lead to an increase in lambing performance and a gain in EBIT of $70 per grassed hectare. The increase in sheep:cattle ratio balanced out the N leaching impact of use of N fertiliser required to match feed demand. This scenario resembles the Base scenario used in the previous Sheep and Beef Systems analysis. Economic analysis of forestry options Forestry investments have long time frames compared to the annual income received from pastoral systems. Forest Research devised the concept of the equivalent annual annuity from a forestry investment. Based on figures produced by Forest Research for the Farm Forestry Association SFF project using the Agroforestry Estate Model, we assumed an annuity value of $50/su and an average stocking rate for the land planted of 10 su/ha to generate a forestry annuity Gross Margin of $500/ha. Pastoral farming EBIT included fixed costs for the farm, so the forestry annuity was added to the pastoral EBIT to get the whole farm EBIT. Results Base plus forestry The results of the simulations are shown in Table 11. These show that increasing forest planting has a strong negative effect on Farm EBIT unless the returns from forestry can be captured in an annuity. With the whole annuity included, the profitability of land use is increased with integration with forestry, while N leaching is reduced. This reflects the relative leaching from the pastoral system (11 kg N/ha) compared with forestry (3 kg N/ha). Clearly the profitability per kg N leached is much higher for the forestry option. Table 11 Effect of changing pastoral land to forestry on Farm EBIT and N leached Scenario Pasture
EBIT ($/ha) Forestry annuity ($/ha)
Total EBIT($)
N leached (kg N/ha/yr)
EBIT/kg N leached ($/kg N)
Base 67992 67992 12 21 Base 20% Forest 49851 26500 76351 11 26 Base 40% Forest 27624 53000 80624 9 34 Improved sheep performance Increasing the productivity of farming on the residual pasture area resulted in improvements in EBIT for the 20 and 40% forestry options. The changes in sheep:cattle ratio maintained the gains in N leaching from forestry. Without these changes, increased productivity on the easier country could eliminate the gains to forestry on the whole farm.
21
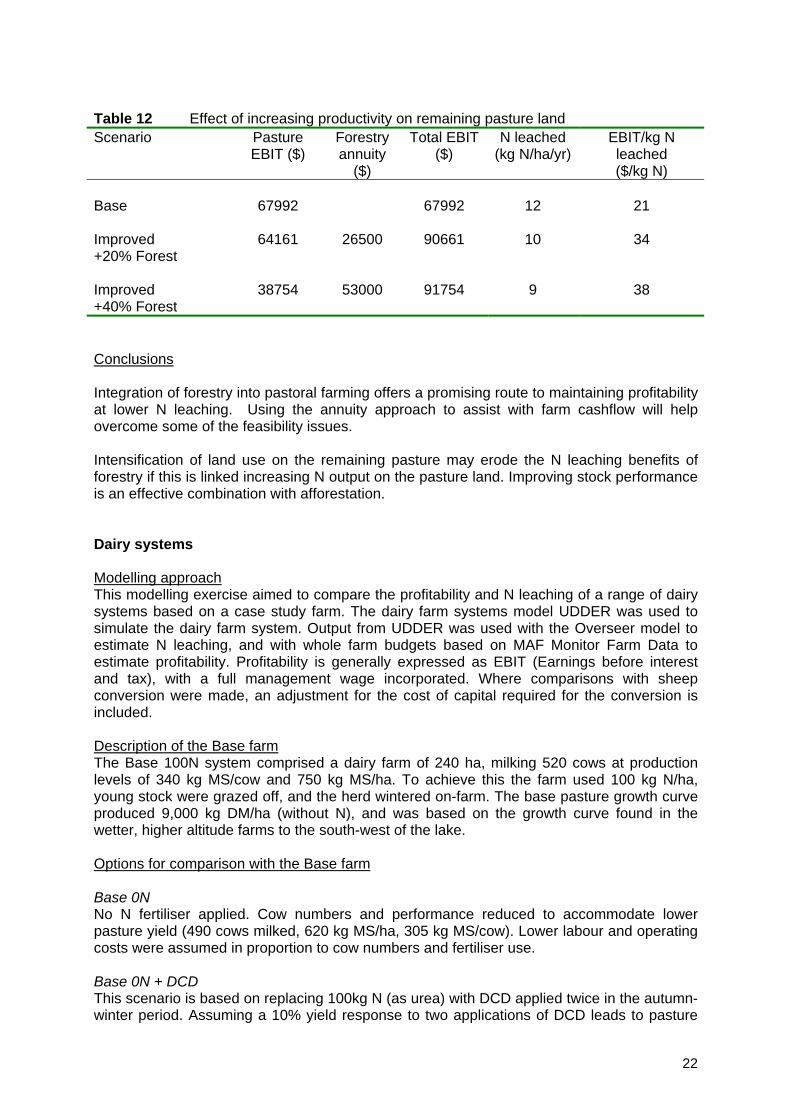
Table 12 Effect of increasing productivity on remaining pasture land Scenario Pasture
EBIT ($) Forestry annuity
($)
Total EBIT ($)
N leached (kg N/ha/yr)
EBIT/kg N leached ($/kg N)
Base
67992
67992
12
21
Improved +20% Forest
64161
26500
90661
10
34
Improved +40% Forest
38754
53000
91754
9
38
Conclusions Integration of forestry into pastoral farming offers a promising route to maintaining profitability at lower N leaching. Using the annuity approach to assist with farm cashflow will help overcome some of the feasibility issues. Intensification of land use on the remaining pasture may erode the N leaching benefits of forestry if this is linked increasing N output on the pasture land. Improving stock performance is an effective combination with afforestation. Dairy systems Modelling approach This modelling exercise aimed to compare the profitability and N leaching of a range of dairy systems based on a case study farm. The dairy farm systems model UDDER was used to simulate the dairy farm system. Output from UDDER was used with the Overseer model to estimate N leaching, and with whole farm budgets based on MAF Monitor Farm Data to estimate profitability. Profitability is generally expressed as EBIT (Earnings before interest and tax), with a full management wage incorporated. Where comparisons with sheep conversion were made, an adjustment for the cost of capital required for the conversion is included. Description of the Base farm The Base 100N system comprised a dairy farm of 240 ha, milking 520 cows at production levels of 340 kg MS/cow and 750 kg MS/ha. To achieve this the farm used 100 kg N/ha, young stock were grazed off, and the herd wintered on-farm. The base pasture growth curve produced 9,000 kg DM/ha (without N), and was based on the growth curve found in the wetter, higher altitude farms to the south-west of the lake. Options for comparison with the Base farm Base 0N No N fertiliser applied. Cow numbers and performance reduced to accommodate lower pasture yield (490 cows milked, 620 kg MS/ha, 305 kg MS/cow). Lower labour and operating costs were assumed in proportion to cow numbers and fertiliser use. Base 0N + DCD This scenario is based on replacing 100kg N (as urea) with DCD applied twice in the autumn-winter period. Assuming a 10% yield response to two applications of DCD leads to pasture
22
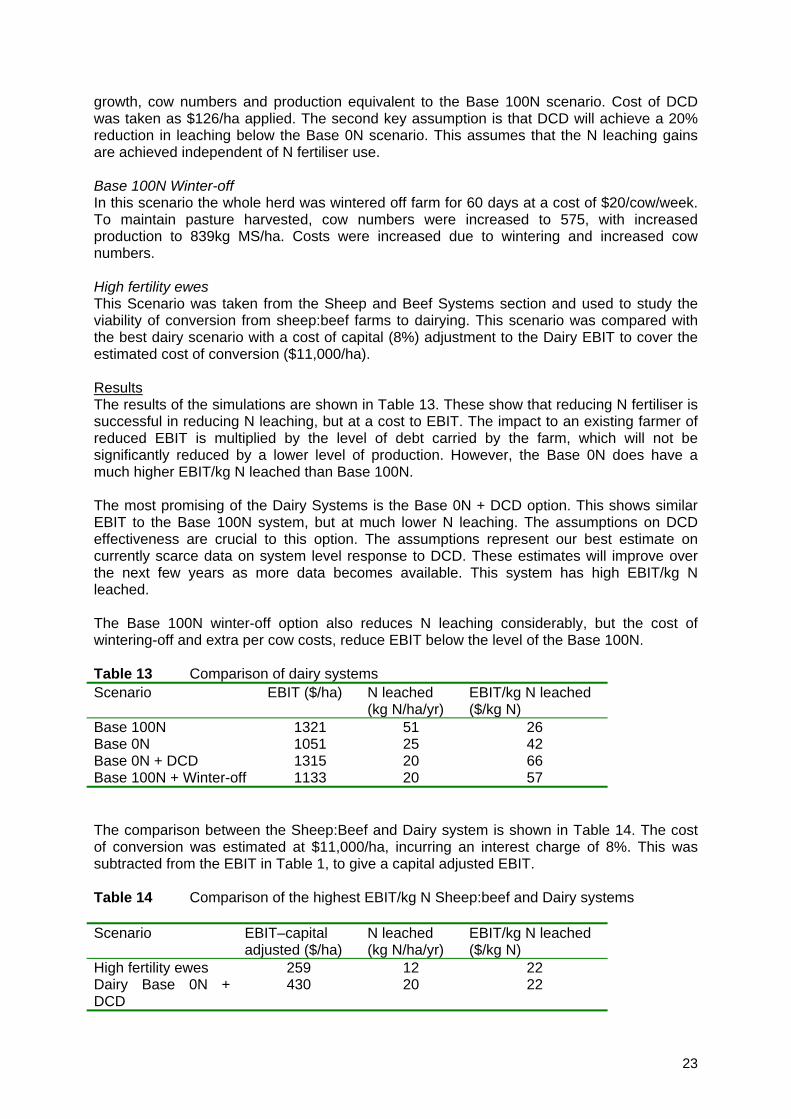
growth, cow numbers and production equivalent to the Base 100N scenario. Cost of DCD was taken as $126/ha applied. The second key assumption is that DCD will achieve a 20% reduction in leaching below the Base 0N scenario. This assumes that the N leaching gains are achieved independent of N fertiliser use. Base 100N Winter-off In this scenario the whole herd was wintered off farm for 60 days at a cost of $20/cow/week. To maintain pasture harvested, cow numbers were increased to 575, with increased production to 839kg MS/ha. Costs were increased due to wintering and increased cow numbers. High fertility ewes This Scenario was taken from the Sheep and Beef Systems section and used to study the viability of conversion from sheep:beef farms to dairying. This scenario was compared with the best dairy scenario with a cost of capital (8%) adjustment to the Dairy EBIT to cover the estimated cost of conversion ($11,000/ha). Results The results of the simulations are shown in Table 13. These show that reducing N fertiliser is successful in reducing N leaching, but at a cost to EBIT. The impact to an existing farmer of reduced EBIT is multiplied by the level of debt carried by the farm, which will not be significantly reduced by a lower level of production. However, the Base 0N does have a much higher EBIT/kg N leached than Base 100N. The most promising of the Dairy Systems is the Base 0N + DCD option. This shows similar EBIT to the Base 100N system, but at much lower N leaching. The assumptions on DCD effectiveness are crucial to this option. The assumptions represent our best estimate on currently scarce data on system level response to DCD. These estimates will improve over the next few years as more data becomes available. This system has high EBIT/kg N leached. The Base 100N winter-off option also reduces N leaching considerably, but the cost of wintering-off and extra per cow costs, reduce EBIT below the level of the Base 100N. Table 13 Comparison of dairy systems Scenario EBIT ($/ha) N leached
(kg N/ha/yr) EBIT/kg N leached ($/kg N)
Base 100N 1321 51 26 Base 0N 1051 25 42 Base 0N + DCD 1315 20 66 Base 100N + Winter-off 1133 20 57 The comparison between the Sheep:Beef and Dairy system is shown in Table 14. The cost of conversion was estimated at $11,000/ha, incurring an interest charge of 8%. This was subtracted from the EBIT in Table 1, to give a capital adjusted EBIT. Table 14 Comparison of the highest EBIT/kg N Sheep:beef and Dairy systems Scenario EBIT–capital
adjusted ($/ha) N leached (kg N/ha/yr)
EBIT/kg N leached ($/kg N)
High fertility ewes 259 12 22 Dairy Base 0N + DCD
430 20 22
23
Table 14 shows that the two systems have very similar levels of EBIT/kg N leached once the capital cost of conversion is included. While dairy systems are more profitable per ha, even the most efficient of the systems examined still leached 67% more N/ha than the sheep:beef system. Given the unproven nature of the critical assumptions underpinning predicted performance of the Base 0N + DCD scenario, this comparison suggests that conversion to dairy systems offers few advantages at present levels of profit, capital costs and N management technologies. Conclusions Wintering-off and the use of DCD both offer options for existing dairy farmers to reduce N leaching while maintaining profitability. The assumptions around the effectiveness of DCD are tentative at this stage. Comparison between the most efficient dairy and sheep:beef systems suggest that the current dairy options are not attractive conversion options in the Lake Taupo context. Acknowledgements This project was funded by Sustainable Farming Fund, Puketapu Group, FertResearch, Dairy InSight and Environment Waikato. Meat and Wool New Zealand contributed funding to the final year of the field trials. Genetic Technologies (Dave Densley) funded the maize trial and contributed expertise to trial management and Wrightson staff (Mike van Plattengen, Murray Lane) contributed to trial management and design. Puketapu Group staff provided valuable support to the project at administrative and operational level. In particular we would like to thank Alan Lower and Colin Gates for direction of grazing trial management and Mike Devlin for assistance with the cropping trial. Taupo Lake Care supported the project at all stages and most local farmers participated in the studies by providing access to their farms for case studies and contributing to the debate around future options. Agricultural contracting was done by Truebridge Contractors and Wyllie Sprayers, and research was conducted by AgResearch and Dexcel. Duncan Smeaton and Stewart Ledgard from AgResearch contributed significantly to the experimental design and scenario analysis.
Science assistance was provided on-site by Laura Bailey, Judy Devlin and Margaret Hughes. Coby Hoogendoorn, Des Costall, Phillip Theobald, Zaneta Park-Ng and Greg Lambert, (AgResearch Palmerston North) and Amanda Judge, Mike Sprosen, Stuart Lindsay and Moira Dexter from AgResearch Ruakura, all helped with trial design, establishment and management.
24