Embed Size (px)
Citation preview

New European Markets –
Baltic operations How to navigate in a recessionary environment
Valdis SiksnisCountry Senior Executive, Nordea Latvia branch

2
Nordea -
the leading bank in the Nordic and Baltic Sea region
RussiaRussia
Branches 51Customers 40,000Total lending EUR 2.5bnMarket rank Top 35
Branches 51Customers 40,000Total lending EUR 2.5bnMarket rank Top 35
LatviaLatvia
Branches 21Customers 68,000Total lending EUR 2.7bnMarket rank 4
Branches 21Customers 68,000Total lending EUR 2.7bnMarket rank 4
LithuaniaLithuania
Branches 17Customers 92,000Total lending EUR 2.0bnMarket rank 4
Branches 17Customers 92,000Total lending EUR 2.0bnMarket rank 4
EstoniaEstonia
Branches 19Customers 73,000Total lending EUR 2.0bnMarket rank 4
Branches 19Customers 73,000Total lending EUR 2.0bnMarket rank 4
DenmarkDenmark
Branches 384Customers 1,544,000Total lending EUR 65bnMarket rank 2
Branches 384Customers 1,544,000Total lending EUR 65bnMarket rank 2
NorwayNorway
Branches 124Customers 753,000Total lending EUR 40bnMarket rank 2
Branches 124Customers 753,000Total lending EUR 40bnMarket rank 2
FinlandFinland
Branches 345Customers 3,000,000Total lending EUR 51bnMarket rank 1
Branches 345Customers 3,000,000Total lending EUR 51bnMarket rank 1
PolandPoland
Branches 96Customers 1,169,000*Total lending EUR 3.5bnMarket rank 13
Branches 96Customers 1,169,000*Total lending EUR 3.5bnMarket rank 13
SwedenSweden
Branches 282Customers 3,473,000Total lending EUR 65bnMarket rank 2-3
Branches 282Customers 3,473,000Total lending EUR 65bnMarket rank 2-3
European Private Banking
European Private Banking
Customers 11,000Total AUM EUR 8bnMarket rank 1 Nordic in Luxembourg
Customers 11,000Total AUM EUR 8bnMarket rank 1 Nordic in Luxembourg
•Incl. Polish Life customers• Assets before eliminations

3
Moderated risk exposure in New European Markets –
increased profitability
An important component in the Nordea long-term strategy
Organic growth strategy has created a solid position in five East European countries
Value creation through profitable organic growth – maintained moderate risk profile
Revenues from New European Markets accounts for approx. 5% of Nordea Group revenues
New European Markets total income, EURm
68
8394
121110
Q3/07 Q4/07 Q1/08 Q2/08 Q3/08

4
Household strategy Based on strong competencies
Private Banking Corporate strategy Selective investments
Existing Nordic customers and new customersSelected global and European business lines
New European Markets
Next level of efficiency to support sustainable growth
Free up resources across the value chain - developing channels, customer service concepts and further streamline processes and IT-systems
Invest in product development, IT-systems and -infrastructure
Strengthen position in relationship-driven customer segments
Support the relationship banking strategy by a focused product strategy
Further differentiate service levels among and within customer segments
Enhance accessibility for all customers and secure efficient servicing - in particular of non-relationship banking customers
Continue to leverage positions within shipping & wealth management
Continue the profitable, risk-balanced growth
Prepare for a closer integration with the rest of the Group
The Nordea organic growth strategy –
4 Pillars

5
Selective investments in New European Markets
Cautious growth in Baltic countriesHarvest from investments – unchanged branch network 2009
Development of new customer segments (e.g. Private Banking)
Organic growth strategy in Poland according to plan - 36 new branches opened the first 9 months 2008
Average break-even after 9 months
Nordea – strong brand name and reputation
Nordea’s growth plan in Russia based on experiences from Poland and the Baltic countries and the full capacity of the Group

6
Key focus
on…
Superior and profitable growth in all segments where we choose to compete:
Nordic and international corporates
Best local corporates in attractive segments
Municipalities and state entities
Employees of corporate customers
Higher income earners
Young people with high potential income
Innovative multichannel distribution and a high level use of e-services
Full product assortment and standardized customer concepts with successful track record and procedures approved by the Nordea Group

7
Macroeconomic situation and trends

8
Will get worse before things will start to improve
Source: Nordea Markets

9
External imbalances have started to improve
Inflation peaked during the summer

10
Unemployment set to rise
Wage pressures easing (at least in Estonia and Latvia)
Source: Nordea Markets

11
Business development and market position in Baltics
12
TODAY
LATV
IAES
TONI
ALI
THUA
NIA
1992 20081994 1996 1998 2000 2002 2004 2006
Acquiring Kredyt Bank’s
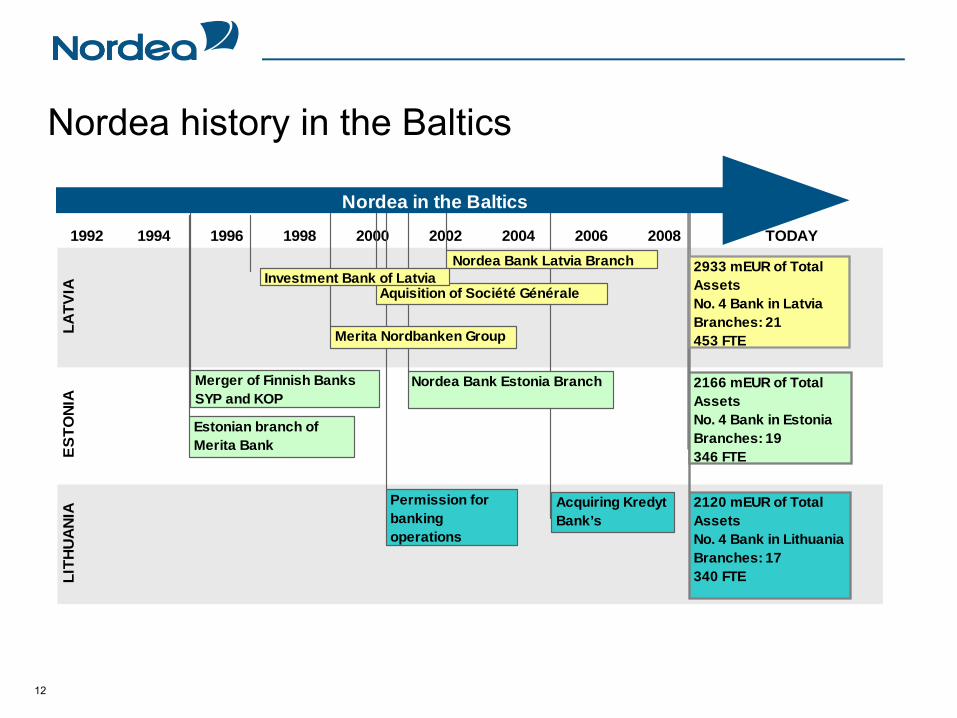
Nordea Bank Latvia Branch
2120 mEUR of Total AssetsNo. 4 Bank in Lithuania Branches: 17 340 FTE
2166 mEUR of Total AssetsNo. 4 Bank in Estonia Branches: 19 346 FTE
2933 mEUR of Total AssetsNo. 4 Bank in LatviaBranches: 21 453 FTE
Nordea Bank Estonia Branch Merger of Finnish Banks SYP and KOP
Permission for banking operations
Aquisition of Société Générale
Merita Nordbanken Group
Estonian branch of Merita Bank
Nordea in the Baltics
Investment Bank of Latvia
Nordea history in the Baltics

13
Market rank by total assets end June 2008
0
2000
4000
6000
8000
10000
12000
Han
saba
nk
SEB
Nor
dea
Sam
po
EKR
E
BIG
ÄRIP
SBM
mio
EU
R
26,29%32,98%22,54%25,20%
9,19%24,56%
-1,65%
4,22%
Latvia5.2%
-3.8% -2.1%
18.9% 3.4%
-7.5% -1.4% 6.6%-5.0% -15.7% -10.3%
13.8%0
1000000
2000000
3000000
4000000
5000000
6000000
7000000
8000000
Han
saba
nka
Par
ex b
anka
SEB
ban
ka
Nor
dea
DnB
NO
RD
Rie
tum
uB
anka
Aizk
rauk
les
bank
aLa
tvija
sH
ipotēk
u un
zem
esU
niC
redi
tB
ank
Latv
ijas
Krā
jban
ka
Nor
vik
Ban
ka
Dan
ske
Ban
k
tEUR
0
1000
2000
3000
4000
5000
6000
7000
8000
SE
B
Han
saba
nk
DnB
NO
RD
Nor
dea
Dan
ske
Ban
k
Sno
ras
Ban
k
Ūki
o B
ank
Šia
ulių
Ban
k
Par
ex B
ank
HV
B
Med
ical
Ban
k
mio
EU
R
1,4%
0,8%8,6%30,0%
1,4%
19,1%
5,1%9,0%5,1%
-3,0% 9,6 %
Estonia
Lithuania

14
Maintained low cost base and further leverage of investments
LithuaniaLithuania
Branches 17Customers 92,000Total lending EUR 2.0bnMarket rank 4
Branches 17Customers 92,000Total lending EUR 2.0bnMarket rank 4
EstoniaEstonia
Branches 19Customers 73,000Total lending EUR 2.0bnMarket rank 4
Branches 19Customers 73,000Total lending EUR 2.0bnMarket rank 4
LatviaLatvia
Branches 22Customers 68,000Total lending EUR 2.7bnMarket rank 4
Branches 22Customers 68,000Total lending EUR 2.7bnMarket rank 4
Development of new customer segments (e.g. Private Banking)
Sales focus on cash management, daily services and savings products
Portfolio quality above market average
Branches 2005
FTE 2005 Branches 2008
FTE 2008
Estonia 11 203 20 346
Latvia 12 215 21 469
Lithuania 10 147 19 315
Prepared for new market situation in Baltic countries

15
Baltic total Latvia Estonia LithuaniaEUR
m Q3/08 Q3/07 Q3/08 Q3/07 Q3/08 Q3/07 Q3/08 Q3/07Total income 105 76 50 37 29 24 26 15Total expenses 42 33 18 14 13 11 11 8Profit before loan losses 61 42 32 23 15 12 14 7
Operating profit 54 42 29 23 14 12 11 7
Increased profitability in Baltic operations
76
105
4254
Q307 Q308
Total income Total expenses Operating profit
EURm

16
Gradually slowing growth ratesGrowth total lending, %
50 49
38
145
65
78
52
9
35
2005 2006 2007 Q308/Q307 Q308/Q208
Total market Nordea
Growth in total lending, EURbn
8,6
10,711,6
7,2
2,7
0,9
2,4 2,5
0,60,6
2005 2006 2007 Q308/Q307 Q308/Q208
Total market Nordea
Nordea accounts for approx 20% of new lending in Q3 – slowing growth rate
Increase mainly explained by new lending to existing customers and to Nordic corporates

17
Credit risk management
18
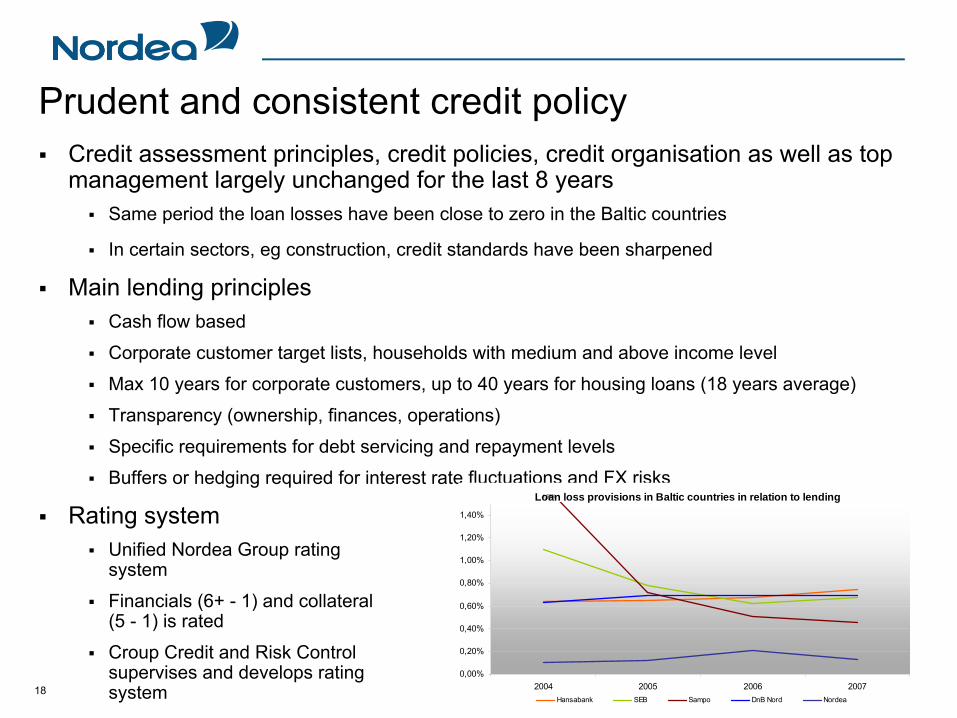
Prudent and consistent credit policyCredit assessment principles, credit policies, credit organisation as well as top management largely unchanged for the last 8 years
Same period the loan losses have been close to zero in the Baltic countries
In certain sectors, eg construction, credit standards have been sharpened
Main lending principlesCash flow based
Corporate customer target lists, households with medium and above income level
Max 10 years for corporate customers, up to 40 years for housing loans (18 years average)
Transparency (ownership, finances, operations)
Specific requirements for debt servicing and repayment levels
Buffers or hedging required for interest rate fluctuations and FX risks
Rating systemUnified Nordea Group rating system
Financials (6+ - 1) and collateral (5 - 1) is rated
Croup Credit and Risk Control supervises and develops rating system
Loan loss provisions in Baltic countries in relation to lending
0,00%
0,20%
0,40%
0,60%
0,80%
1,00%
1,20%
1,40%
2004 2005 2006 2007Hansabank SEB Sampo DnB Nord Nordea
1,68%
19
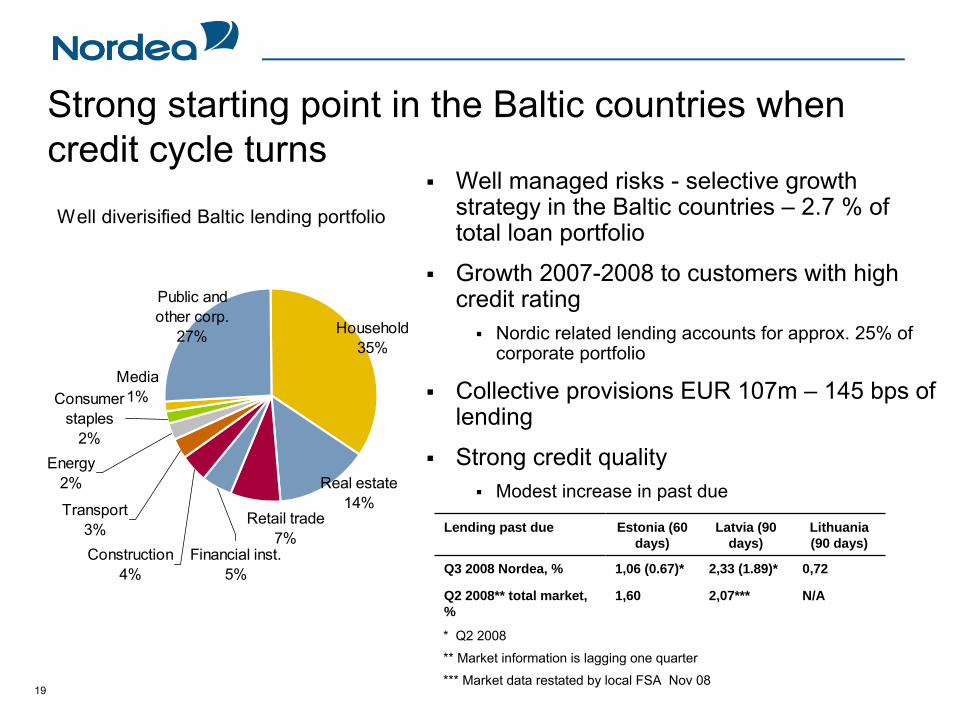
Strong starting point in the Baltic countries when credit cycle turns
Well managed risks - selective growth strategy in the Baltic countries – 2.7 % of total loan portfolio
Growth 2007-2008 to customers with high credit rating
Nordic related lending accounts for approx. 25% of corporate portfolio
Collective provisions EUR 107m – 145 bps of lending
Strong credit qualityModest increase in past due
Well diverisified Baltic lending portfolio
Public and other corp.
27%
Financial inst.5%
Consumer staples
2%Energy
2%
Transport3%
Media1%
Household35%
Real estate14%
Construction 4%
Retail trade7%
Lending past due Estonia (60 days)
Latvia (90 days)
Lithuania (90 days)
Q3 2008 Nordea, % 1,06 (0.67)* 2,33 (1.89)* 0,72
Q2 2008** total market, %
1,60 2,07*** N/A
* Q2 2008
** Market information is lagging one quarter
*** Market data restated by local FSA Nov 08

20
Insignificant individual loan losses Ytd September
Impaired loans of EUR 106m or 1.45% of total lending
Collective allowances for the Baltic countries amounting to EUR 107m
Loan losses remained at low levels
0
1
2
3
4
5
6
7
8
2007 Q108 Q208 Q3080
5
10
15
20
25
30
35
Total lending (lhs) Loan losses in basis points of total lending (rhs)
EURbn bps

21
Nordea Latvian operations

22
Loan growth mainly in corporate segment
0
200
400
600
800
1 000
1 200
1 400
1 600
1 800
2 000
1.kv2005
2.kv2005
3.kv2005
4.kv2005
1.kv2006
2.kv2006
3.kv2006
4.kv2006
1.kv2007
2.kv2007
3.kv2007
4.kv2007
1.kv2008
2.kv2008
3.kv2008
Corporate loans Household loans
EURm
23
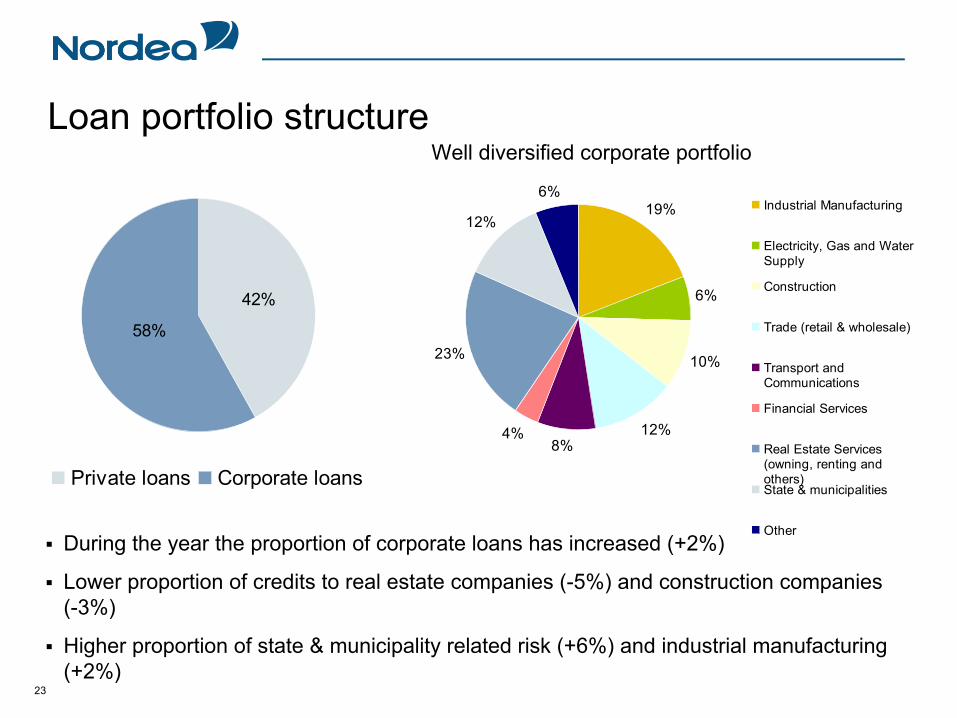
Loan portfolio structure
58%
42%
Private loans Corporate loans
19%
6%
10%
12%8%
4%
23%
12%
6%Industrial Manufacturing
Electricity, Gas and WaterSupply
Construction
Trade (retail & wholesale)
Transport andCommunications
Financial Services
Real Estate Services(owning, renting andothers)State & municipalities
Other During the year the proportion of corporate loans has increased (+2%)
Lower proportion of credits to real estate companies (-5%) and construction companies (-3%)
Higher proportion of state & municipality related risk (+6%) and industrial manufacturing (+2%)
Well diversified corporate portfolio

24
Deposits increases in both Corporate and Household segment
Resident deposit market has been decreasing
Nordea perceived as “safe harbour” – substantial increase of current account balance and deposit volumes during last 5 weeks
0
50
100
150
200
250
300
350
1.kv 2005 3.kv 2005 1.kv 2006 3.kv 2006 1.kv 2007 3.kv 2007 1.kv 2008 3.kv 2008
Corporate deposits Household deposits
EURm

25
Market shares
Large volume of non-resident deposits in the market influences Nordea market share
Deposit market share increase, “house bank”relationships top sales priority
4%5%6%7%8%9%
10%11%12%13%
Q12003
Q32003
Q12004
Q32004
Q12005
Q32005
Q12006
Q32006
Q12007
Q32007
Q12008
Q32008
Corporate loans Household loans
12.2%
11.3%
4.4%
3.2%
1,5%
2,0%
2,5%
3,0%
3,5%
4,0%
4,5%
5,0%
Q12003
Q32003
Q12004
Q32004
Q12005
Q32005
Q12006
Q32006
Q12007
Q32007
Q12008
Q32008
Corporate deposits Household deposits

26
Loan loss provisions
0
500
1 000
1 500
2 000
2 500
3 000
3 500
2002 2003 2004 2005 2006 2007 20080,00%
0,05%
0,10%
0,15%
0,20%
0,25%
Net Loan Losses and provisions Net Loans Losses and provisions from Total Portfolio
2002 2003 2004 2005 2006 2007 2008Loans 128 005 310 144 466 747 749 468 1 207 127 2 211 316 2 859 229Off-balance sheet items 10 610 33 739 40 875 122 365 116 153 165 498 183 089Loan Portfolio Total 138 616 343 883 507 622 871 833 1 323 280 2 376 814 3 042 318Net Loan Losses and provisions 285 2 758 115 213 426 2 874Net Loan Losses and provisions from Total Portfolio 0,21% 0,00% 0,15% 0,01% 0,02% 0,02% 0,09%

27
Operating profit increased by 24%
2006 1-3 Kv. 2007 1-3 Kv. 2008 1-3Kv.Net interest income 12 958 22 493 31 524Comission Income 4 435 11 229 10 711Other income 3 421 3 082 7 425Total income 20 814 36 804 49 660Staff costs 4 913 5 497 8 651Administrative expenses 3 708 7 465 8 496Other costs 515 428 771Total costs 9 136 13 390 17 917Income-expenses 11 678 23 414 31 743Loan provisions 196 68 2 874Operational income 11 481 23 346 28 868C/I 43,9% 36,4% 36,1%
0
10 000
20 000
30 000
40 000
50 000
60 000
2006 1-3 Kv. 2007 1-3 Kv. 2008 1-3Kv.0,0%
5,0%
10,0%
15,0%
20,0%
25,0%
30,0%
35,0%
40,0%
45,0%
50,0%
Income Total expenses Operational profit C/I

2820082007
15
Nordea branch network in Latvia
22 branches
This year:2 new branches in Riga
2 branches expanded in Daugavpils and Liepāja
By the end of the year new branch in Ventspils

29
Profitability in banking sector decreasing –
Nordea an industry exception
Profit before tax (TEUR)
020 000
40 00060 000
80 000100 000120 000
140 000160 000
180 000200 000
Q12006
Q22006
Q32006
Q420006
Q12007
Q22007
Q32007
Q42007
Q12008
Q22008
Q32008
0,0%
2,0%
4,0%
6,0%
8,0%
10,0%
12,0%
14,0%
16,0%
Banking sector Nordea Nordea share of total pretax profit
30
Summary
Solid position in five East European countries
New European Markets an important component in the Nordea long-term strategy
Strong starting point in the Baltic countries when credit cycle turns
Prudent and consistent credit policy
Loan losses remained at low levels - past due lower than market average
Lower proportion of credits to real estate companies and construction companies in Latvian corporate portfolio
Profitability in Latvian banking sector decreasing – Nordea an industry exception

New European Markets –
Baltic operations How to navigate in a recessionary environment
Valdis SiksnisCountry Senior Executive, Nordea Latvia branch

32
Appendix

33
New European Markets 9 month results
Poland Latvia Estonia Lithuania RussiaEURm Ytd
08 Ytd
07 Ytd
08 Ytd
07 Ytd
08 Ytd
07 Ytd
08 Ytd
07 Ytd
08 Ytd
07
Total income 101 62 50 37 29 24 26 15 122 55
Total expenses 56 41 18 14 13 11 11 8 57 33
Profit before loan losses 44 21 32 23 15 12 14 7 65 23
Operating profit 45 21 29 23 14 12 11 7 65 21
Ytd
08 Ytd
07 Ytd
08 Ytd
07 Ytd
08 Ytd
07 Ytd
08 Ytd
07 Ytd
08 Ytd
07
Lending, bn 3.9 2.3 2.9 2.0 2.1 1.5 2.3 1.2 3.5 0.9
Deposits, bn 2.3 1.4 0.6 0.5 0.6 0.6 0.5 0.3 0.6 0.3
Number
of employees
(FTEs) 1 000 1 444 469 405 346 303 315 240 1 704 1 217

34
3rd quarter operating profit by markets
Banking Denmark
Banking Finland
Banking Norway
Banking Sweden
New European Markets
EURm Q308 Chg Q308 Chg Q308 Chg Q308 Chg Q308 Chg
Total income 464 8% 435 3% 252 25% 456 7% 120 76%
Total expenses -212 7% -193 7% -118 6% -242 9% -57 46%
Profit before loan losses 252 10% 242 0% 134 47% 214 5% 63 272%
Operating profit 220 -7% 223 -10% 130 34% 208 8% 58 93
Q308 Q307 Q308 Q307 Q308 Q307 Q308 Q307 Q308 Q307
RaRoCar, % 24 27 34 38 23 18 24 24 39 23
C/I ratio, % 46 46 44 43 47 55 53 52 48 67
Lending, bn 66.0 59.5 51.9 45.7 39.7 35.5 64.1 58.9 14.8 8.1
Deposits, bn 35.1 31.1 34.0 28.4 19.3 18.9 31.3 28.3 4.5 3.2
Number of employees (FTEs) 4 969 4 989 5 457 5 476 1 877 1 806 4 856 4 336 4 291 3 178
35
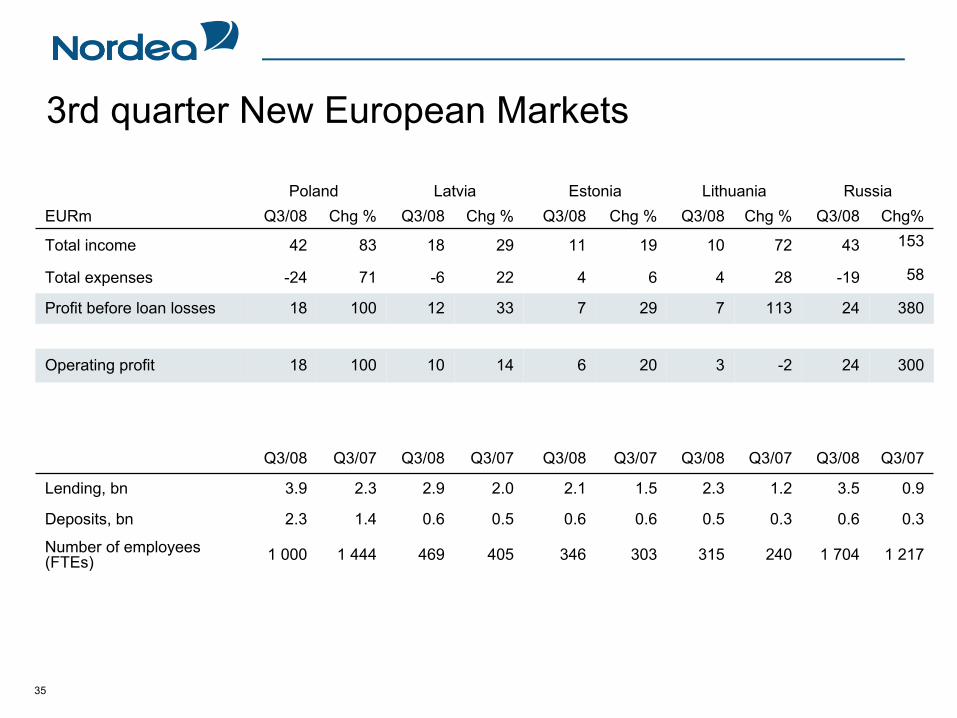
3rd quarter New European Markets
Poland Latvia Estonia Lithuania RussiaEURm Q3/08 Chg % Q3/08 Chg % Q3/08 Chg % Q3/08 Chg % Q3/08 Chg%
Total income 42 83 18 29 11 19 10 72 43 153
Total expenses -24 71 -6 22 4 6 4 28 -19 58
Profit before loan losses 18 100 12 33 7 29 7 113 24 380
Operating profit 18 100 10 14 6 20 3 -2 24 300
Q3/08 Q3/07 Q3/08 Q3/07 Q3/08 Q3/07 Q3/08 Q3/07 Q3/08 Q3/07
Lending, bn 3.9 2.3 2.9 2.0 2.1 1.5 2.3 1.2 3.5 0.9
Deposits, bn 2.3 1.4 0.6 0.5 0.6 0.6 0.5 0.3 0.6 0.3
Number
of employees
(FTEs) 1 000 1 444 469 405 346 303 315 240 1 704 1 217


![Object-oriented rapid prototyping / [by] Valdis Berzins](https://img.pdfslide.us/doc/110x75/61ec7f1fe7d16b283277bfb2/object-oriented-rapid-prototyping-by-valdis-berzins.jpg)