Embed Size (px)
Citation preview
New England Common Assessment Program Science
2007–2008 Technical Report
March 2009
100 Education Way, Dover, NH 03820 (800) 431-8901

i
Table of Contents CHAPTER 1. OVERVIEW ............................................................................................................................................1
1.1 Purpose of the New England Common Assessment Program........................................................................1 1.2 Purpose of this Report ...................................................................................................................................1 1.3 Organization of this Report ...........................................................................................................................2
SECTION I—DESCRIPTION OF THE 2007-08 NECAP SCIENCE TEST ...............................................................3 CHAPTER 2. DEVELOPMENT AND TEST DESIGN ........................................................................................................3
2.1 Development of 2007 Pilot Tests ...................................................................................................................3 2.1.2 Test Design of the 2007 Pilot Tests ............................................................................................................................ 4 2.1.3 Sampling Plan for the 2007 Pilot Tests ...................................................................................................................... 4 2.1.4 Scoring of the 2007 Pilot Tests................................................................................................................................... 4
2.2 Operational Development Process ................................................................................................................5 2.2.1 Assessment Targets .................................................................................................................................................... 5 2.2.2 Inquiry Tasks.............................................................................................................................................................. 5 2.2.3 External Item Review ................................................................................................................................................. 6 2.2.4 Internal Item Review .................................................................................................................................................. 7 2.2.5 Bias and Sensitivity Review ....................................................................................................................................... 7 2.2.6 Item Editing................................................................................................................................................................ 8 2.2.7 Reviewing and Refining ............................................................................................................................................. 8 2.2.8 Operational Test Assembly ........................................................................................................................................ 8 2.2.9 Editing Drafts of Operational Tests ............................................................................................................................ 9 2.2.10 Braille and Large-Print Translation ..................................................................................................................... 10
2.3 Item Types....................................................................................................................................................10 2.4 Operational Test Designs and Blueprints....................................................................................................10
2.4.1 Embedded Field Test ................................................................................................................................................ 11 2.4.2 Test Booklet Design ................................................................................................................................................. 11 2.4.3 Science Test Design ................................................................................................................................................. 11 2.4.4 Science Blueprint ..................................................................................................................................................... 11 2.4.5 The Use of Calculators on the NECAP..................................................................................................................... 12 2.4.6 Test Sessions ............................................................................................................................................................ 12
2.5 Accessibility .................................................................................................................................................14 2.5.1 Publication Specifications ........................................................................................................................................ 14 2.5.2 Focused Reviews...................................................................................................................................................... 14 2.5.3 DIF Analyses............................................................................................................................................................ 15 2.5.4 Accommodations...................................................................................................................................................... 15
CHAPTER 3. TEST ADMINISTRATION .......................................................................................................................17 3.1 Responsibility for Administration ................................................................................................................17 3.2 Administration Procedures ..........................................................................................................................17 3.3 Participation Requirements and Documentation.........................................................................................17 3.4 Administrator Training ................................................................................................................................19 3.5 Documentation of Accommodations ............................................................................................................20 3.6 Test Security.................................................................................................................................................21 3.7 Test and Administration Irregularities ........................................................................................................22 3.8 Test Administration Window........................................................................................................................22 3.9 NECAP Service Center ................................................................................................................................22
CHAPTER 4. SCORING..............................................................................................................................................23 4.1 Machine-Scored Items .................................................................................................................................23 4.2 Hand-Scored Items ......................................................................................................................................23
4.2.1 Scoring Location and Staff ....................................................................................................................................... 24 4.2.2 Benchmarking Meetings with the NECAP State Science Specialists ....................................................................... 25 4.2.3 Scoring of Inquiry Task Items .................................................................................................................................. 25 4.2.4 Reader Recruitment and Qualifications .................................................................................................................... 26 4.2.5 Methodology for Scoring Constructed-Response Items ........................................................................................... 26 4.2.6 Reader Training........................................................................................................................................................ 28 4.2.7 Senior Quality Assurance Coordinator (QAC) and Senior Reader (SR) Training.................................................... 30
SECTION II—STATISTICAL AND PSYCHOMETRIC SUMMARIES ..................................................................35 CHAPTER 5. SCALING AND EQUATING ....................................................................................................................35
5.1 Equating.......................................................................................................................................................36
ii
5.2 Standard Setting...........................................................................................................................................37 5.3 Reported Scale Scores .................................................................................................................................37
5.3.1 Description of Scale ................................................................................................................................................. 37 5.3.2 Calculations .............................................................................................................................................................. 39 5.3.3 Distributions ............................................................................................................................................................. 40
CHAPTER 6. ITEM ANALYSES ..................................................................................................................................41 6.1 Classical Statistics .......................................................................................................................................41 6.2 Differential Item Functioning (DIF) ............................................................................................................43 6.3 Dimensionality Analyses..............................................................................................................................47 6.4 Item Response Theory Analyses...................................................................................................................49
CHAPTER 7. RELIABILITY........................................................................................................................................51 7.1 Reliability and Standard Errors of Measurement........................................................................................52 7.2 Subgroup Reliability ....................................................................................................................................53 7.3 Stratified Coefficient Alpha .........................................................................................................................54 7.4 Reporting Subcategories (Domains) Reliability ..........................................................................................55 7.5 Reliability of Achievement Level Categorization.........................................................................................56
7.5.1 Results of Accuracy, Consistency, and Kappa Analyses .......................................................................................... 57 CHAPTER 8. VALIDITY ............................................................................................................................................59
8.1 Questionnaire Data......................................................................................................................................60 8.2 Validity Studies Agenda ...............................................................................................................................62
8.2.1 External Validity ...................................................................................................................................................... 62 8.2.2 Convergent and Discriminant Validity ..................................................................................................................... 63 8.2.3 Structural Validity .................................................................................................................................................... 64 8.2.4 Procedural Validity................................................................................................................................................... 64
SECTION III—2008-09 NECAP REPORTING............................................................................................................67 CHAPTER 9. SCORE REPORTING ..............................................................................................................................67
9.1 Teaching Year vs. Testing Year Reporting...................................................................................................67 9.2 Primary Reports...........................................................................................................................................67 9.3 Student Report .............................................................................................................................................67 9.4 Item Analysis Reports ..................................................................................................................................68 9.5 School and District Results Reports ............................................................................................................69 9.6 School and District Summary Reports .........................................................................................................71 9.7 Decision Rules .............................................................................................................................................71 9.8 Quality Assurance........................................................................................................................................72
SECTION IV—REFERENCES ......................................................................................................................................75 SECTION V—APPENDICES.........................................................................................................................................77 Appendix A Guidelines for the Development of Science Inquiry Tasks (GDIT’s) Appendix B Committee Membership Appendix C Table of Standard Test Accommodations Appendix D Appropriateness of Accommodations Appendix E Double Blind Scoring Inter-Rater Agreement Percentage Tables Appendix F NECAP Science Standard Setting Report Appendix G Raw to Scaled Score Conversions Appendix H Scales Score Cumulative Density Functions Appendix I Item Response Theory Calibration Results Appendix J Decision Accuracy and Consistency Results Appendix K Student Questionnaire Data Appendix L Sample Reports Appendix M Decision Rules
Chapter 1—Overview 1 2007-08 NECAP Science Technical Report
Chapter 1. OVERVIEW
1.1 Purpose of the New England Common Assessment Program
The New England Common Assessment Program (NECAP) is the result of collaboration among New
Hampshire (NH), Rhode Island (RI), and Vermont (VT) to build a set of tests for grades 3 through 8 and 11 to
meet the requirements of the No Child Left Behind Act (NCLB). The specific purposes of the science tests for
NECAP are as follows: (1) Provide data on student achievement in science at grades 4, 8, and 11 to meet
NCLB requirements; (2) provide information to support program evaluation and improvement; and (3)
provide information to parents and the public on the performance of students and schools. The tests are
constructed to meet rigorous technical criteria, to include universal design elements and accommodations so
that students can access test content, and to gather reliable student demographic information for accurate
reporting. School improvement is supported by
1. providing a transparent test design through the NECAP Science Assessment Targets, distributions of emphasis, and practice tests
2. reporting results by science domain, released items, and subgroups 3. hosting test interpretation workshops to foster understanding of results
Student-level results are provided to schools and families to be used as one piece among all collected
evidence about progress and learning that occurred on the assessment targets for the respective grade span
(K–4, 5–8, 9–11). The results are a status report of a student’s performance against assessment targets, and
they should be used cautiously in concert with local data.
1.2 Purpose of this Report
The purpose of this report is to document the technical aspects of the 2007–08 NECAP science tests
(NECAP Science). Students in grades 4, 8, and 11 participated in the first operational administration of
NECAP Science in May of 2008. This report provides evidence on the technical quality of those tests, which
includes descriptions of the processes used to develop, administer, and score the tests and of those used to
analyze the test results. This report is intended to serve as a guide for replicating and/or improving the
procedures in subsequent years.
Though some parts of this technical report may be used by educated laypersons, the intended
audience is experts in psychometrics and educational research. The report assumes a working knowledge of
measurement concepts such as “reliability” and “validity” and statistical concepts such as “correlation” and
“central tendency.” In some chapters, the reader is presumed also to have basic familiarity with advanced
topics in measurement and statistics.
Chapter 1—Overview 2 2007-08 NECAP Science Technical Report
1.3 Organization of this Report
The organization of this report is based on the conceptual flow of a test’s life span. The report begins
with the initial test specifications and addresses all intermediate steps that lead to final score reporting.
Section I provides a description of the NECAP science tests. It consists of three chapters covering the test
design and development process; the administration of the tests; and scoring. Section II provides statistical
and psychometric information, and includes four chapters covering calibration, scaling, and equating; item
analysis; reliability; and validity. Section III is devoted to NECAP Science score reporting. Section IV
contains the references cited throughout the report, and Section V contains the report appendices.

Chapter 2—Development & Design 3 2007-08 NECAP Science Technical Report
SECTION I—DESCRIPTION OF THE 2007-08 NECAP SCIENCE TEST
Chapter 2. DEVELOPMENT AND TEST DESIGN
2.1 Development of 2007 Pilot Tests
In preparation for the first operational administration of the NECAP science test in May of 2008, a
pilot test was conducted in May of 2007, with the following purposes
Pilot-test all newly developed science items to be used in the common and matrix-equating
sections of the following year’s operational test.
Pilot-test the inquiry task portion of the test with tasks developed and previously administered to
students by the inquiry task developer, PASS at WestEd, to familiarize administrators and
students prior to the operational test.
Try out all procedures and materials of the program (e.g., the timing of test sessions;
accommodations; test administrator and test coordinator manuals; science reference sheets;
inquiry task kits; shipping/receiving processes; and the like) before the first operational
administration.
Provide to schools the opportunity to experience the new assessment so as to assist them in
getting prepared for the first operational administration.
Obtain feedback from students, test administrators, and test coordinators in order to make any
necessary modifications.
The test development process for the pilot test mirrored the process described in this chapter for the
operational test. The NECAP Science test contains three item types: 1-point multiple choice (MC), 2-point
short answer (SA), and 3- and 4-point constructed response (CR3, CR4). SA and CR3 items appear only in
the session 3 inquiry task of the NECAP Science test. Because the pilot test included a previously tested
inquiry task, there were no SA and CR3 items developed for the pilot. The numbers of items developed and
pilot-tested are presented in Table 2-1.
Table 2-1. 2007 NECAP Science Pilot: Numbers of Items Developed and Pilot Tested—Grades 4, 8, and 11
Populate first year’s operational forms
Initial Pilot Test Items Developed
MC 69 153 200 CR4 6 12 20
Chapter 2—Development & Design 4 2007-08 NECAP Science Technical Report
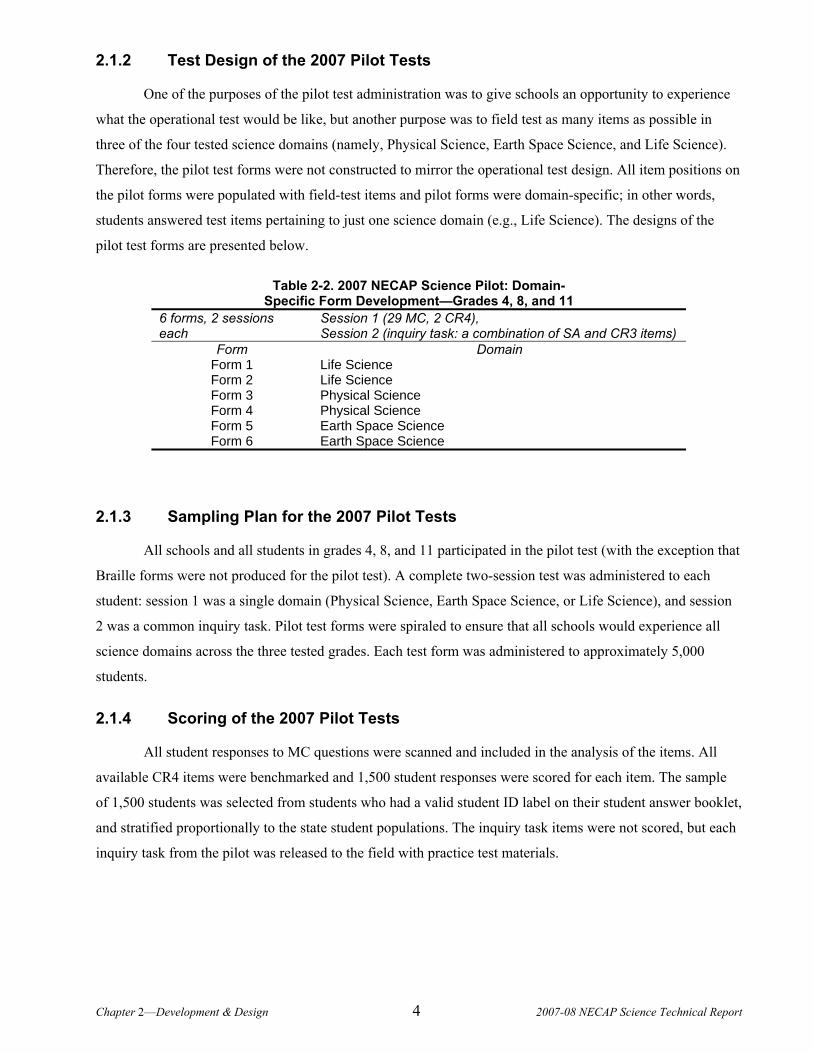
2.1.2 Test Design of the 2007 Pilot Tests
One of the purposes of the pilot test administration was to give schools an opportunity to experience
what the operational test would be like, but another purpose was to field test as many items as possible in
three of the four tested science domains (namely, Physical Science, Earth Space Science, and Life Science).
Therefore, the pilot test forms were not constructed to mirror the operational test design. All item positions on
the pilot forms were populated with field-test items and pilot forms were domain-specific; in other words,
students answered test items pertaining to just one science domain (e.g., Life Science). The designs of the
pilot test forms are presented below.
Table 2-2. 2007 NECAP Science Pilot: Domain- Specific Form Development—Grades 4, 8, and 11
6 forms, 2 sessions each
Session 1 (29 MC, 2 CR4), Session 2 (inquiry task: a combination of SA and CR3 items)
Form Domain Form 1 Life Science Form 2 Life Science Form 3 Physical Science Form 4 Physical Science Form 5 Earth Space Science Form 6 Earth Space Science
2.1.3 Sampling Plan for the 2007 Pilot Tests
All schools and all students in grades 4, 8, and 11 participated in the pilot test (with the exception that
Braille forms were not produced for the pilot test). A complete two-session test was administered to each
student: session 1 was a single domain (Physical Science, Earth Space Science, or Life Science), and session
2 was a common inquiry task. Pilot test forms were spiraled to ensure that all schools would experience all
science domains across the three tested grades. Each test form was administered to approximately 5,000
students.
2.1.4 Scoring of the 2007 Pilot Tests
All student responses to MC questions were scanned and included in the analysis of the items. All
available CR4 items were benchmarked and 1,500 student responses were scored for each item. The sample
of 1,500 students was selected from students who had a valid student ID label on their student answer booklet,
and stratified proportionally to the state student populations. The inquiry task items were not scored, but each
inquiry task from the pilot was released to the field with practice test materials.
Chapter 2—Development & Design 5 2007-08 NECAP Science Technical Report
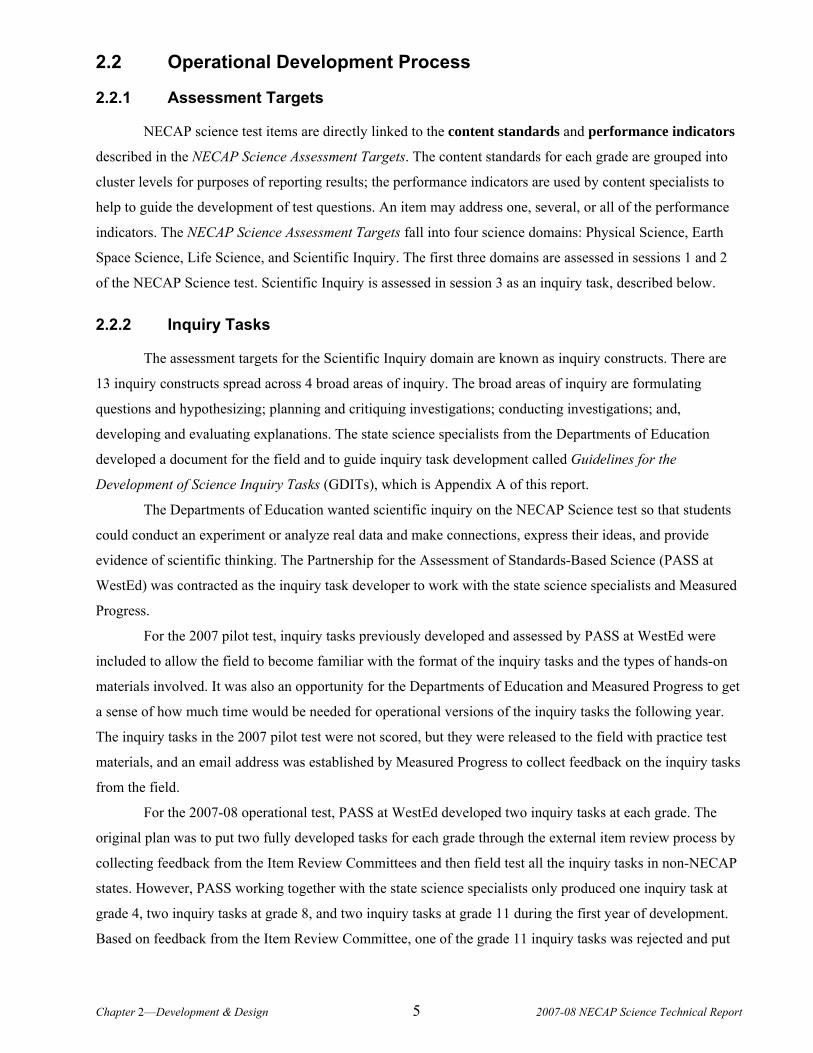
2.2 Operational Development Process
2.2.1 Assessment Targets
NECAP science test items are directly linked to the content standards and performance indicators
described in the NECAP Science Assessment Targets. The content standards for each grade are grouped into
cluster levels for purposes of reporting results; the performance indicators are used by content specialists to
help to guide the development of test questions. An item may address one, several, or all of the performance
indicators. The NECAP Science Assessment Targets fall into four science domains: Physical Science, Earth
Space Science, Life Science, and Scientific Inquiry. The first three domains are assessed in sessions 1 and 2
of the NECAP Science test. Scientific Inquiry is assessed in session 3 as an inquiry task, described below.
2.2.2 Inquiry Tasks
The assessment targets for the Scientific Inquiry domain are known as inquiry constructs. There are
13 inquiry constructs spread across 4 broad areas of inquiry. The broad areas of inquiry are formulating
questions and hypothesizing; planning and critiquing investigations; conducting investigations; and,
developing and evaluating explanations. The state science specialists from the Departments of Education
developed a document for the field and to guide inquiry task development called Guidelines for the
Development of Science Inquiry Tasks (GDITs), which is Appendix A of this report.
The Departments of Education wanted scientific inquiry on the NECAP Science test so that students
could conduct an experiment or analyze real data and make connections, express their ideas, and provide
evidence of scientific thinking. The Partnership for the Assessment of Standards-Based Science (PASS at
WestEd) was contracted as the inquiry task developer to work with the state science specialists and Measured
Progress.
For the 2007 pilot test, inquiry tasks previously developed and assessed by PASS at WestEd were
included to allow the field to become familiar with the format of the inquiry tasks and the types of hands-on
materials involved. It was also an opportunity for the Departments of Education and Measured Progress to get
a sense of how much time would be needed for operational versions of the inquiry tasks the following year.
The inquiry tasks in the 2007 pilot test were not scored, but they were released to the field with practice test
materials, and an email address was established by Measured Progress to collect feedback on the inquiry tasks
from the field.
For the 2007-08 operational test, PASS at WestEd developed two inquiry tasks at each grade. The
original plan was to put two fully developed tasks for each grade through the external item review process by
collecting feedback from the Item Review Committees and then field test all the inquiry tasks in non-NECAP
states. However, PASS working together with the state science specialists only produced one inquiry task at
grade 4, two inquiry tasks at grade 8, and two inquiry tasks at grade 11 during the first year of development.
Based on feedback from the Item Review Committee, one of the grade 11 inquiry tasks was rejected and put
Chapter 2—Development & Design 6 2007-08 NECAP Science Technical Report
back into development, so only one grade 11 inquiry task was approved for field-testing. PASS at WestEd
conducted the field-testing of the four remaining inquiry tasks in the fall of 2007 in classrooms throughout
northern California. The selected schools had varying demographics and population sizes, and each of the
four inquiry tasks was administered to approximately 100 students. PASS at WestEd submitted their Inquiry
Task Field Test Report to the state science specialists and Measured Progress in December of 2007. Based on
the state specialist’s review of the Inquiry Task Field Test Report, they selected one inquiry task at each grade
for the May 2008 test, and the other inquiry tasks were banked for use on future NECAP science tests.
The Inquiry Task Field Test Report is not included as an appendix due to space limitations, but it can
be obtained from any of the three NECAP states as a stand-alone document.
2.2.3 External Item Review
Item Review Committees (IRCs) were formed by the states to provide an external review of the test
items. Committees are made up of teachers, curriculum supervisors, and higher-education faculty from the
states, and all committee members serve rotating terms. A list of the 2007–08 NECAP IRCs for science in
grades 4, 8, and 11 and their affiliations is included as Appendix B. The primary role of the IRCs is to review
test items for the NECAP science tests, provide feedback on the items, and make recommendations on
operational item selection. The IRCs met in Killington, Vermont in August 2007. The committee members
reviewed the entire set of the embedded field-test items proposed for the 2007–08 operational test, including
multiple inquiry tasks per grade, and made recommendations about selecting, revising, or eliminating specific
items from the item pool for the operational test. During the meeting, the members were asked to review each
item against the following criteria:
Assessment Target Alignment
- Is the test item aligned to the appropriate assessment target? - If not, which assessment target or grade level is more appropriate?
Correctness
- Are the items and distracters correct with respect to content accuracy and developmental appropriateness?
- Are the scoring guides consistent with assessment target wording and developmental appropriateness?
Depth of Knowledge
- Are the items coded to the appropriate Depth of Knowledge? - If consensus cannot be reached, is there clarity around why the item might be on the
borderline of two levels?
Language
- Is the item language clear? - Is the item language accurate (syntax, grammar, conventions)?
Chapter 2—Development & Design 7 2007-08 NECAP Science Technical Report
Universal Design
- Is there an appropriate use of simplified language (does not interfere with the construct being assessed)?
- Are charts, tables, and diagrams easy to read and understandable? - Are charts, tables, and diagrams necessary to the item? - Are instructions easy to follow? - Is the item amenable to accommodations—read aloud, signed, or Braille?
2.2.4 Internal Item Review
Measured Progress also conducts an internal review of the items that is performed by staff from the
Curriculum & Assessment and Publications divisions in the company. Below are the important steps in the
internal item review process that are followed:
The lead Measured Progress science test developer reviewed the formatted item, CR scoring
guide, and any graphics.
The content reviewer considered item “integrity,” item content and structure, appropriateness to
designated content area, item format, clarity, possible ambiguity, answer cueing, appropriateness
and quality of graphics, and appropriateness of scoring guide descriptions and distinctions (as
correlated to the item and within the guide itself). The content reviewer also ensured that, for
each item, there was only one correct answer.
The content reviewer also considered scorability and evaluated whether the scoring guide
adequately addressed performance on the item.
Fundamental questions that the content reviewer considered, but was not limited to, included the
following:
- What is the item asking? - Is the key the only possible key? (Is there only one correct answer?) - Is the CR item scorable as written (were the correct words used to elicit the response
defined by the guide)? - Is the wording of the scoring guide appropriate and parallel to the item wording? - Is the item complete (e.g., with scoring guide, content codes, key, grade level, and
contract identified)? - Is the item appropriate for the designated grade level?
2.2.5 Bias and Sensitivity Review
Bias review is an essential component of the development process. During the bias review process,
NECAP science items were reviewed by a committee of teachers, English language learner (ELL) specialists,
special-education teachers, and other educators and members of major constituency groups who represent the
interests of legally protected and/or educationally disadvantaged groups. A list of bias and sensitivity review
committee member names and affiliations are included in Appendix B. Items were examined for issues that
might offend or dismay students, teachers, or parents. Including such groups in the development of

Chapter 2—Development & Design 8 2007-08 NECAP Science Technical Report
assessment items and materials can avoid many unduly controversial issues, and unfounded concerns can be
allayed before the test forms are produced.
2.2.6 Item Editing
Measured Progress editors reviewed and edited the items to ensure uniform style (based on The
Chicago Manual of Style, 15th edition) and adherence to sound testing principles. These principles included
the stipulation that items
were correct with regard to grammar, punctuation, usage, and spelling;
were written in a clear, concise style;
contained unambiguous explanations to students as to what is required to attain a maximum
score;
were written at a reading level that would allow the student to demonstrate his or her knowledge
of the tested subject matter, regardless of reading ability;
exhibited high technical quality regarding psychometric characteristics;
had appropriate answer options or score-point descriptors; and
were free of potentially sensitive content.
2.2.7 Reviewing and Refining
At the conclusion of the Item Review Committee meetings, the test developers and state science
specialists met to review the feedback on the items provided by the teacher committees. At the conclusion of
this review, the state science specialists provided approval to the test developers for the final edits to be made
to the items. After all of the edits that were requested to be made to the items were completed, a follow up
“item selection” meeting was held at Measured Progress. At this face-to-face meeting, the test developers
presented the final edited item sets, and the state science specialists selected the items from the set to be
included in the May 2008 operational tests..
2.2.8 Operational Test Assembly
At Measured Progress, test assembly is the sorting and laying out of item sets into test forms. Criteria
considered during this process included the following:
Content coverage/match to test design. Test developers completed an initial sorting of items
into sets based on a balance of content categories across sessions and forms, as well as a match to
the test design (e.g., number of MC, SA, and CR items).
Item difficulty and complexity. Item statistics drawn from the data analysis of previously tested
items were used to ensure similar levels of difficulty and complexity across forms.

Chapter 2—Development & Design 9 2007-08 NECAP Science Technical Report
Visual balance. Item sets were reviewed to ensure that each reflected a similar length and
“density” of selected items (e.g., number and size of graphics).
Option balance. Each item set was checked to verify that it contained a roughly equivalent
number of key options (A, B, C, and D).
Bias. Each item set was reviewed to ensure fairness and balance based on gender, ethnicity,
religion, socioeconomic status, and other factors.
Page fit. Item placement was modified to ensure the best fit and arrangement of items on any
given page.
Facing-page issues. For multiple items associated with a single stimulus (inquiry task),
consideration was given both to whether those items needed to begin on a left- or right-hand page
to the nature and amount of material that needed to be placed on facing pages. These
considerations served to minimize the amount of “page flipping” required of students.
Relationship between forms. Although matrix items differ from form to form, they must take up
the same number of pages in each form so that sessions begin on the same page in every form.
Therefore, the number of pages needed for the longest form often determines the layout of each
form.
Visual appeal. The visual accessibility of each page of the form was always taken into
consideration, including such aspects as the amount of “white space,” the density of the text, and
the number of graphics.
2.2.9 Editing Drafts of Operational Tests
Any changes made by a test construction specialist must be reviewed and approved by a test
developer. After a form had been laid out in what was considered its final form, it was reread to identify any
final considerations, including the following:
Editorial changes. All text was scrutinized for editorial accuracy, including consistency of
instructional language, grammar, spelling, punctuation, and layout. Measured Progress’s
publishing standards are based on The Chicago Manual of Style, 15th edition.
“Keying” items. Items were reviewed for any information that might “key” or provide
information that would help to answer another item. Decisions about moving keying items are
based on the severity of the “key-in” and the placement of the items in relation to each other
within the form.
Key patterns. The final sequence of keys was reviewed to ensure that their order appeared
random (e.g., no recognizable pattern and no more than one instance per test session of three of
the same key in a row).
Chapter 2—Development & Design 10 2007-08 NECAP Science Technical Report
2.2.10 Braille and Large-Print Translation
Common items for grades 4, 8, and 11 were translated into Braille by a subcontractor that specializes
in test materials for students who are blind or visually impaired. In addition, Form 1 for each grade was also
adapted into a large-print version.
2.3 Item Types
NH, RI, and VT educators and students were familiar with the item types that were used in the 2007–
08 assessment, as all had been previously introduced on the pilot tests administered in May of 2007. The item
types used and the functions of each are described below.
Multiple-Choice (MC) items were administered to provide breadth of coverage of the
assessment targets. Because they require approximately one minute for most students to answer,
these items make efficient use of limited testing time and allow coverage of a wide range of
knowledge and skills.
Short-Answer (SA) items were administered in the inquiry task (session 3) to assess students’
skills and their abilities to work with brief, well-structured problems that had one solution or a
very limited number of solutions. SA items require approximately two to five minutes for most
students to answer. The advantage of this item type is that it requires students to demonstrate
knowledge and skills by generating, rather than merely selecting, an answer.
Constructed-Response (CR) items typically require students to use higher-order thinking
skills—evaluation, analysis, summarization, and so on—in constructing a satisfactory response.
CR items should take most students approximately five to ten minutes to complete. Four-point
CR items (CR4) were administered in sessions 1 and 2 of the test in the Physical Science, Earth
Space Science, and Life Science domains. Three-point CR items (CR3) were included in the
session 3 inquiry task.
Approximately twenty-five percent of the common NECAP items in sessions 1 and 2, as well as the
entire inquiry task at each grade, were released to the public in 2007–08. The released NECAP items are
posted on a Web site hosted by Measured Progress and on the Department of Education Web sites. Schools
are encouraged to incorporate the use of released items in their instructional activities so that students will be
familiar with them.
2.4 Operational Test Designs and Blueprints
Since the beginning of the program, the goal of the NECAP has been to measure what students know
and are able to do by using a variety of test item types; the program was structured to use both common and
matrix-sampled items. (Common items are those taken by all students at a given grade level; matrix-sampled
Chapter 2—Development & Design 11 2007-08 NECAP Science Technical Report
items make up a pool of items that is divided among the multiple forms of the test at each grade level.) This
design provides reliable and valid results at the student level and breadth of coverage of science for school
results while minimizing testing time.
2.4.1 Embedded Field Test
The NECAP Science test includes an embedded field test. Because the field test is taken by all
students, it provides the sample needed to produce reliable data with which to inform the process of selecting
items for future tests.
Embedding the field test achieves two other objectives. First, it creates a pool of replacement items
needed due to natural attrition caused by the release of common items each year. Second, embedding field-
test items into the operational test ensures that students take the items under operational conditions.
2.4.2 Test Booklet Design
To accommodate the embedded field test in the 2007–08 NECAP science test, there were four unique
test forms at each grade. In sessions 1 and 2, the field-test items were distributed among the common items in
a way that was not evident to test takers. The session 3 inquiry task items were common to every test form.
2.4.3 Science Test Design
Table 2-3 summarizes the numbers and types of items that were used in the NECAP science
assessment for 2007–08. In sessions 1 and 2, each MC item was worth one point, and each CR item was
worth four points. In session 3, each SA item was worth two points, and each CR item was worth three points.
Table 2-3. 2007-08 NECAP Science: Numbers of Items and Types Common Matrix – Equating Matrix – Field Test Total per Student
MC SA2 CR3 CR4 MC CR4 MC CR4 MC SA2 CR3 CR4 33 3 4 3 36 3 36 6 51 3 4 6
2.4.4 Science Blueprint
As indicated earlier, the assessment framework for science was based on the NECAP Assessment
Targets, and all items on the NECAP science test were designed to measure a specific assessment target. The
items on the NECAP science test are broken down into the following science domains:
Physical Science
Earth Space Science
Life Science
Scientific Inquiry
Chapter 2—Development & Design 12 2007-08 NECAP Science Technical Report
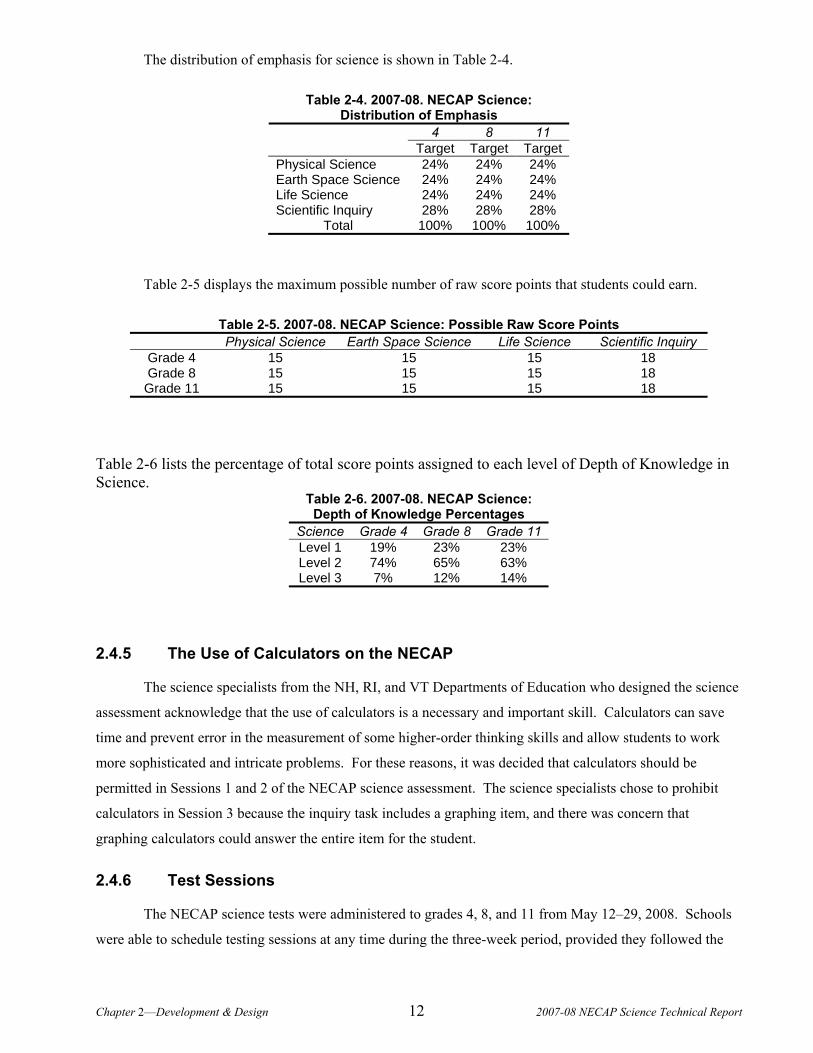
The distribution of emphasis for science is shown in Table 2-4.
Table 2-4. 2007-08. NECAP Science: Distribution of Emphasis
4 8 11 Target Target Target
Physical Science 24% 24% 24% Earth Space Science 24% 24% 24% Life Science 24% 24% 24% Scientific Inquiry 28% 28% 28%
Total 100% 100% 100%
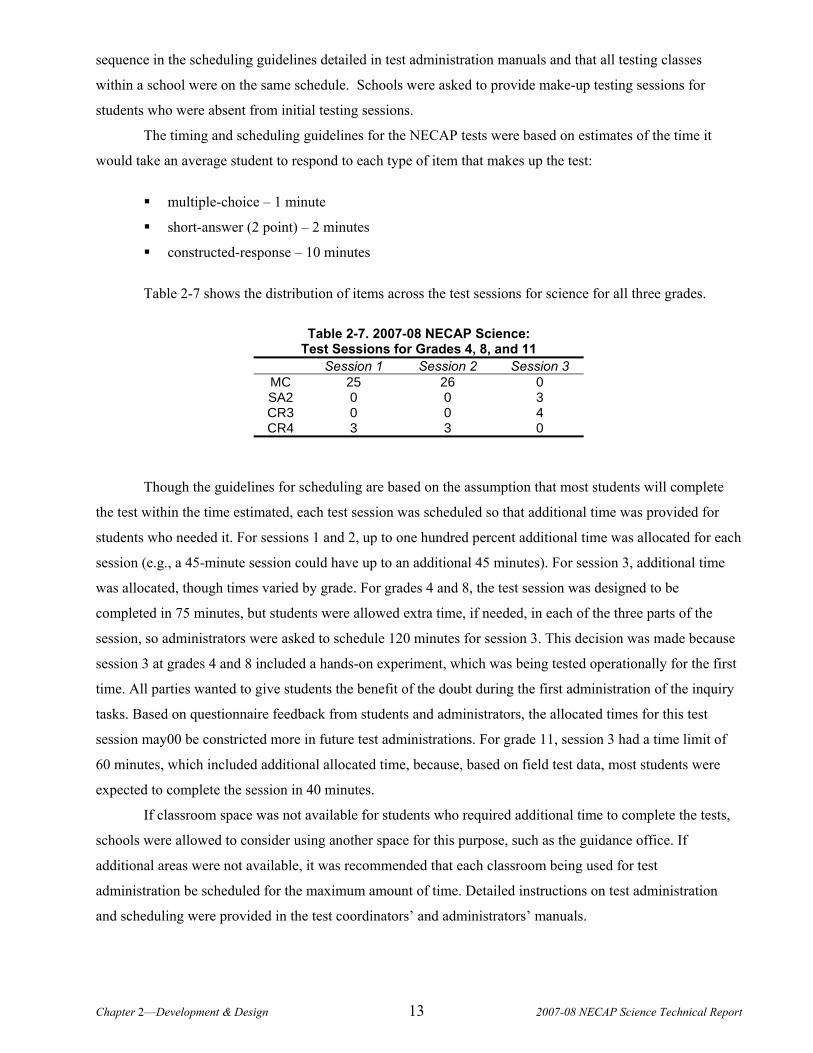
Table 2-5 displays the maximum possible number of raw score points that students could earn.
Table 2-5. 2007-08. NECAP Science: Possible Raw Score Points Physical Science Earth Space Science Life Science Scientific Inquiry
Grade 4 15 15 15 18 Grade 8 15 15 15 18 Grade 11 15 15 15 18
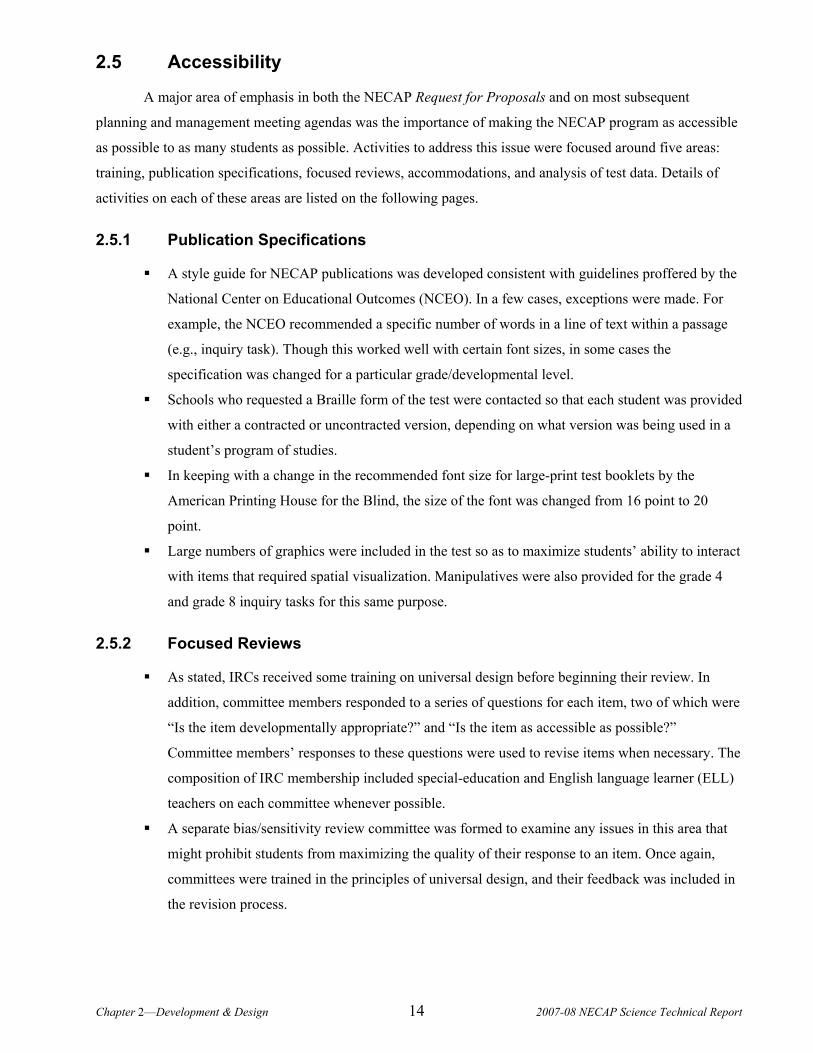
Table 2-6 lists the percentage of total score points assigned to each level of Depth of Knowledge in Science.
Table 2-6. 2007-08. NECAP Science: Depth of Knowledge Percentages
Science Grade 4 Grade 8 Grade 11 Level 1 19% 23% 23% Level 2 74% 65% 63% Level 3 7% 12% 14%
2.4.5 The Use of Calculators on the NECAP
The science specialists from the NH, RI, and VT Departments of Education who designed the science
assessment acknowledge that the use of calculators is a necessary and important skill. Calculators can save
time and prevent error in the measurement of some higher-order thinking skills and allow students to work
more sophisticated and intricate problems. For these reasons, it was decided that calculators should be
permitted in Sessions 1 and 2 of the NECAP science assessment. The science specialists chose to prohibit
calculators in Session 3 because the inquiry task includes a graphing item, and there was concern that
graphing calculators could answer the entire item for the student.
2.4.6 Test Sessions
The NECAP science tests were administered to grades 4, 8, and 11 from May 12–29, 2008. Schools
were able to schedule testing sessions at any time during the three-week period, provided they followed the
Chapter 2—Development & Design 13 2007-08 NECAP Science Technical Report
sequence in the scheduling guidelines detailed in test administration manuals and that all testing classes
within a school were on the same schedule. Schools were asked to provide make-up testing sessions for
students who were absent from initial testing sessions.
The timing and scheduling guidelines for the NECAP tests were based on estimates of the time it
would take an average student to respond to each type of item that makes up the test:
multiple-choice – 1 minute
short-answer (2 point) – 2 minutes
constructed-response – 10 minutes
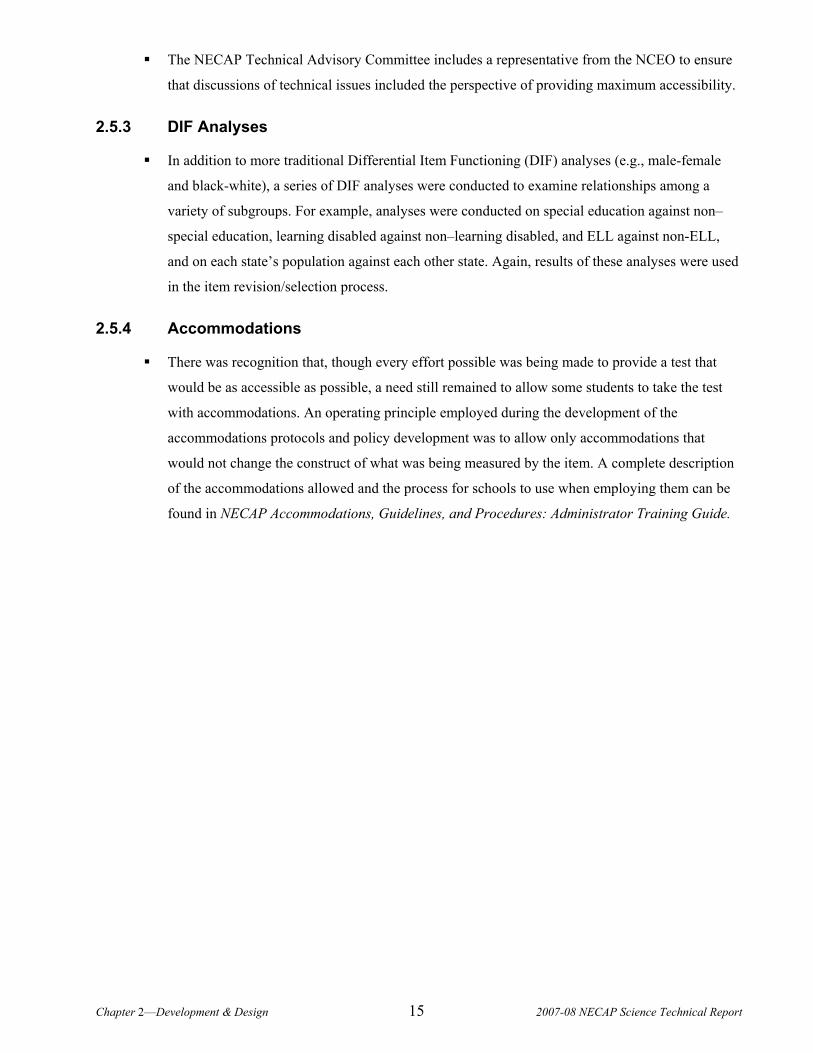
Table 2-7 shows the distribution of items across the test sessions for science for all three grades.
Table 2-7. 2007-08 NECAP Science: Test Sessions for Grades 4, 8, and 11
Session 1 Session 2 Session 3 MC 25 26 0 SA2 0 0 3 CR3 0 0 4 CR4 3 3 0
Though the guidelines for scheduling are based on the assumption that most students will complete
the test within the time estimated, each test session was scheduled so that additional time was provided for
students who needed it. For sessions 1 and 2, up to one hundred percent additional time was allocated for each
session (e.g., a 45-minute session could have up to an additional 45 minutes). For session 3, additional time
was allocated, though times varied by grade. For grades 4 and 8, the test session was designed to be
completed in 75 minutes, but students were allowed extra time, if needed, in each of the three parts of the
session, so administrators were asked to schedule 120 minutes for session 3. This decision was made because
session 3 at grades 4 and 8 included a hands-on experiment, which was being tested operationally for the first
time. All parties wanted to give students the benefit of the doubt during the first administration of the inquiry
tasks. Based on questionnaire feedback from students and administrators, the allocated times for this test
session may00 be constricted more in future test administrations. For grade 11, session 3 had a time limit of
60 minutes, which included additional allocated time, because, based on field test data, most students were
expected to complete the session in 40 minutes.
If classroom space was not available for students who required additional time to complete the tests,
schools were allowed to consider using another space for this purpose, such as the guidance office. If
additional areas were not available, it was recommended that each classroom being used for test
administration be scheduled for the maximum amount of time. Detailed instructions on test administration
and scheduling were provided in the test coordinators’ and administrators’ manuals.
Chapter 2—Development & Design 14 2007-08 NECAP Science Technical Report
2.5 Accessibility
A major area of emphasis in both the NECAP Request for Proposals and on most subsequent
planning and management meeting agendas was the importance of making the NECAP program as accessible
as possible to as many students as possible. Activities to address this issue were focused around five areas:
training, publication specifications, focused reviews, accommodations, and analysis of test data. Details of
activities on each of these areas are listed on the following pages.
2.5.1 Publication Specifications
A style guide for NECAP publications was developed consistent with guidelines proffered by the
National Center on Educational Outcomes (NCEO). In a few cases, exceptions were made. For
example, the NCEO recommended a specific number of words in a line of text within a passage
(e.g., inquiry task). Though this worked well with certain font sizes, in some cases the
specification was changed for a particular grade/developmental level.
Schools who requested a Braille form of the test were contacted so that each student was provided
with either a contracted or uncontracted version, depending on what version was being used in a
student’s program of studies.
In keeping with a change in the recommended font size for large-print test booklets by the
American Printing House for the Blind, the size of the font was changed from 16 point to 20
point.
Large numbers of graphics were included in the test so as to maximize students’ ability to interact
with items that required spatial visualization. Manipulatives were also provided for the grade 4
and grade 8 inquiry tasks for this same purpose.
2.5.2 Focused Reviews
As stated, IRCs received some training on universal design before beginning their review. In
addition, committee members responded to a series of questions for each item, two of which were
“Is the item developmentally appropriate?” and “Is the item as accessible as possible?”
Committee members’ responses to these questions were used to revise items when necessary. The
composition of IRC membership included special-education and English language learner (ELL)
teachers on each committee whenever possible.
A separate bias/sensitivity review committee was formed to examine any issues in this area that
might prohibit students from maximizing the quality of their response to an item. Once again,
committees were trained in the principles of universal design, and their feedback was included in
the revision process.
Chapter 2—Development & Design 15 2007-08 NECAP Science Technical Report
The NECAP Technical Advisory Committee includes a representative from the NCEO to ensure
that discussions of technical issues included the perspective of providing maximum accessibility.
2.5.3 DIF Analyses
In addition to more traditional Differential Item Functioning (DIF) analyses (e.g., male-female
and black-white), a series of DIF analyses were conducted to examine relationships among a
variety of subgroups. For example, analyses were conducted on special education against non–
special education, learning disabled against non–learning disabled, and ELL against non-ELL,
and on each state’s population against each other state. Again, results of these analyses were used
in the item revision/selection process.
2.5.4 Accommodations
There was recognition that, though every effort possible was being made to provide a test that
would be as accessible as possible, a need still remained to allow some students to take the test
with accommodations. An operating principle employed during the development of the
accommodations protocols and policy development was to allow only accommodations that
would not change the construct of what was being measured by the item. A complete description
of the accommodations allowed and the process for schools to use when employing them can be
found in NECAP Accommodations, Guidelines, and Procedures: Administrator Training Guide.

Chapter 3—Test Administration 17 2007-08 NECAP Science Technical Report
Chapter 3. TEST ADMINISTRATION
3.1 Responsibility for Administration
The 2007-08 NECAP Science Principal/Test Coordinator Manual indicated that principals and/or
their designated NECAP test coordinator were responsible for the proper administration of the NECAP
science test. Manuals that contained explicit directions and scripts to be read aloud to students by test
administrators were used in order to ensure the uniformity of administration procedures from school to
school.
3.2 Administration Procedures
Principals and/or their school’s designated NECAP coordinator were instructed to read the
Principal/Test Coordinator Manual before testing and to be familiar with the instructions provided in the Test
Administrator Manuals. The Principal/Test Coordinator Manual provided each school with checklists to help
them to prepare for testing. The checklists outlined tasks to be performed by school staff before, during, and
after test administration. Besides these checklists, the Principal/Test Coordinator Manual described the
testing material being sent to each school and how to inventory the material, track it during administration,
and return it after testing was complete. The Test Administrator Manuals included checklists for the
administrators to prepare themselves, their classrooms, and the students for the administration of the test. The
Test Administrator Manuals contained sections that detailed the procedures to be followed for each test
session, and instructions for preparing the material before the principal/test coordinator would return it to
Measured Progress.
3.3 Participation Requirements and Documentation
The legislation’s intent is for all students in grades 4, 8, and 11 to participate in the NECAP science
test through standard administration, administration with accommodations, or alternate assessment.
Furthermore, any student who is absent during any session of the NECAP science test is expected to makeup
the missed sessions within the three-week testing window.
Schools were required to return a student answer booklet for every enrolled student in the grade level.
On those occasions when it was deemed impossible to test a particular student, school personnel were
required to inform their Department of Education. The states included a grid on the student answer booklets
that listed the approved reasons why a student answer booklet could be returned blank for one or more
sessions of the science test:
Student completed the Alternate Test for the 2007–2008 school year
- If a student completed the alternate test in the current school year, the student was not required to participate in the NECAP science test in 2007-08.
Chapter 3—Test Administration 18 2007-08 NECAP Science Technical Report
Student withdrew from school after May 12, 2008
- If a student withdrew after May 12, 2008 but before completing all of the test sessions, school personnel were instructed to code this reason on the student’s answer booklet.
Student enrolled in school after May 12, 2008
- If a student enrolled after May 12, 2008 and was unable to complete all of the test sessions before the end of the testing administration window, school personnel were instructed to code this reason on the student’s answer booklet.
State-approved special consideration
- Each state department of education had a process for documenting and approving circumstances that made it impossible or not advisable for a student to participate in testing. Schools were required to obtain state approval before beginning testing.
Student was enrolled in school on May 12, 2008 and did not complete test for reasons other than
those listed above
- If a student was not tested for a reason not stated above, school personnel were instructed to code this reason on the student’s answer booklet. These “Other” categories were considered “not state-approved.”
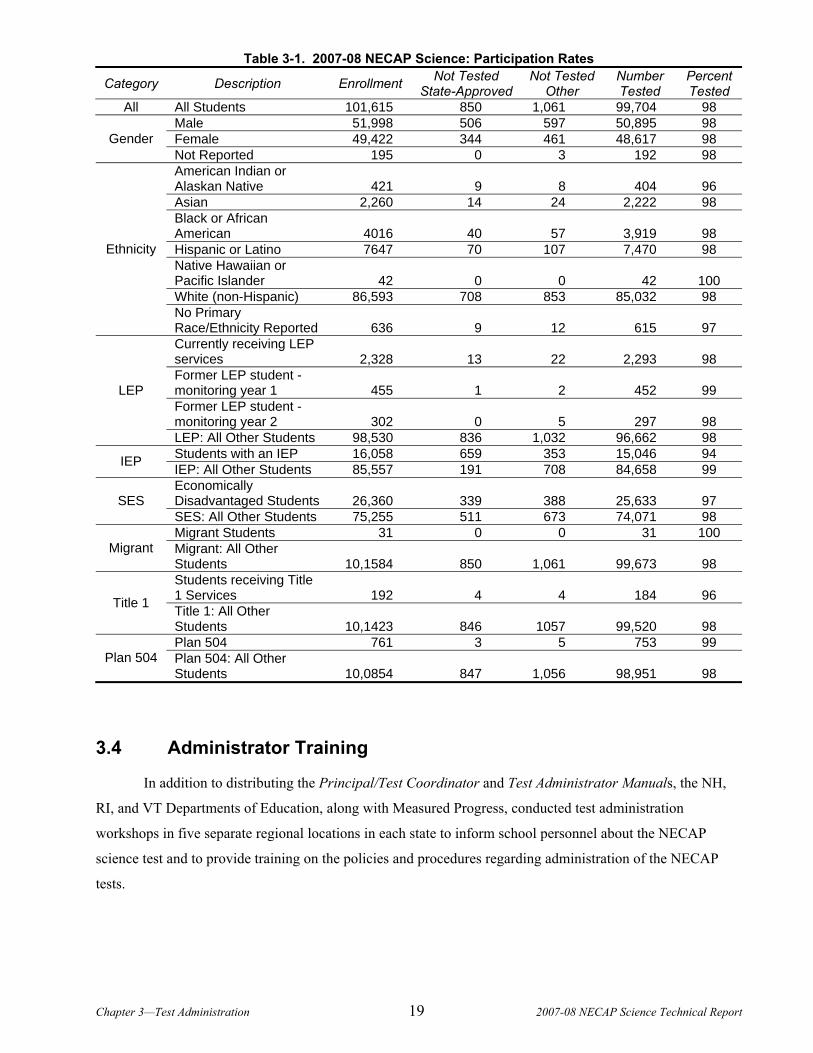
Table 3-1 lists the participation rates of the three states combined in science.
Chapter 3—Test Administration 19 2007-08 NECAP Science Technical Report
Table 3-1. 2007-08 NECAP Science: Participation Rates
Category Description Enrollment Not Tested State-Approved
Not Tested Other
Number Tested
Percent Tested
All All Students 101,615 850 1,061 99,704 98 Male 51,998 506 597 50,895 98 Female 49,422 344 461 48,617 98 Gender Not Reported 195 0 3 192 98 American Indian or Alaskan Native 421 9 8 404 96 Asian 2,260 14 24 2,222 98 Black or African American 4016 40 57 3,919 98 Hispanic or Latino 7647 70 107 7,470 98 Native Hawaiian or Pacific Islander 42 0 0 42 100 White (non-Hispanic) 86,593 708 853 85,032 98
Ethnicity
No Primary Race/Ethnicity Reported 636 9 12 615 97 Currently receiving LEP services 2,328 13 22 2,293 98 Former LEP student - monitoring year 1 455 1 2 452 99 Former LEP student - monitoring year 2 302 0 5 297 98
LEP
LEP: All Other Students 98,530 836 1,032 96,662 98 Students with an IEP 16,058 659 353 15,046 94 IEP IEP: All Other Students 85,557 191 708 84,658 99 Economically Disadvantaged Students 26,360 339 388 25,633 97 SES SES: All Other Students 75,255 511 673 74,071 98 Migrant Students 31 0 0 31 100
Migrant Migrant: All Other Students 10,1584 850 1,061 99,673 98 Students receiving Title 1 Services 192 4 4 184 96 Title 1 Title 1: All Other Students 10,1423 846 1057 99,520 98 Plan 504 761 3 5 753 99
Plan 504 Plan 504: All Other Students 10,0854 847 1,056 98,951 98
3.4 Administrator Training
In addition to distributing the Principal/Test Coordinator and Test Administrator Manuals, the NH,
RI, and VT Departments of Education, along with Measured Progress, conducted test administration
workshops in five separate regional locations in each state to inform school personnel about the NECAP
science test and to provide training on the policies and procedures regarding administration of the NECAP
tests.
Chapter 3—Test Administration 20 2007-08 NECAP Science Technical Report
3.5 Documentation of Accommodations
The Principal/Test Coordinator and Test Administrator Manuals provided directions for coding the
information related to accommodations and modifications on page 2 of the student answer booklet.
All accommodations used during any test session were required to be coded by authorized school
personnel—not students—after testing was completed.
An Accommodations, Guidelines, and Procedures: Administrator Training Guide was also produced
to provide detailed information on planning and implementing accommodations. This guide can be located on
each state’s Department of Education Web site. The states collectively made the decision that
accommodations be made available to all students based on individual need regardless of disability status.
Decisions regarding accommodations were to be made by the students’ educational team on an individual
basis and were to be consistent with those used during the students’ regular classroom instruction. Making
accommodations decisions on an entire-group basis rather than on an individual basis was not permitted. If
the decision made by a student’s educational team required an accommodation not listed in the state-approved
Table of Standard Test Accommodations, schools were instructed to contact the Department of Education in
advance of testing for specific instructions for coding the “Other Accommodations (E)” and/or “Modifications
(F)” section.
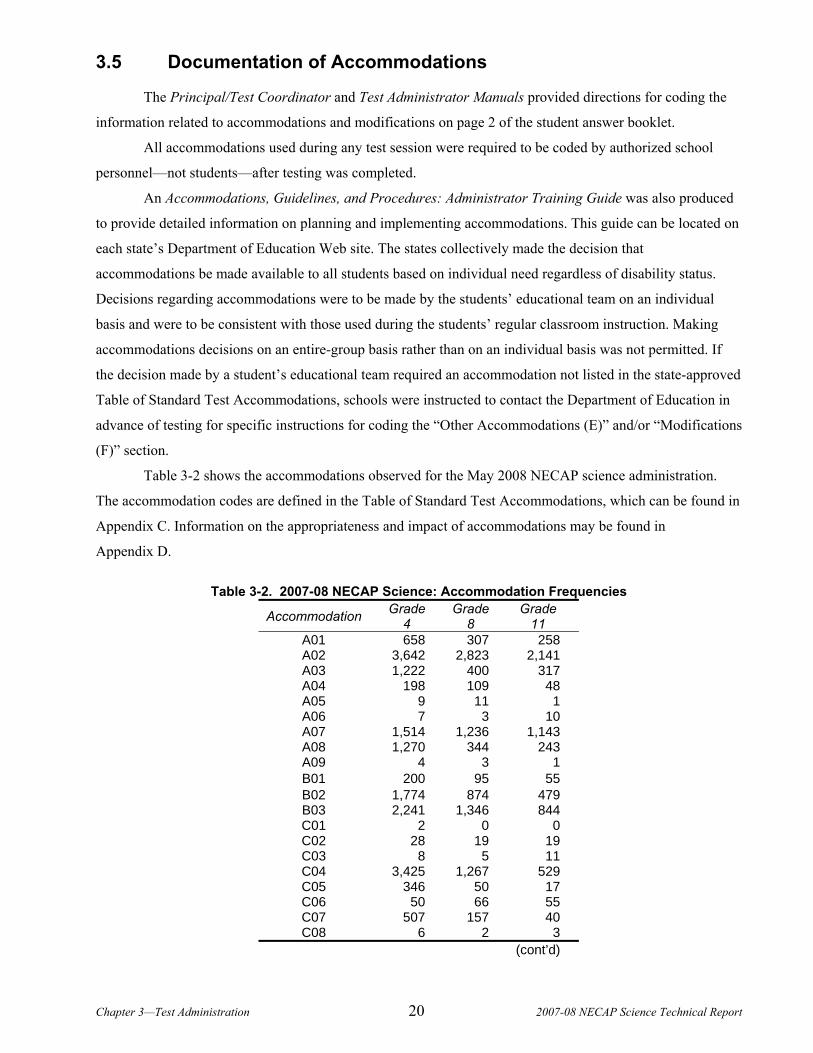
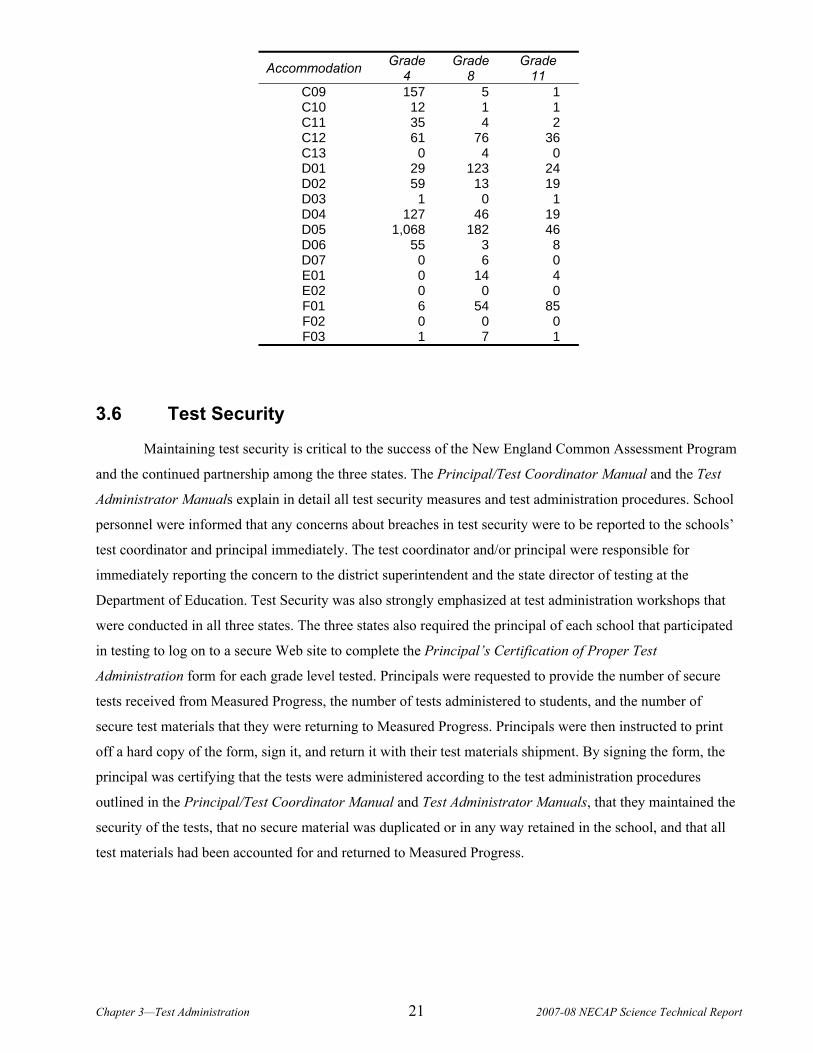
Table 3-2 shows the accommodations observed for the May 2008 NECAP science administration.
The accommodation codes are defined in the Table of Standard Test Accommodations, which can be found in
Appendix C. Information on the appropriateness and impact of accommodations may be found in
Appendix D.
Table 3-2. 2007-08 NECAP Science: Accommodation Frequencies
Accommodation Grade 4
Grade 8
Grade 11
A01 658 307 258 A02 3,642 2,823 2,141 A03 1,222 400 317 A04 198 109 48 A05 9 11 1 A06 7 3 10 A07 1,514 1,236 1,143 A08 1,270 344 243 A09 4 3 1 B01 200 95 55 B02 1,774 874 479 B03 2,241 1,346 844 C01 2 0 0 C02 28 19 19 C03 8 5 11 C04 3,425 1,267 529 C05 346 50 17 C06 50 66 55 C07 507 157 40 C08 6 2 3
(cont’d)
Chapter 3—Test Administration 21 2007-08 NECAP Science Technical Report
Accommodation Grade 4
Grade 8
Grade 11
C09 157 5 1 C10 12 1 1 C11 35 4 2 C12 61 76 36 C13 0 4 0 D01 29 123 24 D02 59 13 19 D03 1 0 1 D04 127 46 19 D05 1,068 182 46 D06 55 3 8 D07 0 6 0 E01 0 14 4 E02 0 0 0 F01 6 54 85 F02 0 0 0 F03 1 7 1
3.6 Test Security
Maintaining test security is critical to the success of the New England Common Assessment Program
and the continued partnership among the three states. The Principal/Test Coordinator Manual and the Test
Administrator Manuals explain in detail all test security measures and test administration procedures. School
personnel were informed that any concerns about breaches in test security were to be reported to the schools’
test coordinator and principal immediately. The test coordinator and/or principal were responsible for
immediately reporting the concern to the district superintendent and the state director of testing at the
Department of Education. Test Security was also strongly emphasized at test administration workshops that
were conducted in all three states. The three states also required the principal of each school that participated
in testing to log on to a secure Web site to complete the Principal’s Certification of Proper Test
Administration form for each grade level tested. Principals were requested to provide the number of secure
tests received from Measured Progress, the number of tests administered to students, and the number of
secure test materials that they were returning to Measured Progress. Principals were then instructed to print
off a hard copy of the form, sign it, and return it with their test materials shipment. By signing the form, the
principal was certifying that the tests were administered according to the test administration procedures
outlined in the Principal/Test Coordinator Manual and Test Administrator Manuals, that they maintained the
security of the tests, that no secure material was duplicated or in any way retained in the school, and that all
test materials had been accounted for and returned to Measured Progress.

Chapter 3—Test Administration 22 2007-08 NECAP Science Technical Report
3.7 Test and Administration Irregularities
No test irregularities were reported during the May 2008 NECAP science test administration.
3.8 Test Administration Window
The test administration window was May 12–29, 2008.
3.9 NECAP Service Center
To provide additional support to schools before, during, and after testing, Measured Progress
established the NECAP Service Center. The additional support that the Service Center provides is an essential
element to the successful administration of any statewide test program. It provides a centralized location to
which individuals in the field can call using a toll-free number and ask specific questions or report any
problems they may be experiencing.
The Service Center was staffed by representatives at varying levels based on call volume and was
available from 8:00 A.M. to 4:00 P.M. beginning two weeks before the start of testing and ending two weeks
after testing. The representatives were responsible for receiving, responding to, and tracking calls, then
routing issues to the appropriate person(s) for resolution.
Chapter4— Scoring 23 2007-08 NECAP Science Technical Report
Chapter 4. SCORING Upon receipt of used NECAP Science answer booklets following testing, the testing contractor scans
all student responses, along with student identification and demographic information. Imaged data for
multiple-choice items are machine-scored. Images of open-response items are processed and organized by
iScore, a secure, server-to-server electronic scoring software designed by Measured Progress, for hand-
scoring.
Student responses that cannot be physically scanned (e.g., answer documents damaged during
shipping) are physically reviewed and scored on an individual basis by trained, qualified readers. These scores
are linked to the student’s demographic data and merged with the student’s scoring file by Measured
Progress’s data processing department.
4.1 Machine-Scored Items
Multiple-choice item responses are compared to scoring keys using item analysis software. Correct
answers are assigned a score of one point; incorrect answers are assigned a score of zero points. Student
responses with multiple marks and blank responses are also assigned zero points.
The hardware elements of the scanners monitor themselves continuously for correct read, and the
software that drives these scanners monitors correct data reads. Standard checks include recognition of a sheet
that does not belong, is upside down or is backwards; identification of critical data that is missing, including a
student ID number or test form that is out of range or missing; and of page/document sequence errors. When a
problem is detected, the scanner stops and displays an error message directing the operator to investigate and
to correct the situation.
4.2 Hand-Scored Items
The images of student responses to open-response items were hand-scored through the iScore system.
Using iScore minimized the need for readers to physically handle actual answer booklets and related scoring
materials. Student confidentiality was easily maintained, as all NECAP Science scoring was “blind” (i.e.,
district, school, and student names were not visible to readers). The iScore system maintained the linkage
between the student response images and their associated test booklet numbers.
Through iScore, qualified readers accessed electronically scanned images of student responses at
computer terminals. The readers evaluated each response and recorded each student’s score via keypad or
mouse entry through the iScore system. When a reader finished one response, the next response appeared
immediately on the computer screen.
Imaged responses from all answer booklets were sorted into item-specific groups for scoring
purposes. Readers reviewed responses from only one item at a time; when necessary however, imaged
Chapter4— Scoring 24 2007-08 NECAP Science Technical Report
responses from a student’s entire booklet were always available for viewing, and the actual physical booklet
was also available to the Chief Reader onsite.
The use of iScore also helped ensure that access to student response images was limited to only those
who were scoring or who were working for Measured Progress in a scoring management capacity.
4.2.1 Scoring Location and Staff
Scoring Location
The iScore database, its operation, and its administrative controls are all based in Dover, NH; in
addition, all NECAP Science 2007-08 test item responses were scored in Dover, NH.
The iScore system monitored accuracy, reliability, and consistency across the scoring site. Constant
daily communication and coordination were accomplished through e-mail, telephone, and secure Web sites, to
ensure that critical information and scoring modifications were shared/implemented throughout the scoring
site.
Staff Positions
The following staff members were involved with scoring the 2007-08 NECAP Science responses:
The NECAP Science Scoring Project Manager, an employee of Measured Progress, was located
in Dover, NH and oversaw communication and coordination of scoring across all scoring sites.
The iScore Operational Manager and iScore administrators, employees of Measured Progress,
were located in Dover, NH and coordinated technical communication across all scoring sites.
A Chief Reader (CR) in the Science content area ensured consistency of scoring across the
scoring site for all grades tested in the Science content area. CRs also provided read-behind
activities for Quality Assurance Coordinators. CRs were employees of Measured Progress.
Numerous Quality Assurance Coordinators (QACs), selected from a pool of experienced Senior
Readers for their ability to score accurately and their ability to instruct and train readers,
participated in benchmarking activities for each specific grade of the Science content area. QACs
provided read-behind activities for Senior Readers. The ratio of QACs and Senior Readers to
readers was approximately 1:11.
Numerous Senior Readers (SRs), selected from a pool of skilled and experienced readers,
provided read-behind activities for the readers at their scoring tables (2 to 12 readers at each
table). The ratio of QACs and SRs to readers was approximately 1:11.
Readers at the scoring site scored the operational and field test NECAP Science 2007-08 student
responses. The recruitment of readers is described in section 4.2.4.
Chapter4— Scoring 25 2007-08 NECAP Science Technical Report
4.2.2 Benchmarking Meetings with the NECAP State Science Specialists
In preparation for implementing NECAP Science guidelines toward the scoring of field test
responses, Measured Progress scoring staff prepared and facilitated benchmarking meetings held with
NECAP state science specialists from their respective departments of education for establishing item-specific
guidelines by which NECAP Science items were to be scored for that current field test scoring session and for
future operational scoring sessions.
In preparation for these meetings, the scoring staff collected a set of several dozen student responses
that CRs identified as being illustrative, mid-range examples of their respective score points. CRs presented
these responses to the NECAP state science specialists, and during benchmarking meetings worked
collaboratively with them to finalize an authoritative set of score-point exemplars for each field-test item. As
a matter of practice, each of these authoritative sets is included as part of the scoring training materials and
used to train Readers each time that item is scored—both as a field test item and as part of a future NECAP
Science administration.
This repeated use of NECAP Science approved sets of mid-range score point exemplars helps ensure
that each time a particular NECAP Science item is scored, readers follow the guidelines that the NECAP state
science specialists established for that item.
4.2.3 Scoring of Inquiry Task Items
Of special interest during this cycle of scoring NECAP Science items was implementing the scoring
requirements associated with Inquiry Task items. These items were unique in that students conducted a single
scientific experiment and then answered approximately seven questions about that experiment. Some of these
questions were interrelated and were thus best scored as a collection of responses instead of seven individual
responses. These questions were interrelated in the sense that, for example, one question could ask the
student to build upon or elaborate on the answer they gave to another of the seven questions – in order to
score the student’s response to each of these interrelated questions, the reader needed to see the interrelated
responses and provide a score according to each of these responses in concert.
As such, the Chief Reader suggested how these interrelated items were best grouped together
(thereby, for each grade, dividing the seven responses into three groups) and gained the client’s approval for
implementing this suggestion. Each of the three groups of interrelated responses was scored by mutually
exclusive teams of readers – no reader was ever assigned to score on more than one of these groups. This
maximized the number of readers that could be assigned for each student while preserving the need to group
these items according to their interrelatedness
Chapter4— Scoring 26 2007-08 NECAP Science Technical Report
4.2.4 Reader Recruitment and Qualifications
For scoring of the 2007-08 NECAP Science tests, Measured Progress actively sought a diverse
scoring pool that was representative of the population of the three NECAP states. The broad range of reader
backgrounds included scientists, editors, business professionals, authors, teachers, graduate school students,
and retired educators. Demographic information for readers (e.g., gender, race, educational background) was
electronically captured and reported.
Although a four-year college degree or higher was preferred for all readers, readers of the responses
of grade 4, 8, and 11 students were required to have successfully completed at least two years of college and
to have demonstrated knowledge of the particular subject they scored. This permitted the recruitment of
readers who were currently enrolled in a college program, a sector of the population who has had relatively
recent exposure to current classroom practices and current trends in their field of study. In all cases, potential
readers submitted documentation (e.g., resume and/or transcripts) of their qualifications.
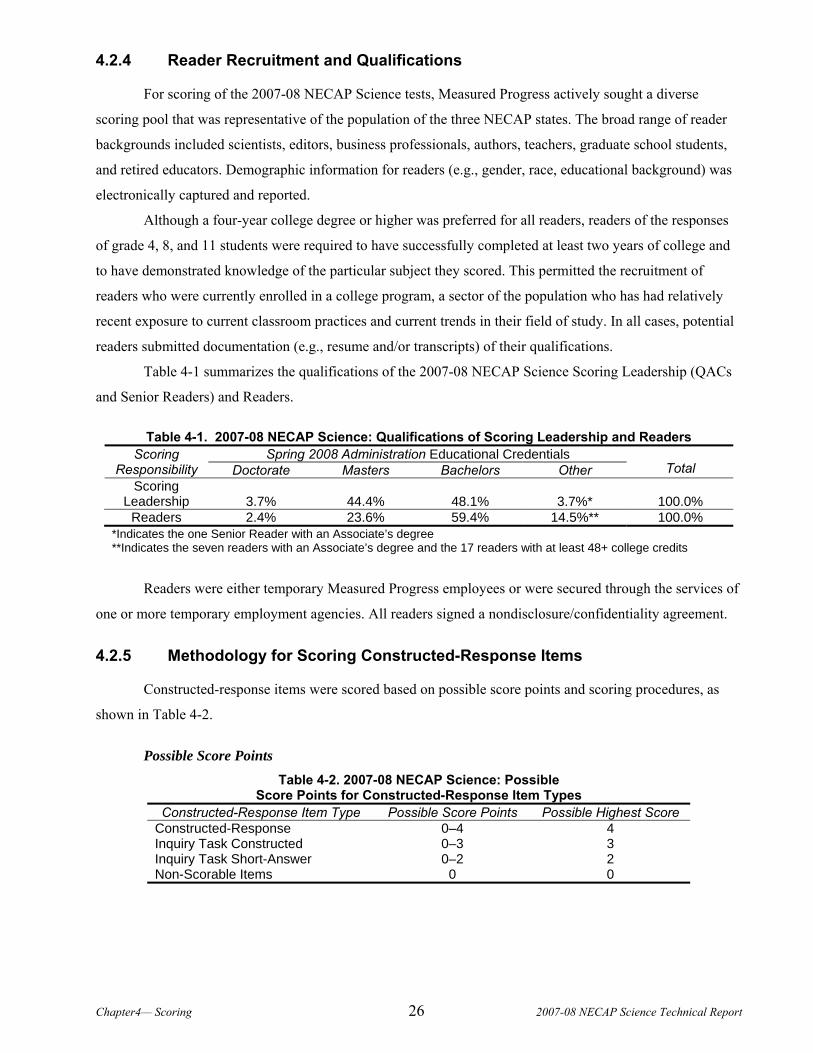
Table 4-1 summarizes the qualifications of the 2007-08 NECAP Science Scoring Leadership (QACs
and Senior Readers) and Readers.
Table 4-1. 2007-08 NECAP Science: Qualifications of Scoring Leadership and Readers Spring 2008 Administration Educational Credentials Scoring
Responsibility Doctorate Masters Bachelors Other Total Scoring
Leadership 3.7% 44.4% 48.1% 3.7%* 100.0% Readers 2.4% 23.6% 59.4% 14.5%** 100.0%
*Indicates the one Senior Reader with an Associate’s degree **Indicates the seven readers with an Associate’s degree and the 17 readers with at least 48+ college credits
Readers were either temporary Measured Progress employees or were secured through the services of
one or more temporary employment agencies. All readers signed a nondisclosure/confidentiality agreement.
4.2.5 Methodology for Scoring Constructed-Response Items
Constructed-response items were scored based on possible score points and scoring procedures, as
shown in Table 4-2.
Possible Score Points Table 4-2. 2007-08 NECAP Science: Possible
Score Points for Constructed-Response Item Types Constructed-Response Item Type Possible Score Points Possible Highest Score
Constructed-Response 0–4 4 Inquiry Task Constructed 0–3 3 Inquiry Task Short-Answer 0–2 2 Non-Scorable Items 0 0
Chapter4— Scoring 27 2007-08 NECAP Science Technical Report
Non-Scorable Items.
Readers could designate a response as non-scorable for any of the following reasons:
response was blank (no attempt to respond to the question)
response was unreadable (illegible, too faint to see, or only partially legible/visible)1
response was written in the wrong location (seemed to be a legitimate answer to a different
question)
response was written in a language other than English
response was completely off-task or off-topic
response included an insufficient amount of material to make scoring possible
response was an exact copy of the assignment
response was incomprehensible
student made a statement refusing to write a response to the question
Scoring Procedures
Scoring procedures for constructed-response items included both single-scoring and double-scoring.
Single-scored items were scored by one reader. Double-scored items were scored independently by two
readers, whose scores were tracked for agreement (“inter-rater agreement”). For further discussion of double-
scoring and inter-rater agreement, see section 4.2.8 and Appendix E.
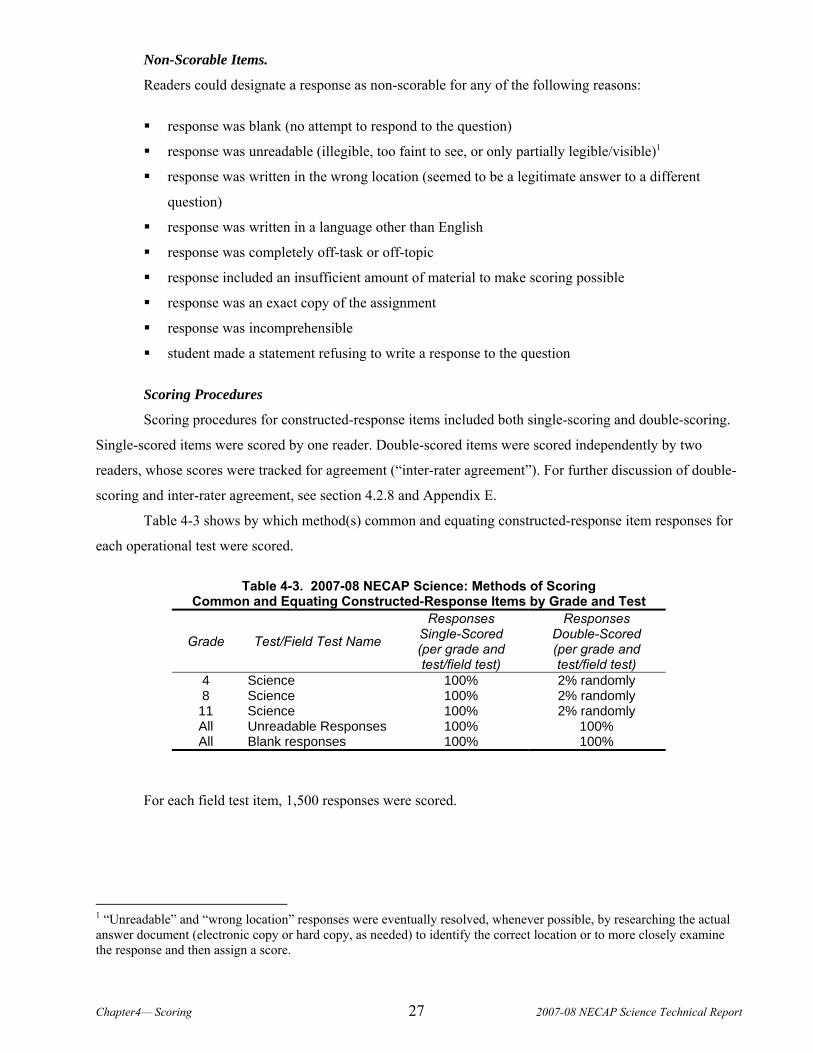
Table 4-3 shows by which method(s) common and equating constructed-response item responses for
each operational test were scored.
Table 4-3. 2007-08 NECAP Science: Methods of Scoring Common and Equating Constructed-Response Items by Grade and Test
Grade Test/Field Test Name
Responses Single-Scored (per grade and test/field test)
Responses Double-Scored (per grade and test/field test)
4 Science 100% 2% randomly 8 Science 100% 2% randomly
11 Science 100% 2% randomly All Unreadable Responses 100% 100% All Blank responses 100% 100%
For each field test item, 1,500 responses were scored.
1 “Unreadable” and “wrong location” responses were eventually resolved, whenever possible, by researching the actual answer document (electronic copy or hard copy, as needed) to identify the correct location or to more closely examine the response and then assign a score.
Chapter4— Scoring 28 2007-08 NECAP Science Technical Report
4.2.6 Reader Training
Reader training began with an introduction of onsite scoring staff and an overview of the NECAP
Science program’s purpose and goals, including a discussion about the security, confidentiality, and
proprietary nature of testing, scoring materials, and procedures.
Next, Readers thoroughly reviewed and discussed the scoring guide for the item to be scored. Each
item-specific scoring guide included the item itself and score point descriptions.
Following review of the item-specific scoring guide for any constructed-response item, Readers
began reviewing or scoring response sets organized for specific training purposes:
Anchor Set
Training Set
Qualifying Set
During training, Readers were able to highlight or mark hard copies of the Anchor, Training, and first
Qualifying Sets, even if all or part of the set was also presented online via computer. The function of each set
is described below.
Anchor Set
Readers first reviewed an Anchor Set of exemplary responses, approved by the state science
specialists representing the three NECAP state departments of education, for the item to be scored. Responses
in Anchor Sets were typical rather than unusual or uncommon; solid, rather than controversial or borderline;
and true, meaning that they had scores that could not be changed by anyone other than the NECAP client and
Measured Progress test development staff.
For constructed-response items, each item-specific Anchor Set contained, for each respective score
point, a client-approved sample response that was to be considered a mid-range score point exemplar of its
respective score point. When necessary, a second, client-approved sample response was identified for any
item’s score point whenever it was plausible that there was more than one exclusive way to illustrate the
merits and intent of that score point.
Responses were read aloud to the room of Readers and presented in descending score order. Trainers
then announced the true score of each anchor response and facilitated a group discussion of the response in
relation to the score point descriptions to allow Readers to internalize typical characteristics of each score
point.
This Anchor Set served as a reference for Readers as they continued with calibration, scoring, and
recalibration activities for that item.
Chapter4— Scoring 29 2007-08 NECAP Science Technical Report
Training Set
Next, Readers practiced applying the scoring guide and anchors to responses in the Training Set. The
Training Set typically included 10 to 15 student responses designed to help establish the score point range and
the range of responses within each score point. The Training Set often included unusual responses that were
less clear or solid (e.g., were shorter than normal, employed atypical approaches, contained both very low and
very high attributes, or were written in ways difficult to decipher). Responses in the Training Set were
presented in randomized score point order.
After Readers had independently read and scored a Training Set response, trainers would poll Readers
or use online training system reports to record the initial range of scores. Then they would lead a group
discussion of one or two responses, directing Reader attention to scoring issues that were particularly relevant
to the specific scoring group, such as the line between two score points. Trainers modeled for Readers how to
discuss scores by referring to the Anchor Set and to scoring guides.
Qualifying Set
After the Training Set had been completed, Readers were required to measurably demonstrate their
ability to accurately and reliably score all items, according to the appropriate Anchor Set in concert with its
scoring rubric, by scoring the Qualifying Set. The Qualifying Set consisted of ten responses, selected from an
array of responses, which clearly illustrated the range of score points for that item. The set was selected in
accordance with responses reviewed and approved by the state specialists. Hard copies of the responses were
also available to Readers so that they could make notes and refer back to specific responses during the post-
qualifying discussion.
To be eligible to score operational 2007-08 NECAP Science responses, Readers were required to
demonstrate scoring accuracy rates of minimum 80 percent exact agreement and at least 90 percent exact-or-
adjacent agreement across all items. In other words, exact scores were required on at least eight of the
Qualifying Set responses and either exact or adjacent scores were required on a total of nine of the 10
responses. Readers were allowed one discrepant score as long as they had at least eight exact scores..
Retraining
Readers who did not pass the first Qualifying Set were retrained as a group by reviewing their
performance with scoring leadership and then scoring a second Qualifying Set of responses. If they achieved
the qualifying rate (minimum 80 percent exact and at least 90 percent exact-or-adjacent agreement) on this
second Qualifying Set, they were allowed to score operational responses.
If Readers did not achieve the required scoring accuracy rates on the second Qualifying Set, they
were not allowed to score responses for that item. Instead, they either began training on a different item or
were dismissed.
Chapter4— Scoring 30 2007-08 NECAP Science Technical Report
4.2.7 Senior Quality Assurance Coordinator (QAC) and Senior Reader (SR) Training
QACs and select SRs were trained in a separate training session that occurred immediately prior to
reader training. In addition to discussing the items and their responses, QAC and SR training included
emphasis on the client’s rationale behind the score points—this rationale was discussed in greater detail with
QACs and SRs then with regular Readers to better equip QACs and SRs to handle questions from the regular
readers..
4.2.7.1 Monitoring of Scoring Quality Control and Consistency
Readers were monitored for continued accuracy rates and scoring consistency throughout the scoring
process, using the following methods and tools:
Embedded Committee-Reviewed Responses (CRRs)
“Read-Behind” Procedures
Double Blind Scoring
Scoring Reports
If Readers met or exceeded the expected accuracy rate, they continued scoring operational responses.
Any Reader whose accuracy rate fell below the expected accuracy rate for the particular item and monitoring
method was retrained on that item and, upon approval by the QAC or CR as appropriate (see below), was
allowed to resume scoring.
It is important to note the difference between the accuracy rate each Reader must have achieved to
qualify for scoring live responses and the accuracy rate each Reader must maintain to continue scoring live
responses. Specifically, the qualification accuracy rate is stricter than the live scoring accuracy rate. The
reason for this difference is that an “exact score” in double blind statistics requires that two Readers during
live scoring both identify the same score for a response; an exact score during qualification requires only that
the individual Reader match the score pre-defined by scoring leadership. Thus the latter is dependent on
matching an expert not a peer.
This highlights why the accuracy rates of Readers during live scoring is monitored using an array of
techniques, thereby providing a more complete picture of a Reader performance than would be the case by
relying on just one technique. These techniques are described below.
Embedded Committee-Reviewed Responses (CRRs)
Previously scored CRRs were selected and loaded into iScore for blind embedding, and distributed to
Readers as a way to monitor accuracy. Embedded CRRs, either chosen before scoring began or selected by
scoring leadership during scoring, were inserted into the scoring queue so as to be indistinguishable from all
other live student responses.
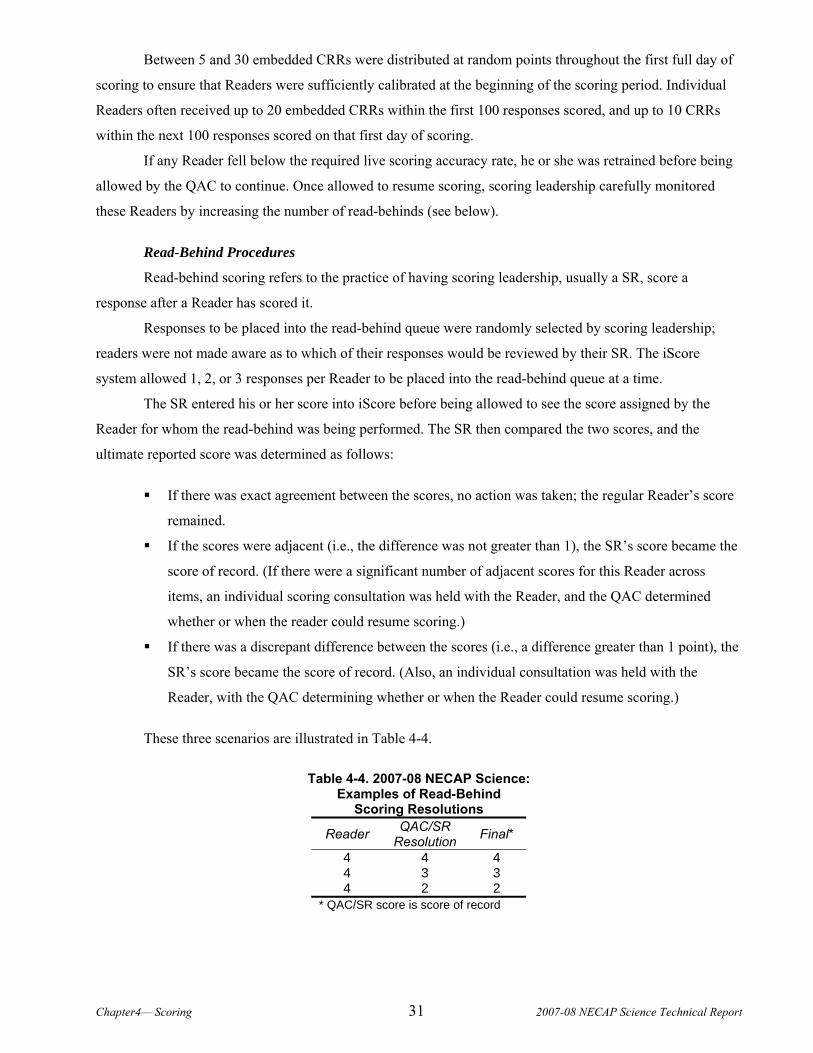
Chapter4— Scoring 31 2007-08 NECAP Science Technical Report
Between 5 and 30 embedded CRRs were distributed at random points throughout the first full day of
scoring to ensure that Readers were sufficiently calibrated at the beginning of the scoring period. Individual
Readers often received up to 20 embedded CRRs within the first 100 responses scored, and up to 10 CRRs
within the next 100 responses scored on that first day of scoring.
If any Reader fell below the required live scoring accuracy rate, he or she was retrained before being
allowed by the QAC to continue. Once allowed to resume scoring, scoring leadership carefully monitored
these Readers by increasing the number of read-behinds (see below).
Read-Behind Procedures
Read-behind scoring refers to the practice of having scoring leadership, usually a SR, score a
response after a Reader has scored it.
Responses to be placed into the read-behind queue were randomly selected by scoring leadership;
readers were not made aware as to which of their responses would be reviewed by their SR. The iScore
system allowed 1, 2, or 3 responses per Reader to be placed into the read-behind queue at a time.
The SR entered his or her score into iScore before being allowed to see the score assigned by the
Reader for whom the read-behind was being performed. The SR then compared the two scores, and the
ultimate reported score was determined as follows:
If there was exact agreement between the scores, no action was taken; the regular Reader’s score
remained.
If the scores were adjacent (i.e., the difference was not greater than 1), the SR’s score became the
score of record. (If there were a significant number of adjacent scores for this Reader across
items, an individual scoring consultation was held with the Reader, and the QAC determined
whether or when the reader could resume scoring.)
If there was a discrepant difference between the scores (i.e., a difference greater than 1 point), the
SR’s score became the score of record. (Also, an individual consultation was held with the
Reader, with the QAC determining whether or when the Reader could resume scoring.)
These three scenarios are illustrated in Table 4-4.
Table 4-4. 2007-08 NECAP Science: Examples of Read-Behind
Scoring Resolutions
Reader QAC/SR Resolution Final*
4 4 4 4 3 3 4 2 2
* QAC/SR score is score of record

Chapter4— Scoring 32 2007-08 NECAP Science Technical Report
Approximately 4% of all student responses were reviewed by QACs and SRs as read behinds. In
cases where a Reader’s scoring rate fell below the required accuracy percentage, QACs and SRs conducted
additional read-behinds for those Readers.
In addition to the daily read-behinds, scoring leadership could choose to do read-behinds on any
Reader at any point during the scoring process, and thereby take an immediate, real-time “snapshot” of a
Reader’s accuracy.
Double Blind Scoring
Double Blind scoring refers to the practice of having two Readers independently score a response,
without their knowledge. Section 4.2.5 provides information about which responses were double-scored.
If there was a discrepancy (a difference greater than 1) between scores, the response was placed into
an arbitration queue. Arbitration responses were reviewed by scoring leadership (SR or QAC) without any
background knowledge of scores assigned by the two previous Readers. Appendix E provides the NECAP
Science 2007-08 percentages of double-blind agreement for each grade-level test.
Scoring leadership consulted individually with any Reader whose scoring rates on the different
monitoring methods fell below the required accuracy percentage, and the QAC determined whether or when
the Reader could resume scoring. Once allowed to resume scoring, scoring leadership carefully monitored
these Readers by increasing their frequency of read-behinds.
Scoring Reports
Measured Progress’s electronic scoring software, iScore, generated multiple reports that were used by
scoring leadership to measure and monitor readers for scoring accuracy, consistency, and productivity. These
reports are further discussed in the followig section.
4.2.7.2 Reports Generated During Scoring
Because the 2007-08 NECAP Science administration was complex, computer-generated reports were
necessary to ensure all of the following:
overall group-level accuracy, consistency, and reliability of scoring
immediate, real-time individual Reader data availability for early Reader intervention when
necessary
scoring schedule maintenance
The following reports were produced by iScore:
The Read-Behind Summary report showed the total number of read-behind responses for each
Reader, and noted the numbers and percentages of scores that were exact, adjacent, and
discrepant between that Reader and the SR/QAC. Scoring leadership could choose to generate
Chapter4— Scoring 33 2007-08 NECAP Science Technical Report
this report by choosing options from a pull-down menu (e.g., “Today”; “Past Week”;
“Cumulative”).The report could also be filtered to select data for a particular item or across all
items. This report was used in conjunction with other reports to determine whether a Reader’s
scores should be voided (i.e., sent back out to the floor to be rescored by other Readers). The
benefit of this report is that it measures the degree to which an individual Reader agrees with their
QAC or SR on how to best score live responses.
The Double-Blind Summary report showed the total number of double-score responses scored
by each Reader, and noted the numbers and percentages of scores that were exact, adjacent, and
discrepant between that Reader and second Readers. This report was used in conjunction with
other reports to determine whether a Reader’s scores would be voided (i.e., sent back out to the
floor to be rescored by other Readers). The benefit of this report is that it reveals the degree to
which Readers are in agreement with each other about how to best score live responses.
The Accuracy Summary report combined read-behind and double-score data, showing the total
number of double-score and read-behind responses scored for each Reader, and noting his or her
accuracy percentages and score point distributions.
The Embedded CRR Summary showed, for each Reader and for either a particular item or
across all items, the total number of responses scored, the number of CRRs scored, and the
numbers and percentages of scores that were exact, adjacent, and discrepant between the Reader
and the SR/QAC. This report was used in conjunction with other reports to determine whether a
Reader’s scores would be voided (i.e., sent back out to the floor to be rescored by other Readers).
The benefit of this report is that it measures the degree to which an individual Reader agrees with
their CR on how to best score live responses—and since embedded responses are administered
during the first hours of scoring, this report provides an early indication of agreement between
Readers and their CR.
The Qualification Statistics Report listed each Reader by name and ID number, identified
which Qualifying Set(s) they did and did not take, and for the ones they did take, whether they
passed or failed. The total number of qualifications passed and failed was noted for each Reader,
as was the total number of individuals passing or failing a particular Qualifying Set. The QAC
could use this report to determine how the Readers within their specific scoring group performed
on a specific Qualifying Set.
The Summary Report showed the total number of student responses for an item, and identified,
for the time at which the report was generated, the following:
- the number of single and double-scorings that had been performed - the number of single and double-scorings yet to be performed

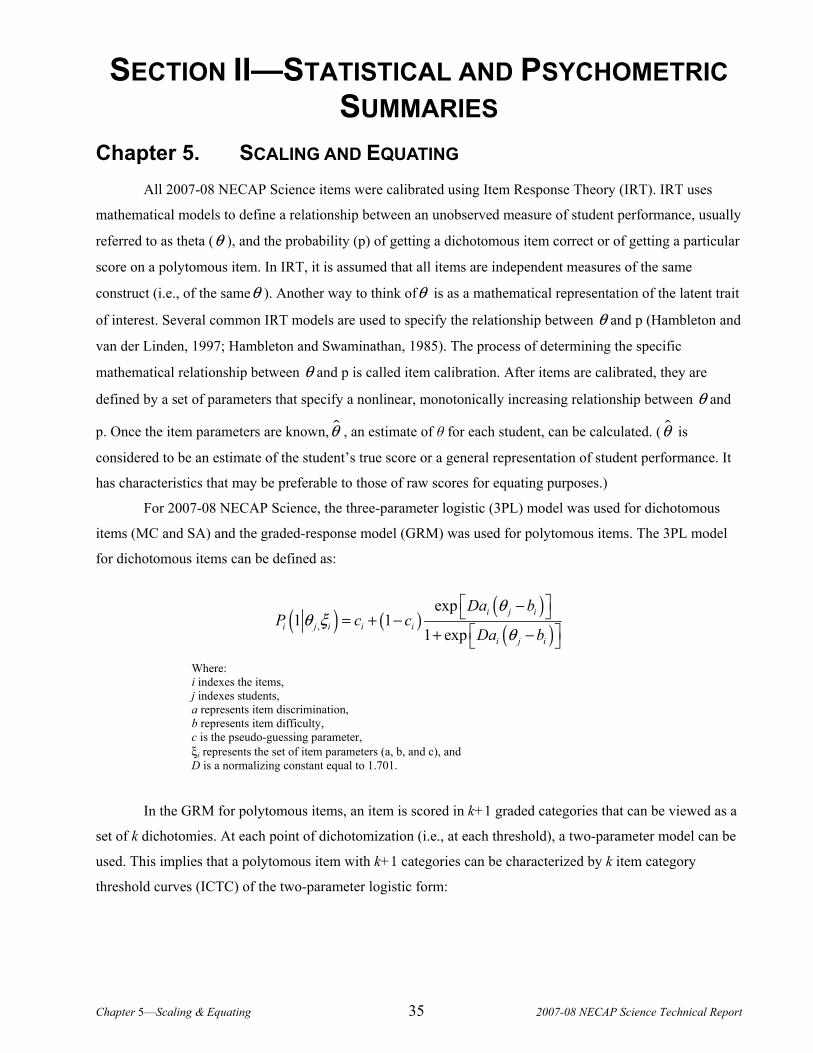
Chapter 5—Scaling & Equating 35 2007-08 NECAP Science Technical Report
SECTION II—STATISTICAL AND PSYCHOMETRIC SUMMARIES
Chapter 5. SCALING AND EQUATING All 2007-08 NECAP Science items were calibrated using Item Response Theory (IRT). IRT uses
mathematical models to define a relationship between an unobserved measure of student performance, usually
referred to as theta (θ ), and the probability (p) of getting a dichotomous item correct or of getting a particular
score on a polytomous item. In IRT, it is assumed that all items are independent measures of the same
construct (i.e., of the sameθ ). Another way to think ofθ is as a mathematical representation of the latent trait
of interest. Several common IRT models are used to specify the relationship between θ and p (Hambleton and
van der Linden, 1997; Hambleton and Swaminathan, 1985). The process of determining the specific
mathematical relationship between θ and p is called item calibration. After items are calibrated, they are
defined by a set of parameters that specify a nonlinear, monotonically increasing relationship between θ and
p. Once the item parameters are known,θ , an estimate of θ for each student, can be calculated. (θ is
considered to be an estimate of the student’s true score or a general representation of student performance. It
has characteristics that may be preferable to those of raw scores for equating purposes.)
For 2007-08 NECAP Science, the three-parameter logistic (3PL) model was used for dichotomous
items (MC and SA) and the graded-response model (GRM) was used for polytomous items. The 3PL model
for dichotomous items can be defined as:
( ) ( )( )
( ),
exp1 1
1 expi j i
i j i i ii j i
Da bP c c
Da b
θθ ξ
θ
⎡ ⎤−⎣ ⎦= + −⎡ ⎤+ −⎣ ⎦
Where: i indexes the items, j indexes students, a represents item discrimination, b represents item difficulty, c is the pseudo-guessing parameter, ξi represents the set of item parameters (a, b, and c), and D is a normalizing constant equal to 1.701.
In the GRM for polytomous items, an item is scored in k+1 graded categories that can be viewed as a
set of k dichotomies. At each point of dichotomization (i.e., at each threshold), a two-parameter model can be
used. This implies that a polytomous item with k+1 categories can be characterized by k item category
threshold curves (ICTC) of the two-parameter logistic form:
Chapter 5—Scaling & Equating 36 2007-08 NECAP Science Technical Report
( ) ( )( )
*,
exp1 , ,
1 expi j i ik
ik j i i iki j i ik
Da b dP a b d
Da b d
θθ
θ
⎡ ⎤− +⎣ ⎦=⎡ ⎤+ − +⎣ ⎦
Where: i indexes the items, j indexes students, k indexes threshold, a represents item discrimination, b represents item difficulty, d represents threshold, and D is a normalizing constant equal to 1.701.
After computing k item category threshold curves in the GRM, k+1 item category characteristic
curves (ICCC) are derived by subtracting adjacent ICTC curves:
* *( 1)(1| ) (1| ) (1| )ik j i k j ik jP P Pθ θ θ−= −
Where:
ikP represents the probability that the score on item i falls in category k, and *
ikP represents the probability that the score on item i falls above the threshold k
( *0 1iP = and *
( 1) 0i mP + = ).
The GRM is also commonly expressed as:
( ) ( )( )
( )( )
1
1
exp exp,
1 exp 1 expi j i k i j i k
ik j ii j i k i j i k
Da b d Da b dP k
Da b d Da b d
θ θθ ξ
θ θ+
+
⎡ ⎤ ⎡ ⎤− + − +⎣ ⎦ ⎣ ⎦= −⎡ ⎤ ⎡ ⎤+ − + + − +⎣ ⎦ ⎣ ⎦
where, ξi represents the set of item parameters for item i.
Finally, the ICC for polytomous items is computed as a weighted sum of ICCCs, where each ICCC is
weighted by a score assigned to a corresponding category.
1
(1| ) (1| )m
i j ik ik jk
P w Pθ θ+
=∑
For more information about item calibration and determination, the reader is referred to Lord and
Novick (1968), Hambleton and Swaminathan (1985), or Baker and Kim (2004)..
5.1 Equating
In this first operational year of the NECAP Science tests, all students in a grade were administered a
common set of scored items. Additional items were matrixed across multiple test forms but not used in the
computation of individual student scores. (The matrixed items, however, were included in computations that
were reported at the school and district levels.) Student response records were combined into a single sparse
Chapter 5—Scaling & Equating 37 2007-08 NECAP Science Technical Report
data matrix and all were items calibrated simultaneously using PARSCALE software according to the models
specified above. All administered items were thus placed on a single scale that will serve as the base scale for
future administrations, when items from the matrixed set will serve as the equating link for maintaining the
2007-08 scale.
5.2 Standard Setting
A standard setting meeting was conducted for the NECAP Science tests August 11-13, 2008, and the
operational data from the 2007-08 NECAP Science tests were used to set the standards. The standard-setting
report is included as Appendix F to this document and outlines in detail the methods and results of the
meetings. The outcome of the standard setting meetings was cut scores on the θ metric. A meeting for the
commissioners of education from each of the three states was held subsequently to review and officially adopt
the final cut scores. Because future equating will scale back to the 2007-08θ metric, the cut scores (presented
in Tables 5-1 and 5-2) will remain fixed throughout the assessment program (unless standards are reset for
any reason).
A list of Standard-Setting Committee member names and affiliations are included in Appendix B.
5.3 Reported Scale Scores
5.3.1 Description of Scale
Because the theta scale used in the IRT calibrations is not readily understood by most stakeholders,
reporting scales were developed for the NECAP Science tests. The reporting scales are simple linear
transformations of the underlying θ scale, and are developed such that they range from x00 through x80
(where x is grade level). In other words, grade 4 scaled scores range from 400 to 480, grade 8 from 800
through 880, and grade 11 from 1100 through 1180. The lowest scaled score in the Proficient range is fixed at
“x40” for each grade level. So for example, to be classified in the Proficient achievement level or above, a
minimum scaled score of 440 was required at grade 4, 840 at grade 8, and 1140 at grade 11.
Scaled scores supplement achievement-level results by providing information that is more specific
about the position of a student’s results within an achievement level. School- and district-level scaled scores
are calculated by computing the average of student-level scaled scores. Students’ raw scores (i.e., total
number of points) on the 2007-08 NECAP Science tests were translated to scaled scores using a data analysis
process called scaling. Scaling simply converts from one scale to another. In the same way that a given
temperature can be expressed on either Fahrenheit or Celsius scales, or the same distance can be expressed in
either miles or kilometers, student scores on the 2007-08 NECAP Science tests can be expressed in raw or
scaled scores. In Figure 5-1, two-way arrows depict how raw scores (vertical axis) map through the S-shaped
Test Characteristic Curve (TCC) to corresponding scores on the theta scale (described above), which in turn
map directly to scaled scores. (More details on transforming theta scores to scale scores are presented in
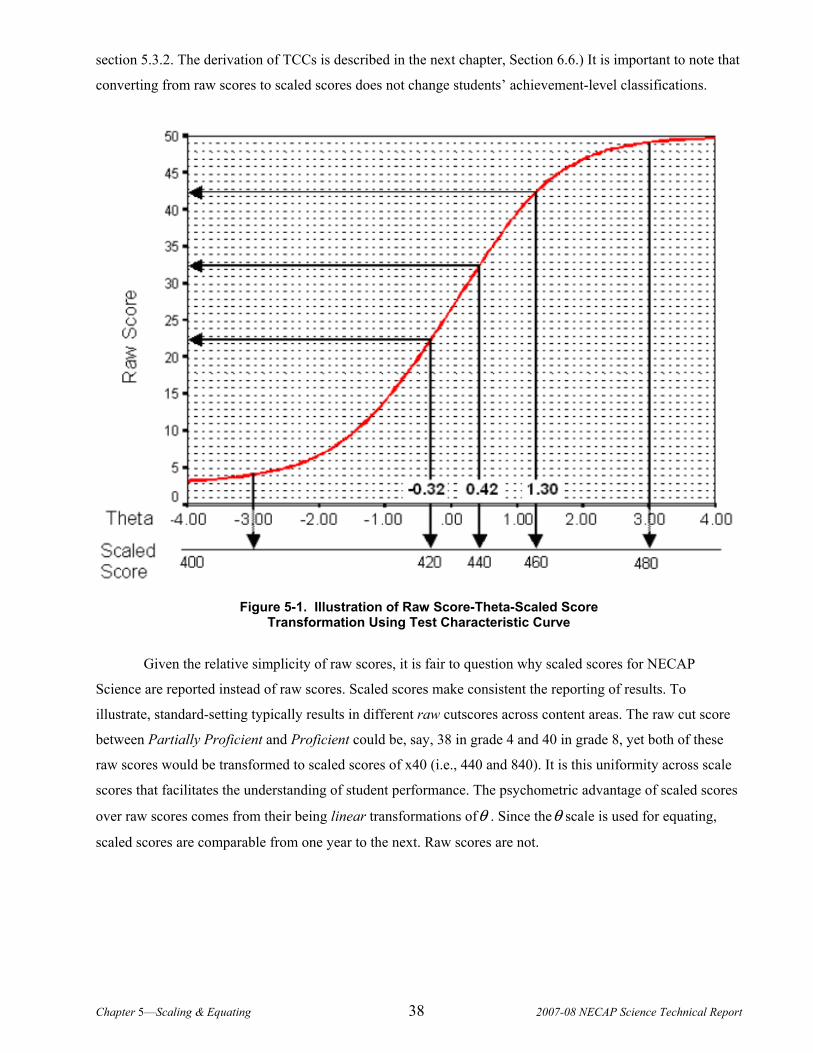
Chapter 5—Scaling & Equating 38 2007-08 NECAP Science Technical Report
section 5.3.2. The derivation of TCCs is described in the next chapter, Section 6.6.) It is important to note that
converting from raw scores to scaled scores does not change students’ achievement-level classifications.
Figure 5-1. Illustration of Raw Score-Theta-Scaled Score
Transformation Using Test Characteristic Curve
Given the relative simplicity of raw scores, it is fair to question why scaled scores for NECAP
Science are reported instead of raw scores. Scaled scores make consistent the reporting of results. To
illustrate, standard-setting typically results in different raw cutscores across content areas. The raw cut score
between Partially Proficient and Proficient could be, say, 38 in grade 4 and 40 in grade 8, yet both of these
raw scores would be transformed to scaled scores of x40 (i.e., 440 and 840). It is this uniformity across scale
scores that facilitates the understanding of student performance. The psychometric advantage of scaled scores
over raw scores comes from their being linear transformations ofθ . Since theθ scale is used for equating,
scaled scores are comparable from one year to the next. Raw scores are not.
Chapter 5—Scaling & Equating 39 2007-08 NECAP Science Technical Report
5.3.2 Calculations
The scaled scores are obtained by a simple translation of ability estimates (θ ) using the linear
relationship between threshold values on the θ metric and their equivalent values on the scaled score metric.
Students’ ability estimates are based on their raw scores and are found by mapping through the TCC. Scaled
scores are calculated using the linear equation
ˆSS m bθ= +
where m is the slope, b is the intercept
A separate linear transformation is used for each grade test of NECAP Science. The transformation
function is determined by fixing the Partially Proficient/Proficient cutscore and the bottom of the scale; that
is, the x40 and the x00 value (e.g., 440 and 400 for grade 4, respectively). The x00 location on the θ scale is
beyond (i.e., below) the scaling of all items. So to determine this location, a chance score (approximately
equal to a student’s expected performance by guessing) is mapped to a value of –4.0 on theθ scale. A raw
score of 0 is also assigned a scaled score of x00. The maximum possible raw score is assigned a scaled score
of x80 (e.g., 480 in the case of grade 4).
Because only two points within theθ scaled-score space are fixed, the cutscores between
Substantially Below Proficient and Partially Proficient (SBP/PP) and between Proficient and Proficient with
Distinction (P/PWD) is free to vary.
Table 5-1 represents the scaled cutscores for each grade/content combination (i.e., the minimum
scaled score for getting into the next achievement level). Again, the values in Table 5-1 do not change from
year to year, because the cutscores along the θ scale do not change. It is important to point out that in any
given year, it may not be possible to attain a particular scaled score, but the scaled score cuts will remain the
same.
Table 5-1. 2008 NECAP Science: Reporting Scale Range, Cut Scores, Intercept, and Slope for Each Achievement Level by Grade
Scale Score Cuts Grade Min Max SBP/PP PP/P P/PWD Intercept Slope
4 400 480 427 440 463 9.881 439.5 8 800 880 829 840 855 8.420 833.7
11 1100 1180 1130 1140 1152 8.354 1133.4 SBP = Substantially Below Proficient; PP = Partially Proficient; P = Proficient; PWD = Proficient with Distinction
Table 5-2 shows the cutscores on the θ metric resulting from standard setting (see the 2005-06
NECAP Technical Report for a description of the grades 3-8 standard-setting process and Appendix F for the
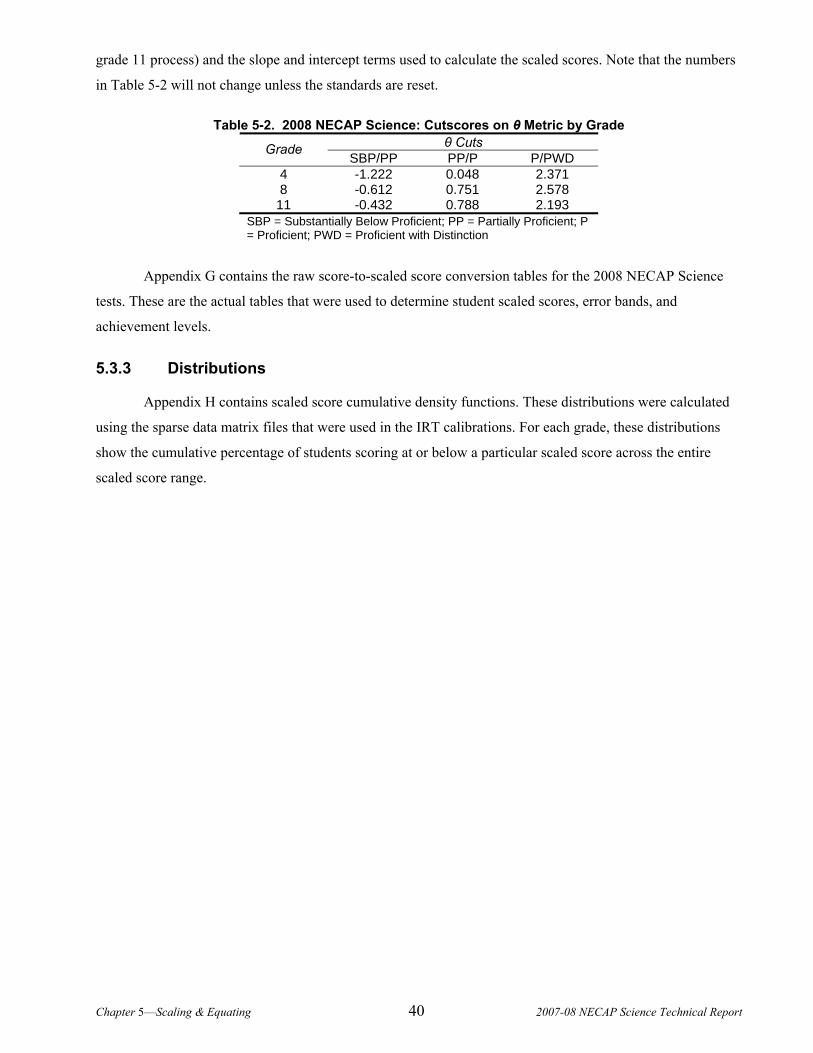
Chapter 5—Scaling & Equating 40 2007-08 NECAP Science Technical Report
grade 11 process) and the slope and intercept terms used to calculate the scaled scores. Note that the numbers
in Table 5-2 will not change unless the standards are reset.
Table 5-2. 2008 NECAP Science: Cutscores on θ Metric by Grade θ Cuts Grade
SBP/PP PP/P P/PWD 4 -1.222 0.048 2.371 8 -0.612 0.751 2.578
11 -0.432 0.788 2.193 SBP = Substantially Below Proficient; PP = Partially Proficient; P = Proficient; PWD = Proficient with Distinction
Appendix G contains the raw score-to-scaled score conversion tables for the 2008 NECAP Science
tests. These are the actual tables that were used to determine student scaled scores, error bands, and
achievement levels.
5.3.3 Distributions
Appendix H contains scaled score cumulative density functions. These distributions were calculated
using the sparse data matrix files that were used in the IRT calibrations. For each grade, these distributions
show the cumulative percentage of students scoring at or below a particular scaled score across the entire
scaled score range.
Chapter 6—Item Analyses 41 2007-08 NECAP Science Technical Report
Chapter 6. ITEM ANALYSES As noted in Brown (1983), “A test is only as good as the items it contains.” A complete evaluation of
a test’s quality must include an evaluation of each question. Both the Standards for Educational and Psy-
chological Testing (AERA, 1999) and the Code of Fair Testing Practices in Education (Joint Committee on
Testing Practices, 1988) include standards for identifying quality questions. Questions should assess only
knowledge or skills that are identified as part of the domain being measured and should avoid assessing
irrelevant factors. They should also be unambiguous and free of grammatical errors, potentially insensitive
content or language, and other confounding characteristics. Further, questions must not unfairly disadvantage
test takers from particular racial, ethnic, or gender groups.
Both qualitative and quantitative approaches were taken to ensure that NECAP Science questions met
these standards. Qualitative work was discussed in Chapter 2 (“Development and Test Design”). The
following discussion summarizes several types of quantitative analyses that were carried out on the 2007-08
NECAP items: (a) classical statistics, (b) Differential Item Functioning (subgroup differences in item
performance), (c) dimensionality analyses, and (d) IRT analyses.
6.1 Classical Statistics
All 2007-08 NECAP Science items were evaluated in terms of difficulty according to standard
classical test theory (CTT) practice. The expected item difficulty, also known as the p-value, is the main index
of item difficulty under the CTT framework. This index measures an item’s difficulty by averaging the
proportion of points received across all students who took the item. MC items were scored dichotomously
(correct vs. incorrect), so for these items, the difficulty index is simply the proportion of students who
correctly answered the item. To place all item types on the same 0–1 scale, the p-value of an OR item was
computed as the average score on the item divided by its maximum possible score. Although the p-value is
traditionally called a measure of difficulty, it is properly interpreted as an easiness index, because larger
values indicate easier items. An index of 0.0 indicates that no student received credit for the item. At the
opposite extreme, an index of 1.0 indicates that every student received full credit for the item.
Items that are answered correctly by almost all students provide little information about differences in
student ability, but they do indicate knowledge or skills that have been mastered by most students. The
converse is true of items that are incorrectly answered by most students. In general, to provide the most
precise measurement, difficulty indices should range from near-chance performance (0.25 for four-option MC
items, 0.00 for CR items) to 0.90. Experience has indicated that items conforming to this guideline tend to
provide satisfactory statistical information for the bulk of the student population. However, on a criterion-
referenced test such as NECAP Science, it may be appropriate to include some items with difficulty values
outside this region in order to measure well, throughout the range, the skill present at a given grade. Having a
Chapter 6—Item Analyses 42 2007-08 NECAP Science Technical Report
range of item difficulties also helps to ensure that the test does not exhibit an excess of scores at the floor or
ceiling of the distribution.
It is a desirable feature of an item when higher-ability students perform better on it than do lower-
ability students. A commonly used measure of this characteristic is the correlation between total test score and
student performance on the item. Within CTT, this item-test correlation is referred to as the item’s
discrimination, because it indicates the extent to which successful performance on an item discriminates
between high and low scores on the test. For polytomous items on the 2007-08 NECAP Science, the Pearson
product-moment correlation was used as the item discrimination index and the point-biserial correlation was
used for dichotomous items.
The theoretical range of these statistics is –1.0 to +1.0, with a typical range from +0.2 to +0.6.
One can think of a discrimination index as a measure of how closely an item assesses the same
knowledge and skills as other items that contribute to the criterion total score; in other words, the
discrimination index can be interpreted as a measure of construct consistency. In light of this, it is quite
important that an appropriate total score criterion be selected. For 2007-08 NECAP Science, raw score—the
sum of student scores on the common items—was selected. Item-test correlations were computed for each
common item, and results are summarized in the next section.
Summary statistics of the difficulty and discrimination indices by grade are provided below. Means
and standard deviations of p-values and discriminations are presented by form in Table 6-1 and by item type
in Table 6-2. A comparison of indices across grade levels is complicated because the indices are population-
dependent. Direct comparisons would require that either the items or students were common across groups.
As that was not the case, it cannot be determined whether differences in item functioning across grade levels
were due to differences in student cohorts’ abilities or differences in item-set difficulties or both. That said, it
does appear as though the grade 4 test was somewhat easier than the tests at the other grades. Comparing the
difficulty indices between item types is tricky also. MC items can be answered correctly by guessing; thus, it
is not surprising that the p-values for MC items were higher than those for OR items. Similarly, because of
partial-credit scoring, the discrimination indices of OR items tended to be larger than those of MC items.
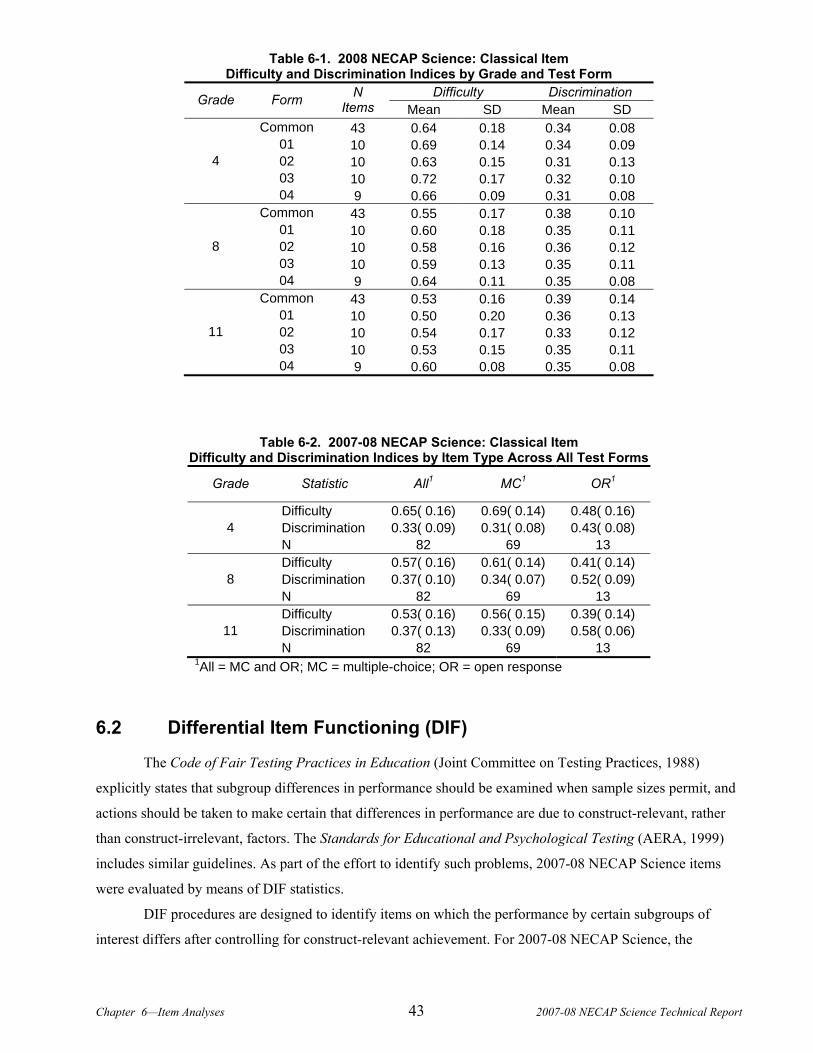
Chapter 6—Item Analyses 43 2007-08 NECAP Science Technical Report
Table 6-1. 2008 NECAP Science: Classical Item Difficulty and Discrimination Indices by Grade and Test Form
Difficulty Discrimination Grade Form N Items Mean SD Mean SD
Common 43 0.64 0.18 0.34 0.08 01 10 0.69 0.14 0.34 0.09 02 10 0.63 0.15 0.31 0.13 03 10 0.72 0.17 0.32 0.10
4
04 9 0.66 0.09 0.31 0.08 Common 43 0.55 0.17 0.38 0.10
01 10 0.60 0.18 0.35 0.11 02 10 0.58 0.16 0.36 0.12 03 10 0.59 0.13 0.35 0.11
8
04 9 0.64 0.11 0.35 0.08 Common 43 0.53 0.16 0.39 0.14
01 10 0.50 0.20 0.36 0.13 02 10 0.54 0.17 0.33 0.12 03 10 0.53 0.15 0.35 0.11
11
04 9 0.60 0.08 0.35 0.08
Table 6-2. 2007-08 NECAP Science: Classical Item Difficulty and Discrimination Indices by Item Type Across All Test Forms
Grade Statistic All1 MC1 OR1
Difficulty 0.65( 0.16) 0.69( 0.14) 0.48( 0.16) Discrimination 0.33( 0.09) 0.31( 0.08) 0.43( 0.08) 4 N 82 69 13 Difficulty 0.57( 0.16) 0.61( 0.14) 0.41( 0.14) Discrimination 0.37( 0.10) 0.34( 0.07) 0.52( 0.09) 8 N 82 69 13 Difficulty 0.53( 0.16) 0.56( 0.15) 0.39( 0.14) Discrimination 0.37( 0.13) 0.33( 0.09) 0.58( 0.06) 11 N 82 69 13
1All = MC and OR; MC = multiple-choice; OR = open response
6.2 Differential Item Functioning (DIF)
The Code of Fair Testing Practices in Education (Joint Committee on Testing Practices, 1988)
explicitly states that subgroup differences in performance should be examined when sample sizes permit, and
actions should be taken to make certain that differences in performance are due to construct-relevant, rather
than construct-irrelevant, factors. The Standards for Educational and Psychological Testing (AERA, 1999)
includes similar guidelines. As part of the effort to identify such problems, 2007-08 NECAP Science items
were evaluated by means of DIF statistics.
DIF procedures are designed to identify items on which the performance by certain subgroups of
interest differs after controlling for construct-relevant achievement. For 2007-08 NECAP Science, the
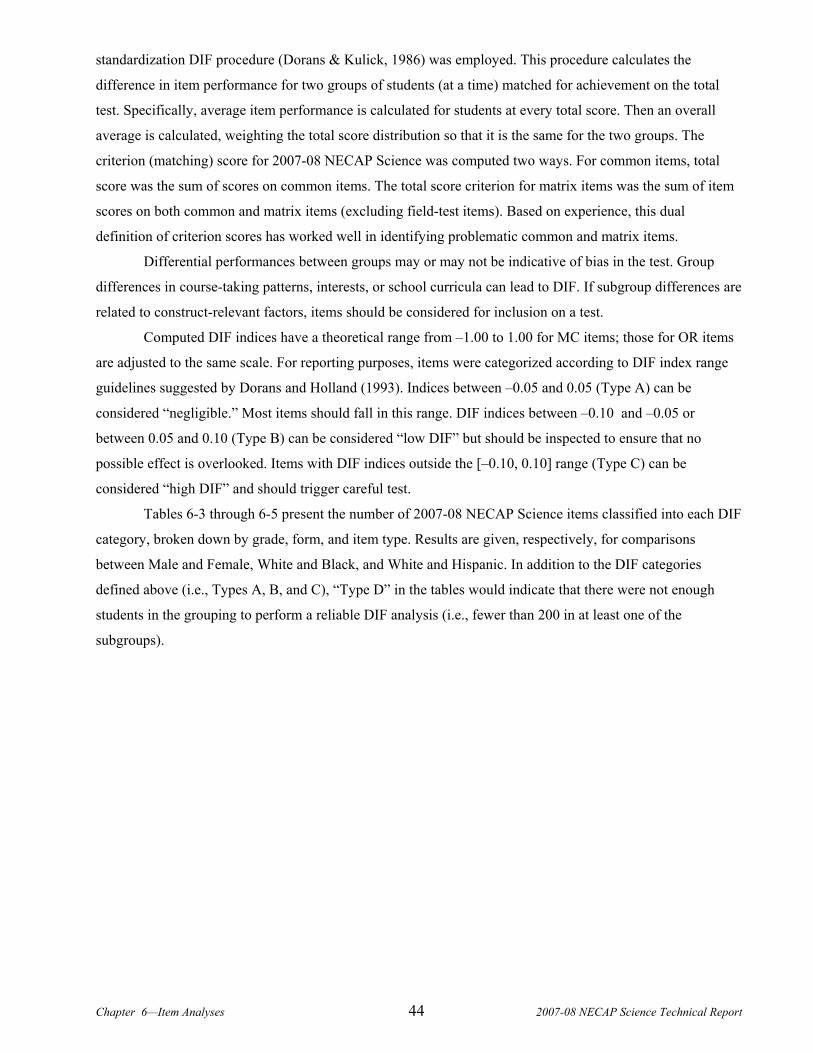
Chapter 6—Item Analyses 44 2007-08 NECAP Science Technical Report
standardization DIF procedure (Dorans & Kulick, 1986) was employed. This procedure calculates the
difference in item performance for two groups of students (at a time) matched for achievement on the total
test. Specifically, average item performance is calculated for students at every total score. Then an overall
average is calculated, weighting the total score distribution so that it is the same for the two groups. The
criterion (matching) score for 2007-08 NECAP Science was computed two ways. For common items, total
score was the sum of scores on common items. The total score criterion for matrix items was the sum of item
scores on both common and matrix items (excluding field-test items). Based on experience, this dual
definition of criterion scores has worked well in identifying problematic common and matrix items.
Differential performances between groups may or may not be indicative of bias in the test. Group
differences in course-taking patterns, interests, or school curricula can lead to DIF. If subgroup differences are
related to construct-relevant factors, items should be considered for inclusion on a test.
Computed DIF indices have a theoretical range from –1.00 to 1.00 for MC items; those for OR items
are adjusted to the same scale. For reporting purposes, items were categorized according to DIF index range
guidelines suggested by Dorans and Holland (1993). Indices between –0.05 and 0.05 (Type A) can be
considered “negligible.” Most items should fall in this range. DIF indices between –0.10 and –0.05 or
between 0.05 and 0.10 (Type B) can be considered “low DIF” but should be inspected to ensure that no
possible effect is overlooked. Items with DIF indices outside the [–0.10, 0.10] range (Type C) can be
considered “high DIF” and should trigger careful test.
Tables 6-3 through 6-5 present the number of 2007-08 NECAP Science items classified into each DIF
category, broken down by grade, form, and item type. Results are given, respectively, for comparisons
between Male and Female, White and Black, and White and Hispanic. In addition to the DIF categories
defined above (i.e., Types A, B, and C), “Type D” in the tables would indicate that there were not enough
students in the grouping to perform a reliable DIF analysis (i.e., fewer than 200 in at least one of the
subgroups).
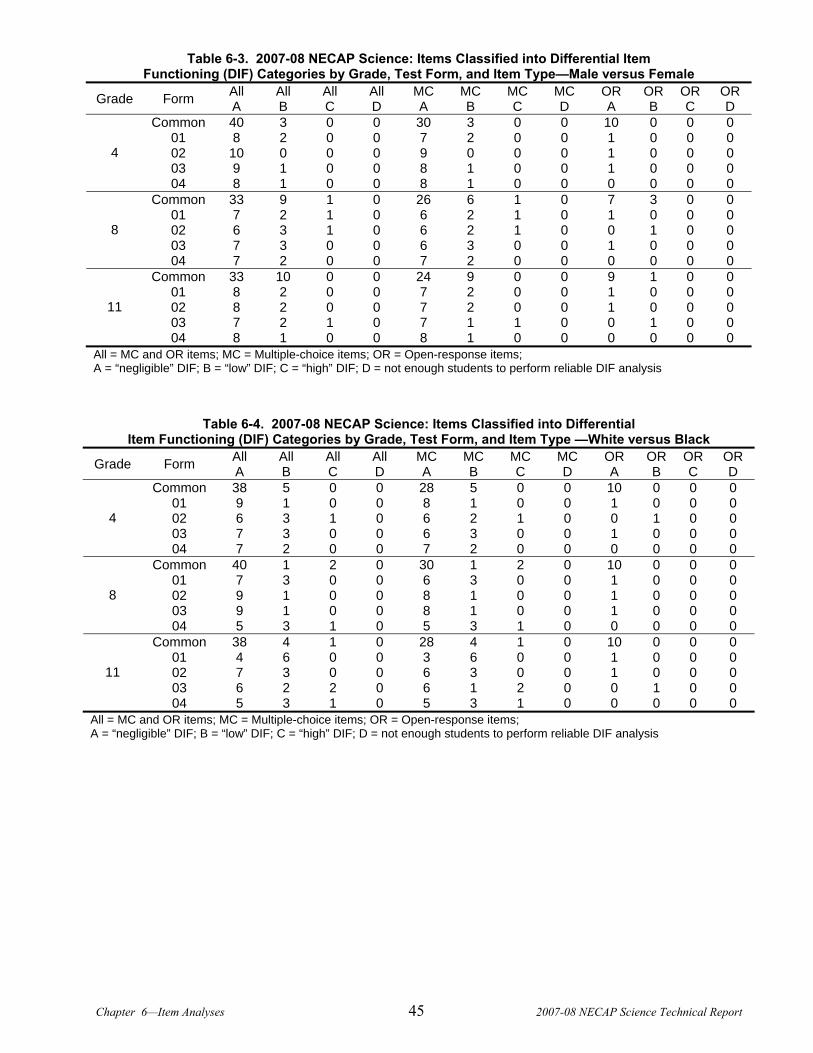
Chapter 6—Item Analyses 45 2007-08 NECAP Science Technical Report
Table 6-3. 2007-08 NECAP Science: Items Classified into Differential Item Functioning (DIF) Categories by Grade, Test Form, and Item Type—Male versus Female
Grade Form All A
All B
All C
All D
MC A
MC B
MC C
MC D
OR A
OR B
OR C
OR D
Common 40 3 0 0 30 3 0 0 10 0 0 0 01 8 2 0 0 7 2 0 0 1 0 0 0 02 10 0 0 0 9 0 0 0 1 0 0 0 03 9 1 0 0 8 1 0 0 1 0 0 0
4
04 8 1 0 0 8 1 0 0 0 0 0 0 Common 33 9 1 0 26 6 1 0 7 3 0 0
01 7 2 1 0 6 2 1 0 1 0 0 0 02 6 3 1 0 6 2 1 0 0 1 0 0 03 7 3 0 0 6 3 0 0 1 0 0 0
8
04 7 2 0 0 7 2 0 0 0 0 0 0 Common 33 10 0 0 24 9 0 0 9 1 0 0
01 8 2 0 0 7 2 0 0 1 0 0 0 02 8 2 0 0 7 2 0 0 1 0 0 0 03 7 2 1 0 7 1 1 0 0 1 0 0
11
04 8 1 0 0 8 1 0 0 0 0 0 0 All = MC and OR items; MC = Multiple-choice items; OR = Open-response items; A = “negligible” DIF; B = “low” DIF; C = “high” DIF; D = not enough students to perform reliable DIF analysis
Table 6-4. 2007-08 NECAP Science: Items Classified into Differential Item Functioning (DIF) Categories by Grade, Test Form, and Item Type —White versus Black
Grade Form All A
All B
All C
All D
MC A
MC B
MC C
MC D
OR A
OR B
OR C
OR D
Common 38 5 0 0 28 5 0 0 10 0 0 0 01 9 1 0 0 8 1 0 0 1 0 0 0 02 6 3 1 0 6 2 1 0 0 1 0 0 03 7 3 0 0 6 3 0 0 1 0 0 0
4
04 7 2 0 0 7 2 0 0 0 0 0 0 Common 40 1 2 0 30 1 2 0 10 0 0 0
01 7 3 0 0 6 3 0 0 1 0 0 0 02 9 1 0 0 8 1 0 0 1 0 0 0 03 9 1 0 0 8 1 0 0 1 0 0 0
8
04 5 3 1 0 5 3 1 0 0 0 0 0 Common 38 4 1 0 28 4 1 0 10 0 0 0
01 4 6 0 0 3 6 0 0 1 0 0 0 02 7 3 0 0 6 3 0 0 1 0 0 0 03 6 2 2 0 6 1 2 0 0 1 0 0
11
04 5 3 1 0 5 3 1 0 0 0 0 0 All = MC and OR items; MC = Multiple-choice items; OR = Open-response items; A = “negligible” DIF; B = “low” DIF; C = “high” DIF; D = not enough students to perform reliable DIF analysis
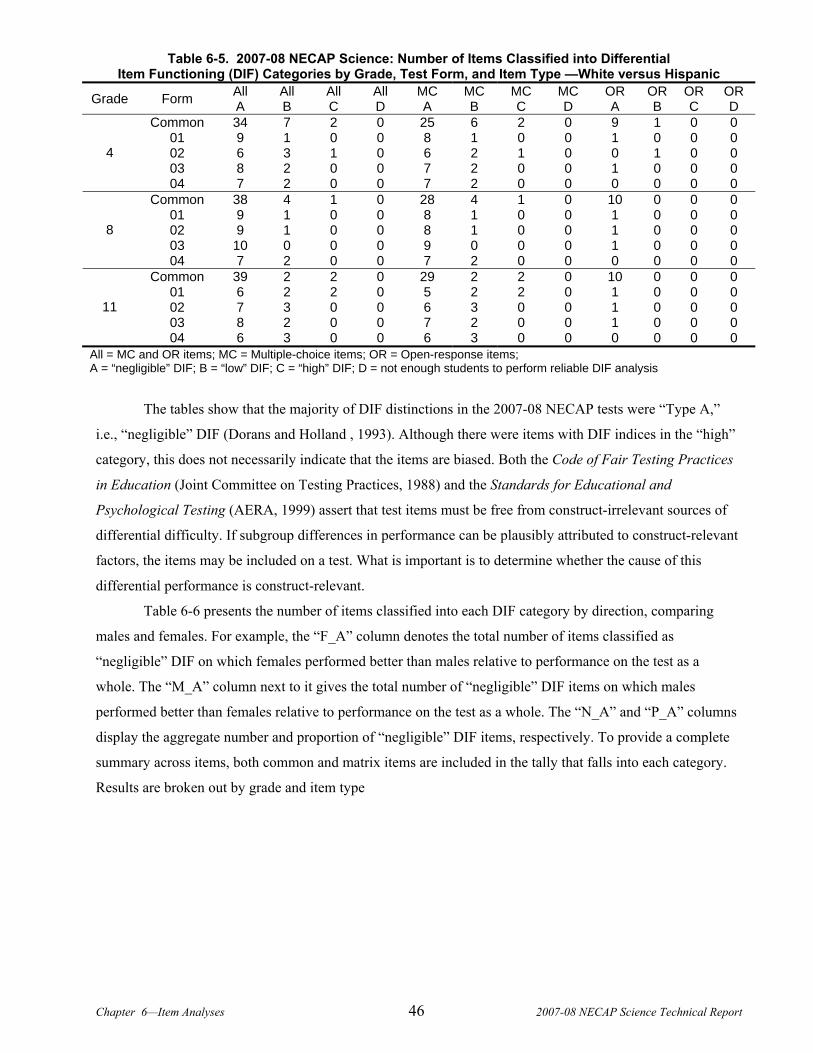
Chapter 6—Item Analyses 46 2007-08 NECAP Science Technical Report
Table 6-5. 2007-08 NECAP Science: Number of Items Classified into Differential Item Functioning (DIF) Categories by Grade, Test Form, and Item Type —White versus Hispanic
Grade Form All A
All B
All C
All D
MC A
MC B
MC C
MC D
OR A
OR B
OR C
OR D
Common 34 7 2 0 25 6 2 0 9 1 0 0 01 9 1 0 0 8 1 0 0 1 0 0 0 02 6 3 1 0 6 2 1 0 0 1 0 0 03 8 2 0 0 7 2 0 0 1 0 0 0
4
04 7 2 0 0 7 2 0 0 0 0 0 0 Common 38 4 1 0 28 4 1 0 10 0 0 0
01 9 1 0 0 8 1 0 0 1 0 0 0 02 9 1 0 0 8 1 0 0 1 0 0 0 03 10 0 0 0 9 0 0 0 1 0 0 0
8
04 7 2 0 0 7 2 0 0 0 0 0 0 Common 39 2 2 0 29 2 2 0 10 0 0 0
01 6 2 2 0 5 2 2 0 1 0 0 0 02 7 3 0 0 6 3 0 0 1 0 0 0 03 8 2 0 0 7 2 0 0 1 0 0 0
11
04 6 3 0 0 6 3 0 0 0 0 0 0 All = MC and OR items; MC = Multiple-choice items; OR = Open-response items; A = “negligible” DIF; B = “low” DIF; C = “high” DIF; D = not enough students to perform reliable DIF analysis
The tables show that the majority of DIF distinctions in the 2007-08 NECAP tests were “Type A,”
i.e., “negligible” DIF (Dorans and Holland , 1993). Although there were items with DIF indices in the “high”
category, this does not necessarily indicate that the items are biased. Both the Code of Fair Testing Practices
in Education (Joint Committee on Testing Practices, 1988) and the Standards for Educational and
Psychological Testing (AERA, 1999) assert that test items must be free from construct-irrelevant sources of
differential difficulty. If subgroup differences in performance can be plausibly attributed to construct-relevant
factors, the items may be included on a test. What is important is to determine whether the cause of this
differential performance is construct-relevant.
Table 6-6 presents the number of items classified into each DIF category by direction, comparing
males and females. For example, the “F_A” column denotes the total number of items classified as
“negligible” DIF on which females performed better than males relative to performance on the test as a
whole. The “M_A” column next to it gives the total number of “negligible” DIF items on which males
performed better than females relative to performance on the test as a whole. The “N_A” and “P_A” columns
display the aggregate number and proportion of “negligible” DIF items, respectively. To provide a complete
summary across items, both common and matrix items are included in the tally that falls into each category.
Results are broken out by grade and item type
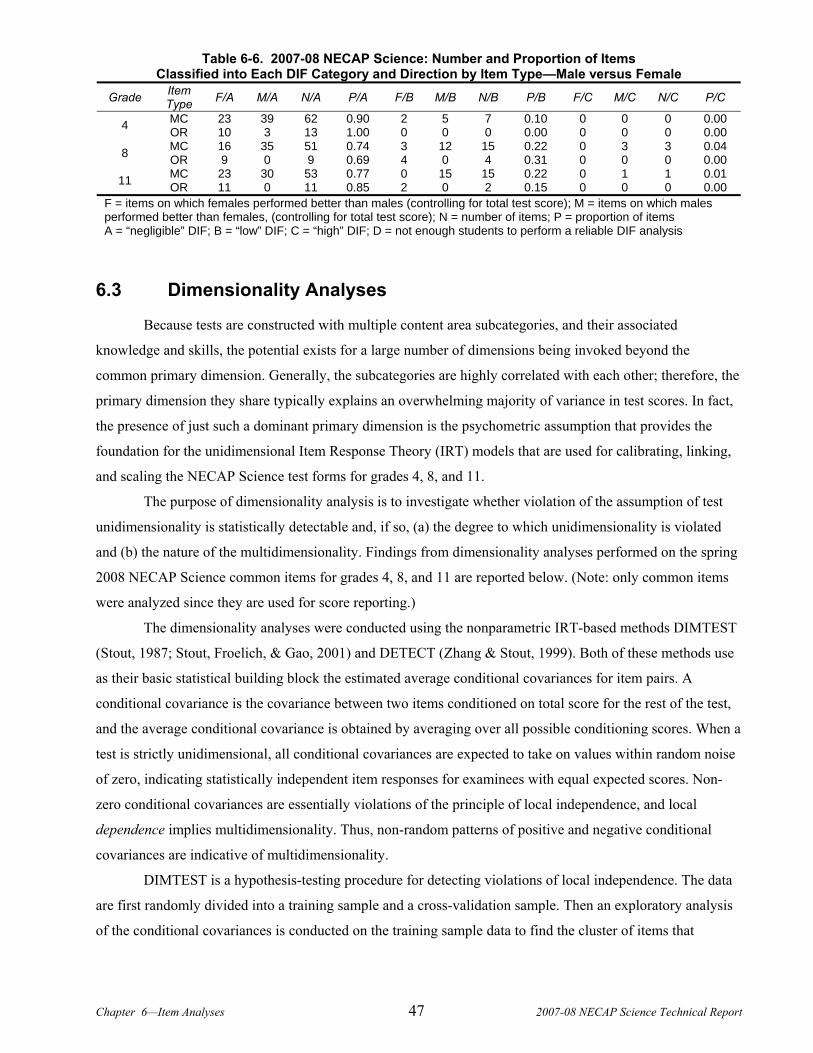
Chapter 6—Item Analyses 47 2007-08 NECAP Science Technical Report
Table 6-6. 2007-08 NECAP Science: Number and Proportion of Items Classified into Each DIF Category and Direction by Item Type—Male versus Female
Grade Item Type F/A M/A N/A P/A F/B M/B N/B P/B F/C M/C N/C P/C
MC 23 39 62 0.90 2 5 7 0.10 0 0 0 0.00 4 OR 10 3 13 1.00 0 0 0 0.00 0 0 0 0.00 MC 16 35 51 0.74 3 12 15 0.22 0 3 3 0.04 8 OR 9 0 9 0.69 4 0 4 0.31 0 0 0 0.00 MC 23 30 53 0.77 0 15 15 0.22 0 1 1 0.01 11 OR 11 0 11 0.85 2 0 2 0.15 0 0 0 0.00
F = items on which females performed better than males (controlling for total test score); M = items on which males performed better than females, (controlling for total test score); N = number of items; P = proportion of items A = “negligible” DIF; B = “low” DIF; C = “high” DIF; D = not enough students to perform a reliable DIF analysis
6.3 Dimensionality Analyses
Because tests are constructed with multiple content area subcategories, and their associated
knowledge and skills, the potential exists for a large number of dimensions being invoked beyond the
common primary dimension. Generally, the subcategories are highly correlated with each other; therefore, the
primary dimension they share typically explains an overwhelming majority of variance in test scores. In fact,
the presence of just such a dominant primary dimension is the psychometric assumption that provides the
foundation for the unidimensional Item Response Theory (IRT) models that are used for calibrating, linking,
and scaling the NECAP Science test forms for grades 4, 8, and 11.
The purpose of dimensionality analysis is to investigate whether violation of the assumption of test
unidimensionality is statistically detectable and, if so, (a) the degree to which unidimensionality is violated
and (b) the nature of the multidimensionality. Findings from dimensionality analyses performed on the spring
2008 NECAP Science common items for grades 4, 8, and 11 are reported below. (Note: only common items
were analyzed since they are used for score reporting.)
The dimensionality analyses were conducted using the nonparametric IRT-based methods DIMTEST
(Stout, 1987; Stout, Froelich, & Gao, 2001) and DETECT (Zhang & Stout, 1999). Both of these methods use
as their basic statistical building block the estimated average conditional covariances for item pairs. A
conditional covariance is the covariance between two items conditioned on total score for the rest of the test,
and the average conditional covariance is obtained by averaging over all possible conditioning scores. When a
test is strictly unidimensional, all conditional covariances are expected to take on values within random noise
of zero, indicating statistically independent item responses for examinees with equal expected scores. Non-
zero conditional covariances are essentially violations of the principle of local independence, and local
dependence implies multidimensionality. Thus, non-random patterns of positive and negative conditional
covariances are indicative of multidimensionality.
DIMTEST is a hypothesis-testing procedure for detecting violations of local independence. The data
are first randomly divided into a training sample and a cross-validation sample. Then an exploratory analysis
of the conditional covariances is conducted on the training sample data to find the cluster of items that
Chapter 6—Item Analyses 48 2007-08 NECAP Science Technical Report
displays the greatest evidence of local dependence. The cross-validation sample is then used to test whether
the conditional covariances of the selected cluster of items displays local dependence, conditioning on total
score on the non-clustered items. The DIMTEST statistic follows a standard normal distribution under the
null hypothesis of unidimensionality.
DETECT is an effect-size measure of multidimensionality. As with DIMTEST, the data are first
randomly divided into a training sample and a cross-validation sample (these samples are drawn independent
of those used with DIMTEST). The training sample is used to find a set of mutually exclusive and
collectively exhaustive clusters of items that best fit a systematic pattern of positive conditional covariances
for pairs of items from the same cluster and negative conditional covariances from different clusters. Next, the
clusters from the training sample are used with the cross-validation sample data to average the conditional
covariances: within-cluster conditional covariances are summed, from this sum the between-cluster
conditional covariances are subtracted, this difference is divided by the total number of item pairs, and this
average is multiplied by 100 to yield an index of the average violation of local independence for an item pair.
DETECT values less than 0.2 indicate very weak multidimensionality (or near unidimensionality), values of
0.2 to 0.4 weak to moderate multidimensionality; values of 0.4 to 1.0 moderate to strong multidimensionality,
and values greater than 1.0 very strong multidimensionality.
DIMTEST and DETECT were applied to the spring 2008 NECAP Science tests for grades 4, 8, and
11. The data for each grade were split into a training sample and a cross-validation sample. Each grade had at
least 30,000 student examinees. Because DIMTEST was limited to using 24,000 students, the training and
cross-validation samples for the DIMTEST analyses used 12,000 each, randomly sampled from the total
sample. DETECT, on the other hand, had an upper limit of 50,000 students, so every training sample and
cross-validation sample used with DETECT had at least 15,000 students. DIMTEST was then applied to each
of the science grades. DETECT was applied to each dataset for which the DIMTEST null hypothesis was
rejected in order to estimate the effect size of the multidimensionality.
The results of the DIMTEST hypothesis tests were that the null hypothesis was strongly rejected for
every dataset (p-value < 0.00005 in all three cases). Because strict unidimensionality is an idealization that
almost never holds exactly for a given dataset, these DIMTEST results were not surprising. Indeed, because
of the very large sample sizes of NECAP, DIMTEST would be expected to be sensitive to even quite small
violations of unidimensionality. Thus, it was important to use DETECT to estimate the effect size of the
violations of local independence found by DIMTEST. Table 6-7 displays the multidimensional effect size
estimates from DETECT.
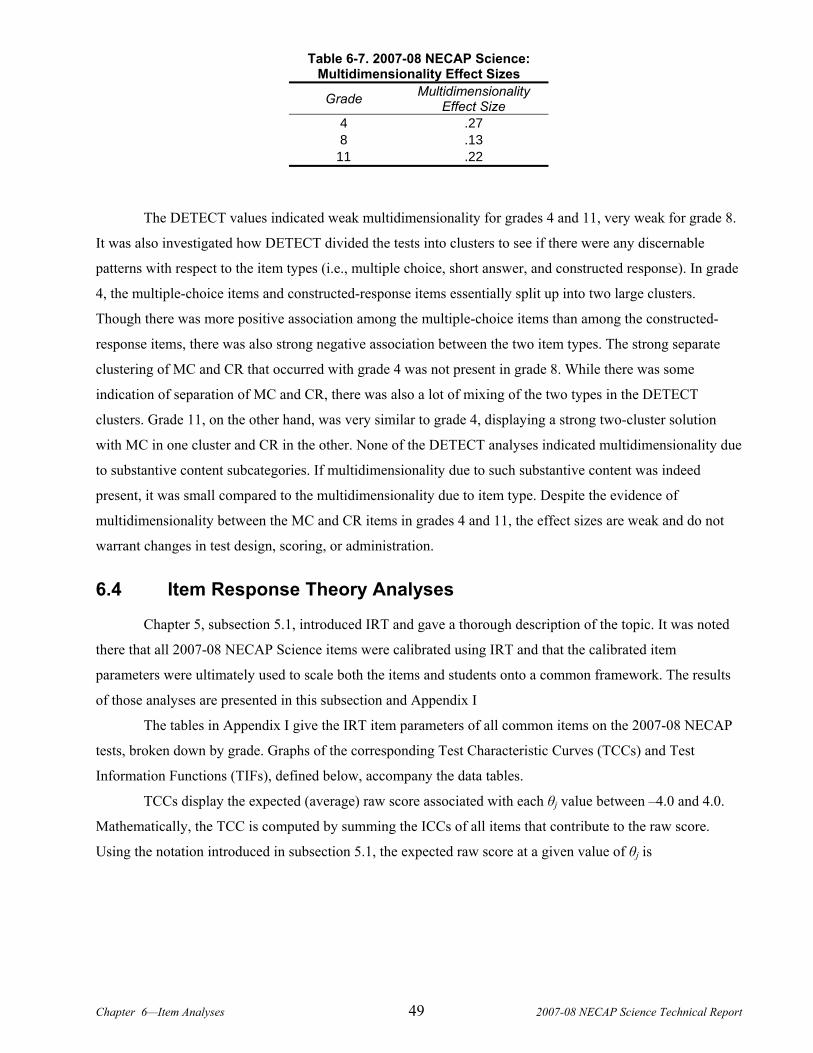
Chapter 6—Item Analyses 49 2007-08 NECAP Science Technical Report
Table 6-7. 2007-08 NECAP Science: Multidimensionality Effect Sizes
Grade Multidimensionality Effect Size
4 .27 8 .13
11 .22
The DETECT values indicated weak multidimensionality for grades 4 and 11, very weak for grade 8.
It was also investigated how DETECT divided the tests into clusters to see if there were any discernable
patterns with respect to the item types (i.e., multiple choice, short answer, and constructed response). In grade
4, the multiple-choice items and constructed-response items essentially split up into two large clusters.
Though there was more positive association among the multiple-choice items than among the constructed-
response items, there was also strong negative association between the two item types. The strong separate
clustering of MC and CR that occurred with grade 4 was not present in grade 8. While there was some
indication of separation of MC and CR, there was also a lot of mixing of the two types in the DETECT
clusters. Grade 11, on the other hand, was very similar to grade 4, displaying a strong two-cluster solution
with MC in one cluster and CR in the other. None of the DETECT analyses indicated multidimensionality due
to substantive content subcategories. If multidimensionality due to such substantive content was indeed
present, it was small compared to the multidimensionality due to item type. Despite the evidence of
multidimensionality between the MC and CR items in grades 4 and 11, the effect sizes are weak and do not
warrant changes in test design, scoring, or administration.
6.4 Item Response Theory Analyses
Chapter 5, subsection 5.1, introduced IRT and gave a thorough description of the topic. It was noted
there that all 2007-08 NECAP Science items were calibrated using IRT and that the calibrated item
parameters were ultimately used to scale both the items and students onto a common framework. The results
of those analyses are presented in this subsection and Appendix I
The tables in Appendix I give the IRT item parameters of all common items on the 2007-08 NECAP
tests, broken down by grade. Graphs of the corresponding Test Characteristic Curves (TCCs) and Test
Information Functions (TIFs), defined below, accompany the data tables.
TCCs display the expected (average) raw score associated with each θj value between –4.0 and 4.0.
Mathematically, the TCC is computed by summing the ICCs of all items that contribute to the raw score.
Using the notation introduced in subsection 5.1, the expected raw score at a given value of θj is

Chapter 6—Item Analyses 50 2007-08 NECAP Science Technical Report
( )1
( | ) 1 ,n
j i ji
E X Pθ θ=
=∑
where i indexes the items (and n is the number of items contributing to the raw score), j indexes students (here, jθ runs from –4 to 4)
( | )jE X θ is the expected raw score for a student of ability jθ .
The expected raw score monotonically increases with jθ , consistent with the notion that students of
high ability tend to earn higher raw scores than do students of low ability. Most TCCs are “S-shaped”—flatter
at the ends of the distribution and steeper in the middle.
The TIF displays the amount of statistical information that the test provides at each value of jθ .
There is a direct relation between the information of a test and its standard error of measurement (SEM).
Information functions depict test precision across the entire latent trait continuum. For long tests, the SEM at
a given jθ is approximately equal to the inverse of the square root of the statistical information (I) at jθ
(Hambleton, Swaminathan, & Rogers, 1991):
1( )( )
jj
SEMI
θθ
=
Compared to the tails, TIFs are often higher near the middle of the θ θ distribution, where most
students are located and most items are sensitive by design.
Chapter 7—Reliability 51 2007-08 NECAP Science Technical Report
Chapter 7. RELIABILITY Although an individual item’s performance is an important focus for evaluation, a complete
evaluation of an assessment must also address the way items function together and complement one another.
Tests that function well provide a dependable assessment of the student’s level of ability. Unfortunately, no
test can do this perfectly. A variety of factors can contribute to a given student’s score being either higher or
lower than his or her true ability. For example, a student may mis-read an item, or mistakenly fill in the wrong
bubble when he or she knew the answer. Collectively, extraneous factors that impact a student’s score are
referred to as measurement error. Any assessment includes some amount of measurement error; that is, no
measurement is perfect. This is true of all academic assessments—some students will receive scores that
underestimate their true ability, and other students will receive scores that overestimate their true ability.
When tests have a high amount of measurement error, student scores are very unstable. Students with high
ability may get low scores or vice versa. Consequently, one cannot reliably measure a student’s true level of
ability with such a test. Assessments that have less measurement error (i.e., errors made are small on average
and student scores on such a test will consistently represent their ability) are described as reliable.
There are a number of ways to estimate an assessment’s reliability. One possible approach is to give
the same test to the same students at two different points in time. If students receive the same scores on each
test, then the extraneous factors affecting performance are small and the test is reliable. (This is referred to as
test-retest reliability.) A potential problem with this approach is that students may remember items from the
first administration or may have gained (or lost) knowledge or skills in the interim between the two
administrations. A solution to the “remembering items” problem is to give a different, but parallel test at the
second administration. If student scores on each test correlate highly the test is considered reliable. (This is
known as alternate forms reliability, because an alternate form of the test is used in each administration.) This
approach, however, does not address the problem that students may have gained (or lost) knowledge or skills
in the interim between the two administrations. In addition, the practical challenges of developing and
administering parallel forms generally preclude the use of parallel forms reliability indices. A way to address
these several problems is to split the test in half and then correlate students’ scores on the two half-tests; this
in effect treats each half-test as a complete test. In doing so, the problems associated with an intervening time
interval or of creating and administering two parallel forms of the test are alleviated. This is known as a split-
half estimate of reliability. If the two half-test scores correlate highly, items on the two half-tests must be
measuring very similar knowledge or skills. This is evidence that the items complement one another and
function well as a group. This also suggests that measurement error will be minimal.
The split-half method requires psychometricians to select items that contribute to each half-test score.
This decision may have an impact on the resulting correlation, since each different possible split of the test
halves will result in a different correlation. Another problem with the split-half method of calculating
reliability is that it underestimates reliability, because test length is cut in half. All else being equal, a shorter
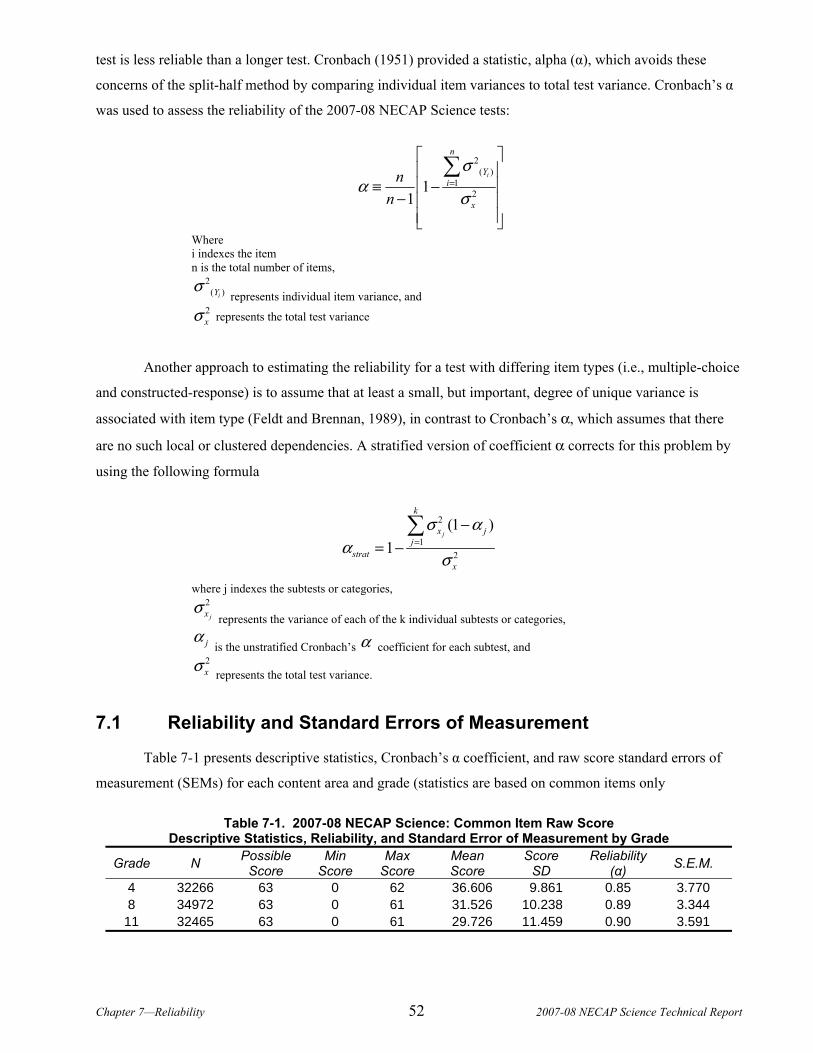
Chapter 7—Reliability 52 2007-08 NECAP Science Technical Report
test is less reliable than a longer test. Cronbach (1951) provided a statistic, alpha (α), which avoids these
concerns of the split-half method by comparing individual item variances to total test variance. Cronbach’s α
was used to assess the reliability of the 2007-08 NECAP Science tests:
2( )
121
1
i
n
Yi
x
nn
σα
σ=
⎡ ⎤⎢ ⎥⎢ ⎥≡ −
− ⎢ ⎥⎢ ⎥⎣ ⎦
∑
Where i indexes the item n is the total number of items,
2( )iYσ
represents individual item variance, and 2xσ represents the total test variance
Another approach to estimating the reliability for a test with differing item types (i.e., multiple-choice
and constructed-response) is to assume that at least a small, but important, degree of unique variance is
associated with item type (Feldt and Brennan, 1989), in contrast to Cronbach’s α, which assumes that there
are no such local or clustered dependencies. A stratified version of coefficient α corrects for this problem by
using the following formula
2
12
(1 )1
j
k
x jj
stratx
σ αα
σ=
−= −
∑
where j indexes the subtests or categories, 2
jxσ represents the variance of each of the k individual subtests or categories,
jα is the unstratified Cronbach’s α coefficient for each subtest, and
2xσ
represents the total test variance.
7.1 Reliability and Standard Errors of Measurement
Table 7-1 presents descriptive statistics, Cronbach’s α coefficient, and raw score standard errors of
measurement (SEMs) for each content area and grade (statistics are based on common items only
Table 7-1. 2007-08 NECAP Science: Common Item Raw Score Descriptive Statistics, Reliability, and Standard Error of Measurement by Grade
Grade N Possible Score
Min Score
Max Score
Mean Score
Score SD
Reliability (α) S.E.M.
4 32266 63 0 62 36.606 9.861 0.85 3.770 8 34972 63 0 61 31.526 10.238 0.89 3.344
11 32465 63 0 61 29.726 11.459 0.90 3.591
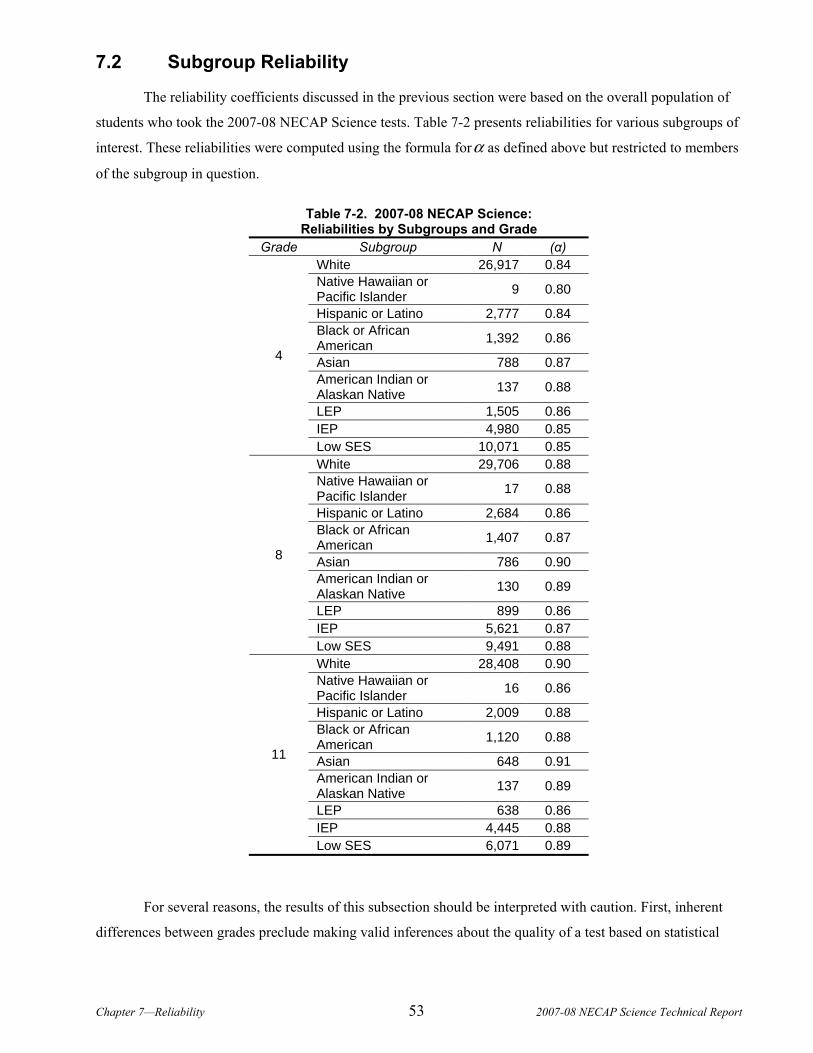
Chapter 7—Reliability 53 2007-08 NECAP Science Technical Report
7.2 Subgroup Reliability
The reliability coefficients discussed in the previous section were based on the overall population of
students who took the 2007-08 NECAP Science tests. Table 7-2 presents reliabilities for various subgroups of
interest. These reliabilities were computed using the formula forα as defined above but restricted to members
of the subgroup in question.
Table 7-2. 2007-08 NECAP Science: Reliabilities by Subgroups and Grade
Grade Subgroup N (α) White 26,917 0.84 Native Hawaiian or Pacific Islander 9 0.80
Hispanic or Latino 2,777 0.84 Black or African American 1,392 0.86
Asian 788 0.87 American Indian or Alaskan Native 137 0.88
LEP 1,505 0.86 IEP 4,980 0.85
4
Low SES 10,071 0.85 White 29,706 0.88 Native Hawaiian or Pacific Islander 17 0.88
Hispanic or Latino 2,684 0.86 Black or African American 1,407 0.87
Asian 786 0.90 American Indian or Alaskan Native 130 0.89
LEP 899 0.86 IEP 5,621 0.87
8
Low SES 9,491 0.88 White 28,408 0.90 Native Hawaiian or Pacific Islander 16 0.86
Hispanic or Latino 2,009 0.88 Black or African American 1,120 0.88
Asian 648 0.91 American Indian or Alaskan Native 137 0.89
LEP 638 0.86 IEP 4,445 0.88
11
Low SES 6,071 0.89
For several reasons, the results of this subsection should be interpreted with caution. First, inherent
differences between grades preclude making valid inferences about the quality of a test based on statistical
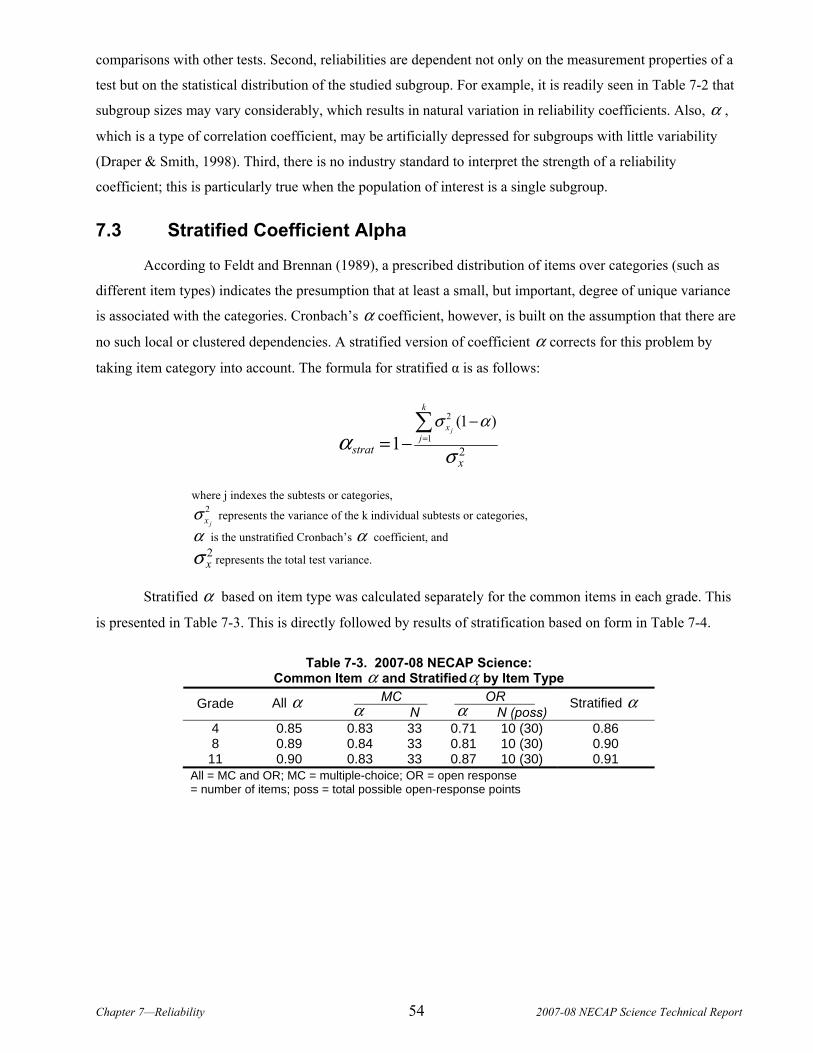
Chapter 7—Reliability 54 2007-08 NECAP Science Technical Report
comparisons with other tests. Second, reliabilities are dependent not only on the measurement properties of a
test but on the statistical distribution of the studied subgroup. For example, it is readily seen in Table 7-2 that
subgroup sizes may vary considerably, which results in natural variation in reliability coefficients. Also, α ,
which is a type of correlation coefficient, may be artificially depressed for subgroups with little variability
(Draper & Smith, 1998). Third, there is no industry standard to interpret the strength of a reliability
coefficient; this is particularly true when the population of interest is a single subgroup.
7.3 Stratified Coefficient Alpha
According to Feldt and Brennan (1989), a prescribed distribution of items over categories (such as
different item types) indicates the presumption that at least a small, but important, degree of unique variance
is associated with the categories. Cronbach’s α coefficient, however, is built on the assumption that there are
no such local or clustered dependencies. A stratified version of coefficient α corrects for this problem by
taking item category into account. The formula for stratified α is as follows:
2
12
(1 )1 =
−= −
∑ j
k
xj
stratx
σ α
σα
where j indexes the subtests or categories, 2
jxσ represents the variance of the k individual subtests or categories,
α is the unstratified Cronbach’s α coefficient, and 2xσ represents the total test variance.
Stratified α based on item type was calculated separately for the common items in each grade. This
is presented in Table 7-3. This is directly followed by results of stratification based on form in Table 7-4.
Table 7-3. 2007-08 NECAP Science: Common Item α and Stratifiedα by Item Type
MC OR Grade All α α N α N (poss) Stratified α
4 0.85 0.83 33 0.71 10 (30) 0.86 8 0.89 0.84 33 0.81 10 (30) 0.90
11 0.90 0.83 33 0.87 10 (30) 0.91 All = MC and OR; MC = multiple-choice; OR = open response = number of items; poss = total possible open-response points
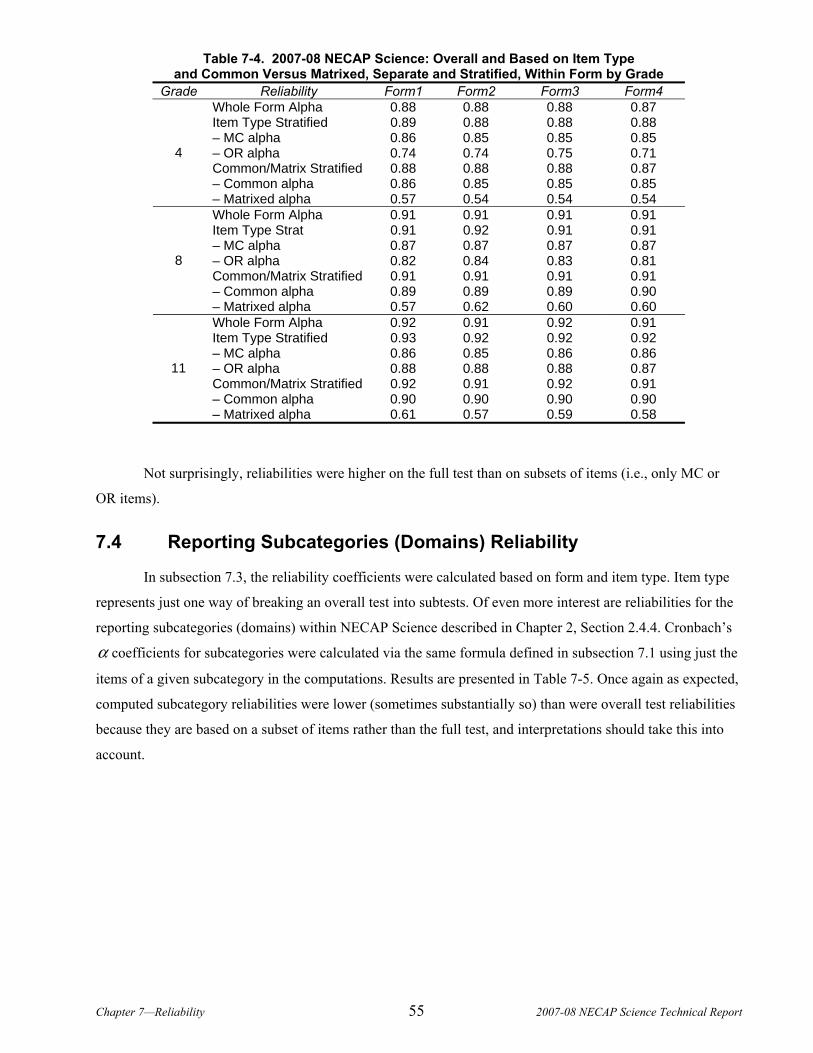
Chapter 7—Reliability 55 2007-08 NECAP Science Technical Report
Table 7-4. 2007-08 NECAP Science: Overall and Based on Item Type and Common Versus Matrixed, Separate and Stratified, Within Form by Grade
Grade Reliability Form1 Form2 Form3 Form4 Whole Form Alpha 0.88 0.88 0.88 0.87 Item Type Stratified 0.89 0.88 0.88 0.88 – MC alpha 0.86 0.85 0.85 0.85 – OR alpha 0.74 0.74 0.75 0.71 Common/Matrix Stratified 0.88 0.88 0.88 0.87 – Common alpha 0.86 0.85 0.85 0.85
4
– Matrixed alpha 0.57 0.54 0.54 0.54 Whole Form Alpha 0.91 0.91 0.91 0.91 Item Type Strat 0.91 0.92 0.91 0.91 – MC alpha 0.87 0.87 0.87 0.87 – OR alpha 0.82 0.84 0.83 0.81 Common/Matrix Stratified 0.91 0.91 0.91 0.91 – Common alpha 0.89 0.89 0.89 0.90
8
– Matrixed alpha 0.57 0.62 0.60 0.60 Whole Form Alpha 0.92 0.91 0.92 0.91 Item Type Stratified 0.93 0.92 0.92 0.92 – MC alpha 0.86 0.85 0.86 0.86 – OR alpha 0.88 0.88 0.88 0.87 Common/Matrix Stratified 0.92 0.91 0.92 0.91 – Common alpha 0.90 0.90 0.90 0.90
11
– Matrixed alpha 0.61 0.57 0.59 0.58
Not surprisingly, reliabilities were higher on the full test than on subsets of items (i.e., only MC or
OR items).
7.4 Reporting Subcategories (Domains) Reliability
In subsection 7.3, the reliability coefficients were calculated based on form and item type. Item type
represents just one way of breaking an overall test into subtests. Of even more interest are reliabilities for the
reporting subcategories (domains) within NECAP Science described in Chapter 2, Section 2.4.4. Cronbach’s
α coefficients for subcategories were calculated via the same formula defined in subsection 7.1 using just the
items of a given subcategory in the computations. Results are presented in Table 7-5. Once again as expected,
computed subcategory reliabilities were lower (sometimes substantially so) than were overall test reliabilities
because they are based on a subset of items rather than the full test, and interpretations should take this into
account.
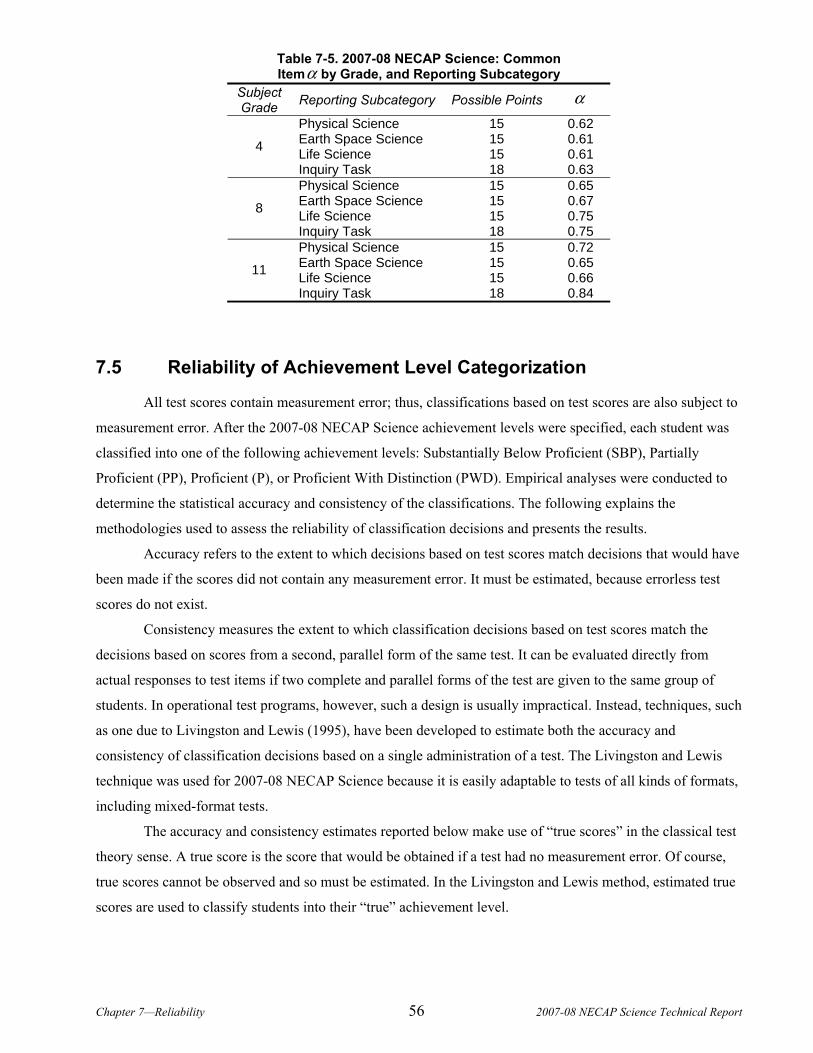
Chapter 7—Reliability 56 2007-08 NECAP Science Technical Report
Table 7-5. 2007-08 NECAP Science: Common Itemα by Grade, and Reporting Subcategory
Subject Grade Reporting Subcategory Possible Points α
Physical Science 15 0.62 Earth Space Science 15 0.61 Life Science 15 0.61 4
Inquiry Task 18 0.63 Physical Science 15 0.65 Earth Space Science 15 0.67 Life Science 15 0.75 8
Inquiry Task 18 0.75 Physical Science 15 0.72 Earth Space Science 15 0.65 Life Science 15 0.66 11
Inquiry Task 18 0.84
7.5 Reliability of Achievement Level Categorization
All test scores contain measurement error; thus, classifications based on test scores are also subject to
measurement error. After the 2007-08 NECAP Science achievement levels were specified, each student was
classified into one of the following achievement levels: Substantially Below Proficient (SBP), Partially
Proficient (PP), Proficient (P), or Proficient With Distinction (PWD). Empirical analyses were conducted to
determine the statistical accuracy and consistency of the classifications. The following explains the
methodologies used to assess the reliability of classification decisions and presents the results.
Accuracy refers to the extent to which decisions based on test scores match decisions that would have
been made if the scores did not contain any measurement error. It must be estimated, because errorless test
scores do not exist.
Consistency measures the extent to which classification decisions based on test scores match the
decisions based on scores from a second, parallel form of the same test. It can be evaluated directly from
actual responses to test items if two complete and parallel forms of the test are given to the same group of
students. In operational test programs, however, such a design is usually impractical. Instead, techniques, such
as one due to Livingston and Lewis (1995), have been developed to estimate both the accuracy and
consistency of classification decisions based on a single administration of a test. The Livingston and Lewis
technique was used for 2007-08 NECAP Science because it is easily adaptable to tests of all kinds of formats,
including mixed-format tests.
The accuracy and consistency estimates reported below make use of “true scores” in the classical test
theory sense. A true score is the score that would be obtained if a test had no measurement error. Of course,
true scores cannot be observed and so must be estimated. In the Livingston and Lewis method, estimated true
scores are used to classify students into their “true” achievement level.
Chapter 7—Reliability 57 2007-08 NECAP Science Technical Report
For 2007-08 NECAP Science, after various technical adjustments were made (described in Livingston
and Lewis, 1995), a 4 x 4 contingency table of accuracy was created for each grade, where cell [i,j]
represented the estimated proportion of students whose true score fell into achievement level i (where i = 1 –
4) and observed score into achievement level j (where j = 1 – 4). The sum of the diagonal entries, i.e., the
proportion of students whose true and observed achievement levels matched one another, signified overall
accuracy.
For consistency, true scores were used to estimate the joint distribution of classifications on two
independent, parallel test forms. Following statistical adjustments (per Livingston and Lewis, 1995), a new 4
× 4 contingency table was created for each grade and populated by the proportion of students who would be
classified into each combination of achievement levels according to the two (hypothetical) parallel test forms.
Cell [i,j] of this table represented the estimated proportion of students whose observed score on the first form
would fall into achievement level i (where i = 1 – 4), and whose observed score on the second form would fall
into achievement level j (where j = 1 – 4). The sum of the diagonal entries, i.e., the proportion of students
classified by the two forms into exactly the same achievement level, signified overall consistency.
Another way to measure consistency is to use Cohen’s (1960) coefficient κ (kappa), which assesses
the proportion of consistent classifications after removing the proportion of consistent classifications that
would be expected by chance. It is calculated using the following formula:
. .
. .
(Observed agreement) - (Chance agreement) ,1 - (Chance agreement) 1
ii i i
i i
i i
i
C C C
C Cκ
−= =
−
∑ ∑∑
where: Ci. is the proportion of students whose observed achievement level would be Level i (where i=1 – 4) on the first hypothetical parallel form of the test; C.i is the proportion of students whose observed achievement level would be Level i (where i=1 – 4) on the second hypothetical parallel form of the test; Cii is the proportion of students whose observed achievement level would be Level i (where i=1 – 4) on both hypothetical parallel forms of the test.
Because κ is corrected for chance, its values are lower than are other consistency estimates.
7.5.1 Results of Accuracy, Consistency, and Kappa Analyses
The accuracy and consistency analyses described above are tabulated in Appendix J. The appendix
includes the accuracy and consistency contingency tables described above and the overall accuracy and
consistency indices, including kappa.
Accuracy and consistency values conditional upon achievement level are also given in Appendix J.
For these calculations, the denominator is the proportion of students associated with a given achievement
level. For example, the conditional accuracy value is 0.756 for the Partially Proficient achievement level for
grade 4. This figure indicates that among the students whose true scores placed them in the Partially
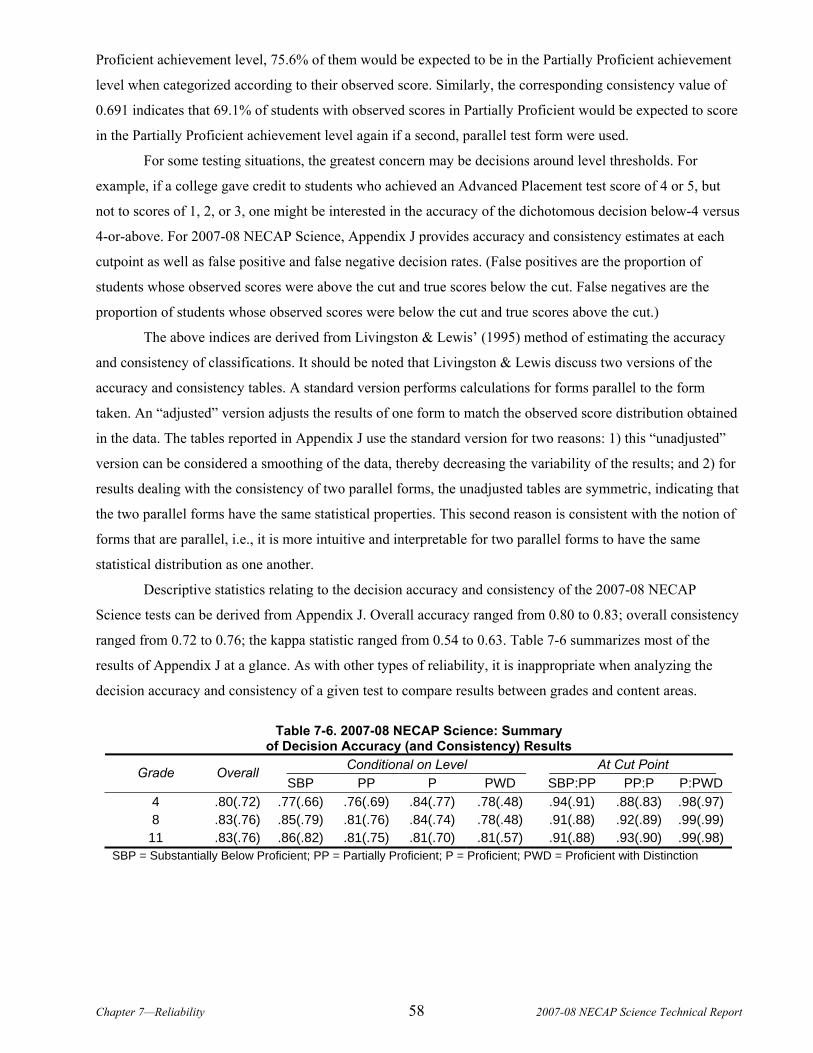
Chapter 7—Reliability 58 2007-08 NECAP Science Technical Report
Proficient achievement level, 75.6% of them would be expected to be in the Partially Proficient achievement
level when categorized according to their observed score. Similarly, the corresponding consistency value of
0.691 indicates that 69.1% of students with observed scores in Partially Proficient would be expected to score
in the Partially Proficient achievement level again if a second, parallel test form were used.
For some testing situations, the greatest concern may be decisions around level thresholds. For
example, if a college gave credit to students who achieved an Advanced Placement test score of 4 or 5, but
not to scores of 1, 2, or 3, one might be interested in the accuracy of the dichotomous decision below-4 versus
4-or-above. For 2007-08 NECAP Science, Appendix J provides accuracy and consistency estimates at each
cutpoint as well as false positive and false negative decision rates. (False positives are the proportion of
students whose observed scores were above the cut and true scores below the cut. False negatives are the
proportion of students whose observed scores were below the cut and true scores above the cut.)
The above indices are derived from Livingston & Lewis’ (1995) method of estimating the accuracy
and consistency of classifications. It should be noted that Livingston & Lewis discuss two versions of the
accuracy and consistency tables. A standard version performs calculations for forms parallel to the form
taken. An “adjusted” version adjusts the results of one form to match the observed score distribution obtained
in the data. The tables reported in Appendix J use the standard version for two reasons: 1) this “unadjusted”
version can be considered a smoothing of the data, thereby decreasing the variability of the results; and 2) for
results dealing with the consistency of two parallel forms, the unadjusted tables are symmetric, indicating that
the two parallel forms have the same statistical properties. This second reason is consistent with the notion of
forms that are parallel, i.e., it is more intuitive and interpretable for two parallel forms to have the same
statistical distribution as one another.
Descriptive statistics relating to the decision accuracy and consistency of the 2007-08 NECAP
Science tests can be derived from Appendix J. Overall accuracy ranged from 0.80 to 0.83; overall consistency
ranged from 0.72 to 0.76; the kappa statistic ranged from 0.54 to 0.63. Table 7-6 summarizes most of the
results of Appendix J at a glance. As with other types of reliability, it is inappropriate when analyzing the
decision accuracy and consistency of a given test to compare results between grades and content areas.
Table 7-6. 2007-08 NECAP Science: Summary of Decision Accuracy (and Consistency) Results
Conditional on Level At Cut Point Grade Overall SBP PP P PWD SBP:PP PP:P P:PWD
4 .80(.72) .77(.66) .76(.69) .84(.77) .78(.48) .94(.91) .88(.83) .98(.97) 8 .83(.76) .85(.79) .81(.76) .84(.74) .78(.48) .91(.88) .92(.89) .99(.99) 11 .83(.76) .86(.82) .81(.75) .81(.70) .81(.57) .91(.88) .93(.90) .99(.98)
SBP = Substantially Below Proficient; PP = Partially Proficient; P = Proficient; PWD = Proficient with Distinction
Chapter 8—Validity 59 2007-08 NECAP Science Technical Report
Chapter 8. VALIDITY Because interpretations of test scores, and not a test itself, are evaluated for validity, the purpose of
the 2007-08 NECAP Science Technical Report is to describe several technical aspects of the tests in support
of score interpretations (AERA, 1999). Each chapter contributes an important component in the investigation
of score validation: test development and design; test administration; scoring, scaling, and equating; item
analyses; reliability; and score reporting.
The NECAP Science tests are based on and aligned with the content standards and performance
indicators in the GLEs for science. Inferences about student achievement on the content standards are
intended from NECAP results, which in turn serve evaluation of school accountability and inform the
improvement of programs and instruction.
The Standards for Educational and Psychological Testing (1999) provides a framework for
describing sources of evidence that should be considered when evaluating validity. These sources include
evidence on the following five general areas: test content, response processes, internal structure,
consequences of testing, and relationship to other variables. Although each of these sources may speak to a
different aspect of validity, they are not distinct types of validity. Instead, each contributes to a body of
evidence about the comprehensive validity of score interpretations.
A measure of test content validity is to determine how well the test tasks represent the curriculum and
standards for each grade level. This is informed by the item development process, including how test
blueprints and test items align with the curriculum and standards. Validation through the content lens was
extensively described in Chapter 2. Item alignment with content standards; item bias; sensitivity and content
appropriateness review processes; adherence to the test blueprint; use of multiple item types; use of
standardized administration procedures, with accommodated options for participation; and appropriate test
administration training are all components of validity evidence based on test content.
All NECAP Science test questions were aligned by educators with specific content standards and
underwent several rounds of review for content fidelity and appropriateness. Items were presented to students
in multiple formats (MC, SA, and CR). Finally, tests were administered according to mandated standardized
procedures, with allowable accommodations, and all test coordinators and test administrators were required to
familiarize themselves with and adhere to all of the procedures outlined in the NECAP Test Coordinator and
Test Administrator manuals.
The scoring information in Chapter 4 described both the steps taken to train and monitor hand-scorers
and quality control procedures related to scanning and machine-scoring. Additional studies might be helpful
for evidence on student response processes. For example, think-aloud protocols could be used to investigate
students’ cognitive processes when confronting test items.
Evidence on internal structure was extensively detailed in discussions of scaling, item analyses, and
reliability in Chapters 5, 6, and 7. Technical characteristics of the internal structure of the tests were presented
Chapter 8—Validity 60 2007-08 NECAP Science Technical Report
in terms of classical item statistics (item difficulty and item-test correlation), DIF analyses, a variety of
reliability coefficients, SEM, multidimensionality hypothesis testing and effect size estimation, and IRT
parameters and procedures. In general, item difficulty indices were within acceptable and expected ranges;
very few items were answered correctly at near-chance or near-perfect rates. Similarly, the positive
discrimination indices indicated that students who performed well on individual items tended to perform well
overall.
Evidence on the consequences of testing was addressed in information on scaled score and reporting
in Chapters 5 and 9 and in the Guide to Using the 2008 NECAP Science Reports, which is a separate
document referenced in the discussion of reporting. Each of these spoke to efforts undertaken for providing
the public with accurate and clear test score information. Scaled scores simplify results reporting across
content areas, grade levels, and successive years. Achievement levels give reference points for mastery at
each grade level, another useful and simple way to interpret scores. Several different standard reports were
provided to stakeholders. Evidence on the consequences of testing could be supplemented with broader
research on the impact on student learning of NECAP testing.
8.1 Questionnaire Data
A measure of external validity was provided by comparing student performance with answers to a
questionnaire administered at the end of test. The number of questions to which students responded was 12,
16, and 19 respectively in grades 4, 8, and 11. Most of the questions were designed to gather information
about students and their study habits; however, a subset could be utilized in the test of external validity. Two
questions from each content area was most expected to correlate with student performance on NECAP tests.
To the extent that the answers to those questions did correlate with student performance in the anticipated
manner, the external validity of score interpretations was confirmed. The questions are now discussed one at a
time.
With minor variations by grade, Question #8 (grade 4)/#22 (grade 8)/#36 (grade 11) read as follows:
How often do you do science experiments or inquiry tasks in your class like the one that you did on this
science test?
A. one or more times each week
B. once/a few times a month
C. a few times a year
D. never or almost never
It might be anticipated that students who did such activities more often would have higher average
scaled scores and achievement level designations than students who did them less often. In particular, it might
be expected that on average, reading performance among students who chose “A” would meet or exceed
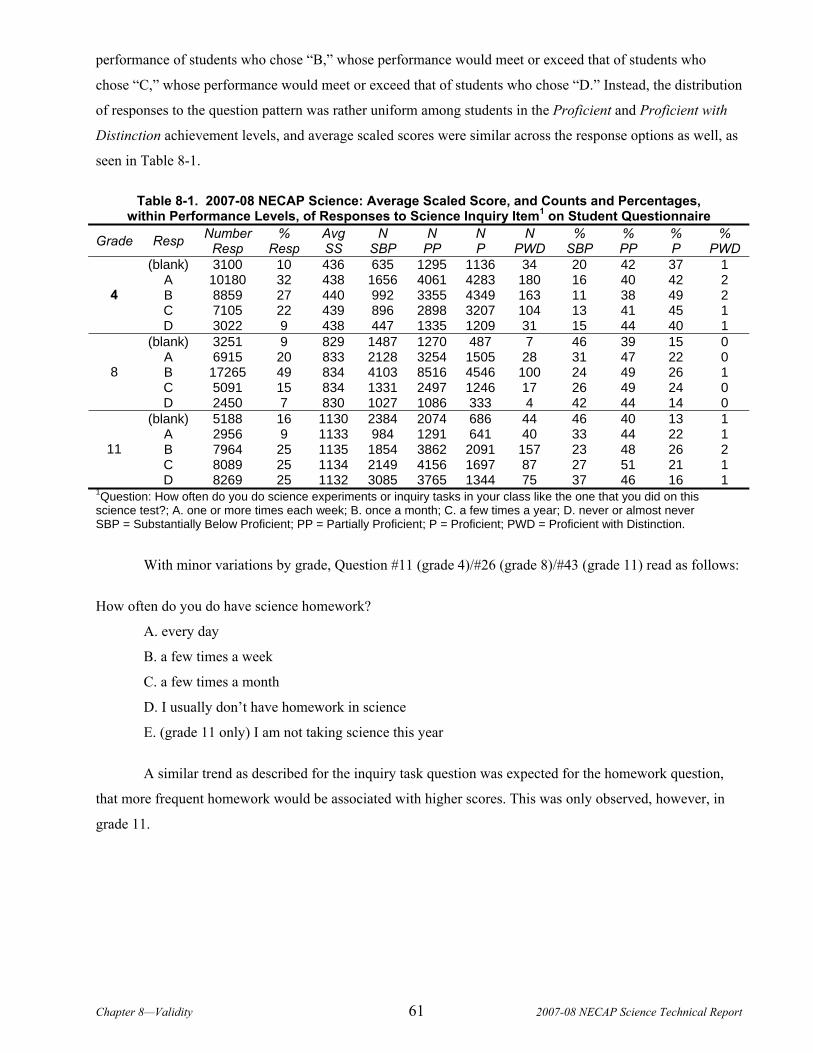
Chapter 8—Validity 61 2007-08 NECAP Science Technical Report
performance of students who chose “B,” whose performance would meet or exceed that of students who
chose “C,” whose performance would meet or exceed that of students who chose “D.” Instead, the distribution
of responses to the question pattern was rather uniform among students in the Proficient and Proficient with
Distinction achievement levels, and average scaled scores were similar across the response options as well, as
seen in Table 8-1.
Table 8-1. 2007-08 NECAP Science: Average Scaled Score, and Counts and Percentages, within Performance Levels, of Responses to Science Inquiry Item1 on Student Questionnaire
Grade Resp Number Resp
% Resp
Avg SS
N SBP
N PP
N P
N PWD
% SBP
% PP
% P
% PWD
(blank) 3100 10 436 635 1295 1136 34 20 42 37 1 A 10180 32 438 1656 4061 4283 180 16 40 42 2 B 8859 27 440 992 3355 4349 163 11 38 49 2 C 7105 22 439 896 2898 3207 104 13 41 45 1
4
D 3022 9 438 447 1335 1209 31 15 44 40 1 (blank) 3251 9 829 1487 1270 487 7 46 39 15 0
A 6915 20 833 2128 3254 1505 28 31 47 22 0 B 17265 49 834 4103 8516 4546 100 24 49 26 1 C 5091 15 834 1331 2497 1246 17 26 49 24 0
8
D 2450 7 830 1027 1086 333 4 42 44 14 0 (blank) 5188 16 1130 2384 2074 686 44 46 40 13 1
A 2956 9 1133 984 1291 641 40 33 44 22 1 B 7964 25 1135 1854 3862 2091 157 23 48 26 2 C 8089 25 1134 2149 4156 1697 87 27 51 21 1
11
D 8269 25 1132 3085 3765 1344 75 37 46 16 1 1Question: How often do you do science experiments or inquiry tasks in your class like the one that you did on this science test?; A. one or more times each week; B. once a month; C. a few times a year; D. never or almost never SBP = Substantially Below Proficient; PP = Partially Proficient; P = Proficient; PWD = Proficient with Distinction.
With minor variations by grade, Question #11 (grade 4)/#26 (grade 8)/#43 (grade 11) read as follows:
How often do you do have science homework?
A. every day
B. a few times a week
C. a few times a month
D. I usually don’t have homework in science
E. (grade 11 only) I am not taking science this year
A similar trend as described for the inquiry task question was expected for the homework question,
that more frequent homework would be associated with higher scores. This was only observed, however, in
grade 11.
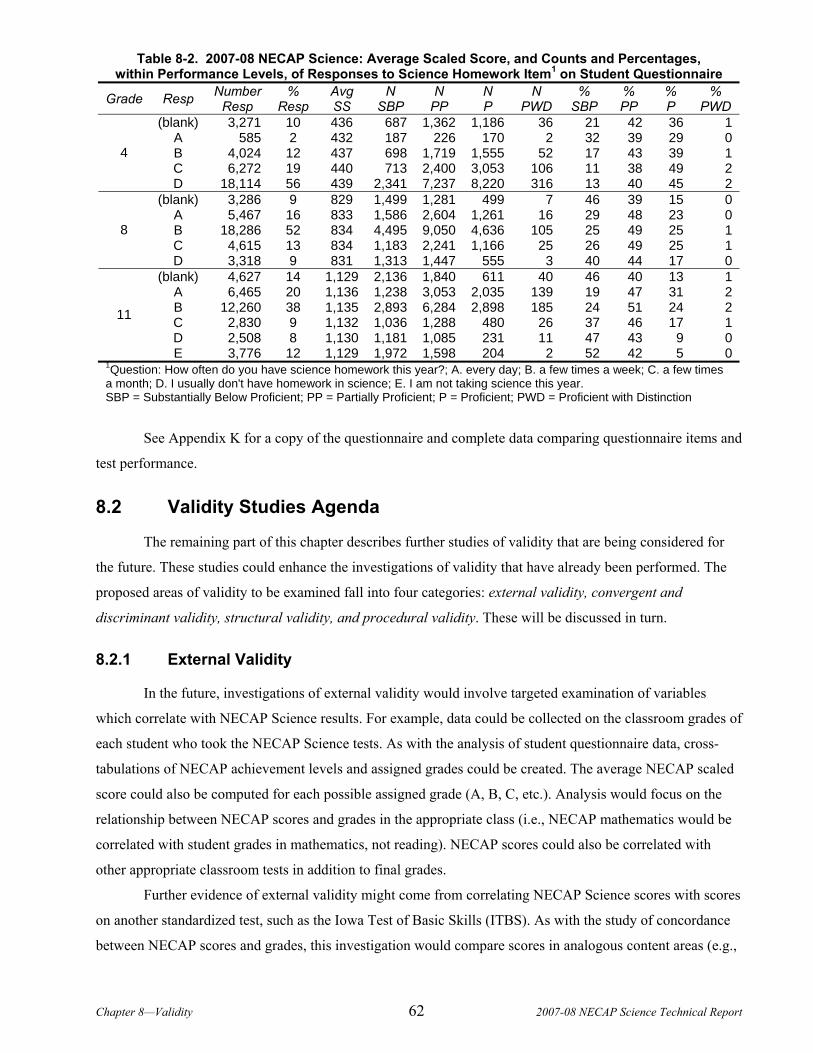
Chapter 8—Validity 62 2007-08 NECAP Science Technical Report
Table 8-2. 2007-08 NECAP Science: Average Scaled Score, and Counts and Percentages, within Performance Levels, of Responses to Science Homework Item1 on Student Questionnaire
Grade Resp Number Resp
% Resp
Avg SS
N SBP
N PP
N P
N PWD
% SBP
% PP
% P
% PWD
(blank) 3,271 10 436 687 1,362 1,186 36 21 42 36 1A 585 2 432 187 226 170 2 32 39 29 0B 4,024 12 437 698 1,719 1,555 52 17 43 39 1C 6,272 19 440 713 2,400 3,053 106 11 38 49 2
4
D 18,114 56 439 2,341 7,237 8,220 316 13 40 45 2(blank) 3,286 9 829 1,499 1,281 499 7 46 39 15 0
A 5,467 16 833 1,586 2,604 1,261 16 29 48 23 0B 18,286 52 834 4,495 9,050 4,636 105 25 49 25 1C 4,615 13 834 1,183 2,241 1,166 25 26 49 25 1
8
D 3,318 9 831 1,313 1,447 555 3 40 44 17 0(blank) 4,627 14 1,129 2,136 1,840 611 40 46 40 13 1
A 6,465 20 1,136 1,238 3,053 2,035 139 19 47 31 2B 12,260 38 1,135 2,893 6,284 2,898 185 24 51 24 2C 2,830 9 1,132 1,036 1,288 480 26 37 46 17 1D 2,508 8 1,130 1,181 1,085 231 11 47 43 9 0
11
E 3,776 12 1,129 1,972 1,598 204 2 52 42 5 01Question: How often do you have science homework this year?; A. every day; B. a few times a week; C. a few times a month; D. I usually don't have homework in science; E. I am not taking science this year. SBP = Substantially Below Proficient; PP = Partially Proficient; P = Proficient; PWD = Proficient with Distinction
See Appendix K for a copy of the questionnaire and complete data comparing questionnaire items and
test performance.
8.2 Validity Studies Agenda
The remaining part of this chapter describes further studies of validity that are being considered for
the future. These studies could enhance the investigations of validity that have already been performed. The
proposed areas of validity to be examined fall into four categories: external validity, convergent and
discriminant validity, structural validity, and procedural validity. These will be discussed in turn.
8.2.1 External Validity
In the future, investigations of external validity would involve targeted examination of variables
which correlate with NECAP Science results. For example, data could be collected on the classroom grades of
each student who took the NECAP Science tests. As with the analysis of student questionnaire data, cross-
tabulations of NECAP achievement levels and assigned grades could be created. The average NECAP scaled
score could also be computed for each possible assigned grade (A, B, C, etc.). Analysis would focus on the
relationship between NECAP scores and grades in the appropriate class (i.e., NECAP mathematics would be
correlated with student grades in mathematics, not reading). NECAP scores could also be correlated with
other appropriate classroom tests in addition to final grades.
Further evidence of external validity might come from correlating NECAP Science scores with scores
on another standardized test, such as the Iowa Test of Basic Skills (ITBS). As with the study of concordance
between NECAP scores and grades, this investigation would compare scores in analogous content areas (e.g.,

Chapter 8—Validity 63 2007-08 NECAP Science Technical Report
NECAP reading and ITBS reading comprehension). All tests taken by each student would be appropriate to
the student’s grade level.
8.2.2 Convergent and Discriminant Validity
The concepts of convergent and discriminant validity were defined by Campbell and Fiske (1959) as
specific types of validity that fall under the umbrella of construct validity. The notion of convergent validity
states that measures or variables that are intended to align with one another should actually be aligned in
practice. discriminant validity, on the other hand, is the idea that measures or variables that are intended to
differ from one another should not be too highly correlated. Evidence for validity comes from examining
whether the correlations among variables are as expected in direction and magnitude.
Campbell and Fiske (1959) introduced the study of different traits and methods as the means of
assessing convergent and discriminant validity. Traits refer to the constructs that are being measured (e.g.,
mathematical ability), and methods are the instruments of measuring them (e.g., a mathematics test or grade).
To utilize the framework of Campbell and Fiske, it is necessary that more than one trait and more than one
method be examined. Analysis is performed through the multi-trait/multi-method matrix, which gives all
possible correlations of the different combinations of traits and methods. Campbell and Fiske defined four
properties of the multi-trait/multi-method matrix that serve as evidence of convergent and discriminant
validity:
The correlation among different methods of measuring the same trait should be sufficiently
different from zero. For example, scores on a science test and grades in a science class should be
positively correlated.
The correlation among different methods of measuring the same trait should be higher than that
of different methods of measuring different traits. For example, scores on a science test and
grades in a science class should be more highly correlated than are scores on a science test and
grades in a reading class.
The correlation among different methods of measuring the same trait should be higher than the
same method of measuring different traits. For example, scores on a science test and grades in a
science class should be more highly correlated than scores on a science test and scores on an
analogous reading test.
The pattern of correlations should be similar across comparisons of different traits and methods.
For example, if the correlation between test scores in science and mathematics is higher than the
correlation between test scores in science and writing, it is expected that the correlation between
grades in science and mathematics would also be higher than the correlation between grades in
science and writing.
Chapter 8—Validity 64 2007-08 NECAP Science Technical Report
For NECAP Science, convergent and discriminant validity could be examined by constructing a
multi-trait/multi-method matrix and analyzing the four pieces of evidence described above. The traits
examined would be science versus mathematics, reading, and writing; different methods would include
respective NECAP scores and such variables as grades, teacher judgments, and/or scores on another
standardized test.
8.2.3 Structural Validity
Though the previous types of validity examine the concurrence between different measures of the
same content area, structural validity focuses on the relation between strands within a content area, thus
supporting content validity. Standardized tests are carefully designed to ensure that all appropriate strands of a
content area are adequately covered in test, and structural validity is the degree to which related elements of a
test are correlated in the intended manner. For instance, it is desired that performance on different strands of a
content area be positively correlated; however, as these strands are designed to measure distinct components
of the content area, it is reasonable to expect that each strand would contribute a unique component to the test.
Additionally, it is desired that the correlation between different item types (MC, SA, and CR) of the same
content area be positive.
As an example, an analysis of NECAP structural validity would investigate the correlation of
performance in Physical Science with that in Earth Space Science and in Life Science. Additionally, the
concordance between performance on MC items and OR items would be examined. Such a study would
address the consistency of NECAP science tests within each grade and content area. In particular, the
dimensionality analyses of Chapter 6 could be expanded to include confirmatory analyses addressing these
concerns.
8.2.4 Procedural Validity
As mentioned earlier, the NECAP Test Coordinator and Test Administrator manuals delineated the
procedures to which all NECAP Science test coordinators and test administrators were required to adhere. A
study of procedural validity would provide a comprehensive documentation of the procedures that were
followed throughout the NECAP administration. The results of the documentation would then be compared to
the manuals, and procedural validity would be confirmed to the extent that the two are in alignment. Evidence
of procedural validity is important because it verifies that the actual administration practices are in accord
with the intentions of the design.
Possible instances where discrepancies can exist between design and implementation include the
following: A teacher may spiral test forms incorrectly within a classroom; cheating may occur among
students; answer documents may be scanned incorrectly. These are examples of administration error. A study
of procedural validity involves capturing any administration errors and presenting them within a cohesive
document for review.

Chapter 8—Validity 65 2007-08 NECAP Science Technical Report
All potential tests of validity that have been introduced in this chapter will be discussed as candidates
for action by the NECAP Technical Advisory Committee (NECAP TAC) during 2008-09. With the advice of
the NECAP TAC, the states will develop a short-term (e.g., 1-year) and longer term (e.g., 2-year to 5-year)
plan for validity studies.

Chapter 9—Score Reporting 67 2007-08 NECAP Science Technical Report
SECTION III—2008-09 NECAP REPORTING Chapter 9. SCORE REPORTING
9.1 Teaching Year vs. Testing Year Reporting
The data used for the NECAP Science Reports are the results of the spring 2008 administration of the
NECAP Science test. NECAP science tests are based on the NECAP Science assessment targets, which cover
the grade spans of K–4, 5–8, and 9–11. For example, the Grade 8 NECAP science test is based on the grades
5–8 assessment targets. Because the assessment targets cover grade spans, the state Departments of Education
determined that assessing science in the spring—as opposed to the fall when mathematics, reading, and
writing are assessed—would allow students and schools adequate time to cover all assessment targets through
the curriculum and would also avoid a testing overload in the fall. Every student who participated in the
NECAP science test was represented in “testing year” reports, because the students took the test in the school
where they completed their learning of the assessment targets for their particular grade span.
9.2 Primary Reports
There were four primary reports for the 2007–08 NECAP science test:
Student Report
Item Analysis Report
School and District Results Report
School and District Summary Report
With the exception of the Student Report, all reports were available for schools and districts to view
or download on a password-secure website hosted by Measured Progress. Student-level data files were also
available for districts to download from the secure Web site. Each of these reports is described in the
following subsections. Sample reports are provided in Appendix L
9.3 Student Report
The NECAP Student Report is a single-page, two-sided report that is printed onto 8.5” by 11” paper.
The front side of the report includes informational text about the design and uses of the assessment. This side
of the report also contains text that describes the three corresponding sections of the reverse side of the
student report as well as the achievement level descriptions. The reverse side of the student report provides a
complete picture of an individual student’s performance on the NECAP science test, divided into three
sections. The first section provides the student’s overall performance for science. The student’s achievement
level is provided and scaled score is presented numerically as well as in a graphic that places the student’s
Chapter 9—Score Reporting 68 2007-08 NECAP Science Technical Report
scaled score, with its standard error of measurement bar constructed about it, within the full range of possible
scaled scores demarcated into the four achievement levels.
The second section of the report displays the student’s achievement level in science relative to the
percentage of students at each achievement level across the school, district, and state.
The third section of the report shows the student’s performance compared to school, district, and
statewide performances in each of four tested science domains: Physical Science, Earth Space Science, Life
Science, and Scientific Inquiry.
Student performances are reported in the context of possible points; average points earned for the
school, district, and state; and the average points earned by students who are minimally proficient on the test
(scaled score of 440, 840, or 1140). The average points earned is a reported as a range, because it is the
average of all students who are minimally proficient, plus or minus one standard deviation.
To provide a more complete picture of the inquiry task portion of the science test (session 3), each
student report includes a description of the inquiry task that was administered to all students at that grade. The
grade 4 inquiry task always contains a hands-on experiment; the grade 8 inquiry task sometimes contains a
hands-on experiment and sometimes contains a paper/pencil data analysis; and the grade 11 inquiry task
always contains a paper/pencil data analysis.
The NECAP Student Report is confidential and should be kept secure within the school and district.
The Family Educational Rights and Privacy Act (FERPA) requires that access to individual student results be
restricted to the student, the student’s parents/guardians, and authorized school personnel.
9.4 Item Analysis Reports
The NECAP Item Analysis Report provides a roster of all the students in each school and their
performances on the common items in the test that are released to the public. For all grades, the student names
and identification numbers are listed as row headers down the left side of the report. The items are listed as
column headers across the top in the order they appeared in the released item documents (not the position in
which they appeared on the test). For each item, seven pieces of information are shown: the released item
number, the science domain for the item, the assessment target code for the item, the Depth of Knowledge
code for the item, the item type, the correct response letter for MC items, and the total possible points for each
item. For each student, MC items are marked either with a plus sign (+), indicating that the student chose the
correct MC response, or a letter (from A to D), indicating the incorrect response chosen by the student. For
CR items, the number of points that the student attained is shown. All responses to released items are shown
in the report, regardless of the student’s participation status.
The columns on the right side of the report show Total Test Results broken into several categories.
The Domain Points Earned columns show points earned by the student relative to total points possible. The
Total Points Earned column is a summary of all points earned and total possible points on the science test.
The last two columns show the Scaled Score and Achievement Level for each student. For students who are
Chapter 9—Score Reporting 69 2007-08 NECAP Science Technical Report
reported as Not Tested, a code appears in the Achievement Level column to indicate the reason why the
student did not test. The descriptions of these codes can be found on the legend, after the last page of data on
the report. It is important to note that not all items used to compute student scores are included in this report.
Only those items that have been released are included. At the bottom of the report, the average percentage
correct for each MC item and average scores for the SA and CR items is shown across the school, district, and
state.
The NECAP Item Analysis Report is confidential and should be kept secure within the school and
district. The FERPA requires that access to individual student results be restricted to the student, the student’s
parents/guardians, and authorized school personnel.
9.5 School and District Results Reports
The NECAP School Results Report and the NECAP District Results Report consist of three parts: the
grade level summary report (page 2), the content area results (page 3), and the disaggregated content area
results (page 4).
The grade level summary report provides a summary of participation in the NECAP science test and a
summary of NECAP science results. The participation section on the top half of the page shows the number
and percentage of students who were enrolled on or after May 12, 2008. The total number of students enrolled
is defined as the number of students tested plus the number of students not tested.
Because students who were not tested did not participate, average school scores were not affected by
non-tested students. These students were included in the calculation of the percentage of students participating
but not in the calculation of scores. For students who participated in some but not all sessions of the NECAP
science test, overall raw and scaled scores were reported. These reporting decisions were made to support the
requirement that all students participate in the NECAP testing program.
Data are provided for the following groups of students who may not have completed the entire
NECAP science test:
1. Alternate Assessment: Students in this category completed an alternate assessment for the 2007-08 school year.
2. Withdrew After May 12: Students withdrawing from a school after May 12, 2008 may have taken some sessions of the NECAP science test prior to their withdrawal from the school.
3. Enrolled After May 12: Students enrolling in a school after May 12, 2008 may not have had adequate time to participate fully in all sessions of the NECAP science test.
4. Special Consideration: Schools received state approval for special consideration for an exemption on all or part of the NECAP science test for any student whose circumstances are not described by the previous categories but for whom the school determined that taking the NECAP science test would not be possible..
5. Other: Occasionally students will not have completed the NECAP science test for reasons other than those listed above. These “other” categories were considered not state approved

Chapter 9—Score Reporting 70 2007-08 NECAP Science Technical Report
The results section in the bottom half of the page shows the number and percentage of students
performing at each achievement level in science across the school, district, and state. In addition, a mean
scaled score is provided across school, district, and state levels. For the district version of this report, the
school information is blank.
The content area results page provides information on performance in the four tested science domains
(Physical Science, Earth Space Science, Life Science, and Scientific Inquiry). The purpose of this section is to
help schools to determine the extent to which their curricula are effective in helping students to achieve the
particular standards and benchmarks contained in the NECAP Science Assessment Targets. Information about
the content area for school, district, and state includes.
the total number of students enrolled, not tested (state-approved reason), not tested (other reason),
and tested;
the total number and percentage of students at each achievement level (based on the number in
the tested column); and
the mean scaled score.
Information about each science domain includes
The total possible points for that domain. In order to provide as much information as possible for
each domain, the total number of points includes both the common items used to calculate scores
and additional items in each category used for equating the test from year to year.
A graphic display of the percent of total possible points for the school, state, and district. In this
graphic display, there are symbols representing school, district, and state performance. In
addition, there is a line representing the standard error of measurement. This statistic indicates
how much a student’s score could vary if the student were examined repeatedly with the same test
(assuming that no learning were to occur between test administrations).
The disaggregated content area results pages present the relationship between performance and
student reporting variables (see list below) in science across school, district, and state levels. The report
shows the number of students categorized as enrolled, not tested (state-approved reason), not tested (other
reason), and tested. The report also provides the number and percentage of students within each of the four
achievement levels and the mean scaled score by each reporting category.
The list of student reporting categories is as follows:
All Students
Gender
Primary Race/Ethnicity
LEP Status (Limited English Proficiency)
Chapter 9—Score Reporting 71 2007-08 NECAP Science Technical Report
IEP
SES (socioeconomic status)
Migrant
Title I
504 Plan
The data for achievement levels and mean scaled score are based on the number shown in the tested
column. The data for the reporting categories were provided by information coded on the students’ answer
booklets by teachers and/or data linked to the student label. Because performance is being reported by
categories that can contain relatively low numbers of students, school personnel are advised, under FERPA
guidelines, to treat these pages confidentially.
It should be noted that for NH and VT, no data were reported for the 504 Plan. In addition, for VT, no
data were reported for Title I.
9.6 School and District Summary Reports
The NECAP District Summary Report provides details on student performance for all grade levels of
NECAP science tested in the district. The purpose of the district summary report is to help districts determine
the extent to which their schools and students achieve the particular standards and benchmarks contained in
the NECAP Science Assessment Targets. The district summary report includes no individual school data.
the total number of students enrolled, not tested (state-approved reason), not tested (other reason),
and tested
the total number and percentage of students at each achievement level (based on the number in
the tested column) and
the mean scaled score
9.7 Decision Rules
To ensure that reported results for the 2007–08 NECAP science test are accurate relative to collected
data and other pertinent information, a document that delineates analysis and reporting rules was created.
These decision rules were observed in the analyses of NECAP science test data and in reporting the test
results. Moreover, these rules are the main reference for quality assurance checks.
The decision rules document used for reporting results of the May 2008 administration of the NECAP
science test is found in Appendix M.
The first set of rules pertains to general issues in reporting scores. Each issue is described, and
pertinent variables are identified. The actual rules applied are described by the way they impact analyses and
Chapter 9—Score Reporting 72 2007-08 NECAP Science Technical Report
aggregations and their specific impact on each of the reports. The general rules are further grouped into issues
pertaining to test items, school type, student exclusions, and number of students for aggregations.
The second set of rules pertains to reporting student participation. These rules describe which students
were counted and reported for each subgroup in the student participation report.
9.8 Quality Assurance
Quality assurance measures are embedded throughout the entire process of analysis and reporting.
The data processor, data analyst, and psychometrician assigned to work on the NECAP implement quality
control checks of their respective computer programs and intermediate products. Moreover, when data are
handed off to different functions within the Research and Analysis division, the sending function verifies that
the data are accurate before handoff. Additionally, when a function receives a data set, the first step is to
verify the data for accuracy.
Another type of quality assurance measure is parallel processing. Students’ scaled scores for science
are assigned by a psychometrician through a process of equating and scaling. The scaled scores are also
computed by a data analyst to verify that scaled scores and corresponding achievement levels are assigned
accurately. Respective scaled scores and achievement levels assigned are compared across all students for
100% agreement. Different exclusions assigned to students that determine whether each student receives
scaled scores and/or is included in different levels of aggregation are also parallel-processed. Using the
decision rules document, two data analysts independently write a computer program that assigns students’
exclusions. For each grade, the exclusions assigned by each data analyst are compared across all students.
Only when 100% agreement is achieved can the rest of data analysis be completed.
The third aspect of quality control involves the procedures implemented by the quality assurance
group to check the veracity and accuracy of reported data. Using a sample of schools and districts, the quality
assurance group verifies that reported information is correct. The step is conducted in two parts: (1) verify
that the computed information was obtained correctly through appropriate application of different decision
rules and (2) verify that the correct data points populate each cell in the NECAP science reports. The selection
of sample schools and districts for this purpose is very specific and can affect the success of the quality
control efforts. There are two sets of samples selected that may not be mutually exclusive.
The first set includes those that satisfy the following criteria:
One-school district
Two-school district
Multi-school district
Chapter 9—Score Reporting 73 2007-08 NECAP Science Technical Report
The second set of samples includes districts or schools that have unique reporting situations as
indicated by decision rules. This set is necessary to check that each rule is applied correctly. The second set
includes the following criteria:
Private school
Small school that receives no school report
Small district that receives no district report
District that receives a report but all schools are too small to receive a school report
School with excluded (not tested) students
School with home-schooled students
The quality assurance group uses a checklist to implement its procedures. After the checklist is
completed, sample reports are circulated for psychometric checks and program management review. The
appropriate sample reports are then presented to the client for review and sign-off.

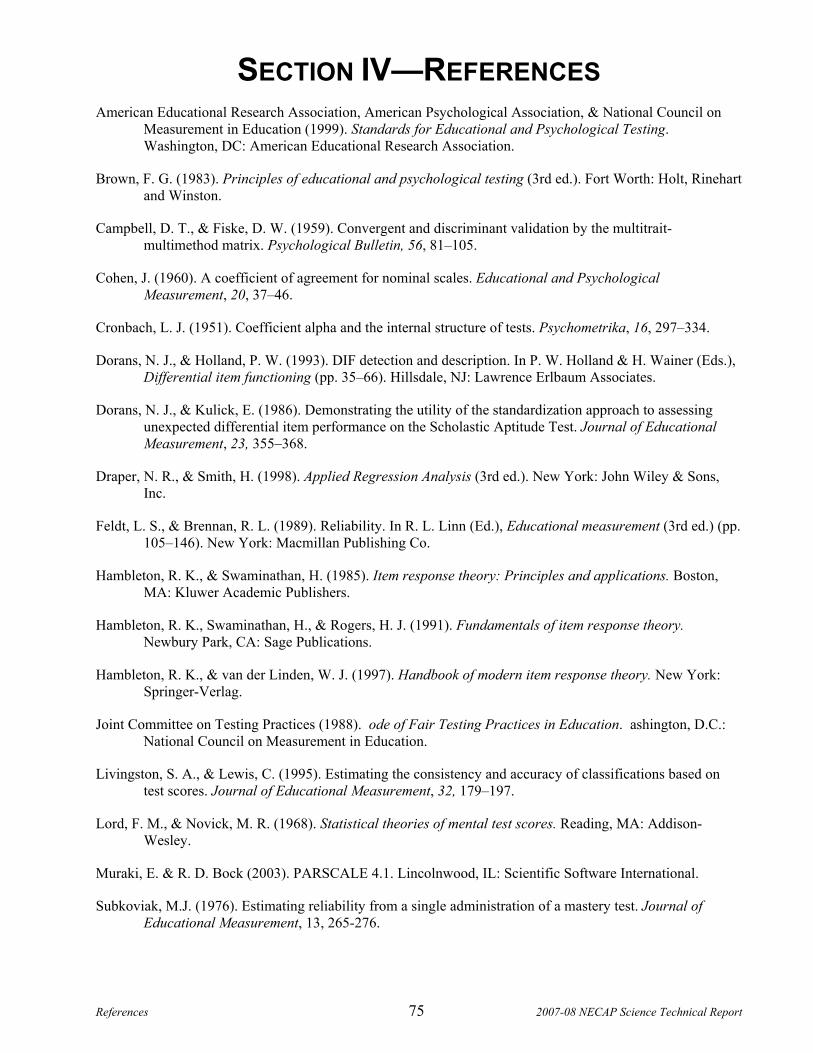
References 75 2007-08 NECAP Science Technical Report
SECTION IV—REFERENCES American Educational Research Association, American Psychological Association, & National Council on
Measurement in Education (1999). Standards for Educational and Psychological Testing. Washington, DC: American Educational Research Association.
Brown, F. G. (1983). Principles of educational and psychological testing (3rd ed.). Fort Worth: Holt, Rinehart and Winston.
Campbell, D. T., & Fiske, D. W. (1959). Convergent and discriminant validation by the multitrait-multimethod matrix. Psychological Bulletin, 56, 81–105.
Cohen, J. (1960). A coefficient of agreement for nominal scales. Educational and Psychological Measurement, 20, 37–46.
Cronbach, L. J. (1951). Coefficient alpha and the internal structure of tests. Psychometrika, 16, 297–334.
Dorans, N. J., & Holland, P. W. (1993). DIF detection and description. In P. W. Holland & H. Wainer (Eds.), Differential item functioning (pp. 35–66). Hillsdale, NJ: Lawrence Erlbaum Associates.
Dorans, N. J., & Kulick, E. (1986). Demonstrating the utility of the standardization approach to assessing unexpected differential item performance on the Scholastic Aptitude Test. Journal of Educational Measurement, 23, 355–368.
Draper, N. R., & Smith, H. (1998). Applied Regression Analysis (3rd ed.). New York: John Wiley & Sons, Inc.
Feldt, L. S., & Brennan, R. L. (1989). Reliability. In R. L. Linn (Ed.), Educational measurement (3rd ed.) (pp. 105–146). New York: Macmillan Publishing Co.
Hambleton, R. K., & Swaminathan, H. (1985). Item response theory: Principles and applications. Boston, MA: Kluwer Academic Publishers.
Hambleton, R. K., Swaminathan, H., & Rogers, H. J. (1991). Fundamentals of item response theory. Newbury Park, CA: Sage Publications.
Hambleton, R. K., & van der Linden, W. J. (1997). Handbook of modern item response theory. New York: Springer-Verlag.
Joint Committee on Testing Practices (1988). ode of Fair Testing Practices in Education. ashington, D.C.: National Council on Measurement in Education.
Livingston, S. A., & Lewis, C. (1995). Estimating the consistency and accuracy of classifications based on test scores. Journal of Educational Measurement, 32, 179–197.
Lord, F. M., & Novick, M. R. (1968). Statistical theories of mental test scores. Reading, MA: Addison-Wesley.
Muraki, E. & R. D. Bock (2003). PARSCALE 4.1. Lincolnwood, IL: Scientific Software International.
Subkoviak, M.J. (1976). Estimating reliability from a single administration of a mastery test. Journal of Educational Measurement, 13, 265-276.

References 76 2007-08 NECAP Science Technical Report
Stout, W. F. (1987). A nonparametric approach for assessing latent trait dimensionality. Psychometrika, 52, 589-617.
Stout, W. F., Froelich, A. G., & Gao, F. (2001). Using resampling methods to produce an improved DIMTEST procedure. In A. Boomsma, M. A. J. van Duign, & T. A. B. Snijders (Eds.), Essays on Item Response Theory, (pp. 357-375). New York: Springer-Verlag.
Zhang, J., & Stout, W. F. (1999). The theoretical DETECT index of dimensionality and its application to approximate simple structure. Psychometrika, 64, 213-249.

Appendices 77 2007–08 NECAP Science Technical Report
SECTION V—APPENDICES


![VIOLONCELLO · 2019. 12. 6. · Viola + Violoncello + Doublebass ☆8901 村雲 あや子 (1949-) インタースパーション (1988) [10'30"] [R-8901] MURAKUMO Ayako Interspersion](https://img.pdfslide.us/doc/110x75/60dca7873292620d7378f372/violoncello-2019-12-6-viola-violoncello-doublebass-a8901-e-.jpg)