Embed Size (px)
Citation preview

- i -
THESIS FOR THE DEGREE OF DOCTOR OF PHILOSOPHY
New Electrochemical Tools to Study Exocytosis
JOAKIM WIGSTRÖM
Department of Chemical and Biological Engineering
CHALMERS UNIVERSITY OF TECHNOLOGY
Gothenburg, Sweden 2015
- ii -
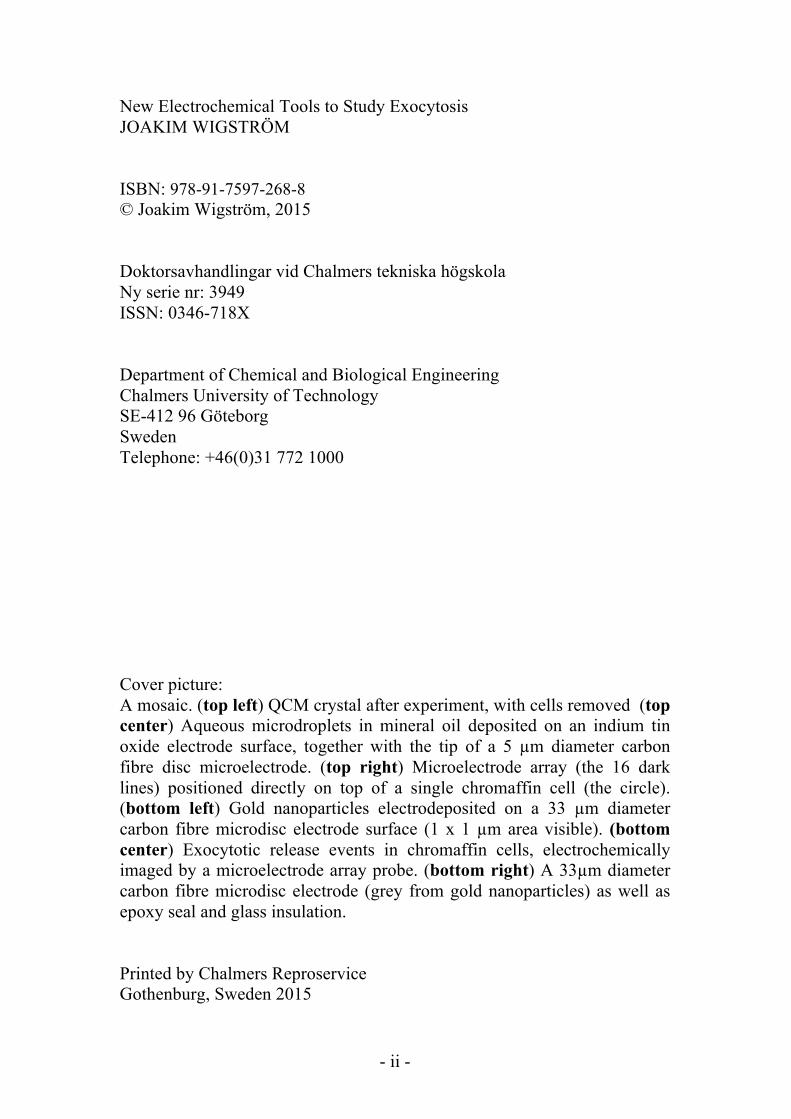
New Electrochemical Tools to Study Exocytosis JOAKIM WIGSTRÖM ISBN: 978-91-7597-268-8 © Joakim Wigström, 2015 Doktorsavhandlingar vid Chalmers tekniska högskola Ny serie nr: 3949 ISSN: 0346-718X Department of Chemical and Biological Engineering Chalmers University of Technology SE-412 96 Göteborg Sweden Telephone: +46(0)31 772 1000 Cover picture: A mosaic. (top left) QCM crystal after experiment, with cells removed (top center) Aqueous microdroplets in mineral oil deposited on an indium tin oxide electrode surface, together with the tip of a 5 µm diameter carbon fibre disc microelectrode. (top right) Microelectrode array (the 16 dark lines) positioned directly on top of a single chromaffin cell (the circle). (bottom left) Gold nanoparticles electrodeposited on a 33 µm diameter carbon fibre microdisc electrode surface (1 x 1 µm area visible). (bottom center) Exocytotic release events in chromaffin cells, electrochemically imaged by a microelectrode array probe. (bottom right) A 33µm diameter carbon fibre microdisc electrode (grey from gold nanoparticles) as well as epoxy seal and glass insulation. Printed by Chalmers Reproservice Gothenburg, Sweden 2015
- iii -
New Electrochemical Tools to Study Exocytosis
ABSTRACT The work described in this thesis has the focus on the development of new analytical tools to study processes related to cellular secretion (exocytosis) in cell models. Four novel techniques were developed, allowing new ways to study processes related to exocytosis, and gain previously unattainable knowledge. The methods were applied to single cells as well as to populations of cells in culture. In the first work A novel enzyme based biosensor, capable of detection of rapid fluctuations in acetylcholine concentration was developed. The work was motivated by limitations found in current electrochemical methods, for monitoring of single vesicle neurotransmitter release, which to date has been unable to detect electroinactive substances. Selective detection of the analyte was performed, based on sequential digestion by acetylcholine-esterase (AChE) and choline oxidase (CHO) enzymes together producing hydrogen peroxide in the presence of acetylcholine. The enzymes were immobilized on a nanostructured, high curvature, electrode surface, promoting retention of enzymatic activity, and the transduction of hydrogen peroxide concentration into amperometric current relied on electrochemical reduction, by the negatively polarized electrode. The sensor structure, catalytic function, and sensor temporal performance were characterized.
In the second work, a new method was developed, with the aim of being able to answer the question of the prevalence, of two fundamentally different modes of exocytosis: ‘full fusion’, where the whole content of neurotransmitter containing vesicles is ejected from cells, and ‘kiss and run’, which may result in a partial release. The method was based on amperometric quantification of the total neurotransmitter content of single isolated vesicles releasing their neurotransmitter content when, collapsing at a microelectrode surface, resulting in a current spike for each collapse. Comparison showed that only a smaller fraction of the total neurotransmitter content is released from each vesicle during stimulated secretion of chromaffin cells.
The goal of the third work was to develop an amperometric method which show the location of single vesicle release with both high temporal and spatial resolution, a combination which has previously been difficult to obtain. A novel microelectrode array (MEA) probe, lithographically microfabricated on the tip of a transparent glass substrate was developed. The MEA was capable of approaching single isolated chromaffin cells, there detecting exocytotic release in 16 different areas across the cell surface with high temporal resolution. Data from the probe was first used to estimate the thickness of the glycocalyx, separating the cell and the MEA probe. Secondly, exocytotic release from single vesicle release was ‘imaged’, in the areas in between the electrodes. The technique used was based on comparing the amperometric currents, passing through multiple detecting electrodes, with random-walk computer simulations. A resolution was obtained, sufficiently high for resolving hot-spots in activity, with distributions smaller than 120 nm. Finally, the question if quartz crystal microbalance (QCM-D) can detect structural changes, related to exocytosis was addressed. A new method where the QCM-D response and amperometric measurement were applied in parallel, monitoring

- iv -
neurotransmitter release and structural changes in a population of cultured PC12 cells stimulated by high K+. Perturbation of the secreted amounts using the drugs L-dopa and reserpine suggested that measurement by QCM-D reflects processes related to exocytosis, validating previous claims. Keywords: amperometry, microelectrode, enzyme biosensor, nanoparticles, acetylcholine, chromaffin cells, large dense core vesicles, electrochemical cytometry, microfabrication, micro electrode array, electrochemical imaging, QCM-D, exocytosis, endocytosis, PC-12 cells
- v -
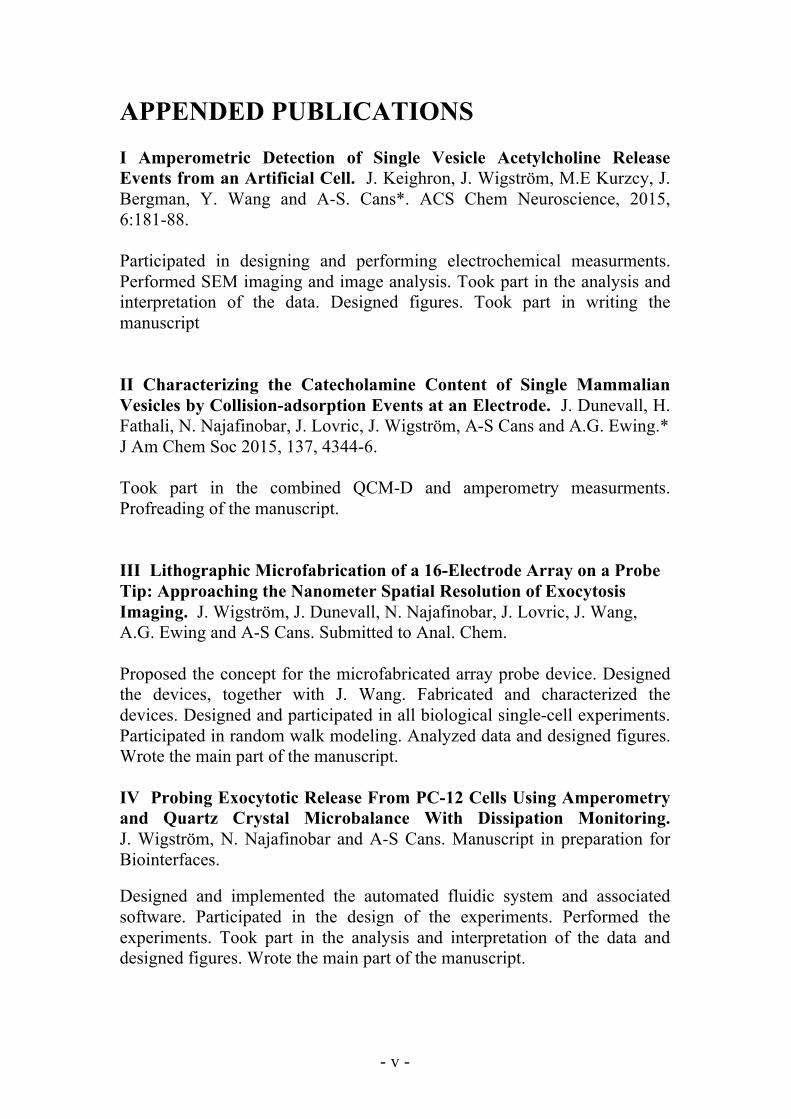
APPENDED PUBLICATIONS I Amperometric Detection of Single Vesicle Acetylcholine Release Events from an Artificial Cell. J. Keighron, J. Wigström, M.E Kurzcy, J. Bergman, Y. Wang and A-S. Cans*. ACS Chem Neuroscience, 2015, 6:181-88. Participated in designing and performing electrochemical measurments. Performed SEM imaging and image analysis. Took part in the analysis and interpretation of the data. Designed figures. Took part in writing the manuscript II Characterizing the Catecholamine Content of Single Mammalian Vesicles by Collision-adsorption Events at an Electrode. J. Dunevall, H. Fathali, N. Najafinobar, J. Lovric, J. Wigström, A-S Cans and A.G. Ewing.* J Am Chem Soc 2015, 137, 4344-6. Took part in the combined QCM-D and amperometry measurments. Profreading of the manuscript. III Lithographic Microfabrication of a 16-Electrode Array on a Probe Tip: Approaching the Nanometer Spatial Resolution of Exocytosis Imaging. J. Wigström, J. Dunevall, N. Najafinobar, J. Lovric, J. Wang, A.G. Ewing and A-S Cans. Submitted to Anal. Chem. Proposed the concept for the microfabricated array probe device. Designed the devices, together with J. Wang. Fabricated and characterized the devices. Designed and participated in all biological single-cell experiments. Participated in random walk modeling. Analyzed data and designed figures. Wrote the main part of the manuscript. IV Probing Exocytotic Release From PC-12 Cells Using Amperometry and Quartz Crystal Microbalance With Dissipation Monitoring. J. Wigström, N. Najafinobar and A-S Cans. Manuscript in preparation for Biointerfaces.
Designed and implemented the automated fluidic system and associated software. Participated in the design of the experiments. Performed the experiments. Took part in the analysis and interpretation of the data and designed figures. Wrote the main part of the manuscript.
- vi -
TABLE OF CONTENTS 1. INTRODUCTION ..................................................................................... 1 2. SECRETION OF NEUROTRANSMITTERS .......................................... 3
2.1 Regulated exocytosis and neural communication ................................ 3 2.2 Vesicle release and the vesicle cycle. .................................................. 3 2.3 Vesicles ................................................................................................ 5 2.4 Vesicle docking, priming and fusion ................................................... 7 2.5 Clathrin mediated compensatory endocytosis ..................................... 8 2.6 Bulk endocytosis .................................................................................. 9 2.7 Morphology of SSV secretion ............................................................. 9 2.8 Morphology of LDCV secretion ........................................................ 10 2.9 The cytoskeleton – not only a barrier ................................................ 10 2.10 The ‘full fusion’ versus ‘kiss and run’ debate ................................. 11
3. ELECTROCHEMICAL METHODS ...................................................... 13 3.1 Introduction to electrochemistry ........................................................ 13 3.2 The Nernst equation ........................................................................... 13 3.3 Voltammetric methods ....................................................................... 14
3.3.1 Voltammetric methods at big and small disc electrodes ............. 14 3.3.2 Potential step at a macroelectrode .............................................. 15 3.3.3 Potential step at a microelectrode ............................................... 16 3.3.4 Amperometry .............................................................................. 17 3.3.5 Cyclic voltammetry at a macro disc electrodes .......................... 17
3.4 Faraday’s law of electrolysis ............................................................. 18 3.5 Reference electrodes .......................................................................... 19
4. IN VIVO ELECTROCHEMISTRY ......................................................... 21 4.1 In vivo amperometry .......................................................................... 21 4.2 Interferents ......................................................................................... 22 4.3 Single cell amperometry .................................................................... 22 4.4 Microelectrode arrays for single cell experiments ............................. 23
5. ELECTROCHEMICAL BIOSENSORS ................................................. 25 5.1 Introduction to biosensors .................................................................. 25 5.2 Three generations of enzyme biosensors ........................................... 26
2.5.1 First generation ........................................................................... 26 2.5.2 Second generation ....................................................................... 27 2.5.3 Third generation .......................................................................... 28
5.3 Enzyme immobilization ..................................................................... 28 5.4 Real time in vivo monitoring of electroinactive substances .............. 30
6. QUARTS CRYSTAL MICROBALANCE MONITORING .................. 31 6.1 Introduction to QCM ......................................................................... 31 6.2 Energy dissipation and frequency shift in liquid media .................... 32 6.3 Frequency shift and shear wave decay in liquid media ..................... 34 6.4 Modeling of viscoelastic (soft) films ................................................. 35

- vii -
6.5 Biological applications ...................................................................... 36 7. OTHER METHODS ................................................................................ 39
7.1 Patch clamp ........................................................................................ 39 7.2 TEM ................................................................................................... 40 7.3 Fluorescence based optical methods .................................................. 40 7.4 Total internal reflection microscopy .................................................. 41 7.5 Combined optical and amperometric methods .................................. 41 7.6 In vivo microdialysis .......................................................................... 42
8. SUMMARY ............................................................................................. 43 9. CONCLUSIONS AND FUTURE OUTLOOK ....................................... 47 10. ACKNOWLEDGEMENTS ................................................................... 51 11. REFERENCES ...................................................................................... 53


New Electrochemical Tools to Study Exocytosis
- 1 -
1. INTRODUCTION It has been said that the human brain is the most complex structure in the entire universe. Until we discover other intelligent life in outer space, or perhaps dolphins smarter than us, we have to assume that it is true. How the cerebral mechanisms generate our cognitive capabilities, permitting us to experience consciousness, to have creativity, or to feel is a big mystery, where a lot is known but much more is not. The circuitry of the human cerebral functions is built from around 100 billion nerve cells1, functioning as computational devices, receiving, storing and transmitting information. These cells communicate, connecting via around 0.1-1 million billion synapses which transmit the nerve signals. To organize and bring function to the multitude of neural pathways, the brain uses a multitude of different kinds of neurotransmitters. The exact number is not known, but is believed to be well over one hundred. It is similarly not clear how many different neuron types there are. Apart from the pure joy of knowing, increasing our knowledge on how the brain works has great importance. For instance, mental conditions or neurodegenerative disorders account for great suffering, but also pose increasing problems for the aging population. The common approach in science is the reductionist method, breaking down problems in simpler parts, analyzed separately. In the case of the nervous system, Nature has provided a number of less complex model organisms, which are more accessible for studies and have been studied extensively, for instance our cousins apes and rats, but also snails and insects, revealing highly conserved mechanisms between species. One key process is neurotransmitter secretion at the synaptic junctions, serving to propagate a nerve signal from one neuron to the next. This secretion is based on exocytosis, a process where intracellular spheres called vesicles, loaded with neurotransmitter, fuse with the outer cell membrane. Studies have revealed similar preserved mechanisms for different animals and various cell types. In studies of the fundamental mechanisms of exocytosis, cell models are often used. In this thesis two cell types have been studied, adrenal chromaffin cells, which are found in the adrenal gland and secrete the catecholamines adrenaline and noradrenaline2, and additionally PC12 cells, an immortalized cell line secreting the neurotransmitter dopamine3. Both cell types are excitable and as such have a lot in common with secreting nerve cells. The aim of this thesis has been to develop techniques to open up new ways to study mechanisms related to exocytosis, in such model cells. Paper I-III deals with three different aspects of secretion, at the level of single vesicles and single cells, while Paper IV has the perspective of transmitter release from populations of cultured cells.
Joakim Wigström (2015)
- 2 -
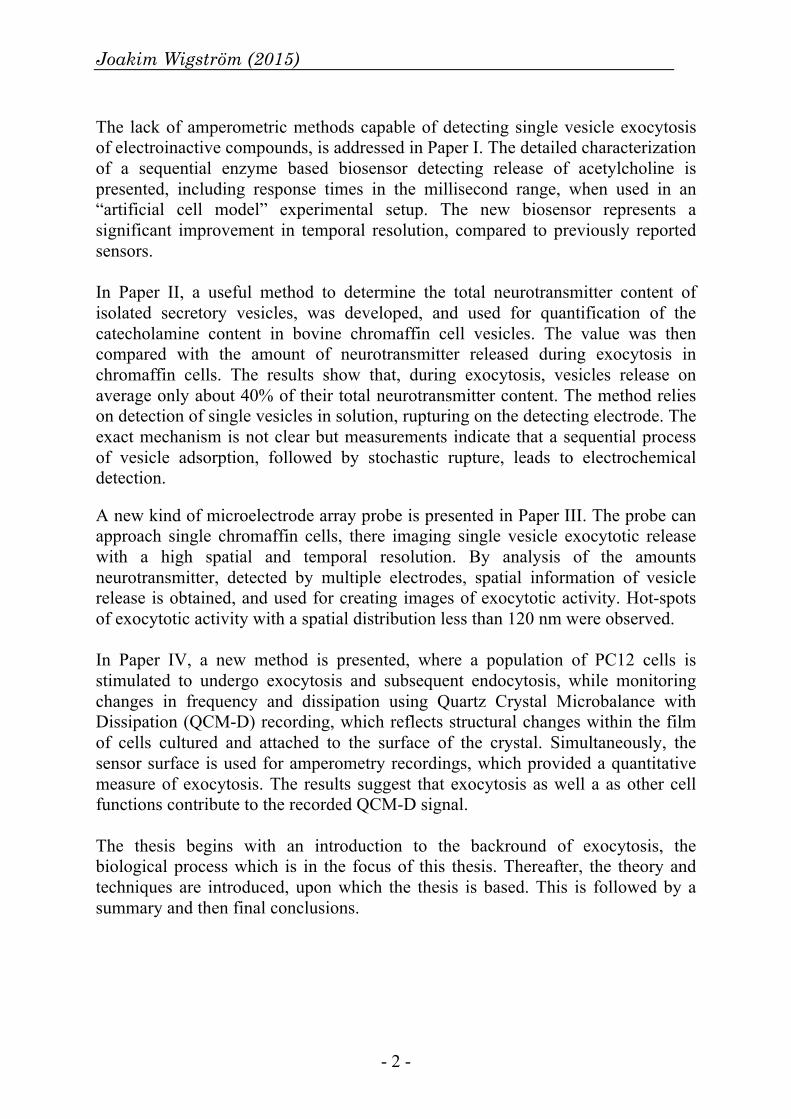
The lack of amperometric methods capable of detecting single vesicle exocytosis of electroinactive compounds, is addressed in Paper I. The detailed characterization of a sequential enzyme based biosensor detecting release of acetylcholine is presented, including response times in the millisecond range, when used in an “artificial cell model” experimental setup. The new biosensor represents a significant improvement in temporal resolution, compared to previously reported sensors. In Paper II, a useful method to determine the total neurotransmitter content of isolated secretory vesicles, was developed, and used for quantification of the catecholamine content in bovine chromaffin cell vesicles. The value was then compared with the amount of neurotransmitter released during exocytosis in chromaffin cells. The results show that, during exocytosis, vesicles release on average only about 40% of their total neurotransmitter content. The method relies on detection of single vesicles in solution, rupturing on the detecting electrode. The exact mechanism is not clear but measurements indicate that a sequential process of vesicle adsorption, followed by stochastic rupture, leads to electrochemical detection. A new kind of microelectrode array probe is presented in Paper III. The probe can approach single chromaffin cells, there imaging single vesicle exocytotic release with a high spatial and temporal resolution. By analysis of the amounts neurotransmitter, detected by multiple electrodes, spatial information of vesicle release is obtained, and used for creating images of exocytotic activity. Hot-spots of exocytotic activity with a spatial distribution less than 120 nm were observed. In Paper IV, a new method is presented, where a population of PC12 cells is stimulated to undergo exocytosis and subsequent endocytosis, while monitoring changes in frequency and dissipation using Quartz Crystal Microbalance with Dissipation (QCM-D) recording, which reflects structural changes within the film of cells cultured and attached to the surface of the crystal. Simultaneously, the sensor surface is used for amperometry recordings, which provided a quantitative measure of exocytosis. The results suggest that exocytosis as well a as other cell functions contribute to the recorded QCM-D signal. The thesis begins with an introduction to the backround of exocytosis, the biological process which is in the focus of this thesis. Thereafter, the theory and techniques are introduced, upon which the thesis is based. This is followed by a summary and then final conclusions.

New Electrochemical Tools to Study Exocytosis
- 3 -
2. SECRETION OF NEUROTRANSMITTERS Exocytosis is the fundamental process where intracellular organelles (vesicles) fuse with the membrane of a cell and thereby release their content to the extracellular space. The process of exocytosis can be constitutive (ongoing) or regulated, i.e. evoked by a trigger signal. Constitutive exocytosis serves purposes such as controlling the cell membrane area during cell differentiation and growth, trafficking of proteins, and creation of cellular organelles. In regulated exocytosis, vesicles fuse with the cell membrane in response to a calcium mediated external signal, allowing for short-term regulation of neurotransmitter.
2.1 Regulated exocytosis and neural communication Regulated exocytosis is tightly controlled in neuronal communication at the synaptic junctions to relay electrical nerve signals from one neuron to the next. Nerve cells and endocrine cells are ‘electrically excitable’. In the resting state of excitable cells, the electric intracellular potential has a negative value (~-70mV), which is being maintained by ATP driven ion pumps in combination with ion channels (mainly K+ selective channels).4 If the intracellular potential, reaches above a certain threshold, a chain of events is initiated as ion channels sensitive to voltage are activated, causing a sequential, transient flux of Na+ and K+ ions across the membrane. This results in an electrochemical pulse called the ‘action potential’. The rise in voltage affects neighboring ion channels, which helps to propagate the action potential along the membrane. In the nervous system, signals are transmitted along neuronal projections as action potentials, eventually reaching synaptic terminals, where exocytotic release may be triggered, mediated by Ca2+.4 Another important biological function of regulated exocytosis is the secretion of proteins and hormones by endocrine cells, such as insulin producing beta-cells and adrenaline/noradrenaline producing chromaffin cells.4,5 Although lacking the projections common to neurons, these cells are also ‘electrically excitable’ and display action potentials as a mechanism for inducing secretion.
2.2 Vesicle release and the vesicle cycle. Common for regulated exocytosis in the nervous system is that the secreted substances are stored in vesicles inside the cells, which can be described as mini-organelles that are specialized in storing and releasing messenger molecules. The vesicles have an outer phospholipid bilayer, similar to the plasma membrane surrounding the cell, that is populated with membrane proteins for essential functions such as vesicle loading as well as for trafficking and eventual delivery of the messenger.6

Joakim Wigström (2015)
- 4 -
The vesicles can be subdivided into two main classes - small synaptic vesicles (SSVs) and dense core vesicles (DCVs),7 also termed dense core granules. From the perspective of a vesicle, participating in regulated exocytosis is a cyclic process.8,9 Figure 1 illustrates the key events thought to occur during this cycle. After its initial creation, the vesicle is transported to the cell membrane where it (1) undergoes docking (a.k.a tethering). In the next step it (2) becomes primed, left in a state of competence, where it may react to a trigger signal in the form of a spike in internal Ca2+ concentration. After exposure to the trigger signal (3) exocytosis begins by first forming a fusion pore through the membrane. After pore formation, the cycle is believed to follow one of two different paths. One is that the transmitters (messengers) are delivered through the pore, which then closes. The vesicle may (4) remain near the cell membrane, later repeating the process of pore formation (‘kiss and stay’ exocytosis) or it (5) leaves for recycling (‘kiss and run’ exocytosis). An alternative path is that (6) the vesicle fuses with the cell membrane completely (‘full fusion’), later to be recovered by (7) compensatory endocytosis serving to recapture vesicles in a clathrin mediated process. The two alternative paths have been debated for a long time and there is support for both mechanisms. The clathrin mediated endocytosis is also believed to occur from (8) invaginations in the cell membrane and from (9) large endocytic vesicles and endosomes.

New Electrochemical Tools to Study Exocytosis
- 5 -
Figure 1 Illustration of synaptic vesicles participating in exocytosis and subsequent recycling (1) Docking at the active zone (2) Priming (3) Pore formation, initiating release (4) Pore closure where the vesicle remain near the cell membrane (‘kiss and stay’) (5) Pore closure where vesicle leave for recycling (6) Collapse of the vesicle fully fusing with the cell membrane (‘full fusion’) Clathrin mediated endocytosis from (7) the edge of the active zone, (8) from invagination or (9) from endosome.
2.3 Vesicles In neurons, most neurotransmitters are stored in SSVs with diameters in the range of 40-50 nm, which are mostly found in clusters at the presynaptic sites. SSVs contain classical low molecule weight neurotransmitters such as acetylcholine, monoamines (dopamine, epinephrine, norepinephrine, histamine, and serotonin), gamma-aminobutyric acid (GABA), glutamate and purines (such as ATP). The effect of these neurotransmitters is very heterogeneous, often serving several

Joakim Wigström (2015)
- 6 -
different functions in the nervous system and throughout the mammalian body, by modulation, suppression or activation of ion channels or in other ways. The DCVs are named after the electron dense core which can be seen in electron micrographs and is mainly composed of a densely packed matrix of chromogranins, a class of acidic proteins.10 The DCVs can be subdivided into smaller SDCVs and larger LDCVs, both of which are found in all parts of the neuron, including the soma (cell body), dendrites, varicosities (axonal boutons) and nerve endings. The SDCVs have diameters in the 100 nm range whereas LDCVs of endocrine and neuroendocrine cells are bigger, with diameters in the order of 200-300 nm.10,11 The content of DCVs can include small molecule neurotransmitters. In addition, LDCVs release higher molecular weight substances such as insulin-related peptides, and other peptides such as neuropeptide Y (NPY), galanin, etc. Neuropeptides have regulatory functions, as example for mood, anxiety and social interactions.12 Secretory cells such as in the endocrine and exocrine glands, including the pancreatic beta-cells, contain LDCVs that are in most respects functionally and structurally similar to their neural counterparts.10 As the name implies, these vesicles are bigger, with diameters in the order of 200-300 nm for chromaffin cells and PC12 cells (a pheochromocytoma-tumor cell line), and up to 700 nm for mast cells. Many of these secretory cells also contain a class of vesicles, called synaptic-like microvesicles (SLMVs), which resemble neural synaptic vesicles in size as well as in lipid and protein composition.13–16 For instance, PC12 are mixed monoaminergic/cholinergic cells that release the monoamines dopamine, from LDCVs,3 and acetylcholine, from SLMVs.14 In beta-cells the SLMVs are known to store and release at least the two inhibitory neurotransmitters glycine and GABA15. After initial formation in the trans-Golgi network in the neuron soma, SSVs are trafficked to nerve end terminals first along axonal microtubules, towed by the ATP driven molecular motors kinesin and dynein, and finally at end terminals by myosin.17Similarly, secretion from LDCVs in endocrine cells rely on active transport of newly formed vesicles along microtubule fibers. The classical low molecule weight neurotransmitters are mainly synthesized locally, and packaged into SSV and DCV vesicles by one of the five types of transmembrane transporters contained in the vesicle membrane: Acetylcholine transporter (VAChT), Monoamine transporter (VMAT), GABA and glycine (inhibitory amino acid) transporter (VIAAT), Glutamate transporter (VGLUT) and ATP (nucleotide) transporter (VNUT).5 These are all antiport transporters, which in the presence of a proton gradient, pump neurotransmitters into vesicles, in exchange for protons being pumped in the other direction. The necessary proton gradient across the vesicle membrane is upheld by an ATP driven proton pump (ATPase), resulting in an internal pH of ~5.5 compared to the intracellular pH of 7.4 surrounding the vesicle.
New Electrochemical Tools to Study Exocytosis
- 7 -
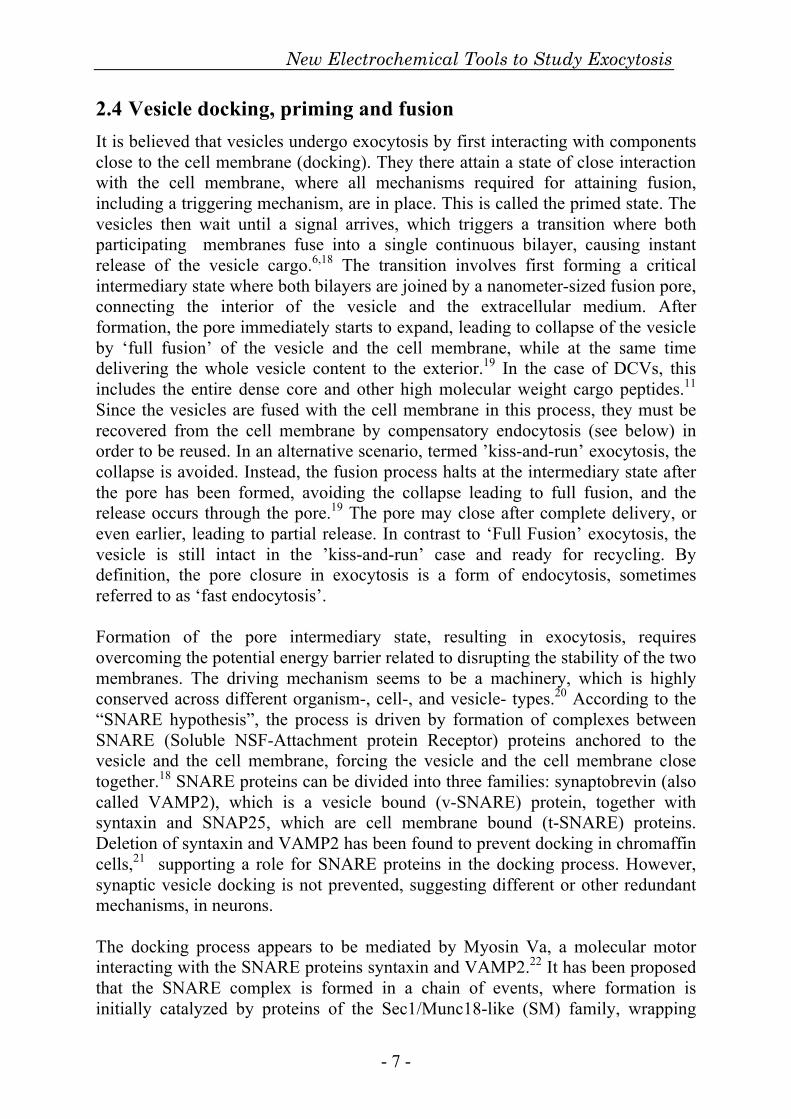
2.4 Vesicle docking, priming and fusion It is believed that vesicles undergo exocytosis by first interacting with components close to the cell membrane (docking). They there attain a state of close interaction with the cell membrane, where all mechanisms required for attaining fusion, including a triggering mechanism, are in place. This is called the primed state. The vesicles then wait until a signal arrives, which triggers a transition where both participating membranes fuse into a single continuous bilayer, causing instant release of the vesicle cargo.6,18 The transition involves first forming a critical intermediary state where both bilayers are joined by a nanometer-sized fusion pore, connecting the interior of the vesicle and the extracellular medium. After formation, the pore immediately starts to expand, leading to collapse of the vesicle by ‘full fusion’ of the vesicle and the cell membrane, while at the same time delivering the whole vesicle content to the exterior.19 In the case of DCVs, this includes the entire dense core and other high molecular weight cargo peptides.11 Since the vesicles are fused with the cell membrane in this process, they must be recovered from the cell membrane by compensatory endocytosis (see below) in order to be reused. In an alternative scenario, termed ’kiss-and-run’ exocytosis, the collapse is avoided. Instead, the fusion process halts at the intermediary state after the pore has been formed, avoiding the collapse leading to full fusion, and the release occurs through the pore.19 The pore may close after complete delivery, or even earlier, leading to partial release. In contrast to ‘Full Fusion’ exocytosis, the vesicle is still intact in the ’kiss-and-run’ case and ready for recycling. By definition, the pore closure in exocytosis is a form of endocytosis, sometimes referred to as ‘fast endocytosis’. Formation of the pore intermediary state, resulting in exocytosis, requires overcoming the potential energy barrier related to disrupting the stability of the two membranes. The driving mechanism seems to be a machinery, which is highly conserved across different organism-, cell-, and vesicle- types.20 According to the “SNARE hypothesis”, the process is driven by formation of complexes between SNARE (Soluble NSF-Attachment protein Receptor) proteins anchored to the vesicle and the cell membrane, forcing the vesicle and the cell membrane close together.18 SNARE proteins can be divided into three families: synaptobrevin (also called VAMP2), which is a vesicle bound (v-SNARE) protein, together with syntaxin and SNAP25, which are cell membrane bound (t-SNARE) proteins. Deletion of syntaxin and VAMP2 has been found to prevent docking in chromaffin cells,21 supporting a role for SNARE proteins in the docking process. However, synaptic vesicle docking is not prevented, suggesting different or other redundant mechanisms, in neurons. The docking process appears to be mediated by Myosin Va, a molecular motor interacting with the SNARE proteins syntaxin and VAMP2.22 It has been proposed that the SNARE complex is formed in a chain of events, where formation is initially catalyzed by proteins of the Sec1/Munc18-like (SM) family, wrapping

Joakim Wigström (2015)
- 8 -
around the SNARE complex. Evidence from several cell types indicate that the formation is GTP driven, controlled by GTPases belonging to the Rab family of enzymes.22 The SM protein is then displaced by Munc13 and CAPS, which facilitate the binding of complexin to the SNARE complex, there acting as a ‘brake’, preventing fusion until the right moment. There is evidence suggesting that synaptotagmin, a vesicle anchored protein, triggers the final step of fusion in response to a Ca2+ signal. This occurs by synaptotagmin interacting with the cell membrane, displacing the complexin and allowing the SNARE to pull the vesicle and cell membrane closer together, thereby inducing fusion. 18 The roles of complexin and synaptotagmin have been implied in several secretory tissues, suggesting a universal mechanism.23 Regulation of docking and priming act on longer timescales than the immediate release in response to an action potential. These slower, regulatory processes seem to be mediated by phosphorylation of the involved SNAP-25, Munc18, and other proteins, by enzymes including protein kinase C (PKC).23,24After the exocytosis fusion event, the SNARE complexes, which represent very stable structures, are still present. The disassembly of the SNARE is driven by ATP, mediated by the ATPase NSF (N-ethylmaleimide sensitive factor).18
2.5 Clathrin mediated compensatory endocytosis In regulated exocytosis, retrieval of the fused membrane by compensatory endocytosis is a crucial process in vesicle recycling, whereby a sufficient pool of vesicles is maintained for renewed release. Clathrin mediated endocytosis has been identified as a pathway for recovery of vesicles fused with the cellular plasma membrane in regulated exocytosis, involving both SSV and LDCV vesicles in several cell types.24,25 In neurons, clathrin mediated endocytosis has been observed in the area surrounding the synaptic zones at nerve terminals.24 On electron microscopy images, pits form on the cell surface, which are covered with an electron dense coating identified as clathrin proteins.25 Initiation of the coating requires assembly of adaptin (also known as adaptor protein complex-2 or AP-2), and clathrin, by interaction with vesicle transmembrane proteins such as synaptotagmin and synaptobrevin.26 Continued growth of the clathrin coating, by addition of subunits, induces curvature to the cell membrane, forming a pit. After successive invagination of the pit and the formation of a throat structure, scission from the cell membrane takes place, forming a clathrin coated vesicle, which leaves for the cell interior, and subsequent uncoating. It is widely accepted that the vesicle scission is mediated by the GTPase dynamin, which wraps around the throat by forming oligomeric ring structures24,25,27 Here, hydrolysis of GTP, coupled to dynamin, acts as a mechanochemical enzyme, constricting the throat, resulting in scission. The role of dynamin has been probed by a membrane permeable GTPase inhibiting drug, dynasoar.26 EM images showed arrested

New Electrochemical Tools to Study Exocytosis
- 9 -
invaginations of two types, thought to represent intermediary steps: an O-shaped invagination with a throat formed and a U-shaped, less developed one. This result suggests that dynamin is also involved early in the process, driving the throat formation in the steps prior to scission, although the mechanism for this is not clear. In fact, dynamin seems to be a versatile protein, also involved in other roles, such as regulating actin polymerization in the cell.28 Clathrin mediated endocytosis of synaptic vesicles is believed to occur with a time constant in the order of tens of seconds29.
2.6 Bulk endocytosis Recent reports, combining fast freeze fixation techniques and EM, have shown alternate paths to vesicle recovery, revealing ‘ultrafast’ endocytosis of large vesicles lacking any clathrin coats.30 The vesicles were shown to form within 50 ms after stimulation at the roundworm caenorhabditis elegans31 as well as mouse synapses,32 with clathrin mediated endocytosis occurring at a later stage from these uncoated vesicles. There is also evidence for this mode of endocytosis in ribbon-type synapses of sensory systems and at the neuromuscular junction (NMJ).33,34 This bulk mode form of endocytosis is compensatory, i.e. triggered by the addition of membrane during full fusion exocytosis. However, it allows a much faster rate of membrane recovery compared to clathrin mediated endocytosis. It has been observed in particular after strong stimulation, leading to excessive secretion, but also under physiological conditions.33 Subsequently, vesicles are formed from the large endocytic vesicles to enter the vesicle reserve or recycling pool, mediated by clathrin and dynamin.
2.7 Morphology of SSV secretion SSVs participating in synaptic secretion are found in active zones, characterized by densely packed clusters of vesicles. A prominent example is the calyx of Held, a large nerve terminal in the auditory system, which contains several hundreds of these active zones.35 Other, less powerful synapses contain fewer zones, in some cases as little as one active zone per synapse. The active zones contain a varying number of SSVs, depending on brain region and synapse type, ranging from relatively few to over one hundred.4,5 The organization of the active zones allows efficient vesicle recycling and fast secretion, aimed at postsynaptic receptors located exactly opposite across the synaptic cleft.36,37,38 In the active zone, voltage gated calcium channels and secretory mechanisms are co-localized resulting in a fast response (<1 ms), which only requires local elevation in Ca2+ concentration as a final trigger. Observations from several types of synapses have shown compensatory endocytosis occurring at the periphery of the active zones.25 The SSVs of the active zones belong to one of three functional pools depending on their ability to undergo fusion. In general only a small fraction of the vesicles are

Joakim Wigström (2015)
- 10 -
docked (typically 1-2%).9 Docked vesicles, most of which are primed, represent the readily releasable pool (RRP),39,40 and it is from these vesicles that secretion occurs. When vesicles in the RRP are consumed by exocytosis during repeated secretion, this pool is believed to be sustained by transfer of vesicles from the recycling pool, which represents ~10% of the vesicles. The rest of the vesicles belong to the reserve pool (a.k.a. resting pool). There has been a consensus that these vesicles, are dormant, and do not participate in secretion under normal physiological conditions. However, some recent results from the rat calyx of Held suggest that most of the vesicles participate in recycling.41
2.8 Morphology of LDCV secretion In contrast to SSVs, DCVs in neurons and LDCVs in endocrine cells are not organized into active zones. This likely reflects the lack of a need for fast response and a spatially confined delivery. On the other hand, other types of exocytotic organization are observed in endocrine cells. Chromaffin and PC12 cells, for instance, are polarized, with active areas of stimulated exocytotic release covering significant parts of the cell and with quiet areas without exocytotic activity, as observed using amperometry.42–44 This is mirrored by findings of areas both rich in, and devoid of, subplasmalemmal vesicles.45 Hotspots of clustered exocytotic activity in chromaffin cells46 and INS-1 cells47 (an immortalized insulin-secreting pancreatic beta cell derivative) have also been observed by TIRF microscopy. Furthermore, co-localization of calcium channels to membrane areas, where exocytotic release occurs, has been observed in beta cells by combined Ca2+ and Zn2+ imaging.48 In chromaffin and PC12 cells, two pools of LDCVs have been observed. About 10% of the vesicle population are docked vesicles which belong to the RRP while the undocked vesicles correspond to a reserve pool.2,49 In β-cells, the docked vesicles of the RRP pool accounts for less than 1% of all DCVs.50
2.9 The cytoskeleton – not only a barrier The actin cortex, located directly beneath the cell membrane of animal cells, consists of a dense network of crosslinked F-actin filaments, ATP driven myosin motors, and actin-binding proteins51. Perturbation of the actin cortex in a variety of cell types, including secretory cells such as chromaffin, PC12 and pancreatic beta-cells, has been shown to influence secretion.52,53 Thus, drugs such as jasplakinolide or phallotoxins, which are known to stabilize actin networks53, generally result in reduced secretion, whereas partial disassembly of the actin network by latrunculin or cytochalasin leads to increased secretion. These observations support the idea that the actin cortex acts as a barrier, restricting vesicles from the reserve pool from reaching the plasma membrane. On the other hand, if the actin cortex is severely disassembled, secretion is reduced,54–56 suggesting that actin is not just a barrier, but also has other roles, promoting exocytosis. When cells are stimulated into secretion, the actin network has been observed to depolymerize temporarily in a

New Electrochemical Tools to Study Exocytosis
- 11 -
local manner around the secretory LDCVs, thus allowing passage of the vesicles to the cell membrane for fusion.22,57,58 This finding suggests a regulatory mechanism for secretion involving the actin cortex. After the release event is finished, the actin network is restored.
2.10 The ‘full fusion’ versus ‘kiss and run’ debate There has been a debate for a long time over ‘full fusion’ versus ‘kiss and run’, the two proposed modes of exocytosis.59 In the literature, there is support for both mechanisms, in different cell types and in various scenarios. One particular advantage of ‘kiss and run’ exocytosis is that it supports faster recycling of vesicles, as the vesicle integrity is retained and the need to re-internalize used vesicles from the cell membrane (by clathrin mediated endocytosis) is avoided by pore closure after delivery. This also allows subsequent release from the same vesicle, even without the need for undocking. The ‘full fusion’ form of exocytosis results in longer turnover times. This may not be sufficient for keeping up with the high rates of exocytosis at some nerve terminals. However, the occurrence of bulk endocytosis (see above) must also be considered, offering higher rates of recapture. Another advantage for the ‘kiss and run’ mode of exocytosis, in case of DCVs, is that it provides an additional mechanism to regulate the amount of substance that is released. It is not likely, however, that this kind of regulation is active in SSV exocytosis, since these vesicles are so small that delivery through the pore will empty the vesicle in less than 100 µs.9 Multiple parameters seem to be important in deciding the mode of exocytosis, including the frequency of stimulation and the general level of secretion, and a regulatory role of choosing between modes has been suggested.60 An important factor seems to be the number of SNARE proteins involved in the fusion event. Studies of reconstituted systems, suggest that while one SNARE complex is sufficient for pore formation, at least three are needed to induce full fusion.61

Joakim Wigström (2015)
- 12 -
New Electrochemical Tools to Study Exocytosis
- 13 -
3. ELECTROCHEMICAL METHODS Electrochemical analytical techniques represent a broad field within analytical chemistry. In this chapter, electrochemical methods and the theory most relevant to this thesis are briefly introduced. Throughout the text, the popular disk electrode62 is used as an example in discussing the methods. Other electrode types, which are not treated here, such as cylindrical, band and spherical ones, are governed by similar principles. Further examples and excellent in depth explanations of the theory can be found in other texts.63
3.1 Introduction to electrochemistry Electroanalytical methods involve the study of electron transfer between an electrode surface and an analyte, taking place within an electrolyte solution. Consider, as an example, a reversible charge transfer reaction
RedneOx ⇔+ − (1)
taking place at the working electrode, and involving a species (Ox) which may be reduced, forming (Red), by accepting n electrons e- from the working electrode. At equilibrium conditions, the net flux of all molecule species is zero (including electrons) and the electrode will assume a potential, which is called the electromotive force (emf) of the reaction. The activities of the oxidized and reduced species will then be the same in the bulk solution and at the electrode surface. The emf is directly related to the tendency for the reaction towards reduction or oxidation. If we could really measure the emf using only a single electrode it would be convenient. However, electric potential is a relative phenomenon (that is why a voltmeter has two cables) and can only be measured as a difference in emf between two electrodes in solution. One electrode is commonly chosen as a reference (reference electrode), and measurements on the studied electrode (working electrode) is performed relative to the reference electrode. Both of the electrodes, the electrolyte, which transports charged molecules through the solution, and the instrumentation connected to the electrodes – together they form a closed circuit.
3.2 The Nernst equation The Nernst equation is central in electrochemistry. For the reversible charge transfer reaction (1), the equilibrium potential of the electrode is a function of the activities of the oxidized and reduced species,

Joakim Wigström (2015)
- 14 -
)Reln(0 dOxnFRTEE += (2)
where the equilibrium potential (E) is the result of the ratio between the activities of the oxidized (Ox) and reduced (Red) species, T is the temperature, R is the gas constant, F is the Faraday constant and n is the number of electrons transferred in the reaction. E0 is the standard potential for the reaction (meaning the measured E with Ox and Red at standard activities), a property, which can be described as a driving force of the equilibrium toward the oxidized or the reduced species. Equation (2) is the foundation for two fundamental electroanalythical methods, potentiometry and voltammetry. In potentiometric methods the electrode potential (i.e. the energy of the electrons in the electrode) is measured at equilibrium and used to calculate the ratio between Ox and Red, without passing current through the electrodes. Voltammetric methods represent the opposite of potentiometric methods. Instead of measuring the Ox/Red ratio between species, an electrode potential (i.e. the energy of the electrons) is applied, driving the Ox/Red ratio toward the Ox or the Red form at the electrode surface. The current, which is measured, is generally caused by transport of Ox or Red from the bulk solution, driving their ratio at the electrode surface toward bulk conditions.
3.3 Voltammetric methods 3.3.1 Voltammetric methods at big and small disc electrodes
Voltammetric methods are a class of techniques working at non-equilibrium. A potential E is applied to a working electrode (WE), immersed in an electrolyte, and the resulting current is studied. By applying a potential more negative or more positive compared to the equilibrium potential, a reaction can be driven towards the oxidized or the reduced species. As mentioned above, this can result in a difference between the Ox/Red ratio at the electrode surface and the ratio further out from the electrode. The current is thus governed by diffusion (for the case of the argument we ignore convection). Depending on the geometry and time scale the diffusion takes on different forms. Figure 2 illustrates the situation in two stereotypical situations, a typical disc macroelectrode A (mm dimensions) and a microelectrode B (µm dimensions). For the macroelectrode, diffusion is predominantly a one-dimensional process, illustrated by the parallel arrows. For the microelectrode the situation is different. Here, transport of analyte to the electrode surface by diffusion occurs for all directions, in three dimensions.62 These fundamental different modes of transport, 1D versus 3D, give rise to characteristic differences between the observed currents for macro- and microelectrodes.

New Electrochemical Tools to Study Exocytosis
- 15 -
Figure 2 Comparison of diffusion of analyte to a disc macroelectrode and a disc microelectrode. The arrows indicate net flow of analyte to parts of the electrodes. (A) Macroelectrode where one-dimensional diffusion dominates. (B) Microelectrode where three-dimensional diffusion dominates.
3.3.2 Potential step at a macroelectrode “Potential step” is a voltammetric method in which electrode current-time behavior is observed following a sudden change in potential of a working electrode. What will happen, following a sudden change from a potential E1, chosen so that reduction does not take place, into a potential E2, where it does? Figure 3 illustrates the resulting current for a macro disc electrode with a planar geometry, undergoing a potential step.
A B
Figure 3. (A) Potential step, potential wave form. (B) Potential step current-time plot, describing an exponential decay after onset. It is seen that the initial current in this potential step experiment is characterized by a sudden onset of current which then rapidly decays as the reaction depletes the electrode diffusion layer from Re. Eventually, a steady state level is gradually approached, This is due to mass transport by diffusion that tends to replenish the diffusion layer. By solving Fick’s equation for linear (one dimensional) diffusion,64 the current response can be calculated for the planar macroelectrode. It is described by the Cottrell equation:65

Joakim Wigström (2015)
- 16 -
2/12/1
*2/1
)(tCnFAD
tiπ
= (3)
Here, F is the Faraday constant, A is the electrode geometric area, D is the diffusion coefficient, C* is the concentration of Re in bulk solution, n is the number of electrons transferred per reacted molecule, and t is time after the potential step. According to the equation, a steady state current for a planar electrode is only apparent as an asymptotic value and will not be reached. In reality though, a steady state current is reached due to naturally occurring convection. By fitting experimental data to the Cottrell equation it is possible to gain knowledge on C* and D.
3.3.3 Potential step at a microelectrode If a microelectrode is used, mass transport occurs in all directions. Solving Fick’s equation for three-dimensional diffusion is much more complicated than in one dimension, as it involves solving in (at least) two dimensions, both radially and perpendicularly with respect to the disc. One solution to this problem is the equations reported by Shoup and Szabo:66
)(4 *
τπ
fr
nFADCi = (4)
2/17823.02/1 2146.08862.07854.0)(
−−− ++= τττ ef (5)
2
4rDt
=τ (6)
This equation describes the current response, approximately, for a disc microelectrode, with radius r, on a flat surface for all times t, with a relatively high accuracy (< 0.6% deviation). The variable τ is a scaled version of time. It can be noted that the equation describes different temporal phases. At short times, the equation displays a decay in current attributed to depletion of reactant in the diffusion zone. Eventually, as a limit in the equation when t is very large, the estimated current reaches a constant value. This represents the state where the reactant depletion in the diffusion zone is balanced against influx of new reactant. One big usefulness of the equation arises from its two-phase behavior. This allows extraction of C* and D from data obtained, using an electrode of known dimensions in a single potential step experiment. Alternatively, if C* and D are known, it is possible to determine the diameter of the disc electrode.

New Electrochemical Tools to Study Exocytosis
- 17 -
3.3.4 Amperometry Single-potential amperometry, here called amperometry, is similar to a potential step experiment in which a constant potential is applied between the working electrode and the reference electrode in the beginning of the experiment. In the amperometry experiment however the current is studied over time, after the steady state current has been established. This allows the monitoring of fluctuating analyte concentration, observed as fluctuations in current.
3.3.5 Cyclic voltammetry at a macro disc electrodes Potential sweep methods are voltammetric methods where the electrode potential is operated to change linearly with time between two potentials, E1 and E2, while simultaneously recording the electrode current. In linear voltammetry, the scanning stops after reaching a target potential. In cyclic voltammetry (CV), however, the scan direction is reversed when the target potential is reached, gradually returning the potential back to the initial value. This completes a CV cycle, which can then be repeated. In a cyclic voltammetry experiment the changing potential results in a change in concentrations of Ox and Red at the electrode surface (see Faraday’s law) in relation to the bulk solution, resulting in a net flow of charge through the working electrode. In figure 4A the applied potential for one cycle in cyclic voltammetry is illustrated, where v is the scan rate (V/s). As an example reaction we again consider the charge transfer reaction 1.
Figure 4 Cyclic voltammetry. (A) Wave form for a single forward and reverse scan potential cycle. (B) Cyclic voltammogram, showing current versus voltage during a forward and a reverse potential scan. Figure 4B shows an ideal voltammogram for a reversible reaction (fast electron transfer) for a disc macroelectrode. The initial potential is E1, where the reaction is driven toward Red, and the target potential is E2, where the reaction is driven toward Ox. A gradual onset of electrochemical reaction, with a rise in current, reaching a peak at Epa, and then decays while reactants in the electrode diffusion layer are depleted by the reaction. In the following reverse scan, the current drops and a reduction peak minimum is observed at Epc. This peak is caused by the presence of species that were oxidized during the forward scan, still present in the

Joakim Wigström (2015)
- 18 -
diffusion layer, resulting in a negative current. This peak decays due to a combination of consumption by the electrode reaction and diffusional transport away from the electrode. For reversible processes the peak separation, ∆E (in voltage), between the current peaks in the forward and the reverse scan is constant, and at all scan rates given by
mVn
EEE cp
ap
59=−=Δ (9)
at 25°C, where n is the number of transferred electrons per reaction. A constant separation, regardless of scan rate, can be rationalized by realizing that the reaction rate at the electrode surface is fast enough to keep the concentrations at equilibrium near the surface, despite diffusion (Faradaic behavior). The peak heights Ipa and Ipc vary with scan rate and are related by the equation
vII pcpa α= (10)
which states that peak height is both proportional to the scan rate ν and at the same time proportional to the bulk concentration. For a quasi-reversible process, where the rate constants for the reaction are low in relation the scan rate (unable to maintain Nernstian concentrations at the electrode surface) the peak separation ΔE increases. Here, the above parameters, given by equations (9) and (10), can serve as a diagnostic test for reversibility.
3.4 Faraday’s law of electrolysis For an electrochemical reaction, Faraday’s law of electrolysis relates transferred electric charge (Q), given in coulomb, to amount, given in moles (N). The relation is linear with a proportional constant equaling the product of Faraday’s constant (F) and the number of transferred electrons per reaction (n).
nFNQ = (7)
Since charge, by definition, is the time integral of electric current, integration of a current (i) passing through an electrode during an episode, arising from an electrochemical reaction, can be used to quantify a detected analyte.
dtinF
N ∫=1 (8)
A requirement, to be met, is that, baseline current, representing other processes, is subtracted before integration. Another condition is that, the fraction of the analyte being lost from detection is minimal, or at least known. This can be achieved by confinement (Papers III and IV) or by release of analyte occurring close to the

New Electrochemical Tools to Study Exocytosis
- 19 -
electrode (Paper II). Immobile material on the electrode surface, participating in electrochemical reactions, for instance oxidation, reduction, or dissolution can also be quantified (see Paper I). The principle of integration works for voltammetric methods, including amperometry and cyclic voltammetry.
3.5 Reference electrodes At an ideal reference electrode, a single reversible reaction is allowed for species held at equilibrium condition, implying that its potential, which is controlled by the Nernst equation, is fixed. The standard hydrogen electrode (SHE) for the reaction,
2HeH ⇔+ −+ , occurring at a platinum electrode, with all species at unit activity, is the internationally accepted primary reference. All redox potentials are reported relative to this reference. For practical reasons, other types of reference electrodes are more often used, including the calomel electrode based on the reaction
−− +⇔+ ClsHgeClHg 2)(2 222 (E =0.241 V) and the silver-silver chloride (Ag/AgCl) electrode (E=0.197) in saturated KCl, a commonly used electrolyte. A diffusion barrier insulating the reference electrode and electrolyte from the rest of solution is required. As mentioned previously it is desirable for a reference electrode to provide a fixed potential for the working electrode. This requires, ideally, no current to pass through, according the conditions set up for the Nernst equation. Here, one important parameter is the solution resistance (Rs), which for an electrode passing current (i) causes an unwanted voltage drop (U) in solution, given by Ohm’s law ( siRU = ). At the same time, the reference electrode must balance the charge passing through the working electrode - a conflicting requirement. The simplest approach to solve this problem is to use a reference electrode with surface area much bigger than that of the working electrode. This will keep the passing charge per area at a minimum, thus minimizing the voltage drop. This strategy is more practical for small electrodes (i.e. microelectrodes). Another approach, applicable to bigger working electrodes, involves a third auxiliary electrode. Here, the potential of the reference electrode, is “insulated” from the rest of the circuit, but is still monitored and used. Active circuitry adjusts the potential across the working and the reference electrodes by injecting a current through the circuit formed by the working and auxiliary electrode, This allows clamping of the potential across the reference and working electrodes to a desired value, without passing current through the reference electrode.

Joakim Wigström (2015)
- 20 -

New Electrochemical Tools to Study Exocytosis
- 21 -
4. IN VIVO ELECTROCHEMISTRY Several methods can be used for detection of neuroactive substances, which are electroinactive, including capillary electrophoresis, high performance liquid chromatography (HPLC) and microdialysis. In vivo microdialysis is an important technique, which has the ability to sample the chemical microenvironment in the tissue, with both high sensitivity and specificity in detection when combined with, for instance, HPLC. Two major limitations, however, are slow response times and limited spatial resolution. Electrochemical detection of neurotransmitters have provided a useful tool for studies of secretion of electroactive neurotransmitters from cells in culture and in vivo. Since the detection occurs directly at the electrode, fast response times can be achieved. Furthermore, amperometric detection offers a quantitative measure of detected chemical neurotransmitters.
4.1 In vivo amperometry In vivo monitoring of secretion by electrochemical detection techniques is based on charge transfer reactions between an analyte and an electrode surface, the latter usually placed in direct contact with a studied tissue (in situ electrochemical detection). A range of substances can be either oxidized or reduced at a polarized electrode surface (typically 0.2-1.0V vs. Ag/AgCl) and are therefore in principle suitable for detection, resulting in amperometric currents which reflect local changes in analyte concentration. These include ascorbate, catecholamines (i.e dopamine, epinephrine, and norepinephrine), indolamines (i.e. serotonin, histamine, melatonin), inorganic ions, lactate, nitric oxide, and urate.67 The development of miniaturized electrodes has achieved improved spatial and temporal resolution for detection, being particularly useful in neuroscience to monitor real time variation in neurotransmitter release and uptake. These electrodes are commonly fabricated from thin carbon fibers, sealed in glass, plastic or epoxy resin insulation. The tip can be polished to expose only a cross section of the fiber, creating a disc electrode which samples the chemical environment locally around the tip, or be left to expose a length of fibre, often of macroscopic dimensions, sampling wider regions. Electrode arrays, capable of simultaneous electrochemical recording at multiple sites, have been realized using carbon fiber electrode bundles.68 Platinum electrode microelectrode arrays, for electrophysiological recordings in neural tissue, have also been microfabricated on silicon substrates.69 This led to the development, of Ceramic-based electrode arrays, improving noise levels and mechanical performance, capable of multisite amperometric recording of fluctuations in extracellular levels of electroactive neurotransmitter in brain tissue.70

Joakim Wigström (2015)
- 22 -
4.2 Interferents A problem in electrochemical recording of neuroactive substances is a low selectivity leading to interfering substances being co-detected. This causes variation in baseline currents, and results in lower detection limits, especially in vivo. A particular challenge is ascorbic acid, which is both electroactive and present at high and variable concentrations (0.1-0.6 mM) in brain tissue.71 Other interferents include dopamine and uric acid. The selectivity can be improved by using exclusion coatings. Nafion®, a widely used anionic Teflon® derivative,72 excludes access of anionic interferents such as ascorbate. Preconcentration of catecholamines at Nafion® membranes has in some cases (cyclic voltammetry) increased the sensitivity for catecholamines (dopamine, norepinephrine etc) at the cost of response times.73 Films have also been tried on the principle of size exclusion, including electrodeposited polyphenylenediamine.74
4.3 Single cell amperometry Single cell amperometry is a well established method, which has been used to monitor neurotransmitter release from individual exocytotic vesicles from single isolated cells, in cell culture, or in vivo, and provides a quantitative measure of the amount released, with high temporal resolution.75–78 This method is capable of monitoring release of electroactive neurotransmitters (i.e catecholamines see above). In single cell amperometric experiments, ultra microelectrodes with sizes in the micron range are placed adjacent to the surface of studied cells in culture or in tissue, to detect electroactive substances by direct electrochemical oxidation at the electrode surface. A single cell amperometry experiment is illustrated in figure 5A. Here, a thin carbon fibre, insulated in glass and polished to expose a disc surface with a typical diameter of five microns, is positioned adjacent to the surface of the studied cell at a very short distance from the site of exocytotic release, and being kept at a positive potential relative to the reference electrode.
Figure 5 Illustration of single cell experiment, showing carbon fibre microdisc electrode, positioned adjacent to the cell surface, there electrochemically detecting individual vesicles release events.

New Electrochemical Tools to Study Exocytosis
- 23 -
This arrangement can achieve a sub-millisecond time resolution, sufficient to resolve kinetic parameters for discrete events of individual exocytotic vesicle release. Such single-cell experiments have provided fundamental knowledge on the mechanisms of neurotransmitter release,3,79 the regulation by exocytotic proteins, the effects of drug on the amount of neurotransmitter released from individual vesicles, kinetic parameters of vesicle pore expansion and closing, as well as pore size and fusion pore biophysics. 80–84 In figure 6, a representative single cell amperometric recording from a PC12 cell can be seen. A pattern of spikes is visible following stimulation of the cell, each spike representing a discrete release event (the stimuli are indicated by arrows). To the right in the figure, an individual spike is shown. The above conditions, where the release occurs in a confined space between the cell surface and the electrode, guarantees that all neurotransmitter being released is consumed by the electrode. This makes it possible to determine the amount of dopamine that is released from each release event by integration of the current and applying Faraday’s law.
Figure 6 Single cell amperometric recording from PC12 cell, showing (left) a trail of current spikes corresponding to individual exocytotic release events and (right) a closeup of a single spike.
4.4 Microelectrode arrays for single cell experiments Classical carbon fiber microelectrodes (CFE) have proven invaluable with their high temporal resolution combined with a quantitative measure. However, they are lacking in spatial resolution. To add spatial information to amperometric measurements several methods have been explored. This development can be traced to initial experiments, where two sites at chromaffin cells were probed using separate carbon fibers, manually positioned at different positions.42 Later, this approach was developed further, by integration of up to seven individual fibers into bundles of multiple carbon fibres, creating of a multiple electrode array (MEA) probe, providing electrochemical imaging of exocytotic release with a ‘resolution’ of seven locations on PC12 cells.43 The number of electrodes in such MEA probes is limited by the dimensions of the carbon fibers, as well as other practical
Joakim Wigström (2015)
- 24 -
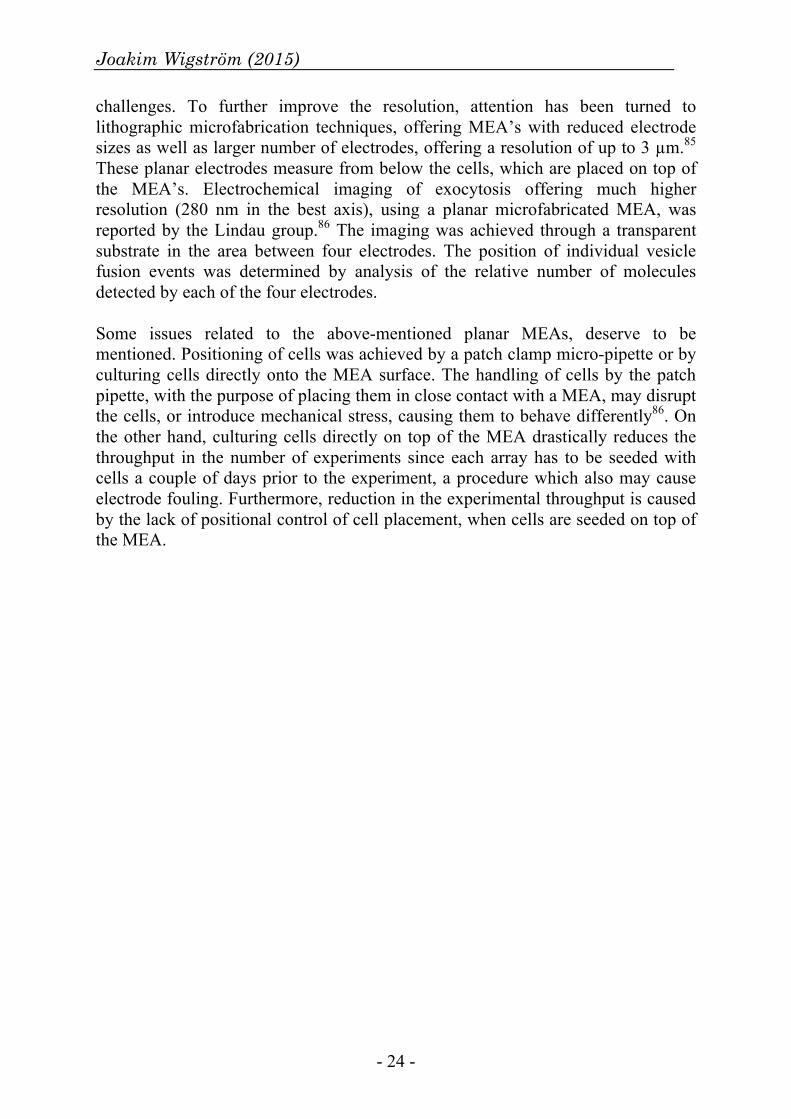
challenges. To further improve the resolution, attention has been turned to lithographic microfabrication techniques, offering MEA’s with reduced electrode sizes as well as larger number of electrodes, offering a resolution of up to 3 µm.85 These planar electrodes measure from below the cells, which are placed on top of the MEA’s. Electrochemical imaging of exocytosis offering much higher resolution (280 nm in the best axis), using a planar microfabricated MEA, was reported by the Lindau group.86 The imaging was achieved through a transparent substrate in the area between four electrodes. The position of individual vesicle fusion events was determined by analysis of the relative number of molecules detected by each of the four electrodes. Some issues related to the above-mentioned planar MEAs, deserve to be mentioned. Positioning of cells was achieved by a patch clamp micro-pipette or by culturing cells directly onto the MEA surface. The handling of cells by the patch pipette, with the purpose of placing them in close contact with a MEA, may disrupt the cells, or introduce mechanical stress, causing them to behave differently86. On the other hand, culturing cells directly on top of the MEA drastically reduces the throughput in the number of experiments since each array has to be seeded with cells a couple of days prior to the experiment, a procedure which also may cause electrode fouling. Furthermore, reduction in the experimental throughput is caused by the lack of positional control of cell placement, when cells are seeded on top of the MEA.

New Electrochemical Tools to Study Exocytosis
- 25 -
5. ELECTROCHEMICAL BIOSENSORS One main limitation of in situ electrochemical detection techniques has historically been its inability to detect important electroinactive molecules, for instance acetylcholine, choline, glutamate, lactate and glucose. Another serious limitation has been the low detection selectivity due to other, interfering electroactive substances. To address these issues, electrochemical biosensors have been developed, allowing detection in vivo, of electroinactive substances.
5.1 Introduction to biosensors Electrochemical biosensors have two main parts. One is the biological sensing element that interacts with and recognizes an analyte of interest. The sensing element is in direct contact with the other part, an electrochemical transduction element or electrode, turning the signal from the biological element into a recordable electrical signal. Catalytic biosensors interact with analytes with high specificity to produce an electroactive molecule species. Enzyme based biosensors, representing the most frequently used type of catalytic biosensor, rely on enzymes acting as catalysts to produce or deplete electroactive species. In amperometric enzyme biosensors, either reduction or oxidation of these species at the electrode will result in an electric current, the magnitude of which corresponds to the analyte concentration (see amperometry). Catalytic biosensors are critically dependent on finding suitable enzymes for a given analyte. Examples include detection of glucose, lactic acid and choline, which rely on single oxidase enzymes (glucose oxidase, choline oxidase, lactate oxidase). In some cases where no suitable enzyme is available, sequential enzyme reactions have been exploited, combining two or more enzymes to create an overall reaction that produces electroactive species. One example is acetylcholineesterase (AChE) together with choline oxidase (ChO) where acetylcholine is converted by ChO to choline, which is not an electroactive molecule, but the ChO further catalyses the choline and forms hydrogen peroxide as one of the electroactive products that can be detected amperometrically (see Paper I). Affinity sensors, another electrochemical biosensor class, rely on selective interaction between the analyte and the sensing element. Sensing elements based on antibody recognition (immunosensing), DNA (nucleic acid hybridization) and ion channel interaction have been used. The detection can be based on amperometric, potentiometric, capacitance, or field effect based methods.

Joakim Wigström (2015)
- 26 -
5.2 Three generations of enzyme biosensors Glucose has a special place in the field of biosensors, which was in fact sparked by development of the first glucose enzyme biosensors. Determination of glucose concentration in blood is the most studied application of enzyme biosensors, and also the most developed commercial application, due to the large number of people diagnosed with diabetes that need to monitor their blood glucose concentrations on regular daily basis. Glucose oxidase is an enzyme produced by the fungus Aspergillus niger, which utilizes this enzyme to produce H2O2, which is antibacterial. Due to its relatively robust nature, this enzyme is suitable for biosensor applications. It catalyzes the oxidation of D-glucose to H2O2 by the reactions
2- FADHtonegluconolacFADD- Glucose +⇒+ β (11)
2222 OHFADOFADH +⇒+ (12) which utilize the enzyme redox cofactor FAD, which is reduced, turning into FADH2. The FAD is then regenerated through oxidation by dissolved oxygen, which acts as electron acceptor, producing H2O2.
2.5.1 First generation The first glucose enzyme biosensors, were developed by Clarke and Lyons in the early 1960’s.87 These early sensors utilized glucose oxidase, trapped in the solution between a semi permeable membrane and a negatively polarized platinum electrode, allowing detection of the oxygen concentration (which is coupled to glucose consumption).
O2H e 4HO 2-
2 ⇒++ + (13) Later development of this concept relied on detection of the produced H2O2, acting as reporter molecule.88 Figure 7 illustrates the mechanism of detection by oxidation of H2O2 into O2 at a positively polarized platinum electrode. This reaction generates an amperometric current while at the same time regenerating the oxygen, offering improvements in accuracy and detection limits. These early sensors, which use dissolved oxygen as reagent, represent the first generation of biosensors.
Figure 7 Mechanism of detection for a first generation glucose sensitive biosensor.

New Electrochemical Tools to Study Exocytosis
- 27 -
The dependence on dissolved oxygen, with its limited solubility, affects the performance at higher, biologically relevant, glucose concentrations, leading to a non-linear response relation at high concentrations of glucose. 89,90 For in vivo applications, variations in oxygen concentration may also pose additional problems. One solution has been to coat the sensor with a diffusional barrier, lowering the required oxygen concentration. Another issue with these sensors is that H2O2 on common electrode materials requires a relatively high potential to induce oxidation,71 leading to interference from other electroactive species present in biological samples, such as ascorbate.
2.5.2 Second generation In second generation glucose sensing enzyme biosensors, the naturally occurring reporter oxygen was replaced with an artificial redox mediator (see Figure 8), added to the solution. The redox mediator acts as an electron acceptor, which reoxidize the FADH2 cofactor of glucose oxidase into FAD. The mediator is subsequently regenerated/detected by a positively polarized electrode, generating amperometric current. Such redox mediators, capable of regenerating FAD cofactors, should have a redox potential higher than that of the catalytic centre, ideally around ~0V,91 thereby regenerating, and generating, response current at a low potential. Avoiding high electrode potentials also minimizes background signals from interfering molecular species, and so provides improvements in sensitivity. Examples of redox mediators include, ferricyanide (and derivatives), ferrocene (and derivatives), prussian blue, quinones, methylene blue, and osmium complexes. 91–93
Figure 8 Mechanism of detection for a second generation glucose biosensor. For practical reasons, and due to toxicity, many in vivo applications exclude the use of redox mediators dissolved in solution. Therefore, the mediators have been co-immobilized together with enzymes, preventing leakage into solution. Covalently linked redox mediators such as ferrocene derivatives or osmium-complexes, have been bound to polymer backbones91,94,95 or tethered through spacer arms directly onto immobilized enzymes.96–98 The mediators are then acting as relays that transport electrons between the electrode and the enzyme reactive site.

Joakim Wigström (2015)
- 28 -
2.5.3 Third generation Reagentless enzyme electrodes relying on the direct electrical transfer between the electrode surface and the reactive centers of enzymes have been termed third generation biosensors. The principle is illustrated in figure 3, where the electrode reoxidize the FADH2 cofactor of glucose directly, resulting in amperometric current in a glucose detecting biosensor. The principle of third generation biosensors, where the enzymes act as electrocatalysts independent of oxygen or other redox mediators is elegant. However, creating such sensors is not entirely straightforward. According to Marcus theory, the rate of electron transfer reactions decrease exponentially with distance between the electrode surface and the enzyme redox centre. This results in an increase in the required electrode potential, effectively preventing direct electron transfer at relevant rates for many enzymes, including glucose oxidase.98
Figure 9 Mechanism of detection for a third generation glucose biosensor. The principle of using long-range electronically conducting nano-wires leading from the electrode surface to enzyme reactive centres has been demonstrated, using single-walled carbon nanotubes, which are excellent electric conductors.99 Carbon nanotubes were covalently attached to a functionalized gold surface. In the next step, FAD cofactors were immobilized to the free ends of the carbon nanotubes. Following this, the electrode was incubated with glucose oxidase apo-enzymes (without FAD cofactors), leading to spontaneous association between the enzymes and the immobilized cofactors. High turnover rates were demonstrated for the electrically contacted enzymes. For some other enzymes, such as microperoxidase (a small heme enzyme fragment), relevant rates of electron transfer directly to electrodes, have been reported, forming the basis of third generation hydrogen peroxide sensing biosensors.100
5.3 Enzyme immobilization Enzyme based biosensors rely on keeping enzymes in close proximity to an electrode, and numerous methods for immobilization have been tried.101–103 (1) Entrapment under a semi permeable membrane and (2) entrapment within a polymer matrix have already been mentioned. Other methods include (3) chemical adsorption to electrode surfaces through linker reagents, and (4) direct physical adsorption. Enzymes can be entrapped in several different materials, such as polymers, deposited by electropolymerization or layer-by-layer deposition, in sol-gels or hydrogels, or within lipid vesicles.104–106 Entrapment within a polymer

New Electrochemical Tools to Study Exocytosis
- 29 -
matrix can be achieved in different ways. For instance, polymers have been grown by electropolymerization on electrode surfaces from monomers such as pyrrole, phenylenediamine or aniline in the presence of enzymes, resulting in enzyme immobilization by entrapment. Chemical adsorption by linker reagents results in immobilization by stable covalent bonds between the enzymes and the substrate. A linker reagent is a compound capable of creating covalent bonds between functional groups. Many of those reagents are available for creating links to functional groups present on the surface of enzymes, including primary amines, carboxylic groups, thiols and alcohol groups.107 EDC (1-ethyl-3-(3-dimethylaminopropyl) carbodiimide) is a popular reagent which has been used to couple carboxyl groups with primary amines in applications such as polypeptide synthesis and protein immobilization. EDC reacts with carboxyl groups, creating reactive esters, which in turn react with the amines, forming a covalent crosslink (amide group). EDC is termed a zero-length crosslinker reagent as it is not part of the final link. EDC can be used in combination with co-reagents such as N-hydroxysuccinimide (NHS), which facilitates the linking procedure by forming a stable reactive ester. Glutaraldehyde is a widely used reagent which has also been used for various other purposes, such as sterilization and fixation of biological samples.108 It is a homobifunctional reagent with two aldehyde groups at each end of a hydrocarbon chain, which react with amine groups, forming covalent links and fixating proteins. Glutaraldehyde has also been used to immobilize enzymes on electrodes. The lysine rich protein BSA (bovine serum albumin) can be added, serving as a matrix to reduce enzyme deactivation. Physical adsorption of enzymes on an electrode surface involves a simple procedure of merely immersing the electrode in an enzyme-containing solution. There, the enzymes adhere with the surface through a combination of interactions, including hydrophobic effects, electrostatic forces, van der Waals forces and hydrogen bonds.109 Due to weak interactions the immobilization is comparatively unstable, limiting the lifetime of the sensor. Critical for catalytical biosensors is the retention of enzymatic activity for the immobilized enzymes. In fact, immobilization may improve the stability of enzymes, by locking the enzyme tertiary structure. Nanostructured, high curvature surfaces have also been shown to have a positive effect on retention of the activity of adsorbed enzyme monolayers. This effect has been observed at gold and silica nanoparticles for the enzymes lysozyme and chymo-trypsine.110,111 When characterizing the state of immobilized enzymes, their activity is often expressed by the two important parameters Vmax, the maximum catalytic rate, and Km, representing the affinity for the analyte substrate. A high Vmax and low Km implies efficient catalytic activity at low analyte concentration.

Joakim Wigström (2015)
- 30 -
5.4 Real time in vivo monitoring of electroinactive substances A class of successful enzyme biosensors capable of monitoring electroinactive substances in vivo, was first introduced by Gerhardt and co-workers (Burmeister et al).112 These sensors feature multiple platinum electrode surfaces on a pointed ceramic substrate, which can be inserted in living tissue (rat CNS). The platinum electrodes are typically coated first with nafion, in order to repel anionic interferents such as dopamine and ascorbic acid, and then enzymes are applied by droplet deposition of a mixture containing the active enzymes, BSA and the linker reagent glutaraldehyde. Several different metabolites have been monitored in living brain tissue, for instance: acetylcholine, choline, glutamate and lactate.74,112–116 In some cases, an outer film was added to adjust the linear range of the response to analytes present at high concentrations, the film acting as a diffusion barrier. 114 One important feature of these electrodes is a self-referencing technique, utilizing sentinel electrodes not coated with active enzymes. These allow correction for background current, providing improved detection limits and response stability. For the sensors discussed above, response-times are generally reported to be in the near-second range. This may be sufficient for monitoring of extracellular levels of neurotransmitters or other metabolites in regions involving multiple cells. The response times are likely related to the size of the electrodes, but may also depend on the presence of convolution of the response, du to diffusion through the multilayered structures, a well established phenomenon.71 The response-time requirement is much higher when studying single vesicle release events, as these are measured in milliseconds rather than seconds. In Paper I, the development of a fast-responding enzyme-based sensor is described, with the aim of bridging the gap.

New Electrochemical Tools to Study Exocytosis
- 31 -
6. QUARTS CRYSTAL MICROBALANCE MONITORING
Quarts Crystal Microbalance (QCM) monitoring is a highly sensitive acoustic method that has been used to detect real-time changes of mass and viscoelastic properties in thin films adherent to the surface of a QCM crystal. Modern QCM instruments operate both in the gas phase and, with reduced sensitivity, in liquid media.117,118 The dissipation can be measured simultaneously with the frequency, and represents a valuable extra source of information on the structure of the biomolecules, which exhibit both viscous and elastic properties.119
6.1 Introduction to QCM QCM is based on two fundamental principles. The first means that the harmonic vibrational resonance frequency of a solid object is affected by mass changes at the surface. The other one is piezoelectricity, which directly couples an electric signal to the mechanical deformation of a material. This makes it easy to determine the resonance frequency, by using an electronic oscillator circuit. Piezoelectricity is based on charge separation of individual atoms in a crystal lattice, manifesting itself as an electric potential. As demonstrated by Sauerbrey in 1959,120 it is possible to drive and measure the resonant frequency by the same electronic circuit. The most common piezoelectric substrate material is quartz (SiO2). Other examples include lithium tantalate, lithium niobatem gallium arsenide and zinc oxide. A disk shaped QCM crystal is illustrated in Figure 10A, with two keyhole shaped electrode surfaces, usually gold deposited on opposite sides of the electrode for interfacing to the electric circuit.
Figure 10 (A) QCM crystal with electrode surfaces (B) Lateral vibrations in a QCM crystal, induced by an applied oscillating potential. Similar to other flat objects, the QCM crystal exhibits several modes of harmonic vibration including bending, extension, face shear and thickness shear vibration. However all QCM crystals are made to resonate in the thickness shear mode where movement occurs as a lateral (horizontal) motion of the surface. This is accomplished by the so called AT-cut, which is a special configuration, where the

Joakim Wigström (2015)
- 32 -
crystal lattice axes relative to the crystal disk are cut at about 35 degrees from the ZX plane of the lattice.121 This resonance is typically around 5 MHz for common QCM crystals. An interesting property of quartz is that it is possible to select the temperature dependence of the material by the cut angle and the wave propagation direction. With proper selection of the cut angle, temperature effects can be minimized. Figure 10B illustrates the oscillations induced by the alternating voltage (U) applied to the surface covering the electrodes. The lateral displacement for the base harmonic oscillation frequency (f0) is indicated by dotted lines. In a QCM crystal, harmonic resonance also occurs at multiple overtones of f0. In the figure, the odd overtones f3 and f5 are also illustrated. The usefulness of these overtones lies in the fact that they offer a choice between different frequencies at which to run the crystal, being important in the case of soft materials (to be discussed below). Even overtones (such as f2 and f4) do not appear in QCM, even though they are mechanically possible in the planar crystal. However, the electrodes are unable to induce them because the symmetry in these vibrations are coupled to charges of the same sign at the two opposite surfaces. Such charges can neither be induced nor detected by an electronic circuit. The Sauerbrey equation120 describes a direct relationship between changes in frequency Δf and in mass Δm at a crystal surface:
mAff Δ−=Δρµ
2 (14)
Here f is the resonant frequency for the crystal, A is the piezoelectrically active area, ρ is the density of quartz and µ is the shear modulus of the material (in the direction of the axis of vibrational displacement). As long as the mass changes occur in a rigid material the equation requires no calibration. The equation predicts the behavior for small mass changes in a rigid film uniformly across the surface, treated as an extension to the crystal material itself. It is considered valid when frequency changes are small (<2% of f0) and when the mass changes occur in a rigid film.119
6.2 Energy dissipation and frequency shift in liquid media A QCM crystal can be arranged in gas phase and without any soft materials attached to its surface, minimizing energy losses. As a contrasting example, the crystal can be immersed in a liquid medium, introducing both severe energy losses due to friction, as well as a shift in the resonant frequency toward lower frequencies. The impedance spectra in figure 11 illustrate the vibrational conductance of a QCM crystal in these two cases, in the gas phase (black) and in the liquid phase (red). It is seen that the crystal resonates at different frequencies depending on the surrounding medium.

New Electrochemical Tools to Study Exocytosis
- 33 -
Figure 11 Conductance spectra of a QCM crystal, in air (black) in a liquid (red). The frequency shifts to a lower range and the bandwidth broadens when the crystal is immersed in the liquid. The spectrum can be obtained by applying a series of sinusoidal voltage signals in sequence, covering a range of frequencies, or by applying a single pulse122 and recording the following, induced oscillations. The conductance profile of the crystal in the gas phase has a characteristic peak, located at resonant frequency. The bandwidth, defined as the width of the curve at half maximum, is quite narrow in this case. For comparison, the liquid phase, has a slightly shifted (lower) resonant frequency together with a substantially larger bandwidth. The quality (Q) factor is a parameter, which can be obtained from the impedance spectrum.
wfQ r= (15)
where fr is the resonant frequency and w is the bandwidth. The Q factor can alternatively be expressed as the fraction between the stored vibrational energy and the vibrational energy losses (dissipation) during a single oscillation. It is a useful measure of energy dissipation in the system.
dissipated
stored
EEQ π2= (16)
Therefore, the Q factor can also be determined from observing the rate of ring-down of the vibration amplitude when the driving circuit is cut of
)2sin()( 0 fteAtAt
πτ−= (17)
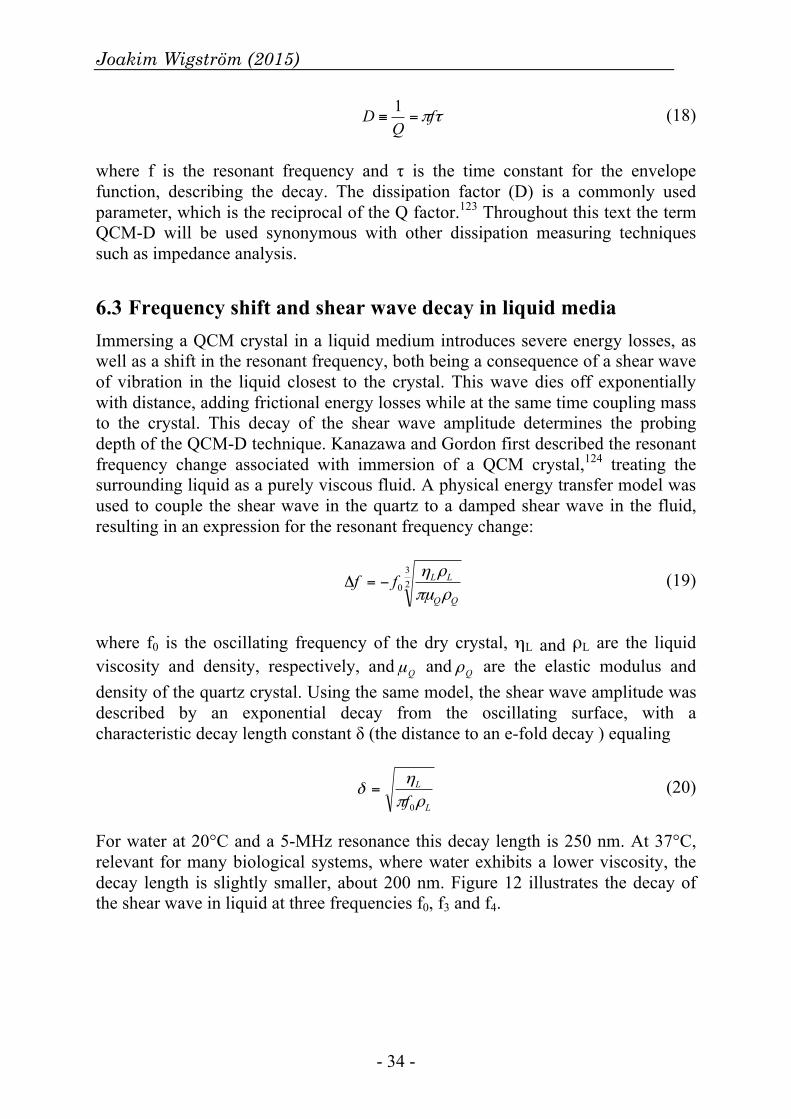
Joakim Wigström (2015)
- 34 -
τπfQ
D =≡1 (18)
where f is the resonant frequency and τ is the time constant for the envelope function, describing the decay. The dissipation factor (D) is a commonly used parameter, which is the reciprocal of the Q factor.123 Throughout this text the term QCM-D will be used synonymous with other dissipation measuring techniques such as impedance analysis.
6.3 Frequency shift and shear wave decay in liquid media Immersing a QCM crystal in a liquid medium introduces severe energy losses, as well as a shift in the resonant frequency, both being a consequence of a shear wave of vibration in the liquid closest to the crystal. This wave dies off exponentially with distance, adding frictional energy losses while at the same time coupling mass to the crystal. This decay of the shear wave amplitude determines the probing depth of the QCM-D technique. Kanazawa and Gordon first described the resonant frequency change associated with immersion of a QCM crystal,124 treating the surrounding liquid as a purely viscous fluid. A physical energy transfer model was used to couple the shear wave in the quartz to a damped shear wave in the fluid, resulting in an expression for the resonant frequency change:
23
0QQ
LLffρπµρη
−=Δ (19)
where f0 is the oscillating frequency of the dry crystal, ηL and ρL are the liquid viscosity and density, respectively, and Qµ and Qρ are the elastic modulus and density of the quartz crystal. Using the same model, the shear wave amplitude was described by an exponential decay from the oscillating surface, with a characteristic decay length constant δ (the distance to an e-fold decay ) equaling
L
L
f ρπη
δ0
= (20)
For water at 20°C and a 5-MHz resonance this decay length is 250 nm. At 37°C, relevant for many biological systems, where water exhibits a lower viscosity, the decay length is slightly smaller, about 200 nm. Figure 12 illustrates the decay of the shear wave in liquid at three frequencies f0, f3 and f4.

New Electrochemical Tools to Study Exocytosis
- 35 -
Figure 12 Shear wave amplitudes within and in the vicinity of a QCM crystal submerged in a liquid (not drawn to scale). Basic resonant frequency f0 and overtones f3 and f5 are shown, illustrating that with increasing frequency, the shear wave decays closer to the crystal (smaller length constant δ).
6.4 Modeling of viscoelastic (soft) films The above equations, which have been derived analytically, are useful in describing a single homogenous semi-infinite layer. More complicated situations involving multiple layers can also been modeled, for example soft films possessing both viscous and elastic properties.125 Two equivalent approaches have been reported, based on electrical or mechanical properties of the QCM resonator.123,126 In equivalent circuit modeling, an electronic model (the Butterworth–Van Dyke model) of the crystal is created where the inertia, friction (energy loss) and elastic energy storage are expressed as electronic components (inductor, resistor and capacitance). Parts of the model thus represent the crystal and other parts the studied film. The acoustic impedance of a layer of film is a property, which can be modeled as a complex-valued vector, where energy loss (dissipation) is represented by the real part and energy storage (elastic and kinetic components) by an imaginary, frequency dependent part. The decaying shear wave propagating through a material can be simulated by connecting multiple such acoustic impedances in series within the model. The other, principally equivalent approach uses continuous mechanics modeling. Here, the frequency and dissipation shifts (∆f and ∆D) are derived from a mechanical model (Maxwell/Voigt) of layers of mass, interconnected to the crystal and to each other by springs (energy storage) and dashpots (energy dissipation).127

Joakim Wigström (2015)
- 36 -
Layered structures, for instance different types of films immersed in liquid, can be modeled with the goal of fitting the conductance (or mechanical) parameters. However, each new layer adds four variables rising from thickness and acoustic impedance components (dissipation, mass and elasticity). So some of them must be known, or given assumed values. Strategies for resolving unknown parameters include using data obtained by other means, or calculated from resonance overtones128. The latter case makes use of shear waves of resonant overtones, providing complimentary data by probing different depths. However, the frequency dependence of model parameters is a complication.129
6.5 Biological applications QCM is a method, which is non-invasive for mammalian cells as well as label-free and has been applied in many cell biology studies. The viscous nature of cells causes both dissipation of energy from the QCM crystal and deviation from the Sauerbrey equation, which describes the relation between adsorbed mass and frequency change. Furthermore, the probing depth of the shear wave generally coincides with the basal layer of attached cells, with cells beyond the first cell layer not contributing to the recorded signal.118,130 QCM is thus mainly a surface sensitive method in cell biology applications. In a majority of reports, the changes in the monitored QCM-D signal (frequency and energy dissipation) have been attributed to the cell basal region and the cell-sensor interfacial layer. The biological applications of QCM-D include monitoring of interactions between cells and a surface during progressive events, such as attachment, spreading and adhesion of the cells at a surface, and cell motility117,118,130,131 During these stages, the dissipation and frequency shift undergo significant changes, reflecting morphological as well as mechanical effects. It is not clear what causes the changes recorded by QCM-D, but structural factors such as the interfacial layer, surface adhesion points, cell viscosity and mechanical properties of the cytoskeleton have been implied to play roles. Other studies include monitoring of changes in cell morphology and mechanics in response to cytomorphic agents or toxins. The influence of the cytoskeleton on viscoelastic properties has been investigated by reversible depolymerization of the actin network,132 using temporary application of cytochalasin D, an actin disrupting drug. One way to analyze QCM-D data from such experiments is to plot the ratio of dissipation change versus frequency change27,133, ∆D/∆f, which has been shown to be more quantitatively relevant than the “raw data” Complete modeling of a confluent cell layer, is a formidable task, due to the structural complexity of cells. Another complicating factor is the dependence of viscoelastic properties of components on frequency.134 However, one study has attempted to characterize viscoelastic properties of a cell layer using a theoretical continuum mechanics model. In the study a simplified one-dimensional three layer

New Electrochemical Tools to Study Exocytosis
- 37 -
model was where some parameters related to the interfacial layer were acquired from other sources.135 The obtained viscoelastic properties, were in general agreement with those found using other techniques. QCM has also been applied to monitor the changes in QCM-D parameters in response to exocytosis induced by high K+ stimulation.136 The latter is especially relevant to the work presented in Paper IV.

Joakim Wigström (2015)
- 38 -
New Electrochemical Tools to Study Exocytosis
- 39 -
7. OTHER METHODS Several techniques have been developed , that can be used for investigating the exocytotic pathways and related processes. Electrochemical methods, enzyme based biosensors and QCM has been central in all papers of this thesis, Paper I – IV, and were reviewed in the previous chapters. In this chapter some other important techniques will be presented briefly.
7.1 Patch clamp Patch clamp is a well established technique which involves application of a glass micropipette filled with a conducting electrolyte to study biological membranes.137,138 It has been proven invaluable for analyzing electric currents in excitable cells, such as neurons and endocrine cells or even small patches of cell membrane.139 In addition, it can be used to estimate membrane area via capacitance measurement. The simplest recording mode is the “cell attached” configuration, which involve creating a tight seal between the tip of the micropipette, and the outside of a cell, but without breaking the membrane. It has been used for investigating exocytotic and endocytotic processes, in a limited area of the cell within the tip of the micropipette, by monitoring the capacitance. The membrane area can then be monitored over time using capacitance measurement, relying on the assumption that the capacitance is proportional to the area of the recorded membrane. Thus the processes of exocytosis and endocytosis, which relate respectively to adding surface by pore formation and removing surface by endocytotic recovery of vesicles, can be studied in detail. In “whole cell” configuration, the cell is ruptured at the electrode tip creating a direct connection between the micropipette and the cell interior allowing capacitance of the whole cell to be measured, providing a measure of total membrane area, which is related to the sum of exocytotic and endocytotic activity across the cell membrane. The time constant of endocytosis, as revealed by capacitance measurement, have been used distinguish between full fusion or kiss-and-run. Thus, rapid endocytosis, with time constants well below one second has been observed,140 and is much faster than the time course for clathrin mediated endocytosis. A very transient (~5ms) rise of capacitance, after 1-2 seconds return to baseline equally abrupt, was observed in ~20% of synaptic vesicles. This capacitance ‘flickering’, which has also been observed in endocrine cells,137 was interpreted as pore opening and closing during kiss-and-run exocytosis. Patch clamp can also been use to induce exocytosis.139 This rely on the direct electrical connection of the pipette to the intracellular space, in “whole cell” mode, to control (or ‘clamp’) the membrane potential to any desired potential. Thus

Joakim Wigström (2015)
- 40 -
allowing almost instantaneous activation (<ms) of voltage gated calcium channels, mediating exocytosis.141
7.2 TEM Transmission electron microscopy (TEM) imaging, with its unprecedented spatial resolution, has been regarded the reference for imaging of the cellular ultrastructure. In combination with fast Cryo-fixation techniques, TEM imaging offers sub-second time resolution of single snap shot views from the synapse. Determination of the mode of exocytosis (‘kiss and run’ vs. ’full fusion’) from TEM images is very challenging, as it is a transient phenomenon. However TEM imaging from secretory cells give single image information on number of vesicles present in the synapse, the vesicle size, the distribution of vesicles present in the different vesicle pools versus docked at the area of the active zone, vesicles going through fusion and subsequent membrane retrieval at locations for various modes of endocytosis to occur.142,143
7.3 Fluorescence based optical methods Optical methods, involving fluorescent staining of vesicles, has proven extremely useful in visualizing the dynamics of exocytotic and endocytotic processes in real time.79,144 By fluorescently labeling synaptic vesicles using the styryl pyridinium dye FM1-43, has provided support for kiss-and-run mode exocytosis at hippocampal synapses. The hydrophobic tails of the amphiphilic FM1-43 dye is readily inserted in the outer leaflet of the membrane and upon dye partitioning a large increase in fluorescence is achieved.145,146144,147 By incubating cells with the dye during cell stimulation to undergo exocytosis, vesicles that are recaptured during compensatory endocytosis are stained by the dye. These recaptured vesicles can be imaged, during the vesicle cycle, allowing the study of vesicular movement, revealing kinetics for exocytotic and endocytotic processes and determining kinetics for the full vesicle cycle. By staining with two different styryl FM dyes, one being more hydrophilic than the other, the mode of release has also been probed. Results showing that the hydrophobic dye (FM1-84) was released more slowly than the hydrophilic dye (FM2–10) were interpreted as a sign of kiss-and-run events. This is because the hydrophobic FM probe would not be released, to the same extent as the hydrophilic probe, during a transient ‘kiss and run’ fusion event. One problem however, with FM1-43 dyes is the phototoxic effect, which may harm the cell after prolonged exposure, limiting its use.148 Fluorescent pH-sensitive proteins, pHluorins, are genetically engineered from green fluorescent protein (GFP),135 and has been incorporated into vesicles by linkage to vesicle associated synaptic membrane proteins in transfected cell lines. The changes in fluorescence signal by pHluorins reflect changes in the local pH. Different versions of pHluorins have been used, for instance where one of two

New Electrochemical Tools to Study Exocytosis
- 41 -
fluorescent wavelengths is quenched at low pH (ecliptic fluorescence) or where pH is detected from the flouescence intensities at two wavelengths (ratiometric flouescence) are monitored during changes of pH.134 Changes in vesicular pH, associated with pore formation during exocytosis are revealed be monitored when the vesicle interior (~pH 5.5) is temporarily exposed to the extracellular medium and then rises to the physiological pH of ~pH 7.4. Ecliptic pHluorins have been used for imaging of fusion of vesicles and subsequent retrieval at mast cells. Acidotropic dyes are pH sensing dyes which under intracellular conditions diffuse freely through membranes. When entering the acidic environment within vesicles, they become protonated (charged) and trapped, resulting in concentration and labeling of acidic vesicles. These dyes have been used in many cell types,15 but has some drawbacks, including a lack in organelle labeling specificity.
7.4 Total internal reflection microscopy Total internal reflection microscopy (TIRF) has been an important and powerful fluorescence imaging method in the study of exocytosis. It exploits the electromagnetic ‘evanescent wave’ formed near a surface, when a beam of light is reflected at the surface. The exponential decay of the ‘evanescent wave’ can be used to excite fluorophores within a few hundred nanometers from the surface.145 Therefore fluorescently labeled vesicles can be monitored as they transfer from the cytoplasm and approach the plasma membrane of the cell and where they light up as they enter within the space where the evanescent wave penetrates the bottom part of the cells. With these conditions, allows for tracking the vesicle movement and docking of single vesicles before subsequent fusion and vesicle content release. The required image analysis is challenging and was previously performed manually, allowing the study of only a limited number of vesicles. Recent development of automated time lapse image analysis has allowed imaging of active locations across the surface of entire cells.46,47
7.5 Combined optical and amperometric methods Since fluorescence based methods, TIRF microscopy imaging in particular, offer imaging of individual vesicles before and during exocytosis, the attention has been drawn to combining electrochemical and optical techniques.149 The optical methods then provide information on the vesicle movement and docking into the cell membrane prior to formation of the fusion pore while electrochemical approach gives information about the opening and closing of fusion pore and the amount of neurotransmitters released. Exocytotic release events have been recorded by thin film electrodes at the cell bottom, by a transparent electrode directly under the cell or by multiple electrodes surrounding the studied area. While simultaneous optical imaging, provide spatial information. However, challenges remain for these methods, including finding optimum electrode materials which combines good optical properties with capability for efficient

Joakim Wigström (2015)
- 42 -
electrochemical detection150.
7.6 In vivo microdialysis In vivo microdialysis is one of the most important techniques, which has the ability to sample the chemical microenvironment in tissue with high sensitivity and specificity in detection. In microdialysis, perfusion solution is pumped through the dialysis probe that is placed in the tissue.151 The local volume is sampled by allowing diffusion through the dialysis membrane and into the probe. Analytes are then transported away for detection at a separate site. The principle of separating sampling and detection provide the possibility of choosing among a number of different options for detection, including optical methods and electrochemical methods (both enzyme-based and enzyme-less) and mass spectrometry. One limitation, at least from the perspective of measuring rapid fluctuations in neuroactive substances, related to changes in behavior or cognitive activities, is related to the response time, which can be in the order of minutes. Another drawback is the limited spatial resolution due to the probe size, which is generally measured in millimeters.

New Electrochemical Tools to Study Exocytosis
- 43 -
8. SUMMARY The work described in this thesis has the focus on development of new tools to study exocytosis. Each of the four papers represents methods aimed toward investigating different aspects of exocytotic and related processes at single model cells as well as in small populations of cells. To start with, Paper I describe the development and characterization of a sequential enzyme-based biosensor with the ultimate aim of detecting single vesicle release of acetylcholine, an electroinactive neurotransmitter with sufficiently high time resolution. In Paper II, a novel electrochemical method is presented for the quantification of the secretory vesicle contents in isolated chromaffin cells. Paper III deals with a new method for electrochemical imaging of single vesicle exocytotic release events with high temporal and spatial resolution. Finally, Paper IV present a method, which combine amperometric and QCM-D based monitoring of cultured PC12 cells stimulated to exocytotic release and by comparison of the data from the two independent analytical methods suggest that QCM-D signal reflect exocytosis, endocytosis and additional simultaneous detectable cell activity induced by the cell simulation to exocytotic release. Paper I The preparation and characterization of a novel enzyme based biosensor with the goal of detecting single vesicular release of ACh at single cells such as PC12 or Chromaffin cells at a sufficient temporal resolution to resolve these events at the millisecond time scale that these events occur. Several challenges must be overcome to achieve this goal, including high enough sensitivity. In contrast to previously in vivo mentioned sensors, where detection is achieved by a volume of enzymes, entrapped within polymers or protein matrixes, a strategy of using enzyme films, approaching monolayer coverage was used. The work was based on previous studies on the optimization of the conditions for preparation of enzyme nanoparticle conjugates by attaching the two sequential enzymes acetylcholine esterase (AChE) and choline oxidase (ChO) to gold nanoparticles that result in the highest retention of enzymatic catalytic activity. The optimization process was performed using analytical chemistry methods and careful characterization of the two enzyme gold nanoparticle conjugates in bulk solution.152 These optimal conditions determined in this work were then applied for placement of the enzymes onto gold nanoparticle coated carbon fiber microelectrodes. At these sensors gold was electrodeposited, forming nanoparticle hemispheres on the surface, and the enzymes were immobilized, using direct adsorption at a previously determined optimal ratio of enzyme concentration and the enzyme coverage was limited to close to a monolayer thickness to optimize the sensor time response A fast response, was achieved and allowed for single vesicle release events to be time resolved in the millisecond time range. Addressing the issue of interfering substances, particularly catecholamines, which are commonly secreted from the

Joakim Wigström (2015)
- 44 -
target cells, a strategy of relying on electrochemical reduction of the sequential end product H2O2 was chosen. Paper II Neurotransmitter secretion, in neurons as well as in neuroendocrine cells relies on exocytosis, meaning that vesicles eject their cargo by fusing with the cell membrane. The details of this process are not clear and which mode of fusion occurring in different scenarios, full membrane fusion or ‘kiss and run’ (temporal pore formation) has been debated. A microfluidic system had previously been developed to quantify the total dopamine content of isolated vesicles84 in an attempt to address the question about fusion mode. By comparison of the total dopamine content of the isolated vesicles, with released amounts of neurotransmitters, determined in single cell experiments, the question if all is released (‘full fusion’), or just a fraction (‘kiss and run’) was tried to be answered. The microfluidic system was based on separation by capillary electrophoresis followed by lysis in a microfluidic platform at an electrode surface leading to electrochemical detection. Prompted by issues in the previous system, related to the complexities of simultaneous lysis and detection in the flow system, the current project was initiated, aimed to find alternative ways to quantify the content of single isolated vesicles. The initial strategy was entrapment and lysis of single vesicles in microscopic cavities, followed by electrochemical detection. Narrow separation between electrodes result in cyclic oxidation and reduction of electroactive molecules such as catecholamines when molecules shuttle back and forth between the electrodes and result in sustained amperometric currents, enabling detection of very low concentrations.153,154 In preparation for a future microfluidic system, electrochemical detection of free dopamine was first tested in micro volumes trapped between mercury and a concave carbon fiber electrode, similar to previously reported methods.155 Later, a water/oil phase system was tried, where deposited aqueous phase droplets were pressed between a carbon fiber electrode and an indium tin oxide (ITO) electrode surface. However, as discovered by Johan Dunevall in our laboratory, controlled lysis of vesicles can be achieved directly on electrode surfaces, by immersing an electrode in a concentrated solution containing isolated vesicles. This finding obviates the need for microfluidic flow systems, as well as microcavity-based ones. In paper II, the total catecholamine content of single vesicles, isolated from chromaffin cells was measured by this method. In this direct system, diffusing vesicles collide with the electrode, adsorb and eventually collapse. The vesicle content is then released, and detected by the electrode, allowing quantification of the catecholamine vesicle content by amperometry. Result show that in comparison the amount detected that is being released by exocytosis is on average 42% of the total neurotransmitter content.

New Electrochemical Tools to Study Exocytosis
- 45 -
Paper III A new kind of microelectrode array (MEA) was developed, with the goal of electrochemical imaging of individual vesicle release events at high spatial and temporal resolution. The imaging principle was adopted from a method previously developed by the Manfred Lindau group,86 based on comparing experimental recordings from multiple detecting electrodes with random-walk computer simulations. A second goal of the MEA was to combine benefits found in carbon fiber microelectrodes, allowing easy placement in close proximity of single cells in culture, and lithographically microfabricated planar microelectrodes, that allow for improvement in spatial resolution compared to the carbon fiber microelectrode. A practical solution in the form of a lithographically microfabricated array probe with the ability to access single adherent undisturbed chromaffin cells is presented for the first time. The MEA was microfabricated on a borosilicate glass substrate, and positioned within a few micrometers from one of the corners of the substrate to create a well-defined tip, MEA that could easily be manipulated and placed in close proximity to a single cell using micromanipulation. The MEA was designed as number of 16 band electrodes arranged in two parallel rows within a 20x25 µm area, comparable in size to the chromaffin cells (ø15-20 µm) used in these experiments. The much smaller distances between the electrodes in the present study (~1 µm) vs. previous ones (~5 µm) offer the potential of significantly improve accuracy in spatial resolution to monitor exocytotic release. To summarize, exocytosis in chromaffin cells was here studied by a novel kind of electrochemical imaging, notably with a spatial resolution approaching that of relevant optical methods, and with a high temporal resolution lying in the millisecond range. Hot-spots of activity were observed, with spatial distributions smaller than 120 nm. Paper IV QCM-D is a non invasive technique which can monitor changes in frequency and energy dissipation caused by alterations in elasticity, viscosity and mass, in thin films in aqueous media. A method is introduced, which can monitor cell structural responses in a population of cultured PC12 cells by QCM-D, combined with neurotransmitter detection by amperometry, and is used to characterize the processes affecting the QCM-D response when cells are stimulated to exocytosis. A key question asked relates to whether QCM-D can detect processes that are directly or indirectly related to exocytosis, some of which are in fact invisible to amperometric detection, such as endocytosis. Secretion of neurotransmitters via exocytosis is related to structural changes within cells. For instance vesicular release is associated with previous vesicle docking at the plasma membrane and subsequent pore formation catalyzed by the SNARE complex formation and dissolution, and followed by compensatory clathrin

Joakim Wigström (2015)
- 46 -
mediated endocytotic processes to recapture membrane fused at full exocytosis. Furthermore the actin cortex beneath the cell membrane has been shown to have a role in regulation of vesicle docking, depolymerizing locally around secretory vesicles approaching the cell membrane, in response to stimuli. These aspects of exocytosis, as well as other structural changes unrelated to exocytosis, may in principle be detected by QCM-D. The present results confirm a previous study,136 which demonstrated changes in QCM-D parameters in response to high K+ stimulation of PC12 and NG108-15 cell cultures, showing overlapping temporal components which were attributed to changes in mass and viscoelasticity of cells during exocytosis and subsequent endocytosis. The present work took advantage of a constant flow technique, allowing smooth solution switching (rapid application and withdrawal of high K+) without changes in temperature and thereby eliminating the need for computational cancelling of flow artifacts during solution switching. Moreover, parallel amperometric recording was used to validate the claim that cellular secretion is accompanied by changes in QCM-D parameters. This was supported by pharmacological manipulation of exocytotic output, where vesicles were expanded in size and loaded with larger amounts of dopamine or shrunk in size and lowering the dopamine content. The recorded QCM-D signal reflected the underlying exocytosis and but did not quantitatively match the changes neurotransmitter release that was detected by amperometry. In addition, a repeated stimulation with high K+ resulted in a less amount of secreted dopamine secreted, but was monitored as a larger QCM-D response. In summary, the results suggest that QCM-D does not reflect a quantitative measure of secretion as such, but closely related cellular viscoelastic changes and possibly cellular shape changes during the exocytotic stimulation.

New Electrochemical Tools to Study Exocytosis
- 47 -
9. CONCLUSIONS AND FUTURE OUTLOOK The work presented in this thesis, has a focus on creating new tools providing new ways to study exocytotic and endocytotic processes. Common to the methods is that they all, in some form, rely on amperometric detection, a fundamental analytical technique that offer a quantitative measure of secreted neurotransmitters. The scales range from detection of the content of single vesicles to the collective secretion from thousands of cells. Paper I presented the development of a novel enzyme based catalytic biosensor, capable of detecting rapid fluctuations in acetylcholine concentration. The aim of the project was to detect single vesicle release of acetylcholine. To achieve this goal a new approach in sensor design was needed to optimize the temporal resolution of the sensor, as currently existing sensor technology was too slow. The effort was put into using thin films, approaching monolayer thickness of adsorbed enzymes. Direct adsorption of enzyme onto gold nanoparticles at the electrode substrate, a material previously shown to favor high retention of enzymatic activity, due to high curvature effects, beneficial for retention of enzymatic activity, was chosen as immobilization strategy. A fast response time, in the order of a few tens of milliseconds was reported. The fast response time is likely the result of a combination of not only the thin films used, in combination with the small dimensions of the microelectrode, allowing relatively fast switching of test solutions in the artificial cell model used for testing. It seems entirely possible that even faster response than those reported here might be obtained by further speeding up solution-switching. A factor limiting the sensitivity of the sensor is the transduction of the chemical signal into an electric one, i.e. reduction of the reporter molecule H2O2. The negative electrode potential required for reduction also results in background currents from free oxygen in solution. On the other hand, using oxidation of H2O2 for detection had previously been avoided. This was both due to possible interference from other secreted substances (i.e. Catecholamine’s) and also due to the sensitivity of gold towards chloride ions at positive potentials.156 A possible route forward which would be interesting to explore, not requiring modification of the sensor design, includes the use of redox mediators that can be detected at low electric potentials. It would also be interesting to apply the same approach to target other electroinactive neurotransmitters. In Paper II, a novel method capable of determining the total catecholamine content in isolated vesicles from chromaffin cells, is described. The quantification was based on freely diffusing vesicles colliding and adsorbing to the surface of a microelectrode. The adsorption of vesicles was followed by stochastic rupture of

Joakim Wigström (2015)
- 48 -
the vesicle compartments at the surface and allowed for quantification of single vesicle content by amperometric detection of the vesicle content, released at the surface of the electrode. Comparative results from this new single vesicle quantification method to exocytosis recordings performed at chromaffin cells suggested that the amount being released during exocytosis represents a fraction (~40%) of the total content. The exact mechanism, causing the vesicle rupture, remains to be established, and will require further studies. In the current work, the fraction of the released neurotransmitter being is lost escaping detection was assumed negligible. It would be desirable to quantify this fraction, which if known, might reveal clues about the mechanism of vesicle rupture. Paper III presented a new kind of MEA probe, capable of electrochemical imaging of single vesicle exocytotic release from the upper part of adherent cells, and with a high spatial and temporal resolution. Imaging of single release events at individual chromaffin cells revealed hot-spots of exocytotic activity with a spatial distribution less than 120 nm, thus substantially smaller than the size of individual chromaffin vesicles (~250-300nm). This high spatial resolution opens up new possibilities for investigating single vesicle release, for instance (1) to study recurring release at discrete sites, previously only observed by optical imaging46,47, but now with high temporal resolution, (2) to explore the prevalence of kiss-and run exocytosis at discrete sites, or (3) to examine the effect of drugs for such events. In Paper IV a method for simultaneous QCM-D and amperometric recording was described, where the gold coated QCM cystal surface is used for electrochemical detection. The purpose was to monitor the structural responses related to exocytosis (and endocytosis) in a population of PC12 cells. The amperometric measurements provided a parallel quantitative measure of exocytotic release, that QCM-D data was be correlated with. The results suggest that QCM-D mirrored some aspect of exocytosis, but did not represent a true quantitative measure of the secreted neurotransmitter during stimulated catecholamine release. This further suggested that other contributions such as changes in the cellular foot-print at the surface of the quartz crystal or viscoelasticity within the cellular matrix also might contribute to the QCM-D signal. The presented method relies on an automated, flow system, allowing swift switching between solutions (i.e. stimulation solution and buffer solution), while avoiding artifacts related to variation in flow rate or temperature. This represents a considerable improvement to manual switching with its associated artifacts, and slow transition times. Photostimulation is a potentially much faster fast method to induce exocytosis in cells, compared with chemical stimulation, and might be employed in future work. In fact, two photostimulation approaches have already

New Electrochemical Tools to Study Exocytosis
- 49 -
been attempted. The first approach was based on using PC12 cells transfected with channelrhodopsin, which is a light-gated ion channel. When exited by blue light (460 nm) these allow cations to cross the cell membrane, resulting in very fast membrane depolarization and influx of calcium, triggering exocytosis.157 The other approach relied on flash photolysis to activate Ca2+ caged by NP-EGTA as previously reported, using a high power ultra violet LED.158 Previous to light stimulation cells where incubated with NP-EGTA, which accumulate in the cells where they cage Ca2+. Upon illumination (300-380nm),159 the cage is cleaved, resulting in free Ca2+, triggering exocytosis. Unfortunately, to date, both approaches were unsuccessful and further optimization of protocols would be needed to make them work, allowing improvement in rapid stimulation. Several techniques already exist to study processes related to exocytosis and endocytosis from different angles. However, they all have their strengths and weaknesses, and there is no such thing as one tool, which will give us all the answers. Therefore, development of new techniques are essential in driving future discoveries. The new methods presented herein represent new ways to study exocytotic processes, and have already provided valuable insights. The methods will hopefully contribute to a deeper understanding of chemical signaling between biological cells, in the nervous system as well as elsewhere.

Joakim Wigström (2015)
- 50 -
New Electrochemical Tools to Study Exocytosis
- 51 -
10. ACKNOWLEDGEMENTS Looking back over the six years I spent here at Chalmers as a PhD student, I must say that it been quite an adventure, with many valuable experiences and so much learnt! I would like to thank all you people who made it possible. First of all, I thank Ann-Sofie Cans, my supervisor, for giving me this opportunity and for introducing me into the fascinating world of exocytosis, for the valuable discussions, and for always being supportive, inspiring and enthusiastic. I also thank Bengt Nordén, for co-supervising my efforts and for being my examiner. I thank all the friends and colleagues at the Cans research group and at the Bioanalytical Center. Thank you for being so nice to work with and for your friendships and all the help during the years. And also the co-authors of the papers. Without you there would be none. The people at the department of Chemical and Biological Engineering and at Analytical and Marine Chemistry at Gothenburg University, for friendliness, help and discussions. The staff at the MC2 facilities, for your support. And my friends, outside of Chalmers, for being there, and for being who you are. My parents Annikki and Holger and my brothers Oskar and Mats, for all your support and love over the years. Holger (again), for reading my manuscripts and for all the science discussions. To my family, Anna and Edith, I Love you. J

Joakim Wigström (2015)
- 52 -

New Electrochemical Tools to Study Exocytosis
- 53 -
11. REFERENCES 1. Azevedo, F. A. C. et al. Equal numbers of neuronal and nonneuronal cells make the
human brain an isometrically scaled-up primate brain. J. Comp. Neurol. 513, 532–41 (2009).
2. Stevens, D. R., Schirra, C., Becherer, U. & Rettig, J. Vesicle pools: lessons from adrenal chromaffin cells. Front. Synaptic Neurosci. 3, 2 (2011).
3. Westerink, R. H. S. & Ewing, A. G. The PC12 cell as model for neurosecretion. Acta Physiol 192, 273–285 (2009).
4. Siegel, G. ., Agranoff, B. W., Albers, R. W. & Molinoff, P. B. Basic Neurochemistry. (1994).
5. Mason, P. Medical Neurobiology. (Oxford University Press, 2011).
6. Ting, J. T. & Phillips, P. E. M. Neurotransmitter: Release. WILEY Encycl. Chem. Biol. 1–12 (2008). doi:10.1002/9780470048672.wecb385
7. Starke, K. et al. Neurotransmitter Release. 184, (2008).
8. Bonanomi, D., Benfenati, F. & Valtorta, F. Protein sorting in the synaptic vesicle life cycle. Prog. Neurobiol. 80, 177–217 (2006).
9. Sudhof, T. C. The synaptic vesicle cycle. Annu. Rev. Neurosci. 27, 509–47 (2004).
10. Winkler, H. The adrenal chromaffin granule: a model for large dense vesicles of endocrine and nervous tissue. J. Anat. 183, 237–252 (1993).
11. Michael, D. J., Cai, H., Xiong, W., Ouyang, J. & Chow, R. H. Mechanisms of peptide hormone secretion. Trends Endocrinol. Metab. 17, 408–15 (2006).
12. Von Bohlen und Halbach, O. & Dermietzel, R. Neurotransmitters and Neuromodulators: Handbook of Receptors and Biological Effects. (Wiley-VCH, 2001).
13. Bergeron, A., Pucci, L., Bezzi, P. & Regazzi, R. Analysis of synaptic-like microvesicle exocytosis of B-cells using a live imaging technique. PLoS One 9, e87758 (2014).
14. Francisco, C. S. Biogenesis of Synaptic Vesicle-like Structures in a Pheochromocytoma Cell Line PC-12. J. Cell Biol. 110, 1693–1703 (1990).
15. Gammelsaeter, R. et al. Glycine, GABA and their transporters in pancreatic islets of Langerhans: evidence for a paracrine transmitter interplay. J. Cell Sci. 117, 3749–3758 (2004).

Joakim Wigström (2015)
- 54 -
16. Zhou, W., Zhu, D., Liang, T., Li, C. & Wu, Z. Characterization of docking and fusion of synaptic-like microvesicles in PC12 cells using TIRFM. Chinese Sci. Bull. 52, 3089–3096 (2007).
17. Morfi, G. A., Burns, M. R., Stenoien, D. L. & Brady, S. T. in Basic Neurochemistry, Eighth Edition 146–164 (2012). doi:10.1016/B978-0-12-374947-5.00008-0
18. Südhof, T. C. & Rizo, J. Synaptic vesicle exocytosis. Cold Spring Harb. Perspect. Biol. 3, (2011).
19. Harata, N. C., Aravanis, A. M. & Tsien, R. W. Kiss-and-run and full-collapse fusion as modes of exo-endocytosis in neurosecretion. J. Neurochem. 97, 1546–1570 (2006).
20. Südhof, T. C. & Rothman, J. E. Membrane Fusion: Grappling with SNARE and SM Proteins Thomas. Science (80-. ). 323, 474–477 (2009).
21. De Wit, H., Cornelisse, L. N., Toonen, R. F. G. & Verhage, M. Docking of secretory vesicles is syntaxin dependent. PLoS One 1, e126 (2006).
22. Porat-Shliom, N., Milberg, O., Masedunskas, A. & Weigert, R. Multiple roles for the actin cytoskeleton during regulated exocytosis. Cell. Mol. Life Sci. 70, 2099–121 (2013).
23. Südhof, T. C. Calcium Control of Neurotransmitter Release. Cold Spring Harb Perspect Biol. 1–15 (2012).
24. Doherty, G. J. & McMahon, H. T. Mechanisms of endocytosis. Annu. Rev. Biochem. 78, 857–902 (2009).
25. Gundelfinger, E. D., Kessels, M. M. & Qualmann, B. Temporal and spatial coordination of exocytosis and endocytosis. Nat. Rev. Mol. Cell Biol. 4, 127–139 (2003).
26. Nankoe, S. R. & Sever, S. Dynasore puts a new spin on dynamin: a surprising dual role during vesicle formation. Trends Cell Biol. 16, 607–9 (2006).
27. Fredriksson, C., Kihlman, S., Rodahl, M. & Kasemo, B. The Piezoelectric Quartz Crystal Mass and Dissipation Sensor: A Means of Studying Cell Adhesion. Langmuir 7463, 248–251 (1998).
28. Sever, S., Chang, J. & Gu, C. Dynamin rings: not just for fission. Traffic 14, 1194–9 (2013).
29. Smith, S. M., Renden, R. & von Gersdorff, H. Synaptic vesicle endocytosis: fast and slow modes of membrane retrieval. Trends Neurosci. 31, 559–68 (2008).
30. Watanabe, S. et al. Clathrin regenerates synaptic vesicles from endosomes. Nature 515, 228–33 (2014).

New Electrochemical Tools to Study Exocytosis
- 55 -
31. Watanabe, S. et al. Ultrafast endocytosis at Caenorhabditis elegans neuromuscular junctions. Elife 2, e00723 (2013).
32. Watanabe, S. et al. Ultrafast endocytosis at mouse hippocampal synapses. Nature 504, 242–7 (2013).
33. Cousin, M. A. Activity-Dependent Bulk Synaptic Vesicle Endocytosis - a Fast , High Capacity Membrane Retrieval Mechanism. Mol Neurobiol 39, 185–189 (2010).
34. Clayton, E. L., Evans, G. J. O. & Cousin, M. A. Bulk Synaptic Vesicle Endocytosis Is Rapidly Triggered during Strong Stimulation. J Neurosci. 28, 6627–6632 (2008).
35. Ryugo, D. K. & Spirou, G. A. Auditory System: Giant Synaptic Terminals , Endbulbs , and Calyces. Encycl. Neurosci. 1, 759–770 (2009).
36. Dresbach, T., Qualmann, B., Kessels, M. M., Garner, C. C. & Gundelfinger, E. D. The presynaptic cytomatrix of brain synapses. Cell. Mol. Life Sci. 58, 94–116 (2001).
37. Fejtova, A. Molecular Organization and Assembly of the Presynaptic Active Zone of Neurotransmitter Release. (2006).
38. Schoch, S. & Gundelfinger, E. D. Molecular organization of the presynaptic active zone. Cell Tissue Res. 326, 379–91 (2006).
39. Kavalali, E. T. & Jorgensen, E. M. Visualizing presynaptic function. Nat. Neurosci. 17, 10–6 (2014).
40. Schikorski, T. & Stevens, C. F. Morphological correlates of functionally defined synaptic vesicle populations. Nat. Neurosci. 4, 391–395 (2001).
41. Xue, L. et al. Most vesicles in a central nerve terminal participate in recycling. J Neurosci. 33, 8820–8826 (2013).
42. Schroeder, T. J., Jankowski, J. A., Senyshyn, J., Holz, R. W. & Wightman, R. M. Zones of exocytotic release on bovine adrenal medullary cells in culture. J. Biol. Chem. 269, 17215–20 (1994).
43. Zhang, B. et al. Spatially and Temporally Resolved Single-Cell Exocytosis Utilizing Individually Addressable Carbon Microelectrode Arrays. Anal Chem. 80, 1394–1400 (2009).
44. Gosso, S. et al. Heterogeneous distribution of exocytotic microdomains in adrenal chromaffin cells resolved by high-density diamond ultra-microelectrode arrays. J Physiol. 592, 3215–3230 (2014).
45. Carmichael, S. . Morphology and innervation of the adrenal medulla. Stimul. Secret. Coupling Chromaffin Cells 1, 2–29 (1987).

Joakim Wigström (2015)
- 56 -
46. Allersma, M. W., Wang, L., Axelrod, D. & Holz, R. W. Visualization of Regulated Exocytosis with a Granule- Membrane Probe Using Total Internal Reflection Microscopy. Mol. Biol. Cell 15, 4658–4668 (2004).
47. Yuan, T., Lu, J., Zhang, J., Zhang, Y. & Chen, L. Spatiotemporal Detection and Analysis of Exocytosis Reveal Fusion “‘ Hotspots ’” Organized by the Cytoskeleton in Endocrine Cells. Biophysj 108, 251–260 (2015).
48. Qian, W. & Kennedy, R. T. Spatial Organization of Ca2+ Entry and Exocytosis in Mouse Pancreatic B-Cells. Biochem. Biophys. Res. Commun. 321, 315–321 (2001).
49. Duncan, R. R. et al. Functional and spatial segregation of secretory vesicle pools according to vesicle age. Nat. Lett. 422, 1–5 (2003).
50. Macdonald, P. E. & Rorsman, P. The Ins and Outs of Secretion from Pancreatic B-Cells: Control of Single-Vesicle Exo- and Endocytosis. 113–121 (2007).
51. Salbreux, G., Charras, G. & Paluch, E. Actin cortex mechanics and cellular morphogenesis. Trends Cell Biol. 22, 536–45 (2012).
52. Schiavo, G. et al. Neurotoxins Affecting Neuroexocytosis. Physiol. Rev. 80, 717–766 (2000).
53. Spector, I., Braet, F., Shochet, N. R. & Bubb, M. R. New Anti-Actin Drugs in the Study of the Organization and Function of the Actin Cytoskeleton. Microsc. Res. Tech. 37, 18–37 (1999).
54. Obberghen, E. V. A. N. et al. Dynamics of Insulin Release and Microtubular-Microfilamentous System. J. Clin. Invest. 52, 1041–1051 (1973).
55. Gil, A., Rueda, J., Viniegra, S. & Gutiérrez, L. . The F-actin cytoskeleton modulates slow secretory components rather than readily releasable vesicle pools in bovine chromaffin cells. Neuroscience 98, 605–614 (2000).
56. Pendleton, A. & Koffer, A. Effects of Latrunculin Reveal Requirements for the Actin Cytoskeleton During Secretion From Mast Cells. Cell Motil. Cytoskeleton 48, 37–51 (2001).
57. Gutiérrez, L. M. in International review of cell and molecular biology 295, 109–137 (2012).
58. Papadopulos, A., Tomatis, V. M., Kasula, R. & Meunier, F. a. The cortical acto-Myosin network: from diffusion barrier to functional gateway in the transport of neurosecretory vesicles to the plasma membrane. Front. Endocrinol. (Lausanne). 4, 153 (2013).
59. Rizzoli, S. O. & Jahn, R. Kiss-and-run, collapse and “readily retrievable” vesicles. Traffic 8, 1137–44 (2007).

New Electrochemical Tools to Study Exocytosis
- 57 -
60. Alabi, A. A. & Tsien, R. W. Perspectives on kiss-and-run: role in exocytosis, endocytosis, and neurotransmission. Annu. Rev. Physiol. 75, 393–422 (2013).
61. Shi, L. et al. SNARE Proteins: One to Fuse and Three to Keep the Nascent Fusion Pore Open. Science (80-. ). 335, 1355–1359 (2013).
62. Basha, C. A. & Rajendran, L. Theories of Ultramicrodisc Electrodes: Review article. 1, 268–282 (2006).
63. Bard, A. J., Faulkner, L. R., Swain, E. & Robey, C. Fundamentals and Applications. (2001).
64. Fick, A. Über Diffusion. Poggendorff’s Ann. der Phys. und Chemie, 94 94, 59–86 (1855).
65. Cottrell, F. G. No Title. Z. Phys. Chem. 42, 385 (1903).
66. Shoup, D. & Szabo, A. No Title. J Electroanal Chem Interfacial Electrochem 140, 237–245 (1982).
67. Michael, A. C. & Borland, L. M. Electrochemical Methods for Neuroscience. (2006).
68. Dressman, S. F., Peters, J. L. & Michael, A. C. Carbon fiber microelectrodes with multiple sensing elements for in vivo voltammetry. J. Neurosci. Methods 119, 75–81 (2002).
69. Bement, S. L., Wise, K. D., Anderson, D. J., Najafi, K. & Drake, K. L. Solid-State Electrodes for Multichannel Multiplexed Intracortical Neuronal Recording. IEEE Trans Biomed Eng 230–241 (1986).
70. Burmeister, J. J., Moxon, K. & Gerhardt, G. A. Ceramic-Based Multisite Microelectrodes for Electrochemical Recordings. Anal. Chem. 72, 187–192 (2000).
71. Wilson, G. S. & Gifford, R. Biosensors for real-time in vivo measurements. Biosens. Bioelectron. 20, 2388–403 (2005).
72. Heitner-wirguin, C. Recent advances in perfluorinated ionomer membranes: structure , properties and applications. 120, 1–33 (1996).
73. Venton, B. J., Troyer, K. P. & Wightman, R. M. Response Times of Carbon Fiber Microelectrodes to Dynamic Changes in Catecholamine Concentration. Anal. Chem. 74, 539–546 (2002).
74. Burmeister, J. J. et al. Ceramic-based multisite microelectrode arrays for simultaneous measures of choline and acetylcholine in CNS. Biosens. Bioelectron. 23, 1382–9 (2008).
75. Majdi, S. et al. Electrochemical Measurements of Optogenetically Stimulated Quantal Amine Release from Single Nerve Cell Varicosities in Drosophila Larvae. Angew. Chem. Int. Ed. Engl. 1–5 (2015). doi:10.1002/anie.201506743

Joakim Wigström (2015)
- 58 -
76. Mosharov, E. V & Sulzer, D. Analysis of exocytotic events recorded by amperometry. Nat. Methods 2, 651–658 (2005).
77. Chen, T. K., Luo, G. & Ewlng, A. Amperometric Monitoring of Stimulated Catecholamine Release from Rat Pheochromocytoma ( PC12 ) Cells at the Zeptomole Level. Anal. Chem. 3031–3035 (1994).
78. Hochstetler, S. E., Puopolo, M., Gustincich, S., Raviola, E. & Wightman, R. M. Real-Time Amperometric Measurements of Zeptomole Quantities of Dopamine Released from Neurons. Anal. Chem. 72, 489–496 (2000).
79. Omiatek, D. M., Cans, A.-S., Heien, M. L. & Ewing, A. G. Analytical approaches to investigate transmitter content and release from single secretory vesicles. Anal. Bioanal. Chem. 397, 3269–79 (2010).
80. Schroeder, T. J. et al. Temporally resolved, independent stages of individual exocytotic secretion events. Biophys. J. 70, 1061–8 (1996).
81. Mellander, L. J., Trouillon, R., Svensson, M. I. & Ewing, A. G. Amperometric post spike feet reveal most exocytosis is via extended kiss-and-run fusion. Sci. Rep. 2, 907 (2012).
82. Staal, R. G. W., Mosharov, E. V & Sulzer, D. Dopamine neurons release transmitter via a flickering fusion pore. Nat. Neurosci. 7, 341–346 (2004).
83. Amatore, C., Oleinick, A. I. & Svir, I. Reconstruction of aperture functions during full fusion in vesicular exocytosis of neurotransmitters. Chemphyschem 11, 159–74 (2010).
84. Omiatek, D. M., Dong, Y., Heien, M. L. & Ewing, A. G. Only a Fraction of Quantal Content is Released During Exocytosis as Revealed by Electrochemical Cytometry of Secretory Vesicles. ACS Chem. Neurosci. 1, 234–245 (2010).
85. Wang, J., Dunevall, J. & Ewing, A. G. Spatial Resolution of Single-Cell Exocytosis by Microwell-Based Individually Addressable Thin Film Ultramicroelectrode Arrays. Anal Chem. 86, 4515−4520 (2014).
86. Hafez, I. et al. Electrochemical imaging of fusion pore openings by electrochemical detector arrays. PNAS 102, 13879–13884 (2005).
87. Clark, L. C. & Lyons, C. Electrode Systems for Continuous Monitoring in Cardiovascular Surgey. Ann. N. Y. Acad. Sci. 102, 29–45 (1962).
88. Guilbault, G. G. & Lubrano, G. J. An Enzyme Electrode for the Amperometric Determination of Glucose. Anal. Chim. Acta 64, 439–455 (1973).
89. Wang, J. Electrochemical Glucose Biosensors. Chem. Rev. 108, 814–825 (2008).
90. Grieshaber, D., MacKenzie, R., Vörös, J. & Reimhult, E. Electrochemical Biosensors - Sensor Principles and Architectures. Sensors 8, 1400–1458 (2008).

New Electrochemical Tools to Study Exocytosis
- 59 -
91. Heller, A. Electrical Connection of Enzyme Redox Centers to Electrodes Abstract. J. Phys. Chem 96, 3579–3587 (1992).
92. Ronkainen, N. J., Halsall, H. B. & Heineman, W. R. Electrochemical biosensors. Chem. Soc. Rev. 39, 1747–63 (2010).
93. Harper, A. & Anderson, M. R. Electrochemical glucose sensors--developments using electrostatic assembly and carbon nanotubes for biosensor construction. Sensors 10, 8248–74 (2010).
94. Mao, F., Mano, N. & Heller, A. Long Tethers Binding Redox Centers to Polymer Backbones Enhance Electron Transport in Enzyme “ Wiring ” Hydrogels. J. Am. Chem. Soc. 125, 4951–4957 (2003).
95. Gregg, B. A. & Heller, A. Cross-Linked Redox Gels Containing Glucose Oxidase for Amperometric Biosensor Applications. Anal. Chem 62, 258–263 (1990).
96. Katz, E., Heleg-shabtai, V., Willner, B. & Biickmann, A. F. Electrical contact of redox enzymes with electrodes: novel approaches for amperometric biosensors. Bioelectrochemistry Bioenerg. 42, 95–104 (1997).
97. Schuhmann, W., Ohara, T. J., Schmidt, H.-L. & Heller, A. Electron Transfer between Glucose Oxidase and Electrodes via Redox Mediators Bound with Flexible Chains to the Enzyme Surface. J. Am. Chem. Soc. 113, 1394–1397 (1991).
98. Degani, Y. & Heller, A. Direct Electrical Communication between Chemically Modified Enzymes and Metal Electrodes. J. Phys. Chem. 91, (1987).
99. Patolsky, F., Weizmann, Y. & Willner, I. Long-range electrical contacting of redox enzymes by SWCNT connectors. Angew. Chem. Int. Ed. 43, 2113–7 (2004).
100. Sakr, O. S. & Borchard, G. Encapsulation of Enzymes in Layer-by-Layer ( LbL ) Structures: Latest Advances and Applications. (2013).
101. Sharma, S. K., Sehgal, N. & Kumar, A. Biomolecules for development of biosensors and their applications. Curr. Appl. Phys. 3, 307–316 (2003).
102. Immobilization of enzymes and cells. (Humana Press Inc., 1997).
103. Sassolas, A., Blum, L. J. & Leca-Bouvier, B. D. Immobilization strategies to develop enzymatic biosensors. Biotechnol. Adv. 30, 489–511 (2012).
104. Park, B.-W., Yoon, D.-Y. & Kim, D.-S. Recent progress in bio-sensing techniques with encapsulated enzymes. Biosens. Bioelectron. 26, 1–10 (2010).
105. Gupta, R. & Chaudhury, N. K. Entrapment of biomolecules in sol-gel matrix for applications in biosensors: problems and future prospects. Biosens. Bioelectron. 22, 2387–99 (2007).

Joakim Wigström (2015)
- 60 -
106. Graça, J. S., Oliveira, R. F. De, Moraes, M. L. De & Ferreira, M. Amperometric glucose biosensor based on layer-by-layer films of microperoxidase-11 and liposome-encapsulated glucose oxidase. Bioelectrochemistry 96, 37–42 (2015).
107. Hermanson, G. T. Bioconjugate Techniques (Second Edition). (2008).
108. Torres, R. Glutaraldehyde in bio-catalysts design: a useful crosslinker and a versatile tool in enzyme immobilization. RSC Adv. 4, 1583–1600 (2014).
109. Keighron, J. D. & Keating, C. D. Enzyme:nanoparticle bioconjugates with two sequential enzymes: stoichiometry and activity of malate dehydrogenase and citrate synthase on Au nanoparticles. Langmuir 26, 18992–9000 (2010).
110. Gagner, J. E., Lopez, M. D., Dordick, J. S. & Siegel, R. W. Effect of gold nanoparticle morphology on adsorbed protein structure and function. Biomaterials 32, 7241–52 (2011).
111. Vertegel, A. A., Siegel, R. W. & Dordick, J. S. Silica Nanoparticle Size Influences the Structure and Enzymatic Activity of Adsorbed Lysozyme. Langmuir 20, 6800–6807 (2004).
112. Burmeister, J. J. & Gerhardt, G. A. Microelectrodes for the Detection and Elimination of Interferences from the Measurement of L -Glutamate and Other Analytes. Anal. Chem. 73, 1037–1042 (2001).
113. Hugo, V. et al. An Update of the Classical and Novel Methods Used for Measuring Fast Neurotransmitters During Normal and Brain Altered Function. Curr Neuropharmacol. 12, 490–508 (2014).
114. Burmeister, J. J., Palmer, M. & Gerhardt, G. a. L-lactate measures in brain tissue with ceramic-based multisite microelectrodes. Biosens. Bioelectron. 20, 1772–9 (2005).
115. Bruno, J. P. et al. Second-by-second measurement of acetylcholine release in prefrontal cortex. Eur. J. Neurosci. 24, 2749–57 (2006).
116. Hascup, K. N., Hascup, E. R., Pomerleau, F., Huettl, P. & Gerhardt, G. A. Second-by-Second Measures of L -Glutamate in the Prefrontal Cortex and Striatum of Freely Moving Mice. J Pharmacol Exp Ther 324, 725–731 (2008).
117. Xi, J., Chen, J. Y., Garcia, M. P. & Penn, L. S. Quartz Crystal Microbalance in Cell Biology Studies. Biochips & Tissue Chips S5, 1–9 (2013).
118. Heitmann, V., Reiß, B. & Wegener, J. The Quartz Crystal Microbalance in Cell Biology: Basics and Applications. Chem Sens Biosens 5, 303–338 (2007).
119. Marx, K. A. Quartz Crystal Microbalance: A Useful Tool for Studying Thin Polymer Films and Complex Biomolecular Systems at the Solution - Surface Interface. Biomacromolecules 4, 1099–1120 (2003).

New Electrochemical Tools to Study Exocytosis
- 61 -
120. Sauerbrey Günter. Verwendung von Schwingquarzen zur Wägung dünner Schichten und zur Mikrowägung. Zeitschrift für Phys. 155, 206–222 (1959).
121. Rodahl, M. Qn the frequency and Q factor response of the quartz crystal microbalance to liquid overlayers. (Chalmers University of Technology, 1995).
122. Resa, P., Castro, P., Rodríguez-López, J. & Elvira, L. Broadband spike excitation method for in-liquid QCM sensors. Sensors Actuators, B Chem. 166-167, 275–280 (2012).
123. Zhang, Y., Du, B., Chen, X. & Ma, H. Convergence of Dissipation and Impedance Analysis of Quartz Crystal Microbalance Studies. Anal. Chem. 81, 642–648 (2009).
124. Kanazawa, K. K. & Gordon II, J. G. The oscillation frequency of a quartz resonator in contact with liquid. Anal. Chim. Acta 175, 99–105 (1985).
125. Johannsmann, D. Modeling of QCM Data.
126. Ferreira, G. N. M., da-Silva, A.-C. & Tomé, B. Acoustic wave biosensors: physical models and biological applications of quartz crystal microbalance. Trends Biotechnol. 27, 689–97 (2009).
127. Voinova, M. V, Rodahl, M., Jonson, M. & Kasemo, B. Viscoelastic Acoustic Response of Layered Polymer Films at Fluid-Solid Interfaces: Continuum Mechanics Approach. Phys. Scripta. 59, 391–396 (1999).
128. Granéli, A., Edvardsson, M. & Höök, F. DNA-Based Formation of a Supported, Three-Dimensional Lipid Vesicle Matrix Probed by QCM-D and SPR. ChemPhysChem 5, 729–733 (2004).
129. Rodriguez, M. L., McGarry, P. J. & Sniadecki, N. J. Review on Cell Mechanics: Experimental and Modeling Approaches. Appl. Mech. Rev. 65, 060801 (2013).
130. Xi, J., Penn, L. S., Xi, N., Chen, J. Y. & Yang, R. in Viscoelasticity – From Theory to Biological Applications 171–186 (2012).
131. Khalili, A. A. & Ahmad, M. R. A Review of Cell Adhesion Studies for Biomedical and Biological Applications. Int. J. Mol. Sci. 16, 18149–84 (2015).
132. Tymchenko, N. et al. Reversible changes in cell morphology due to cytoskeletal rearrangements measured in real-time by QCM-D. Biointerphases 7, 1–9 (2012).
133. Fredriksson, C., Khilman, S., Kasemo, B. & Steel, D. M. In vitro real-time characterization of cell attachment and spreading. J. Mater. Sci. Mater. Med. 9, 785–8 (1998).
134. Mofrad, M. R. K. Rheology of the Cytoskeleton. Annu. Rev. Fluid Mech. 41, 433–453 (2009).

Joakim Wigström (2015)
- 62 -
135. Li, F., Wang, J. H.-C. & Wang, Q.-M. Thickness shear mode acoustic wave sensors for characterizing the viscoelastic properties of cell monolayer. Sensors Actuators B Chem. 128, 399–406 (2008).
136. Cans, A. S. et al. Measurement of the dynamics of exocytosis and vesicle retrieval at cell populations using a quartz crystal microbalance. Anal. Chem. 73, 5805–5811 (2001).
137. Henry, J. P., Darchen, F. & Cribier, S. Physical techniques for the study of exocytosis in isolated cells. Biochimie 80, 371–377 (1998).
138. Borges, R., Camacho, M. & Gillis, K. D. Measuring secretion in chromaffin cells using electrophysiological and electrochemical methods. Acta physiol 192, 173–84 (2008).
139. Lindau, M. High resolution electrophysiological techniques for the study of calcium-activated exocytosis. Biochim. Biophys. Acta 1820, 1234–1242 (2013).
140. He, L., Wu, X.-S., Mohan, R. & Wu, L.-G. Two modes of fusion pore opening revealed by cell-attached recordings at a synapse. Nature 444, 102–5 (2006).
141. Coupland, R E Weakley, B. S. Developing chromaffin tissue in the rabbit: an electron microscopic study. J. Anat. 102, 425–455 (1968).
142. Heuser, J. E. et al. Synaptic vesicle exocytosis captured by quick freezing and correlated with quantal transmitter release. J Cell Biol. 81, 275–300 (1979).
143. Heuser, J. E. Review of electron microscopic evidence favouring vesicle exocytosis as the structural basis for quantal release during synaptic. 1051–1069 (1989).
144. Keighron, J. D., Ewing, A. G. & Cans, A.-S. Analytical tools to monitor exocytosis: a focus on new fluorescent probes and methods. Analyst 137, 1755 (2012).
145. Ryan, T. A. Presynaptic imaging techniques. Curr. Opin. Neurobiol. 11, 544–549 (2001).
146. Brumback, A. C., Lieber, J. L., Angleson, J. K. & Betz, W. J. Using FM1-43 to study neuropeptide granule dynamics and exocytosis. Methods 33, 287–94 (2004).
147. Ge, S., Koseoglu, S. & Haynes, C. L. Bioanalytical tools for single-cell study of exocytosis. Anal. Bioanal. Chem. 397, 3281–304 (2010).
148. Betz, W. J., Mao, F. & Smith, C. B. Imaging exocytosis and endocytosis. Curr. Opin. Neurobiol. 6, 365–371 (1996).
149. Amatore, C., Delacotte, J., Guille-collignon, M. & Lemaître, F. microelectrode arrays. Analyst 140, 3687–3695 (2015).

New Electrochemical Tools to Study Exocytosis
- 63 -
150. Kisler, K. et al. Transparent Electrode Materials for Simultaneous Amperometric Detection of Exocytosis and Fluorescence Microscopy. J. Biomater. Nanobiotechnol. 3, 243–253 (2012).
151. Chefer, V. I., Thompson, A. C., Zapata, A. & Shippenberg, T. S. in Curr Protoc Neurosci Chapter 7 doi:10.1002/0471142301.ns0701s47.Overview
152. Keighron, J. D., Åkesson, S. & Cans, A.-S. Coimmobilization of Acetylcholinesterase and Choline Oxidase on Gold Nanoparticles: Stoichiometry, Activity, and Reaction Efficiency. Langmuir 30, 11348−11355 (2014).
153. Sun, P. & Mirkin, M. V. Electrochemistry of Individual Molecules in Zeptoliter Volumes. J. Am. Chem. Soc. 130, 8241–8250 (2008).
154. Fan, F. F. & Bard, A. J. Electrochemical Detection of Single Molecules. Science (80-. ). 267, 871–874 (1995).
155. Schulte, A. & Chow, R. H. Cylindrically Etched Carbon-Fiber Microelectrodes for Low-Noise Amperometric Recording of Cellular Secretion. Anal Chem. 70, 985–990 (1998).
156. Zachek, M. K., Hermans, A., Wightman, R. M. & Mccarty, G. S. Electrochemical Dopamine Detection: Comparing Gold and Carbon Fiber Microelectrodes using Background Subtracted Fast Scan Cyclic Voltammetry. J Electroanal Chem 614, 113–120 (2008).
157. Lin, J. Y., Lin, M. Z., Steinbach, P. & Tsien, R. Y. Characterization of engineered channelrhodopsin variants with improved properties and kinetics. Biophys. J. 96, 1803–14 (2009).
158. Bernardinelli, Y., Haeberli, C. & Chatton, J.-Y. Flash photolysis using a light emitting diode: an efficient, compact, and affordable solution. Cell Calcium 37, 565–72 (2005).
159. Ellis-Davies, G. C. R. & Barsotti, R. J. Tuning caged calcium: photolabile analogues of EGTA with improved optical and chelation properties. Cell Calcium 39, 75–83 (2006).