Embed Size (px)
DESCRIPTION
New Directions in Strategic Asset Allocation. International Conference on the Investment of Social Security Funds September 27-28, 2005 Merida, Mexico. Sudhir Rajkumar Head of Pension Asset Advisory Services World Bank Treasury [email protected]. Assets under Management. - PowerPoint PPT Presentation
Citation preview

1
September
2005
New Directions in Strategic Asset Allocation
International Conferenceon the
Investment of Social Security Funds
September 27-28, 2005Merida, Mexico
Sudhir RajkumarHead of Pension Asset Advisory Services
World Bank [email protected]
2
September
2005
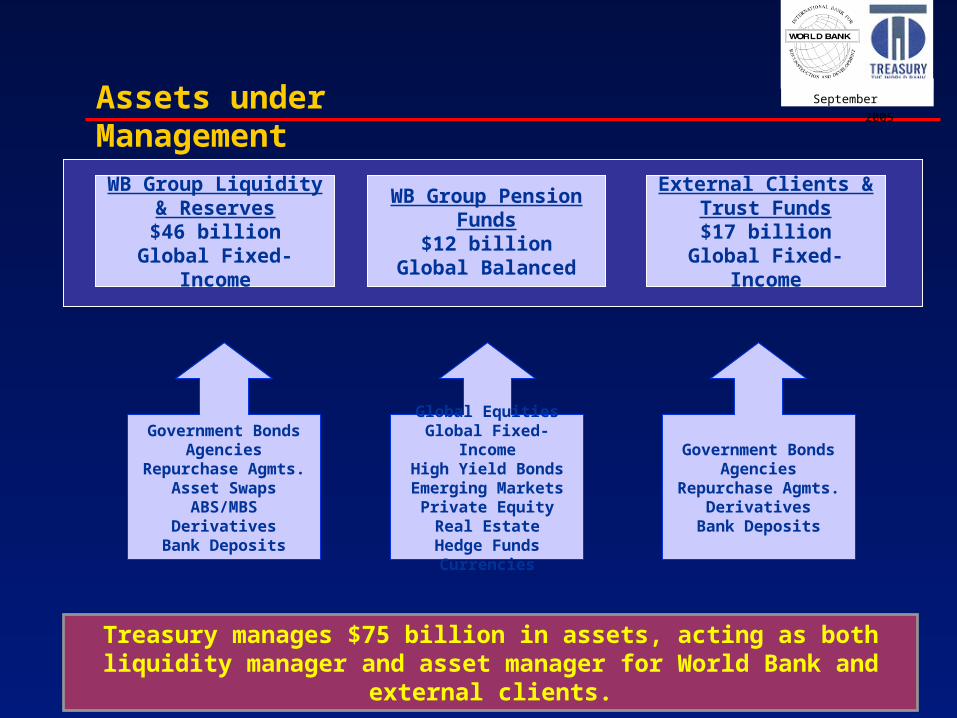
WB Group Liquidity & Reserves$46 billion
Global Fixed-Income
WB Group Pension Funds
$12 billionGlobal Balanced
External Clients & Trust Funds$17 billion
Global Fixed-Income
Government BondsAgencies
Repurchase Agmts.Asset Swaps
ABS/MBSDerivatives
Bank Deposits
Global EquitiesGlobal Fixed-Income
High Yield BondsEmerging Markets
Private EquityReal Estate
Hedge FundsCurrencies
Government BondsAgencies
Repurchase Agmts.Derivatives
Bank Deposits
Assets under Management
Treasury manages $75 billion in assets, acting as both liquidity manager and asset manager for World Bank and external clients.
3
September
2005
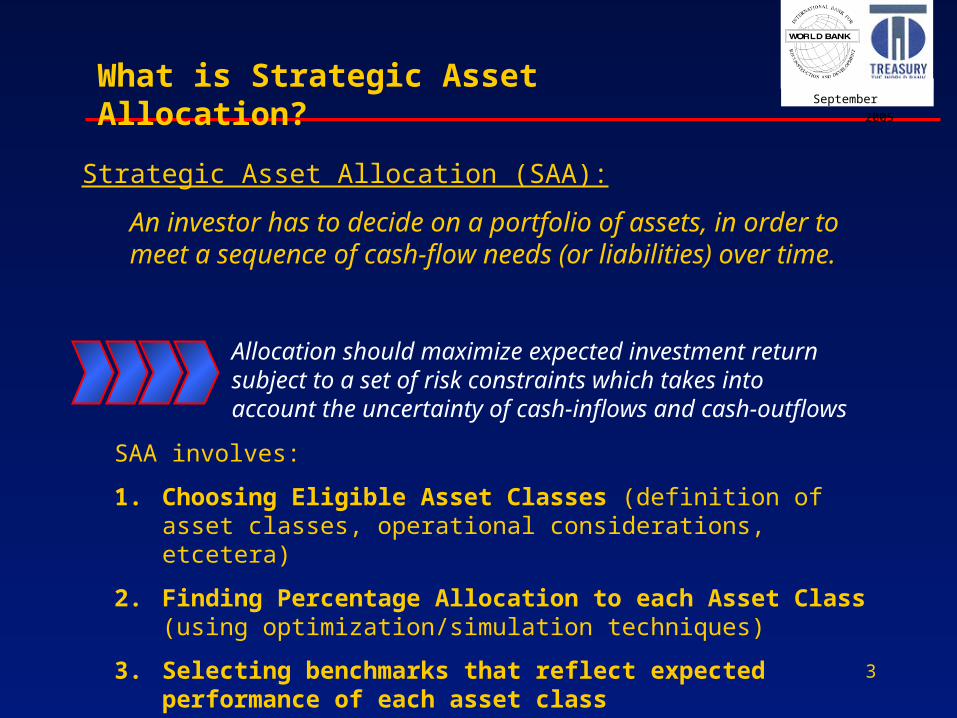
Strategic Asset Allocation (SAA):
An investor has to decide on a portfolio of assets, in order to meet a sequence of cash-flow needs (or liabilities) over time.
SAA involves:
1. Choosing Eligible Asset Classes (definition of asset classes, operational considerations, etcetera)
2. Finding Percentage Allocation to each Asset Class (using optimization/simulation techniques)
3. Selecting benchmarks that reflect expected performance of each asset class
Allocation should maximize expected investment return subject to a set of risk constraints which takes into account the uncertainty of cash-inflows and cash-outflows
What is Strategic Asset Allocation?
4
September
2005
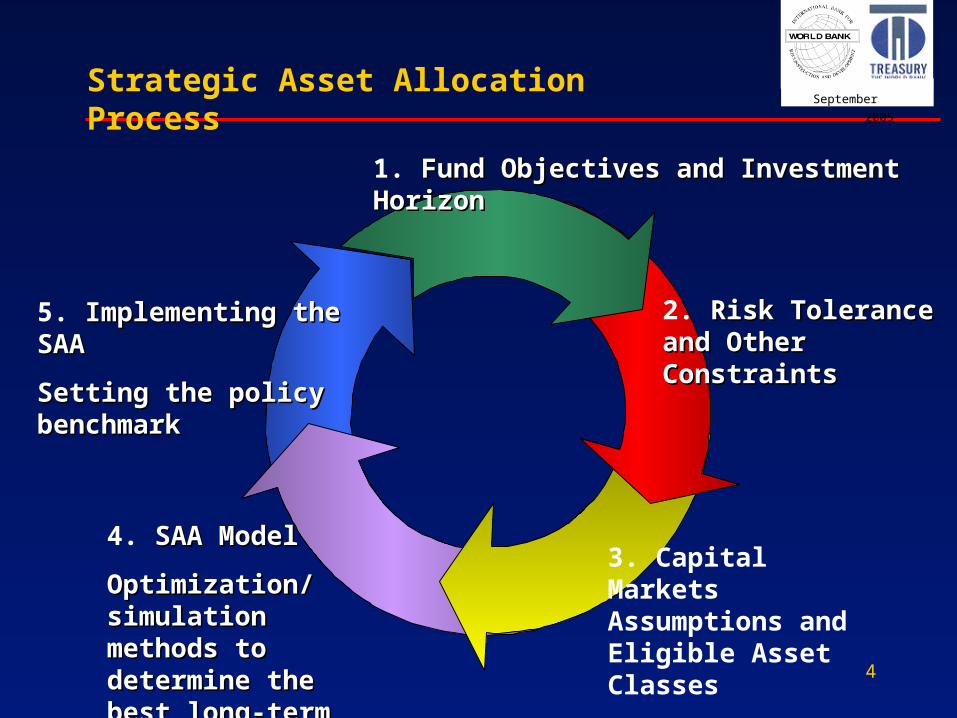
1. Fund Objectives and Investment HorizonFund Objectives and Investment Horizon
2. Risk Tolerance and Risk Tolerance and Other ConstraintsOther Constraints
3. Capital Markets Assumptions and Eligible Asset Classes
4. SAA ModelSAA Model
Optimization/Optimization/simulation simulation methods to methods to determine the determine the best long-term best long-term allocationallocation
5. Implementing the Implementing the SAASAA
Setting the policy Setting the policy benchmarkbenchmark
Strategic Asset Allocation Process
September
2005
5
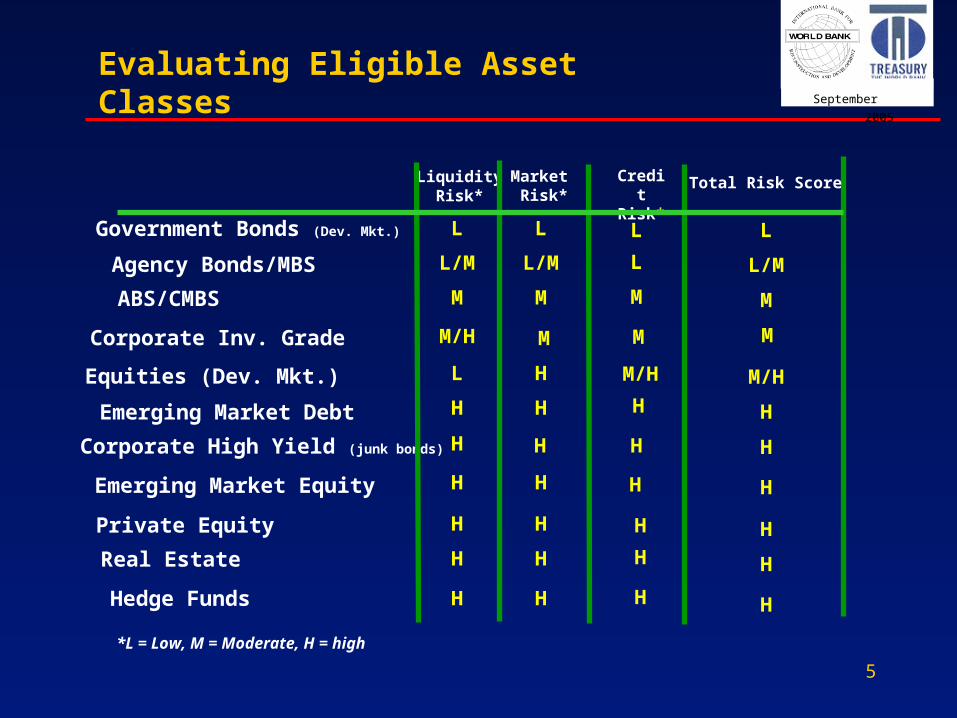
Evaluating Eligible Asset Classes
LiquidityRisk*
Corporate Inv. Grade
Agency Bonds/MBS
ABS/CMBS
Government Bonds (Dev. Mkt.)
Emerging Market Equity
Emerging Market Debt
Corporate High Yield (junk bonds)
Equities (Dev. Mkt.)
Hedge Funds
Private Equity
Real Estate
L
L/M
M
M/H
L
H
H
H
H
H
H
Market Risk*
L
L/M
M
M
H
H
H
H
H
H
Credit Risk*
Total Risk Score
L
L/M
M
M
M/H
H
H
H
H
H
H
*L = Low, M = Moderate, H = high
H
L
L
M
M
M/H
H
H
H
H
H
H
6
September
2005Fund Objectives and Risk Constraints
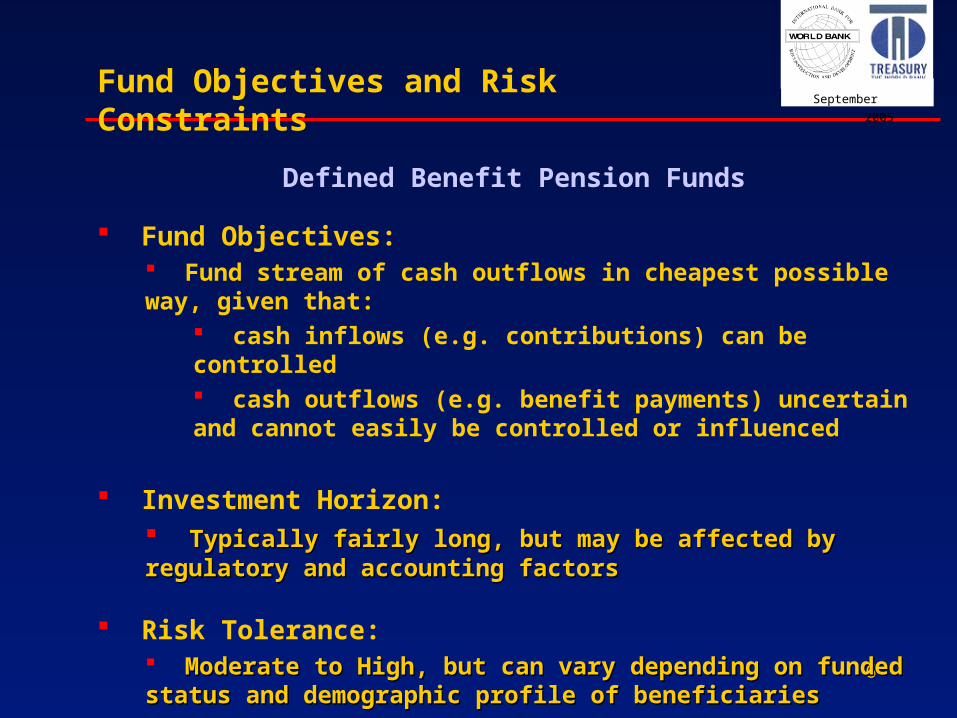
Defined Benefit Pension Funds
Fund Objectives: Fund stream of cash outflows in cheapest possible way, given that:
cash inflows (e.g. contributions) can be controlled cash outflows (e.g. benefit payments) uncertain and cannot easily be controlled or influenced
Investment Horizon: Typically fairly long, but may be affected by regulatory and Typically fairly long, but may be affected by regulatory and accounting factorsaccounting factors
Risk Tolerance:
Moderate to High, but can vary depending on funded status and Moderate to High, but can vary depending on funded status and demographic profile of beneficiariesdemographic profile of beneficiaries
7
September
2005Fund Objectives and Risk Constraints
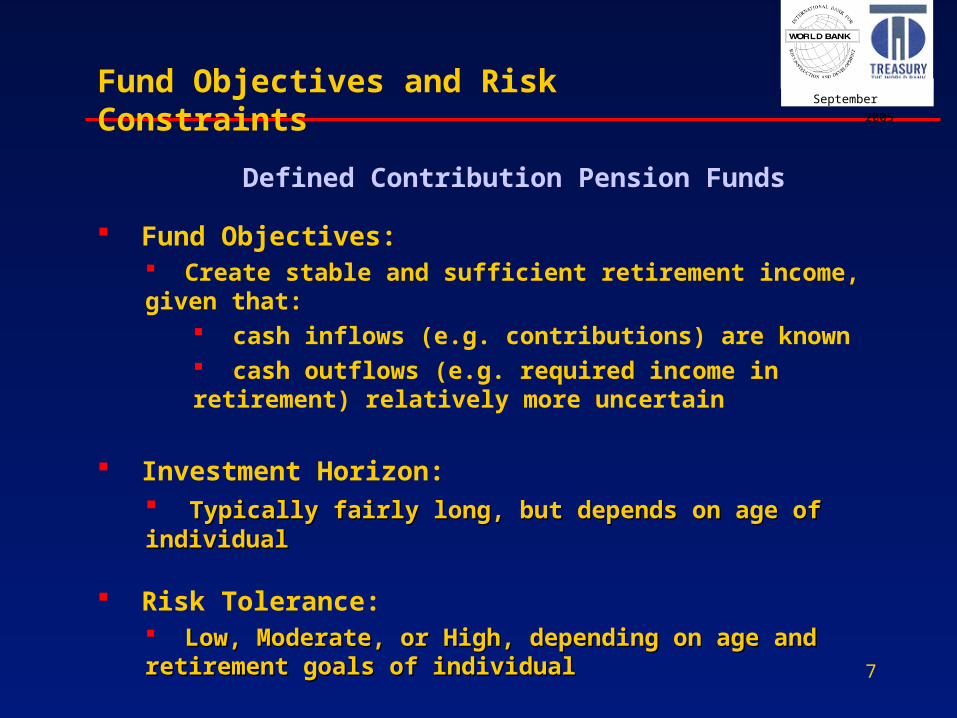
Defined Contribution Pension Funds
Fund Objectives: Create stable and sufficient retirement income, given that:
cash inflows (e.g. contributions) are known cash outflows (e.g. required income in retirement) relatively more uncertain
Investment Horizon: Typically fairly long, but depends on age of individualTypically fairly long, but depends on age of individual
Risk Tolerance:
Low, Moderate, or High, depending on age and retirement goals of Low, Moderate, or High, depending on age and retirement goals of individualindividual
8
September
2005Fund Objectives and Risk Constraints
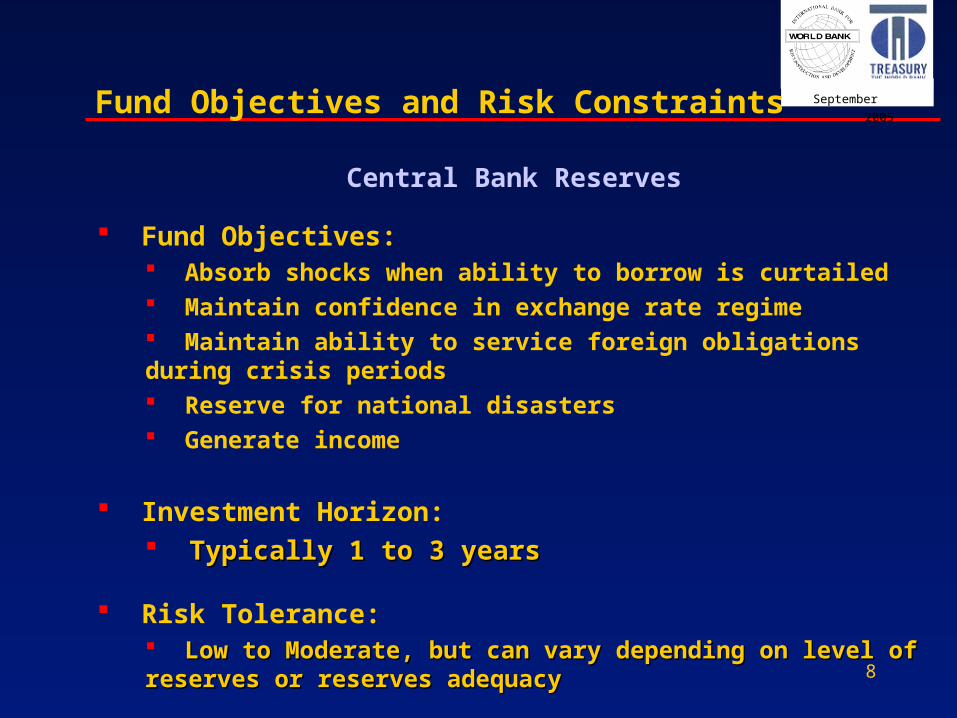
Central Bank Reserves
Fund Objectives: Absorb shocks when ability to borrow is curtailed Maintain confidence in exchange rate regime Maintain ability to service foreign obligations during crisis periods Reserve for national disasters Generate income
Investment Horizon: Typically 1 to 3 yearsTypically 1 to 3 years
Risk Tolerance:
Low to Moderate, but can vary depending on level of reserves or Low to Moderate, but can vary depending on level of reserves or reserves adequacyreserves adequacy
9
September
2005Fund Objectives and Risk Constraints
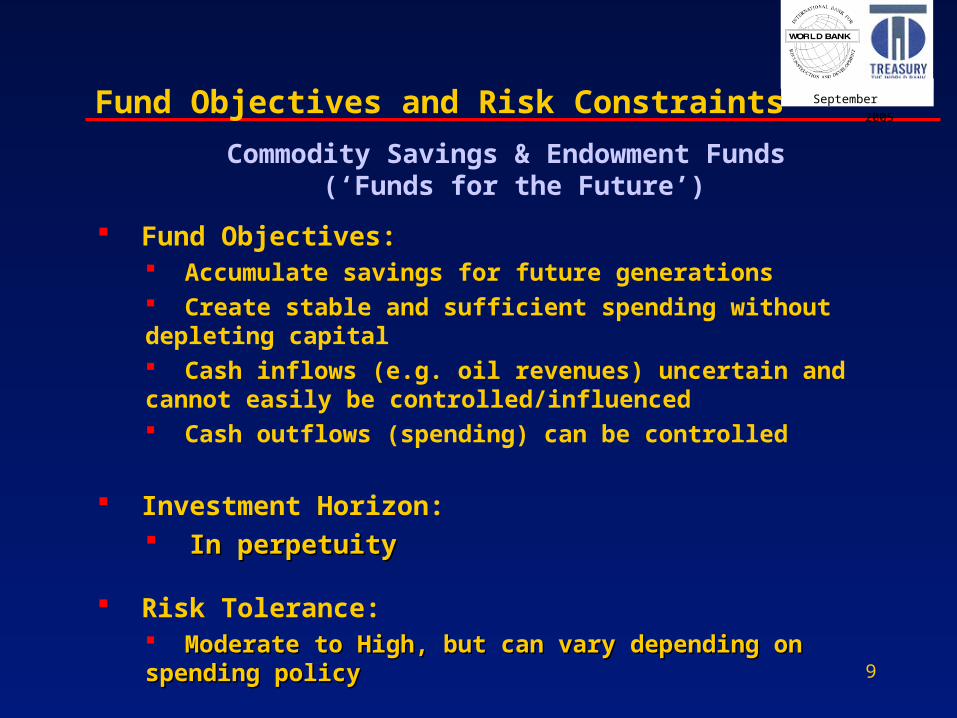
Commodity Savings & Endowment Funds (‘Funds for the Future’)
Fund Objectives: Accumulate savings for future generations Create stable and sufficient spending without depleting capital Cash inflows (e.g. oil revenues) uncertain and cannot easily be controlled/influenced Cash outflows (spending) can be controlled
Investment Horizon: In perpetuityIn perpetuity
Risk Tolerance:
Moderate to High, but can vary depending on spending policyModerate to High, but can vary depending on spending policy
10
September
2005Fund Objectives and Risk Constraints
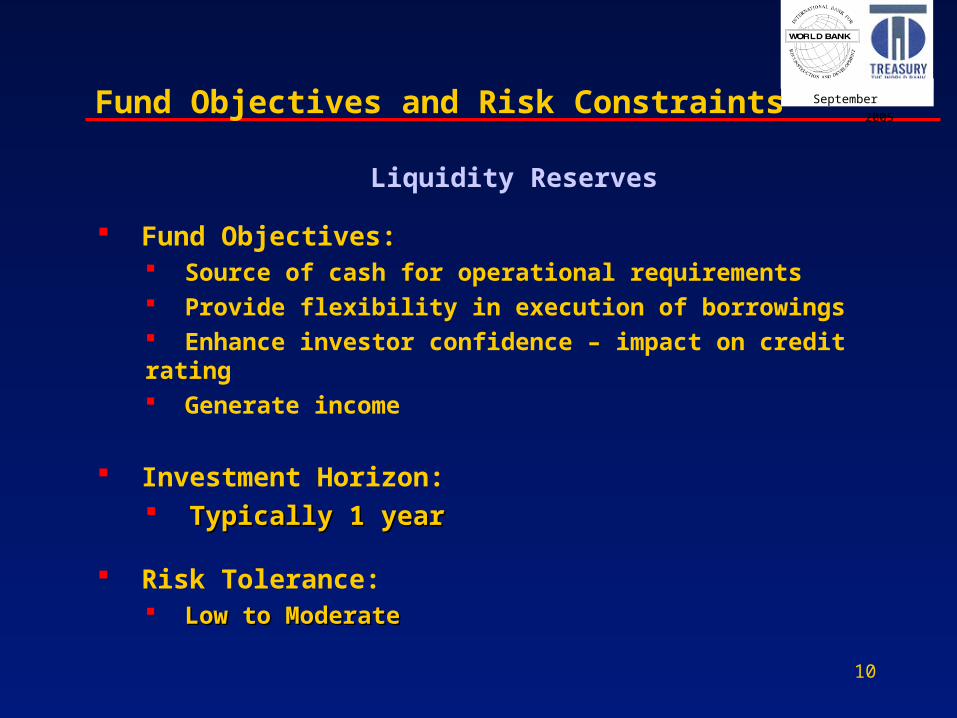
Liquidity Reserves
Fund Objectives: Source of cash for operational requirements Provide flexibility in execution of borrowings Enhance investor confidence – impact on credit rating Generate income
Investment Horizon: Typically 1 yearTypically 1 year
Risk Tolerance:
Low to ModerateLow to Moderate

11
September
2005
Exp
ecte
d T
otal
Ret
urn
Risk (e.g. duration or volatility)
Efficient Frontier
Optimal PortfolioModerate Investor
Optimal PortfolioAggressive Investor
Acce
pta
ble
Le
vel o
f Risk:
Ag
gressive
Investor
Acce
pta
ble
Le
vel o
f Risk:
Mo
de
rate
Inve
stor
Trading-Off Risk and Reward
Efficient frontier: set of portfolios which have the highest possible expected total return for a given risk level.
12
September
2005Traditional Approach to SAA
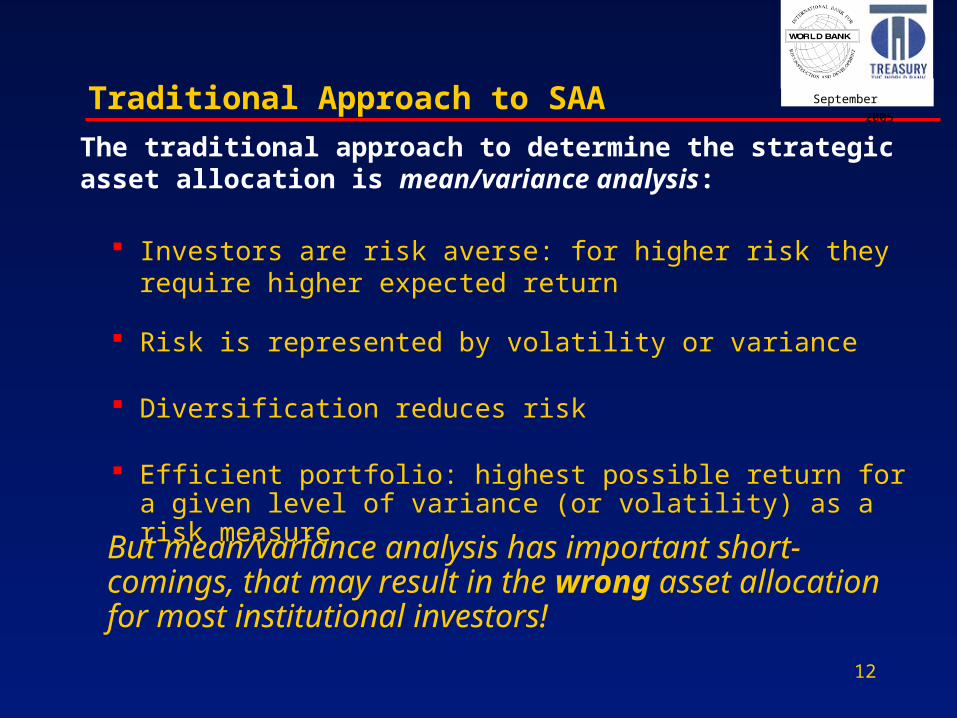
Investors are risk averse: for higher risk they require higher expected return
Risk is represented by volatility or variance
Diversification reduces risk
Efficient portfolio: highest possible return for a given level of variance (or volatility) as a risk measure
The traditional approach to determine the strategic asset allocation is mean/variance analysis:
But mean/variance analysis has important short-comings, that may result in the wrong asset allocation for most institutional investors!
13
September
2005Shortcomings of Mean/Variance Analysis
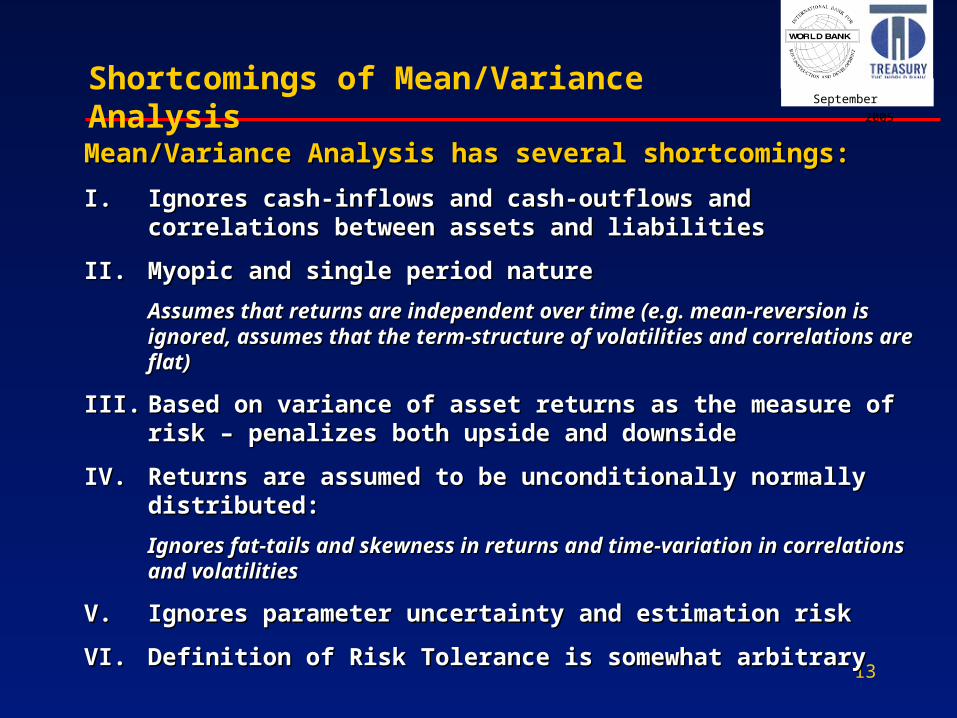
Mean/Variance Analysis has several shortcomings:Mean/Variance Analysis has several shortcomings:
I.I. Ignores cash-inflows and cash-outflows and correlations between Ignores cash-inflows and cash-outflows and correlations between assets and liabilitiesassets and liabilities
II.II. Myopic and single period natureMyopic and single period nature
Assumes that returns are independent over time (e.g. mean-reversion is Assumes that returns are independent over time (e.g. mean-reversion is ignored, assumes that the term-structure of volatilities and correlations are ignored, assumes that the term-structure of volatilities and correlations are flat)flat)
III.III. Based on variance of asset returns as the measure of risk – Based on variance of asset returns as the measure of risk – penalizes both upside and downsidepenalizes both upside and downside
IV.IV. Returns are assumed to be unconditionally normally distributed:Returns are assumed to be unconditionally normally distributed:
Ignores fat-tails and skewness in returns and time-variation in correlations Ignores fat-tails and skewness in returns and time-variation in correlations and volatilitiesand volatilities
V.V. Ignores parameter uncertainty and estimation riskIgnores parameter uncertainty and estimation risk
VI.VI. Definition of Risk Tolerance is somewhat arbitraryDefinition of Risk Tolerance is somewhat arbitrary
14
September
2005
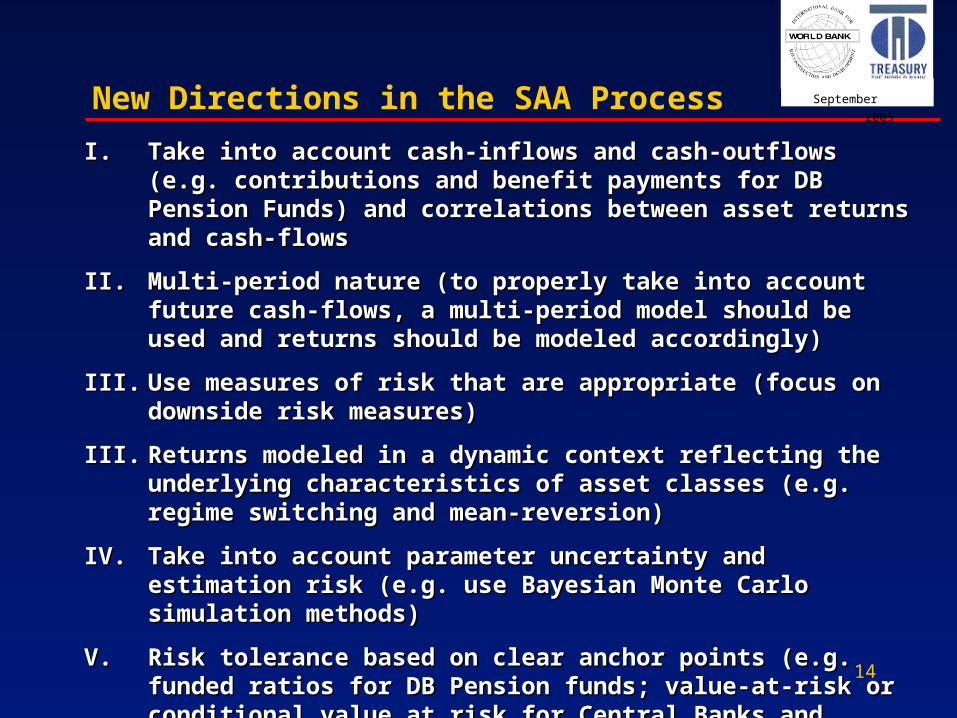
I.I. Take into account cash-inflows and cash-outflows (e.g. Take into account cash-inflows and cash-outflows (e.g. contributions and benefit payments for DB Pension Funds) and contributions and benefit payments for DB Pension Funds) and correlations between asset returns and cash-flowscorrelations between asset returns and cash-flows
II.II. Multi-period nature (to properly take into account future cash-Multi-period nature (to properly take into account future cash-flows, a multi-period model should be used and returns should be flows, a multi-period model should be used and returns should be modeled accordingly)modeled accordingly)
III.III. Use measures of risk that are appropriate (focus on downside risk Use measures of risk that are appropriate (focus on downside risk measures)measures)
III.III. Returns modeled in a dynamic context reflecting the underlying Returns modeled in a dynamic context reflecting the underlying characteristics of asset classes (e.g. regime switching and mean-characteristics of asset classes (e.g. regime switching and mean-reversion)reversion)
IV.IV. Take into account parameter uncertainty and estimation risk (e.g. Take into account parameter uncertainty and estimation risk (e.g. use Bayesian Monte Carlo simulation methods)use Bayesian Monte Carlo simulation methods)
V.V. Risk tolerance based on clear anchor points (e.g. funded ratios for Risk tolerance based on clear anchor points (e.g. funded ratios for DB Pension funds; value-at-risk or conditional value at risk for DB Pension funds; value-at-risk or conditional value at risk for Central Banks and liquidity reserves; spending-at-risk for Central Banks and liquidity reserves; spending-at-risk for endowments)endowments)
New Directions in the SAA Process
15
September
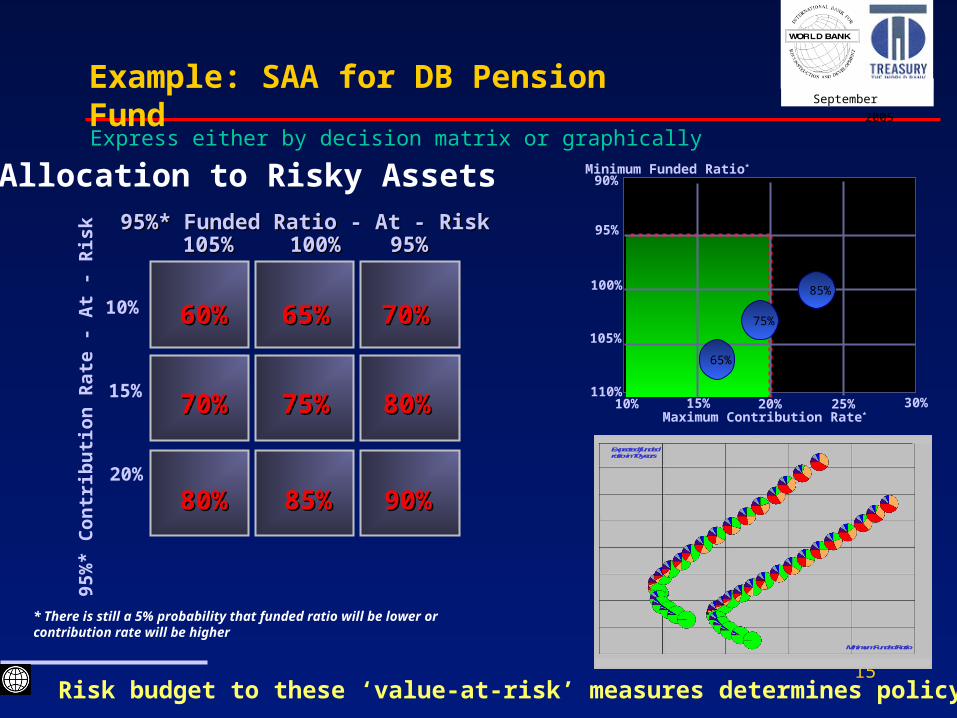
2005Example: SAA for DB Pension Fund
60%60% 70%70%65%65%
70%70% 80%80%75%75%
80%80% 90%90%85%85%
105%105% 95%95%100%100%95%* Funded Ratio - At - Risk95%* Funded Ratio - At - Risk
10%
20%
15%
95%
* C
on
trib
uti
on
Rat
e -
At
- R
isk
Risk budget to these ‘value-at-risk’ measures determines policy allocation
* There is still a 5% probability that funded ratio will be lower or contribution rate will be higher
Maximum Contribution Rate*
Minimum Funded Ratio*
110%10%
100%
90%
20% 30%15% 25%
105%
95%
65%
85%
75%
Express either by decision matrix or graphically
Expected funded ratio in 10 years
Minimum Funded Ratio
Expected funded ratio in 10 years
Minimum Funded Ratio
Allocation to Risky Assets
16
September
2005
Setting Realistic Expected Return Assumptions
Modeling Risk: Downside Risk Approaches
Modeling Future Returns
New Directions……
17
September
2005
Setting Realistic Return Expectations:
Asset allocation optimizations are extremely sensitive to expected return assumptions. How do we ensure realistic expectations?
• Should we use long-term historical returns?• Should we use equilibrium expected returns?• What are the drivers of actual returns?• Should expected returns be valuation-independent (‘no
view’ approach) or do valuations matter?• How often do you review expected return assumptions?
Ensuring Realistic Expectations…
18
September
2005
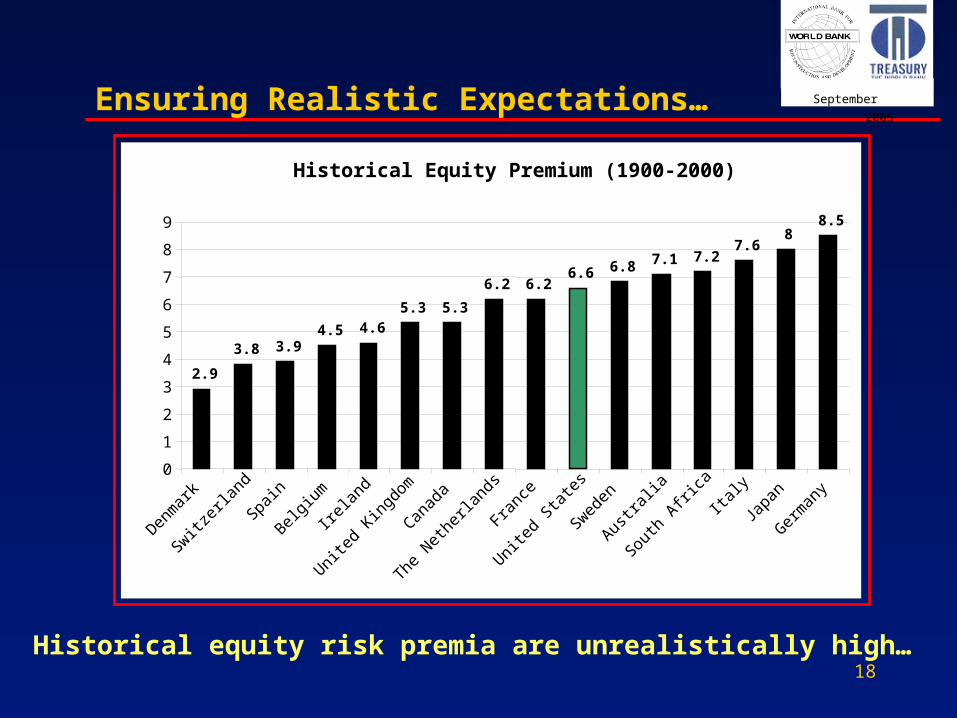
Historical Equity Premium (1900-2000)
2.9
3.8 3.94.5 4.6
5.3 5.3
6.2 6.26.6 6.8 7.1 7.2
7.68
8.5
0
1
2
3
4
5
6
7
8
9
Denm
ark
Switzer
land
Spain
Belgium
Irelan
d
United
King
dom
Canad
a
The N
ethe
rland
s
Franc
e
United
Sta
tes
Sweden
Austra
lia
South
Afri
caIta
ly
Japa
n
Germ
any
Historical equity risk premia are unrealistically high…
Ensuring Realistic Expectations…
19
September
2005
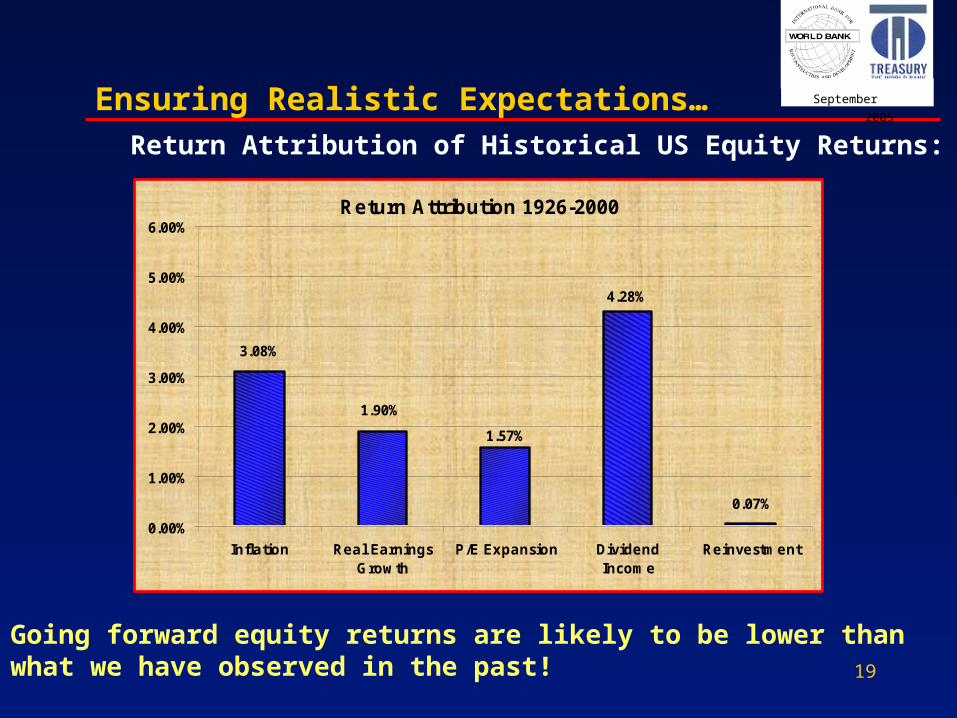
Return Attribution 1926-2000
3.08%
1.90%
1.57%
4.28%
0.07%
0.00%
1.00%
2.00%
3.00%
4.00%
5.00%
6.00%
Inflation Real EarningsGrowth
P/E Expansion DividendIncome
Reinvestment
Ensuring Realistic Expectations…
Going forward equity returns are likely to be lower than what we have observed in the past!
Return Attribution of Historical US Equity Returns:
20
September
2005
Accurately capturing risks of investment portfolios:
Variance of asset returns penalizes both the upside and downside equally, but what if we care more about downside risk?
• Likelihood versus magnitude of losses• Risk at the end of the investment horizon versus risk
during the investment horizon
Modeling Risk
21
September
2005
Risk of 10 Percent Loss: 20% Probability
75
80
85
90
95
100
105
110
115
120
0 1 2 3 4
Risk of 10 Percent Loss: 20% Probability
75
80
85
90
95
100
105
110
115
120
0 1 2 3 4
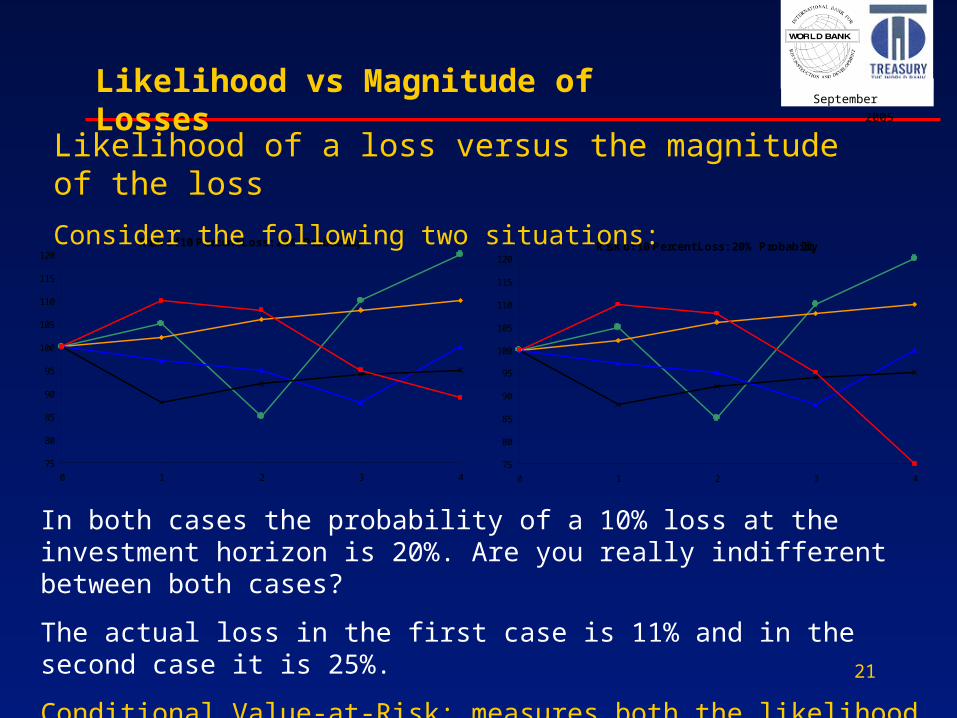
Likelihood of a loss versus the magnitude of the loss
Consider the following two situations:
In both cases the probability of a 10% loss at the investment horizon is 20%. Are you really indifferent between both cases?
The actual loss in the first case is 11% and in the second case it is 25%.
Conditional Value-at-Risk: measures both the likelihood and the magnitude of losses
Likelihood vs Magnitude of Losses
22
September
2005
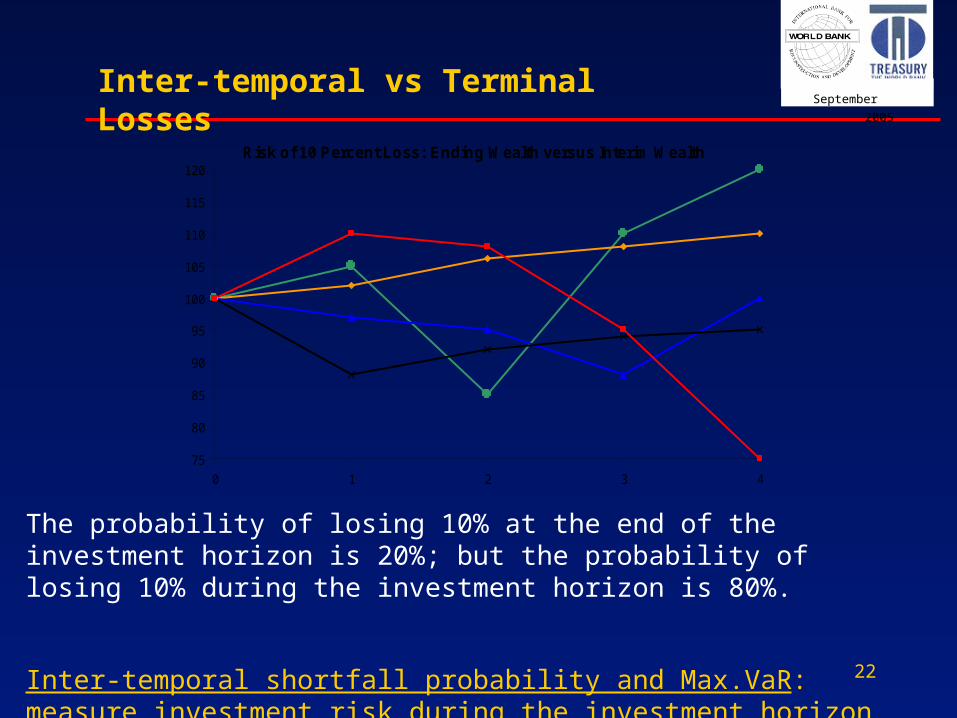
Risk of 10 Percent Loss: Ending Wealth versus Interim Wealth
75
80
85
90
95
100
105
110
115
120
0 1 2 3 4
The probability of losing 10% at the end of the investment horizon is 20%; but the probability of losing 10% during the investment horizon is 80%.
Inter-temporal shortfall probability and Max.VaR: measure investment risk during the investment horizon and not only at the end
Inter-temporal vs Terminal Losses
23
September
2005
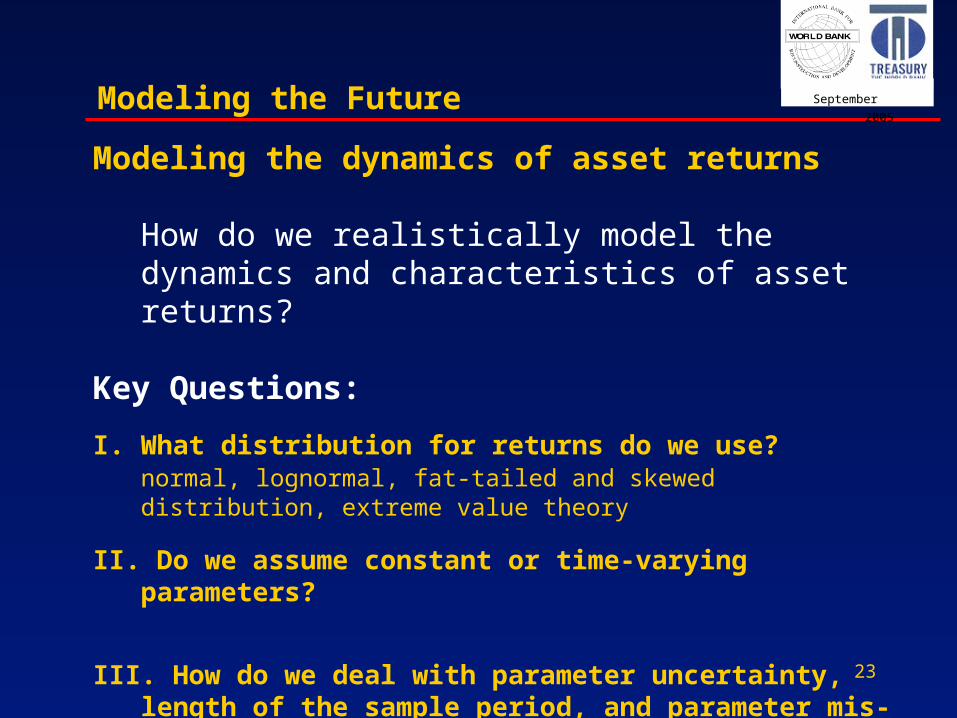
Modeling the dynamics of asset returns
How do we realistically model the dynamics and characteristics of asset returns?
Key Questions:
I. What distribution for returns do we use?normal, lognormal, fat-tailed and skewed distribution, extreme value theory
II. Do we assume constant or time-varying parameters?
III. How do we deal with parameter uncertainty, length of the sample period, and parameter mis-estimation?
Modeling the Future
24
September
2005
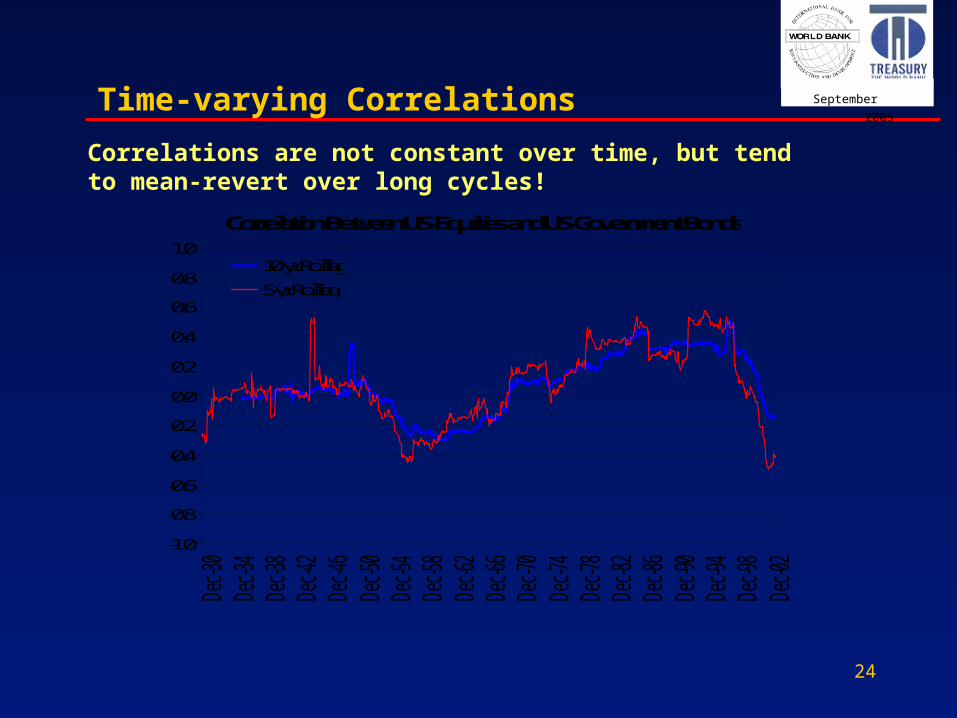
Correlation Between US Equities and US Government Bonds
-1.0
-0.8
-0.6
-0.4
-0.2
0.0
0.2
0.4
0.6
0.8
1.0
Dec
-30
Dec
-34
Dec
-38
Dec
-42
Dec
-46
Dec
-50
Dec
-54
Dec
-58
Dec
-62
Dec
-66
Dec
-70
Dec
-74
Dec
-78
Dec
-82
Dec
-86
Dec
-90
Dec
-94
Dec
-98
Dec
-02
10-yr Rolling
5-yr Rolling
Correlations are not constant over time, but tend to mean-revert over long cycles!
Time-varying Correlations
25
September
2005
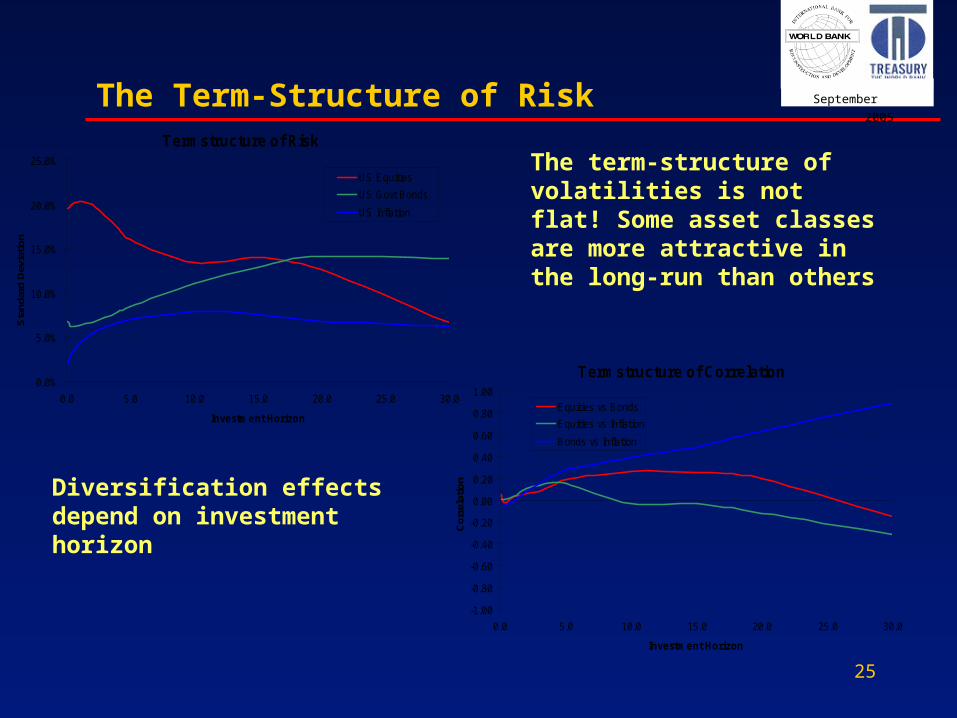
Termstructure of Risk
0.0%
5.0%
10.0%
15.0%
20.0%
25.0%
0.0 5.0 10.0 15.0 20.0 25.0 30.0
Investment Horizon
Sta
ndar
d D
evia
tion
US Equities
US Govt Bonds
US Inflation
Termstructure of Correlation
-1.00
-0.80
-0.60
-0.40
-0.20
0.00
0.20
0.40
0.60
0.80
1.00
0.0 5.0 10.0 15.0 20.0 25.0 30.0
Investment Horizon
Co
rrel
atio
n
Equities vs Bonds
Equities vs Inflation
Bonds vs Inflation
The term-structure of volatilities is not flat! Some asset classes are more attractive in the long-run than others
Diversification effects depend on investment horizon
The Term-Structure of Risk
26
September
2005
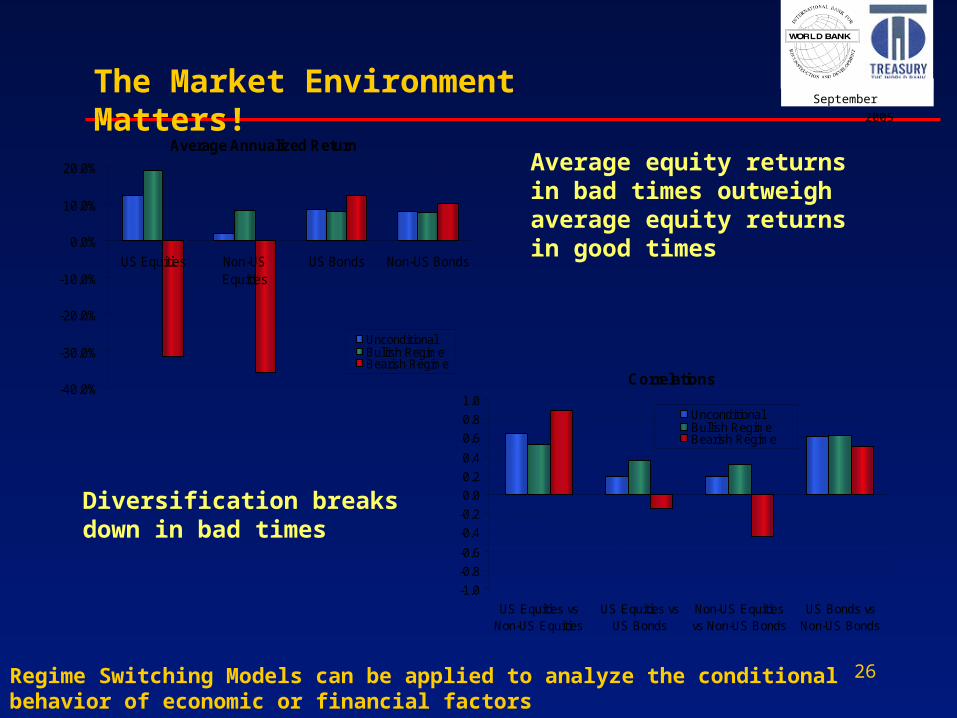
Average Annualized Return
-40.0%
-30.0%
-20.0%
-10.0%
0.0%
10.0%
20.0%
US Equities Non-USEquities
US Bonds Non-US Bonds
UnconditionalBullish RegimeBearish Regime
The Market Environment Matters!
Average equity returns in bad times outweigh average equity returns in good times
Correlations
-1.0
-0.8
-0.6
-0.4
-0.2
0.0
0.2
0.4
0.6
0.8
1.0
US Equities vsNon-US Equities
US Equities vsUS Bonds
Non-US Equitiesvs Non-US Bonds
US Bonds vsNon-US Bonds
UnconditionalBullish RegimeBearish Regime
Diversification breaks down in bad times
Regime Switching Models can be applied to analyze the conditional behavior of economic or financial factors