Embed Size (px)
Citation preview

New Design Feed Channel Spacer in Spiral Wound Elements for Pretreatment Cost Reduction
Final Technical Report
byPeter Eriksson
Desalination Systems, Inc.Escondido, CA
Assistance Agreement No. 1425-97-FC-81-30006FMembrane Separation Processes for Wastewater Reclamation
Desalination Research and Development Program Report No. 45
September 1998
U.S. Department of InteriorBureau of Reclamation
Technical Services CenterWater Treatment Engineering and Research Group

REPORT DOCUMENTATION PAGE Form ApprovedOMB No. 0704-0188
Public reporting burden for this collection of information is estimated to average 1 hour per response, including the time for reviewing instrucitons, searching exisitng data sources, gathering andmaintaining the data needed, and completing and reviewing the collection of information. Send comments regarding this burden estimate or any other aspect of this collection of information, includingsuggestions for reducing this burden to Washington Headquarters Services, Directorate for Information Operations and Reports, 1215 Jefferson Davis Highway, Suit 1204, Arlington VA 22202-4302, and to the Office of Management and Budget, Paperwork Reduction Report (0704-0188), Washington DC 20503.
1. AGENCY USE ONLY (LeaveBlank)
2. REPORT DATE
September 1998
3. REPORT TYPE AND DATESCOVEREDFinal, October 1997-September 1998
4. TITLE AND SUBTITLENew Design Feed Channel Spacer in Spiral Wound Elements for PretreatmentCost Reduction
5. FUNDING NUMBERS
1425-97-FC-81-30006F
6. AUTHOR(S)Peter K. Eriksson, Ph D. Development Engineer
7. PERFORMING ORGANIZATION NAME(S) AND ADDRESS(ES)Osmonics/Desal760 Shadowridge DriveVista CA 92083
8. PERFORMINGORGANIZATIONREPORT NUMBER
9. SPONSORING/MONITORING AGENCY NAME(S) ANDADDRESS(ES)U.S. Department of InteriorBureau of ReclamationP. O. Box 25007Denver Co. 80225-0007
10.SPONSORING/MONITORINGAGENCY REPORT NUMBER Desalination Research and Development Program, Report No. 45
11. SUPPLEMENTARY NOTES
12a. DISTRIBUTION/AVAILABILITY STATEMENT Available from the National Technical Information Service, Operations Division,5285 Port Royal Road, Springfield, Virginia 22161
12b. DISTRIBUTION CODE
13. ABSTRACT (Maximum 200 words)The objective of this work was to examine whether a new type of feed channel spacer, called a parallel spacer, inspiral wound elements would decrease the pretreatment requirement, when operating RO/NF elements onmunicipal wastewater. The new design feed channel spacer consisted of thicker longitudinal strands, which definethe spacer thickness, and thinner cross strands (perpendicular to the thicker strands), which were not in contactwith the membrane surface.RO/NF elements with the parallel spacer and the standard diamond shape spacer operated on tertiary treatedmunicipal wastewater for six months. The elements with the standard diamond shape spacer performed better than the elements with the parallel spacer. A nominal 5 �m melt blown cartridge filter stopped the particulatematerial which otherwise would have increased the pressure drop over the elements, but did not stop colloidalmaterial which caused a rapid decline in water permeability of the elements. Alkaline cleaning removed browndeposits , but did not remove a thin transparent slimy layer from the membrane surface. This slimy layer wasprobably the cause of the rapid decline in membrane performance after cleaning. If this slimy layer can beprevented from forming, or if it can be removed by cleaning, the permeate flux of RO/NF elements, withoutmembrane microfiltration as pretreatment, can most likely be maintained at 10 l/(m2�h) (6 gfd) and possibly at 15 l/(m2�h) (9 gfd).
14. SUBJECT TERMSReverse Osmosis, Nanofiltration, microfiltration, pretreatment, municipal wastewater
15. NUMBER OFPAGES 49
16. PRICE CODE
17. SECURITYCLASSIFICATION OFREPORT
18. SECURITYCLASSIFICATION OFTHIS PAGE
19. SECURITYCLASSIFICATION OFABSTRACT
20. LIMITATIONOF ABSTRACT
NSN 7540-01-280-5500 Standard Form 298 (Rev. 2-89)Prescribed by ANSI Std. 239-18298-102
New Design Feed Channel Spacer in Spiral Wound Elements for Pretreatment Cost Reduction
Final Technical Report
byPeter Eriksson
Desalination Systems, Inc.Escondido, CA
Assistance Agreement No. 1425-97-FC-81-30006FMembrane Separation Processes for Wastewater Reclamation
Desalination Research and Development Program Report No. 45
September 1998
U.S. Department of InteriorBureau of Reclamation
Technical Services CenterWater Treatment Engineering and Research Group

Mission Statements
U.S. Department of the Interior
The mission of the Department of the Interior is to protect and provide access to our Nation’snatural and cultural heritage and honor our trust responsibilities to tribes.
Bureau of Reclamation
The mission of the Bureau of Reclamation is to manage, develop, and protect water and relatedresources in an environmentally and economically sound manner in the interest of the Americanpublic.
Federal Disclaimer
The information contained in this report regarding commercial products of firms may not be usedfor advertising or promotional purposes and is not to be construed as an endorsement of anyproduct or firm by the Bureau of Reclamation.
The information contained in this report was developed for the Bureau of Reclamation: nowarranty as to the accuracy, usefulness, or completeness is expressed or implied.
Researcher Acknowledgments
The author would like to thank the Water Treatment Technology Program, Bureau ofReclamation, for sponsoring this research.
The author also would like to thank the City of San Diego, CA, specifically: Paul Gagliardo,manager of the Aqua 2000 Research Center, for the financial and management support; andDave Ross, Shane Trussel, Jack Swerlein and others at the Aqua 2000 Research Center for theirassistance in construction, operation, and maintenance of the test units.
Bureau Point of Contact
The Bureau of Reclamation's Water Reuse Task Manager for this work is Robert Jurenka. Hecan be reached in Denver at (303) 445-2254.

i
Table of Contents
Section PageGlossary . . . . . . . . . . . . . . . . . . . . . . . . . . . . . . . . . . . . . . . . . . . . . . . . . . . . . . . . . . . . . . . . . . . . iv
1. Executive Summary . . . . . . . . . . . . . . . . . . . . . . . . . . . . . . . . . . . . . . . . . . . . . . . . . . . . . . 1
2. Introduction . . . . . . . . . . . . . . . . . . . . . . . . . . . . . . . . . . . . . . . . . . . . . . . . . . . . . . . . . . . . 2
3. Conclusions and Recommendations . . . . . . . . . . . . . . . . . . . . . . . . . . . . . . . . . . . . . . . . . 3
4. Test Site and Feed Water . . . . . . . . . . . . . . . . . . . . . . . . . . . . . . . . . . . . . . . . . . . . . . . . . . 4
5. Test Units and Spiral Wound Elements . . . . . . . . . . . . . . . . . . . . . . . . . . . . . . . . . . . . . . . 6
6. Performance Parameters of the Membrane Elements . . . . . . . . . . . . . . . . . . . . . . . . . . . . 8
6.1 Calculation of the Water Permeability . . . . . . . . . . . . . . . . . . . . . . . . . . . . . . . . . . 86.2 Calculation of the Conductivity Permeability . . . . . . . . . . . . . . . . . . . . . . . . . . . 106.3 Calculation of the Normalized Pressure Drop . . . . . . . . . . . . . . . . . . . . . . . . . . . 11
7. Backwashable Cartridge Filters . . . . . . . . . . . . . . . . . . . . . . . . . . . . . . . . . . . . . . . . . . . . 12
8. Test Procedure and Results . . . . . . . . . . . . . . . . . . . . . . . . . . . . . . . . . . . . . . . . . . . . . . . 13
8.1 Performance of the AK Membrane Elements . . . . . . . . . . . . . . . . . . . . . . . . . . . 148.2 Performance of the DK Membrane Elements . . . . . . . . . . . . . . . . . . . . . . . . . . . 20
9. Analysis of Results . . . . . . . . . . . . . . . . . . . . . . . . . . . . . . . . . . . . . . . . . . . . . . . . . . . . . 27
References . . . . . . . . . . . . . . . . . . . . . . . . . . . . . . . . . . . . . . . . . . . . . . . . . . . . . . . . . . . . . . . . . . 30
SI Metric Conversion Table . . . . . . . . . . . . . . . . . . . . . . . . . . . . . . . . . . . . . . . . . . . . . . . . . . . . . 31
Appendix A - Result of Calibration Check . . . . . . . . . . . . . . . . . . . . . . . . . . . . . . . . . . . . . . . . . 32
Appendix B - Raw Data Record . . . . . . . . . . . . . . . . . . . . . . . . . . . . . . . . . . . . . . . . . . . . . . . . . 33

ii
List of Tables
Table Page1. Typical Wastewater Pretreatment Data . . . . . . . . . . . . . . . . . . . . . . . . . . . . . . . . . . . . . . . 5
2. Approximate Dimensions, Two Feed Channel Spacers . . . . . . . . . . . . . . . . . . . . . . . . . . . 7
3. Active Membrane Areas in the Membrane Elements . . . . . . . . . . . . . . . . . . . . . . . . . . . . 7
4. Test Data for Fouled AK Membrane Samples, Which Have Been “Cleaned” With Three Different Methods. . . . . . . . . . . . . . . . . . . . . . . . . . . . . . . . . . . . . . . . . . . . . 20
List of Figures
Figure Page1. Schematic of a diamond shape spacer and a parallel spacer . . . . . . . . . . . . . . . . . . . . . . . 2
2. The permeate flow rate versus pressure, when operating the membrane unit with AK4040 elements with the diamond shape feed channel spacer on the wastewater at 17°C . . . . . . . . . . . . . . . . . . . . . . . . . . . . . . . . . . . . . . . . . . . 6
3. Flow schematic of one of the two identical test units . . . . . . . . . . . . . . . . . . . . . . . . . . . . 6
4. Temperature, turbidity and chloramine concentration in the feed water to the membrane units when operating with the AK membrane elements . . . . . . . . . . . 15
5. Water permeabilities corrected to 20°C (A(20C) of the AK elements when operating on the wastewater . . . . . . . . . . . . . . . . . . . . . . . . . . . . . . . . . . . . . . . . . . . . . . . 16
6. Pressure drop over the four AK elements, normalized to 20°C and 1.3 m3/h (5.7 gpm) average feed/concentrate flow rate . . . . . . . . . . . . . . . . . . . . . . . . . . 18
7. Conductivity permeabilities corrected to 20°C (B(20C) of the AK elements when operating on the wastewater . . . . . . . . . . . . . . . . . . . . . . . . . . . . . . . . . . . . . . . . . . 19
8. Temperature, turbidity and chloramine concentration in the feed water to the membrane units when operating with the DK membrane elements . . . . . . . . . . . . . 21
9. Water permeabilities corrected to 20°C (A(20C) of the DK elements when operating on the wastewater . . . . . . . . . . . . . . . . . . . . . . . . . . . . . . . . . . . . . . . . . . 23

iii
List of Figures - Continued
Figure Page10. Pressure drop over the four DK elements, normalized to 20°C and
1.3 m3/h (5.7 gpm) average feed/concentrate flow rate . . . . . . . . . . . . . . . . . . . . . . . . . . 25
11. Conductivity permeabilities corrected to 20°C (B(20C) of the DK elements when operating on the wastewater . . . . . . . . . . . . . . . . . . . . . . . . . . . . . . . 26

iv
Glossary
BOD biological oxygen demand
Conductivity permeability defined in Eq.(5) on page 10
gfd US gallons per square foot and day
gpm US gallons per minute
kgal 1000 US gallons
net driving pressure the difference between the feed and the permeate side in hydraulic pressure minus the osmotic pressure
NF nanofiltration
NTU nephelometric turbidity unit
Permeate flux permeate flow rate divided with the active membrane area
Permeate recovery the permeate flow rate divided with the feed flow rate
Polarization modulus the ratio (solute concentration at the membrane surface on the feed side)/(solute concentration in the bulk solution)
RO reverse osmosis
SDI Silt Density Index
TDS total dissolved solids
Water permeability the permeate flow rate per unit membrane area and net driving pressure

1
1. Executive Summary
Reverse osmosis (RO) and nanofiltration (NF) are presently used in a few places to purifytertiary treated municipal wastewater, and the interest for this application is growing. Spiralwound membrane elements are presently used. These elements with the standard diamond shapefeed channel spacer are rather susceptible to plugging and fouling, so extensive pretreatment isrequired to get good membrane performance. Presently, membrane microfiltration seems to bethe most cost effective method of pretreatment. The objective of this work was to examinewhether a new type of feed channel spacer in spiral wound elements would decrease thepretreatment requirement. The new design feed channel spacer consisted of thicker longitudinalstrands, which define the spacer thickness, and thinner cross strands (perpendicular to the thickerstrands), which were not in contact with the membrane surface. This spacer is called the parallel spacer.
Two membrane units had each four spiral wound membrane elements in series. One of themembrane units had membrane elements with the standard diamond shape feed channel spacer,and the other membrane unit had membrane elements with the parallel spacer. These twomembrane units operated on tertiary treated municipal wastewater for two periods of threemonths each, with different nominal rated (5-100 �m) cartridge prefilters. Low pressurepolyamide RO membranes were used for the first three months, and polyamide NF membranes for the last three months. The permeate flux was varied between 10 and 20 l/(m2�h) (6 and 12 gfd).
The membrane elements with the standard diamond shape spacer performed better than theelements with the new parallel spacer. The spacer design seemed not to affect the accumulationof colloidal material on the membrane surface. Alkaline cleaning easily removed brown depositsfrom the membrane surface, but did not remove a thin slimy layer. In order to be costcompetitive when operating an RO/NF unit without membrane microfiltration as pretreatment,the minimum requirements are
(1) A cleaning method must be developed which removes the slimy layer from themembrane surface.
(2) For prefiltration, a nominal 30-100 �m screen should be used, which has eitherautomatic backwash or other types of automatic solids removal.
(3) The RO/NF unit must be able to operate at 15 l/(m2�h) (9 gfd) permeate flux, withonly a minor decrease in the water permeability between the cleanings. Cleaningfrequency should not exceed once every three weeks.

2
2. Introduction
Reverse Osmosis (RO) and Nanofiltration (NF) are membrane separation processes, which areused extensively for treatment of surface water and groundwater to be used for drinking waterand industrial process water. For these applications, predominantly spiral wound membraneelements with a 0.71 mm (0.028") thick diamond shape feed channel spacer are used. Figure 1,skewed view portrays a diamond shaped spacer.
Figure 1.—Schematic of a diamond shape spacer and a parallel spacer.
The diamond shape spacer has two planes of strands, one on the top of the other. The strands arein parallel within each plane, and form an angle with the strands in the other plane. The parallelspacer has thick longitudinal strands, and thin strands in the cross direction. The thin strands donot touch the membrane surface, but they are connected off-centered to the thick strands (see sideview). The strands are in contact with, or very close to, the membrane surface. Particulatematerials which enter the spiral wound element typically accumulate where the strands are inclose contact with the membrane surface. Deposits are typically seen on both sides of the strand,the upstream side and the downstream side (leeward side). The fluid dynamics are such that awake is formed on the downstream side of the strand, so there is no force to remove solids whichhave deposited there.
The deposition of solids on the membrane surface degrades its performance. Essentially allparticulate materials has to be removed from the water stream before entering the spiral woundelement, to maintain a good membrane performance. This can be done in a fairly inexpensiveway in most cases where the feed is groundwater or surface water with a low concentration ofsuspended solids. However, for many wastewaters, it becomes rather expensive to remove theparticulate materials, which otherwise would cause fouling problems in spiral wound elementswith diamond shape feed channel spacers. The total cost of membrane filtration and the requiredpretreatment might be less with another design of the feed channel spacer, which would allow forthe particulate materials to easily pass from the feed end to the concentrate end of the spiralwound element.

3
Intuitively, a feed channel spacer as depicted in the front view of Figure 1, would allow easierpassage of particulate materials. The strands which are in contact with the membrane are orientedin the flow direction, and the cross strands are thin enough to allow particles smaller than 0.15 mm (0.06 inch) to pass through on either side. The disadvantage with this type of spacer,compared to the standard diamond shape spacer, is that it promotes less mixing , which results ina higher degree of concentration polarization, and consequently a higher passage of small solutesthrough the membrane. However, this would only be of concern in the few wastewaterapplications where very low TDS (total dissolved solids) in permeate is required.
The objective with this project was to examine whether it would be cost effective to use spiralwound membrane elements with the parallel feed channel spacer as shown in Figure 1b, insteadof the standard diamond shape spacer, when operating on tertiary treated municipal wastewater.The City of San Diego had already operated spiral wound RO elements with the standarddiamond shape spacer on this type of water, using membrane microfiltration as pretreatment. Theperformance of the RO elements was stable for half a year with no need for RO membranecleaning. The total cost for operation with membrane elements with the parallel spacer andrequired pretreatment was to be compared with the cost for operation with membrane elementswith the standard diamond shape spacer and membrane microfiltration as pretreatment.
3. Conclusions and Recommendations
� Membrane elements with the standard diamond shape spacer gave a betterperformance than elements with the parallel spacer when operating on the tertiarytreated municipal wastewater. The relatively poor performance of the parallelspacer was probably caused by uneven feed side flow distribution within theelements. Even if the flow distribution problem had been eliminated, theseelements would not have performed better than the elements with the standarddiamond shape spacer. The reason for this was that the colloidal material whichfouled the membrane did easily exit the membrane element as long it was notattached to the membrane surface. Neither of the tested feed channel spacersseemed to be responsible to the accumulation of foulants in the elements.
� A nominal 5 �m melt blown cartridge prefilter prevented an increase in thepressure drop over the membrane elements. It did not, however, prevent themembrane elements from being fouled by small colloidal particles, which causeda decline in the water permeability.
� With a nominal 100 �m wound filter for prefiltration, a permeate flux of 10 l/(m2�h) (6 gfd) could be maintained fairly well, and 15 l/(m2�h) might bepossible to maintain. Even with a 5 �m melt blown cartridge for prefiltration, apermeate flux of 20 l/(m2�h) caused a rapid decline in water permeability of themembrane elements.

4
� Alkaline (pH 11) cleaning with a surfactant at 35-40°C did easily remove thebrown deposits from the membrane elements. It did not, however, remove a thinslimy layer on the membrane. This layer probably caused the rapid fouling rateupon subsequent operation on the wastewater.
� Shutting down the membrane unit for 10 minutes twice daily helped in removingthe brown deposits from the membrane, and helped stabilize the performance ofthe membrane elements.
� In order to be cost competitive when operating an RO/NF unit without membranemicrofiltration as pretreatment, the minimum requirements are
(1) A cleaning method must be developed which removes the slimy layerfrom the membrane surface.
(2) For prefiltration, a nominal 30-100 �m screen should be used, which haseither automatic backwash or other types of automatic solids removal.
(3) The RO/NF unit must be able to operate at 15 l/(m2�h) (9 gfd) permeateflux, with only a minor decrease in the water permeability between thecleanings. Cleaning frequency should not exceed once every three weeks.
4. Test Site and Feed Water
The test site was the Aqua 2000 Research Center, owned by the City of San Diego, California.The feed water was tertiary treated domestic wastewater from the Rancho Bernardo area. Thetertiary treatment consisted of the following steps.
1. Mechanical bar screen and grit remover
2. Hycor Rotostrainer rotary drum screen with 6 mm (0.25 inch) openings
3. Hycor Discostrainer rotary disk filters with 250 �m openings
4. Water Hyacinth ponds
5. Coagulation with FeCl3 addition followed by a plate settler
6. Single media filter with anthracite, size 1.4-1.5 mm, and 1.9 m/h (0.8gal./(minute�ft2)) fluid flow rate
7. Sodium hypochlorite addition to form 1-3 mg/l chloramines

5
The turbidity of the tertiary treated wastewater was measured continuously after the media filter,and the ferric chloride dosing in the coagulation step was controlled to give a turbidity of 2 NTU.If the turbidity after the media filter decreased below 2, the ferric chloride dose rate decreasedand vice versa. The chloramine concentration in the feed water entering the membrane units wasalso measured continuously.
The tertiary treated wastewater was also used in other membrane tests at the Aqua 2000 ResearchCenter. The turbidity set point was 2.0 NTU, which could be maintained all year around, tominimize the variation in the fouling tendency of the tertiary treated wastewater. The highturbidity set point was advantageous in speeding up membrane fouling. Table 1 shows otherconstituents in the wastewater, which were measured.
Table 1.—Typical Wastewater Pretreatment Data
After Hyacinth pond After media filter
BOD, mg/l 10
Suspended solids, mg/l 10-15
Total dissolved solids, mg/l 1100-1150
Silt Density Index Too high to be measurable
Osmotic pressure 67 kPa (10 psi)
pH 7.1-7.6
Ammonia average 2.7 mg/l as Nitrogen
Nitrate average 3.9 mg/l as Nitrogen
Absorbance at 254 nm average 0.19
The osmotic pressure of the feed solution was estimated by plotting the permeate flow rateversus the average pressure on the feed side of the AK membrane elements, when operating onthe wastewater. The result is shown in Figure 2. The average feed/concentrate conductivity at25°C was 1780 uS/cm. The conductivity rejection was 98%.

6
1
1
1
1
1
0123456789
10
0 100 200 300 400 500 600 700 800 900Average pressure on the feed side of the membrane elements, kPa
Figure 2.—The permeate flow rate versus pressure, when operating the membrane unit with AK4040 elements with the diamond shape feed channel spacer on the wastewater at 17°C.
Figure 3.—Flow schematic of one of the two identical test units.
5. Test Units and Spiral Wound Elements
For testing the spiral wound elements, two identical Osmonics RO, E4-7200-DLX, 460, 6, 50-75 units were used. They were modified by adding a throttling valve after the high pressurepump, and disconnecting the concentrate recirculation. The flow diagram of the test units isshown in Figure 3. The same Goulds NPE 1st 1F5 C4 centrifugal pump fed both test units. Thevalves were manually adjusted regulating valves.
The temperature of the feed solution was measured before the Goulds centrifugal pump. Abouttwo times a day, feed and permeate samples from the membrane units were within 5 minutes ofsampling brought into the laboratory for measurement of temperature, conductivity and pH.

7
At the beginning of the test series, the flow meters, the pressure gages just before and after themembrane element housings, and the temperature gage were checked for calibration. The resultfrom this is shown in Appendix A.
In each test unit, there were four element housings in series, each with one membrane elementwith nominal size 0.1 m (4") diameter and 1 m (40") long. The feed channel spacer was astandard diamond shape one (see Figure 1a) for the membrane elements in one of the test units,and a parallel one (see Figure 1b) for the membrane elements in the other test unit. Table 2 givessome of the dimensions of the two feed channel spacers. The open space between the off-centered cross strands and the membrane surface for the parallel spacer was difficult to measure,but was estimated to be about 0.15 mm (0.006 inch) on one side and 0.43 mm (0.017 inch) on theother side of the spacer.
Table 2.—Approximate Dimensions, Two Feed Channel Spacers
Spacer thick-ness, mm
Angle betweencrossing strands
Strand thickness, mm Center to center distancebetween parallel strands,mm
D P D P D P,long P,cross D P,long P,cross
0.71 0.89 85-95 90 0.36 0.89 0.25 2.9 6.6 2.0
D and P refer to the diamond shape and parallel feed channel spacer respectively. P,long andP,cross refer to the longitudinal and crossing strands respectively (seen from the perspective ofthe feed flow direction) of the parallel feed channel spacer. Two types of membranes were used,the AK and the DK membranes. Both of these are composite membranes with a polyamidebarrier layer. The polyamide composition is different in the two membranes. The AK membraneis an RO membrane in the Desal-11 family, with a relatively high water permeability. Its sodiumchloride rejection at normal operating conditions is better than 96 percent. The DK membrane isan NF membrane in the Desal-5 family. At normal operating conditions, it has above 98 percentrejection of sulfates and organics with molecular weight above 200 Dalton, and below 50 percentrejection of chlorides. The active membrane areas in the different type membrane elements areshown in Table 3.
Table 3.—Active Membrane Areas in the Membrane Elements
Element AK4040 DK4040
Type feed channel spacer Diamond Parallel Diamond Parallel
Active membrane area, m2 (ft2) 8.2 (88) 7.4 (80) 7.8 (84) 7.3 (78)

8
Two types of cartridge filters were used, Hytrex® melt blown filters with nominal rating 5, 10,20 and 75 micron, and Filter-Cor WPX100R20P wound filters with nominal rating 100 micron.They were 64 (2.5 inch) mm in diameter and 0.5 m (20 inch) long.
Antiscalant was added all the time except for the first three days of operation. The antiscalantwas Hypersperse AF 200 UL from Argo Scientific. The antiscalant concentration in the feedsolution varied in the range 3-7 mg/l.
6. Performance Parameters of the Membrane Elements
The performances of the membrane elements during operation were monitored by calculatingtheir water and conductivity permeabilities, and the feed side pressure drop over the fourelements in series. The permeabilities were normalized for temperature, and the pressure dropwas normalized for temperature and feed side flow rate. The average water and conductivitypermeabilities over the four elements in the membrane unit were monitored, and not thepermeabilities for the individual elements.
The measured pressure drop was that between the entrance port of the upstream element housingand the exit port of the downstream element housing. To get the pressure drop over the elements,the pressure drop over the plumbing and the entrance and exit ports of the four element housingsmust be deducted from the total pressure drop. However, in this study, the absolute value of thepressure drop over the elements was not important, but its change in time was important. In sucha case, it is satisfactory to measure the total pressure drop over the four element housings. Anincrease in that normalized pressure drop indicates fouling of the membrane elements.
6.1 Calculation of the Water Permeability
The water permeability was calculated according to Eq.(1).

9
whereA(Tref) is the water permeability at temperature Tref, m/(s�MPa)
Jw is the permeate flux, m/s or l/(m2�h) or gfd
TCFA is the temperature correction factor for the water permeability
�P is the average hydraulic pressure difference between the feed and permeate sides ofthe membrane
� is the osmotic pressure
the subscripts fbav and p denote the average of the feed and concentrate values, and thepermeate respectively.
�P was assumed to be the arithmetic average of the gage pressures upstream (Pin) anddownstream (Pout) of the elements. The pressure drop in the permeate tubing should have beenlow and was neglected.
The permeate flux was the permeate flow rate divided with the active membrane area, which islisted in Table 3.
Eq.(2) was used to calculate the temperature correction factor.
where T is the actual temperature, and T and Tref are expressed in °C.
As shown in Figure 2, the osmotic pressure of the wastewater solution with 1780 �S/cmconductivity at 25°C was estimated to 67 kPa (10 psi). The osmotic pressure of both thewastewater and the permeate was then assumed to follow Eq.(3).
where � is the conductivity at 25°C in �S/cm, and � has the unit kPa.

10
The osmotic pressure is approximately proportional to the absolute temperature. In this study, thetemperature varied between 14 and 29°C. For a solution, the osmotic pressure would increaseabout 5 percent for a temperature increase from 14 to 29°C. In this study, this is an increase ofless than 4 kPa (1 psi), which can be neglected. The osmotic pressure was assumed to beindependent of the temperature.
The conductivity of the feed and permeate solutions were measured. The concentrateconductivity was calculated from a conductivity balance according to Eq.(4).
whereF is the flow rates, m3/s or gpmsubscripts f and c refer to the feed and concentrate streams respectively
The conductivities are not linear with the solute concentrations, so Eq.(4) is not quite correct, butis good enough for the purposes of this study.
As Eq.(1) is defined, the water permeability of the element is a function of the waterpermeabilities of membrane and the fouling layer and also of the polarization modulus.
6.2 Calculation of the Conductivity Permeability
The conductivity permeability was calculated according to Eq.(5).
whereB(Tref) is the conductivity permeability at temperature Tref , m/s or cm/sJw is the permeate flux, m/s or l/(m2�h) or gfd� is the conductivity of the solution at 25°C, �S/cmTCFB is the temperature correction factor for the solute permeability

11
The conductivity rejection, R, is defined in Eq.(6)
R = 1 - �p/�fbav (6)
The temperature correction factor for the conductivity permeability, TCFB, was assumed to bethe same as that one for the water permeability, TCFA.
6.3 Calculation of the Normalized Pressure Drop
The pressure drop in a channel with a given geometry can be expressed according to Eq.(7).
wherePin - Pout is the pressure drop over the channel, Pa or psiL is the length of the channel, m or ftdh is a characteristic length of the channel, m or ftf is the fanning friction factor� is the density of the solution, kg/m3 v is the velocity of the fluid in the channel, m/s or ft/s
The fanning friction factor is a function of the channel geometry and the Reynolds number, Re.
where� is the absolute viscosity of the solution, kg/(m�s)
For membrane elements with either of the two tested feed channel spacers, the pressure drop overthe elements is approximately proportional to the feed/concentrate average flow rate to power 1.5. Eqs.(7) and (8) then imply that the fanning friction factor is proportional to theReynolds number to the power -0.5. The pressure drop over the elements then becomesproportional to the square root of booth the viscosity and density of the solution. In thetemperature interval of this study, 14-29°C, the density changes were small enough to be

12
neglected. The pressure drop over the elements needs then only to be normalized with respect tothe feed/concentrate average flow rate and its viscosity. The viscosity of the solution wasassumed to be the same as for pure water, which was taken from page 3-201 of Perry (1963).
µw,20 = 1.005�10-3 kg/(m�s)µw,T/µw,20 = 99.5/[2.1482�{(T-8.435)+( 8078.4+(T-8.435)2 )0.5 } -120] (9)
whereµw,20 is the water viscosity at 20°Cµw,T is the water viscosity at T°C
The normalized pressure drop over the elements was calculated from Eq.(10).
where(Pin - Pout) norm is the pressure drop normalized to temperature and flow ratePin - Pout is the measured pressure dropFfbref is a reference average feed/concentrate flow rateFfbav is the measured average feed/concentrate flow rate�Tref is the water viscosity at a reference temperature�T is the water viscosity at the measured temperature
To be accurate, only the pressure drop over the elements should be included in Eq.(10). In thiswork, however, the measured pressure drop also included pressure drops at entry ports and exitports of element housings, and the tubing there between. The error in doing so was small enough,to easily see when the pressure drop over the elements increased because of fouling of themembrane elements.
7. Backwashable Cartridge Filters
According to the test plan, a backwashable cartridge filter should also had been tried as a prefilterto the membrane unit. This backwashable cartridge filter was tested on the actual tertiary treatedwastewater before the membrane units were in operation. It did not perform well. The operatingtime between backwashes was only 4-6 hours. Cleaning chemicals were required in thebackwash solution to partially restore the performance of the cartridge filter elements. Thefiltrate had a high Silt Density Index, above 5. The manufacturer took back the backwashablecartridge filter unit before the membrane units were put into operation.

13
8. Test Procedure and Results
The membrane units operated first with the AK (RO) elements for three months, followed by theDK (NF) elements for three months. During the initial three months with the AK elements,different types and nominal micron rating cartridge filters were used for prefiltration. During thelast three months, only the most open of the tested cartridge filters, nominal 100 �m woundfilter, was used. A cartridge filter was replaced when the pressure drop over it exceeded about100 kPa (15 psi).
The membrane fouling rate is highly dependent on the permeate flux, which has beendocumented by among others Bergman (1985) and Chellam et al. (1997). At the Aqua 2000Research Center, RO and NF spiral wound membrane elements had operated on the same feedwater as used in this study, with membrane microfiltration as pretreatment. A permeate flux of20 l/(m2�h) (12 gfd) gave stable performance for over half a year. For this reason, 20 l/(m2�h) waschosen as the initial permeate flux in this study.
The feed flow rate was also varied throughout the study. The permeate recovery for a membraneunit is defined as the permeate flow rate divided with the feed flow rate.
The membrane elements were cleaned periodically. The cleaning cycle consisted of
� Flush the membrane unit with 0.2 m3 (50 gallons) potable water
� Recirculate the cleaning solution for about half an hour at 30-35°C for the acidcleaning, and at 35-40°C for the alkaline cleaning
� Flush the membrane unit with 0.2 m3 potable water
The cleaning solutions were made up with RO permeate and cleaning chemicals. For acidcleanings, the cleaning chemical was 0.6 wt% citric acid to get pH in the range 2-3. For alkalinecleaning, the cleaning chemicals were 0.3 wt% sodium hydroxide, 0.06 wt% sodium dodecylsulfate, and citric acid to get pH in the range 10.5-11.5.
The figures which show the performances of the membrane elements have the operating time forthe abscissa. The operating time includes stops lasting for less than 6 hours, for example stopsfor cleaning, but does not include a few stops which lasted for longer times. The chosenreference temperature was 20°C, because that was close to the average operating pressure duringthe first three months.
Most of the time, pressures, flow rates and temperature were recorded 2-4 times a day, while theconductivities were recorded half as often. For most of the cases where conductivity data weremissing, the conductivities were assumed to be the arithmetic average of the closest before and

14
after recorded values. In a few other cases, e.g. for the first reading after a cleaning or when tworeadings were close together in time, the conductivities were assumed to be the same as at theclosest in time recorded values.
Before each reading, if required, the two regulating valves in each membrane unit were adjustedto make the units operate with the desired permeate and concentrate flow rates. The permeateflux and permeate recovery could be slightly off these values for some time between thereadings.
8.1 Performance of the AK Membrane Elements
Figure 4 shows the temperature, turbidity and chloramine concentration in the feed water to themembrane units when operating with the AK membrane elements. The time in operation refersto the membrane unit with the parallel spacer. The time scale can be up to three days off for theother membrane unit.
Figure 5 shows the water permeability of the elements during the 90 days of operation.Antiscalant was added all the time except for the first three days of operation. The membraneelements had originally, when tested on a NaCl solution, a water permeability at 20°C of about15�10-6 m/(s�MPa). Cleaning consisted of both acid and alkaline cleaning in every case. Duringthe first three days, the permeate flux was 20-22 l/(m2�h) (12-13 gfd), the permeate recovery was42 percent, and nominal 75 �m prefilters were used. The water permeabilities at 20°C decreasedrapidly from above 10�10-6 to below 4�10-6 m/(s�MPa). The performance loss could have beenfrom colloidal fouling and/or from calcium carbonate precipitation, because no antiscalant wasadded during these initial three days. Acid and alkaline cleaning restored some of the lost waterpermeability. The test continued with 20-22 l/(m2�h) permeate flux, but this time with antiscalantaddition and nominal 5 �m prefilters. The loss in water permeability was still drastic. This musthave been caused by colloidal fouling, because no inorganics should have precipitated duringthese conditions.
After a second cleaning, the permeate flux was lowered to 10 l/(m2�h) and the permeate recoverywas lowered to 27 percent, and that made the water permeabilities to stay fairly stable. Theelements with the diamond shape spacer had a stable water permeability at 20°C of 7 l/(m2�h) for46 days, at which time the prefilter was removed. This caused the water permeability to decline.Cleanings restored the water permeability at 20°C to 8 l/(m2�h), but it dropped down to 6 l/(m2�h)in a weeks time. There was no big difference in water permeability decline whether the permeateflux was 10 or 16 l/(m2�h).

15
10
15
20
25
30
0 10 20 30 40 50 60 70 80 90 100
Time in operation, days
Te
mp
era
ture
, de
g.C
0
1
2
3
4
0 10 20 30 40 50 60 70 80 90 100
Time in operation, days
Tur
bid
ity, N
TU
0
2
4
6
8
10
0 10 20 30 40 50 60 70 80 90 100
Time in operation, days
Chl
ora
min
e c
onc
ent
ratio
n,
mg
/l
Figure 4.—Temperature, turbidity and chloramine concentration in the feed water to the membrane units when operating with the AK membrane elements.

16
0
2
4
6
8
10
12
0 10 20 30 40 50 60 70 80 90 100Time in operation, days
A(2
0C
)*1
0^6
, m/(
s*M
Pa
)
F lux, l/(m2*h)10
Vertical arrows denote element cleaning
20 15 10
75 5 75 20 75 10 No prefilter Prefilter micron rating 100
42 27 Permeate recovery, % 16 25 26 42 27
AK membrane, parallel spacer
0
2
4
6
8
10
12
0 10 20 30 40 50 60 70 80 90 100Time in operation, days
A(2
0C
)*1
0^6
, m/(
s*M
Pa
)
22 Flux, l/(m2*h)
AK membrane, diamond shape spacer
Prefilter micron rating 75 5 75 20 100 No prefilter 100
10 16 10
43 27 Permeate recovery, % 20 27
Vertical arrows denote element cleaning
Figure 5.—Water permeabilities corrected to 20°C (A(20C) of the AK elements when operating on the wasterwater.

17
The membrane elements with the parallel spacer experienced a decrease in the waterpermeability at 20°C from 6�10-6 to 5�10-6 m/(s�MPa) during 23 days of operation with prefilters,compared to stable performance at a higher water permeability for the membrane elements withthe diamond shape spacer. Thus, elements with the parallel spacer seemed to be more foulingsensitive than elements with the standard diamond shape spacer. The prefilter was removed tosee if the membrane elements could operate satisfactorily without it. The decline in waterpermeability worsened with time. For the first 20 days without prefilter, this decline rate mighthave been acceptable, but it was not acceptable after that.
The membrane elements with the diamond shape spacer performed better those with the parallelspacer also when there was no prefilter installed.
At the end of the test with the AK elements, the prefilters were reinstalled, but that did not stopthe decline in the water permeabilities with operating time. It seemed that the cleanings did notrestore the membrane elements completely. Even though the cleanings restored the waterpermeability to the same level as the previous cleaning, the rate in performance loss betweencleanings increased all the time at constant permeate flux and degree of prefiltration.
The normalized pressure drops over the four membrane elements are shown in Figure 6. Thecleaning frequency is as shown in Figure 5. As long as melt blown Hytrex prefilters withnominal rating 5, 10, 20 or 75 �m were used, the normalized pressure drop was stable. However, these filters had to be replaced about every 5 days, during which they treated about100 m3 (30 kgal) of feed water. A nominal 100 �m wound prefilter treated the feed water to theunit with the diamond shape spacer for 34 days without replacement. This caused more materialto accumulate inside the elements, which is evident from the rise in the pressure drop. However,it did not affect the water permeability of the elements, which is shown in Figure 5, and cleaningseemed to restore the elements completely.
The conductivity permeabilities normalized to 20°C are shown in Figure 7. The conductivityrejection varied in the range 93-99 percent. Again, the permeate flux, permeate recovery, andprefilter and cleaning frequencies are as shown in Figure 5. They were initially 0.1 �m/s, anddecreased with operating time to reach 0.05 �m/s after 30 days. Later, the conductivitypermeabilities increased, which coincided with the increase in the pressure drop over theelements. Most likely, the accumulation of particulate material in the membrane elements,hindered the back diffusion of rejected dissolved solids from the membrane surface. This causedan increase in the solute concentration at the membrane surface, which in turn increased thesolute passage through the membrane. The conductivity permeability at 20°C increased up to0.18 �m/s for the membrane elements with the parallel spacer, but cleaning of the membraneelements restored it back to 0.07 �m/s.

18
0
50
100
150
200
250
300
350
400
450
0 10 20 30 40 50 60 70 80 90 100Time in operation, days
No
rm. p
ress
ure
dro
p o
ver
4 e
lem
ent
s,
kPa
AK membrane, parallel spacer
5-75 Prefilter micron rating No prefilter 100
0
50
100
150
200
250
300
350
400
450
0 10 20 30 40 50 60 70 80 90 100Time in operation, days
No
rm. p
ress
ure
dro
p o
ver
4 e
lem
ent
s,
kPa
AK membrane, diamond shape spacer
5-75 100 Prefilter micron rating No prefilter 100
Figure 6.—Pressure drop over the four AK elements, normalized to 20°C and 1.3 m3/h (5.7 gpm) average feed/concentrate flow rate.

19
0
0.02
0.04
0.06
0.08
0.1
0.12
0.14
0.16
0.18
0.2
0 10 20 30 40 50 60 70 80 90 100
Time in operation, days
B(2
0C
)*1
0^6
, m/s
AK membrane, parallel spacer
0
0.02
0.04
0.06
0.08
0.1
0.12
0.14
0.16
0.18
0.2
0 10 20 30 40 50 60 70 80 90 100
Time in operation, days
B(2
0C
)*1
0^6
, m/s
AK membrane, diamond shape spacer
Figure 7.—Conductivity permeabilities corrected to 20°C (B(20C) of the AK elements when operating on the wastewater.

20
After a final cleaning, the membrane units operated for 5 days before they were shut down forremoval of the elements. The two leading membrane elements and the next to the leadingelement with the parallel spacer were opened up for inspection. The first 0.2 m (8 inches) ofmembrane of both the leading elements were heavily covered by a brown slimy substance. Theremaining 0.8 m length of the membrane and the membrane of the next to the leading elementwere only lightly covered by the same brown substance. The brown slimy substance was easilyremoved by gently wiping with the finger. It was evident that the brown substance first coveredall the membrane lightly, and that the heavy cover was slowly spreading downstream from theupstream end of the upstream element. The brown substance was especially prevalent where thelongitudinal strands were in contact with the membrane.
Six membrane samples were cut out from the most heavily fouled part of the leading elementwith the diamond shape spacer. Two samples were held under faucet with 45°C water comingout, which removed the foulants. Two membrane samples soaked in 0.1 M sodium hydroxide (NaOH) at 25°C for 15 minutes. The remaining two membrane samples soaked in 0.1 M hydrochloric (HCl) acid at 25°C for 15 minutes. The sodium hydroxide solution made thebrown foulant to detach from the membrane and float to the surface of the solution. The acidsolution seemed not to affect the brown foulant. Then the membrane samples were tested with a0.1 wt% sodium chloride solution at 690 kPa (100 psi) gage pressure and 24°C. The test resultafter one hour in operation is shown in Table 4. With readings taken one hour after start of test,the presented data are the average of two values and the spread, BNaCl(20C) is the sodium chloridepermeability at 20°C based on wt%.
Table 4.—Test Data for Fouled AK Membrane Samples, Which Have Been “Cleaned” With Three Different Methods
Cleaning method 45°C flush 0.1 M NaOH 0.1 M HCl
A(20C)�106, m/(s�MPa) 13.5±0.2 14.6±0.6 10.1±0.1
BNaCl(20C)�106, m/s 0.16±0.05 0.21±0.01 0.074±0.008
The soak in the sodium hydroxide solution restored the water permeability of the AK membraneto its nominal value. The flush with 45°C tap water was almost as good as the soak in the sodiumhydroxide solution to restore the water permeability. The soak in the hydrochloric acid solutiondid not affect the water permeability significantly.
8.2 Performance of the DK Membrane Elements
Figure 8 shows the temperature, turbidity and chloramine concentration in the feed water to themembrane units when operating with the DK membrane elements. The chloramine concentrationwas zero a few times because problems with the hypochlorite addition.

21
10
15
20
25
30
0 10 20 30 40 50 60 70 80 90 100
Time in operation, days
Te
mp
era
ture
, de
g.C
0
1
2
3
4
0 10 20 30 40 50 60 70 80 90 100
Time in operation, days
Tur
bid
ity, N
TU
0
2
4
6
8
10
0 10 20 30 40 50 60 70 80 90 100
Time in operation, days
Chl
ora
min
e c
onc
ent
ratio
n m
g/l
Figure 8.—Temperature, turbidity and chloramine concentration in the feed water to the membrane units when operating with the DK membrane elements.

22
During the whole test with the DK elements, nominal 100 �m wound cartridge filters were usedfor prefiltration, and the permeate recovery was about 27 percent. In the test with the AK elements, the same nominal 100 �m wound cartridge filter was used for 34 days. In the testwith the DK elements, the time between prefilter replacement varied between 3 and 16 days, withan average of 8 days.
After 75 days of testing the DK elements with the diamond shape spacer, it was noticed that thedownstream pressure gage of that membrane unit was stuck at about 43 psig, so it was replaced.It is not known for how long time it was unreliable, but the first suspicious value occurred after 42 days of testing. Thus, the water permeability and pressure drop data between 42 and 75 daysof testing these elements are not reliable. However, the trends between changes in operatingconditions in that time period should be correct.
Figure 9 shows the water permeability of the elements during the 86 days of operation.Antiscalant was added all the time. Prefiltration consisted of a nominal 100 �m wound cartridgefilter. The permeate recovery was 27 percent. The membrane elements had originally, whentested on a MgSO4 solution, a water permeability at 20°C of 10�10-6 m/(s�MPa). Cleaningconsisted of alkaline cleaning only. Inside the rectangle, the data are not reliable because thedownstream pressure gage was stuck, but the trends are valid. During the first 19 days, thepermeate flux was 10 l/(m2�h) (6 gfd). The water permeabilities at 20°C were stable at about11�10-6 m/(s�MPa) for the first 10 days and then started to decline. When the permeate flux wasincreased to 15 l/(m2�h), the rate of decline in water permeability increased somewhat. Alkalinecleanings restored the water permeabilities to their initial values or slightly higher. The rate ofdecline in water permeability after cleaning was rather high, however. Typically, there was a 50 percent reduction in water permeability during a week of operation. As in the case of the AK elements, also for the DK elements, the elements with the diamond shape spacer performedbetter than the elements with the parallel spacer.
After 41 days of operation, there was a shut down for 37 hours for general facility maintenance,including cleaning of the media filter in the pretreatment section. Upon restart, the waterpermeability at 20°C of the elements with the parallel spacer was 8�10-6 m/(s�MPa), compared to5�10-6 m/(s�MPa) just before the shut down. The unit with the other elements was also shut down,but its downstream pressure gage was not reliable after the shut down, so it is not known howthese elements reacted to the shut down. When starting up after a short stop to replace the faultypressure gage after 75 days of operation, the concentrate was very dark brown for severalminutes, which indicated that foulants had loosened from the membrane, and were flushed out.

23
0
2
4
6
8
10
12
14
0 10 20 30 40 50 60 70 80 90 100
Time in operation, days
A(2
0C
)*1
0^6
, m/(
s*M
Pa
)DK membrane, parallel spacer
Flux, l/(m2*h)10 15 10
Vertical arrows denote element cleaning
Daily shut downs
#
# = A 37 h shut down at 41 days
0
2
4
6
8
10
12
14
0 10 20 30 40 50 60 70 80 90 100
Time in operation, days
A(2
0C
)*1
0^6
, m/(
s*M
Pa
)
DK membrane, diamond shape spacer
Flux, l/(m2*h)10 15 10
Daily shut downsVertical arrows denote cleanings
Figure 9.—Water permeabilities corrected to 20°C (A(20C) of the DK elements when operating on the wastewater.

24
For the last 10 days, the units were shut down for about 10 minutes twice daily. This stabilizedthe water permeability at 20°C for the elements with the parallel spacer to be within 6�10-6 and8�10-6 m/(s�MPa). For the elements with the diamond shape spacer, the water permeability at20°C decreased during the first 6 days of twice daily shut downs to 7�10-6 m/(s�MPa), but thensuddenly jumped up to 10�10-6 m/(s�MPa). During the remaining four days, the waterpermeability at 20°C decreased to 8�10-6 m/(s�MPa). After 85 days of operation, there was a 23 hours stop, which was caused by a power outage. This stop caused the water permeabilitiesfor the elements in both the membrane units to temporarily increase significantly.
The normalized pressure drop over the elements is shown in Figure 10. The cleaning frequencymatched that as shown in Figure 9. There is no significant difference between the two types ofelements, except between 76 and 82 days of operation. This was the first six days of twice dailyshut downs of the units. The rectangle shows the period of time when the downstream pressuregage was suspect.
The conductivity permeabilities at 20°C of the elements are shown in Figure 11. Theconductivity rejection varied in the range of 20 to 50 percent. The permeate flux, recovery andprefilter and cleaning frequencies are as shown in Figure 9. These increase steadily up to thepoint of the first alkaline cleaning. After the first alkaline cleaning, they seemed to havestabilized at 6-8 �m/s for the elements with the parallel spacer, and 5-7 �m/s for the elementswith the diamond shape spacer. The variations within these ranges were probably caused by thevariations of the amounts of foulants on the membrane surface.
At the end of the test, the upstream and downstream elements in both membrane units wereremoved, and the remaining membrane elements went through alkaline cleaning. The upstreamelement with the diamond shape spacer and the downstream element with the parallel spacerwere opened up and inspected. The membrane in both elements were covered by a layer ofbrown deposit. For the element with the parallel spacer, the deposits where slightly thicker on themembrane surface which was closer to the cross strands than the membrane on the other side ofthe spacer.
Two of the cleaned membrane elements, from the second position of each membrane unit, wereopened up and inspected. The element with the diamond shape spacer had all the brown depositsremoved, except for linear brown stains on the membrane where it was in direct contact with thefeed channel spacer, and also linear brown stains directly underneath the strands which were notin contact with the membrane. In general, the membrane was slightly darker closer to thecentertube than in the outer areas. Even though almost all the membrane looked very clean, itwas covered by a thin transparent slimy layer, which was easily wiped away with a finger. Thisslimy layer is probably what caused the high fouling rate during operation.

25
0
100
200
300
400
500
600
700
800
0 10 20 30 40 50 60 70 80 90 100
Time in operation, days
No
rm. p
ress
ure
dro
p o
ver
4 e
lem
ent
s kP
aDK membrane, parallel spacer
0
100
200
300
400
500
600
700
800
0 10 20 30 40 50 60 70 80 90 100Time in operation, days
No
rm.
pre
ss
ure
dro
p o
ver
4 e
lem
en
ts
kPa
DK membrane, diamond shape spacer
Figure 10.—Pressure drop over the four DK elements, normalized to 20°C and 1.3 m3/h (5.7 gpm) average feed/concentrate flow rate.

26
0
1
2
3
4
5
6
7
8
9
10
0 10 20 30 40 50 60 70 80 90 100
Time in operation, days
B(2
0C
)*1
0^6
, m/s
DK membrane, parallel spacer
0
1
2
3
4
5
6
7
8
9
10
0 10 20 30 40 50 60 70 80 90 100
Time in operation, days
B(2
0C
)*1
0^6
, cm
/s
DK membrane, diamond shape spacer
Figure 11.—Conductivity permeabilities corrected to 20°C (B(20C) of the DK elements when operating on the wastewater.

27
The element with the parallel spacer had still a lot of brown deposits on the membrane. Therewere a few 0.1 m (4 inches) wide areas in parallel with the centertube, covering the whole lengthof the element, which had been cleaned from the brown deposits. This indicates that there wasuneven flow distribution within the element. Most of the feed flow went to a few channels, andthese channels were cleaned very well. Most of the flow channels, however, must have got a verylow feed flow rate, which caused them to foul heavily, and made cleaning difficult. Also in thiselement, there was the thin slimy transparent layer, and linear brown stains between thelongitudinal strands and the membrane and where the cross strands passed over the membrane.
9. Analysis of Results
Membrane elements with the standard diamond shape feed channel spacer outperformed theelements with the parallel spacer. The main reason for this was probably uneven flowdistribution on the feed side of the latter elements. The feed and exit ports of the elementhousings had an inner diameter of 12 mm (0.5 inch), and there was 4 cm (1.6 inches) distancebetween the inner end of the port and the feed channel of the element. With the typical feed flowrate of 23 l/minute (6 gpm), the feed velocity in the port was 4 m/s (13 ft/s), which correspondsto a dynamic pressure of 8 kPa (1.2 psi). The feed side pressure drop over a clean element withthis feed flow rate should be between 8 and 13 kPa. Thus, the dynamic pressure was about thesame as the expected pressure drop over the element. This coupled with the design of the parallelfeed channel spacer, which hinders feed flow redistribution after entering the element, mostlikely resulted in a highly uneven flow distribution on the feed side of the membrane element.
The membrane fouling was mainly caused by small colloidal material which passed through anominal 5 �m melt blown filter. It was deposited on the membrane surface independent on thetype of feed channel spacer. It was easily removed by an alkaline cleaning, and it was enoughwith a 10 minutes shut down to detach some of the deposits from the membrane surface. Theeasiness in which the deposits could be removed, resulted in no advantage in using the parallelspacer instead of the diamond shape spacer. Even with even flow distribution, the parallel spacerwould not be to any advantage in operating on the tertiary treated wastewater.
Membrane microfiltration uses short term reverse permeate flow (higher pressure on thepermeate side than on the feed side) to remove deposits from the membrane surface. This methodwould work very well also with spiral wound elements operating on the tertiary treated municipalwastewater. However, the reverse permeate flow would probably shorten the life time of themembrane elements. Spiral wound membrane elements normally will not be damaged from up to100 kPa (15 psi) higher pressure on the permeate side than on the feed side, but doing thisrepeatedly would most likely with time cause damage.
Membrane foulants were stuck between the spacer strands and the membrane where these werein contact with each other, which is as expected. More difficult to explain is why there were linesof dark material on the membrane underneath or above the strands which were half a channelheight away from the membrane surface. The only plausible explanation is that these strands

28
generate a flow pattern, which forms a wake on the membrane surface just below or above thestrand. It is not likely that the accumulation of foulants in these suggested wakes contributedsignificantly to the overall fouling of the membrane surface.
In operation, the tested DK nanofiltration membrane elements had the same water permeabilitiesafter cleaning as at the initial production test on a clean magnesium sulfate solution. The testedAK reverse osmosis membrane elements on the other hand, had only about half or less of theiroriginal water permeability when operating on the wastewater. The difference was most likelythat the AK membrane attracted the foulants more strongly than the DK membrane. It can not beexcluded, however, that the higher salt concentration at the membrane surface in the case for theAK membrane compared to the DK membrane, also had an influence on the fouling tendency.The feed temperature was higher when operating the DK elements than when operating the AK elements, which should have resulted in faster microbiological growth in the former case.
The melt blown Hytrex cartridge filters removed the particulate material which caused pressuredrop over the elements, but not the small colloidal particles which caused a decline in the waterpermeability. Such a filter treated about 100 m3 (30 kgal) tertiary treated wastewater beforereplacement. The cost for such a filter is about $4, which gives a prefilter replacement cost of$0.04 per m3 ($0.13 per kgal) wastewater feed. To this comes the labor and disposal costs ofprefilter replacement. These costs together with the frequent cleaning of the RO/NF unit makedisposable cartridge prefiltration not cost competitive with membrane microfiltration aspretreatment.
Alkaline cleaning at pH 11 with a surfactant worked fine to remove the brown deposits from atleast the DK membrane elements. However, there still remained a thin slimy layer on themembrane surface, which without doubt caused the membrane to foul rapidly upon start up. Inorder to make RO/NF without membrane microfiltration competitive with RO/NF withmembrane microfiltration as pretreatment, it is imperative that a cleaning method is developed,which removes the slimy layer. Even better would be an additive to the feed solution, whichprevented the formation of the slimy material.
If a cleaning method is developed, which removes the slimy layer on the membrane, the requiredcleaning frequency would be every 3 to 4 weeks according to the first four weeks data in Figures 6 and 9. Prefiltration could consist of a screen with nominal 30-100 �m rating. Suchscreens are commercially available, which have either automatic backwash or other types ofautomatic removal of solids from the screen. The RO/NF unit can most likely not operate at 20 l/(m2�h) (12 gfd) permeate flux, as in the case with membrane microfiltration as prefiltration,but most likely at 10 l/(m2�h) and maybe at 15 l/(m2�h).
Leslie et al. (1998) conducted a cost evaluation of using membrane microfiltration followed byreverse osmosis to treat clarified secondary effluent from municipal wastewater. Their result wasthat the amortized capital costs contributed to 59 percent of the total costs (about 20 percent ofthe total costs was for the amortized capitol costs of the MF and RO membrane units), and theoperating costs for power, membranes and maintenance were about equal. The capital cost for

29
equipment was estimated to $240 per m3/d ($0.9 per gal/d) permeate for the RO unit and $106 per m3/d ($0.4 per gal/d) permeate for the MF unit. If the permeate flux of the RO unit islowered to half of the value, which can be maintained with membrane prefiltration aspretreatment, the RO membrane area to produce a given permeate flow rate would double. Thepumps and instrumentation for the RO unit would remain the same in both cases, but the numberof RO elements, element housings and manifold piping would double. The doubling of thesecomponent would increase the cost of the RO unit by at least 50 percent, making the capital costof the RO to be higher than the combined cost of the alternative membrane microfiltrationfollowed by RO. Operating at a lower permeate flux would require a lower pressure, andconsequently a lower energy consumption. The RO membrane replacement cost would, however,double. It is not likely that eliminating membrane microfiltration and operating the RO unit athalf the permeate flux would be economical. However, if the RO unit could operate well withoutmembrane microfiltration at 15 l/(m2�h) with cleanings every 3-4 weeks, it might be competitiveto RO with membrane microfiltration as pretreatment.

30
References
Bergman (1985). Robert Bergman, Desalination 54, (1985), pp. 55-74.
Chellam et al. (1997). Shankararaman Chellam, Joseph G. Jacangelo, Thomas P. Bonacquisti andBarbara A. Schauer, Effect of pretreatment on surface water nanofiltration, JournalAWWA, 10, No. 10, October 1997.
Leslie et al (1998). G.L. Leslie, W.R. Mills, W.R. Dunivin, M.P. Wehner and R.G. Sudak,“Performance and Economic Evaluation of Membrane Processes for ReuseApplications”, Proc. American Water Works Association, Water Reuse Conference, LakeBuena Vista, Florida, February 1998.
Perry (1963). John H. Perry (Ed.), “Chemical Engineers’ Handbook”, 4th edn., McGraw-HillKogakusha Co., Tokyo, 1963.
31
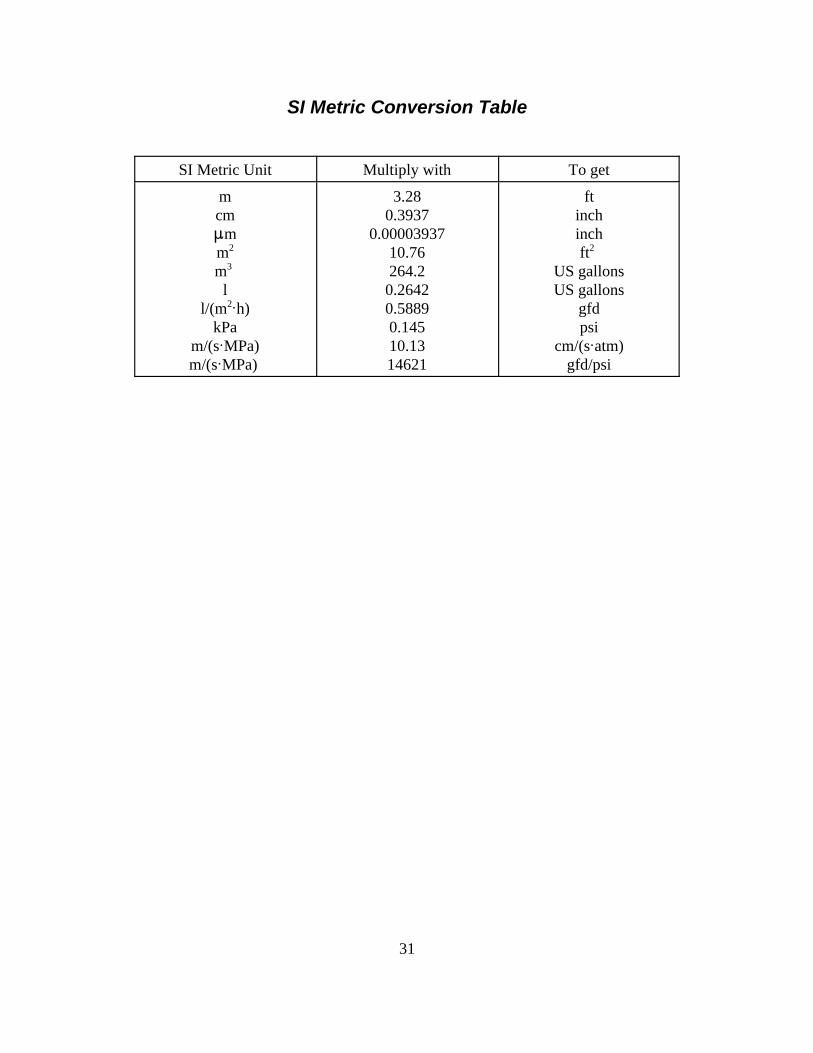
SI Metric Conversion Table
SI Metric Unit Multiply with To get
mcm�mm2
m3 l
l/(m2�h)kPa
m/(s�MPa)m/(s�MPa)
3.280.3937
0.0000393710.76264.20.26420.58890.14510.1314621
ftinchinchft2
US gallonsUS gallons
gfdpsi
cm/(s�atm)gfd/psi

32
Appendix A - Result of Calibration Check
The pressure gages were checked for calibration against a master pressure gage. The masterpressure gage was accurate when checked against a deadweight tester. The pressure gagereadings were in psig. Pread was the pressure gage reading in psig. Preal was the real pressure inpsig, which was obtained from the calibration check. One pressure gage failed, and was replaced12 days before the end of the testing.
Pressure gages used in the membrane unit with the parallel feed channel spacer.Just before upstream element housing: Preal = 0.996�Pread + 2.6Just after downstream element housing: Preal = 0.000109�P2 read +0.9437�Pread +4.47
Pressure gages used in the membrane unit with the diamond shape feed channel spacer.Just before upstream element housing: Preal = 0.986�Pread + 1.3Just after downstream element housing
All the time except after 74.5 days of operation with the DK elements:If Preal < 100; Preal = 0.96�Pread + 4, If Preal > 100; Preal = Pread
After 74.5 days of operation with the DK elements: Preal = Pread
The flow meter readings were in gallons per minute, gpm. After 7 days of operating time withthe AK membrane elements, the permeate flow meters were replaced with smaller ones. Theflowmeters were calibrated using a bucket and a stop watch. Fread was the flow meter reading ingpm. Freal was the real flow rate in gpm, which was obtained from the calibration check.
Flow meters used in the membrane unit with the parallel feed channel spacer.Concentrate flow meter: Freal = Fread
Permeate flow meter for the first 7 days in operation: Freal = Fread + 0.2Permeate flow meter after the first 7 days in operation: Freal = Fread -0.05
Flow meters used in the membrane unit with the diamond shape feed channel spacer.Concentrate flow meter: Freal = Fread
Permeate flow meter for the first 7 days in operation: Freal = Fread + 0.3Permeate flow meter after the first 7 days in operation: Freal = Fread -0.1
During the first week of operation, the temperature gage readings were compared with thetemperatures of the feed solutions, which were measured in the laboratory. The lattertemperatures were mostly about 0.5°C higher than the former ones. It was then assumed that thereal temperature was 0.5°C higher than the reading from the temperature gage.
33
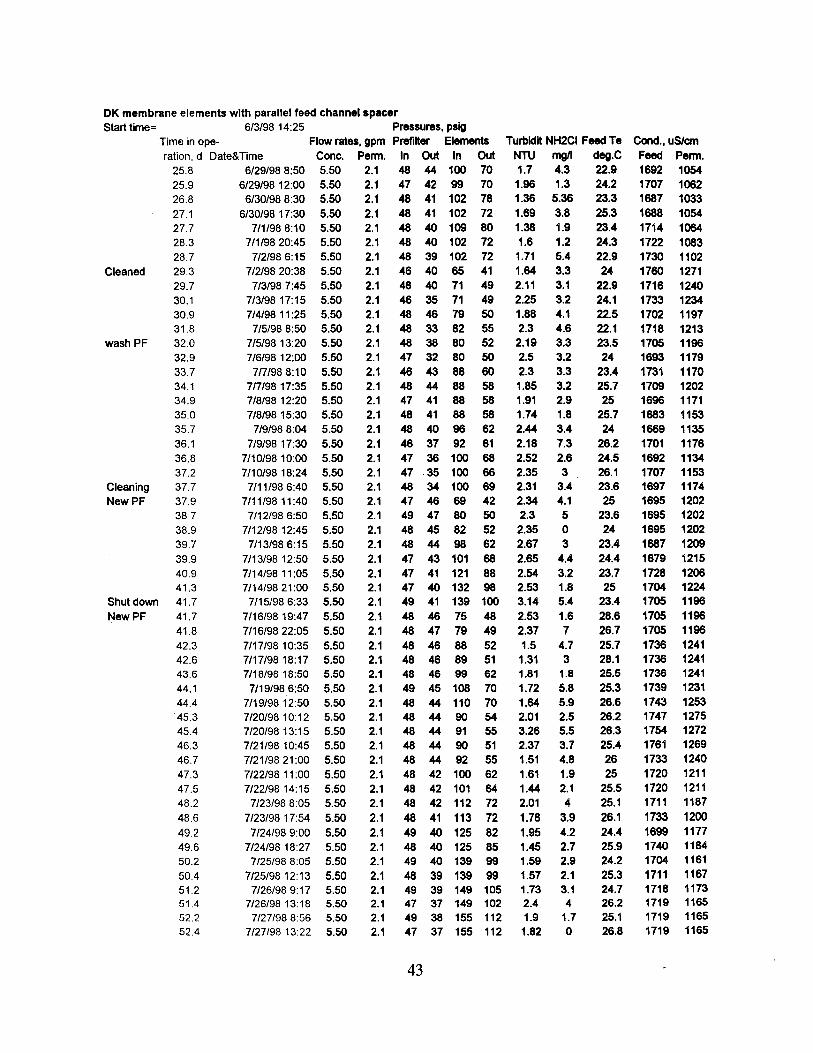
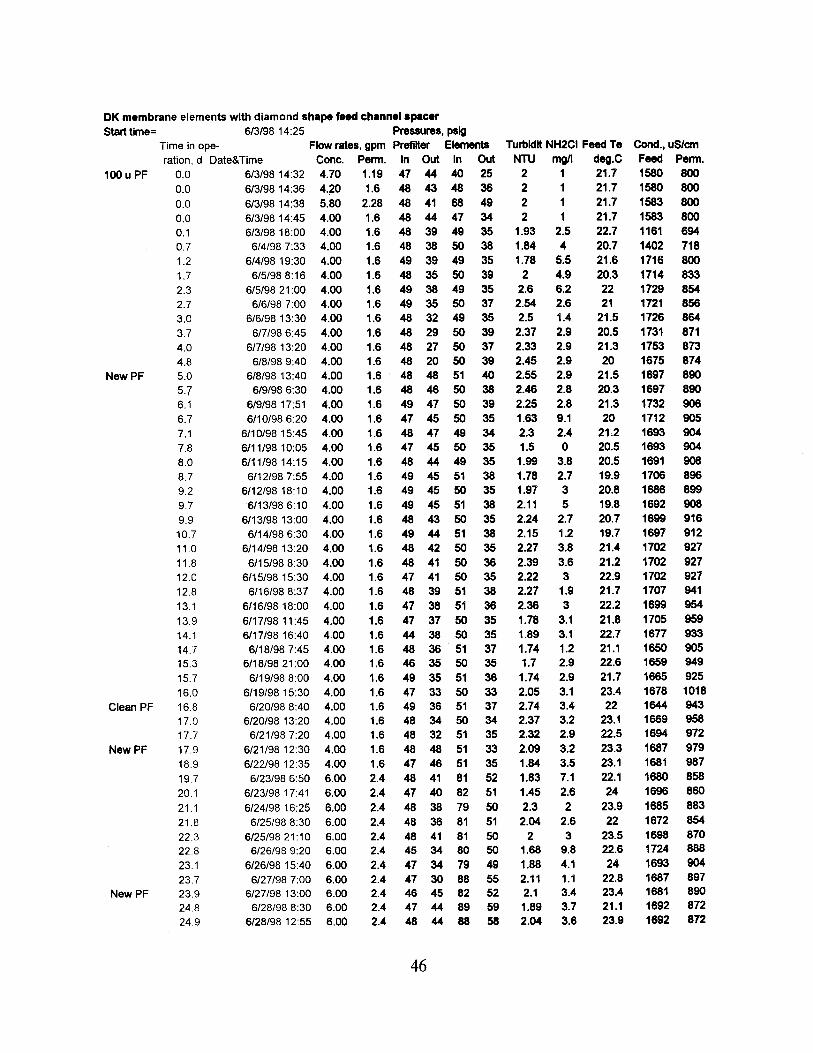
Appendix B - Raw Data Record
The data are shown in following orderPage
� AK elements with parallel spacer . . . . . . . . . . . . . . . . . . . . . . . . . . . . . . . . . . . . 34� AK elements with diamond shape spacer . . . . . . . . . . . . . . . . . . . . . . . . . . . . . . 38� DK elements with parallel spacer . . . . . . . . . . . . . . . . . . . . . . . . . . . . . . . . . . . . 42� DK elements with diamond shape spacer . . . . . . . . . . . . . . . . . . . . . . . . . . . . . . 46