Embed Size (px)
Citation preview
New Decline Curve Tool for GOM3/GOMsmart & “Forgotten Oil & Gas Study”
2012 GOM3 User Conference at AnadarkoJohn D. Grace, Ph.D.
Earth Science Associates
New Tool Objectives
• Provide a robust tool for forecasting production & estimating remaining resources by completion/completion interval
• Introduce optional new method for refining decline curve analysis accounting for “breaks in regime”
• Internally, use tool in batch mode to identify opportunities for further production
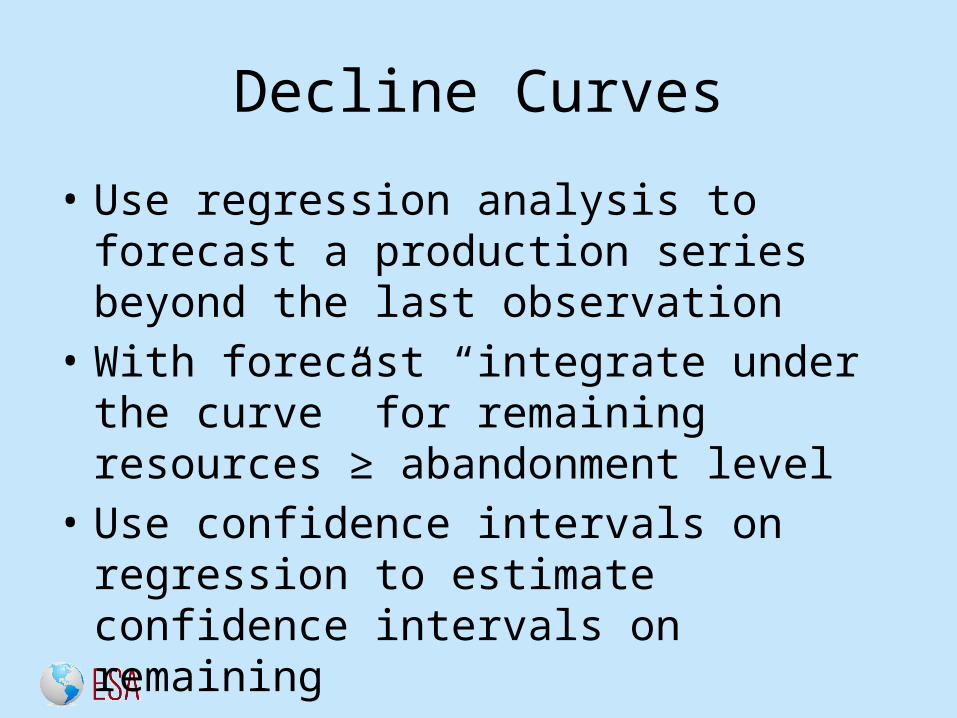
Decline Curves
• Use regression analysis to forecast a production series beyond the last observation
• With forecast “integrate under the curve” for remaining resources ≥ abandonment level
• Use confidence intervals on regression to estimate confidence intervals on remaining
• Use analysis of breaks in time series to improve on “naïve” regression models
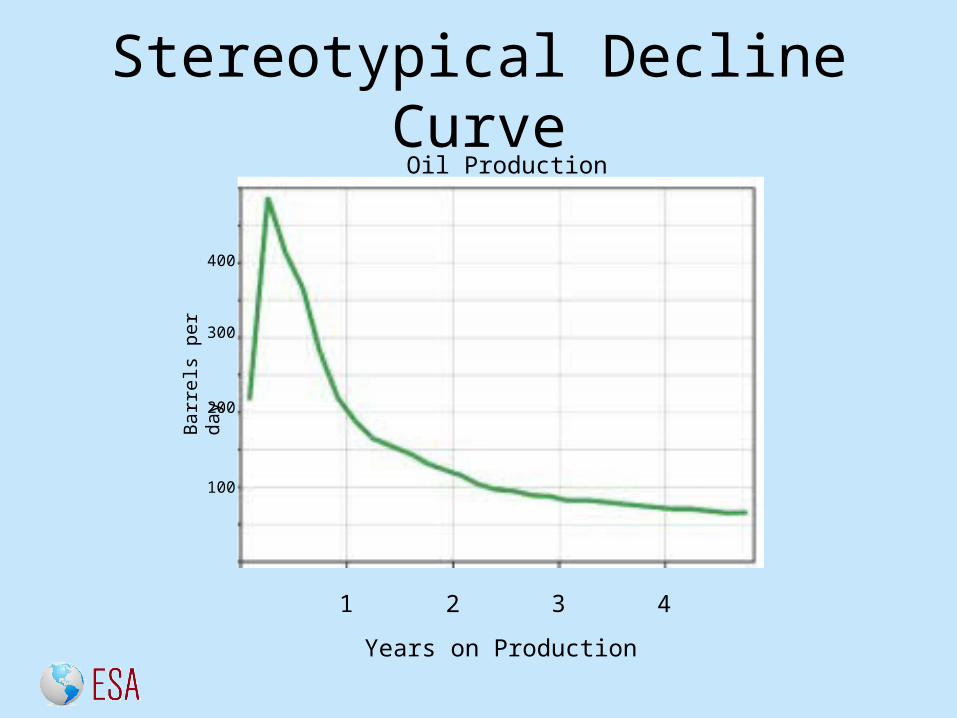
Stereotypical Decline CurveBa
rrel
s pe
r day
Oil Production
100
200
300
400
1 2 3 4
Years on Production
Fitting a Decline Curve
• Classical functional forms of decline curves– Exponential (rate vs. time)– Hyperbolic (rate vs. time)– Linear (rate vs. cumulative production)– P/Z vs. cumulative production (gas only)
• Where does the estimable decline start?– Global maximum production rate?– At the last significant structural break in regime?
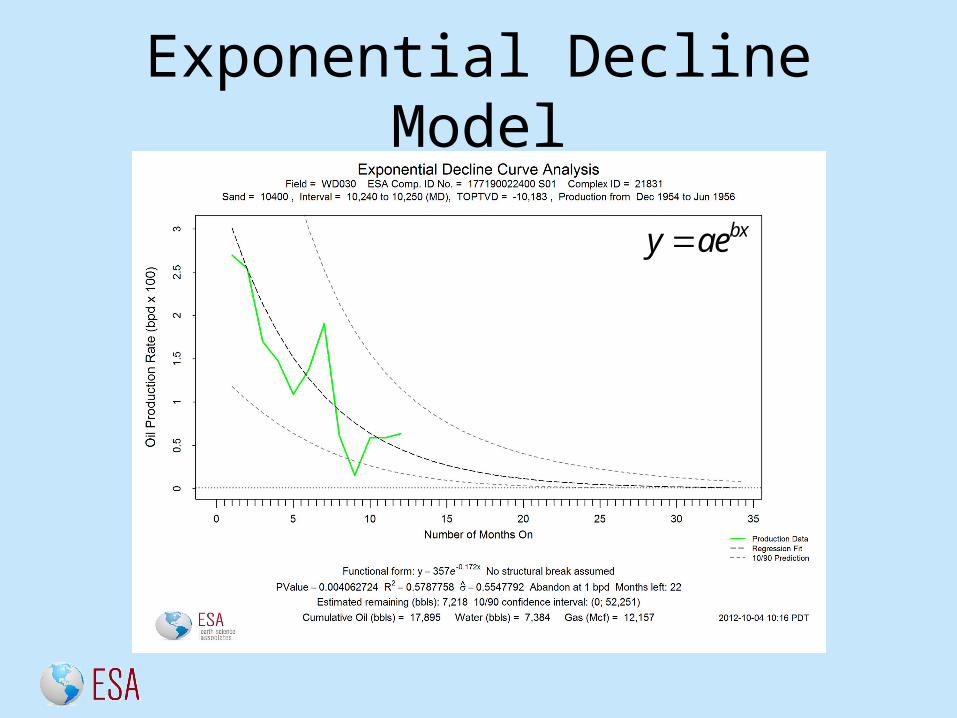
Exponential Decline Model
bxy ae
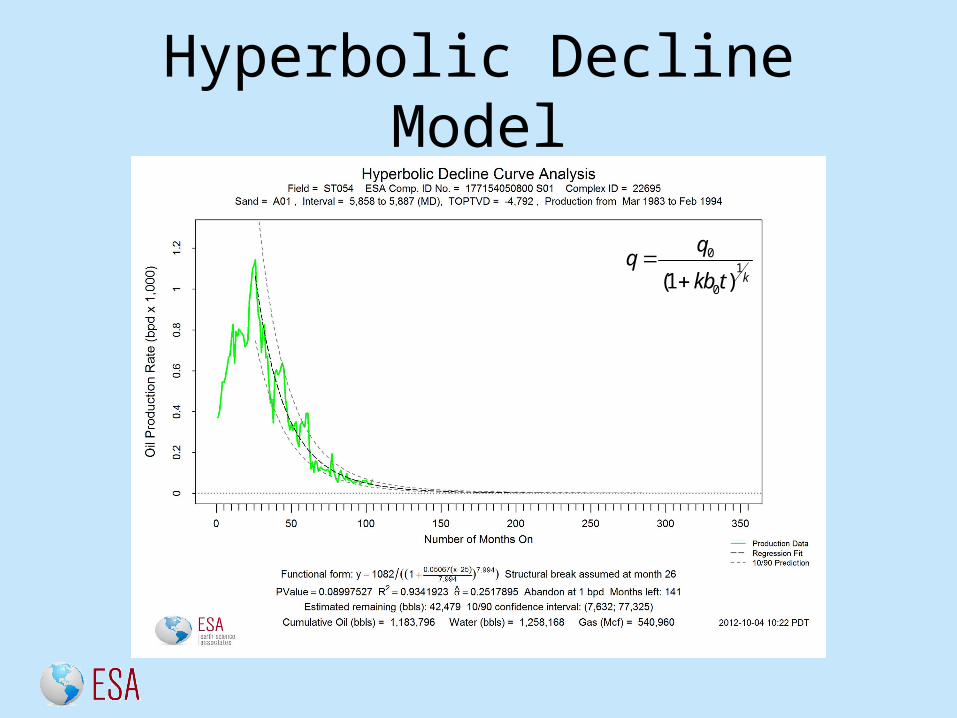
Hyperbolic Decline Model
01
0(1 ) k
kb t
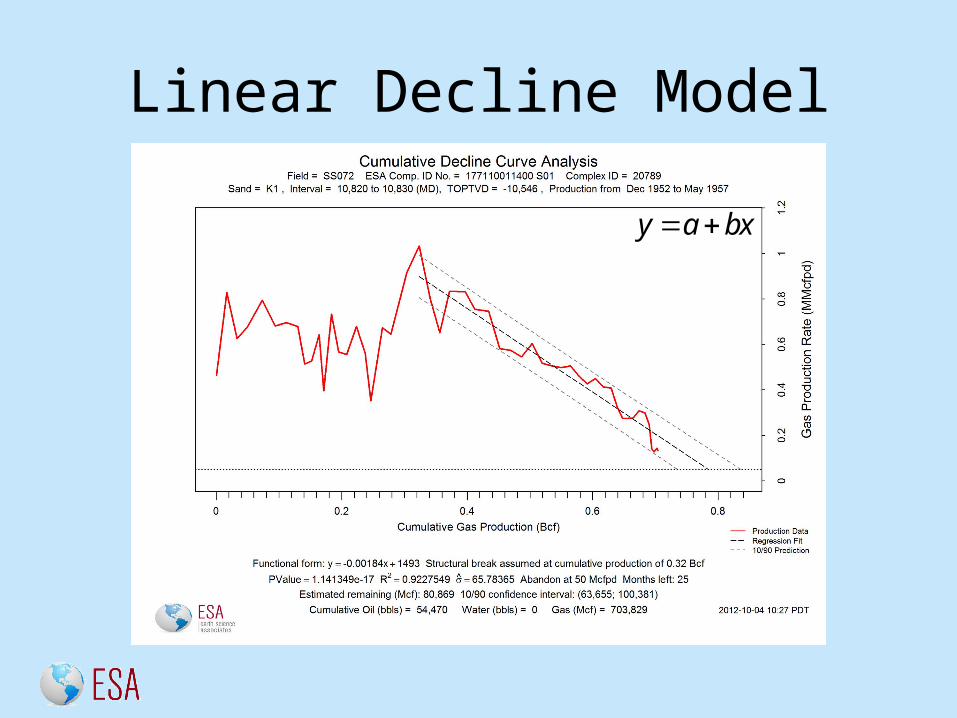
Linear Decline Model
y a bx
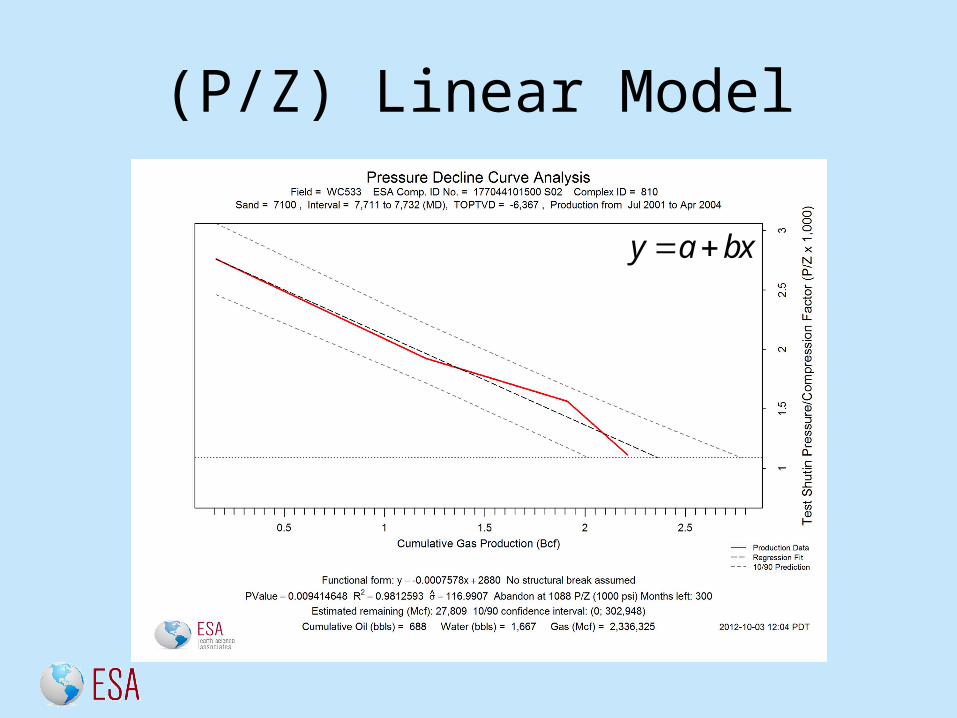
(P/Z) Linear Model
y a bx
Improving & Choosing Model
• Statistical measures of “goodness of fit”– R2 and “predicted R2”– Statistics on estimated parameter of decline– Still under research (e.g., retrospective forecast)
• Actuarial approach (cum. prob. den. function)• Optimal choice of structural break– Last break – problem of shutting down well– Compare candidate breaks (& forms) against cdfs– Allow user to chose break point
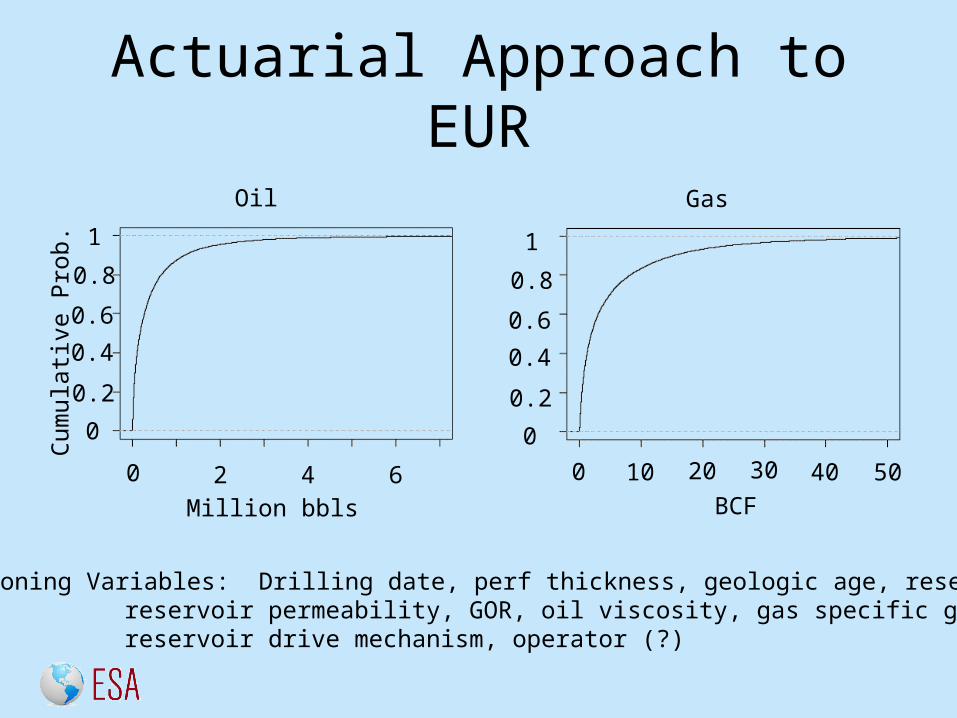
Actuarial Approach to EUR
0 2 4 6
0.2
0.6
0.4
0.8
1
0Cum
ulati
ve P
rob.
Million bbls
Oil
0 10 20 30 40 50
0.2
0.6
0.4
0.8
1
0
BCF
Gas
Conditioning Variables: Drilling date, perf thickness, geologic age, reservoir volume, reservoir permeability, GOR, oil viscosity, gas specific gravity, reservoir drive mechanism, operator (?)
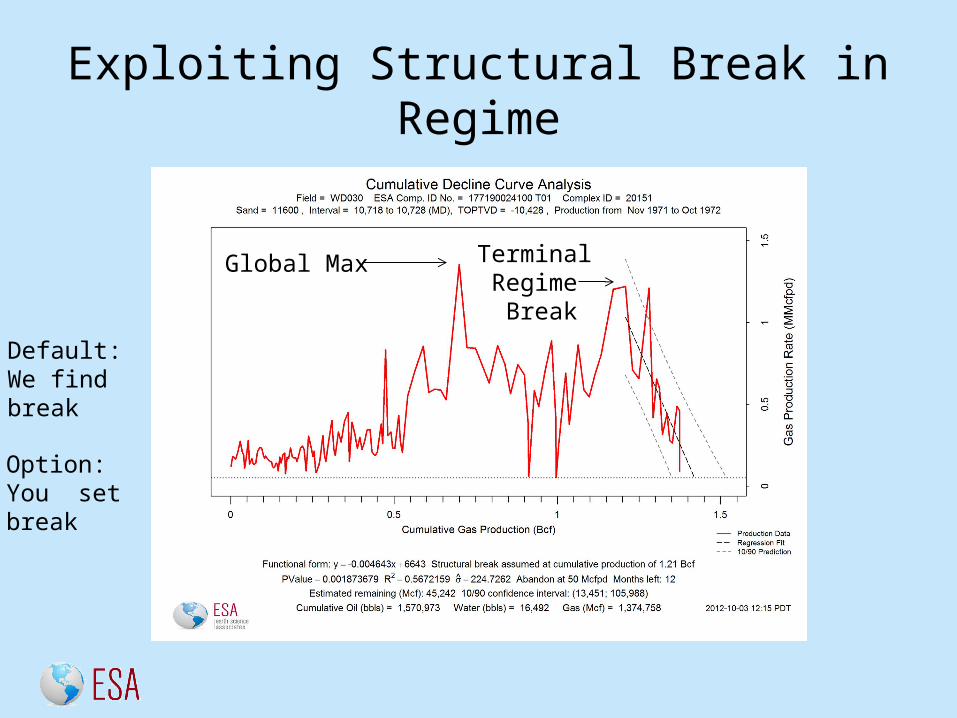
Exploiting Structural Break in Regime
Global Max Terminal Regime
Break
Default:We findbreak
Option:You setbreak
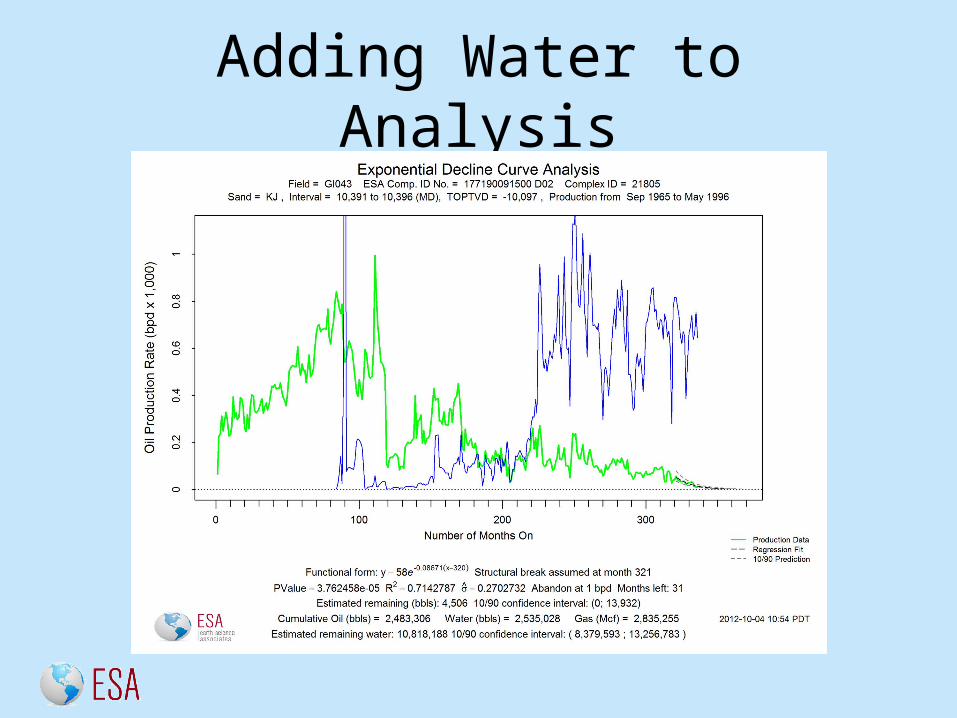
Adding Water to Analysis
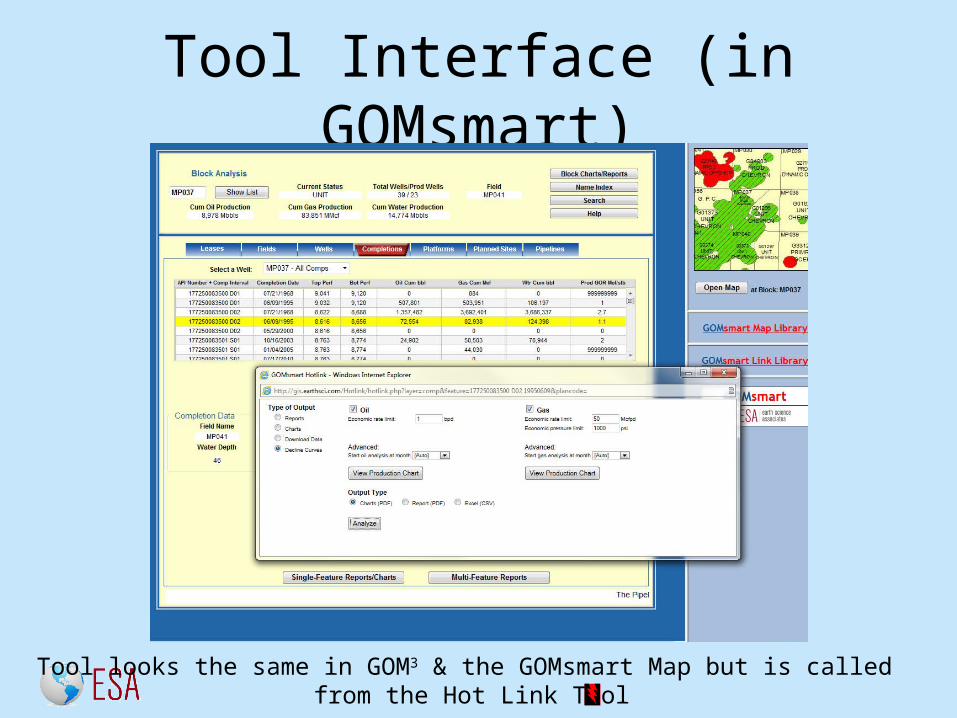
Tool Interface (in GOMsmart)
Tool looks the same in GOM3 & the GOMsmart Map but is called from the Hot Link Tool
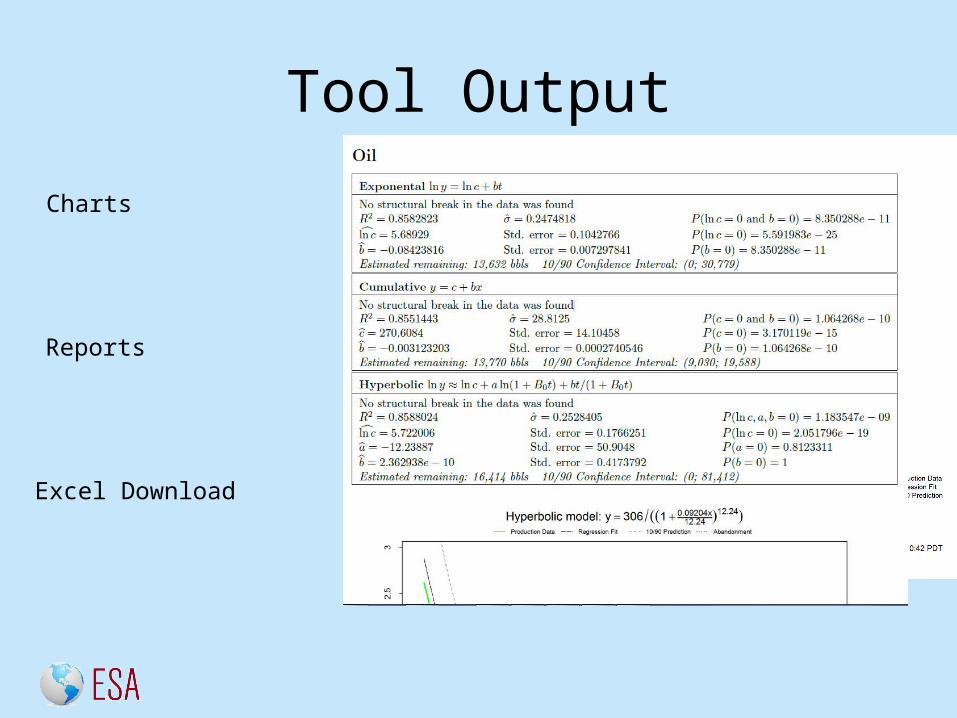
Tool Output
Charts
Reports
Excel Download
“Forgotten Oil & Gas Study”
• Motivated by running Decline Curve Tool in batch mode – ~60,000 completions/ completion intervals– Sensitivities to abandonment rate