Embed Size (px)
Citation preview
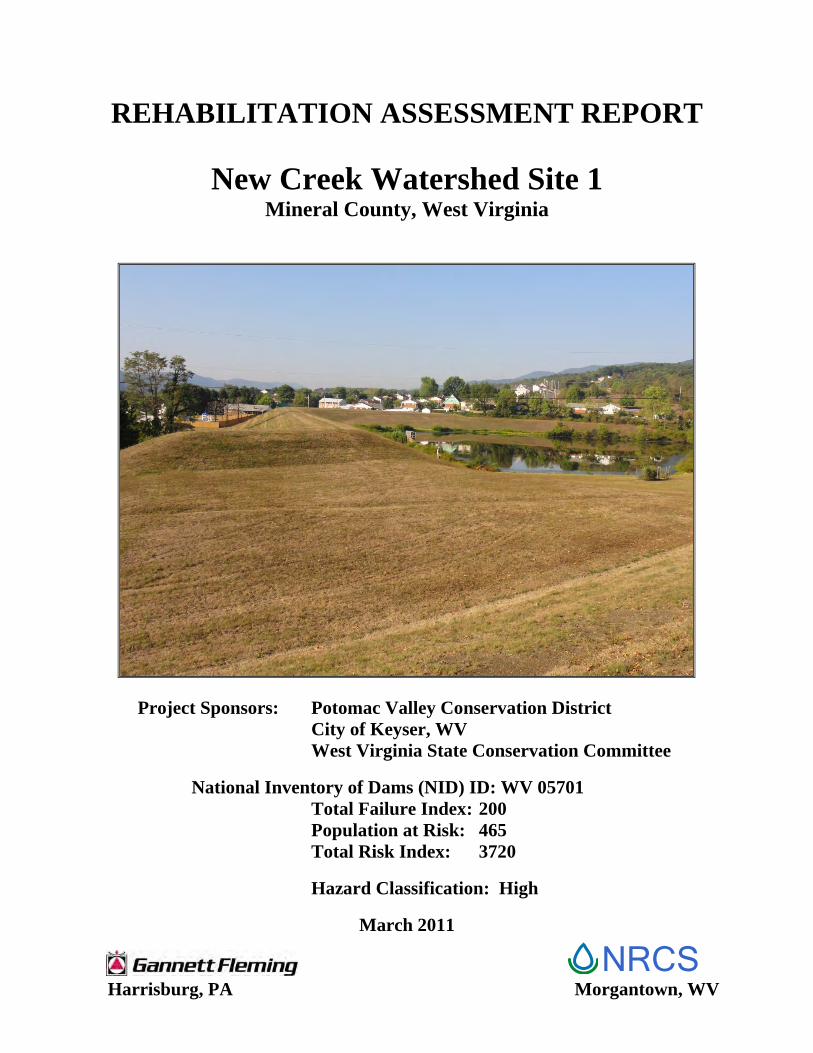
REHABILITATION ASSESSMENT REPORT
New Creek Watershed Site 1 Mineral County, West Virginia
Project Sponsors: Potomac Valley Conservation District City of Keyser, WV West Virginia State Conservation Committee National Inventory of Dams (NID) ID: WV 05701 Total Failure Index: 200 Population at Risk: 465 Total Risk Index: 3720 Hazard Classification: High
March 2011
Harrisburg, PA Morgantown, WV
NRCS
REHABILITATION ASSESSMENT REPORT
NEW CREEK WATERSHED SITE 1
Mineral County, West Virginia
National Inventory of Dams (NID) ID: WV 05701
Project Sponsors:
POTOMAC VALLEY CONSERVATION DISTRICT CITY OF KEYSER, WV
WEST VIRGINIA STATE CONSERVATION COMMITTEE
March 2011
Prepared for
WEST VIRGINIA NRCS MORGANTOWN, WEST VIRGINIA
Prepared by
GANNETT FLEMING, INC. HARRISBURG PENNSYLVANIA

New Creek Site 1 Dam Rehabilitation Assessment Report
• i March 2011
NRCS
REHABILITATION ASSESSMENT REPORT
New Creek Watershed Site 1 Mineral County, West Virginia
Table of Contents Page
1. Introduction and Purpose ....................................................................................................... 1
2. Project Setting and History ..................................................................................................... 1
3. Site Inspection Summary and Operation and Maintenance .................................................... 2
4. Hydrologic and Hydraulic Analyses ....................................................................................... 7
5. Spillway Integrity Analyses .................................................................................................... 8
6. Breach Inundation Mapping and Hazard Classification Summary ......................................... 9
7. Review of Available Geotechnical Information ................................................................... 12
8. Failure and Risk Indexes ....................................................................................................... 13
9. Discussion of Potential Rehabilitation Alternatives ............................................................. 13
10. Cost Estimates for Rehabilitation Alternatives ..................................................................... 14
11. Conclusions and Recommendations ..................................................................................... 15
Exhibits
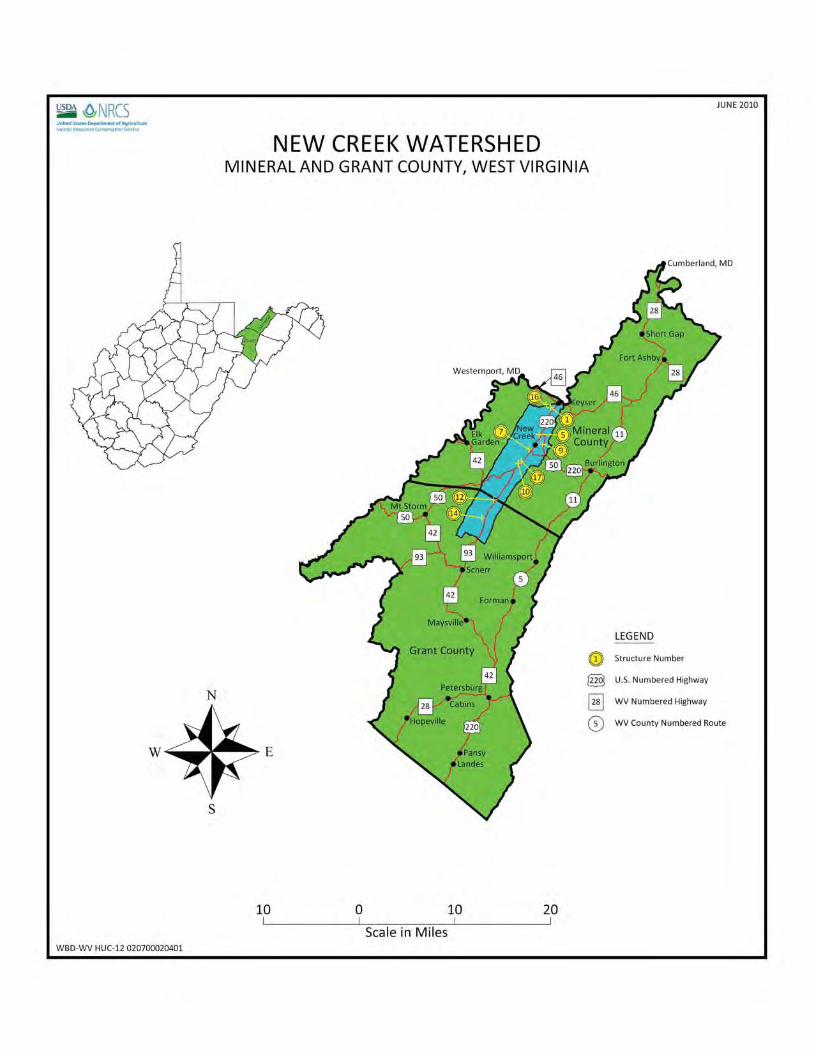
Exhibit 1 Project Map for the New Creek Watershed
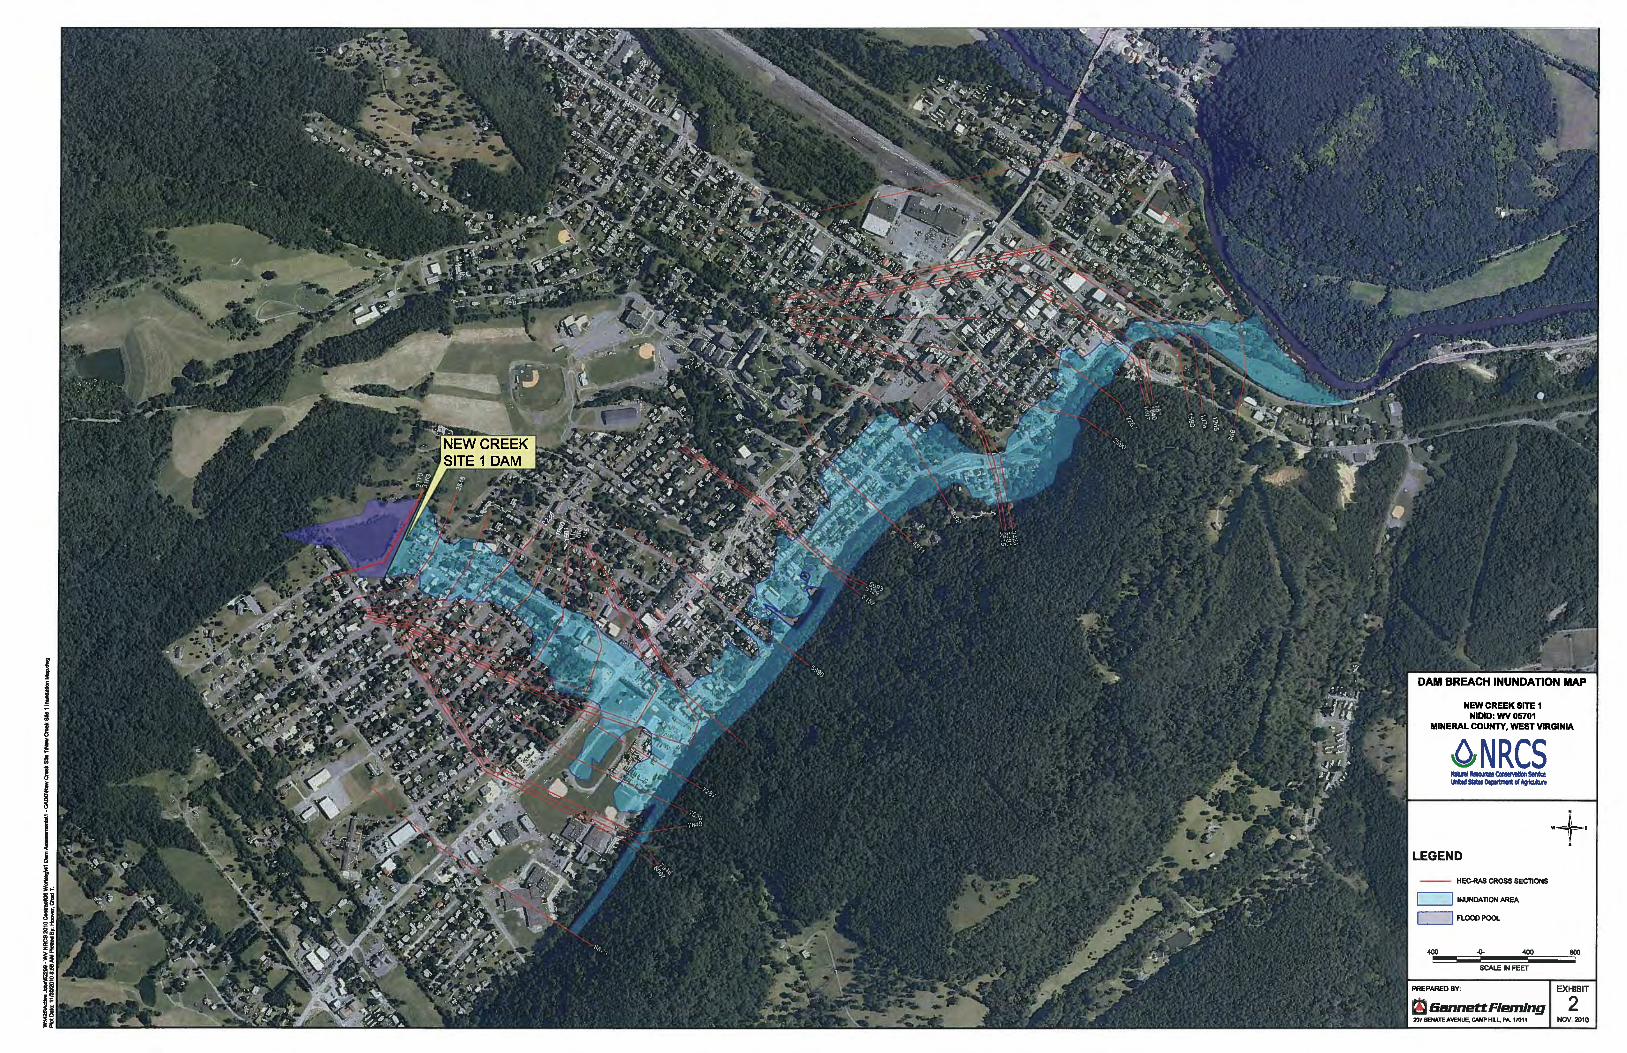
Exhibit 2 Limits of the Maximum Pool Elevation and the Downstream Inundation Limits on Ortohphoto Base Map
Exhibit 3 Limits of the Maximum Pool Elevation and the Downstream Inundation Limits on USGS 7.5 Minute Quadrangle Base Map
Appendices
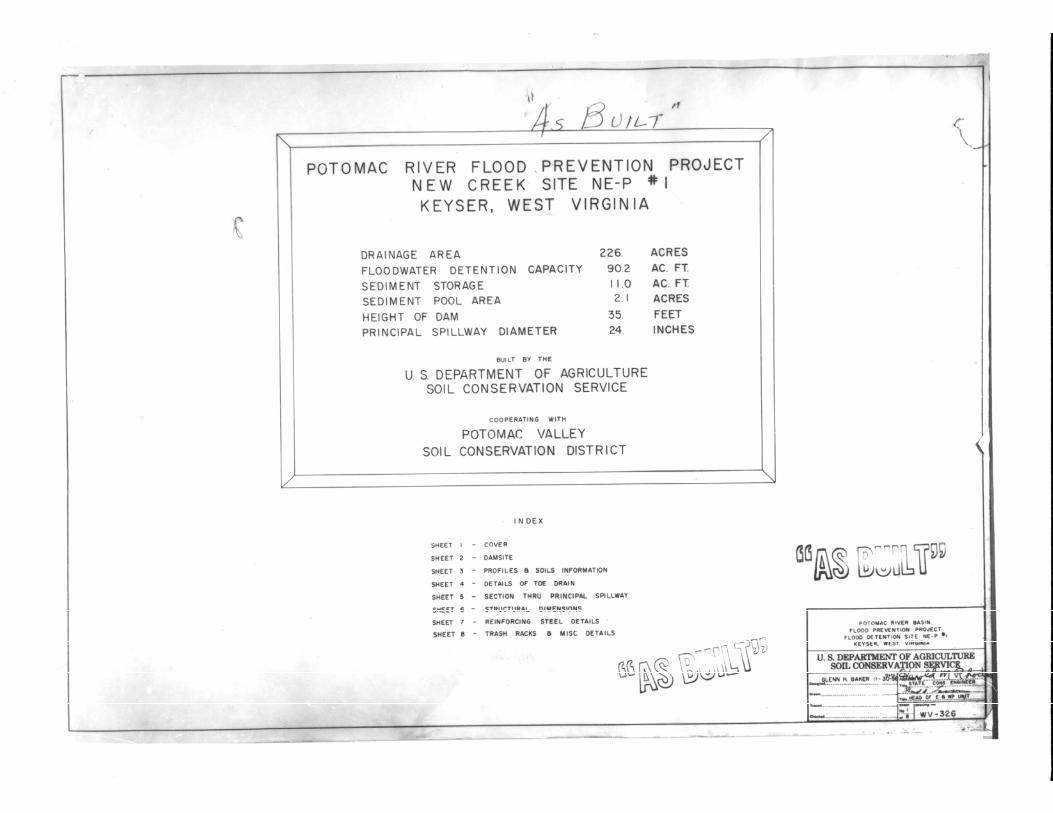
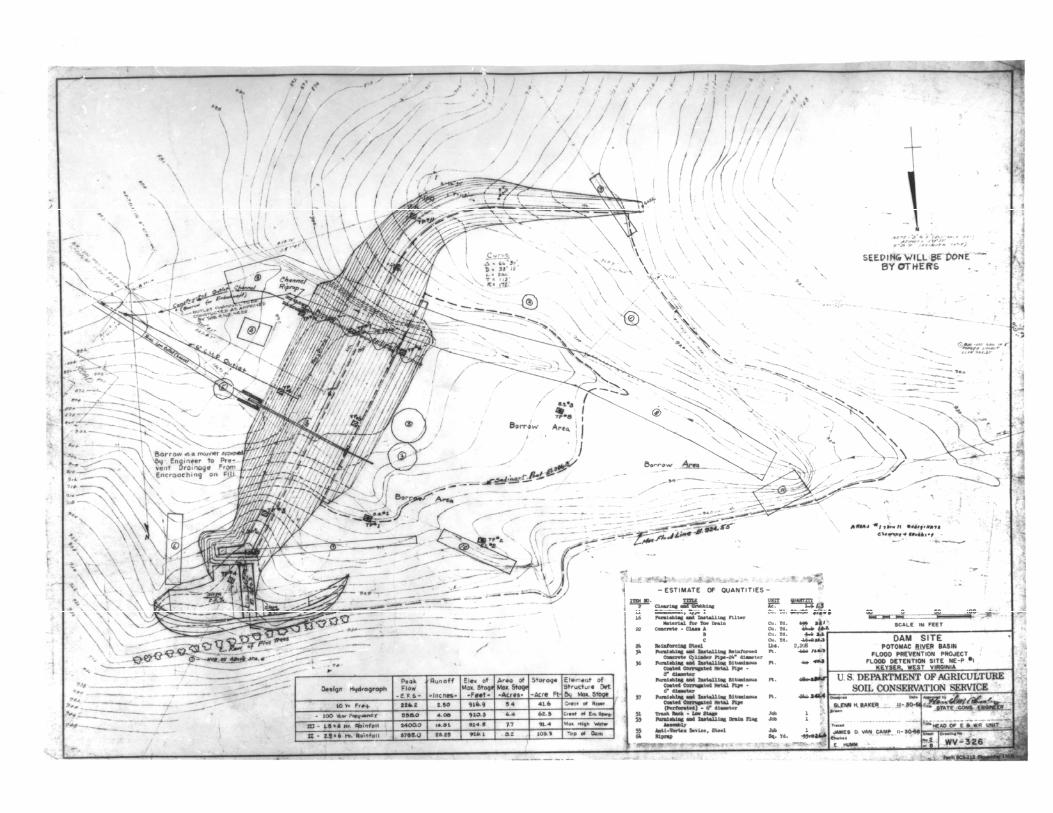
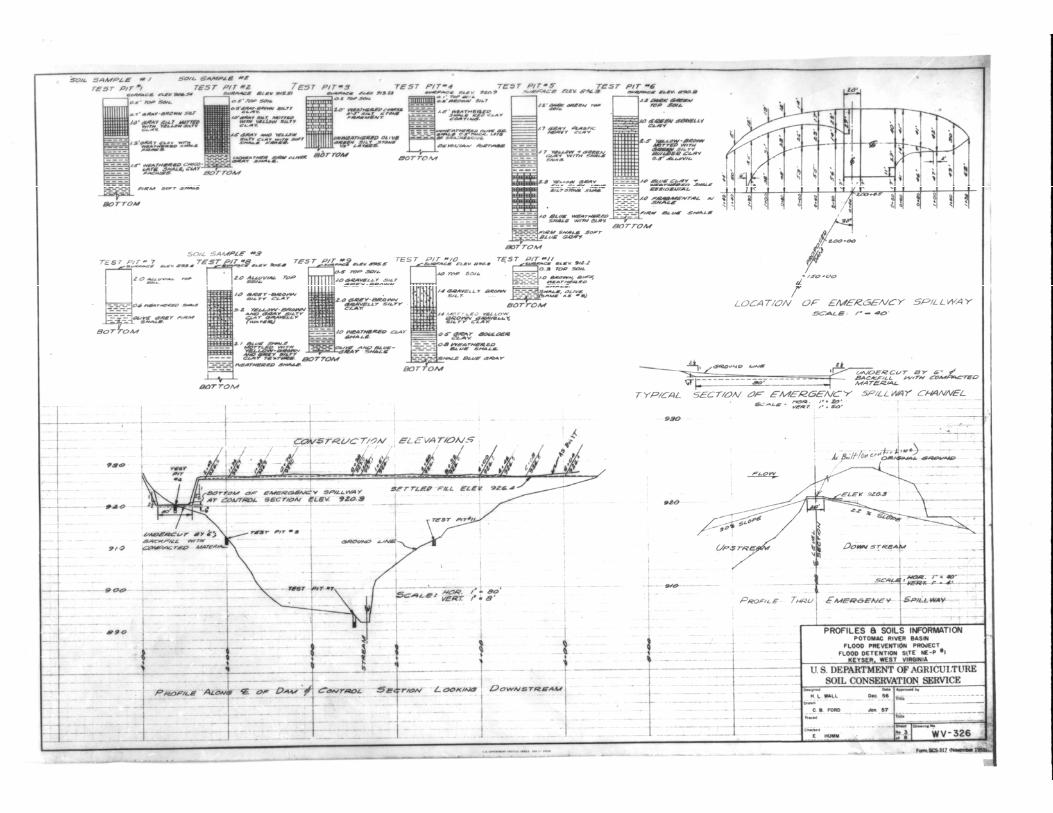
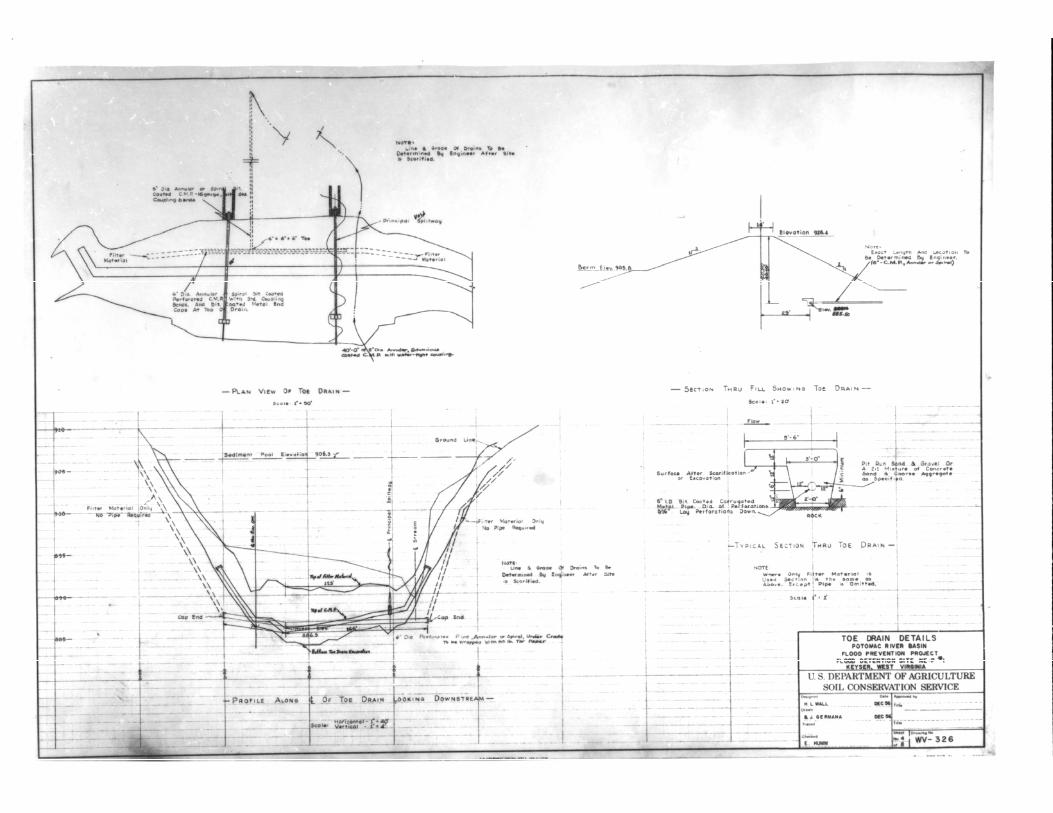
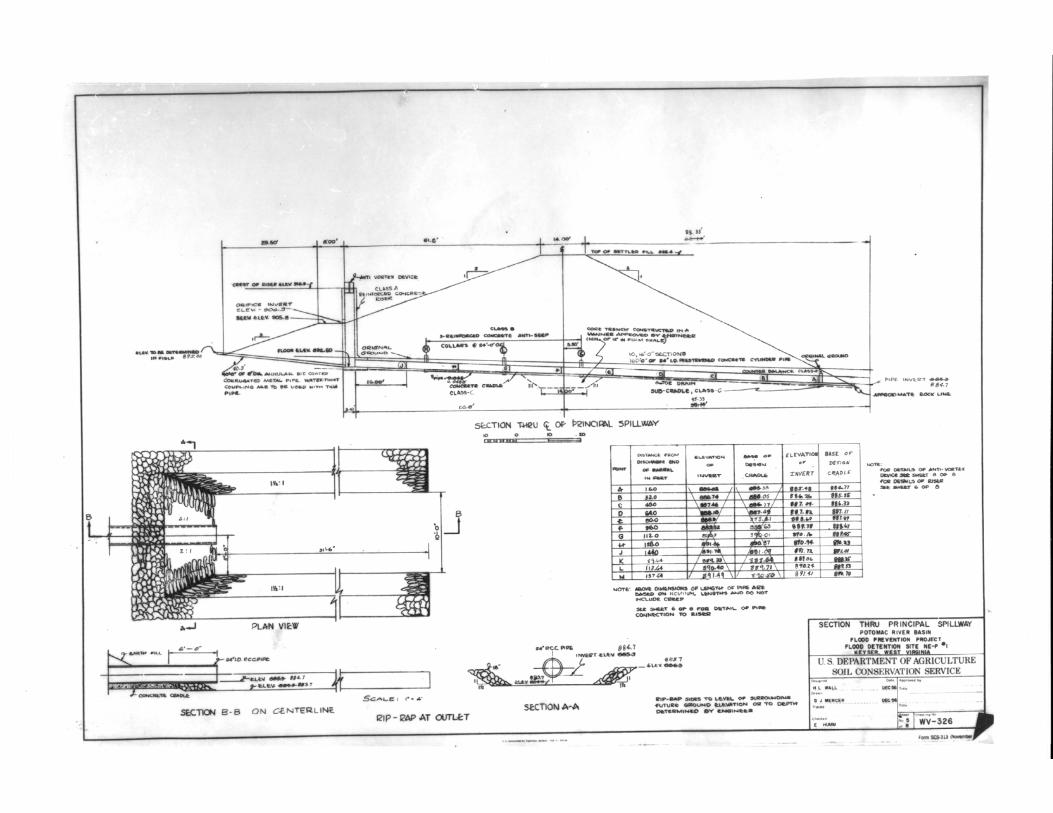
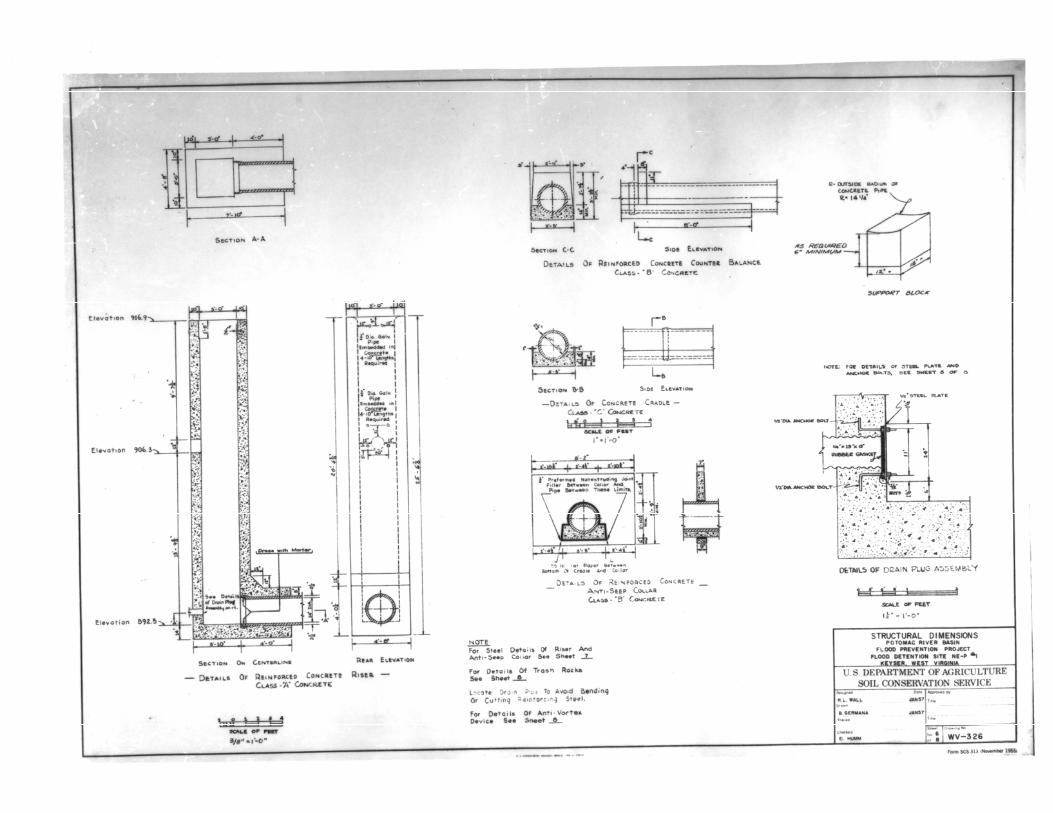
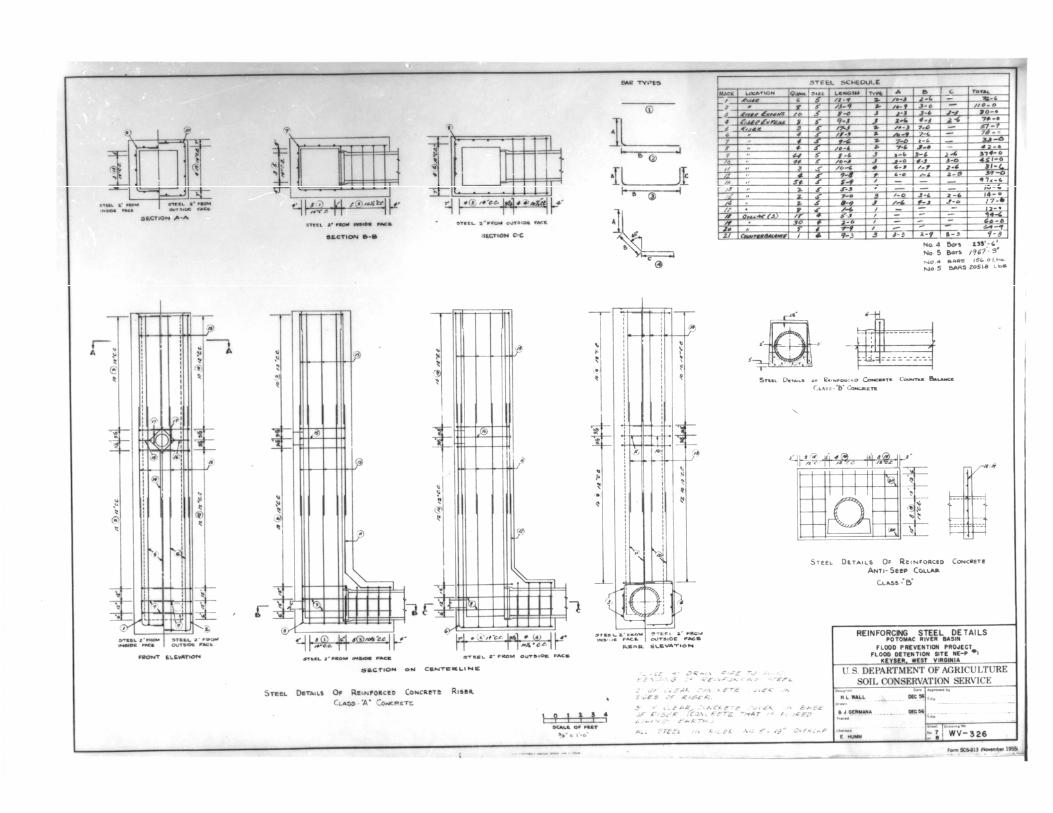
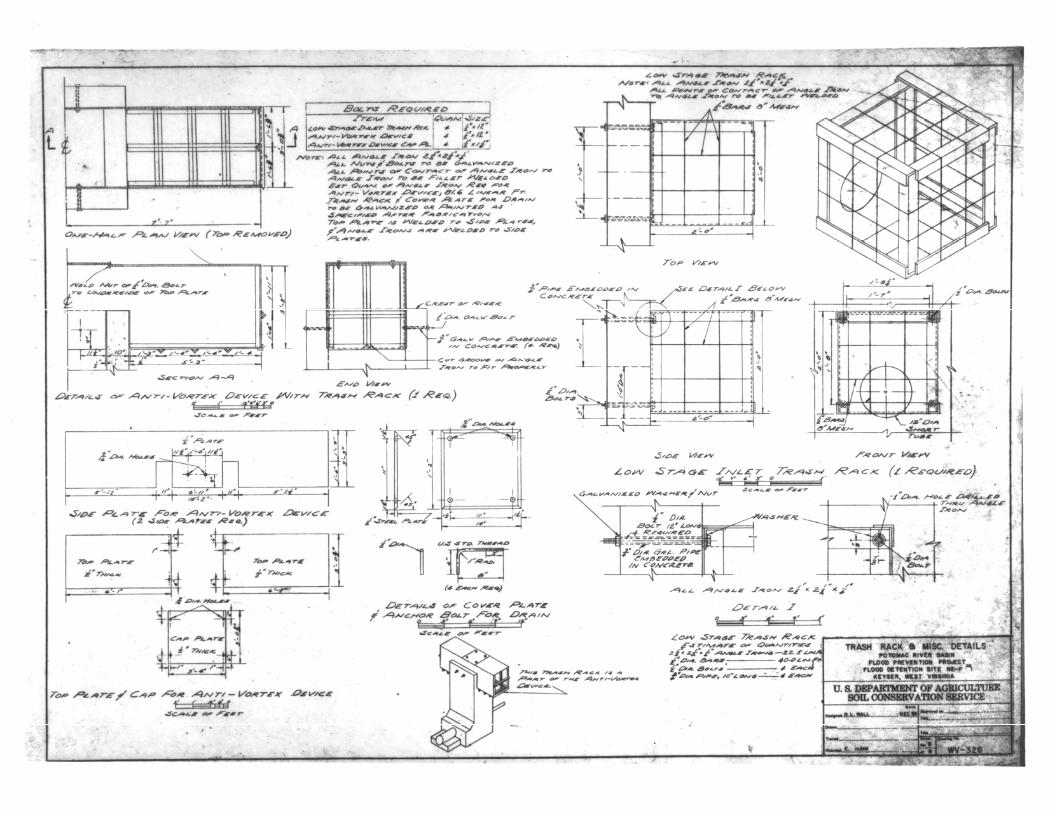
Appendix A Selected As-Built Drawings
Appendix B Site Inspection Checklist and Photographs
Appendix C SITES Output
Appendix D Evaluation of Potential Rehabilitation Projects-Priority Ranking Spreadsheet
New Creek Site 1 Dam Rehabilitation Assessment Report
1 March 2011
NRCS
1. Introduction and Purpose
The purpose of this report is to provide the West Virginia Natural Resources Conservation Service (NRCS) an assessment of New Creek Site 1, as authorized by contract dated May 24, 2010 for 41 Dam Assessments for various watersheds in West Virginia (Award No. AG-3D47-D-10-0008). The report provides a description of the dam, an assessment of the current conditions and status of operation and maintenance, and the scope of potential rehabilitation alternatives. In addition to assessing the overall integrity of the structure, available design information was reviewed to determine whether the structure meets current NRCS design criteria. This information is provided to assist the NRCS and local sponsor(s) in determining future actions concerning potential rehabilitation of the dam to extend the service life of the dam and meet current safety criteria.
The Watershed Protection and Flood Protection Act (Section 14 of PL-83-566, as amended) authorizes funding and technical assistance to rehabilitate aging flood control dams originally built with assistance of the USDA Watershed Programs. Sponsors of these dams may apply for assistance to extend the project service life and ensure that the facility meets applicable safety and performance standards. If the project is eligible for rehabilitation assistance, the NRCS may provide funding for 65 percent of the total rehabilitation project costs; the project sponsors are responsible for the remaining 35 percent. Technical assistance by NRCS for planning and design of the rehabilitation project is provided at no cost to project sponsors. 2. Project Setting and History
The original New Creek – White’s Run Subwatersheds Work Plan Agreement was signed on March 11, 1957. The New Creek Subwatershed of the Potomac River Watershed was planned and constructed in accordance with provisions of PL-534, approved December 22, 1944. The project Work Plan was supplemented four times; Supplemental Work Plan Agreement No. 1 signed in December 1959, Supplemental Work Plan Agreement No. 2 signed in January 1961, Supplemental Work Plan Agreement No. 3 signed in October 1961, and Supplemental Work Plan Agreement No. 4 signed in August 1991. The Potomac Valley Conservation District, the West Virginia State Conservation Committee, and the City of Keyser, WV are the sponsors of the project.
The purpose of the plan for New Creek Subwatershed was to outline land treatment and structural measures necessary to achieve the maximum practical erosion control and alleviate flood damage. Installation of planned structural measures were to assist in providing floodwater protection to dwellings, roads, fields, crops, and businesses, and to permit more intensive land use by reducing damage to land in the flood regions and also make uplands more attractive and productive. A total of 9 floodwater retarding dams were constructed on tributaries within the New Creek Watershed.
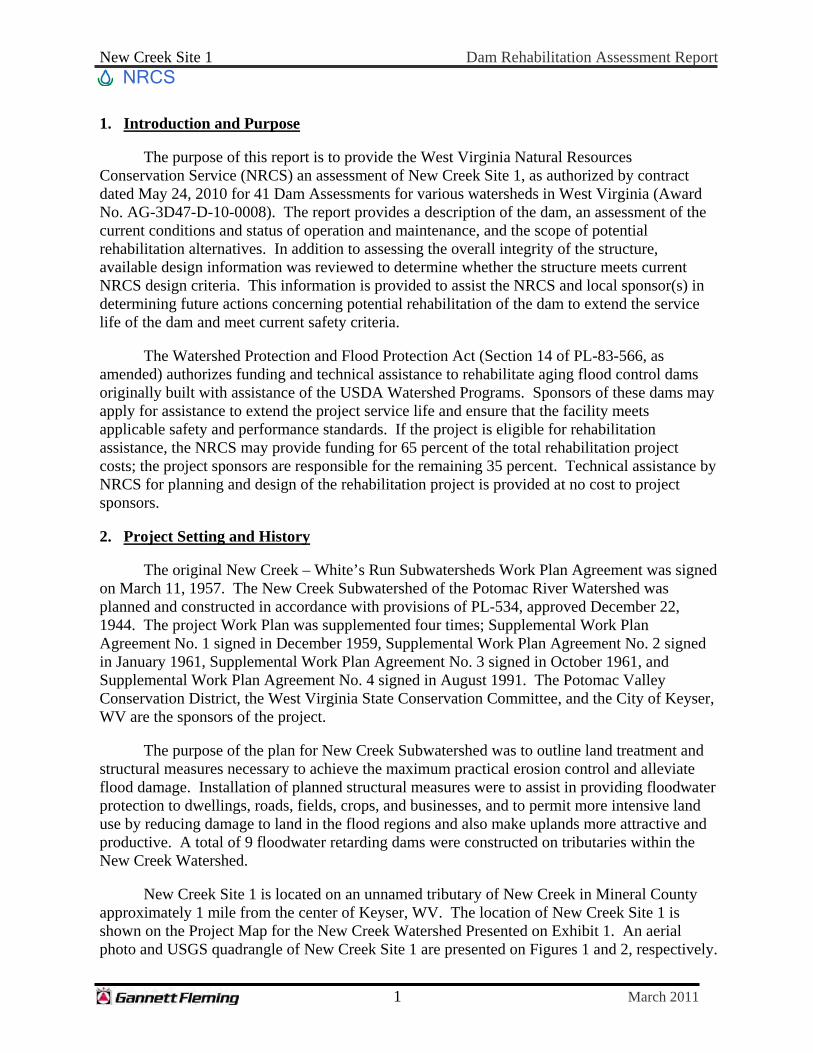
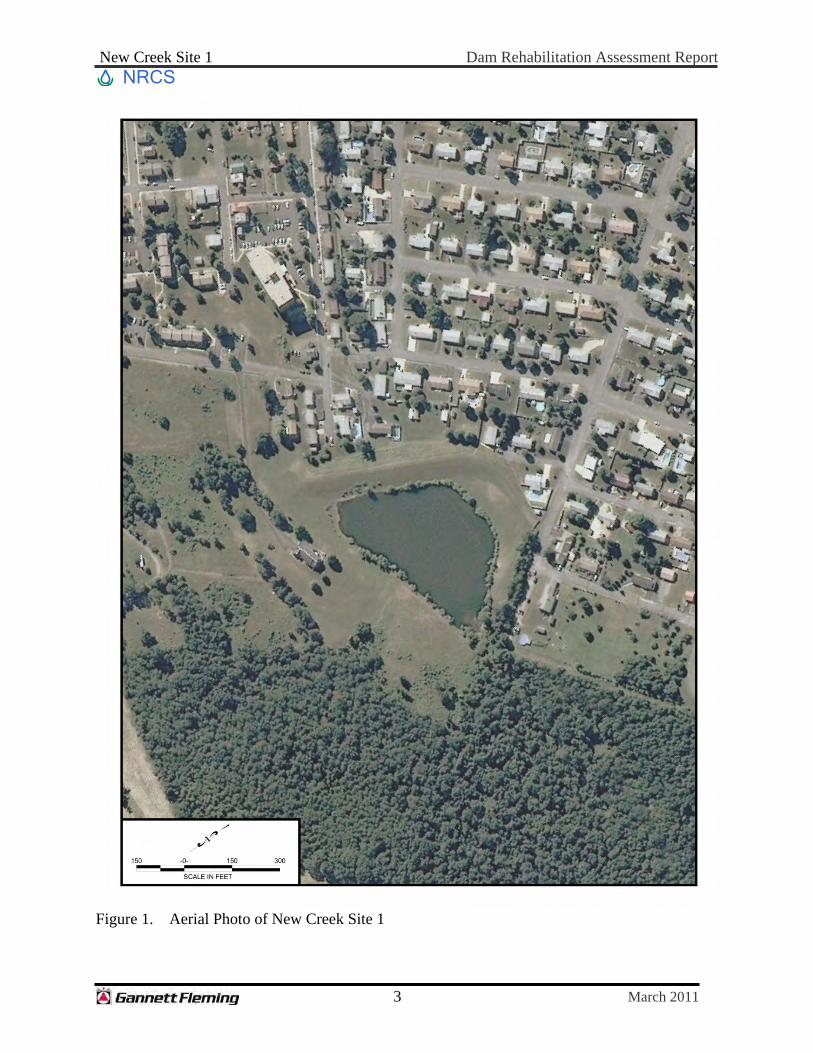
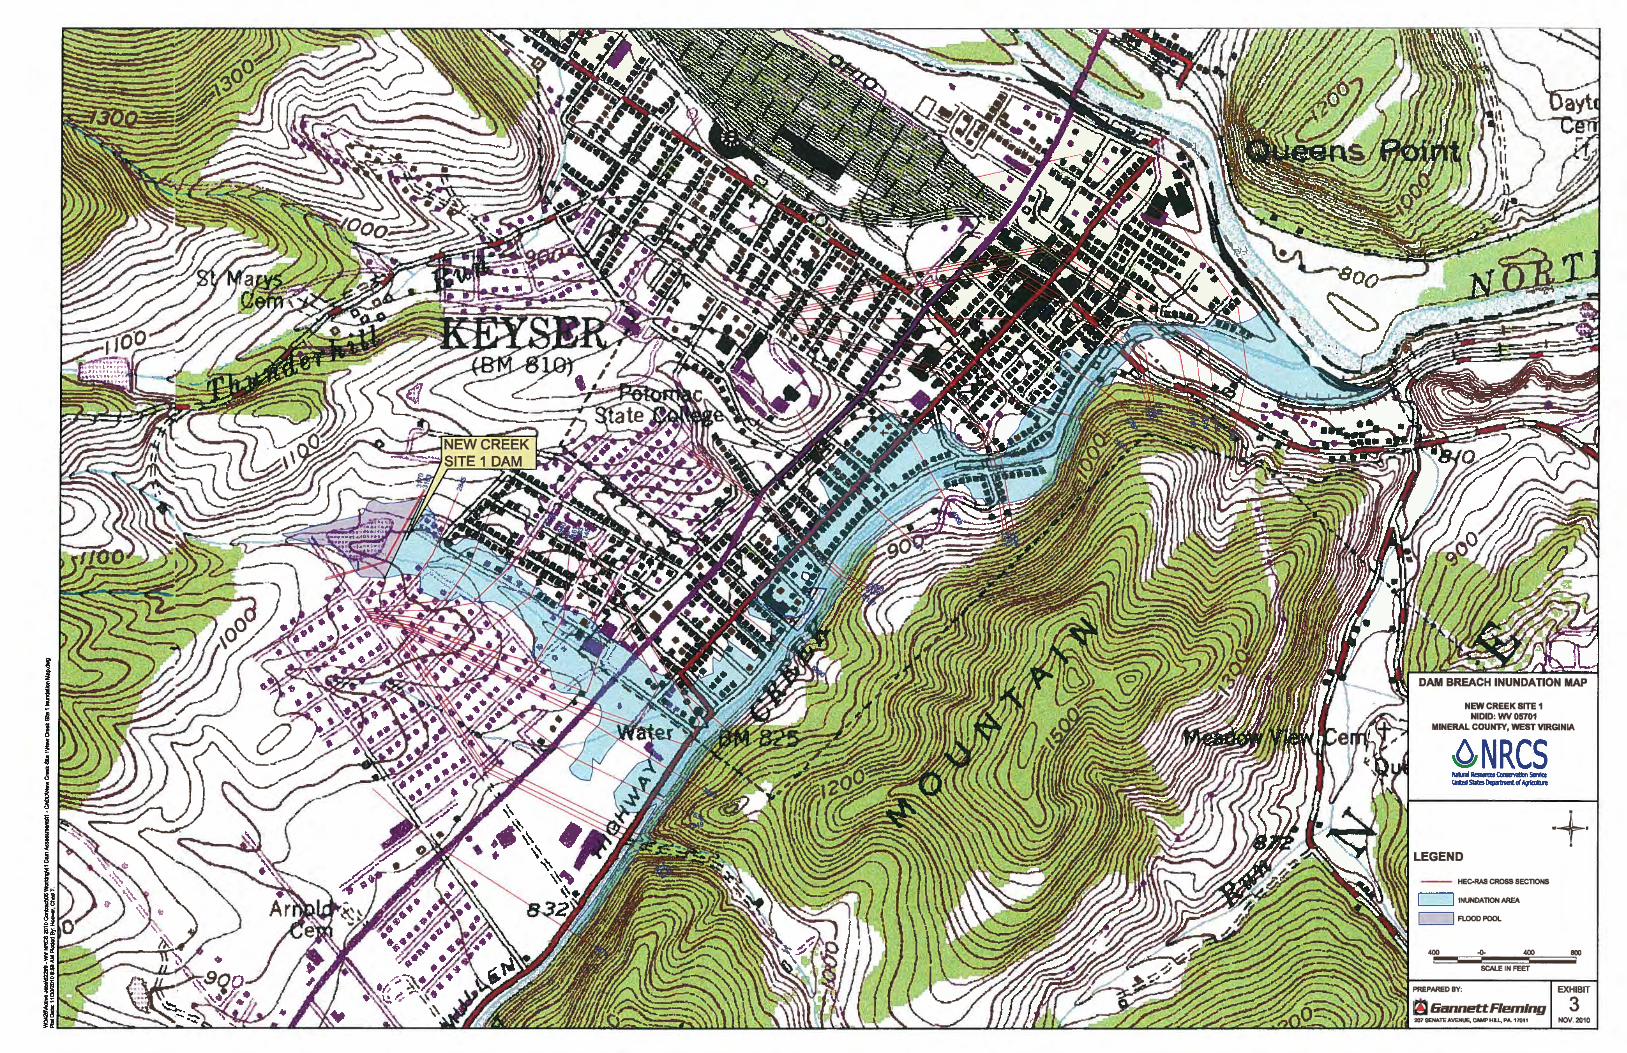
New Creek Site 1 is located on an unnamed tributary of New Creek in Mineral County
approximately 1 mile from the center of Keyser, WV. The location of New Creek Site 1 is shown on the Project Map for the New Creek Watershed Presented on Exhibit 1. An aerial photo and USGS quadrangle of New Creek Site 1 are presented on Figures 1 and 2, respectively.

New Creek Site 1 Dam Rehabilitation Assessment Report
2 March 2011
NRCS
Engineering design data and other reference data were collected and reviewed. The following is a list of data sources reviewed for this assessment report.
1. Original Work Plan and Subsequent Supplements (12/1956, 12/1959, 05/1961, 10/1961, 05/1991)
2. As-Built Drawings (1957) 3. Design Report Sections (Geology, Structural Design, and Hydraulic Design) (1956) 4. Inspection Records (1984, 2008, 2009, 2010) 5. O&M Agreement and Amendments (01/1959, 02/1960, 01/1964, 12/2002) 6. Failure and Risk Index Spreadsheet (2011) 7. New Creek Sub-watershed Map (2010) 8. Emergency Action Plan (12/2007)
New Creek Site 1 is a single purpose flood control dam designed by the SCS (now
NRCS), Morgantown, West Virginia. The dam and its appurtenances consist of a 945-foot long, zoned earthfill embankment with a maximum height of 41.7 feet above the invert of the principal spillway. The dam has two spillways; a two-stage principal spillway and an open channel vegetated auxiliary spillway. The auxiliary spillway crest is approximately 6.1 feet below the top of the dam. Both spillways are uncontrolled. All inflow is discharged through the principal spillway until the pool level reaches the level of the auxiliary spillway crest. A drawdown gate was provided to lower or drain the reservoir. The principal spillway conduit consists of a 24-inch diameter reinforced concrete, steel cylinder type pre-stressed pressure pipe. The principal spillway conduit was constructed with a concrete cradle with reinforced concrete anti-seep collars.
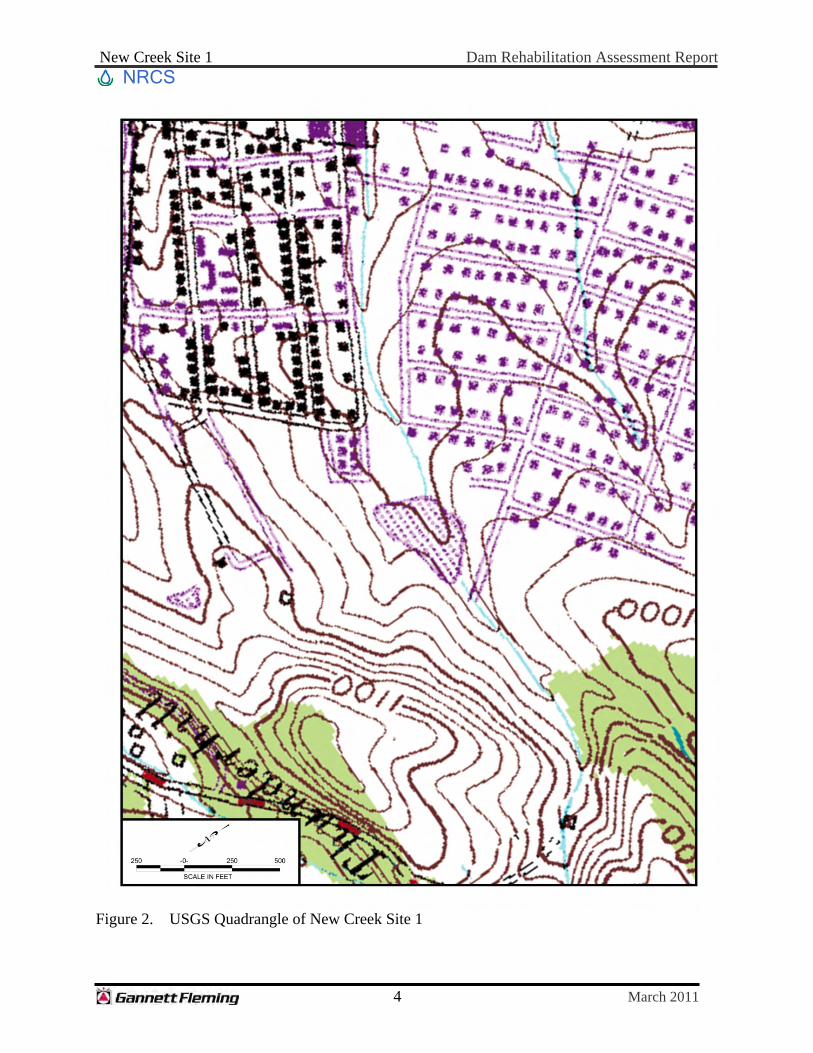
A summary of specific design data is presented in Table 1. Selected as-built drawings are presented in Appendix A. 3. Site Inspection Summary and Operation and Maintenance
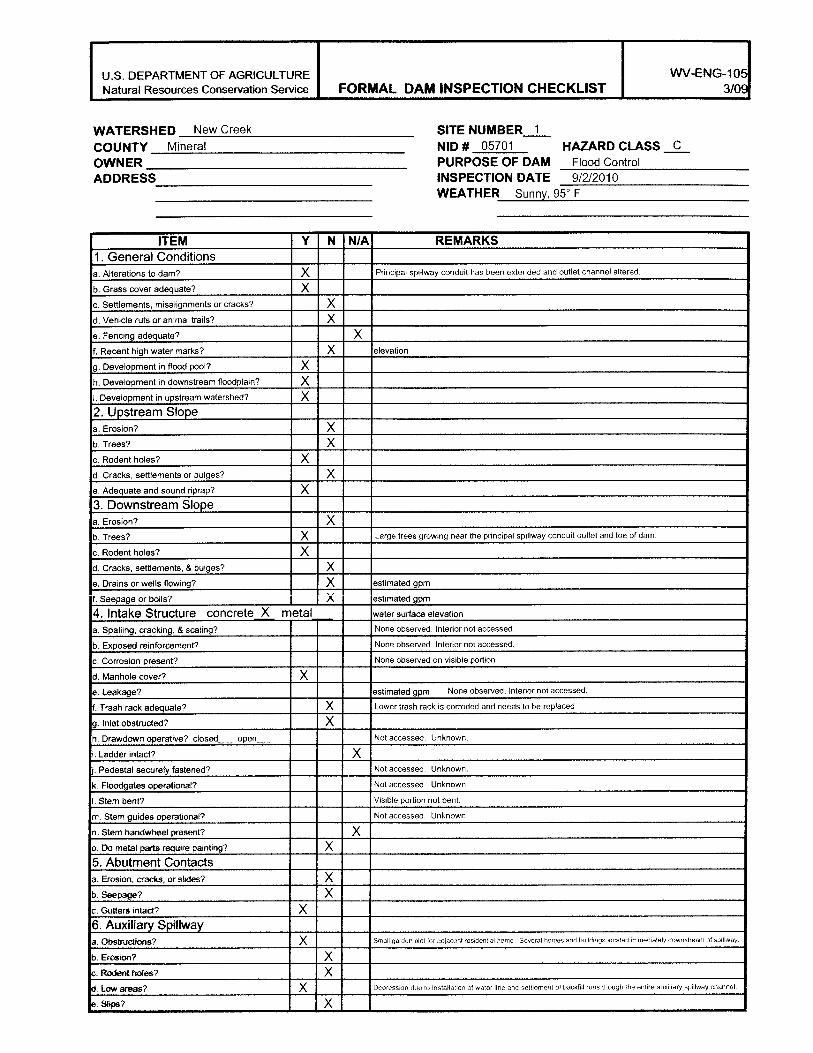
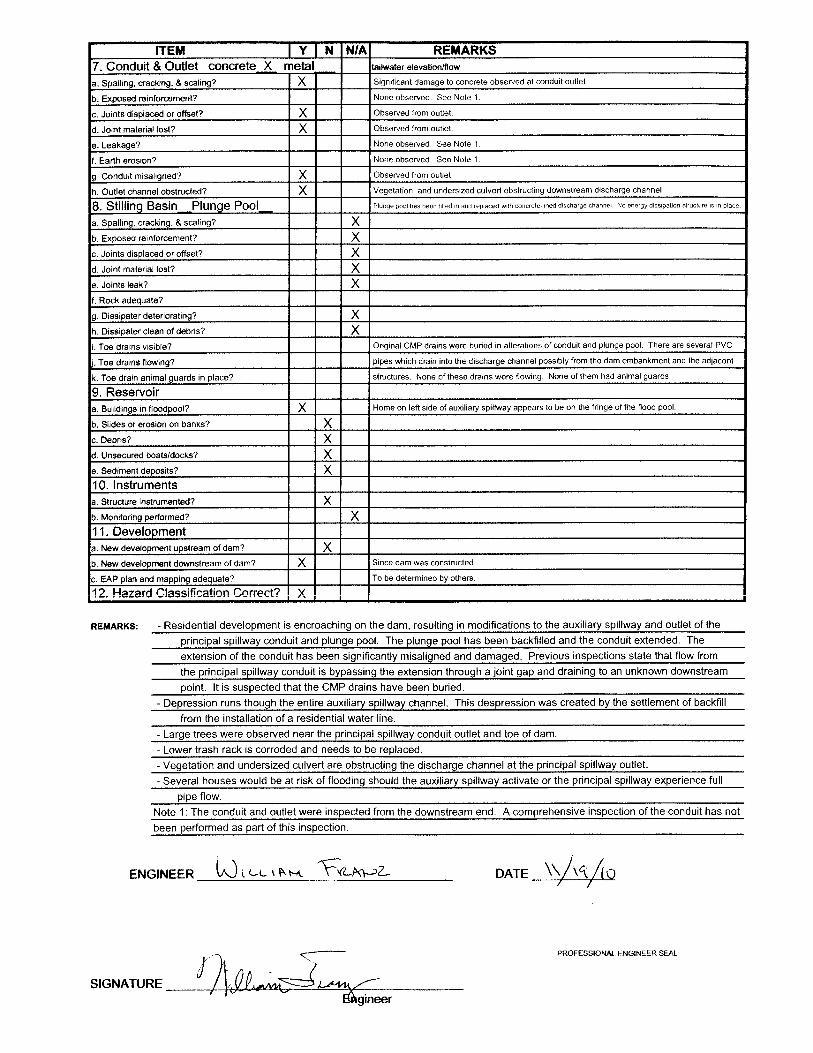
William Franz, P.E., P.G.; Gregory Richards, E.I.T.; and Joe Bell, E.I.T. of Gannett Fleming, Inc. conducted a site inspection of New Creek Site 1 on September 2, 2010. The WV-ENG-105, Formal Dam Inspection Checklist was used to record findings and is presented in Appendix B. General photographs of the dam site (Photos 1-6) and photographs of deficiencies (Photos 7-16) noted during the site inspection are also presented in Appendix B. Additional photos taken during the field review are furnished in the Supporting Data Folder on a CD. Several ongoing maintenance items as well as recommendations for additional investigations are noted below.
The grass cover on the upstream and downstream slope of the dam embankment appears
to be adequate. There are, however, several large animal burrows located on both the upstream and the downstream slope of the dam embankment. A residential water line has been installed through the auxiliary spillway. The backfill has since settled leaving a vegetated depression that extends through the channel of the spillway. Additionally, a small garden plot and fence was observed within the spillway channel. Many residential homes have been constructed immediately downstream of the auxiliary spillway and
New Creek Site 1 Dam Rehabilitation Assessment Report
3 March 2011
NRCS
Figure 1. Aerial Photo of New Creek Site 1
New Creek Site 1 Dam Rehabilitation Assessment Report
4 March 2011
NRCS
Figure 2. USGS Quadrangle of New Creek Site 1
New Creek Site 1 Dam Rehabilitation Assessment Report
5 March 2011
NRCS
Table 1 As-Built Design Data for New Creek Site 1
Description Value
General Data Year Designed 1956 Year Constructed 1957 Purpose Flood Control Original Hazard Classification High (Class C) Current Hazard Classification High (Class C) Design Life 50 years (2007) Design Drainage Area 226 Acres (0.35 Mi2) Dam Height (Along Centerline) 35 Feet Maximum Dam Height 41.7 Feet Embankment Length 945 Feet Embankment Top Width 14 Feet Embankment Upstream Slope 3H:1V Embankment Downstream Slope 2H:1V Critical Elevations (MSL) Top of Dam 926.4 Feet Auxiliary Spillway Crest 920.3 Feet PSW Weir 916.9 Feet Normal Pool (50-Year Submerged Sediment) 906.3 Feet PSW Conduit Outfall Invert 884.7 Feet PSW Outlet Channel Invert 883.7 Feet Storage Capacities Sediment Storage (50-Year Submerged &
Aerated Sediment) 11 Acre-Feet
Normal Pool (50-Year Submerged Sediment) 9 Acre-Feet Auxiliary Spillway Crest 72.4 Acre-Feet Top of Dam 117.4 Acre-Feet Pool Surface Areas Normal Pool 2.1 Acres Auxiliary Spillway Crest 6.35 Acres Other Features Principal Spillway Orifice Size 12 Inch Dia. Principal Spillway Conduit Diameter 24 Inches Principal Spillway Conduit Length 161.13 Feet Principal Spillway Weir Crest Length 6-Feet (Total) Auxiliary Spillway Width 80 Feet
New Creek Site 1 Dam Rehabilitation Assessment Report
6 March 2011
NRCS
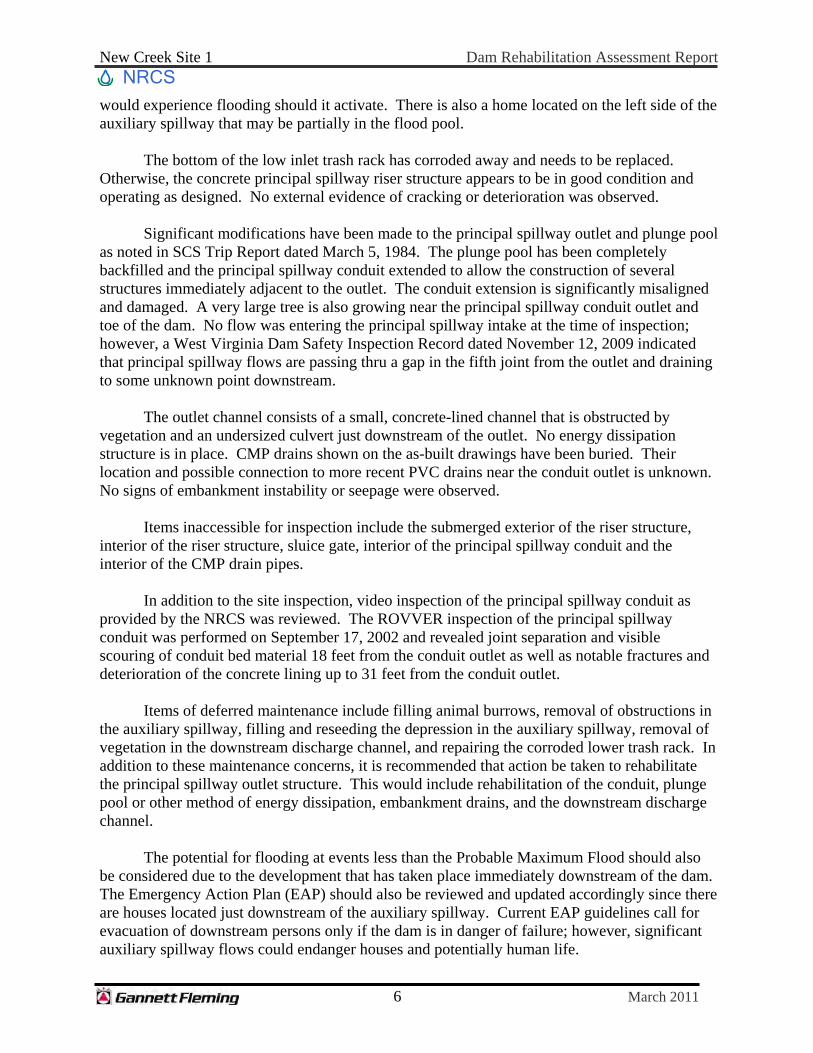
would experience flooding should it activate. There is also a home located on the left side of the auxiliary spillway that may be partially in the flood pool.
The bottom of the low inlet trash rack has corroded away and needs to be replaced. Otherwise, the concrete principal spillway riser structure appears to be in good condition and operating as designed. No external evidence of cracking or deterioration was observed.
Significant modifications have been made to the principal spillway outlet and plunge pool
as noted in SCS Trip Report dated March 5, 1984. The plunge pool has been completely backfilled and the principal spillway conduit extended to allow the construction of several structures immediately adjacent to the outlet. The conduit extension is significantly misaligned and damaged. A very large tree is also growing near the principal spillway conduit outlet and toe of the dam. No flow was entering the principal spillway intake at the time of inspection; however, a West Virginia Dam Safety Inspection Record dated November 12, 2009 indicated that principal spillway flows are passing thru a gap in the fifth joint from the outlet and draining to some unknown point downstream.
The outlet channel consists of a small, concrete-lined channel that is obstructed by
vegetation and an undersized culvert just downstream of the outlet. No energy dissipation structure is in place. CMP drains shown on the as-built drawings have been buried. Their location and possible connection to more recent PVC drains near the conduit outlet is unknown. No signs of embankment instability or seepage were observed.
Items inaccessible for inspection include the submerged exterior of the riser structure, interior of the riser structure, sluice gate, interior of the principal spillway conduit and the interior of the CMP drain pipes.
In addition to the site inspection, video inspection of the principal spillway conduit as
provided by the NRCS was reviewed. The ROVVER inspection of the principal spillway conduit was performed on September 17, 2002 and revealed joint separation and visible scouring of conduit bed material 18 feet from the conduit outlet as well as notable fractures and deterioration of the concrete lining up to 31 feet from the conduit outlet.
Items of deferred maintenance include filling animal burrows, removal of obstructions in the auxiliary spillway, filling and reseeding the depression in the auxiliary spillway, removal of vegetation in the downstream discharge channel, and repairing the corroded lower trash rack. In addition to these maintenance concerns, it is recommended that action be taken to rehabilitate the principal spillway outlet structure. This would include rehabilitation of the conduit, plunge pool or other method of energy dissipation, embankment drains, and the downstream discharge channel.
The potential for flooding at events less than the Probable Maximum Flood should also
be considered due to the development that has taken place immediately downstream of the dam. The Emergency Action Plan (EAP) should also be reviewed and updated accordingly since there are houses located just downstream of the auxiliary spillway. Current EAP guidelines call for evacuation of downstream persons only if the dam is in danger of failure; however, significant auxiliary spillway flows could endanger houses and potentially human life.
New Creek Site 1 Dam Rehabilitation Assessment Report
7 March 2011
NRCS
It should be realized that the reported condition of the dam is based on observations of field conditions at the time of inspection along with data available to the inspection team. It is also important to note that the condition of a dam depends on numerous and constantly changing internal and external conditions, and is evolutionary in nature. It would be incorrect to assume that the present condition of the dam will continue to represent the condition of the dam at some point in the future. Continued care and inspection are necessary to detect unsafe conditions. 4. Hydrologic and Hydraulic Analyses
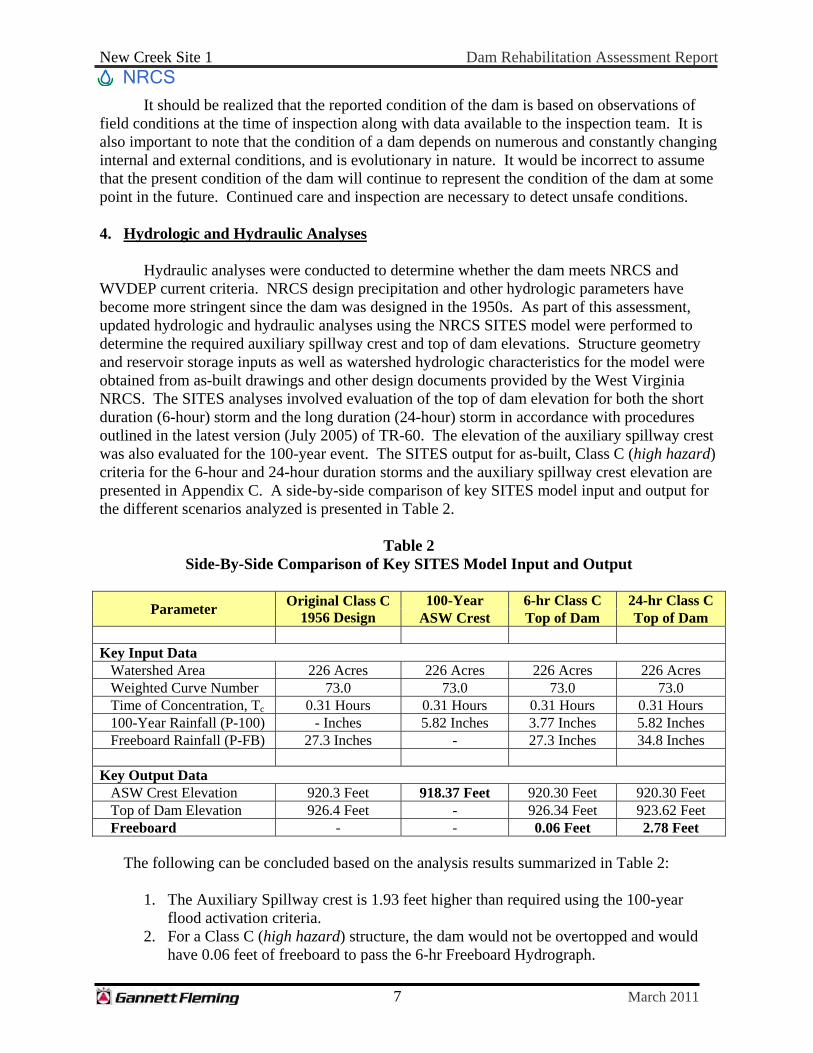
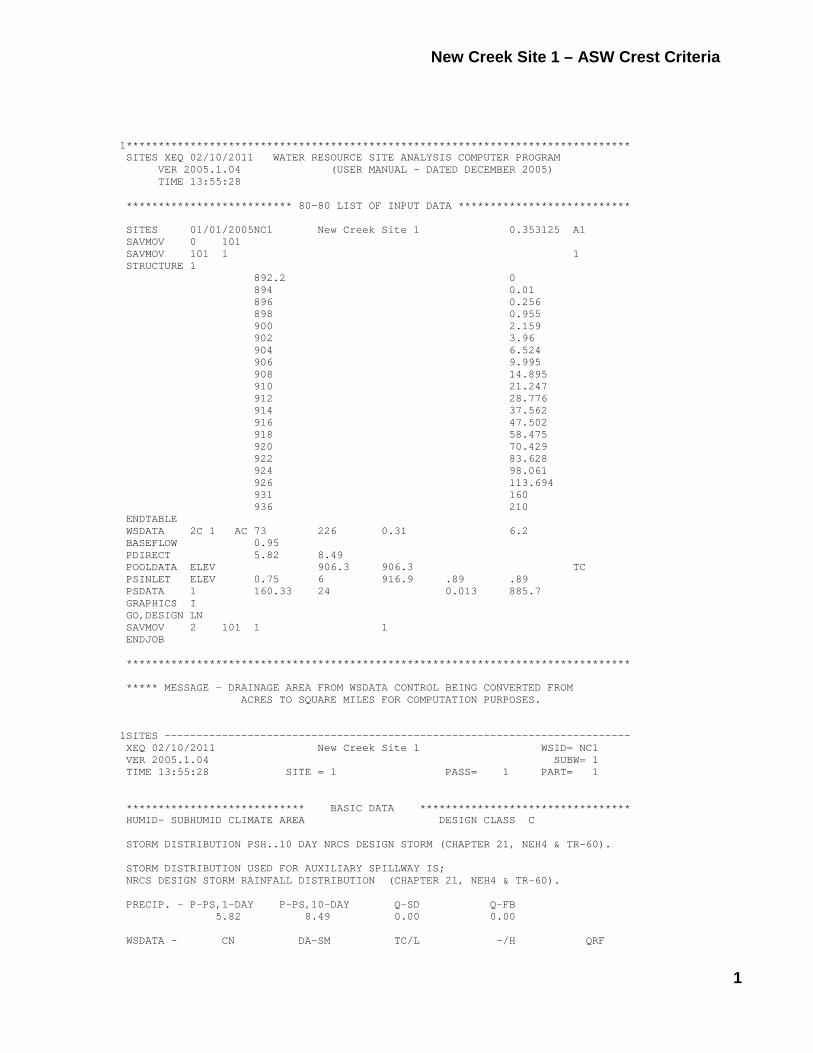
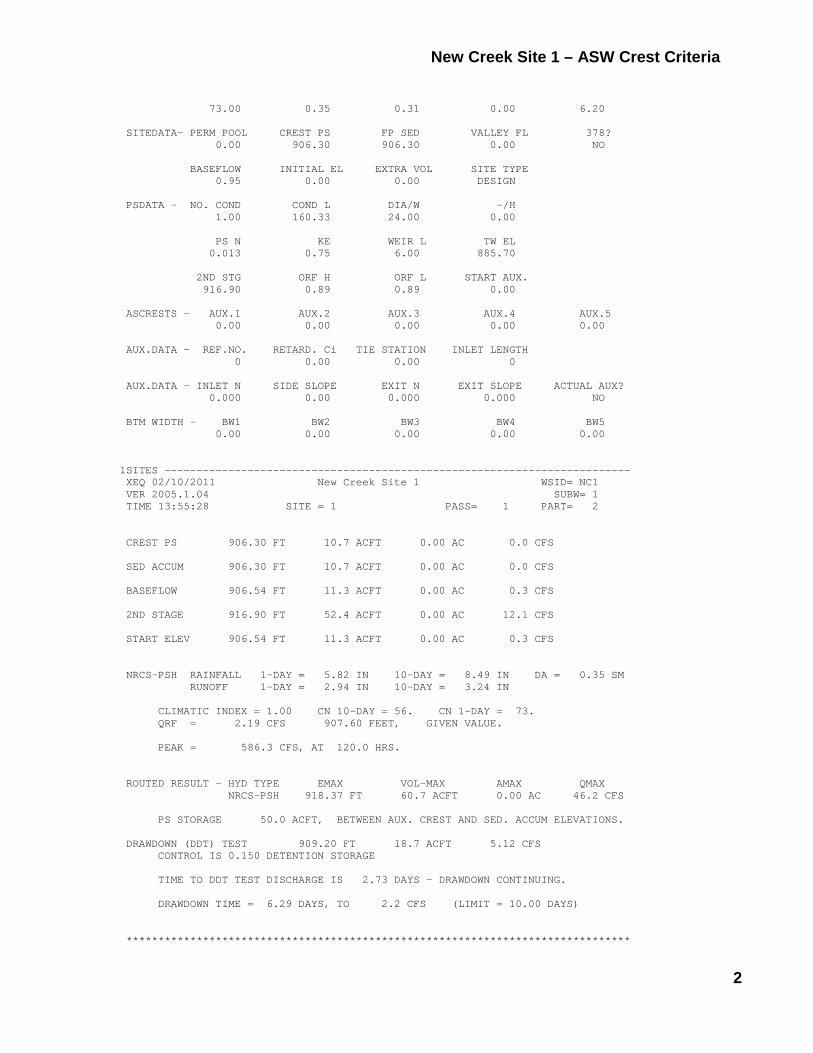
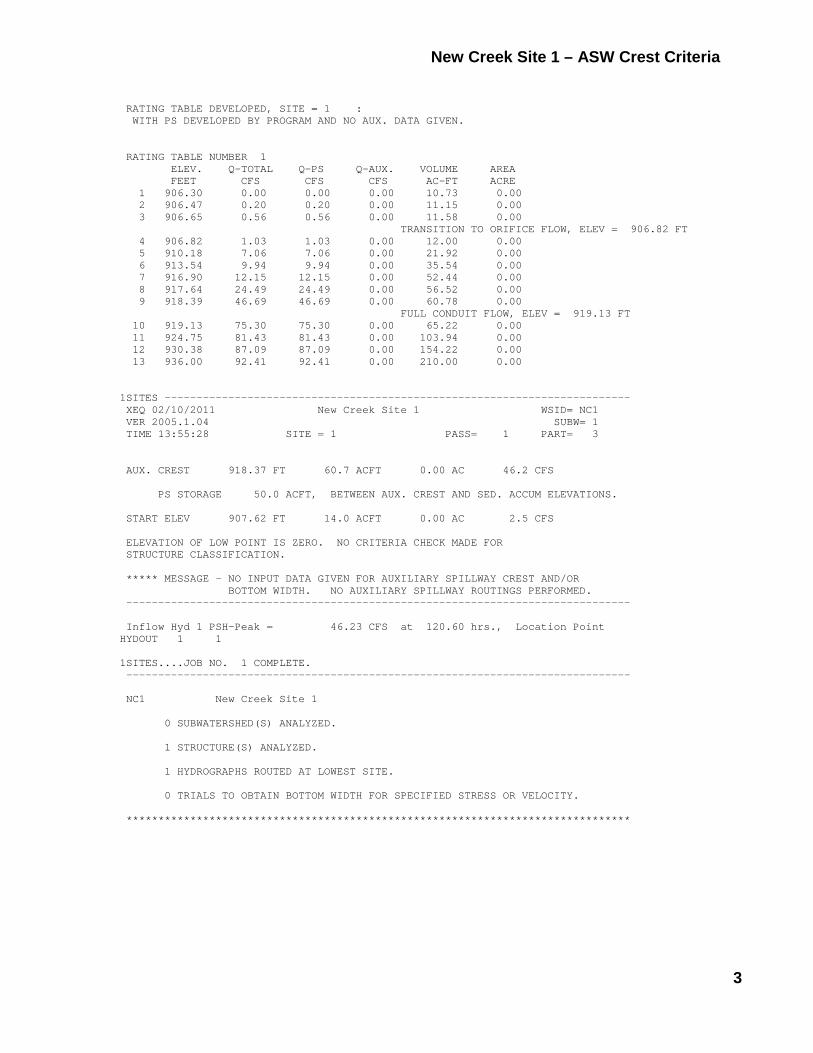
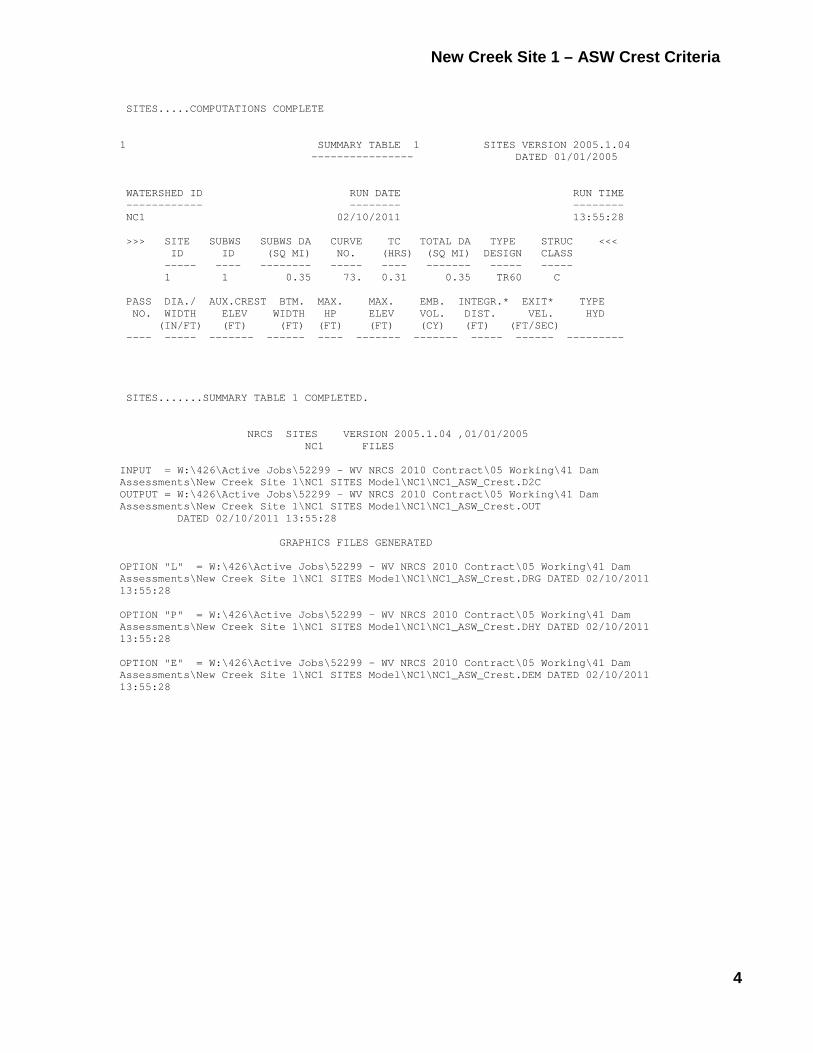
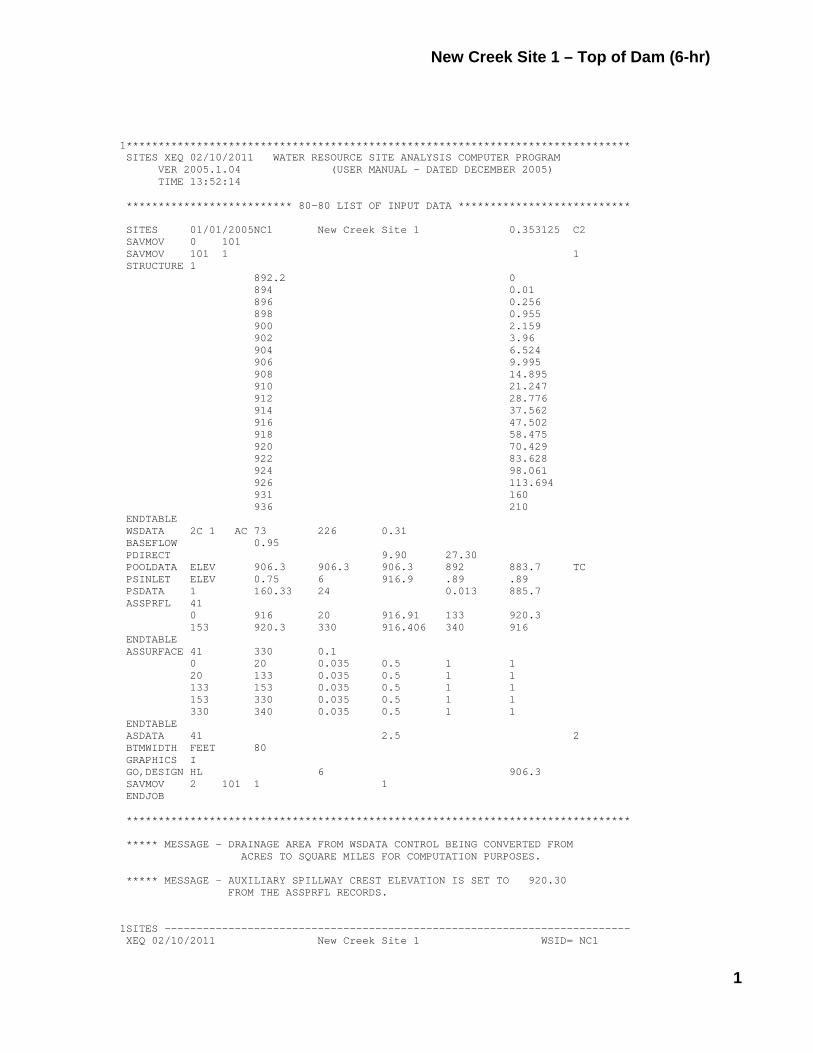
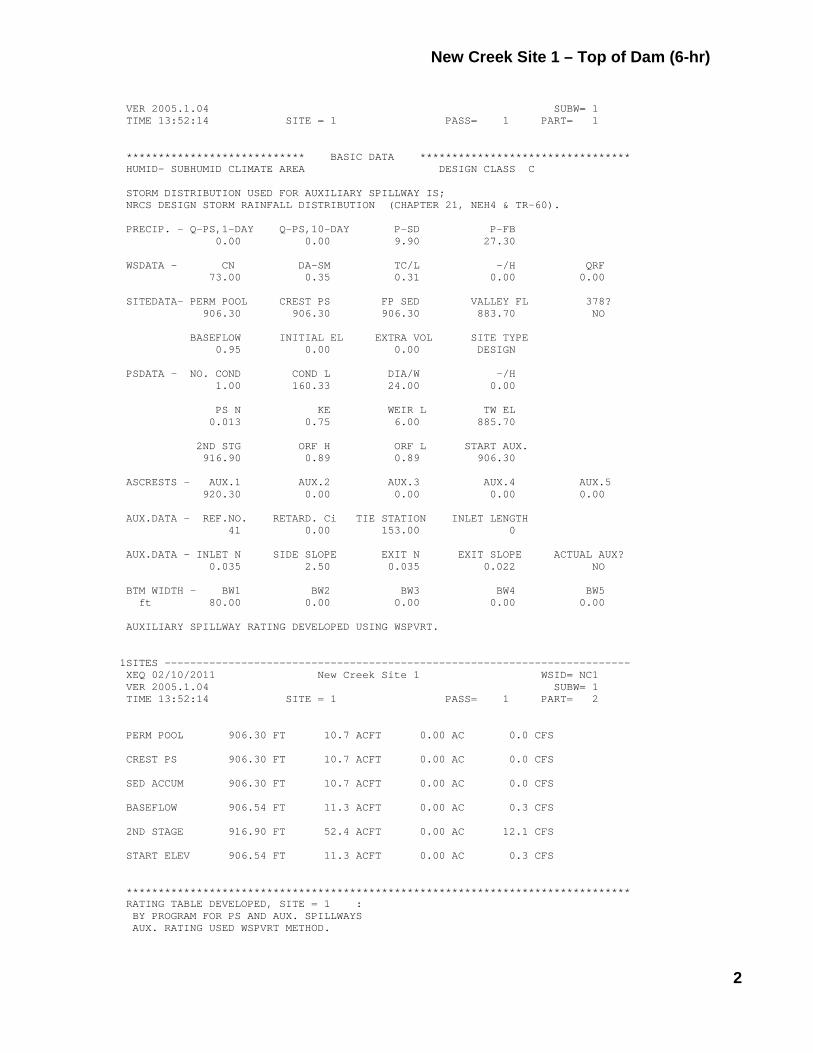
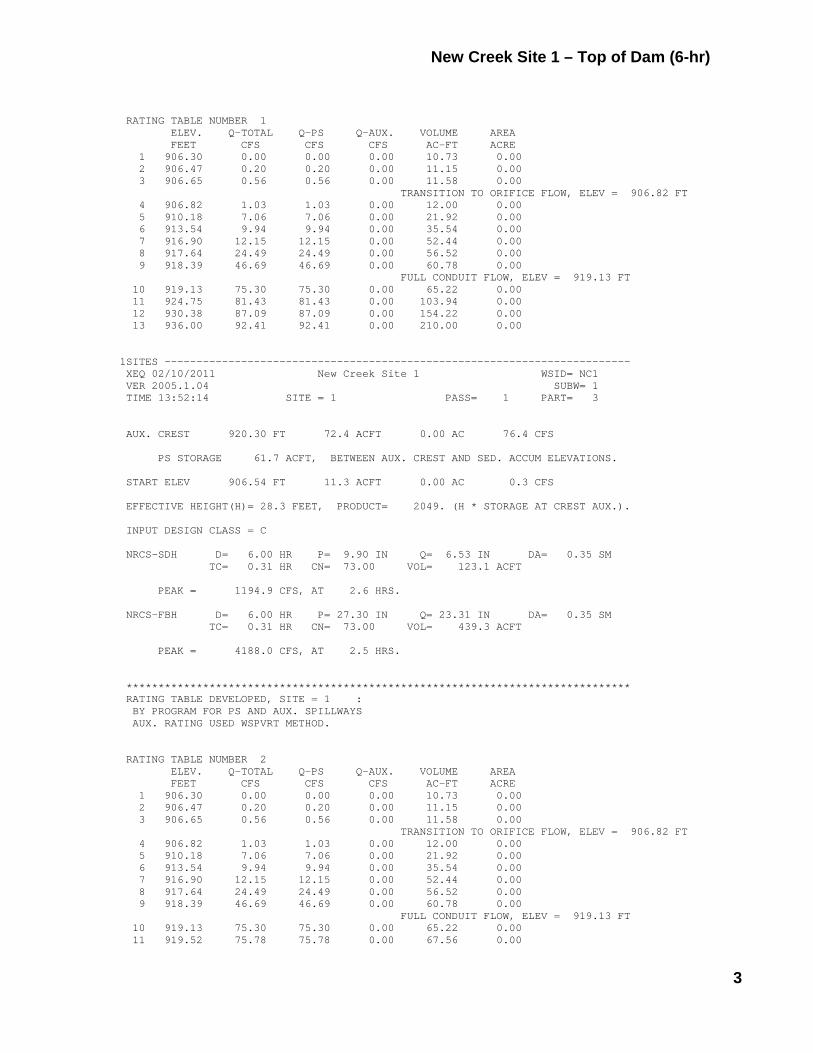
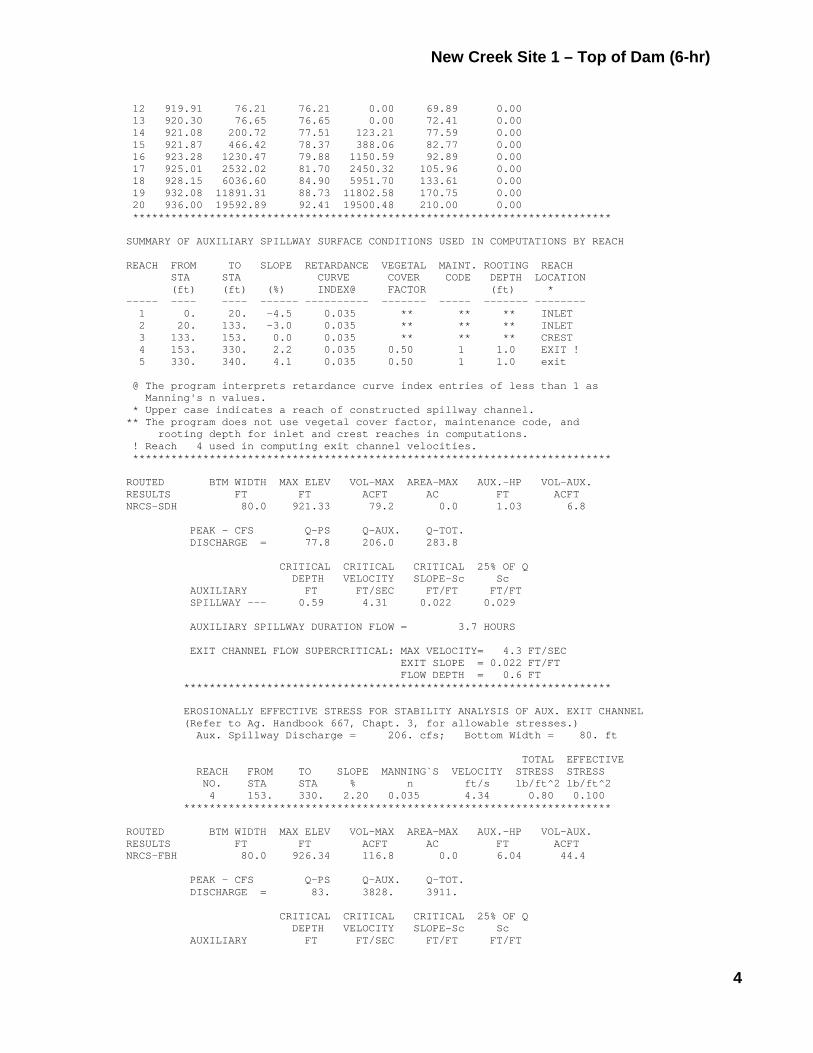
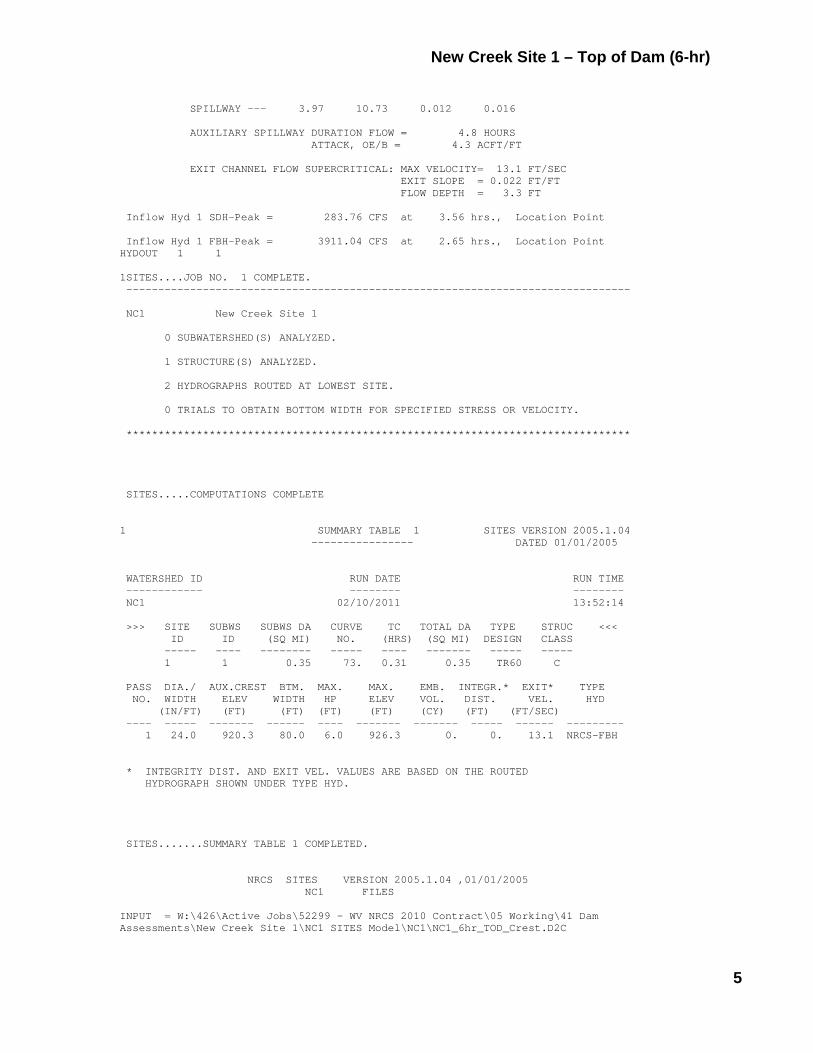
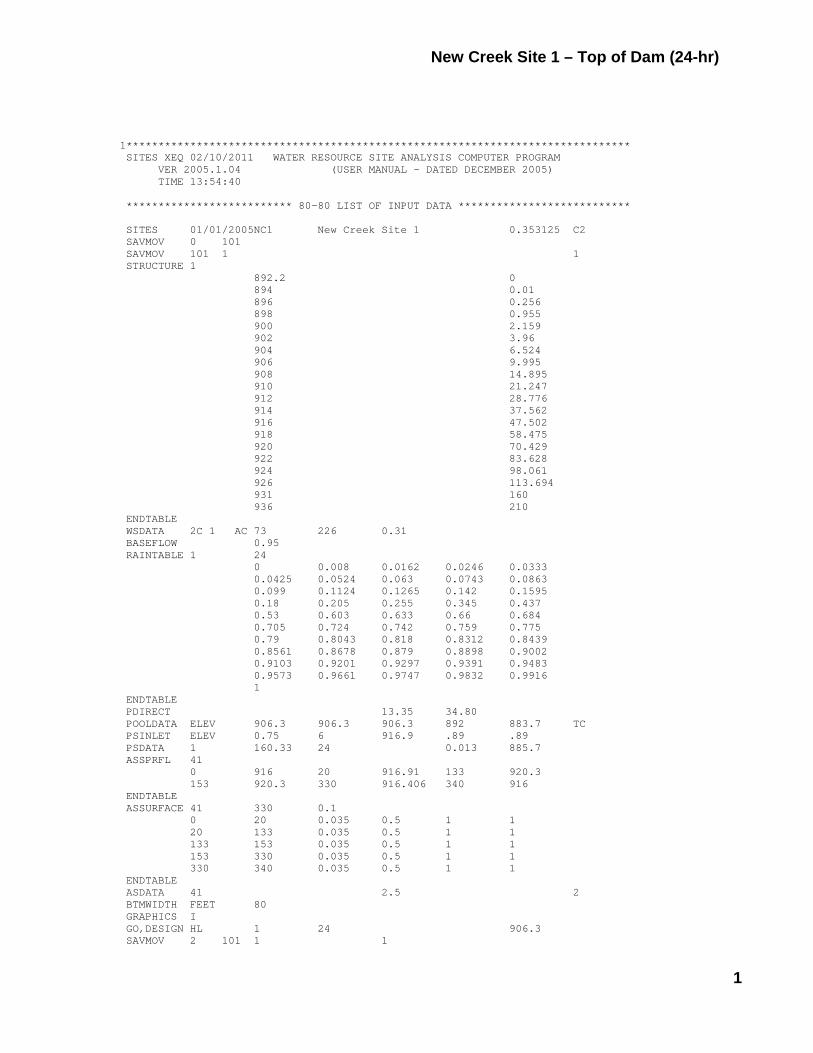
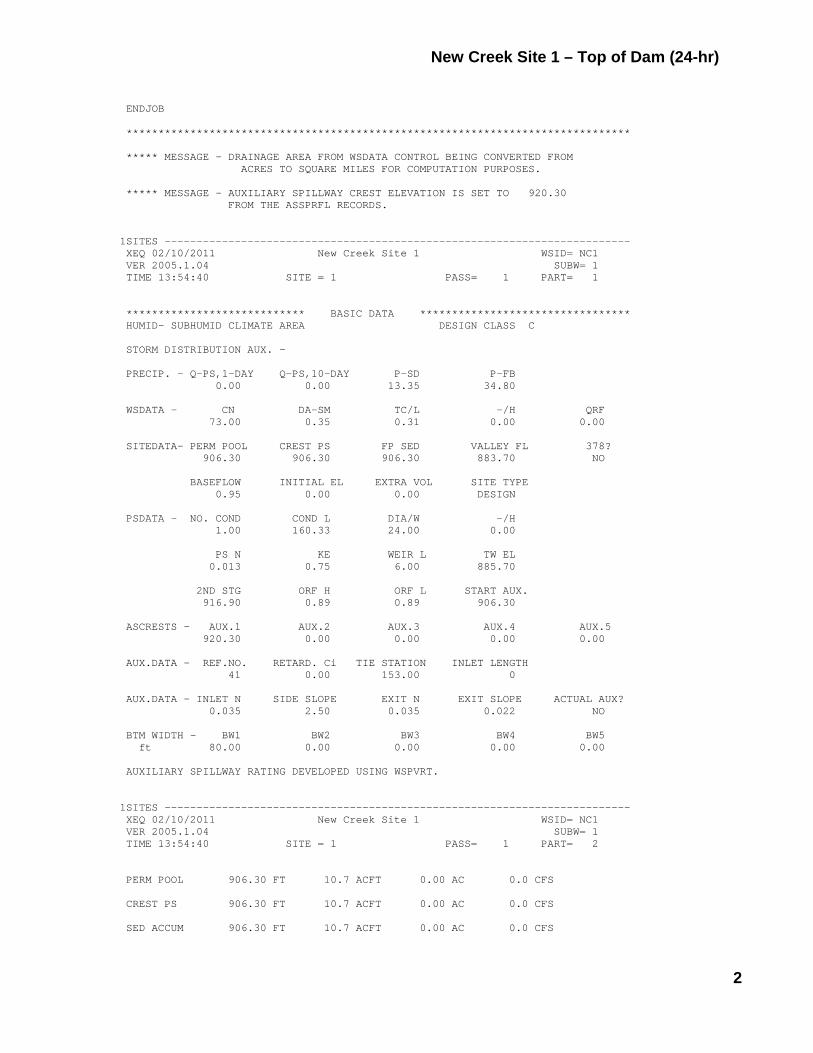
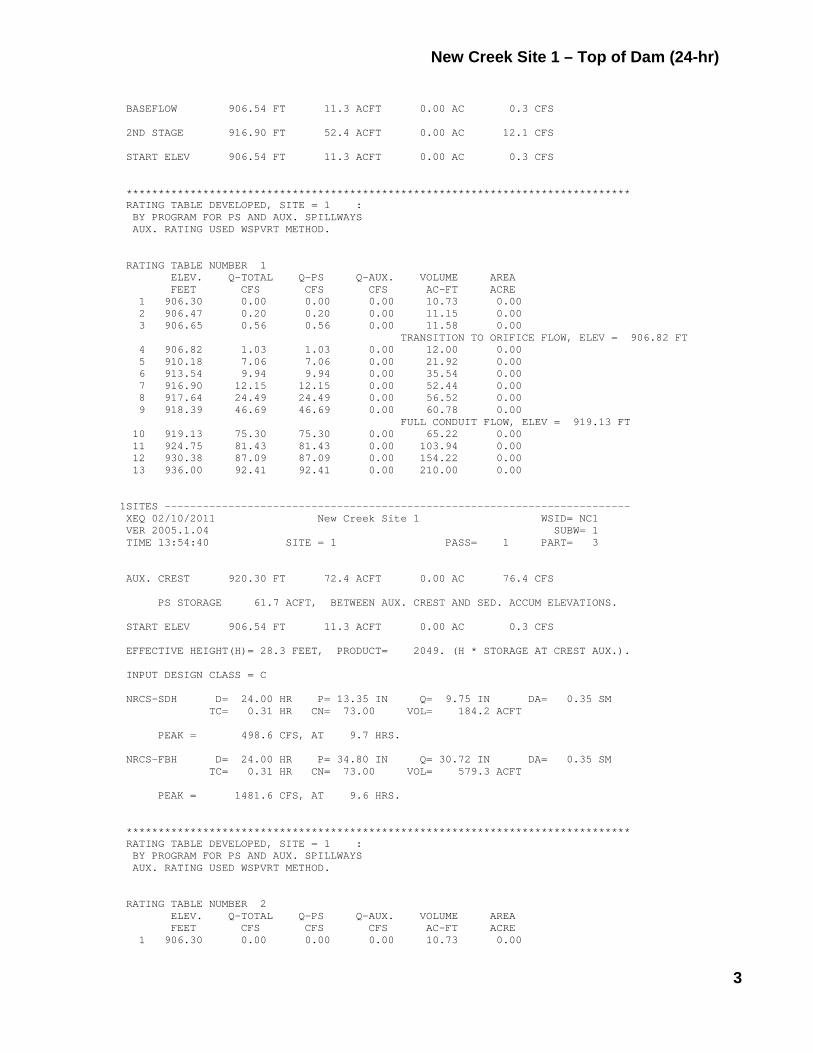
Hydraulic analyses were conducted to determine whether the dam meets NRCS and WVDEP current criteria. NRCS design precipitation and other hydrologic parameters have become more stringent since the dam was designed in the 1950s. As part of this assessment, updated hydrologic and hydraulic analyses using the NRCS SITES model were performed to determine the required auxiliary spillway crest and top of dam elevations. Structure geometry and reservoir storage inputs as well as watershed hydrologic characteristics for the model were obtained from as-built drawings and other design documents provided by the West Virginia NRCS. The SITES analyses involved evaluation of the top of dam elevation for both the short duration (6-hour) storm and the long duration (24-hour) storm in accordance with procedures outlined in the latest version (July 2005) of TR-60. The elevation of the auxiliary spillway crest was also evaluated for the 100-year event. The SITES output for as-built, Class C (high hazard) criteria for the 6-hour and 24-hour duration storms and the auxiliary spillway crest elevation are presented in Appendix C. A side-by-side comparison of key SITES model input and output for the different scenarios analyzed is presented in Table 2.
Table 2
Side-By-Side Comparison of Key SITES Model Input and Output
Parameter Original Class C 1956 Design
100-Year 6-hr Class C 24-hr Class C ASW Crest Top of Dam Top of Dam
Key Input Data Watershed Area 226 Acres 226 Acres 226 Acres 226 Acres Weighted Curve Number 73.0 73.0 73.0 73.0 Time of Concentration, Tc 0.31 Hours 0.31 Hours 0.31 Hours 0.31 Hours 100-Year Rainfall (P-100) - Inches 5.82 Inches 3.77 Inches 5.82 Inches Freeboard Rainfall (P-FB) 27.3 Inches - 27.3 Inches 34.8 Inches Key Output Data ASW Crest Elevation 920.3 Feet 918.37 Feet 920.30 Feet 920.30 Feet Top of Dam Elevation 926.4 Feet - 926.34 Feet 923.62 Feet Freeboard - - 0.06 Feet 2.78 Feet
The following can be concluded based on the analysis results summarized in Table 2:
1. The Auxiliary Spillway crest is 1.93 feet higher than required using the 100-year flood activation criteria.
2. For a Class C (high hazard) structure, the dam would not be overtopped and would have 0.06 feet of freeboard to pass the 6-hr Freeboard Hydrograph.
New Creek Site 1 Dam Rehabilitation Assessment Report
8 March 2011
NRCS
5. Spillway Integrity Analyses
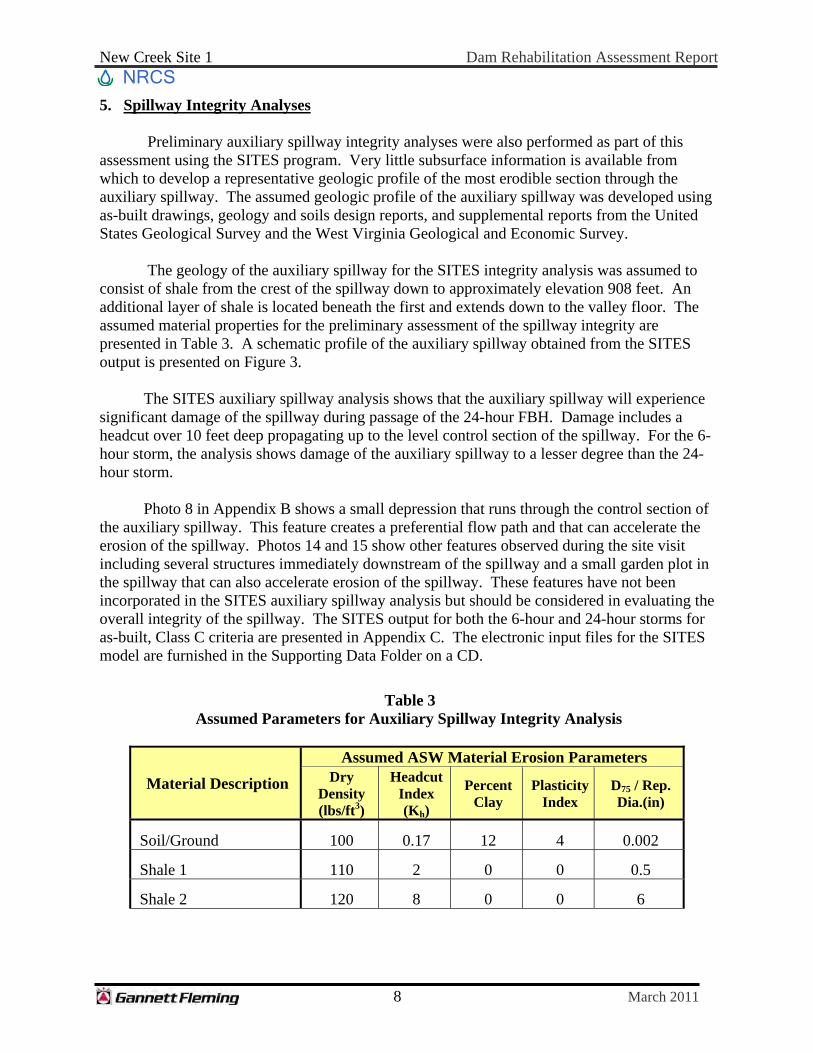
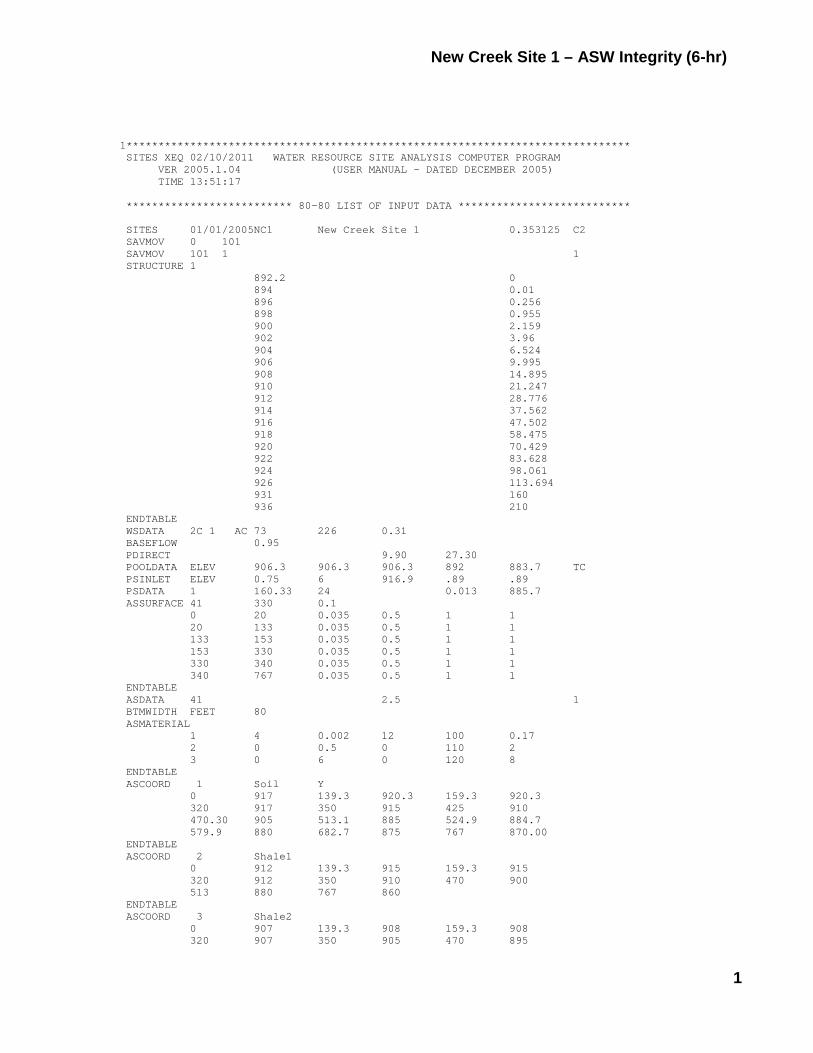
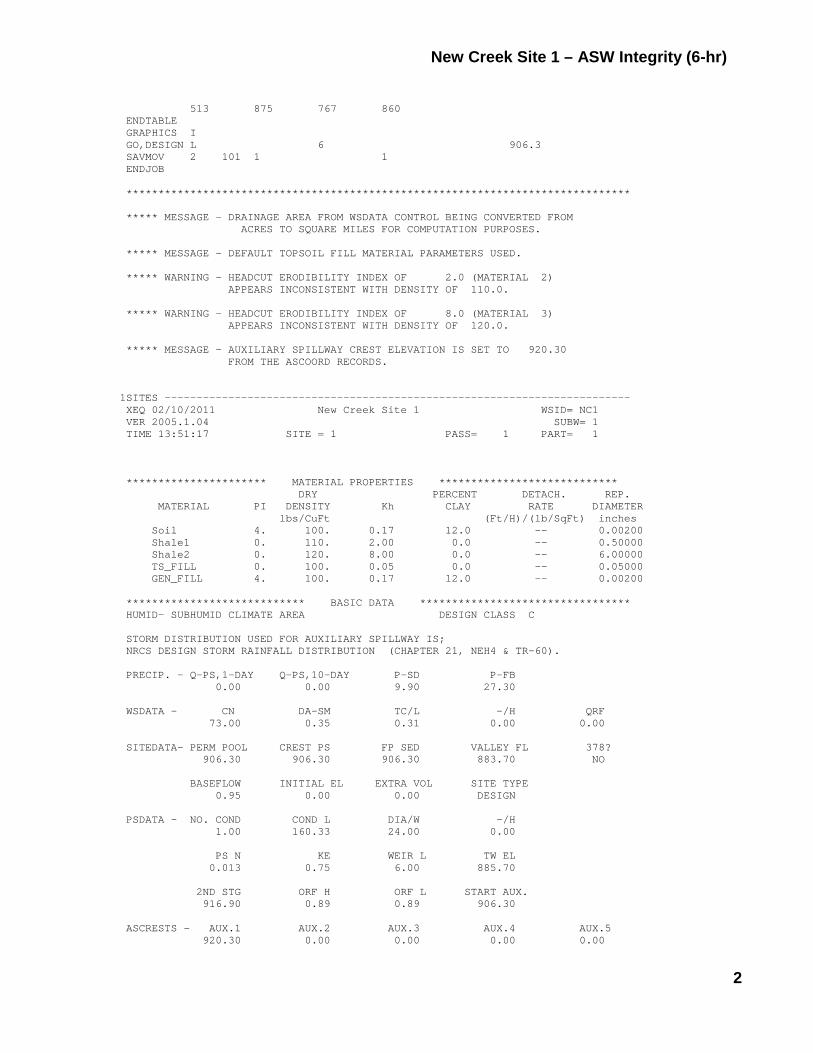
Preliminary auxiliary spillway integrity analyses were also performed as part of this assessment using the SITES program. Very little subsurface information is available from which to develop a representative geologic profile of the most erodible section through the auxiliary spillway. The assumed geologic profile of the auxiliary spillway was developed using as-built drawings, geology and soils design reports, and supplemental reports from the United States Geological Survey and the West Virginia Geological and Economic Survey.
The geology of the auxiliary spillway for the SITES integrity analysis was assumed to
consist of shale from the crest of the spillway down to approximately elevation 908 feet. An additional layer of shale is located beneath the first and extends down to the valley floor. The assumed material properties for the preliminary assessment of the spillway integrity are presented in Table 3. A schematic profile of the auxiliary spillway obtained from the SITES output is presented on Figure 3.
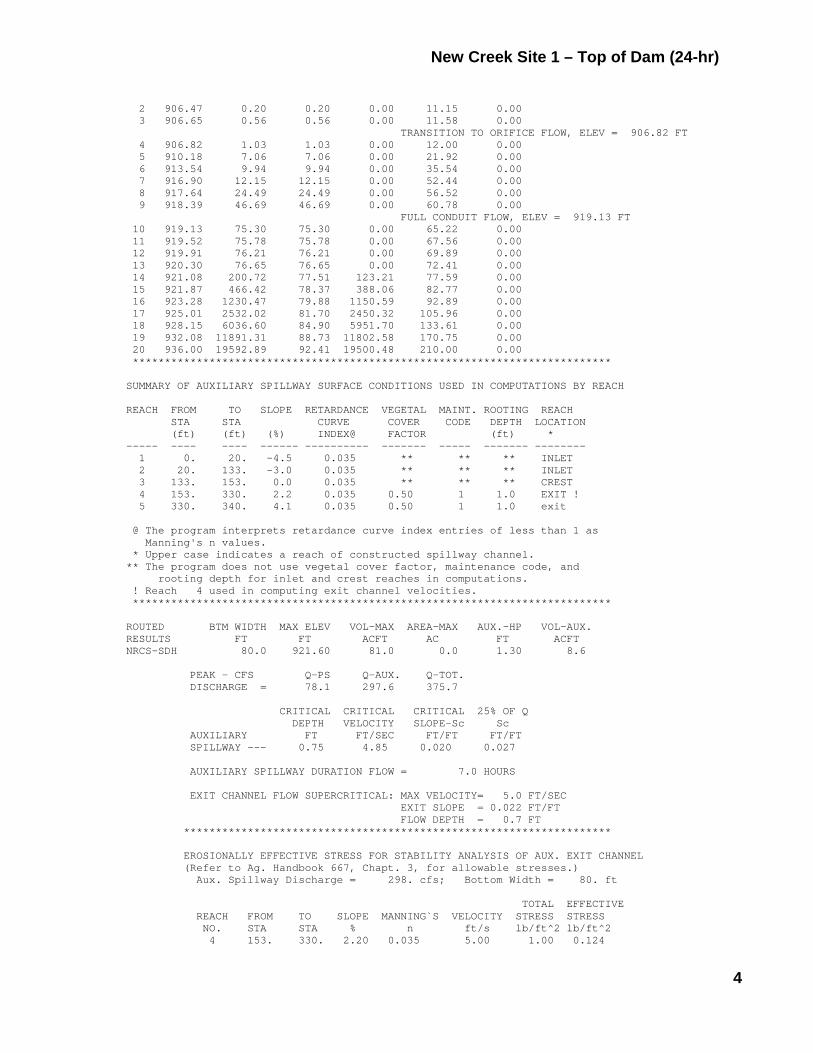
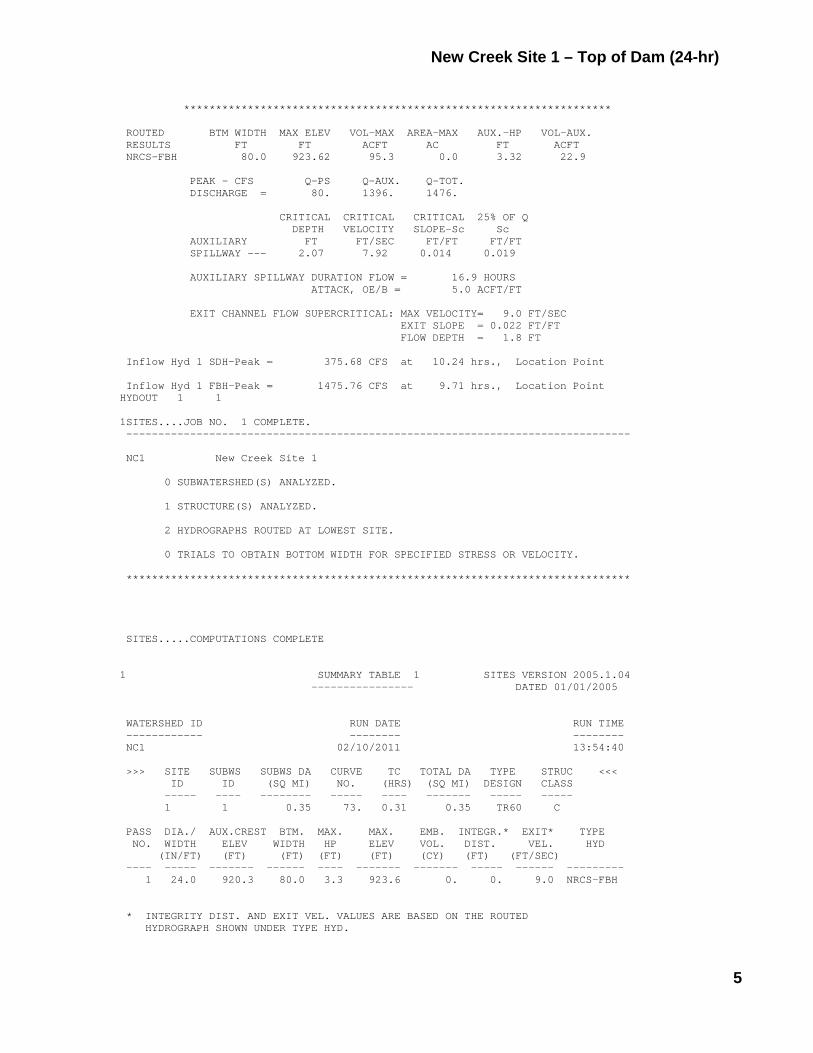
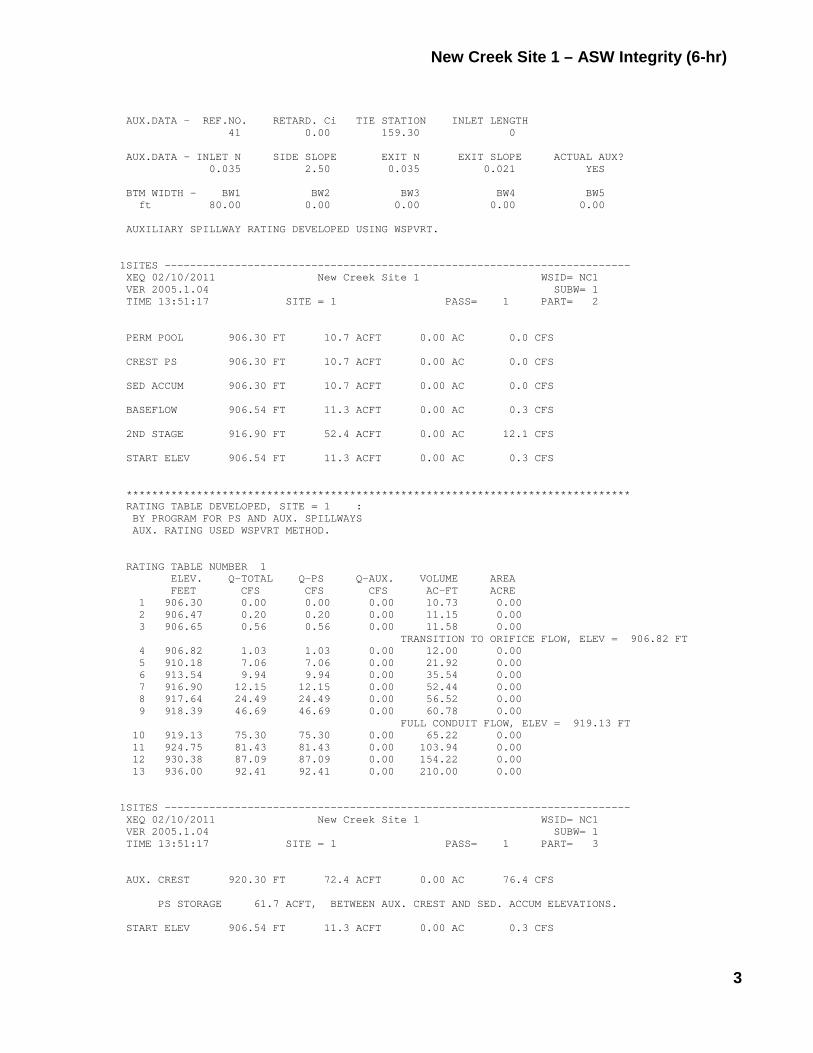
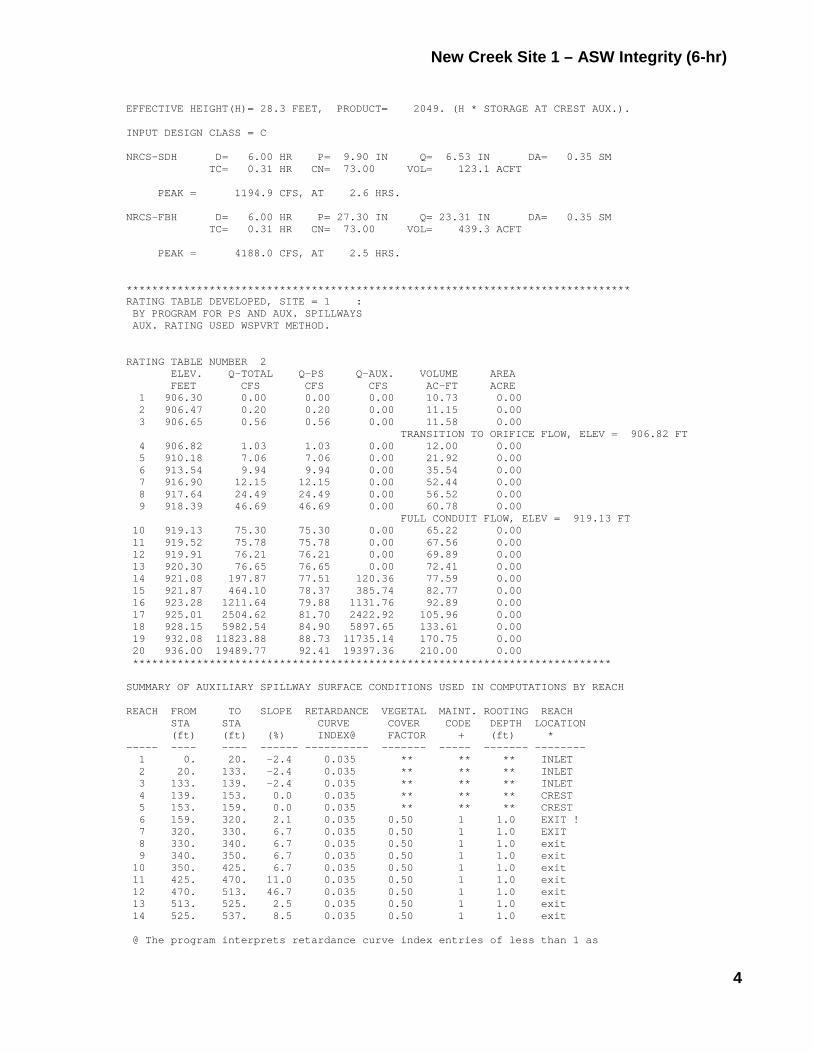
The SITES auxiliary spillway analysis shows that the auxiliary spillway will experience
significant damage of the spillway during passage of the 24-hour FBH. Damage includes a headcut over 10 feet deep propagating up to the level control section of the spillway. For the 6-hour storm, the analysis shows damage of the auxiliary spillway to a lesser degree than the 24-hour storm. Photo 8 in Appendix B shows a small depression that runs through the control section of the auxiliary spillway. This feature creates a preferential flow path and that can accelerate the erosion of the spillway. Photos 14 and 15 show other features observed during the site visit including several structures immediately downstream of the spillway and a small garden plot in the spillway that can also accelerate erosion of the spillway. These features have not been incorporated in the SITES auxiliary spillway analysis but should be considered in evaluating the overall integrity of the spillway. The SITES output for both the 6-hour and 24-hour storms for as-built, Class C criteria are presented in Appendix C. The electronic input files for the SITES model are furnished in the Supporting Data Folder on a CD.
Table 3 Assumed Parameters for Auxiliary Spillway Integrity Analysis
Material Description
Assumed ASW Material Erosion Parameters Dry
Density (lbs/ft3)
Headcut Index (Kh)
Percent Clay
Plasticity Index
D75 / Rep. Dia.(in)
Soil/Ground 100 0.17 12 4 0.002
Shale 1 110 2 0 0 0.5
Shale 2 120 8 0 0 6

New Creek Site 1 Dam Rehabilitation Assessment Report
9 March 2011
NRCS
Figure 3. Plot of Auxiliary Spillway Profile and Extent of Erosion from Integrity Analysis for 24-hour
Class C Freeboard Hydrograph (PMF) Obtained from SITES Model Output 6. Breach Inundation Mapping and Hazard Classification Summary
A dam breach hydraulic analysis was performed using the U.S. Army Corps of Engineers’ HEC-RAS computer model in order to determine the downstream inundation limits of the flood wave created by a sudden breach of the dam. A field assessment of downstream structures located within the path of the flood wave was also made to verify the current hazard classification. The hazard classification evaluation consisted of evaluating the downstream area within the breach inundation zone. The dam was then classified according to West Virginia State Dam Safety definitions and NRCS definitions in NEM, Part 520, Subpart C – Dams. The inflow hydrograph, reservoir stage-storage relationship, and other inputs used to describe the dam in the HEC-RAS model were obtained from the 6-hour FBH SITES output and as-built drawings. The dam breach parameters, including the time to breach, breach bottom width and side slopes were determined by trial and error until the peak breach discharge criteria specified in TR-60 was satisfied. The minimum and maximum peak breach discharges using TR-60 criteria were computed to be 35,375 cfs and 63,847 cfs, respectively. Assuming a complete breach of the dam occurs within 3 minutes, a peak breach discharge of approximately 36,000 cfs was computed using the HEC-RAS model. The height of the breach flood wave at the dam site, from the top of the dam to the valley floor would be approximately 47 feet.
The HEC-RAS dam breach analysis and downstream unsteady flow modeling of the flood wave was performed using a three (3) meter Digital Elevation Model (DEM) and SAMB Orthophotos to obtain the cross sections and Manning’s “n” values necessary for modeling the

New Creek Site 1 Dam Rehabilitation Assessment Report
10 March 2011
NRCS
channel and floodplain. The HEC-RAS model of the downstream area at the confluence of New Creek Site 1’s unnamed tributary with New Creek was treated as a junction so that the flood wave could be modeled as propagating both upstream and downstream of the junction. The additional storage attenuation of the flood wave within the reach immediately upstream of the junction can be an important feature of the hydraulic analysis. Without this feature, the downstream inundation limits can be overestimated.
The extent of the breach analysis was greater than that shown on the existing inundation map included in the Emergency Evacuation Plan for this structure. The breach analysis was based upon the FBH storm for a Class C dam with assumed failure occurring at the top of dam elevation. The FBH storm was only assumed to occur in the watershed upstream of the dam with normal base flow of approximately 200 cfs occurring downstream of the dam. Flood elevations were tracked downstream until they came largely within the stream bank or when the flow rate was less than 10 percent of the peak breach flow rate at the dam.
For New Creek Site 1, the inundation mapping was extended to the city of Keyser,
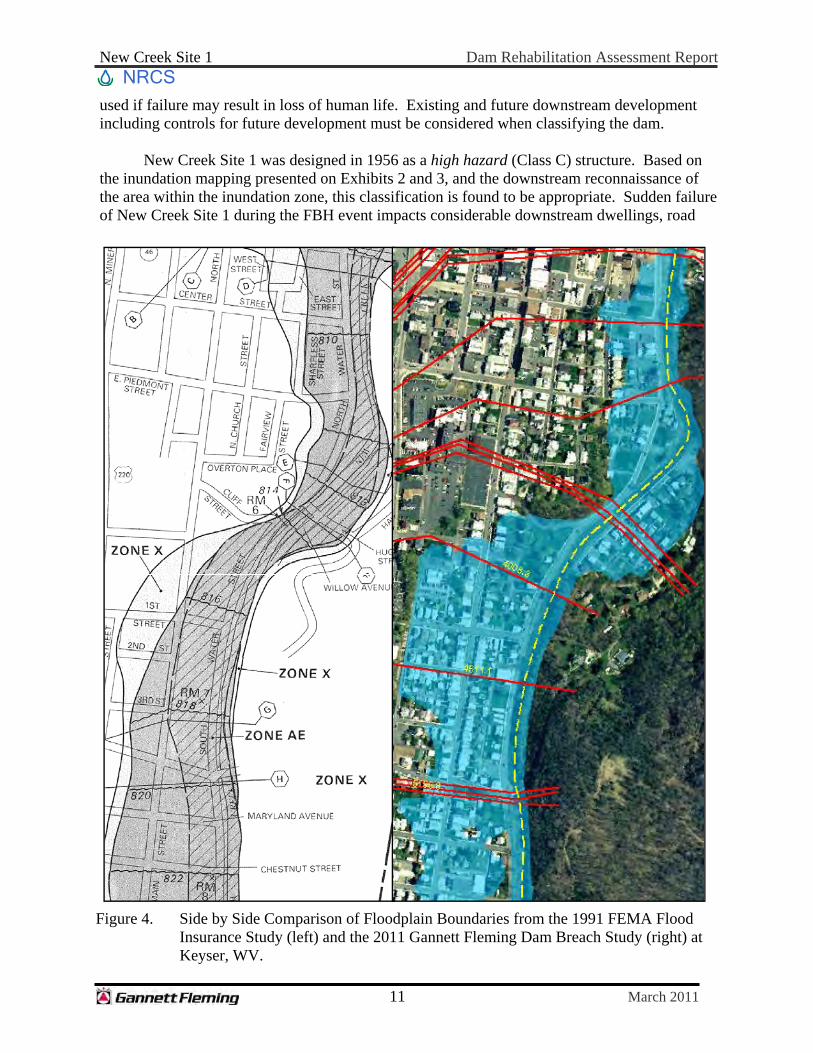
approximately 1.4 miles downstream of the dam, until the flood wave was largely within the banks of New Creek. According to the HEC-RAS dam breach model, the peak flow rate of the breach flow or flood wave at Keyser is approximately 6,000 cfs or 17 percent of the peak breach flow at the dam. The resulting inundation limits in the vicinity of Keyser were compared with the inundation limits shown on the existing detailed FEMA Flood Insurance maps for the same area for the 100-year and 500-year flood events. At Keyser, the peak 100-year and 500-year FEMA flood flows were estimated to be 10,610 cfs and 15,710 cfs, respectively. The two sources of mapping appear to be in very close agreement. The peak FEMA 100-year flood elevation near the center of Keyser was reported to be 811 feet. The peak dam breach flood elevation at the same location was computed to be 808.5 feet. A side by side comparison of the dam breach inundation mapping and the FEMA Flood Insurance mapping at Keyser is presented in Figure 4.
Homes, businesses, road crossings, bridges, farms and commercial buildings, utilities and
other structures located within the dam breach inundation limits were identified and photographed. All photographs were tagged electronically with their date, time, longitude and latitude using GPS. This information was used to create a GIS database to help quantify the flood impacts and persons at risk.
The limits of the maximum pool elevation and the downstream inundation were plotted in AutoCAD on both an orthophoto base map and a USGS Quadrangle base map, and are presented on Exhibits 2 and 3, respectively. The locations of all cross sections used in the HEC-RAS model are also shown Exhibits 2 and 3. All associated HEC-RAS, AutoCAD, and other supporting computer files are furnished in the Supporting Data Folder on a CD. A GIS database containing the downstream inundation limits and the photographs of all inundated features within the downstream inundation limits is also provided on a CD.
According to West Virginia State Dam Safety definitions and NRCS definitions in NEM, Part 520, Subpart C – Dams, high hazard dams (Class 1 or Class C) are those dams located where failure may cause loss of life or serious damage to homes, commercial or industrial buildings, main highways or railroads, or important public utilities. This classification must be
New Creek Site 1 Dam Rehabilitation Assessment Report
11 March 2011
NRCS
used if failure may result in loss of human life. Existing and future downstream development including controls for future development must be considered when classifying the dam.
New Creek Site 1 was designed in 1956 as a high hazard (Class C) structure. Based on the inundation mapping presented on Exhibits 2 and 3, and the downstream reconnaissance of the area within the inundation zone, this classification is found to be appropriate. Sudden failure of New Creek Site 1 during the FBH event impacts considerable downstream dwellings, road
Figure 4. Side by Side Comparison of Floodplain Boundaries from the 1991 FEMA Flood
Insurance Study (left) and the 2011 Gannett Fleming Dam Breach Study (right) at Keyser, WV.

New Creek Site 1 Dam Rehabilitation Assessment Report
12 March 2011
NRCS
crossings/bridges, commercial buildings and other structures, and meets both the loss of life and property damage criteria for a high hazard dam.
Eight dwellings were identified within the downstream inundation zone that are less than
200 feet from the toe of the dam. Many other dwellings in the City of Keyser would clearly be impacted by a flood wave.
A total of approximately 186 dwellings were judged to experience flooding of the
adjacent ground by a depth of more than 3 feet based on the aforementioned dam failure hydraulic analysis. The corresponding persons at risk (PAR) assuming an average of 2.5 persons per dwelling is 465 persons.
According to the HEC-RAS model results, it will take less than 15 minutes for a flood
wave created by a sudden failure of New Creek Site 1 to reach its peak flood level at Keyser. There is, therefore, a limited amount of warning time available which significantly decreases the probability of survival for persons at risk that are located in the downstream reaches of the inundation area. 7. Review of Available Geotechnical Information
Available geotechnical information was reviewed with respect to items that are considered in the “Evaluation of Potential Rehabilitation Projects-Priority Ranking Spreadsheet”. This information included the Geology Report (1956), as built plan sheets (1957), Phase I Inspection Report prepared by Berger Associates for the Huntington District of the U.S. Army Corps of Engineers (1981), a trip report prepared by the SCS (03/1984), and a dam inspection report prepared by the WVDEP (11/2009).
The 1950’s time period for design and construction predates the full development of
several current NRCS design criteria. Two important design criteria include drain/filter compatibility and seepage control for principal spillway conduits. The manuals that define these two design methodologies, Gradation Design of Sand and Gravel Filters and Filter Diaphragms, were first published in 1994 and 2007, respectively. The compatibility of adjacent embankment zones is another design criteria that has developed since the 1960’s and has become an essential step in the design process for earthen dams.
As discussed in Section 3, significant modifications have been made to the principal
spillway conduit of New Creek Site 1. The conduit has been extended and additional fill added to the embankment and downstream toe area to cover the pipe and backfill the former plunge pool. The joint between the original pipe and the extension is open. As observed during the WV DEP November 2009 inspection, the joint spacing was large enough to capture all of the flow from the riser. No exit point for the flow could be determined. Also, the single outlet pipe for the internal embankment drain appears to have been buried in conjunction with the additional fill placement.
The existing embankment drain consists of a single coarse aggregate material. No
gradation limits are specified. The as built drawings state a requirement for pit run sand and gravel or a 2:1 mixture of concrete sand and coarse aggregate. The use of drain materials
New Creek Site 1 Dam Rehabilitation Assessment Report
13 March 2011
NRCS
without specified gradation limits for drains is problematic with respect to compatibility with adjacent embankment and foundation soils.
The drain configuration within the embankment has very few similarities to currently
designed filter diaphragms. While its horizontal dimension, which essentially extends from abutment to abutment, does exceed current criteria, the lack of any piping alongside the principal spillway conduit is a significant omission from current design.
Slope stability analyses performed as part of the original design were not available. A
stability analysis, however, was performed in conjunction with the Phase I inspection. Since no site specific shear strength parameters were available, the analysis was an iterative solution that solved for a factor of safety of 1.5 while varying soil strengths. The predicted shear strengths were judged to be within the expected range for site soils; therefore, the stability was considered to be adequate.
The significant seepage control deficiencies, an open joint in the principal spillway
conduit, sand and gravel drain material, the lack of a filter diaphragm, and a buried outlet pipe, require a thorough seepage assessment of the embankment. As recommended by WV DEP, this assessment should include televising the entire length of the conduit, and observing the conduit after each storm event that fills the pipe by about one quarter of its cross section. This seepage assessment should include a subsurface investigation to determine the geotechnical characteristics of the foundation and embankment. The dam has no instrumentation to monitor phreatic levels, seepage discharge or surface movement.
Review comments related to the geotechnical factors in the “Evaluation of Potential
Rehabilitation Projects-Priority Ranking Spreadsheet” are presented in Appendix D. Also included in the appendix is a copy of the spreadsheet as completed by the WV NRCS.
8. Failure and Risk Indexes
The structure’s risk of failure and the consequences of failure were evaluated by the WV NRCS by completing the “Evaluation of Potential Rehabilitation Projects-Priority Ranking Spreadsheet” (Exhibit 508.1 of the NRCS-National Watershed Manual) to determine whether the dam qualifies for rehabilitation as per Section 508 Subpart E of the National Watershed Manual. Based on the completed spreadsheet, the total failure index computed by the NRCS for New Creek Site 1 is 200, with a total risk index of 3,720. A copy of the spreadsheet completed by the WV NRCS is included in Appendix D. 9. Discussion of Potential Rehabilitation Alternatives
New Creek Site 1 meets current Class C (high hazard) design criteria relating to overtopping of the dam and activation of the auxiliary spillway. However, it is recommended that action be taken to rehabilitate the principal spillway outlet structure due to unauthorized alterations made prior to 1984. This would include rehabilitation of the conduit, plunge pool or other method of energy dissipation, embankment drains, and the downstream discharge channel.

New Creek Site 1 Dam Rehabilitation Assessment Report
14 March 2011
NRCS
It appears that the auxiliary spillway would experience a significant but acceptable
amount of damage during passage of the Freeboard Hydrograph as determined by the preliminary SITES integrity analysis. However, it is noted that the spillway integrity analysis was performed using limited information about the subsurface properties of the spillway. Some design features within the embankment, particularly drain/filter compatibility, seepage control, and compatibility between adjacent embankment zones as discussed in Section 7 of this report, do not meet current NRCS design criteria. Full evaluation for compliance to current criteria cannot be confirmed without a subsurface investigation and subsequent analyses and are not included herein as deficiencies requiring rehabilitation. 10. Cost Estimates for Rehabilitation Alternatives
Based on preliminary information, planning level cost estimates were prepared for the two alternatives listed in Table 4. Decommissioning or breaching the dam was included as an alternative. Due to the many factors related to the rehabilitation of the principal spillway outlet structure, the cost of this alternative has been approximated and is listed as a range. Factors impacting this cost include the possibility of land acquisition, the unknown condition of the buried conduit and drains, and the length of downstream channel to be rehabilitated. The cost estimate for breaching the dam is based on construction prices from similar projects.
In addition to the costs noted in Table 4, subsequent investigation of the condition of the
embankment and auxiliary spillway profile may reveal additional deficiencies. Such deficiencies could increase rehabilitation costs substantially.
Table 4 Planning-Level Cost Estimates for Modifications to Bring
New Creek Site 1 into Compliance with NRCS Class C Design Criteria*
Alternative Alternative Description Estimated Total Project Cost
1
Rehabilitate Principal Spillway Outlet Conduit, Energy Dissipation Structure, Embankment Drains, and the Discharge Channel
$1,500,000 - $2,000,000
2 Decommission/Breach Dam $600,000
* Some design features within the embankment may not meet current NRCS design criteria. Compliance of these features cannot be confirmed without further analysis and are not included herein as deficiencies requiring rehabilitation.
New Creek Site 1 Dam Rehabilitation Assessment Report
15 March 2011
NRCS
11. Conclusions and Recommendations 11.1 Operations and Maintenance. Several maintenance deficiencies exist at New Creek
Site 1 that need to be addressed. These include filling animal burrows, removal of obstructions in the auxiliary spillway, filling and reseeding the depression in the auxiliary spillway, removal of vegetation in the downstream discharge channel, and repairing the corroded lower trash rack.
11.2 Additional Studies. Subsurface investigations to more accurately quantify conditions within the embankment, foundation, and auxiliary spillway are recommended. This information is important to confirm that the embankment meets current design criteria and to more accurately evaluate the integrity of the auxiliary spillway. Embankment slope stability should be evaluated based on the results of the subsurface investigations. Items not readily accessible for inspection such as the inside of the principal spillway conduit, riser structure, and embankment drains, and the submerged exterior of the riser and sluice gate should also be assessed. As recommended by WV DEP, a thorough seepage assessment of the embankment should be performed and include televising the entire length of the conduit, and observing the conduit after each storm event that fills the pipe by about one quarter of its cross section. This seepage assessment should include a subsurface investigation to determine the geotechnical characteristics of the foundation and embankment. In addition to subsurface investigations, the potential for flooding at events less than the Probable Maximum Flood should be considered due to the development that has taken place immediately downstream of the dam. The Emergency Action Plan (EAP) should also be reviewed and updated accordingly since there are houses located just downstream of the auxiliary spillway. Current EAP guidelines call for evacuation of downstream persons only if the dam is in danger of failure; however, significant auxiliary spillway flows could endanger houses and potentially human life.
11.3 Hazard Classification. Based on the inundation mapping prepared as part of this study and the downstream reconnaissance of the area within the inundation zone, the classification of New Creek Site 1 as a high hazard structure is found to be appropriate. Sudden failure of New Creek Site 1 during the FBH event impacts considerable downstream dwellings, road crossings/bridges, commercial buildings and other structures, and meets both the loss of life and property damage criteria for a high hazard dam.
11.4 Design Deficiencies. New Creek Site 1 meets current Class C (high hazard) design criteria relating to overtopping of the dam and activation of the auxiliary spillway. However, it is recommended that action be taken to rehabilitate the principal spillway outlet structure due to unauthorized alterations made prior to 1984. Other deficiencies may exist related to geotechnical issues with the embankment or features that were not inspected.

New Creek Site 1 Dam Rehabilitation Assessment Report
16 March 2011
NRCS
11.5 Failure and Risk Indexes and Priority Ranking of Rehabilitation Project. The total
failure index for New Creek Site 1 as indicated in the spreadsheet prepared by the WV NRCS is 200, with a total risk index of 3,720.
11.6 Rehabilitation Project. Significant modifications to the principal spillway outlet of New Creek Site 1 are needed to bring the dam into compliance with current NRCS high hazard dam design criteria, for the known deficiencies. This would include rehabilitation of the conduit, plunge pool or other method of energy dissipation, embankment drains, and the downstream discharge channel. A planning level total project cost to make structural modifications to the dam to meet current NRCS design criteria is estimated to be between $1,500,000 and $2,000,000. This estimate assumes that major expenditures to address potential embankment and auxiliary spillway integrity deficiencies are not required, as discussed in Section 9 and Section 11.2.
, , f’-. .—-S •
: ‘ • .
#“
5%
5
;
S • •‘ , S
‘.;
‘S •
Sz
,c
55 ‘
•S’ •: •,.
: ‘ . N .
. ;5—’ . . •1” •
5/ 5 S ; •S
A 5, 4 •:,
5%
—, - S
•‘:,
,
.5
5
-‘
. S
I a- , I ‘5,., 5.
-
Si5
A ,-5 , j-
S55
S SS .S. S. • S•
.5 S •
SS_
S\ 55 •‘ ,: . S
S
— ‘.
c
,SSS #55
S • .
S;_.
S : • -:
NEWCREEK . / . .
‘ ,, “ • •
SITE I DAM ‘S /
S
: : -
-.:
S •
•
7/S ;•f :. : ‘
‘
.5
..%.‘.
,*. —
I,)
S
S
•5•
S
‘S• ;‘H •
\9-
7 5,
••5; • . ..S
. 5. : S..S
:“•- ,
S
S
S •
• SS
SS S.
:•
DAM BREACH INUNDATION MAP. , & S
S.
S • — ..5
5
S A’55”
NEW CREEK SITE I-
S•
S ‘S.
• •• S •. NIDID: WV 05701
?$T / 5’ S MINERAL COUNTY WEST VIRGINIA
4:t NRCS
$ - •S: :; . . S5;
—n .Conseron Srvice
. .
SS5. . ,
.SS S, “
.‘ S :c , sf5 S •
S•;
••
S ; . w
IS
: •. -
5Sc\
. ,
, :c.. • ‘ S • LEGEND
4 ,S . .,
S’ —V HEC-RAS CROSS SC11ONS
i S SS
S
I I INUNDA11ON AREA
! •S
.5
S • •
I I FLOOD POOL
S S
S• S
55•
400 .Qs 400 800. V
‘:
V S , -
! .. . . S
SCALE IN FEET
V ,S,
5V •5
PREPAREDSY: EXHIBIT
V V‘ :: •k VV • V &anne.ttFleming 2
V
.,,.SS
VVV•VV 2O7SENATEAVENUE,GAMPHILLSPAVI7OII NOV2010
___
.J
I’
..———iOO ./ / ___ —...
(_ -. , /
( .-. •-1---;:i‘
>-:- ;41c - - ‘7-
- c::_S s
,
L Ste
-
‘•/‘//i
:;‘1’7 ‘
ccN—. ) •1r4 ..-: •
__%\ 4
Ar:4d*e\ ;‘
J4S(
/ .,‘ ,
c( I
2 *:
,
/
w+
LEGEND
HEC-RAS CROSS SECTIONS
_______ INUNDATION AREA
FLOOD POOL
400 -0- 400 800
SCALE IN FELT
S Li 5
“::: ‘))) [4
T
-5--
‘fiy
-
.
N
DAM BREACH INUNDATION MAP
NEW CREEK SITE IMOlD: WV 05701
MINERAL COUNTY, WEST VIRGINIA
, ••:--
7-
__s I,
N’
ÔNRCSNa8flLl Ss0ep4mA4a4oo
, ‘7fj
__
‘N, y,’) I
___
ii \(\\\\dS -
‘ --2- - / -
EXHIBIT
3NOV. 2010

NRCS
Appendix A Selected As-Built Drawings
APPE
ND
IX A
NRCS
Appendix B Site Inspection Checklist and Photos
APPE
ND
IX B
New Creek Site 1 Site Inspection September 2, 2010
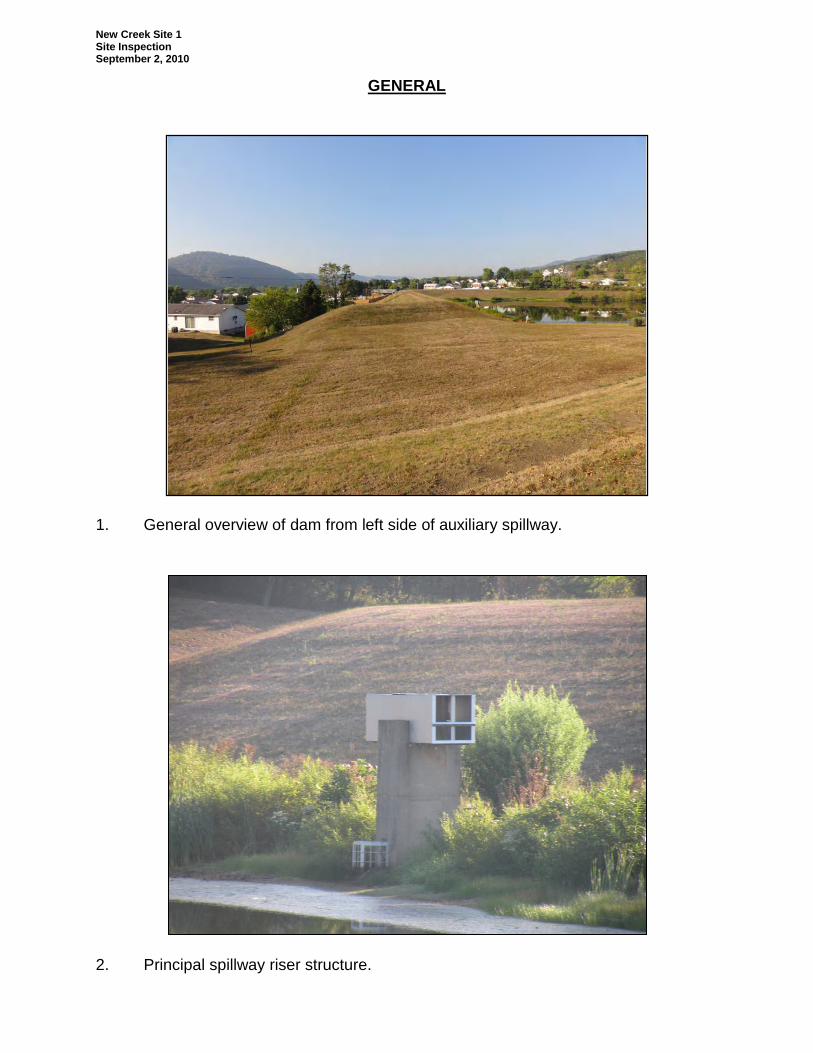
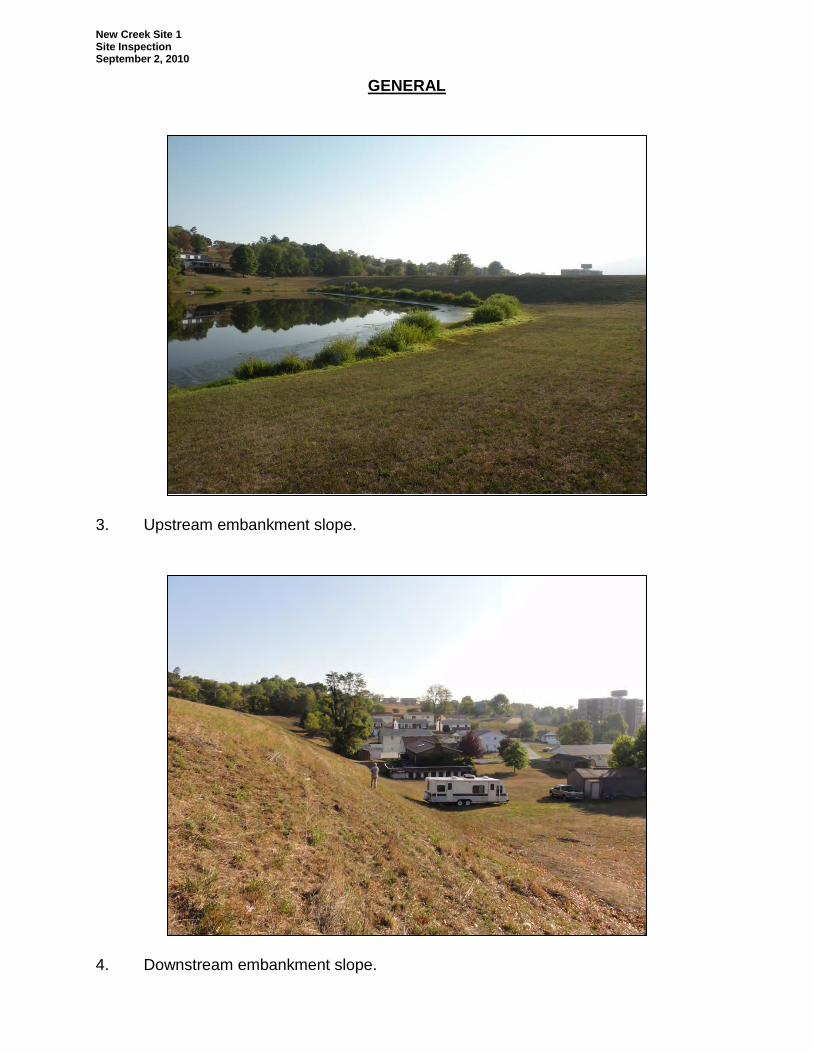
GENERAL
1. General overview of dam from left side of auxiliary spillway.
2. Principal spillway riser structure.
New Creek Site 1 Site Inspection September 2, 2010
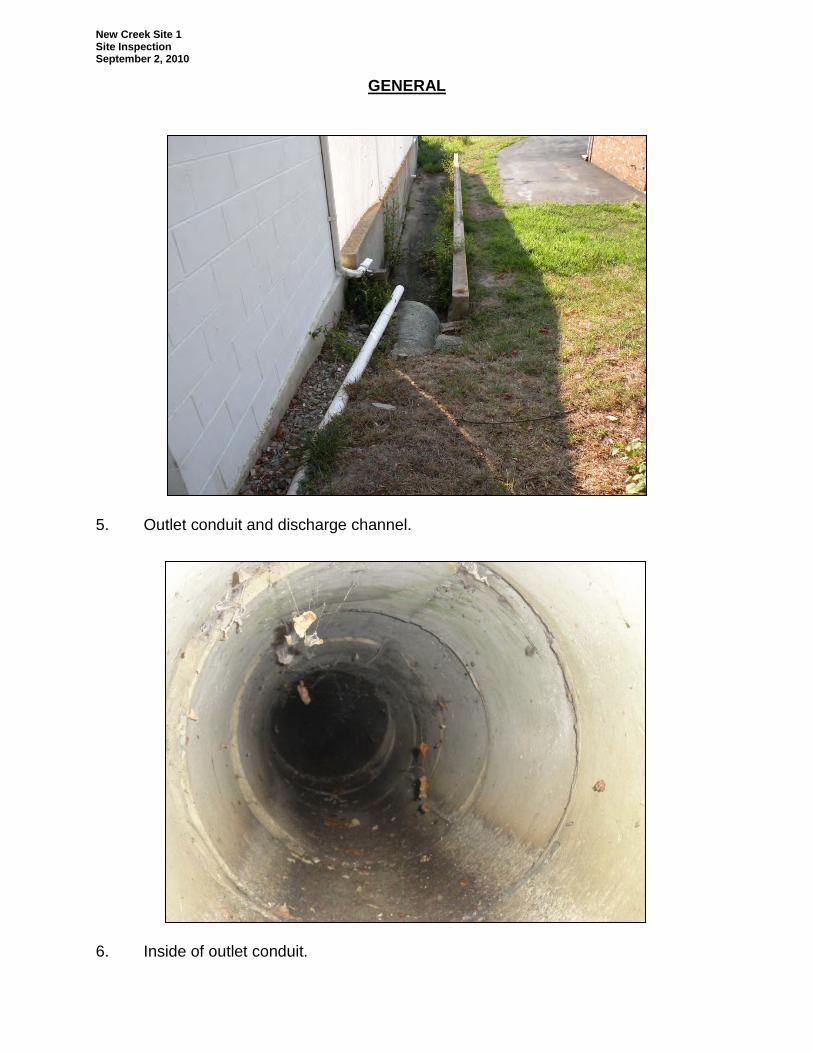
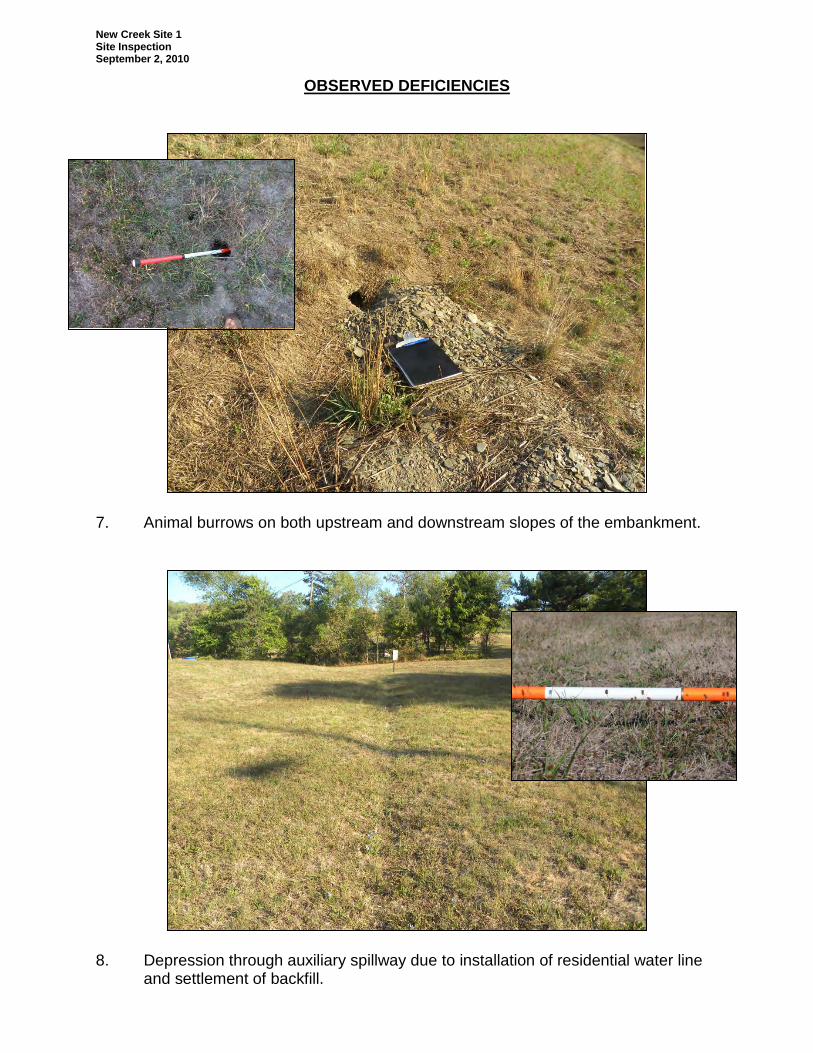
GENERAL
3. Upstream embankment slope.
4. Downstream embankment slope.
New Creek Site 1 Site Inspection September 2, 2010
GENERAL
5. Outlet conduit and discharge channel.
6. Inside of outlet conduit.
New Creek Site 1 Site Inspection September 2, 2010
OBSERVED DEFICIENCIES
7. Animal burrows on both upstream and downstream slopes of the embankment.
8. Depression through auxiliary spillway due to installation of residential water line
and settlement of backfill.
New Creek Site 1 Site Inspection September 2, 2010
OBSERVED DEFICIENCIES
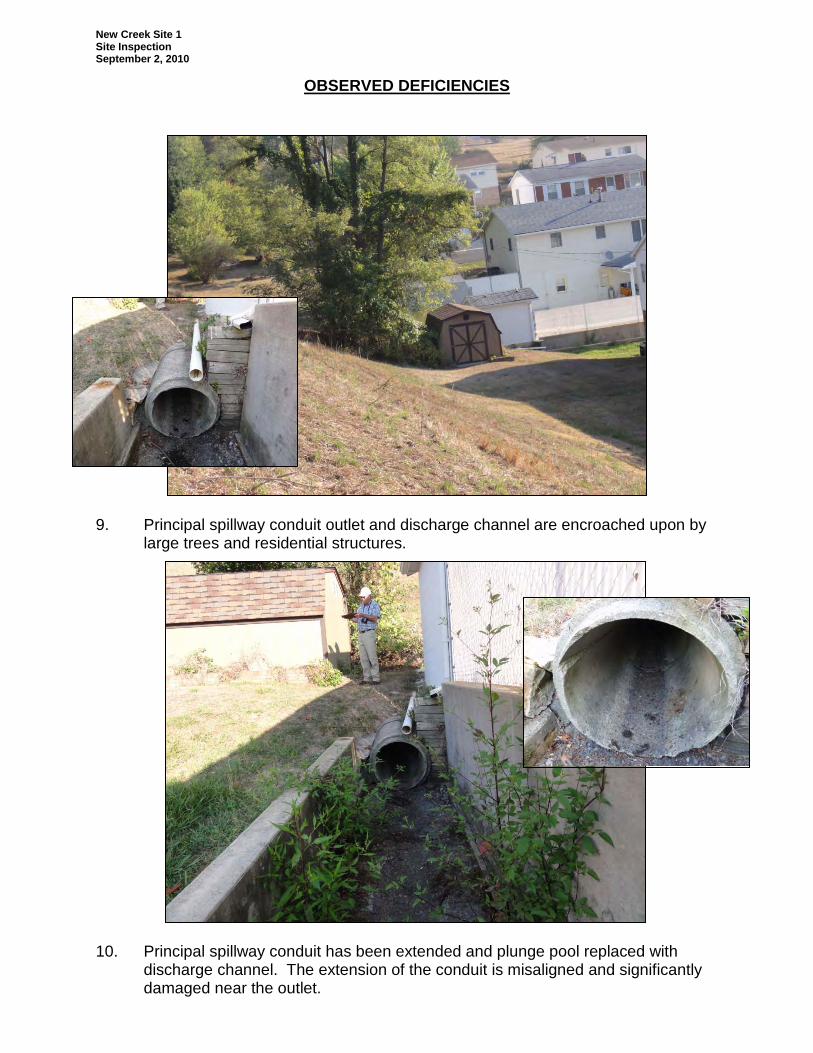
9. Principal spillway conduit outlet and discharge channel are encroached upon by
large trees and residential structures.
10. Principal spillway conduit has been extended and plunge pool replaced with
discharge channel. The extension of the conduit is misaligned and significantly damaged near the outlet.
New Creek Site 1 Site Inspection September 2, 2010
OBSERVED DEFICIENCIES
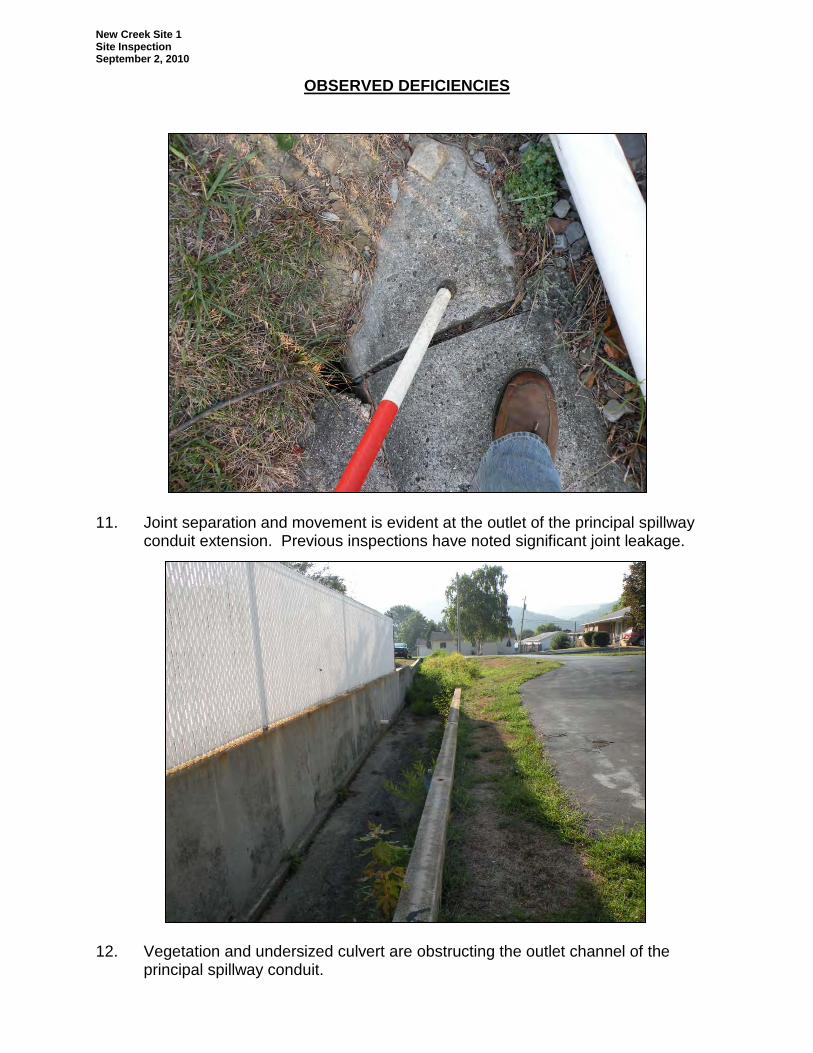
11. Joint separation and movement is evident at the outlet of the principal spillway
conduit extension. Previous inspections have noted significant joint leakage.
12. Vegetation and undersized culvert are obstructing the outlet channel of the
principal spillway conduit.
New Creek Site 1 Site Inspection September 2, 2010
OBSERVED DEFICIENCIES
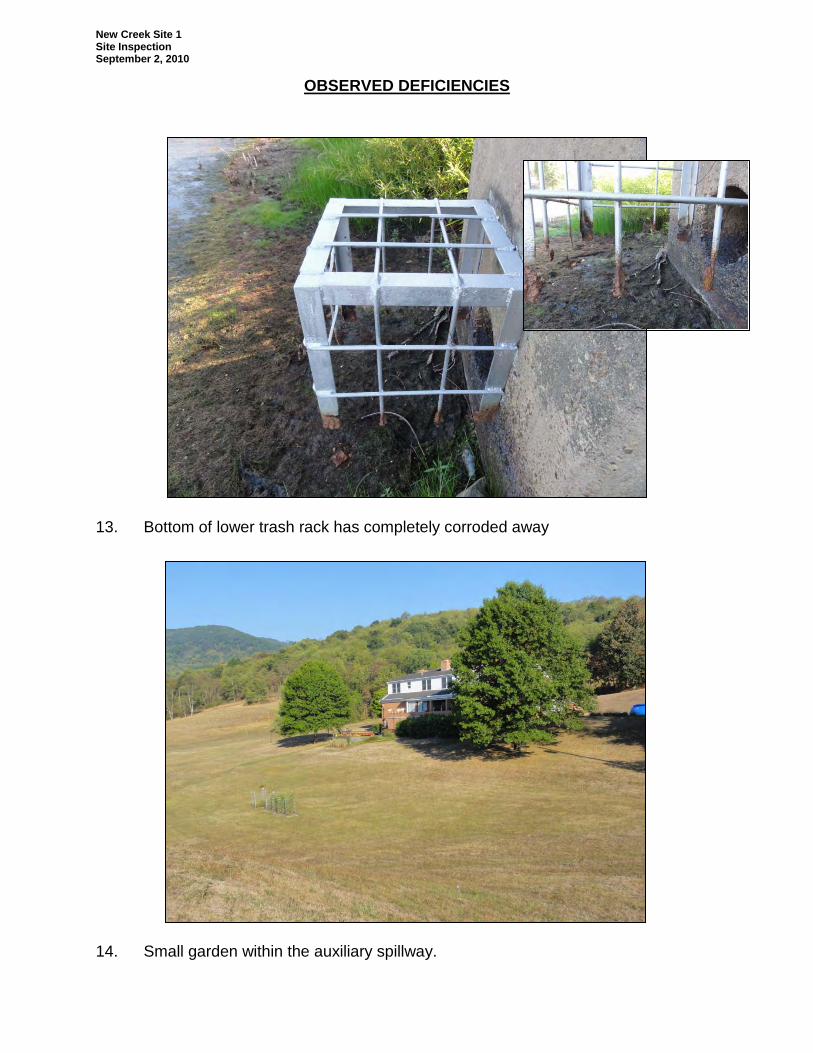
13. Bottom of lower trash rack has completely corroded away
14. Small garden within the auxiliary spillway.
New Creek Site 1 Site Inspection September 2, 2010
OBSERVED DEFICIENCIES
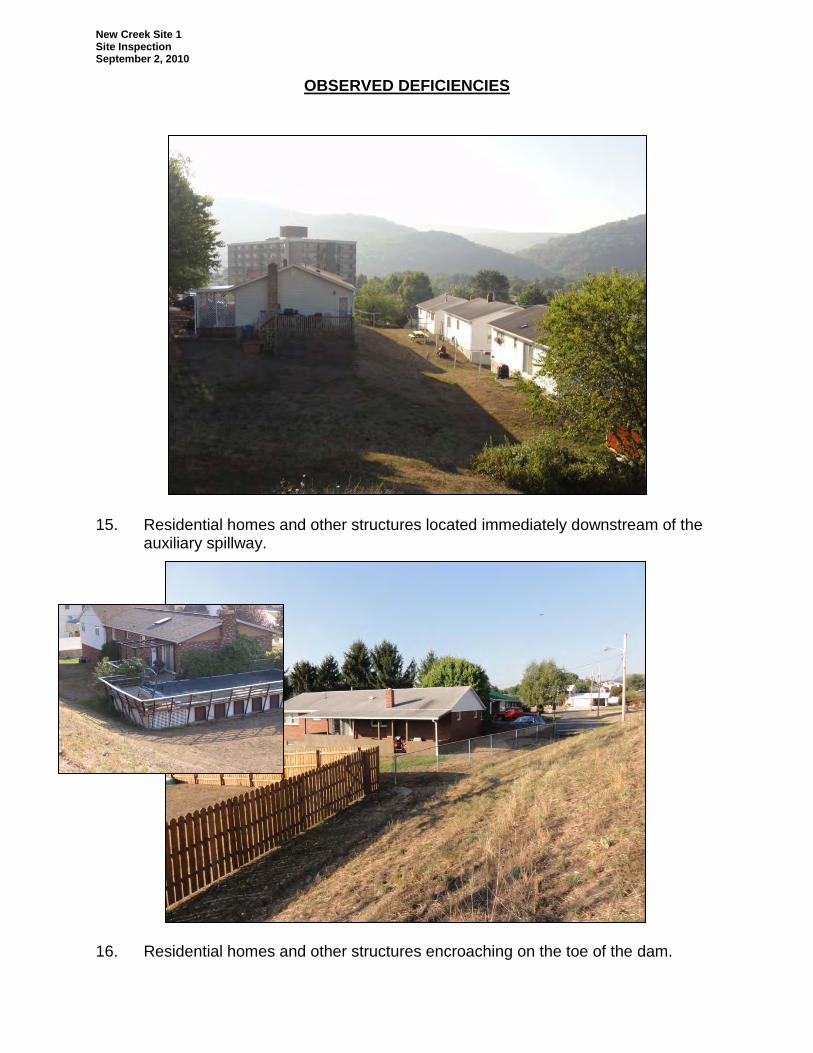
15. Residential homes and other structures located immediately downstream of the
auxiliary spillway.
16. Residential homes and other structures encroaching on the toe of the dam.
NRCS
Appendix C SITES Output
APPE
ND
IX C
NRCS
SITES Output New Creek Site 1 – ASW Crest Criteria
New Creek Site 1 – ASW Crest Criteria
1
1******************************************************************************* SITES XEQ 02/10/2011 WATER RESOURCE SITE ANALYSIS COMPUTER PROGRAM VER 2005.1.04 (USER MANUAL - DATED DECEMBER 2005) TIME 13:55:28 ************************** 80-80 LIST OF INPUT DATA *************************** SITES 01/01/2005NC1 New Creek Site 1 0.353125 A1 SAVMOV 0 101 SAVMOV 101 1 1 STRUCTURE 1 892.2 0 894 0.01 896 0.256 898 0.955 900 2.159 902 3.96 904 6.524 906 9.995 908 14.895 910 21.247 912 28.776 914 37.562 916 47.502 918 58.475 920 70.429 922 83.628 924 98.061 926 113.694 931 160 936 210 ENDTABLE WSDATA 2C 1 AC 73 226 0.31 6.2 BASEFLOW 0.95 PDIRECT 5.82 8.49 POOLDATA ELEV 906.3 906.3 TC PSINLET ELEV 0.75 6 916.9 .89 .89 PSDATA 1 160.33 24 0.013 885.7 GRAPHICS I GO,DESIGN LN SAVMOV 2 101 1 1 ENDJOB ******************************************************************************* ***** MESSAGE - DRAINAGE AREA FROM WSDATA CONTROL BEING CONVERTED FROM ACRES TO SQUARE MILES FOR COMPUTATION PURPOSES. 1SITES ------------------------------------------------------------------------- XEQ 02/10/2011 New Creek Site 1 WSID= NC1 VER 2005.1.04 SUBW= 1 TIME 13:55:28 SITE = 1 PASS= 1 PART= 1 **************************** BASIC DATA ********************************* HUMID- SUBHUMID CLIMATE AREA DESIGN CLASS C STORM DISTRIBUTION PSH..10 DAY NRCS DESIGN STORM (CHAPTER 21, NEH4 & TR-60). STORM DISTRIBUTION USED FOR AUXILIARY SPILLWAY IS; NRCS DESIGN STORM RAINFALL DISTRIBUTION (CHAPTER 21, NEH4 & TR-60). PRECIP. - P-PS,1-DAY P-PS,10-DAY Q-SD Q-FB 5.82 8.49 0.00 0.00 WSDATA - CN DA-SM TC/L -/H QRF
New Creek Site 1 – ASW Crest Criteria
2
73.00 0.35 0.31 0.00 6.20 SITEDATA- PERM POOL CREST PS FP SED VALLEY FL 378? 0.00 906.30 906.30 0.00 NO BASEFLOW INITIAL EL EXTRA VOL SITE TYPE 0.95 0.00 0.00 DESIGN PSDATA - NO. COND COND L DIA/W -/H 1.00 160.33 24.00 0.00 PS N KE WEIR L TW EL 0.013 0.75 6.00 885.70 2ND STG ORF H ORF L START AUX. 916.90 0.89 0.89 0.00 ASCRESTS - AUX.1 AUX.2 AUX.3 AUX.4 AUX.5 0.00 0.00 0.00 0.00 0.00 AUX.DATA - REF.NO. RETARD. Ci TIE STATION INLET LENGTH 0 0.00 0.00 0 AUX.DATA - INLET N SIDE SLOPE EXIT N EXIT SLOPE ACTUAL AUX? 0.000 0.00 0.000 0.000 NO BTM WIDTH - BW1 BW2 BW3 BW4 BW5 0.00 0.00 0.00 0.00 0.00 1SITES ------------------------------------------------------------------------- XEQ 02/10/2011 New Creek Site 1 WSID= NC1 VER 2005.1.04 SUBW= 1 TIME 13:55:28 SITE = 1 PASS= 1 PART= 2 CREST PS 906.30 FT 10.7 ACFT 0.00 AC 0.0 CFS SED ACCUM 906.30 FT 10.7 ACFT 0.00 AC 0.0 CFS BASEFLOW 906.54 FT 11.3 ACFT 0.00 AC 0.3 CFS 2ND STAGE 916.90 FT 52.4 ACFT 0.00 AC 12.1 CFS START ELEV 906.54 FT 11.3 ACFT 0.00 AC 0.3 CFS NRCS-PSH RAINFALL 1-DAY = 5.82 IN 10-DAY = 8.49 IN DA = 0.35 SM RUNOFF 1-DAY = 2.94 IN 10-DAY = 3.24 IN CLIMATIC INDEX = 1.00 CN 10-DAY = 56. CN 1-DAY = 73. QRF = 2.19 CFS 907.60 FEET, GIVEN VALUE. PEAK = 586.3 CFS, AT 120.0 HRS. ROUTED RESULT - HYD TYPE EMAX VOL-MAX AMAX QMAX NRCS-PSH 918.37 FT 60.7 ACFT 0.00 AC 46.2 CFS PS STORAGE 50.0 ACFT, BETWEEN AUX. CREST AND SED. ACCUM ELEVATIONS. DRAWDOWN (DDT) TEST 909.20 FT 18.7 ACFT 5.12 CFS CONTROL IS 0.150 DETENTION STORAGE TIME TO DDT TEST DISCHARGE IS 2.73 DAYS - DRAWDOWN CONTINUING. DRAWDOWN TIME = 6.29 DAYS, TO 2.2 CFS (LIMIT = 10.00 DAYS) *******************************************************************************
New Creek Site 1 – ASW Crest Criteria
3
RATING TABLE DEVELOPED, SITE = 1 : WITH PS DEVELOPED BY PROGRAM AND NO AUX. DATA GIVEN. RATING TABLE NUMBER 1 ELEV. Q-TOTAL Q-PS Q-AUX. VOLUME AREA FEET CFS CFS CFS AC-FT ACRE 1 906.30 0.00 0.00 0.00 10.73 0.00 2 906.47 0.20 0.20 0.00 11.15 0.00 3 906.65 0.56 0.56 0.00 11.58 0.00 TRANSITION TO ORIFICE FLOW, ELEV = 906.82 FT 4 906.82 1.03 1.03 0.00 12.00 0.00 5 910.18 7.06 7.06 0.00 21.92 0.00 6 913.54 9.94 9.94 0.00 35.54 0.00 7 916.90 12.15 12.15 0.00 52.44 0.00 8 917.64 24.49 24.49 0.00 56.52 0.00 9 918.39 46.69 46.69 0.00 60.78 0.00 FULL CONDUIT FLOW, ELEV = 919.13 FT 10 919.13 75.30 75.30 0.00 65.22 0.00 11 924.75 81.43 81.43 0.00 103.94 0.00 12 930.38 87.09 87.09 0.00 154.22 0.00 13 936.00 92.41 92.41 0.00 210.00 0.00 1SITES ------------------------------------------------------------------------- XEQ 02/10/2011 New Creek Site 1 WSID= NC1 VER 2005.1.04 SUBW= 1 TIME 13:55:28 SITE = 1 PASS= 1 PART= 3 AUX. CREST 918.37 FT 60.7 ACFT 0.00 AC 46.2 CFS PS STORAGE 50.0 ACFT, BETWEEN AUX. CREST AND SED. ACCUM ELEVATIONS. START ELEV 907.62 FT 14.0 ACFT 0.00 AC 2.5 CFS ELEVATION OF LOW POINT IS ZERO. NO CRITERIA CHECK MADE FOR STRUCTURE CLASSIFICATION. ***** MESSAGE - NO INPUT DATA GIVEN FOR AUXILIARY SPILLWAY CREST AND/OR BOTTOM WIDTH. NO AUXILIARY SPILLWAY ROUTINGS PERFORMED. ------------------------------------------------------------------------------- Inflow Hyd 1 PSH-Peak = 46.23 CFS at 120.60 hrs., Location Point HYDOUT 1 1 1SITES....JOB NO. 1 COMPLETE. ------------------------------------------------------------------------------- NC1 New Creek Site 1 0 SUBWATERSHED(S) ANALYZED. 1 STRUCTURE(S) ANALYZED. 1 HYDROGRAPHS ROUTED AT LOWEST SITE. 0 TRIALS TO OBTAIN BOTTOM WIDTH FOR SPECIFIED STRESS OR VELOCITY. *******************************************************************************
New Creek Site 1 – ASW Crest Criteria
4
SITES.....COMPUTATIONS COMPLETE 1 SUMMARY TABLE 1 SITES VERSION 2005.1.04 ---------------- DATED 01/01/2005 WATERSHED ID RUN DATE RUN TIME ------------ -------- -------- NC1 02/10/2011 13:55:28 >>> SITE SUBWS SUBWS DA CURVE TC TOTAL DA TYPE STRUC <<< ID ID (SQ MI) NO. (HRS) (SQ MI) DESIGN CLASS ----- ---- -------- ----- ---- ------- ----- ----- 1 1 0.35 73. 0.31 0.35 TR60 C PASS DIA./ AUX.CREST BTM. MAX. MAX. EMB. INTEGR.* EXIT* TYPE NO. WIDTH ELEV WIDTH HP ELEV VOL. DIST. VEL. HYD (IN/FT) (FT) (FT) (FT) (FT) (CY) (FT) (FT/SEC) ---- ----- ------- ------ ---- ------- ------- ----- ------ --------- SITES.......SUMMARY TABLE 1 COMPLETED. NRCS SITES VERSION 2005.1.04 ,01/01/2005 NC1 FILES INPUT = W:\426\Active Jobs\52299 - WV NRCS 2010 Contract\05 Working\41 Dam Assessments\New Creek Site 1\NC1 SITES Model\NC1\NC1_ASW_Crest.D2C OUTPUT = W:\426\Active Jobs\52299 - WV NRCS 2010 Contract\05 Working\41 Dam Assessments\New Creek Site 1\NC1 SITES Model\NC1\NC1_ASW_Crest.OUT DATED 02/10/2011 13:55:28 GRAPHICS FILES GENERATED OPTION "L" = W:\426\Active Jobs\52299 - WV NRCS 2010 Contract\05 Working\41 Dam Assessments\New Creek Site 1\NC1 SITES Model\NC1\NC1_ASW_Crest.DRG DATED 02/10/2011 13:55:28 OPTION "P" = W:\426\Active Jobs\52299 - WV NRCS 2010 Contract\05 Working\41 Dam Assessments\New Creek Site 1\NC1 SITES Model\NC1\NC1_ASW_Crest.DHY DATED 02/10/2011 13:55:28 OPTION "E" = W:\426\Active Jobs\52299 - WV NRCS 2010 Contract\05 Working\41 Dam Assessments\New Creek Site 1\NC1 SITES Model\NC1\NC1_ASW_Crest.DEM DATED 02/10/2011 13:55:28
NRCS
SITES Output New Creek Site 1 – Top of Dam (6-hr)
New Creek Site 1 – Top of Dam (6-hr)
1
1******************************************************************************* SITES XEQ 02/10/2011 WATER RESOURCE SITE ANALYSIS COMPUTER PROGRAM VER 2005.1.04 (USER MANUAL - DATED DECEMBER 2005) TIME 13:52:14 ************************** 80-80 LIST OF INPUT DATA *************************** SITES 01/01/2005NC1 New Creek Site 1 0.353125 C2 SAVMOV 0 101 SAVMOV 101 1 1 STRUCTURE 1 892.2 0 894 0.01 896 0.256 898 0.955 900 2.159 902 3.96 904 6.524 906 9.995 908 14.895 910 21.247 912 28.776 914 37.562 916 47.502 918 58.475 920 70.429 922 83.628 924 98.061 926 113.694 931 160 936 210 ENDTABLE WSDATA 2C 1 AC 73 226 0.31 BASEFLOW 0.95 PDIRECT 9.90 27.30 POOLDATA ELEV 906.3 906.3 906.3 892 883.7 TC PSINLET ELEV 0.75 6 916.9 .89 .89 PSDATA 1 160.33 24 0.013 885.7 ASSPRFL 41 0 916 20 916.91 133 920.3 153 920.3 330 916.406 340 916 ENDTABLE ASSURFACE 41 330 0.1 0 20 0.035 0.5 1 1 20 133 0.035 0.5 1 1 133 153 0.035 0.5 1 1 153 330 0.035 0.5 1 1 330 340 0.035 0.5 1 1 ENDTABLE ASDATA 41 2.5 2 BTMWIDTH FEET 80 GRAPHICS I GO,DESIGN HL 6 906.3 SAVMOV 2 101 1 1 ENDJOB ******************************************************************************* ***** MESSAGE - DRAINAGE AREA FROM WSDATA CONTROL BEING CONVERTED FROM ACRES TO SQUARE MILES FOR COMPUTATION PURPOSES. ***** MESSAGE - AUXILIARY SPILLWAY CREST ELEVATION IS SET TO 920.30 FROM THE ASSPRFL RECORDS. 1SITES ------------------------------------------------------------------------- XEQ 02/10/2011 New Creek Site 1 WSID= NC1
New Creek Site 1 – Top of Dam (6-hr)
2
VER 2005.1.04 SUBW= 1 TIME 13:52:14 SITE = 1 PASS= 1 PART= 1 **************************** BASIC DATA ********************************* HUMID- SUBHUMID CLIMATE AREA DESIGN CLASS C STORM DISTRIBUTION USED FOR AUXILIARY SPILLWAY IS; NRCS DESIGN STORM RAINFALL DISTRIBUTION (CHAPTER 21, NEH4 & TR-60). PRECIP. - Q-PS,1-DAY Q-PS,10-DAY P-SD P-FB 0.00 0.00 9.90 27.30 WSDATA - CN DA-SM TC/L -/H QRF 73.00 0.35 0.31 0.00 0.00 SITEDATA- PERM POOL CREST PS FP SED VALLEY FL 378? 906.30 906.30 906.30 883.70 NO BASEFLOW INITIAL EL EXTRA VOL SITE TYPE 0.95 0.00 0.00 DESIGN PSDATA - NO. COND COND L DIA/W -/H 1.00 160.33 24.00 0.00 PS N KE WEIR L TW EL 0.013 0.75 6.00 885.70 2ND STG ORF H ORF L START AUX. 916.90 0.89 0.89 906.30 ASCRESTS - AUX.1 AUX.2 AUX.3 AUX.4 AUX.5 920.30 0.00 0.00 0.00 0.00 AUX.DATA - REF.NO. RETARD. Ci TIE STATION INLET LENGTH 41 0.00 153.00 0 AUX.DATA - INLET N SIDE SLOPE EXIT N EXIT SLOPE ACTUAL AUX? 0.035 2.50 0.035 0.022 NO BTM WIDTH - BW1 BW2 BW3 BW4 BW5 ft 80.00 0.00 0.00 0.00 0.00 AUXILIARY SPILLWAY RATING DEVELOPED USING WSPVRT. 1SITES ------------------------------------------------------------------------- XEQ 02/10/2011 New Creek Site 1 WSID= NC1 VER 2005.1.04 SUBW= 1 TIME 13:52:14 SITE = 1 PASS= 1 PART= 2 PERM POOL 906.30 FT 10.7 ACFT 0.00 AC 0.0 CFS CREST PS 906.30 FT 10.7 ACFT 0.00 AC 0.0 CFS SED ACCUM 906.30 FT 10.7 ACFT 0.00 AC 0.0 CFS BASEFLOW 906.54 FT 11.3 ACFT 0.00 AC 0.3 CFS 2ND STAGE 916.90 FT 52.4 ACFT 0.00 AC 12.1 CFS START ELEV 906.54 FT 11.3 ACFT 0.00 AC 0.3 CFS ******************************************************************************* RATING TABLE DEVELOPED, SITE = 1 : BY PROGRAM FOR PS AND AUX. SPILLWAYS AUX. RATING USED WSPVRT METHOD.
New Creek Site 1 – Top of Dam (6-hr)
3
RATING TABLE NUMBER 1 ELEV. Q-TOTAL Q-PS Q-AUX. VOLUME AREA FEET CFS CFS CFS AC-FT ACRE 1 906.30 0.00 0.00 0.00 10.73 0.00 2 906.47 0.20 0.20 0.00 11.15 0.00 3 906.65 0.56 0.56 0.00 11.58 0.00 TRANSITION TO ORIFICE FLOW, ELEV = 906.82 FT 4 906.82 1.03 1.03 0.00 12.00 0.00 5 910.18 7.06 7.06 0.00 21.92 0.00 6 913.54 9.94 9.94 0.00 35.54 0.00 7 916.90 12.15 12.15 0.00 52.44 0.00 8 917.64 24.49 24.49 0.00 56.52 0.00 9 918.39 46.69 46.69 0.00 60.78 0.00 FULL CONDUIT FLOW, ELEV = 919.13 FT 10 919.13 75.30 75.30 0.00 65.22 0.00 11 924.75 81.43 81.43 0.00 103.94 0.00 12 930.38 87.09 87.09 0.00 154.22 0.00 13 936.00 92.41 92.41 0.00 210.00 0.00 1SITES ------------------------------------------------------------------------- XEQ 02/10/2011 New Creek Site 1 WSID= NC1 VER 2005.1.04 SUBW= 1 TIME 13:52:14 SITE = 1 PASS= 1 PART= 3 AUX. CREST 920.30 FT 72.4 ACFT 0.00 AC 76.4 CFS PS STORAGE 61.7 ACFT, BETWEEN AUX. CREST AND SED. ACCUM ELEVATIONS. START ELEV 906.54 FT 11.3 ACFT 0.00 AC 0.3 CFS EFFECTIVE HEIGHT(H)= 28.3 FEET, PRODUCT= 2049. (H * STORAGE AT CREST AUX.). INPUT DESIGN CLASS = C NRCS-SDH D= 6.00 HR P= 9.90 IN Q= 6.53 IN DA= 0.35 SM TC= 0.31 HR CN= 73.00 VOL= 123.1 ACFT PEAK = 1194.9 CFS, AT 2.6 HRS. NRCS-FBH D= 6.00 HR P= 27.30 IN Q= 23.31 IN DA= 0.35 SM TC= 0.31 HR CN= 73.00 VOL= 439.3 ACFT PEAK = 4188.0 CFS, AT 2.5 HRS. ******************************************************************************* RATING TABLE DEVELOPED, SITE = 1 : BY PROGRAM FOR PS AND AUX. SPILLWAYS AUX. RATING USED WSPVRT METHOD. RATING TABLE NUMBER 2 ELEV. Q-TOTAL Q-PS Q-AUX. VOLUME AREA FEET CFS CFS CFS AC-FT ACRE 1 906.30 0.00 0.00 0.00 10.73 0.00 2 906.47 0.20 0.20 0.00 11.15 0.00 3 906.65 0.56 0.56 0.00 11.58 0.00 TRANSITION TO ORIFICE FLOW, ELEV = 906.82 FT 4 906.82 1.03 1.03 0.00 12.00 0.00 5 910.18 7.06 7.06 0.00 21.92 0.00 6 913.54 9.94 9.94 0.00 35.54 0.00 7 916.90 12.15 12.15 0.00 52.44 0.00 8 917.64 24.49 24.49 0.00 56.52 0.00 9 918.39 46.69 46.69 0.00 60.78 0.00 FULL CONDUIT FLOW, ELEV = 919.13 FT 10 919.13 75.30 75.30 0.00 65.22 0.00 11 919.52 75.78 75.78 0.00 67.56 0.00
New Creek Site 1 – Top of Dam (6-hr)
4
12 919.91 76.21 76.21 0.00 69.89 0.00 13 920.30 76.65 76.65 0.00 72.41 0.00 14 921.08 200.72 77.51 123.21 77.59 0.00 15 921.87 466.42 78.37 388.06 82.77 0.00 16 923.28 1230.47 79.88 1150.59 92.89 0.00 17 925.01 2532.02 81.70 2450.32 105.96 0.00 18 928.15 6036.60 84.90 5951.70 133.61 0.00 19 932.08 11891.31 88.73 11802.58 170.75 0.00 20 936.00 19592.89 92.41 19500.48 210.00 0.00 *************************************************************************** SUMMARY OF AUXILIARY SPILLWAY SURFACE CONDITIONS USED IN COMPUTATIONS BY REACH REACH FROM TO SLOPE RETARDANCE VEGETAL MAINT. ROOTING REACH STA STA CURVE COVER CODE DEPTH LOCATION (ft) (ft) (%) INDEX@ FACTOR (ft) * ----- ---- ---- ------ ---------- ------- ----- ------- -------- 1 0. 20. -4.5 0.035 ** ** ** INLET 2 20. 133. -3.0 0.035 ** ** ** INLET 3 133. 153. 0.0 0.035 ** ** ** CREST 4 153. 330. 2.2 0.035 0.50 1 1.0 EXIT ! 5 330. 340. 4.1 0.035 0.50 1 1.0 exit @ The program interprets retardance curve index entries of less than 1 as Manning's n values. * Upper case indicates a reach of constructed spillway channel. ** The program does not use vegetal cover factor, maintenance code, and rooting depth for inlet and crest reaches in computations. ! Reach 4 used in computing exit channel velocities. *************************************************************************** ROUTED BTM WIDTH MAX ELEV VOL-MAX AREA-MAX AUX.-HP VOL-AUX. RESULTS FT FT ACFT AC FT ACFT NRCS-SDH 80.0 921.33 79.2 0.0 1.03 6.8 PEAK - CFS Q-PS Q-AUX. Q-TOT. DISCHARGE = 77.8 206.0 283.8 CRITICAL CRITICAL CRITICAL 25% OF Q DEPTH VELOCITY SLOPE-Sc Sc AUXILIARY FT FT/SEC FT/FT FT/FT SPILLWAY --- 0.59 4.31 0.022 0.029 AUXILIARY SPILLWAY DURATION FLOW = 3.7 HOURS EXIT CHANNEL FLOW SUPERCRITICAL: MAX VELOCITY= 4.3 FT/SEC EXIT SLOPE = 0.022 FT/FT FLOW DEPTH = 0.6 FT ******************************************************************* EROSIONALLY EFFECTIVE STRESS FOR STABILITY ANALYSIS OF AUX. EXIT CHANNEL (Refer to Ag. Handbook 667, Chapt. 3, for allowable stresses.) Aux. Spillway Discharge = 206. cfs; Bottom Width = 80. ft TOTAL EFFECTIVE REACH FROM TO SLOPE MANNING`S VELOCITY STRESS STRESS NO. STA STA % n ft/s lb/ft^2 lb/ft^2 4 153. 330. 2.20 0.035 4.34 0.80 0.100 ******************************************************************* ROUTED BTM WIDTH MAX ELEV VOL-MAX AREA-MAX AUX.-HP VOL-AUX. RESULTS FT FT ACFT AC FT ACFT NRCS-FBH 80.0 926.34 116.8 0.0 6.04 44.4 PEAK - CFS Q-PS Q-AUX. Q-TOT. DISCHARGE = 83. 3828. 3911. CRITICAL CRITICAL CRITICAL 25% OF Q DEPTH VELOCITY SLOPE-Sc Sc AUXILIARY FT FT/SEC FT/FT FT/FT
New Creek Site 1 – Top of Dam (6-hr)
5
SPILLWAY --- 3.97 10.73 0.012 0.016 AUXILIARY SPILLWAY DURATION FLOW = 4.8 HOURS ATTACK, OE/B = 4.3 ACFT/FT EXIT CHANNEL FLOW SUPERCRITICAL: MAX VELOCITY= 13.1 FT/SEC EXIT SLOPE = 0.022 FT/FT FLOW DEPTH = 3.3 FT Inflow Hyd 1 SDH-Peak = 283.76 CFS at 3.56 hrs., Location Point Inflow Hyd 1 FBH-Peak = 3911.04 CFS at 2.65 hrs., Location Point HYDOUT 1 1 1SITES....JOB NO. 1 COMPLETE. ------------------------------------------------------------------------------- NC1 New Creek Site 1 0 SUBWATERSHED(S) ANALYZED. 1 STRUCTURE(S) ANALYZED. 2 HYDROGRAPHS ROUTED AT LOWEST SITE. 0 TRIALS TO OBTAIN BOTTOM WIDTH FOR SPECIFIED STRESS OR VELOCITY. ******************************************************************************* SITES.....COMPUTATIONS COMPLETE 1 SUMMARY TABLE 1 SITES VERSION 2005.1.04 ---------------- DATED 01/01/2005 WATERSHED ID RUN DATE RUN TIME ------------ -------- -------- NC1 02/10/2011 13:52:14 >>> SITE SUBWS SUBWS DA CURVE TC TOTAL DA TYPE STRUC <<< ID ID (SQ MI) NO. (HRS) (SQ MI) DESIGN CLASS ----- ---- -------- ----- ---- ------- ----- ----- 1 1 0.35 73. 0.31 0.35 TR60 C PASS DIA./ AUX.CREST BTM. MAX. MAX. EMB. INTEGR.* EXIT* TYPE NO. WIDTH ELEV WIDTH HP ELEV VOL. DIST. VEL. HYD (IN/FT) (FT) (FT) (FT) (FT) (CY) (FT) (FT/SEC) ---- ----- ------- ------ ---- ------- ------- ----- ------ --------- 1 24.0 920.3 80.0 6.0 926.3 0. 0. 13.1 NRCS-FBH * INTEGRITY DIST. AND EXIT VEL. VALUES ARE BASED ON THE ROUTED HYDROGRAPH SHOWN UNDER TYPE HYD. SITES.......SUMMARY TABLE 1 COMPLETED. NRCS SITES VERSION 2005.1.04 ,01/01/2005 NC1 FILES INPUT = W:\426\Active Jobs\52299 - WV NRCS 2010 Contract\05 Working\41 Dam Assessments\New Creek Site 1\NC1 SITES Model\NC1\NC1_6hr_TOD_Crest.D2C
New Creek Site 1 – Top of Dam (6-hr)
6
OUTPUT = W:\426\Active Jobs\52299 - WV NRCS 2010 Contract\05 Working\41 Dam Assessments\New Creek Site 1\NC1 SITES Model\NC1\NC1_6hr_TOD_Crest.OUT DATED 02/10/2011 13:52:14 GRAPHICS FILES GENERATED OPTION "L" = W:\426\Active Jobs\52299 - WV NRCS 2010 Contract\05 Working\41 Dam Assessments\New Creek Site 1\NC1 SITES Model\NC1\NC1_6hr_TOD_Crest.DRG DATED 02/10/2011 13:52:14 OPTION "P" = W:\426\Active Jobs\52299 - WV NRCS 2010 Contract\05 Working\41 Dam Assessments\New Creek Site 1\NC1 SITES Model\NC1\NC1_6hr_TOD_Crest.DHY DATED 02/10/2011 13:52:14 OPTION "E" = W:\426\Active Jobs\52299 - WV NRCS 2010 Contract\05 Working\41 Dam Assessments\New Creek Site 1\NC1 SITES Model\NC1\NC1_6hr_TOD_Crest.DEM DATED 02/10/2011 13:52:14

NRCS
SITES Output New Creek Site 1 – Top of Dam (24-hr)
New Creek Site 1 – Top of Dam (24-hr)
1
1******************************************************************************* SITES XEQ 02/10/2011 WATER RESOURCE SITE ANALYSIS COMPUTER PROGRAM VER 2005.1.04 (USER MANUAL - DATED DECEMBER 2005) TIME 13:54:40 ************************** 80-80 LIST OF INPUT DATA *************************** SITES 01/01/2005NC1 New Creek Site 1 0.353125 C2 SAVMOV 0 101 SAVMOV 101 1 1 STRUCTURE 1 892.2 0 894 0.01 896 0.256 898 0.955 900 2.159 902 3.96 904 6.524 906 9.995 908 14.895 910 21.247 912 28.776 914 37.562 916 47.502 918 58.475 920 70.429 922 83.628 924 98.061 926 113.694 931 160 936 210 ENDTABLE WSDATA 2C 1 AC 73 226 0.31 BASEFLOW 0.95 RAINTABLE 1 24 0 0.008 0.0162 0.0246 0.0333 0.0425 0.0524 0.063 0.0743 0.0863 0.099 0.1124 0.1265 0.142 0.1595 0.18 0.205 0.255 0.345 0.437 0.53 0.603 0.633 0.66 0.684 0.705 0.724 0.742 0.759 0.775 0.79 0.8043 0.818 0.8312 0.8439 0.8561 0.8678 0.879 0.8898 0.9002 0.9103 0.9201 0.9297 0.9391 0.9483 0.9573 0.9661 0.9747 0.9832 0.9916 1 ENDTABLE PDIRECT 13.35 34.80 POOLDATA ELEV 906.3 906.3 906.3 892 883.7 TC PSINLET ELEV 0.75 6 916.9 .89 .89 PSDATA 1 160.33 24 0.013 885.7 ASSPRFL 41 0 916 20 916.91 133 920.3 153 920.3 330 916.406 340 916 ENDTABLE ASSURFACE 41 330 0.1 0 20 0.035 0.5 1 1 20 133 0.035 0.5 1 1 133 153 0.035 0.5 1 1 153 330 0.035 0.5 1 1 330 340 0.035 0.5 1 1 ENDTABLE ASDATA 41 2.5 2 BTMWIDTH FEET 80 GRAPHICS I GO,DESIGN HL 1 24 906.3 SAVMOV 2 101 1 1
New Creek Site 1 – Top of Dam (24-hr)
2
ENDJOB ******************************************************************************* ***** MESSAGE - DRAINAGE AREA FROM WSDATA CONTROL BEING CONVERTED FROM ACRES TO SQUARE MILES FOR COMPUTATION PURPOSES. ***** MESSAGE - AUXILIARY SPILLWAY CREST ELEVATION IS SET TO 920.30 FROM THE ASSPRFL RECORDS. 1SITES ------------------------------------------------------------------------- XEQ 02/10/2011 New Creek Site 1 WSID= NC1 VER 2005.1.04 SUBW= 1 TIME 13:54:40 SITE = 1 PASS= 1 PART= 1 **************************** BASIC DATA ********************************* HUMID- SUBHUMID CLIMATE AREA DESIGN CLASS C STORM DISTRIBUTION AUX. - PRECIP. - Q-PS,1-DAY Q-PS,10-DAY P-SD P-FB 0.00 0.00 13.35 34.80 WSDATA - CN DA-SM TC/L -/H QRF 73.00 0.35 0.31 0.00 0.00 SITEDATA- PERM POOL CREST PS FP SED VALLEY FL 378? 906.30 906.30 906.30 883.70 NO BASEFLOW INITIAL EL EXTRA VOL SITE TYPE 0.95 0.00 0.00 DESIGN PSDATA - NO. COND COND L DIA/W -/H 1.00 160.33 24.00 0.00 PS N KE WEIR L TW EL 0.013 0.75 6.00 885.70 2ND STG ORF H ORF L START AUX. 916.90 0.89 0.89 906.30 ASCRESTS - AUX.1 AUX.2 AUX.3 AUX.4 AUX.5 920.30 0.00 0.00 0.00 0.00 AUX.DATA - REF.NO. RETARD. Ci TIE STATION INLET LENGTH 41 0.00 153.00 0 AUX.DATA - INLET N SIDE SLOPE EXIT N EXIT SLOPE ACTUAL AUX? 0.035 2.50 0.035 0.022 NO BTM WIDTH - BW1 BW2 BW3 BW4 BW5 ft 80.00 0.00 0.00 0.00 0.00 AUXILIARY SPILLWAY RATING DEVELOPED USING WSPVRT. 1SITES ------------------------------------------------------------------------- XEQ 02/10/2011 New Creek Site 1 WSID= NC1 VER 2005.1.04 SUBW= 1 TIME 13:54:40 SITE = 1 PASS= 1 PART= 2 PERM POOL 906.30 FT 10.7 ACFT 0.00 AC 0.0 CFS CREST PS 906.30 FT 10.7 ACFT 0.00 AC 0.0 CFS SED ACCUM 906.30 FT 10.7 ACFT 0.00 AC 0.0 CFS
New Creek Site 1 – Top of Dam (24-hr)
3
BASEFLOW 906.54 FT 11.3 ACFT 0.00 AC 0.3 CFS 2ND STAGE 916.90 FT 52.4 ACFT 0.00 AC 12.1 CFS START ELEV 906.54 FT 11.3 ACFT 0.00 AC 0.3 CFS ******************************************************************************* RATING TABLE DEVELOPED, SITE = 1 : BY PROGRAM FOR PS AND AUX. SPILLWAYS AUX. RATING USED WSPVRT METHOD. RATING TABLE NUMBER 1 ELEV. Q-TOTAL Q-PS Q-AUX. VOLUME AREA FEET CFS CFS CFS AC-FT ACRE 1 906.30 0.00 0.00 0.00 10.73 0.00 2 906.47 0.20 0.20 0.00 11.15 0.00 3 906.65 0.56 0.56 0.00 11.58 0.00 TRANSITION TO ORIFICE FLOW, ELEV = 906.82 FT 4 906.82 1.03 1.03 0.00 12.00 0.00 5 910.18 7.06 7.06 0.00 21.92 0.00 6 913.54 9.94 9.94 0.00 35.54 0.00 7 916.90 12.15 12.15 0.00 52.44 0.00 8 917.64 24.49 24.49 0.00 56.52 0.00 9 918.39 46.69 46.69 0.00 60.78 0.00 FULL CONDUIT FLOW, ELEV = 919.13 FT 10 919.13 75.30 75.30 0.00 65.22 0.00 11 924.75 81.43 81.43 0.00 103.94 0.00 12 930.38 87.09 87.09 0.00 154.22 0.00 13 936.00 92.41 92.41 0.00 210.00 0.00 1SITES ------------------------------------------------------------------------- XEQ 02/10/2011 New Creek Site 1 WSID= NC1 VER 2005.1.04 SUBW= 1 TIME 13:54:40 SITE = 1 PASS= 1 PART= 3 AUX. CREST 920.30 FT 72.4 ACFT 0.00 AC 76.4 CFS PS STORAGE 61.7 ACFT, BETWEEN AUX. CREST AND SED. ACCUM ELEVATIONS. START ELEV 906.54 FT 11.3 ACFT 0.00 AC 0.3 CFS EFFECTIVE HEIGHT(H)= 28.3 FEET, PRODUCT= 2049. (H * STORAGE AT CREST AUX.). INPUT DESIGN CLASS = C NRCS-SDH D= 24.00 HR P= 13.35 IN Q= 9.75 IN DA= 0.35 SM TC= 0.31 HR CN= 73.00 VOL= 184.2 ACFT PEAK = 498.6 CFS, AT 9.7 HRS. NRCS-FBH D= 24.00 HR P= 34.80 IN Q= 30.72 IN DA= 0.35 SM TC= 0.31 HR CN= 73.00 VOL= 579.3 ACFT PEAK = 1481.6 CFS, AT 9.6 HRS. ******************************************************************************* RATING TABLE DEVELOPED, SITE = 1 : BY PROGRAM FOR PS AND AUX. SPILLWAYS AUX. RATING USED WSPVRT METHOD. RATING TABLE NUMBER 2 ELEV. Q-TOTAL Q-PS Q-AUX. VOLUME AREA FEET CFS CFS CFS AC-FT ACRE 1 906.30 0.00 0.00 0.00 10.73 0.00
New Creek Site 1 – Top of Dam (24-hr)
4
2 906.47 0.20 0.20 0.00 11.15 0.00 3 906.65 0.56 0.56 0.00 11.58 0.00 TRANSITION TO ORIFICE FLOW, ELEV = 906.82 FT 4 906.82 1.03 1.03 0.00 12.00 0.00 5 910.18 7.06 7.06 0.00 21.92 0.00 6 913.54 9.94 9.94 0.00 35.54 0.00 7 916.90 12.15 12.15 0.00 52.44 0.00 8 917.64 24.49 24.49 0.00 56.52 0.00 9 918.39 46.69 46.69 0.00 60.78 0.00 FULL CONDUIT FLOW, ELEV = 919.13 FT 10 919.13 75.30 75.30 0.00 65.22 0.00 11 919.52 75.78 75.78 0.00 67.56 0.00 12 919.91 76.21 76.21 0.00 69.89 0.00 13 920.30 76.65 76.65 0.00 72.41 0.00 14 921.08 200.72 77.51 123.21 77.59 0.00 15 921.87 466.42 78.37 388.06 82.77 0.00 16 923.28 1230.47 79.88 1150.59 92.89 0.00 17 925.01 2532.02 81.70 2450.32 105.96 0.00 18 928.15 6036.60 84.90 5951.70 133.61 0.00 19 932.08 11891.31 88.73 11802.58 170.75 0.00 20 936.00 19592.89 92.41 19500.48 210.00 0.00 *************************************************************************** SUMMARY OF AUXILIARY SPILLWAY SURFACE CONDITIONS USED IN COMPUTATIONS BY REACH REACH FROM TO SLOPE RETARDANCE VEGETAL MAINT. ROOTING REACH STA STA CURVE COVER CODE DEPTH LOCATION (ft) (ft) (%) INDEX@ FACTOR (ft) * ----- ---- ---- ------ ---------- ------- ----- ------- -------- 1 0. 20. -4.5 0.035 ** ** ** INLET 2 20. 133. -3.0 0.035 ** ** ** INLET 3 133. 153. 0.0 0.035 ** ** ** CREST 4 153. 330. 2.2 0.035 0.50 1 1.0 EXIT ! 5 330. 340. 4.1 0.035 0.50 1 1.0 exit @ The program interprets retardance curve index entries of less than 1 as Manning's n values. * Upper case indicates a reach of constructed spillway channel. ** The program does not use vegetal cover factor, maintenance code, and rooting depth for inlet and crest reaches in computations. ! Reach 4 used in computing exit channel velocities. *************************************************************************** ROUTED BTM WIDTH MAX ELEV VOL-MAX AREA-MAX AUX.-HP VOL-AUX. RESULTS FT FT ACFT AC FT ACFT NRCS-SDH 80.0 921.60 81.0 0.0 1.30 8.6 PEAK - CFS Q-PS Q-AUX. Q-TOT. DISCHARGE = 78.1 297.6 375.7 CRITICAL CRITICAL CRITICAL 25% OF Q DEPTH VELOCITY SLOPE-Sc Sc AUXILIARY FT FT/SEC FT/FT FT/FT SPILLWAY --- 0.75 4.85 0.020 0.027 AUXILIARY SPILLWAY DURATION FLOW = 7.0 HOURS EXIT CHANNEL FLOW SUPERCRITICAL: MAX VELOCITY= 5.0 FT/SEC EXIT SLOPE = 0.022 FT/FT FLOW DEPTH = 0.7 FT ******************************************************************* EROSIONALLY EFFECTIVE STRESS FOR STABILITY ANALYSIS OF AUX. EXIT CHANNEL (Refer to Ag. Handbook 667, Chapt. 3, for allowable stresses.) Aux. Spillway Discharge = 298. cfs; Bottom Width = 80. ft TOTAL EFFECTIVE REACH FROM TO SLOPE MANNING`S VELOCITY STRESS STRESS NO. STA STA % n ft/s lb/ft^2 lb/ft^2 4 153. 330. 2.20 0.035 5.00 1.00 0.124
New Creek Site 1 – Top of Dam (24-hr)
5
******************************************************************* ROUTED BTM WIDTH MAX ELEV VOL-MAX AREA-MAX AUX.-HP VOL-AUX. RESULTS FT FT ACFT AC FT ACFT NRCS-FBH 80.0 923.62 95.3 0.0 3.32 22.9 PEAK - CFS Q-PS Q-AUX. Q-TOT. DISCHARGE = 80. 1396. 1476. CRITICAL CRITICAL CRITICAL 25% OF Q DEPTH VELOCITY SLOPE-Sc Sc AUXILIARY FT FT/SEC FT/FT FT/FT SPILLWAY --- 2.07 7.92 0.014 0.019 AUXILIARY SPILLWAY DURATION FLOW = 16.9 HOURS ATTACK, OE/B = 5.0 ACFT/FT EXIT CHANNEL FLOW SUPERCRITICAL: MAX VELOCITY= 9.0 FT/SEC EXIT SLOPE = 0.022 FT/FT FLOW DEPTH = 1.8 FT Inflow Hyd 1 SDH-Peak = 375.68 CFS at 10.24 hrs., Location Point Inflow Hyd 1 FBH-Peak = 1475.76 CFS at 9.71 hrs., Location Point HYDOUT 1 1 1SITES....JOB NO. 1 COMPLETE. ------------------------------------------------------------------------------- NC1 New Creek Site 1 0 SUBWATERSHED(S) ANALYZED. 1 STRUCTURE(S) ANALYZED. 2 HYDROGRAPHS ROUTED AT LOWEST SITE. 0 TRIALS TO OBTAIN BOTTOM WIDTH FOR SPECIFIED STRESS OR VELOCITY. ******************************************************************************* SITES.....COMPUTATIONS COMPLETE 1 SUMMARY TABLE 1 SITES VERSION 2005.1.04 ---------------- DATED 01/01/2005 WATERSHED ID RUN DATE RUN TIME ------------ -------- -------- NC1 02/10/2011 13:54:40 >>> SITE SUBWS SUBWS DA CURVE TC TOTAL DA TYPE STRUC <<< ID ID (SQ MI) NO. (HRS) (SQ MI) DESIGN CLASS ----- ---- -------- ----- ---- ------- ----- ----- 1 1 0.35 73. 0.31 0.35 TR60 C PASS DIA./ AUX.CREST BTM. MAX. MAX. EMB. INTEGR.* EXIT* TYPE NO. WIDTH ELEV WIDTH HP ELEV VOL. DIST. VEL. HYD (IN/FT) (FT) (FT) (FT) (FT) (CY) (FT) (FT/SEC) ---- ----- ------- ------ ---- ------- ------- ----- ------ --------- 1 24.0 920.3 80.0 3.3 923.6 0. 0. 9.0 NRCS-FBH * INTEGRITY DIST. AND EXIT VEL. VALUES ARE BASED ON THE ROUTED HYDROGRAPH SHOWN UNDER TYPE HYD.
New Creek Site 1 – Top of Dam (24-hr)
6
SITES.......SUMMARY TABLE 1 COMPLETED. NRCS SITES VERSION 2005.1.04 ,01/01/2005 NC1 FILES INPUT = W:\426\Active Jobs\52299 - WV NRCS 2010 Contract\05 Working\41 Dam Assessments\New Creek Site 1\NC1 SITES Model\NC1\NC1_24hr_TOD_Crest.D2C OUTPUT = W:\426\Active Jobs\52299 - WV NRCS 2010 Contract\05 Working\41 Dam Assessments\New Creek Site 1\NC1 SITES Model\NC1\NC1_24hr_TOD_Crest.OUT DATED 02/10/2011 13:54:40 GRAPHICS FILES GENERATED OPTION "L" = W:\426\Active Jobs\52299 - WV NRCS 2010 Contract\05 Working\41 Dam Assessments\New Creek Site 1\NC1 SITES Model\NC1\NC1_24hr_TOD_Crest.DRG DATED 02/10/2011 13:54:40 OPTION "P" = W:\426\Active Jobs\52299 - WV NRCS 2010 Contract\05 Working\41 Dam Assessments\New Creek Site 1\NC1 SITES Model\NC1\NC1_24hr_TOD_Crest.DHY DATED 02/10/2011 13:54:40 OPTION "E" = W:\426\Active Jobs\52299 - WV NRCS 2010 Contract\05 Working\41 Dam Assessments\New Creek Site 1\NC1 SITES Model\NC1\NC1_24hr_TOD_Crest.DEM DATED 02/10/2011 13:54:40

NRCS
SITES Output New Creek Site 1 – ASW Integrity (6-hr)
New Creek Site 1 – ASW Integrity (6-hr)
1
1******************************************************************************* SITES XEQ 02/10/2011 WATER RESOURCE SITE ANALYSIS COMPUTER PROGRAM VER 2005.1.04 (USER MANUAL - DATED DECEMBER 2005) TIME 13:51:17 ************************** 80-80 LIST OF INPUT DATA *************************** SITES 01/01/2005NC1 New Creek Site 1 0.353125 C2 SAVMOV 0 101 SAVMOV 101 1 1 STRUCTURE 1 892.2 0 894 0.01 896 0.256 898 0.955 900 2.159 902 3.96 904 6.524 906 9.995 908 14.895 910 21.247 912 28.776 914 37.562 916 47.502 918 58.475 920 70.429 922 83.628 924 98.061 926 113.694 931 160 936 210 ENDTABLE WSDATA 2C 1 AC 73 226 0.31 BASEFLOW 0.95 PDIRECT 9.90 27.30 POOLDATA ELEV 906.3 906.3 906.3 892 883.7 TC PSINLET ELEV 0.75 6 916.9 .89 .89 PSDATA 1 160.33 24 0.013 885.7 ASSURFACE 41 330 0.1 0 20 0.035 0.5 1 1 20 133 0.035 0.5 1 1 133 153 0.035 0.5 1 1 153 330 0.035 0.5 1 1 330 340 0.035 0.5 1 1 340 767 0.035 0.5 1 1 ENDTABLE ASDATA 41 2.5 1 BTMWIDTH FEET 80 ASMATERIAL 1 4 0.002 12 100 0.17 2 0 0.5 0 110 2 3 0 6 0 120 8 ENDTABLE ASCOORD 1 Soil Y 0 917 139.3 920.3 159.3 920.3 320 917 350 915 425 910 470.30 905 513.1 885 524.9 884.7 579.9 880 682.7 875 767 870.00 ENDTABLE ASCOORD 2 Shale1 0 912 139.3 915 159.3 915 320 912 350 910 470 900 513 880 767 860 ENDTABLE ASCOORD 3 Shale2 0 907 139.3 908 159.3 908 320 907 350 905 470 895
New Creek Site 1 – ASW Integrity (6-hr)
2
513 875 767 860 ENDTABLE GRAPHICS I GO,DESIGN L 6 906.3 SAVMOV 2 101 1 1 ENDJOB ******************************************************************************* ***** MESSAGE - DRAINAGE AREA FROM WSDATA CONTROL BEING CONVERTED FROM ACRES TO SQUARE MILES FOR COMPUTATION PURPOSES. ***** MESSAGE - DEFAULT TOPSOIL FILL MATERIAL PARAMETERS USED. ***** WARNING - HEADCUT ERODIBILITY INDEX OF 2.0 (MATERIAL 2) APPEARS INCONSISTENT WITH DENSITY OF 110.0. ***** WARNING - HEADCUT ERODIBILITY INDEX OF 8.0 (MATERIAL 3) APPEARS INCONSISTENT WITH DENSITY OF 120.0. ***** MESSAGE - AUXILIARY SPILLWAY CREST ELEVATION IS SET TO 920.30 FROM THE ASCOORD RECORDS. 1SITES ------------------------------------------------------------------------- XEQ 02/10/2011 New Creek Site 1 WSID= NC1 VER 2005.1.04 SUBW= 1 TIME 13:51:17 SITE = 1 PASS= 1 PART= 1 ********************** MATERIAL PROPERTIES **************************** DRY PERCENT DETACH. REP. MATERIAL PI DENSITY Kh CLAY RATE DIAMETER lbs/CuFt (Ft/H)/(lb/SqFt) inches Soil 4. 100. 0.17 12.0 -- 0.00200 Shale1 0. 110. 2.00 0.0 -- 0.50000 Shale2 0. 120. 8.00 0.0 -- 6.00000 TS_FILL 0. 100. 0.05 0.0 -- 0.05000 GEN_FILL 4. 100. 0.17 12.0 -- 0.00200 **************************** BASIC DATA ********************************* HUMID- SUBHUMID CLIMATE AREA DESIGN CLASS C STORM DISTRIBUTION USED FOR AUXILIARY SPILLWAY IS; NRCS DESIGN STORM RAINFALL DISTRIBUTION (CHAPTER 21, NEH4 & TR-60). PRECIP. - Q-PS,1-DAY Q-PS,10-DAY P-SD P-FB 0.00 0.00 9.90 27.30 WSDATA - CN DA-SM TC/L -/H QRF 73.00 0.35 0.31 0.00 0.00 SITEDATA- PERM POOL CREST PS FP SED VALLEY FL 378? 906.30 906.30 906.30 883.70 NO BASEFLOW INITIAL EL EXTRA VOL SITE TYPE 0.95 0.00 0.00 DESIGN PSDATA - NO. COND COND L DIA/W -/H 1.00 160.33 24.00 0.00 PS N KE WEIR L TW EL 0.013 0.75 6.00 885.70 2ND STG ORF H ORF L START AUX. 916.90 0.89 0.89 906.30 ASCRESTS - AUX.1 AUX.2 AUX.3 AUX.4 AUX.5 920.30 0.00 0.00 0.00 0.00
New Creek Site 1 – ASW Integrity (6-hr)
3
AUX.DATA - REF.NO. RETARD. Ci TIE STATION INLET LENGTH 41 0.00 159.30 0 AUX.DATA - INLET N SIDE SLOPE EXIT N EXIT SLOPE ACTUAL AUX? 0.035 2.50 0.035 0.021 YES BTM WIDTH - BW1 BW2 BW3 BW4 BW5 ft 80.00 0.00 0.00 0.00 0.00 AUXILIARY SPILLWAY RATING DEVELOPED USING WSPVRT. 1SITES ------------------------------------------------------------------------- XEQ 02/10/2011 New Creek Site 1 WSID= NC1 VER 2005.1.04 SUBW= 1 TIME 13:51:17 SITE = 1 PASS= 1 PART= 2 PERM POOL 906.30 FT 10.7 ACFT 0.00 AC 0.0 CFS CREST PS 906.30 FT 10.7 ACFT 0.00 AC 0.0 CFS SED ACCUM 906.30 FT 10.7 ACFT 0.00 AC 0.0 CFS BASEFLOW 906.54 FT 11.3 ACFT 0.00 AC 0.3 CFS 2ND STAGE 916.90 FT 52.4 ACFT 0.00 AC 12.1 CFS START ELEV 906.54 FT 11.3 ACFT 0.00 AC 0.3 CFS ******************************************************************************* RATING TABLE DEVELOPED, SITE = 1 : BY PROGRAM FOR PS AND AUX. SPILLWAYS AUX. RATING USED WSPVRT METHOD. RATING TABLE NUMBER 1 ELEV. Q-TOTAL Q-PS Q-AUX. VOLUME AREA FEET CFS CFS CFS AC-FT ACRE 1 906.30 0.00 0.00 0.00 10.73 0.00 2 906.47 0.20 0.20 0.00 11.15 0.00 3 906.65 0.56 0.56 0.00 11.58 0.00 TRANSITION TO ORIFICE FLOW, ELEV = 906.82 FT 4 906.82 1.03 1.03 0.00 12.00 0.00 5 910.18 7.06 7.06 0.00 21.92 0.00 6 913.54 9.94 9.94 0.00 35.54 0.00 7 916.90 12.15 12.15 0.00 52.44 0.00 8 917.64 24.49 24.49 0.00 56.52 0.00 9 918.39 46.69 46.69 0.00 60.78 0.00 FULL CONDUIT FLOW, ELEV = 919.13 FT 10 919.13 75.30 75.30 0.00 65.22 0.00 11 924.75 81.43 81.43 0.00 103.94 0.00 12 930.38 87.09 87.09 0.00 154.22 0.00 13 936.00 92.41 92.41 0.00 210.00 0.00 1SITES ------------------------------------------------------------------------- XEQ 02/10/2011 New Creek Site 1 WSID= NC1 VER 2005.1.04 SUBW= 1 TIME 13:51:17 SITE = 1 PASS= 1 PART= 3 AUX. CREST 920.30 FT 72.4 ACFT 0.00 AC 76.4 CFS PS STORAGE 61.7 ACFT, BETWEEN AUX. CREST AND SED. ACCUM ELEVATIONS. START ELEV 906.54 FT 11.3 ACFT 0.00 AC 0.3 CFS
New Creek Site 1 – ASW Integrity (6-hr)
4
EFFECTIVE HEIGHT(H)= 28.3 FEET, PRODUCT= 2049. (H * STORAGE AT CREST AUX.). INPUT DESIGN CLASS = C NRCS-SDH D= 6.00 HR P= 9.90 IN Q= 6.53 IN DA= 0.35 SM TC= 0.31 HR CN= 73.00 VOL= 123.1 ACFT PEAK = 1194.9 CFS, AT 2.6 HRS. NRCS-FBH D= 6.00 HR P= 27.30 IN Q= 23.31 IN DA= 0.35 SM TC= 0.31 HR CN= 73.00 VOL= 439.3 ACFT PEAK = 4188.0 CFS, AT 2.5 HRS. ******************************************************************************* RATING TABLE DEVELOPED, SITE = 1 : BY PROGRAM FOR PS AND AUX. SPILLWAYS AUX. RATING USED WSPVRT METHOD. RATING TABLE NUMBER 2 ELEV. Q-TOTAL Q-PS Q-AUX. VOLUME AREA FEET CFS CFS CFS AC-FT ACRE 1 906.30 0.00 0.00 0.00 10.73 0.00 2 906.47 0.20 0.20 0.00 11.15 0.00 3 906.65 0.56 0.56 0.00 11.58 0.00 TRANSITION TO ORIFICE FLOW, ELEV = 906.82 FT 4 906.82 1.03 1.03 0.00 12.00 0.00 5 910.18 7.06 7.06 0.00 21.92 0.00 6 913.54 9.94 9.94 0.00 35.54 0.00 7 916.90 12.15 12.15 0.00 52.44 0.00 8 917.64 24.49 24.49 0.00 56.52 0.00 9 918.39 46.69 46.69 0.00 60.78 0.00 FULL CONDUIT FLOW, ELEV = 919.13 FT 10 919.13 75.30 75.30 0.00 65.22 0.00 11 919.52 75.78 75.78 0.00 67.56 0.00 12 919.91 76.21 76.21 0.00 69.89 0.00 13 920.30 76.65 76.65 0.00 72.41 0.00 14 921.08 197.87 77.51 120.36 77.59 0.00 15 921.87 464.10 78.37 385.74 82.77 0.00 16 923.28 1211.64 79.88 1131.76 92.89 0.00 17 925.01 2504.62 81.70 2422.92 105.96 0.00 18 928.15 5982.54 84.90 5897.65 133.61 0.00 19 932.08 11823.88 88.73 11735.14 170.75 0.00 20 936.00 19489.77 92.41 19397.36 210.00 0.00 *************************************************************************** SUMMARY OF AUXILIARY SPILLWAY SURFACE CONDITIONS USED IN COMPUTATIONS BY REACH REACH FROM TO SLOPE RETARDANCE VEGETAL MAINT. ROOTING REACH STA STA CURVE COVER CODE DEPTH LOCATION (ft) (ft) (%) INDEX@ FACTOR + (ft) * ----- ---- ---- ------ ---------- ------- ----- ------- -------- 1 0. 20. -2.4 0.035 ** ** ** INLET 2 20. 133. -2.4 0.035 ** ** ** INLET 3 133. 139. -2.4 0.035 ** ** ** INLET 4 139. 153. 0.0 0.035 ** ** ** CREST 5 153. 159. 0.0 0.035 ** ** ** CREST 6 159. 320. 2.1 0.035 0.50 1 1.0 EXIT ! 7 320. 330. 6.7 0.035 0.50 1 1.0 EXIT 8 330. 340. 6.7 0.035 0.50 1 1.0 exit 9 340. 350. 6.7 0.035 0.50 1 1.0 exit 10 350. 425. 6.7 0.035 0.50 1 1.0 exit 11 425. 470. 11.0 0.035 0.50 1 1.0 exit 12 470. 513. 46.7 0.035 0.50 1 1.0 exit 13 513. 525. 2.5 0.035 0.50 1 1.0 exit 14 525. 537. 8.5 0.035 0.50 1 1.0 exit @ The program interprets retardance curve index entries of less than 1 as
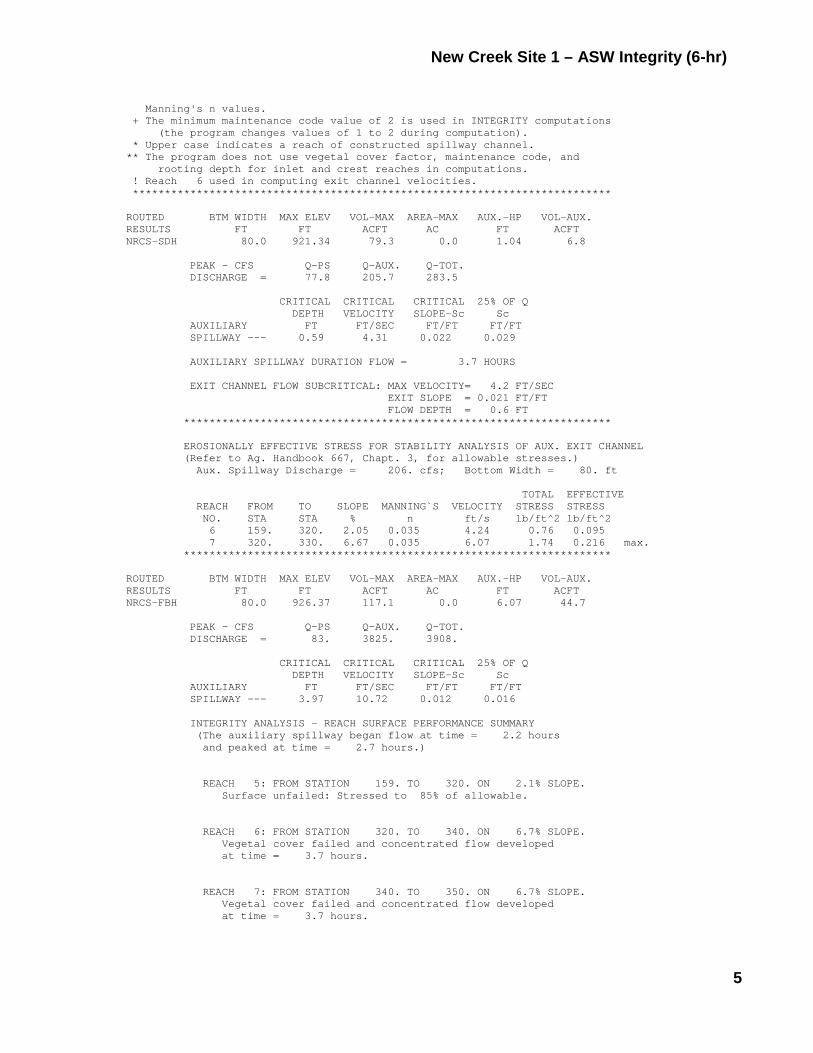
New Creek Site 1 – ASW Integrity (6-hr)
5
Manning's n values. + The minimum maintenance code value of 2 is used in INTEGRITY computations (the program changes values of 1 to 2 during computation). * Upper case indicates a reach of constructed spillway channel. ** The program does not use vegetal cover factor, maintenance code, and rooting depth for inlet and crest reaches in computations. ! Reach 6 used in computing exit channel velocities. *************************************************************************** ROUTED BTM WIDTH MAX ELEV VOL-MAX AREA-MAX AUX.-HP VOL-AUX. RESULTS FT FT ACFT AC FT ACFT NRCS-SDH 80.0 921.34 79.3 0.0 1.04 6.8 PEAK - CFS Q-PS Q-AUX. Q-TOT. DISCHARGE = 77.8 205.7 283.5 CRITICAL CRITICAL CRITICAL 25% OF Q DEPTH VELOCITY SLOPE-Sc Sc AUXILIARY FT FT/SEC FT/FT FT/FT SPILLWAY --- 0.59 4.31 0.022 0.029 AUXILIARY SPILLWAY DURATION FLOW = 3.7 HOURS EXIT CHANNEL FLOW SUBCRITICAL: MAX VELOCITY= 4.2 FT/SEC EXIT SLOPE = 0.021 FT/FT FLOW DEPTH = 0.6 FT ******************************************************************* EROSIONALLY EFFECTIVE STRESS FOR STABILITY ANALYSIS OF AUX. EXIT CHANNEL (Refer to Ag. Handbook 667, Chapt. 3, for allowable stresses.) Aux. Spillway Discharge = 206. cfs; Bottom Width = 80. ft TOTAL EFFECTIVE REACH FROM TO SLOPE MANNING`S VELOCITY STRESS STRESS NO. STA STA % n ft/s lb/ft^2 lb/ft^2 6 159. 320. 2.05 0.035 4.24 0.76 0.095 7 320. 330. 6.67 0.035 6.07 1.74 0.216 max. ******************************************************************* ROUTED BTM WIDTH MAX ELEV VOL-MAX AREA-MAX AUX.-HP VOL-AUX. RESULTS FT FT ACFT AC FT ACFT NRCS-FBH 80.0 926.37 117.1 0.0 6.07 44.7 PEAK - CFS Q-PS Q-AUX. Q-TOT. DISCHARGE = 83. 3825. 3908. CRITICAL CRITICAL CRITICAL 25% OF Q DEPTH VELOCITY SLOPE-Sc Sc AUXILIARY FT FT/SEC FT/FT FT/FT SPILLWAY --- 3.97 10.72 0.012 0.016 INTEGRITY ANALYSIS - REACH SURFACE PERFORMANCE SUMMARY (The auxiliary spillway began flow at time = 2.2 hours and peaked at time = 2.7 hours.) REACH 5: FROM STATION 159. TO 320. ON 2.1% SLOPE. Surface unfailed: Stressed to 85% of allowable. REACH 6: FROM STATION 320. TO 340. ON 6.7% SLOPE. Vegetal cover failed and concentrated flow developed at time = 3.7 hours. REACH 7: FROM STATION 340. TO 350. ON 6.7% SLOPE. Vegetal cover failed and concentrated flow developed at time = 3.7 hours.
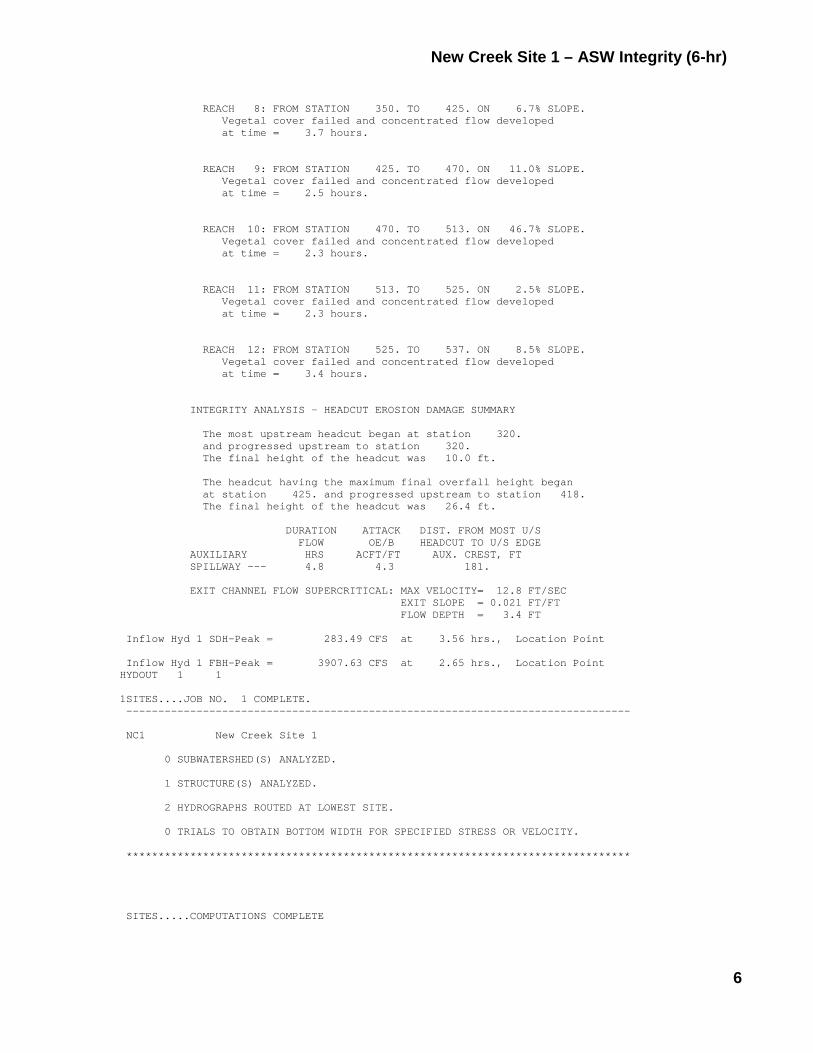
New Creek Site 1 – ASW Integrity (6-hr)
6
REACH 8: FROM STATION 350. TO 425. ON 6.7% SLOPE. Vegetal cover failed and concentrated flow developed at time = 3.7 hours. REACH 9: FROM STATION 425. TO 470. ON 11.0% SLOPE. Vegetal cover failed and concentrated flow developed at time = 2.5 hours. REACH 10: FROM STATION 470. TO 513. ON 46.7% SLOPE. Vegetal cover failed and concentrated flow developed at time = 2.3 hours. REACH 11: FROM STATION 513. TO 525. ON 2.5% SLOPE. Vegetal cover failed and concentrated flow developed at time = 2.3 hours. REACH 12: FROM STATION 525. TO 537. ON 8.5% SLOPE. Vegetal cover failed and concentrated flow developed at time = 3.4 hours. INTEGRITY ANALYSIS - HEADCUT EROSION DAMAGE SUMMARY The most upstream headcut began at station 320. and progressed upstream to station 320. The final height of the headcut was 10.0 ft. The headcut having the maximum final overfall height began at station 425. and progressed upstream to station 418. The final height of the headcut was 26.4 ft. DURATION ATTACK DIST. FROM MOST U/S FLOW OE/B HEADCUT TO U/S EDGE AUXILIARY HRS ACFT/FT AUX. CREST, FT SPILLWAY --- 4.8 4.3 181. EXIT CHANNEL FLOW SUPERCRITICAL: MAX VELOCITY= 12.8 FT/SEC EXIT SLOPE = 0.021 FT/FT FLOW DEPTH = 3.4 FT Inflow Hyd 1 SDH-Peak = 283.49 CFS at 3.56 hrs., Location Point Inflow Hyd 1 FBH-Peak = 3907.63 CFS at 2.65 hrs., Location Point HYDOUT 1 1 1SITES....JOB NO. 1 COMPLETE. ------------------------------------------------------------------------------- NC1 New Creek Site 1 0 SUBWATERSHED(S) ANALYZED. 1 STRUCTURE(S) ANALYZED. 2 HYDROGRAPHS ROUTED AT LOWEST SITE. 0 TRIALS TO OBTAIN BOTTOM WIDTH FOR SPECIFIED STRESS OR VELOCITY. ******************************************************************************* SITES.....COMPUTATIONS COMPLETE
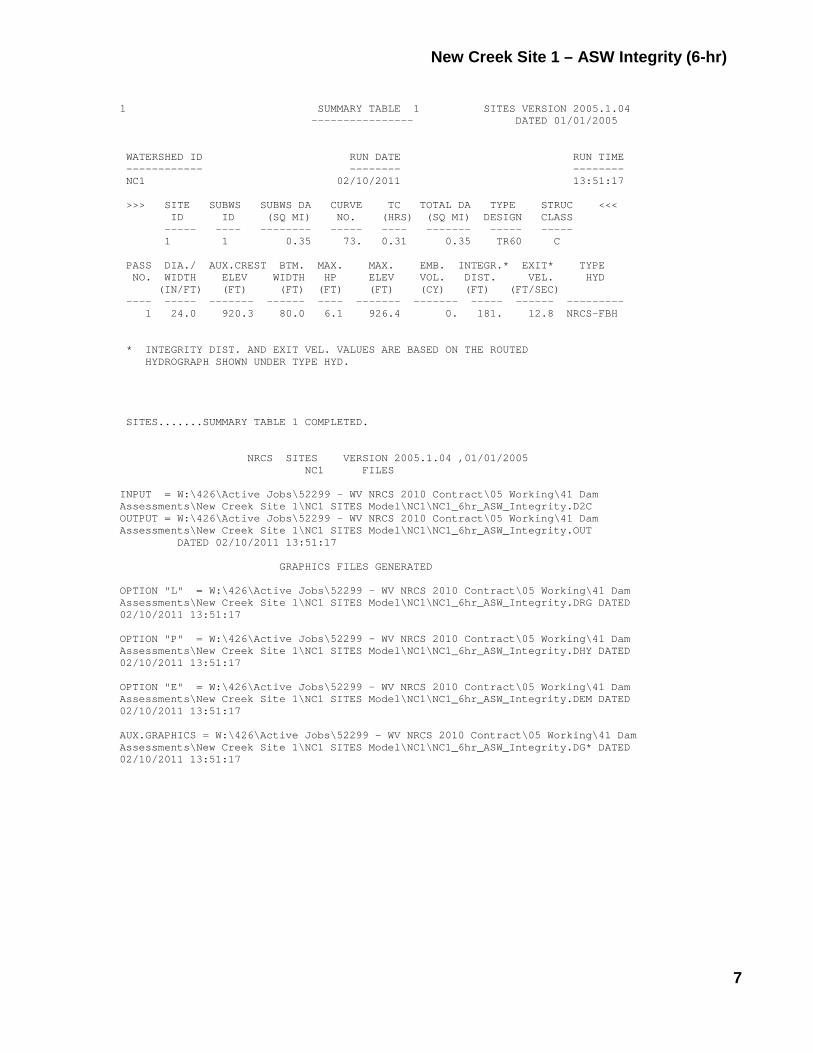
New Creek Site 1 – ASW Integrity (6-hr)
7
1 SUMMARY TABLE 1 SITES VERSION 2005.1.04 ---------------- DATED 01/01/2005 WATERSHED ID RUN DATE RUN TIME ------------ -------- -------- NC1 02/10/2011 13:51:17 >>> SITE SUBWS SUBWS DA CURVE TC TOTAL DA TYPE STRUC <<< ID ID (SQ MI) NO. (HRS) (SQ MI) DESIGN CLASS ----- ---- -------- ----- ---- ------- ----- ----- 1 1 0.35 73. 0.31 0.35 TR60 C PASS DIA./ AUX.CREST BTM. MAX. MAX. EMB. INTEGR.* EXIT* TYPE NO. WIDTH ELEV WIDTH HP ELEV VOL. DIST. VEL. HYD (IN/FT) (FT) (FT) (FT) (FT) (CY) (FT) (FT/SEC) ---- ----- ------- ------ ---- ------- ------- ----- ------ --------- 1 24.0 920.3 80.0 6.1 926.4 0. 181. 12.8 NRCS-FBH * INTEGRITY DIST. AND EXIT VEL. VALUES ARE BASED ON THE ROUTED HYDROGRAPH SHOWN UNDER TYPE HYD. SITES.......SUMMARY TABLE 1 COMPLETED. NRCS SITES VERSION 2005.1.04 ,01/01/2005 NC1 FILES INPUT = W:\426\Active Jobs\52299 - WV NRCS 2010 Contract\05 Working\41 Dam Assessments\New Creek Site 1\NC1 SITES Model\NC1\NC1_6hr_ASW_Integrity.D2C OUTPUT = W:\426\Active Jobs\52299 - WV NRCS 2010 Contract\05 Working\41 Dam Assessments\New Creek Site 1\NC1 SITES Model\NC1\NC1_6hr_ASW_Integrity.OUT DATED 02/10/2011 13:51:17 GRAPHICS FILES GENERATED OPTION "L" = W:\426\Active Jobs\52299 - WV NRCS 2010 Contract\05 Working\41 Dam Assessments\New Creek Site 1\NC1 SITES Model\NC1\NC1_6hr_ASW_Integrity.DRG DATED 02/10/2011 13:51:17 OPTION "P" = W:\426\Active Jobs\52299 - WV NRCS 2010 Contract\05 Working\41 Dam Assessments\New Creek Site 1\NC1 SITES Model\NC1\NC1_6hr_ASW_Integrity.DHY DATED 02/10/2011 13:51:17 OPTION "E" = W:\426\Active Jobs\52299 - WV NRCS 2010 Contract\05 Working\41 Dam Assessments\New Creek Site 1\NC1 SITES Model\NC1\NC1_6hr_ASW_Integrity.DEM DATED 02/10/2011 13:51:17 AUX.GRAPHICS = W:\426\Active Jobs\52299 - WV NRCS 2010 Contract\05 Working\41 Dam Assessments\New Creek Site 1\NC1 SITES Model\NC1\NC1_6hr_ASW_Integrity.DG* DATED 02/10/2011 13:51:17

NRCS
SITES Output New Creek Site 1 – ASW Integrity (24-hr)
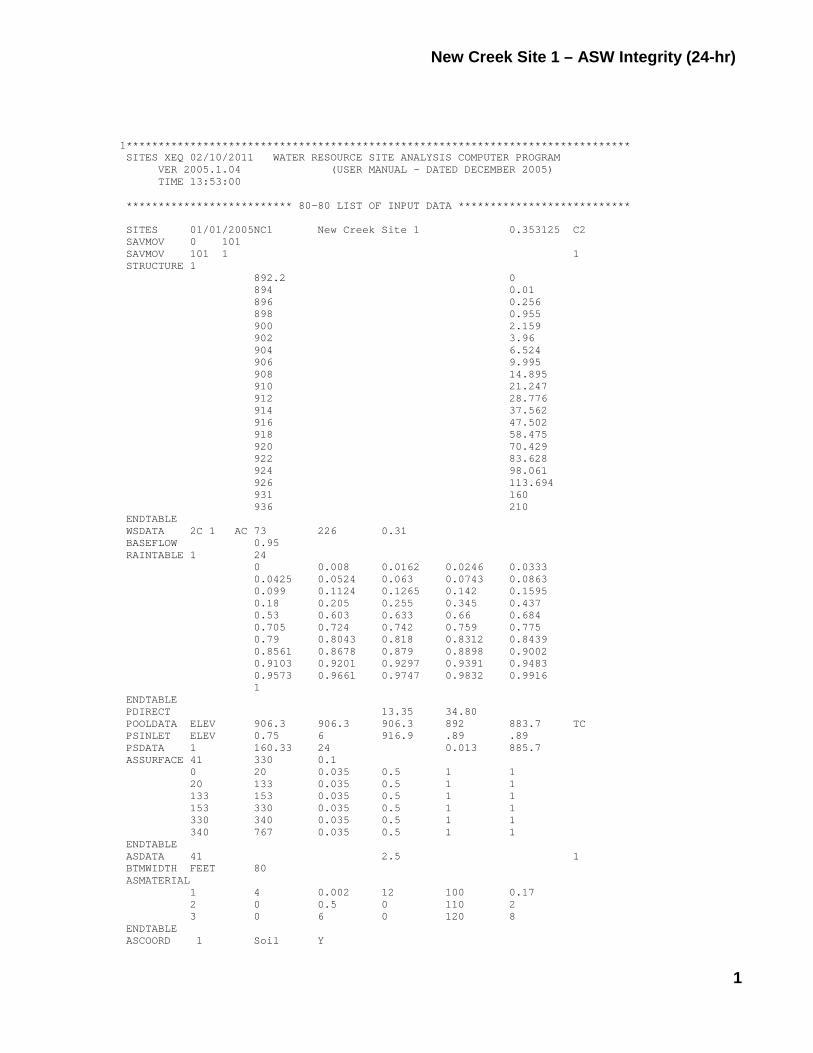
New Creek Site 1 – ASW Integrity (24-hr)
1
1******************************************************************************* SITES XEQ 02/10/2011 WATER RESOURCE SITE ANALYSIS COMPUTER PROGRAM VER 2005.1.04 (USER MANUAL - DATED DECEMBER 2005) TIME 13:53:00 ************************** 80-80 LIST OF INPUT DATA *************************** SITES 01/01/2005NC1 New Creek Site 1 0.353125 C2 SAVMOV 0 101 SAVMOV 101 1 1 STRUCTURE 1 892.2 0 894 0.01 896 0.256 898 0.955 900 2.159 902 3.96 904 6.524 906 9.995 908 14.895 910 21.247 912 28.776 914 37.562 916 47.502 918 58.475 920 70.429 922 83.628 924 98.061 926 113.694 931 160 936 210 ENDTABLE WSDATA 2C 1 AC 73 226 0.31 BASEFLOW 0.95 RAINTABLE 1 24 0 0.008 0.0162 0.0246 0.0333 0.0425 0.0524 0.063 0.0743 0.0863 0.099 0.1124 0.1265 0.142 0.1595 0.18 0.205 0.255 0.345 0.437 0.53 0.603 0.633 0.66 0.684 0.705 0.724 0.742 0.759 0.775 0.79 0.8043 0.818 0.8312 0.8439 0.8561 0.8678 0.879 0.8898 0.9002 0.9103 0.9201 0.9297 0.9391 0.9483 0.9573 0.9661 0.9747 0.9832 0.9916 1 ENDTABLE PDIRECT 13.35 34.80 POOLDATA ELEV 906.3 906.3 906.3 892 883.7 TC PSINLET ELEV 0.75 6 916.9 .89 .89 PSDATA 1 160.33 24 0.013 885.7 ASSURFACE 41 330 0.1 0 20 0.035 0.5 1 1 20 133 0.035 0.5 1 1 133 153 0.035 0.5 1 1 153 330 0.035 0.5 1 1 330 340 0.035 0.5 1 1 340 767 0.035 0.5 1 1 ENDTABLE ASDATA 41 2.5 1 BTMWIDTH FEET 80 ASMATERIAL 1 4 0.002 12 100 0.17 2 0 0.5 0 110 2 3 0 6 0 120 8 ENDTABLE ASCOORD 1 Soil Y
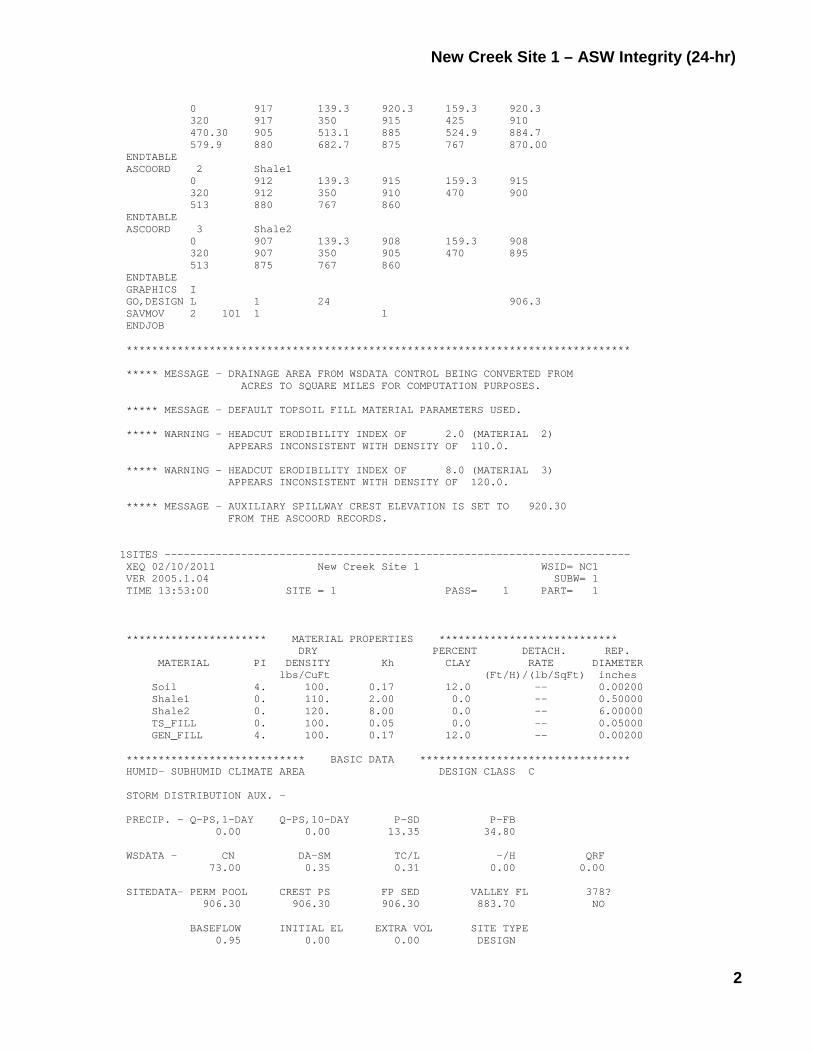
New Creek Site 1 – ASW Integrity (24-hr)
2
0 917 139.3 920.3 159.3 920.3 320 917 350 915 425 910 470.30 905 513.1 885 524.9 884.7 579.9 880 682.7 875 767 870.00 ENDTABLE ASCOORD 2 Shale1 0 912 139.3 915 159.3 915 320 912 350 910 470 900 513 880 767 860 ENDTABLE ASCOORD 3 Shale2 0 907 139.3 908 159.3 908 320 907 350 905 470 895 513 875 767 860 ENDTABLE GRAPHICS I GO,DESIGN L 1 24 906.3 SAVMOV 2 101 1 1 ENDJOB ******************************************************************************* ***** MESSAGE - DRAINAGE AREA FROM WSDATA CONTROL BEING CONVERTED FROM ACRES TO SQUARE MILES FOR COMPUTATION PURPOSES. ***** MESSAGE - DEFAULT TOPSOIL FILL MATERIAL PARAMETERS USED. ***** WARNING - HEADCUT ERODIBILITY INDEX OF 2.0 (MATERIAL 2) APPEARS INCONSISTENT WITH DENSITY OF 110.0. ***** WARNING - HEADCUT ERODIBILITY INDEX OF 8.0 (MATERIAL 3) APPEARS INCONSISTENT WITH DENSITY OF 120.0. ***** MESSAGE - AUXILIARY SPILLWAY CREST ELEVATION IS SET TO 920.30 FROM THE ASCOORD RECORDS. 1SITES ------------------------------------------------------------------------- XEQ 02/10/2011 New Creek Site 1 WSID= NC1 VER 2005.1.04 SUBW= 1 TIME 13:53:00 SITE = 1 PASS= 1 PART= 1 ********************** MATERIAL PROPERTIES **************************** DRY PERCENT DETACH. REP. MATERIAL PI DENSITY Kh CLAY RATE DIAMETER lbs/CuFt (Ft/H)/(lb/SqFt) inches Soil 4. 100. 0.17 12.0 -- 0.00200 Shale1 0. 110. 2.00 0.0 -- 0.50000 Shale2 0. 120. 8.00 0.0 -- 6.00000 TS_FILL 0. 100. 0.05 0.0 -- 0.05000 GEN_FILL 4. 100. 0.17 12.0 -- 0.00200 **************************** BASIC DATA ********************************* HUMID- SUBHUMID CLIMATE AREA DESIGN CLASS C STORM DISTRIBUTION AUX. - PRECIP. - Q-PS,1-DAY Q-PS,10-DAY P-SD P-FB 0.00 0.00 13.35 34.80 WSDATA - CN DA-SM TC/L -/H QRF 73.00 0.35 0.31 0.00 0.00 SITEDATA- PERM POOL CREST PS FP SED VALLEY FL 378? 906.30 906.30 906.30 883.70 NO BASEFLOW INITIAL EL EXTRA VOL SITE TYPE 0.95 0.00 0.00 DESIGN
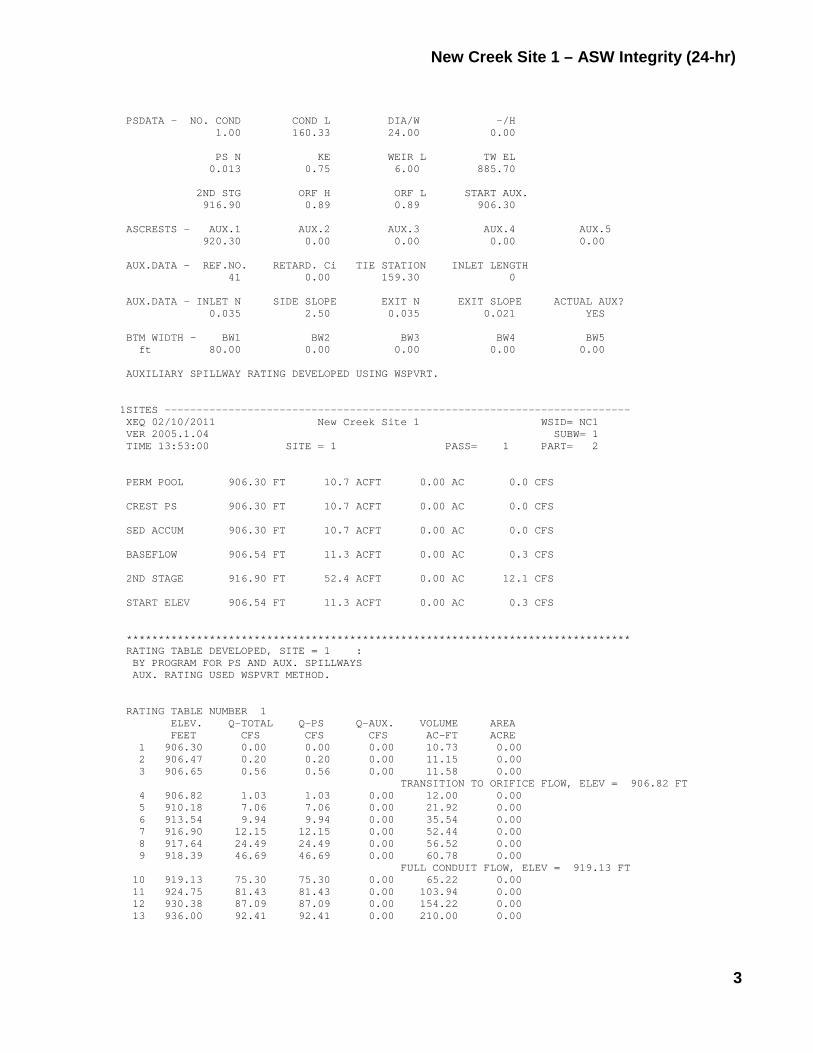
New Creek Site 1 – ASW Integrity (24-hr)
3
PSDATA - NO. COND COND L DIA/W -/H 1.00 160.33 24.00 0.00 PS N KE WEIR L TW EL 0.013 0.75 6.00 885.70 2ND STG ORF H ORF L START AUX. 916.90 0.89 0.89 906.30 ASCRESTS - AUX.1 AUX.2 AUX.3 AUX.4 AUX.5 920.30 0.00 0.00 0.00 0.00 AUX.DATA - REF.NO. RETARD. Ci TIE STATION INLET LENGTH 41 0.00 159.30 0 AUX.DATA - INLET N SIDE SLOPE EXIT N EXIT SLOPE ACTUAL AUX? 0.035 2.50 0.035 0.021 YES BTM WIDTH - BW1 BW2 BW3 BW4 BW5 ft 80.00 0.00 0.00 0.00 0.00 AUXILIARY SPILLWAY RATING DEVELOPED USING WSPVRT. 1SITES ------------------------------------------------------------------------- XEQ 02/10/2011 New Creek Site 1 WSID= NC1 VER 2005.1.04 SUBW= 1 TIME 13:53:00 SITE = 1 PASS= 1 PART= 2 PERM POOL 906.30 FT 10.7 ACFT 0.00 AC 0.0 CFS CREST PS 906.30 FT 10.7 ACFT 0.00 AC 0.0 CFS SED ACCUM 906.30 FT 10.7 ACFT 0.00 AC 0.0 CFS BASEFLOW 906.54 FT 11.3 ACFT 0.00 AC 0.3 CFS 2ND STAGE 916.90 FT 52.4 ACFT 0.00 AC 12.1 CFS START ELEV 906.54 FT 11.3 ACFT 0.00 AC 0.3 CFS ******************************************************************************* RATING TABLE DEVELOPED, SITE = 1 : BY PROGRAM FOR PS AND AUX. SPILLWAYS AUX. RATING USED WSPVRT METHOD. RATING TABLE NUMBER 1 ELEV. Q-TOTAL Q-PS Q-AUX. VOLUME AREA FEET CFS CFS CFS AC-FT ACRE 1 906.30 0.00 0.00 0.00 10.73 0.00 2 906.47 0.20 0.20 0.00 11.15 0.00 3 906.65 0.56 0.56 0.00 11.58 0.00 TRANSITION TO ORIFICE FLOW, ELEV = 906.82 FT 4 906.82 1.03 1.03 0.00 12.00 0.00 5 910.18 7.06 7.06 0.00 21.92 0.00 6 913.54 9.94 9.94 0.00 35.54 0.00 7 916.90 12.15 12.15 0.00 52.44 0.00 8 917.64 24.49 24.49 0.00 56.52 0.00 9 918.39 46.69 46.69 0.00 60.78 0.00 FULL CONDUIT FLOW, ELEV = 919.13 FT 10 919.13 75.30 75.30 0.00 65.22 0.00 11 924.75 81.43 81.43 0.00 103.94 0.00 12 930.38 87.09 87.09 0.00 154.22 0.00 13 936.00 92.41 92.41 0.00 210.00 0.00
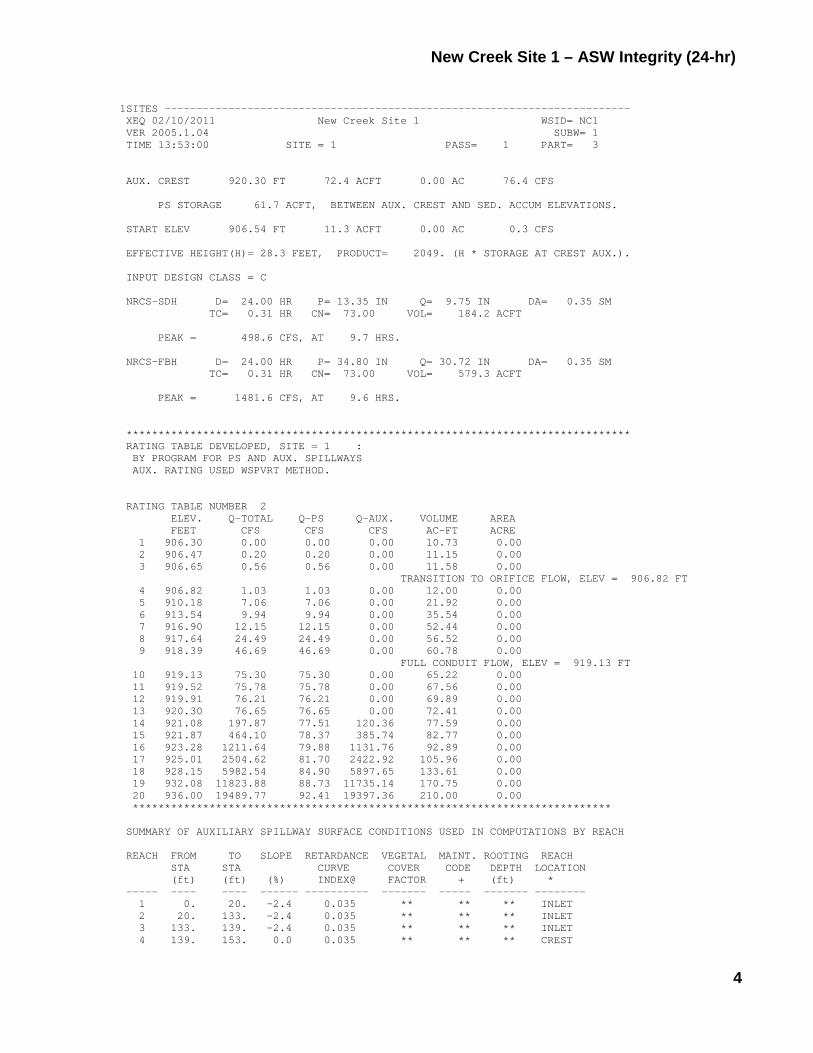
New Creek Site 1 – ASW Integrity (24-hr)
4
1SITES ------------------------------------------------------------------------- XEQ 02/10/2011 New Creek Site 1 WSID= NC1 VER 2005.1.04 SUBW= 1 TIME 13:53:00 SITE = 1 PASS= 1 PART= 3 AUX. CREST 920.30 FT 72.4 ACFT 0.00 AC 76.4 CFS PS STORAGE 61.7 ACFT, BETWEEN AUX. CREST AND SED. ACCUM ELEVATIONS. START ELEV 906.54 FT 11.3 ACFT 0.00 AC 0.3 CFS EFFECTIVE HEIGHT(H)= 28.3 FEET, PRODUCT= 2049. (H * STORAGE AT CREST AUX.). INPUT DESIGN CLASS = C NRCS-SDH D= 24.00 HR P= 13.35 IN Q= 9.75 IN DA= 0.35 SM TC= 0.31 HR CN= 73.00 VOL= 184.2 ACFT PEAK = 498.6 CFS, AT 9.7 HRS. NRCS-FBH D= 24.00 HR P= 34.80 IN Q= 30.72 IN DA= 0.35 SM TC= 0.31 HR CN= 73.00 VOL= 579.3 ACFT PEAK = 1481.6 CFS, AT 9.6 HRS. ******************************************************************************* RATING TABLE DEVELOPED, SITE = 1 : BY PROGRAM FOR PS AND AUX. SPILLWAYS AUX. RATING USED WSPVRT METHOD. RATING TABLE NUMBER 2 ELEV. Q-TOTAL Q-PS Q-AUX. VOLUME AREA FEET CFS CFS CFS AC-FT ACRE 1 906.30 0.00 0.00 0.00 10.73 0.00 2 906.47 0.20 0.20 0.00 11.15 0.00 3 906.65 0.56 0.56 0.00 11.58 0.00 TRANSITION TO ORIFICE FLOW, ELEV = 906.82 FT 4 906.82 1.03 1.03 0.00 12.00 0.00 5 910.18 7.06 7.06 0.00 21.92 0.00 6 913.54 9.94 9.94 0.00 35.54 0.00 7 916.90 12.15 12.15 0.00 52.44 0.00 8 917.64 24.49 24.49 0.00 56.52 0.00 9 918.39 46.69 46.69 0.00 60.78 0.00 FULL CONDUIT FLOW, ELEV = 919.13 FT 10 919.13 75.30 75.30 0.00 65.22 0.00 11 919.52 75.78 75.78 0.00 67.56 0.00 12 919.91 76.21 76.21 0.00 69.89 0.00 13 920.30 76.65 76.65 0.00 72.41 0.00 14 921.08 197.87 77.51 120.36 77.59 0.00 15 921.87 464.10 78.37 385.74 82.77 0.00 16 923.28 1211.64 79.88 1131.76 92.89 0.00 17 925.01 2504.62 81.70 2422.92 105.96 0.00 18 928.15 5982.54 84.90 5897.65 133.61 0.00 19 932.08 11823.88 88.73 11735.14 170.75 0.00 20 936.00 19489.77 92.41 19397.36 210.00 0.00 *************************************************************************** SUMMARY OF AUXILIARY SPILLWAY SURFACE CONDITIONS USED IN COMPUTATIONS BY REACH REACH FROM TO SLOPE RETARDANCE VEGETAL MAINT. ROOTING REACH STA STA CURVE COVER CODE DEPTH LOCATION (ft) (ft) (%) INDEX@ FACTOR + (ft) * ----- ---- ---- ------ ---------- ------- ----- ------- -------- 1 0. 20. -2.4 0.035 ** ** ** INLET 2 20. 133. -2.4 0.035 ** ** ** INLET 3 133. 139. -2.4 0.035 ** ** ** INLET 4 139. 153. 0.0 0.035 ** ** ** CREST
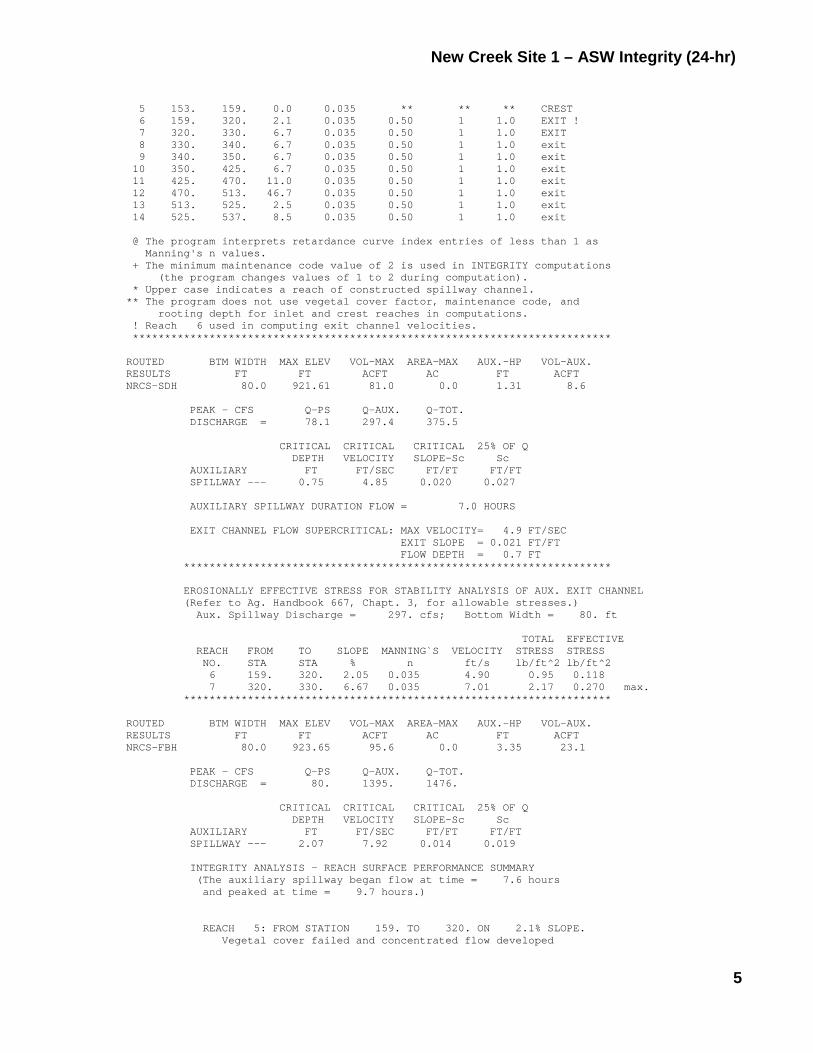
New Creek Site 1 – ASW Integrity (24-hr)
5
5 153. 159. 0.0 0.035 ** ** ** CREST 6 159. 320. 2.1 0.035 0.50 1 1.0 EXIT ! 7 320. 330. 6.7 0.035 0.50 1 1.0 EXIT 8 330. 340. 6.7 0.035 0.50 1 1.0 exit 9 340. 350. 6.7 0.035 0.50 1 1.0 exit 10 350. 425. 6.7 0.035 0.50 1 1.0 exit 11 425. 470. 11.0 0.035 0.50 1 1.0 exit 12 470. 513. 46.7 0.035 0.50 1 1.0 exit 13 513. 525. 2.5 0.035 0.50 1 1.0 exit 14 525. 537. 8.5 0.035 0.50 1 1.0 exit @ The program interprets retardance curve index entries of less than 1 as Manning's n values. + The minimum maintenance code value of 2 is used in INTEGRITY computations (the program changes values of 1 to 2 during computation). * Upper case indicates a reach of constructed spillway channel. ** The program does not use vegetal cover factor, maintenance code, and rooting depth for inlet and crest reaches in computations. ! Reach 6 used in computing exit channel velocities. *************************************************************************** ROUTED BTM WIDTH MAX ELEV VOL-MAX AREA-MAX AUX.-HP VOL-AUX. RESULTS FT FT ACFT AC FT ACFT NRCS-SDH 80.0 921.61 81.0 0.0 1.31 8.6 PEAK - CFS Q-PS Q-AUX. Q-TOT. DISCHARGE = 78.1 297.4 375.5 CRITICAL CRITICAL CRITICAL 25% OF Q DEPTH VELOCITY SLOPE-Sc Sc AUXILIARY FT FT/SEC FT/FT FT/FT SPILLWAY --- 0.75 4.85 0.020 0.027 AUXILIARY SPILLWAY DURATION FLOW = 7.0 HOURS EXIT CHANNEL FLOW SUPERCRITICAL: MAX VELOCITY= 4.9 FT/SEC EXIT SLOPE = 0.021 FT/FT FLOW DEPTH = 0.7 FT ******************************************************************* EROSIONALLY EFFECTIVE STRESS FOR STABILITY ANALYSIS OF AUX. EXIT CHANNEL (Refer to Ag. Handbook 667, Chapt. 3, for allowable stresses.) Aux. Spillway Discharge = 297. cfs; Bottom Width = 80. ft TOTAL EFFECTIVE REACH FROM TO SLOPE MANNING`S VELOCITY STRESS STRESS NO. STA STA % n ft/s lb/ft^2 lb/ft^2 6 159. 320. 2.05 0.035 4.90 0.95 0.118 7 320. 330. 6.67 0.035 7.01 2.17 0.270 max. ******************************************************************* ROUTED BTM WIDTH MAX ELEV VOL-MAX AREA-MAX AUX.-HP VOL-AUX. RESULTS FT FT ACFT AC FT ACFT NRCS-FBH 80.0 923.65 95.6 0.0 3.35 23.1 PEAK - CFS Q-PS Q-AUX. Q-TOT. DISCHARGE = 80. 1395. 1476. CRITICAL CRITICAL CRITICAL 25% OF Q DEPTH VELOCITY SLOPE-Sc Sc AUXILIARY FT FT/SEC FT/FT FT/FT SPILLWAY --- 2.07 7.92 0.014 0.019 INTEGRITY ANALYSIS - REACH SURFACE PERFORMANCE SUMMARY (The auxiliary spillway began flow at time = 7.6 hours and peaked at time = 9.7 hours.) REACH 5: FROM STATION 159. TO 320. ON 2.1% SLOPE. Vegetal cover failed and concentrated flow developed
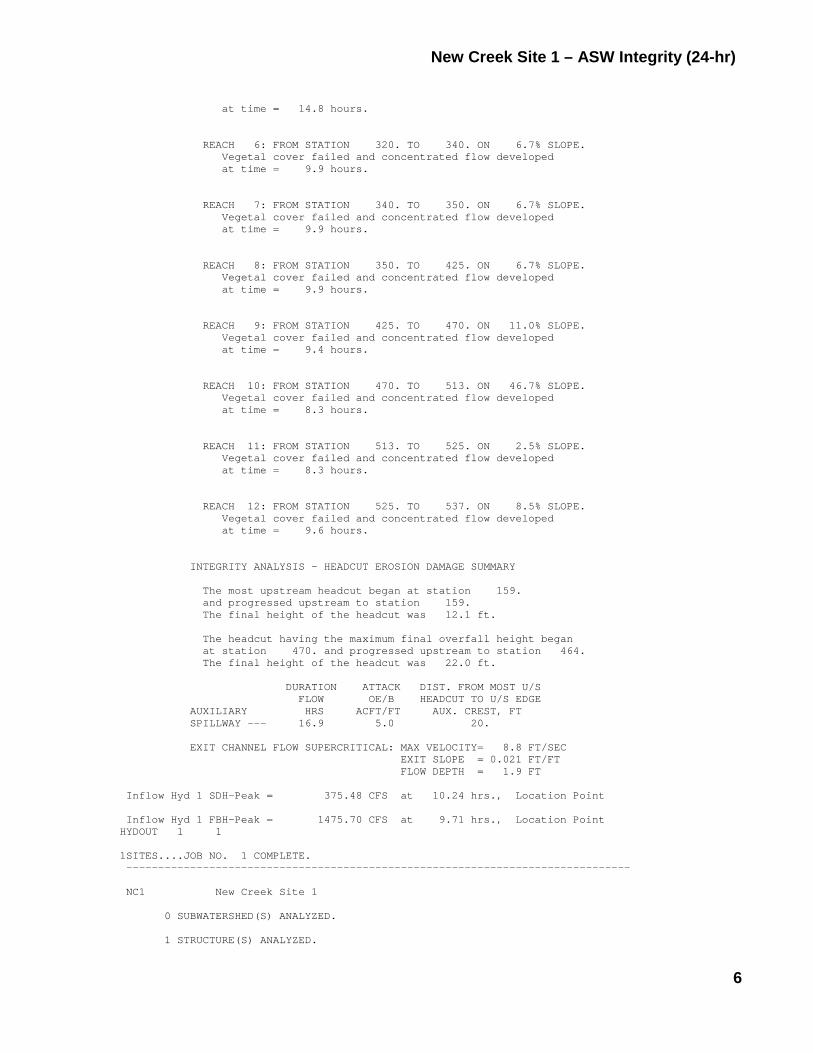
New Creek Site 1 – ASW Integrity (24-hr)
6
at time = 14.8 hours. REACH 6: FROM STATION 320. TO 340. ON 6.7% SLOPE. Vegetal cover failed and concentrated flow developed at time = 9.9 hours. REACH 7: FROM STATION 340. TO 350. ON 6.7% SLOPE. Vegetal cover failed and concentrated flow developed at time = 9.9 hours. REACH 8: FROM STATION 350. TO 425. ON 6.7% SLOPE. Vegetal cover failed and concentrated flow developed at time = 9.9 hours. REACH 9: FROM STATION 425. TO 470. ON 11.0% SLOPE. Vegetal cover failed and concentrated flow developed at time = 9.4 hours. REACH 10: FROM STATION 470. TO 513. ON 46.7% SLOPE. Vegetal cover failed and concentrated flow developed at time = 8.3 hours. REACH 11: FROM STATION 513. TO 525. ON 2.5% SLOPE. Vegetal cover failed and concentrated flow developed at time = 8.3 hours. REACH 12: FROM STATION 525. TO 537. ON 8.5% SLOPE. Vegetal cover failed and concentrated flow developed at time = 9.6 hours. INTEGRITY ANALYSIS - HEADCUT EROSION DAMAGE SUMMARY The most upstream headcut began at station 159. and progressed upstream to station 159. The final height of the headcut was 12.1 ft. The headcut having the maximum final overfall height began at station 470. and progressed upstream to station 464. The final height of the headcut was 22.0 ft. DURATION ATTACK DIST. FROM MOST U/S FLOW OE/B HEADCUT TO U/S EDGE AUXILIARY HRS ACFT/FT AUX. CREST, FT SPILLWAY --- 16.9 5.0 20. EXIT CHANNEL FLOW SUPERCRITICAL: MAX VELOCITY= 8.8 FT/SEC EXIT SLOPE = 0.021 FT/FT FLOW DEPTH = 1.9 FT Inflow Hyd 1 SDH-Peak = 375.48 CFS at 10.24 hrs., Location Point Inflow Hyd 1 FBH-Peak = 1475.70 CFS at 9.71 hrs., Location Point HYDOUT 1 1 1SITES....JOB NO. 1 COMPLETE. ------------------------------------------------------------------------------- NC1 New Creek Site 1 0 SUBWATERSHED(S) ANALYZED. 1 STRUCTURE(S) ANALYZED.
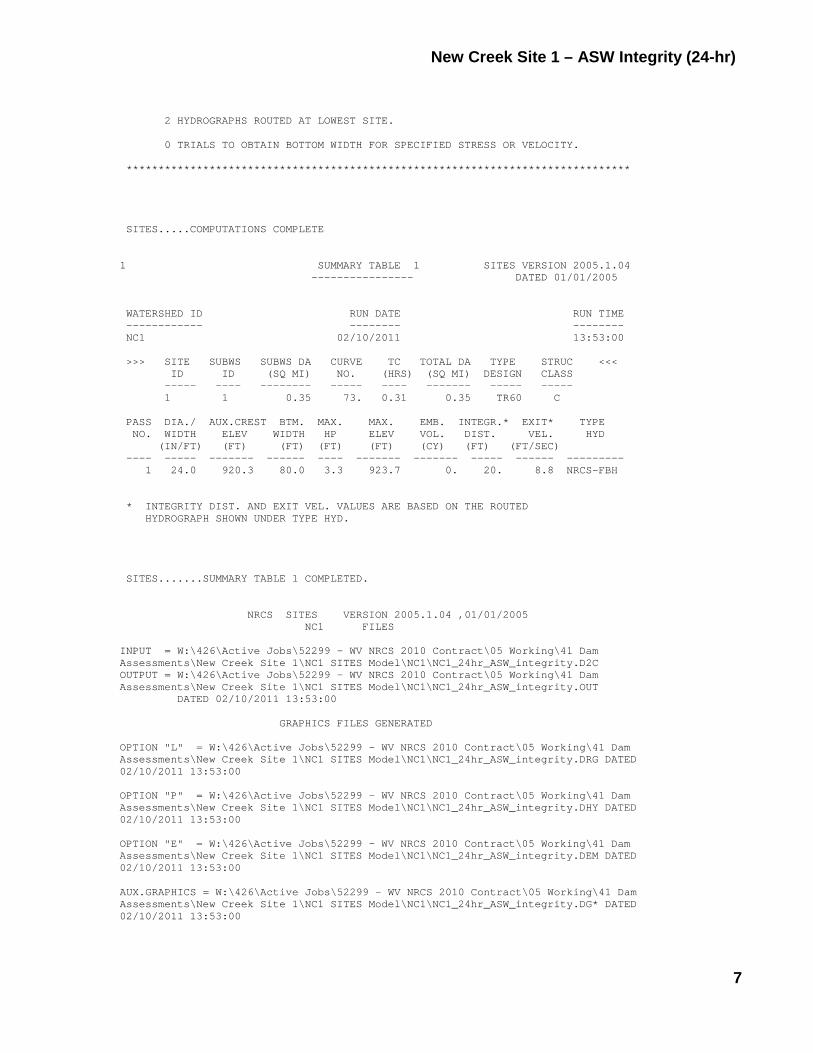
New Creek Site 1 – ASW Integrity (24-hr)
7
2 HYDROGRAPHS ROUTED AT LOWEST SITE. 0 TRIALS TO OBTAIN BOTTOM WIDTH FOR SPECIFIED STRESS OR VELOCITY. ******************************************************************************* SITES.....COMPUTATIONS COMPLETE 1 SUMMARY TABLE 1 SITES VERSION 2005.1.04 ---------------- DATED 01/01/2005 WATERSHED ID RUN DATE RUN TIME ------------ -------- -------- NC1 02/10/2011 13:53:00 >>> SITE SUBWS SUBWS DA CURVE TC TOTAL DA TYPE STRUC <<< ID ID (SQ MI) NO. (HRS) (SQ MI) DESIGN CLASS ----- ---- -------- ----- ---- ------- ----- ----- 1 1 0.35 73. 0.31 0.35 TR60 C PASS DIA./ AUX.CREST BTM. MAX. MAX. EMB. INTEGR.* EXIT* TYPE NO. WIDTH ELEV WIDTH HP ELEV VOL. DIST. VEL. HYD (IN/FT) (FT) (FT) (FT) (FT) (CY) (FT) (FT/SEC) ---- ----- ------- ------ ---- ------- ------- ----- ------ --------- 1 24.0 920.3 80.0 3.3 923.7 0. 20. 8.8 NRCS-FBH * INTEGRITY DIST. AND EXIT VEL. VALUES ARE BASED ON THE ROUTED HYDROGRAPH SHOWN UNDER TYPE HYD. SITES.......SUMMARY TABLE 1 COMPLETED. NRCS SITES VERSION 2005.1.04 ,01/01/2005 NC1 FILES INPUT = W:\426\Active Jobs\52299 - WV NRCS 2010 Contract\05 Working\41 Dam Assessments\New Creek Site 1\NC1 SITES Model\NC1\NC1_24hr_ASW_integrity.D2C OUTPUT = W:\426\Active Jobs\52299 - WV NRCS 2010 Contract\05 Working\41 Dam Assessments\New Creek Site 1\NC1 SITES Model\NC1\NC1_24hr_ASW_integrity.OUT DATED 02/10/2011 13:53:00 GRAPHICS FILES GENERATED OPTION "L" = W:\426\Active Jobs\52299 - WV NRCS 2010 Contract\05 Working\41 Dam Assessments\New Creek Site 1\NC1 SITES Model\NC1\NC1_24hr_ASW_integrity.DRG DATED 02/10/2011 13:53:00 OPTION "P" = W:\426\Active Jobs\52299 - WV NRCS 2010 Contract\05 Working\41 Dam Assessments\New Creek Site 1\NC1 SITES Model\NC1\NC1_24hr_ASW_integrity.DHY DATED 02/10/2011 13:53:00 OPTION "E" = W:\426\Active Jobs\52299 - WV NRCS 2010 Contract\05 Working\41 Dam Assessments\New Creek Site 1\NC1 SITES Model\NC1\NC1_24hr_ASW_integrity.DEM DATED 02/10/2011 13:53:00 AUX.GRAPHICS = W:\426\Active Jobs\52299 - WV NRCS 2010 Contract\05 Working\41 Dam Assessments\New Creek Site 1\NC1 SITES Model\NC1\NC1_24hr_ASW_integrity.DG* DATED 02/10/2011 13:53:00

NRCS
Appendix D Evaluation of Potential Rehabilitation
Projects-Priority Ranking Spreadsheet
APPE
ND
IX D

STATE WV DAM BY TAR DATE
1957 DESIGN HAZARD CLASS C 0.35 mi2
1956 CURRENT HAZARD CLASS C 41.7 ft
sht 1 of 5 ver 100101
POTENTIAL DAM FAILURE:
Total Failure Index 200 A
POTENTIAL LOSS OF LIFE:
Maximum Population-at-Risk [PAR] (number) 465 B
Total Risk Index 3720 C
POTENTIAL LOSS OF PROPERTY:
Identify major community affected by breach and rate impact as High (H), Medium (M), Low (L) or None(blank)
Community (H,M,L,-) H D
Number of homes, businesses, major buildings (number) 186 E
POTENTIAL LIFELINE DISRUPTION:
Water supply, identify community disrupted by dam failure, and estimate number/amount
Municipal sole source Users (number) F
Supplemental source Users (number) G
Irrigation water Storage (Ac-Ft) H
POTENTIAL INFRASTRUCTURE DISRUPTION:
Transportation system crossings, identify major crossing rendered unusable by dam failure, and estimate number
Major/Interstate Roads (number) 1 I
Secondary/County Roads (number) 2 J
POTENTIAL ADVERSE IMPACTS ON THE ENVIRONMENT:
Describe impacts and rate each as High (H), Medium (M), Low (L), or None (blank)
Threatened & endangered species (H,M,L,-) L K
Sensitive riparian areas (H,M,L,-) L L
Contaminated reservoir sediment (H,M,L,-) L M
Wetland and wildlife habitat (H,M,L,-) L N
Other (H,M,L,-) O
POTENTIAL ADVERSE SOCIAL IMPACTS:
Describe impacts and rate each as High (H), Medium (M), Low (L) or None(blank)
Known cultural resources (H,M,L,-) L P
Historic preservation issues (H,M,L,-) Q
Socially disadvantaged community (H,M,L,-) M R
POTENTIAL ADVERSE ECONOMIC IMPACTS:
Average annual benefits attributed to this dam, updated workplan value ( $ ) 11,548 S
Changes in benefits since workplan; Increase(I), No change(NC), Decrease(D) (I,NC,D) I T
Low income families impacted (number) 208 U
INPUT BY STATE DAM SAFETY AGENCY:
State dam safety order issued for repair, modification, removal issued, Yes(Y), No(N) ( Y,N ) V
State Dam Safety Agency Priority, High(H), Medium(M), Low(L), None(blank) (H,M,L,-) W
OTHER CONSIDERATIONS:
Identify any other considerations and rate as High(H), Medium(M), Low(L) or None(blank)
(H,M,L,-) X
(H,M,L,-) Y
01/20/11New Creek Site 1
CONSEQUENCES OF DAM FAILURE
U.S. Route 220
Keyser
W.V. Route 46, County Route 220/5
EVALUATION OF POTENTIAL REHABILITATION PROJECTS
DRAINAGE AREA
DAM HEIGHT
YEAR BUILT
WORK PLAN DATE
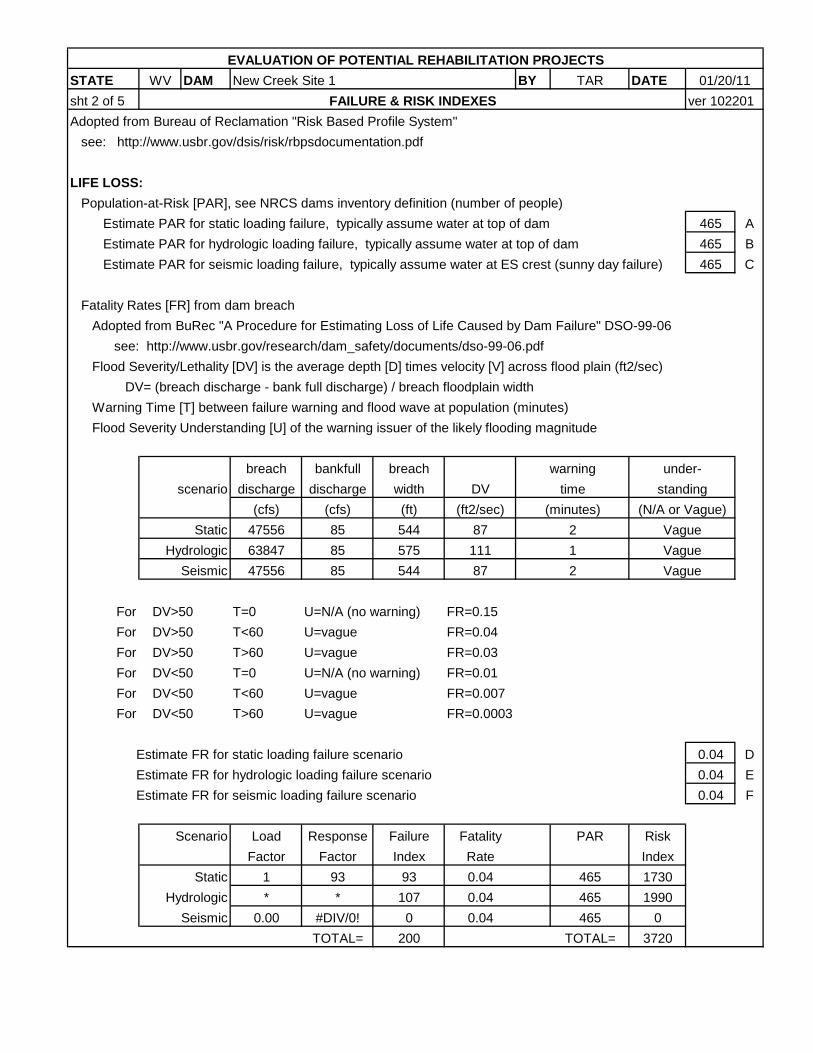
STATE WV DAM BY TAR DATE
sht 2 of 5 ver 102201
Adopted from Bureau of Reclamation "Risk Based Profile System"
see: http://www.usbr.gov/dsis/risk/rbpsdocumentation.pdf
LIFE LOSS:
Population-at-Risk [PAR], see NRCS dams inventory definition (number of people)
Estimate PAR for static loading failure, typically assume water at top of dam 465 A
Estimate PAR for hydrologic loading failure, typically assume water at top of dam 465 B
Estimate PAR for seismic loading failure, typically assume water at ES crest (sunny day failure) 465 C
Fatality Rates [FR] from dam breach
Adopted from BuRec "A Procedure for Estimating Loss of Life Caused by Dam Failure" DSO-99-06
see: http://www.usbr.gov/research/dam_safety/documents/dso-99-06.pdf
Flood Severity/Lethality [DV] is the average depth [D] times velocity [V] across flood plain (ft2/sec)
DV= (breach discharge - bank full discharge) / breach floodplain width
Warning Time [T] between failure warning and flood wave at population (minutes)
Flood Severity Understanding [U] of the warning issuer of the likely flooding magnitude
breach bankfull breach
scenario discharge discharge width DV
(cfs) (cfs) (ft) (ft2/sec)
Static 47556 85 544 87
Hydrologic 63847 85 575 111
Seismic 47556 85 544 87
For DV>50 T=0 U=N/A (no warning) FR=0.15
For DV>50 T<60 U=vague FR=0.04
For DV>50 T>60 U=vague FR=0.03
For DV<50 T=0 U=N/A (no warning) FR=0.01
For DV<50 T<60 U=vague FR=0.007
For DV<50 T>60 U=vague FR=0.0003
Estimate FR for static loading failure scenario 0.04 D
Estimate FR for hydrologic loading failure scenario 0.04 E
Estimate FR for seismic loading failure scenario 0.04 F
Scenario Load Response Failure Fatality PAR Risk
Factor Factor Index Rate Index
Static 1 93 93 0.04 465 1730
Hydrologic * * 107 0.04 465 1990
Seismic 0.00 #DIV/0! 0 0.04 465 0
TOTAL= 200 TOTAL= 3720
FAILURE & RISK INDEXES
warning
time
2
(minutes)
under-
EVALUATION OF POTENTIAL REHABILITATION PROJECTS
Vague
standing
(N/A or Vague)
Vague
Vague
New Creek Site 1
1
2
01/20/11
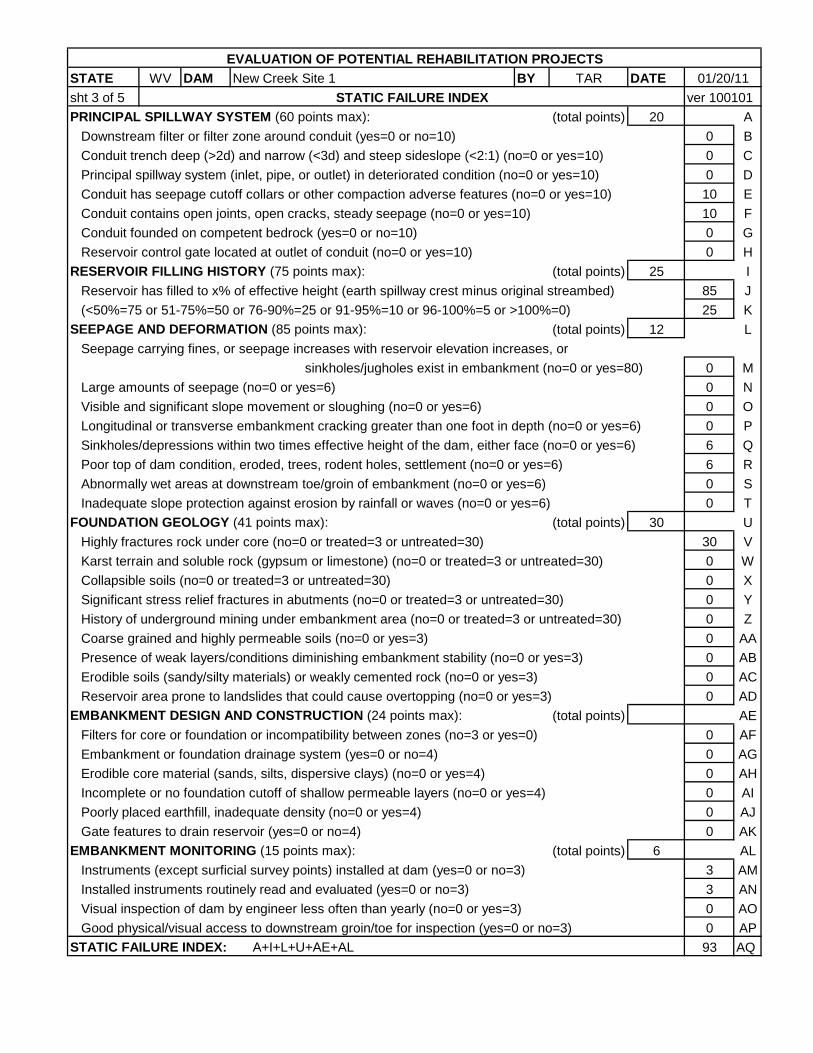
STATE WV DAM New Creek Site 1 BY TAR DATE
sht 3 of 5 ver 100101
PRINCIPAL SPILLWAY SYSTEM (60 points max): (total points) 20 A
Downstream filter or filter zone around conduit (yes=0 or no=10) 0 B
Conduit trench deep (>2d) and narrow (<3d) and steep sideslope (<2:1) (no=0 or yes=10) 0 C
Principal spillway system (inlet, pipe, or outlet) in deteriorated condition (no=0 or yes=10) 0 D
Conduit has seepage cutoff collars or other compaction adverse features (no=0 or yes=10) 10 E
Conduit contains open joints, open cracks, steady seepage (no=0 or yes=10) 10 F
Conduit founded on competent bedrock (yes=0 or no=10) 0 G
Reservoir control gate located at outlet of conduit (no=0 or yes=10) 0 H
RESERVOIR FILLING HISTORY (75 points max): (total points) 25 I
Reservoir has filled to x% of effective height (earth spillway crest minus original streambed) 85 J
(<50%=75 or 51-75%=50 or 76-90%=25 or 91-95%=10 or 96-100%=5 or >100%=0) 25 K
SEEPAGE AND DEFORMATION (85 points max): (total points) 12 L
Seepage carrying fines, or seepage increases with reservoir elevation increases, or
sinkholes/jugholes exist in embankment (no=0 or yes=80) 0 M
Large amounts of seepage (no=0 or yes=6) 0 N
Visible and significant slope movement or sloughing (no=0 or yes=6) 0 O
Longitudinal or transverse embankment cracking greater than one foot in depth (no=0 or yes=6) 0 P
Sinkholes/depressions within two times effective height of the dam, either face (no=0 or yes=6) 6 Q
Poor top of dam condition, eroded, trees, rodent holes, settlement (no=0 or yes=6) 6 R
Abnormally wet areas at downstream toe/groin of embankment (no=0 or yes=6) 0 S
Inadequate slope protection against erosion by rainfall or waves (no=0 or yes=6) 0 T
FOUNDATION GEOLOGY (41 points max): (total points) 30 U
Highly fractures rock under core (no=0 or treated=3 or untreated=30) 30 V
Karst terrain and soluble rock (gypsum or limestone) (no=0 or treated=3 or untreated=30) 0 W
Collapsible soils (no=0 or treated=3 or untreated=30) 0 X
Significant stress relief fractures in abutments (no=0 or treated=3 or untreated=30) 0 Y
History of underground mining under embankment area (no=0 or treated=3 or untreated=30) 0 Z
Coarse grained and highly permeable soils (no=0 or yes=3) 0 AA
Presence of weak layers/conditions diminishing embankment stability (no=0 or yes=3) 0 AB
Erodible soils (sandy/silty materials) or weakly cemented rock (no=0 or yes=3) 0 AC
Reservoir area prone to landslides that could cause overtopping (no=0 or yes=3) 0 AD
EMBANKMENT DESIGN AND CONSTRUCTION (24 points max): (total points) AE
Filters for core or foundation or incompatibility between zones (no=3 or yes=0) 0 AF
Embankment or foundation drainage system (yes=0 or no=4) 0 AG
Erodible core material (sands, silts, dispersive clays) (no=0 or yes=4) 0 AH
Incomplete or no foundation cutoff of shallow permeable layers (no=0 or yes=4) 0 AI
Poorly placed earthfill, inadequate density (no=0 or yes=4) 0 AJ
Gate features to drain reservoir (yes=0 or no=4) 0 AK
EMBANKMENT MONITORING (15 points max): (total points) 6 AL
Instruments (except surficial survey points) installed at dam (yes=0 or no=3) 3 AM
Installed instruments routinely read and evaluated (yes=0 or no=3) 3 AN
Visual inspection of dam by engineer less often than yearly (no=0 or yes=3) 0 AO
Good physical/visual access to downstream groin/toe for inspection (yes=0 or no=3) 0 AP
STATIC FAILURE INDEX: A+I+L+U+AE+AL 93 AQ
STATIC FAILURE INDEX
01/20/11
EVALUATION OF POTENTIAL REHABILITATION PROJECTS
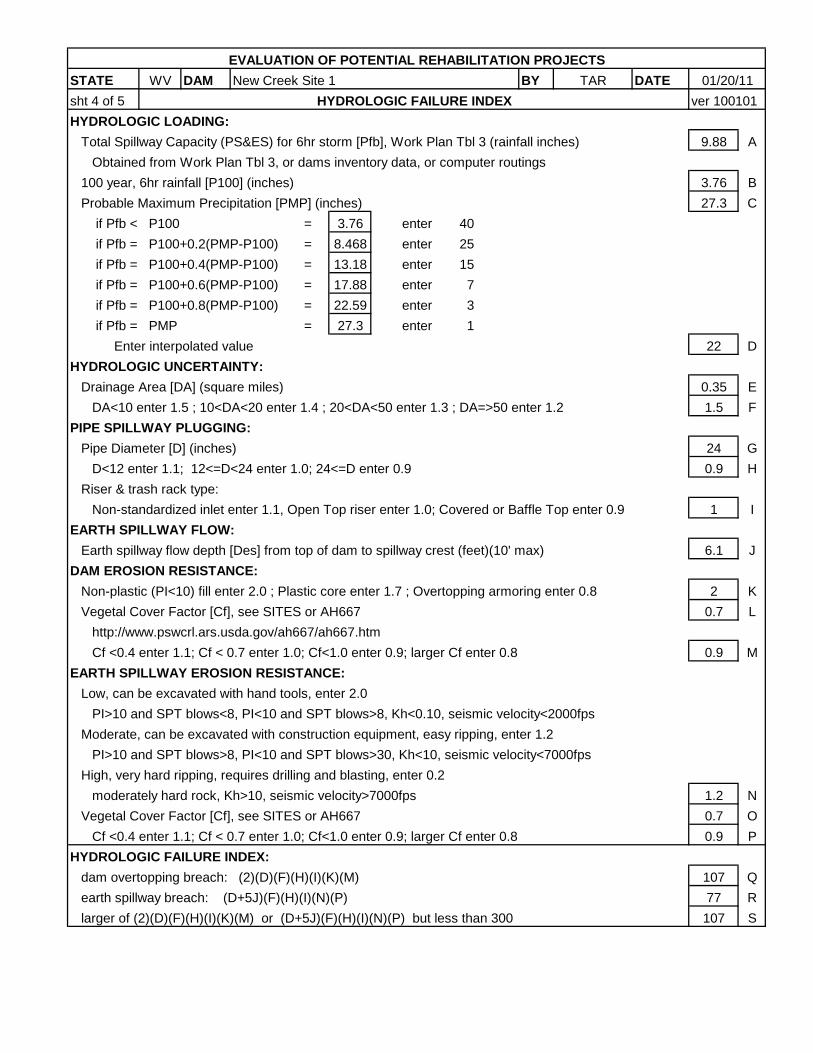
STATE WV DAM BY TAR DATE
sht 4 of 5
HYDROLOGIC LOADING:
Total Spillway Capacity (PS&ES) for 6hr storm [Pfb], Work Plan Tbl 3 (rainfall inches) 9.88 A
Obtained from Work Plan Tbl 3, or dams inventory data, or computer routings
100 year, 6hr rainfall [P100] (inches) 3.76 B
Probable Maximum Precipitation [PMP] (inches) 27.3 C
if Pfb <= P100 = 3.76 enter 40
if Pfb = P100+0.2(PMP-P100) = 8.468 enter 25
if Pfb = P100+0.4(PMP-P100) = 13.18 enter 15
if Pfb = P100+0.6(PMP-P100) = 17.88 enter 7
if Pfb = P100+0.8(PMP-P100) = 22.59 enter 3
if Pfb => PMP = 27.3 enter 1
Enter interpolated value 22 D
HYDROLOGIC UNCERTAINTY:
Drainage Area [DA] (square miles) 0.35 E
DA<10 enter 1.5 ; 10<DA<20 enter 1.4 ; 20<DA<50 enter 1.3 ; DA=>50 enter 1.2 1.5 F
PIPE SPILLWAY PLUGGING:
Pipe Diameter [D] (inches) 24 G
D<12 enter 1.1; 12<=D<24 enter 1.0; 24<=D enter 0.9 0.9 H
Riser & trash rack type:
Non-standardized inlet enter 1.1, Open Top riser enter 1.0; Covered or Baffle Top enter 0.9 1 I
EARTH SPILLWAY FLOW:
Earth spillway flow depth [Des] from top of dam to spillway crest (feet)(10' max) 6.1 J
DAM EROSION RESISTANCE:
Non-plastic (PI<10) fill enter 2.0 ; Plastic core enter 1.7 ; Overtopping armoring enter 0.8 2 K
Vegetal Cover Factor [Cf], see SITES or AH667 0.7 L
http://www.pswcrl.ars.usda.gov/ah667/ah667.htm
Cf <0.4 enter 1.1; Cf < 0.7 enter 1.0; Cf<1.0 enter 0.9; larger Cf enter 0.8 0.9 M
EARTH SPILLWAY EROSION RESISTANCE:
Low, can be excavated with hand tools, enter 2.0
PI>10 and SPT blows<8, PI<10 and SPT blows>8, Kh<0.10, seismic velocity<2000fps
Moderate, can be excavated with construction equipment, easy ripping, enter 1.2
PI>10 and SPT blows>8, PI<10 and SPT blows>30, Kh<10, seismic velocity<7000fps
High, very hard ripping, requires drilling and blasting, enter 0.2
moderately hard rock, Kh>10, seismic velocity>7000fps 1.2 N
Vegetal Cover Factor [Cf], see SITES or AH667 0.7 O
Cf <0.4 enter 1.1; Cf < 0.7 enter 1.0; Cf<1.0 enter 0.9; larger Cf enter 0.8 0.9 P
HYDROLOGIC FAILURE INDEX:
dam overtopping breach: (2)(D)(F)(H)(I)(K)(M) 107 Q
earth spillway breach: (D+5J)(F)(H)(I)(N)(P) 77 R
larger of (2)(D)(F)(H)(I)(K)(M) or (D+5J)(F)(H)(I)(N)(P) but less than 300 107 S
EVALUATION OF POTENTIAL REHABILITATION PROJECTS
New Creek Site 1
HYDROLOGIC FAILURE INDEX
01/20/11
ver 100101
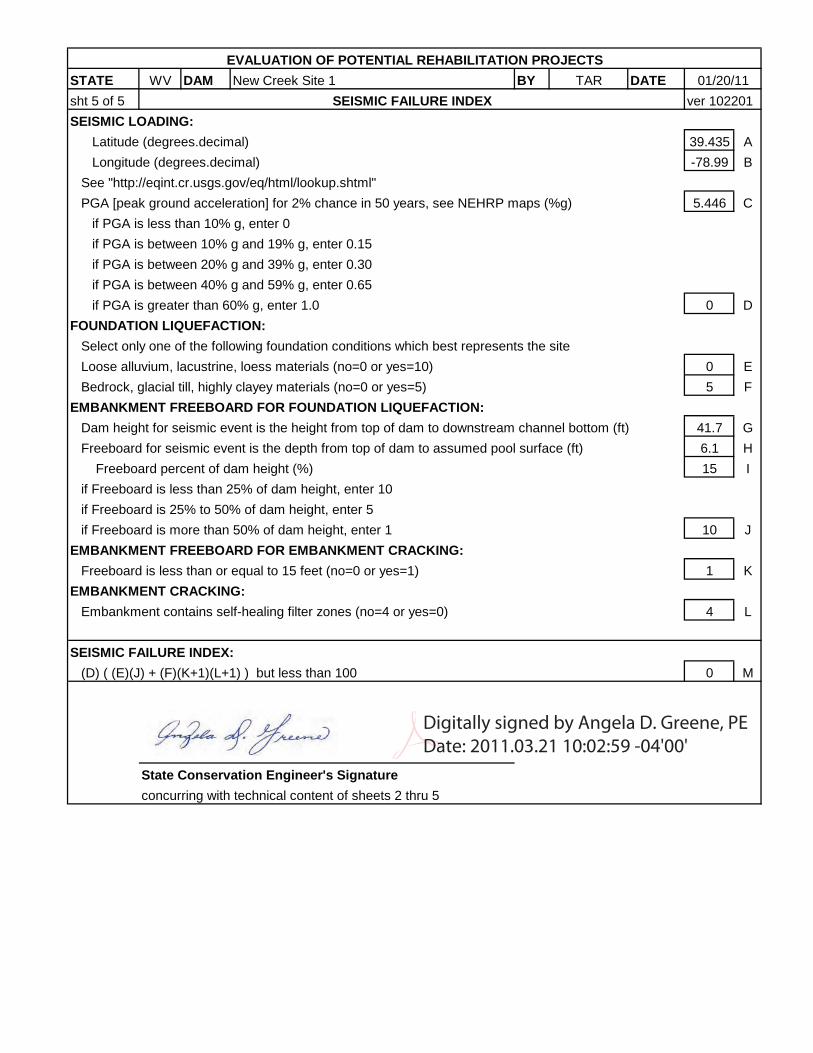
STATE WV DAM New Creek Site 1 BY TAR DATE
sht 5 of 5 ver 102201
SEISMIC LOADING:
Latitude (degrees.decimal) 39.435 A
Longitude (degrees.decimal) -78.99 B
See "http://eqint.cr.usgs.gov/eq/html/lookup.shtml"
PGA [peak ground acceleration] for 2% chance in 50 years, see NEHRP maps (%g) 5.446 C
if PGA is less than 10% g, enter 0
if PGA is between 10% g and 19% g, enter 0.15
if PGA is between 20% g and 39% g, enter 0.30
if PGA is between 40% g and 59% g, enter 0.65
if PGA is greater than 60% g, enter 1.0 0 D
FOUNDATION LIQUEFACTION:
Select only one of the following foundation conditions which best represents the site
Loose alluvium, lacustrine, loess materials (no=0 or yes=10) 0 E
Bedrock, glacial till, highly clayey materials (no=0 or yes=5) 5 F
EMBANKMENT FREEBOARD FOR FOUNDATION LIQUEFACTION:
Dam height for seismic event is the height from top of dam to downstream channel bottom (ft) 41.7 G
Freeboard for seismic event is the depth from top of dam to assumed pool surface (ft) 6.1 H
Freeboard percent of dam height (%) 15 I
if Freeboard is less than 25% of dam height, enter 10
if Freeboard is 25% to 50% of dam height, enter 5
if Freeboard is more than 50% of dam height, enter 1 10 J
EMBANKMENT FREEBOARD FOR EMBANKMENT CRACKING:
Freeboard is less than or equal to 15 feet (no=0 or yes=1) 1 K
EMBANKMENT CRACKING:
Embankment contains self-healing filter zones (no=4 or yes=0) 4 L
SEISMIC FAILURE INDEX:
(D) ( (E)(J) + (F)(K+1)(L+1) ) but less than 100 0 M
State Conservation Engineer's Signature
concurring with technical content of sheets 2 thru 5
SEISMIC FAILURE INDEX
01/20/11
EVALUATION OF POTENTIAL REHABILITATION PROJECTS
Digitally signed by Angela D. Greene, PE
Date: 2011.03.21 10:02:59 -04'00'
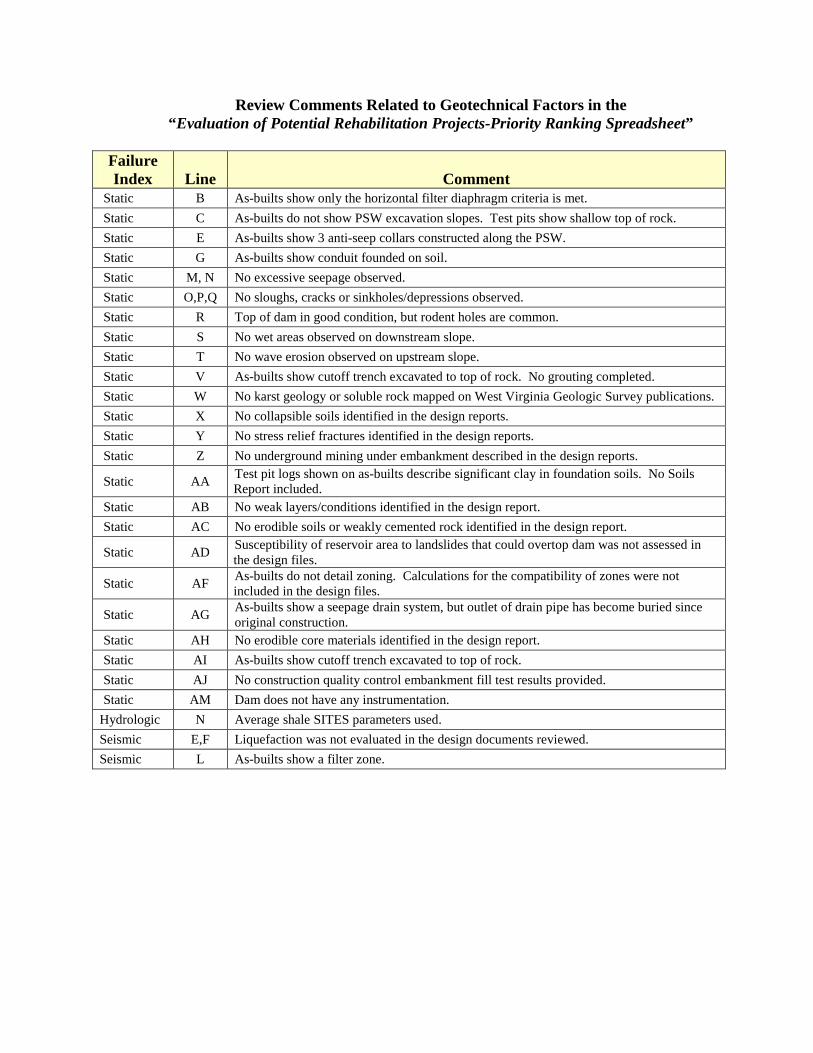
Review Comments Related to Geotechnical Factors in the “Evaluation of Potential Rehabilitation Projects-Priority Ranking Spreadsheet”
Failure Index Line Comment
Static B As-builts show only the horizontal filter diaphragm criteria is met. Static C As-builts do not show PSW excavation slopes. Test pits show shallow top of rock. Static E As-builts show 3 anti-seep collars constructed along the PSW. Static G As-builts show conduit founded on soil. Static M, N No excessive seepage observed. Static O,P,Q No sloughs, cracks or sinkholes/depressions observed. Static R Top of dam in good condition, but rodent holes are common. Static S No wet areas observed on downstream slope. Static T No wave erosion observed on upstream slope. Static V As-builts show cutoff trench excavated to top of rock. No grouting completed. Static W No karst geology or soluble rock mapped on West Virginia Geologic Survey publications. Static X No collapsible soils identified in the design reports. Static Y No stress relief fractures identified in the design reports. Static Z No underground mining under embankment described in the design reports.
Static AA Test pit logs shown on as-builts describe significant clay in foundation soils. No Soils Report included.
Static AB No weak layers/conditions identified in the design report. Static AC No erodible soils or weakly cemented rock identified in the design report.
Static AD Susceptibility of reservoir area to landslides that could overtop dam was not assessed in the design files.
Static AF As-builts do not detail zoning. Calculations for the compatibility of zones were not included in the design files.
Static AG As-builts show a seepage drain system, but outlet of drain pipe has become buried since original construction.
Static AH No erodible core materials identified in the design report. Static AI As-builts show cutoff trench excavated to top of rock. Static AJ No construction quality control embankment fill test results provided. Static AM Dam does not have any instrumentation.
Hydrologic N Average shale SITES parameters used. Seismic E,F Liquefaction was not evaluated in the design documents reviewed. Seismic L As-builts show a filter zone.