Embed Size (px)
Citation preview
New Generation Cooperatives:Case StudiesExpanded 2001
I l l i n o i s I n s t i t u t ef o r R u r a l A f f a i r sUSDA
New Generation Cooperatives:Case StudiesExpanded 2001
Edited by
Mary HolmesNorman WalzerChristopher D. Merrett
The authors are research associate, director, and associate professor, respectively, IllinoisInstitute for Rural Affairs, Western Illinois University.
I l l i n o i s I n s t i t u t ef o r R u r a l A f f a i r sUSDA
Printed on recycled paper
Published by Illinois Institute for Rural AffairsStipes Hall 518Western Illinois University1 University CircleMacomb, IL [email protected]
This publication is available from IIRA in print and on the IIRA web page with linksenabled.
Quoting from these materials for noncommercial purposes is permitted provided propercredit is given.
First Printing: August 2001
Financial support for this project came from the Value Project To Improve Farm Incomeand Rural Communities through Specialty Farm Products and also the RuralDevelopment Opportunities (RDO) Project identifying rural development opportunities inIllinois funded through the Rural Community Development Strategic Research Initiativeentitled Illinois Farming Alternative and Rural Revitalization Methods (I-FAARM).Primary support for Center projects has come from the Council on Food and AgriculturalResearch (C-FAR), the VALUE project (C-FAR) at the University of Illinois, theUSDA—Rural Development; the Illinois Department of Agriculture; the IllinoisDepartment of Commerce and Community Affairs; and the Illinois Institute for RuralAffairs located at Western Illinois University.
iii
Contents
Section Page Number
New Generation Cooperatives and the Future of Agriculture: An Introduction Jennifer Waner ............................................................................................................................ 1
Table 1. NGC Practice: The Role of the Facilitator................................................................. 2
Table 2. NGC Practice: The Importance of a Network of Support ......................................... 3
Table 3. New Generation Cooperatives: Ten Difficulties Most Often Encountered ............... 5
Table 4. Percentage of the NGC/LLC: Start-up Capital by Source ........................................11
Table 5. Reasons Stimulating the Establishment of the NGC/LLC ...................................... 13
Table 6. Obstacles to NGC/LLC Formation or Operation..................................................... 14
Table 7. Factors Contributing to the Success of the NGC/LLC Effort .................................. 15
New Generation Cooperatives: A Short History of the Idea and the Enterprise Igor Kotov ................................................................................................................................. 19
Golden Oval Patricia Buschette ..................................................................................................................... 33
Going Against the Grain: The Story of the Mountain View Harvest Cooperative David Carter ............................................................................................................................. 43
Case Study of Southwest Iowa Soy Cooperative Norman Walzer and Mary Holmes ........................................................................................... 55
Table 1. Financial Structure ................................................................................................... 62
Table 2. U.S. Soybean Products: Value and Crush Margin per Bushel, 1950-1998 .............. 63
Figure 1. Value of Soybeans and Products per Bushel .......................................................... 64
Figure 2. Margin Received by Farmers per Bushel ............................................................... 64
Golden Triangle Energy Cooperative, Inc. Ethanol Plant Rodney Fink .............................................................................................................................. 69
Table 1. Job Creation Impact from Ethanol Plant ................................................................. 75
Table 2. Estimated Values of a Livestock Operation ............................................................. 76
Table 3. Estimated Tax Revenues as a Result of an Ethanol Plant ........................................ 76
Table 4. Specifications and Assumptions .............................................................................. 78
Table 5. Operations Data ....................................................................................................... 78
Table 6. Summary Statistics .................................................................................................. 79
iv
The Role of Value-Added Cooperatives in Rural Economic Development:The Case of Heartland Organic Marketing Cooperative Chris Merrett ............................................................................................................................ 83
Table 1. Prices for Organic Versus Conventional Soybeans, May 1998 ($/bushel) .............. 85
Table 2. Income Statement for Heartland Organic Marketing Cooperative, 1995-1999....... 91
Home Grown Wisconsin: The Story of a New Producer Cooperative Greg Lawless ............................................................................................................................ 95
Figure 1. Why Don’t You Buy More Locally Grown Food Products? .................................. 96
Figure 2. How Likely Are You To Buy More Local Food . . . ? ............................................ 97
Northern Vineyards Winery Lee Egerstrom ......................................................................................................................... 109
Table 1. U.S. Wine Consumption, 1993-1998 ......................................................................114
Table 2. Characteristics of U.S. Small Farms Differ Markedly from Large Farms..............118
Table 3. Selected Characteristics of Minority and Women Farm Operators ........................119
Hard Choices: The Birth and Death of Ranchers’ Choice Cooperative David Carter ........................................................................................................................... 121
Table 1. Product Mix for Cooperative ................................................................................. 124
U.S. Premium Beef Mary Holz-Clause .................................................................................................................. 133
Figure 1. Beef, Pork, and Poultry Per Capita Consumption ................................................ 133
Table 1. USPB Return on Investment .................................................................................. 141
Figure 2. FNB Slaughter Market Share ............................................................................... 142
Appendix A. U.S. Premium Beef Cattle Settlement Grid ................................................... 148
Appendix B. USPB Settlement Sheet .................................................................................. 149
South Dakota Soybean Processors Rodney J. Fink ........................................................................................................................ 151
Table 1. Characteristics of Three Soy Processing Plants ..................................................... 154
Table 2. Output Fractions from a Bushel of Soybeans from Alternative Processing Plants ................................................................................................... 154
Table 3. Average CBOT Soybean Crush Margins ............................................................... 155
Table 4. Change in Volume Processed ................................................................................. 160
Table 5. Changes in Earning Structure ................................................................................ 160
Table 6. SDSP Profit Distribution and Utilization ............................................................... 161
Table 7. Estimated Economic Activity Generated by SDSP ............................................... 163
Table 8. Estimated Economic Activity As a result of SDSP ............................................... 163
v
Iowa Turkey Growers Cooperative and West Liberty Foods Mary Swalla Holmes and Daniel Curry ................................................................................. 167
Table 1. Turkeys: Number Raised 1998-1999 ..................................................................... 168
Figure 1. Organizational Chart ............................................................................................ 170
Figure 2. Estimated Net Returns for Whole Turkey at Wholesale ...................................... 171
Table 2. 1998 Per Capita Consumption in Pounds .............................................................. 173
Figure 3. Percent of Value-Added Products Delivered to Customers ................................. 174
Table 3. Time Line ............................................................................................................... 177
Sunrise Energy Cooperative Rodney J. Fink ........................................................................................................................ 179
Table 1. Cash Flows from Financing Activities .................................................................. 186
Table 2. Cash Flow Summary.............................................................................................. 188
21st Century Alliance: Building Value-Added Agribusiness Roger Brown ........................................................................................................................... 193
Table 1. Farms and Principal Occupation ............................................................................ 194
Table 2. Organizations Created by the 21st Century Alliance .............................................. 196
Figure 1. Organization Chart ............................................................................................... 199
Figure 2. Commercialization Process .................................................................................. 201
About the Authors ...................................................................................................................... 207

1
New Generation Cooperatives and the Future of Agriculture:An Introduction
by Jennifer Waner
The past 50 years have brought major changes in agriculture. Agricultural producers in theUnited States and around the world have faced greater competition as the capacity to produceand the supply of commodities has increased. In a sense, agriculture has been undergoing an“industrialization” process that has been defined as “the application of modern industrialmanufacturing, production, procurement, distribution, and coordination concepts to the food andindustrial product chain” (Boehlje 1996, 30).
The industrialization of agriculture has transformed a nation of relatively small diversifiedfamily farms into fewer specialized highly technical corporate and private operations. Over thelong term, such enterprises may threaten many of the remaining traditional farms because of anabsolute size advantage. Farm producers no longer engage in a subsistence type food productionsystem; instead, they must operate in a global food system. Markets are product-driven, andproduction is increasingly capital dependent.
By operating individually, many farmers are simply unable to expand operations to the scalenecessary for involvement in processing. This move requires too much capital, expertise, andtime; however, by pooling resources, as in a cooperative venture, even small producers can reachthe necessary size and output levels to vertically integrate and enter the processing arena.Cooperatives have worked well in some areas because they allow farm producers to retainownership and control of assets while achieving economic and political power via membership(Stefanson and Fulton 1997).
Low commodity prices, recent changes in government policy such as the 1996 Freedom toFarm Act, and declining rural income and employment indicate that agricultural producers mayhave to revise their farming operations in order to survive. In fact, conditions such as these haveresulted in the formation of numerous successful New Generation Cooperatives (NGCs) since themid-1970s.
The following case studies examine specific NGCs and consider several questions. Why dosome co-ops succeed while others do not get off the starting line? Theories have been advancedbut without clear-cut answers. Because of their recent history, not much research exists onco-ops. One fact is certain, however. Creating an NGC can be financially rewarding but is farfrom a guarantee of survival in an ever-changing market structure.
What Is a New Generation Cooperative?
The main focal point of an NGC is value-added processing. Earlier co-op ventures centeredon commodity marketing, basically acting as a clearinghouse for the members’ products(Stefanson, Fulton, and Harris 1995). NGCs differ markedly from these traditional co-ops in thatthey have a restricted or closed membership, and members have specified delivery rights basedupon the number of shares held. A democratic form of organization with one member/one vote
2
policies and a board of directors elected by members from the membership is the norm. Earningsare distributed among members on the basis of shares (Cropp 1996).
The price and delivery requirement per share is essentially established by the capitalrequired for financing the development of a processing facility and the capacity of the plannedfacility (Stefanson et al. 1995). While members are usually allowed to purchase varying amountsof stock, the members’ investments constitute a legally binding agreement to deliver thepredetermined quantity of the commodity. To allow for community involvement and support,many NGCs sell preferred stock. The holders of this stock do not have voting rights.
Some of these NGCs require only a small amount of start-up capital; however, a majorityrequire millions of dollars to be raised before construction can begin. Depending on the specificNGC, the investment and producer requirements can differ substantially.
Cooperative DevelopmentWithin the United States, Minnesota and North Dakota have led the nation in developing
NGCs. The successes achieved in these states have ignited a wave of NGC development acrossthe Midwest. The question facing potential co-op members and development agents now iswhether this model will work in other areas. Since no one has managed to define a universal planfor NGC development that is common to all existing NGCs, we must look to common criticalfactors as guides to developing these organizations.
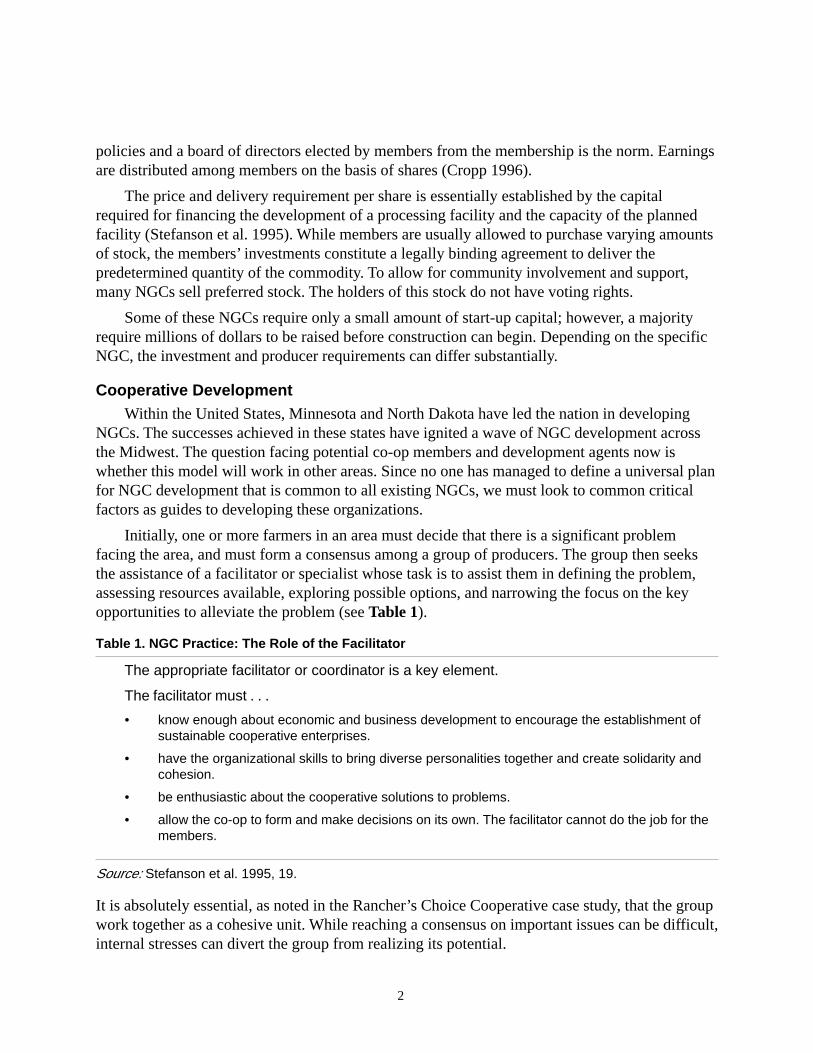
Initially, one or more farmers in an area must decide that there is a significant problemfacing the area, and must form a consensus among a group of producers. The group then seeksthe assistance of a facilitator or specialist whose task is to assist them in defining the problem,assessing resources available, exploring possible options, and narrowing the focus on the keyopportunities to alleviate the problem (see Table 1).
Table 1. NGC Practice: The Role of the Facilitator
The appropriate facilitator or coordinator is a key element.
The facilitator must . . .
• know enough about economic and business development to encourage the establishment ofsustainable cooperative enterprises.
• have the organizational skills to bring diverse personalities together and create solidarity andcohesion.
• be enthusiastic about the cooperative solutions to problems.
• allow the co-op to form and make decisions on its own. The facilitator cannot do the job for themembers.
Source: Stefanson et al. 1995, 19.
It is absolutely essential, as noted in the Rancher’s Choice Cooperative case study, that the groupwork together as a cohesive unit. While reaching a consensus on important issues can be difficult,internal stresses can divert the group from realizing its potential.
3
According to Stefanson et al. (1995), “Motivated, determined producers are the mostimportant element in the success of New Generation Cooperatives” (14). Producer-membersmust spend an immense amount of time working together to develop an NGC. Regardless ofindividual differences or past disputes, members must band together to develop a unified front.
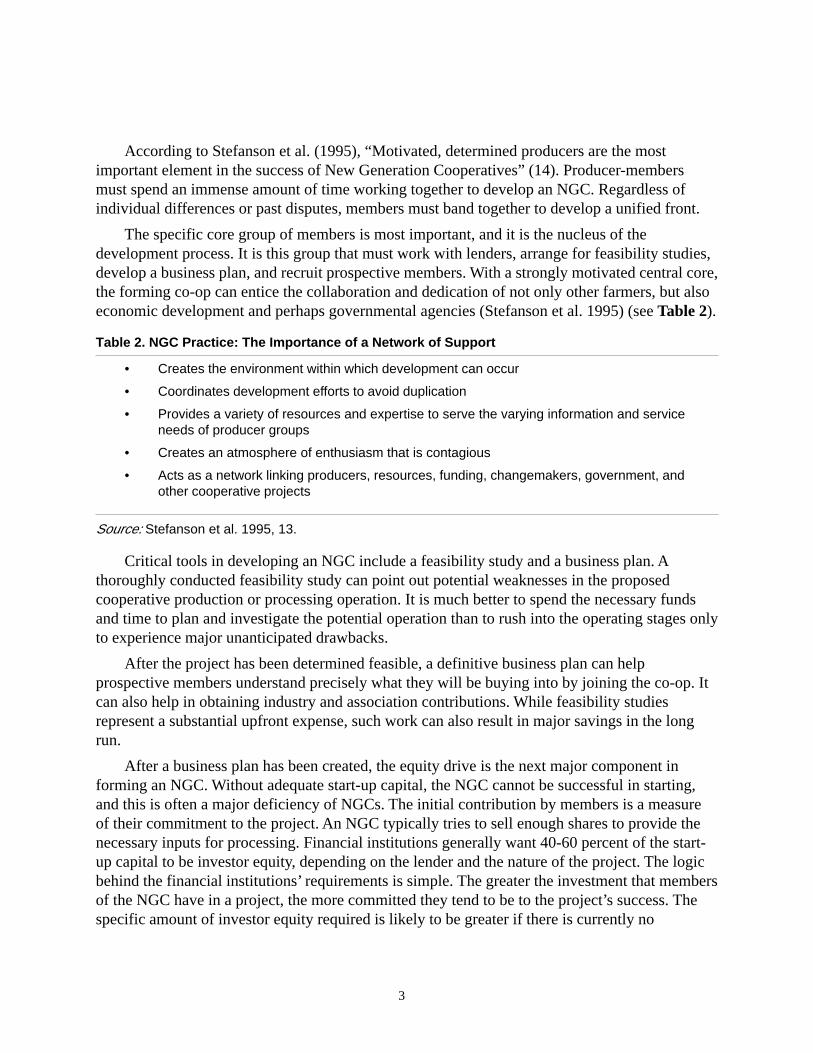
The specific core group of members is most important, and it is the nucleus of thedevelopment process. It is this group that must work with lenders, arrange for feasibility studies,develop a business plan, and recruit prospective members. With a strongly motivated central core,the forming co-op can entice the collaboration and dedication of not only other farmers, but alsoeconomic development and perhaps governmental agencies (Stefanson et al. 1995) (see Table 2).
Table 2. NGC Practice: The Importance of a Network of Support
• Creates the environment within which development can occur
• Coordinates development efforts to avoid duplication
• Provides a variety of resources and expertise to serve the varying information and serviceneeds of producer groups
• Creates an atmosphere of enthusiasm that is contagious
• Acts as a network linking producers, resources, funding, changemakers, government, andother cooperative projects
Source: Stefanson et al. 1995, 13.
Critical tools in developing an NGC include a feasibility study and a business plan. Athoroughly conducted feasibility study can point out potential weaknesses in the proposedcooperative production or processing operation. It is much better to spend the necessary fundsand time to plan and investigate the potential operation than to rush into the operating stages onlyto experience major unanticipated drawbacks.
After the project has been determined feasible, a definitive business plan can helpprospective members understand precisely what they will be buying into by joining the co-op. Itcan also help in obtaining industry and association contributions. While feasibility studiesrepresent a substantial upfront expense, such work can also result in major savings in the longrun.
After a business plan has been created, the equity drive is the next major component informing an NGC. Without adequate start-up capital, the NGC cannot be successful in starting,and this is often a major deficiency of NGCs. The initial contribution by members is a measureof their commitment to the project. An NGC typically tries to sell enough shares to provide thenecessary inputs for processing. Financial institutions generally want 40-60 percent of the start-up capital to be investor equity, depending on the lender and the nature of the project. The logicbehind the financial institutions’ requirements is simple. The greater the investment that membersof the NGC have in a project, the more committed they tend to be to the project’s success. Thespecific amount of investor equity required is likely to be greater if there is currently no
4
established market for the product, if risk elements involved have never been dealt with before,or if the product is extremely high-tech (Thyfault 1996).
While investing in an NGC may seem too risky for some producers, a well-placedinvestment can bring many financial benefits. In Successful Farming, Thomas Jacobs, whosefamily has invested in NGCs, offers the following tips for investing:
• Read the disclosure statement. It describes risks in addition to past performance.
• Do your homework on management. Do they have experience in this industry? Have theyfailed in other jobs?
• Learn about the value-added industry. How strong are any competitors?
• Do not borrow too much money to buy stock. For example, it is not wise to risk the farm onthe purchase of stock.
With the recent technological innovations that allow NGCs to produce materials such asparticle board and biocomposites, not to mention the food processing products, producers caneasily be swept up in the excitement of the future potential of an NGC. David Barton, director ofKansas State University’s Arthur Capper Cooperative Center, says that it is crucial to honestlyevaluate two questions before continuing on with the development process: (1) Why should wedo this? and (2) Why shouldn’t we do this? Objectively addressing these questions cansubstantially lower the risk of the venture’s failure, as well as assist in the development of anaction plan for the organization (Thyfault 1996).
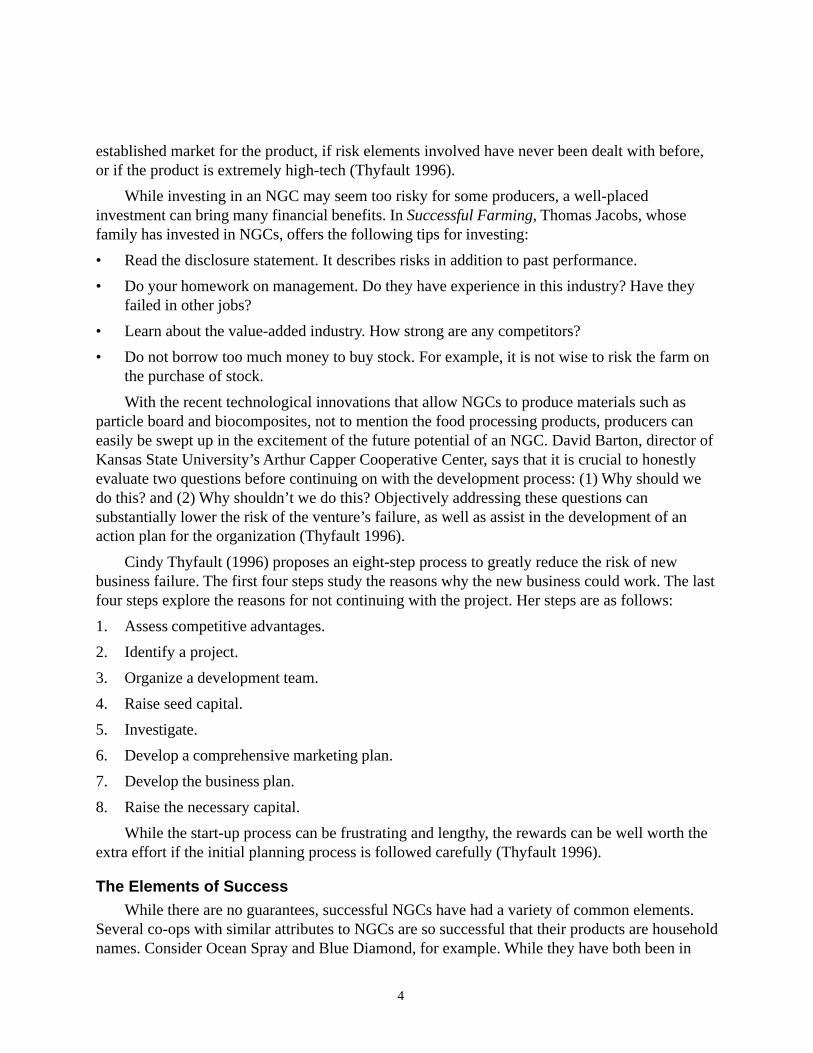
Cindy Thyfault (1996) proposes an eight-step process to greatly reduce the risk of newbusiness failure. The first four steps study the reasons why the new business could work. The lastfour steps explore the reasons for not continuing with the project. Her steps are as follows:
1. Assess competitive advantages.
2. Identify a project.
3. Organize a development team.
4. Raise seed capital.
5. Investigate.
6. Develop a comprehensive marketing plan.
7. Develop the business plan.
8. Raise the necessary capital.
While the start-up process can be frustrating and lengthy, the rewards can be well worth theextra effort if the initial planning process is followed carefully (Thyfault 1996).
The Elements of SuccessWhile there are no guarantees, successful NGCs have had a variety of common elements.
Several co-ops with similar attributes to NGCs are so successful that their products are householdnames. Consider Ocean Spray and Blue Diamond, for example. While they have both been in
5
existence for a number of years and are not considered NGCs, these co-ops have both succeededin establishing new and innovative markets for their products.
The Minnesota Association of Cooperatives has proposed several reasons why the state ofMinnesota has been so successful in developing and operating NGCs. Specifically, leadership,legislative support, and believers are cited as three keys to Minnesota’s success. In fact, residentsare very devoted to NGCs, and the Minnesota legislature has enacted a variety of laws whichbenefit NGCs.
Minnesota has a network of support; institutions such as the St. Paul Bank for Cooperatives,the National Cooperative Bank, the Rural Finance Authority, and many others enable thetechnical, financial, and legal framework to be set in place for continuing cooperativedevelopment.
Thriving NGCs have successfully addressed the risks associated with entering into newmarkets. They have taken advantage of their strengths and found a niche that had to be filled.They have studied the market and know what consumers want. As shown in subsequent casestudies, it takes much more than a strong desire to succeed. Success in a new market requires adedicated, unified group of producers, including those with leadership skills; knowledgeable,informed facilitators; successful, effective management; a strong business plan; a solid market;and supportive financial institutions.
Potential ProblemsA variety of problems can contribute to the failure of NGCs, but there are once again
common characteristics among unsuccessful NGC ventures. Unfortunately, many attempts atNGC formation never get beyond the early developmental stages (see Table 3).
Table 3. New Generation Cooperatives: Ten Difficulties Most Often Encountered
1. Plant specifications not met
2. Construction contract problems such as delays and overruns
3. Lack of owner commitment
4. Noncompetitive business location
5. Overly optimistic market projections
6. Unrealistically low operating cost projections
7. Faulty government-based marketing assumptions
8. Management problems
9. Excessive debt-to-equity ratio
10. Outside promoter rather than producer leadership
Source: Minnesota Association of Cooperatives n.d.
6
The most detrimental component of a new NGC can be the members themselves. Ifmembers cannot work together for the benefit of the group as a whole rather than compete witheach other, the co-op is most certainly doomed. Perhaps this is the reason why this model ofcooperation has worked quite well in the upper Midwest region. Residents in this area have anancestral tendency to work well in groups or co-ops. Nevertheless, co-ops also succeed in otherregions.
Another major hurdle in the formation and operation of an NGC is obtaining capital. Whenprocessing facilities can cost more than $100 million, it can be daunting to even considerfinances; however, with a significant number of shares, an array of available grants, low interestloans, tax credits, and other financing options, the goal is certainly not unobtainable.
A related obstacle can often be selling potential members on the benefits of joining theNGC. The concept of buying contract shares in a co-op is relatively new to most farmer-producers, especially when processing is involved. Some producers simply do not see themselvesas part of the food production industry, let alone the fiber, oils, or ethanol industries. To theseproducers, the NGC may not seem like a realistic investment.
Members and facilitators who are devoted to the project and who have a reasonable amountof technical knowledge are needed to explain what a producer can gain through membership.Producers can be more easily convinced to join once they’ve realized the potential to garnerhigher premiums and returns on stock.
Finally, the location of the processing facility is an important consideration. Such facilitieshave a multitude of requirements, including an adequate water supply and land specifications. Itmay be somewhat difficult to find a suitable building site. An additional problem can arise whenmembers are not able to agree on the location of the building site. Due to the economic potentialfor the community in which the facility is located, members may want the facility in theirimmediate area when, in fact, the facility should be located based on market considerations. Suchconflicts must be resolved early if the NGC is to move forward in the development process.Internal conflicts that are not dealt with tend to erode the enthusiasm, dedication, andcommitment of the organizers until the developmental effort gradually falls apart.
In light of the enthusiasm over the successes of NGCs, organizers and members need to usecaution as they proceed with the effort. Brent Bostrom, Chair of Doherty, Rumble & Butler’sCooperative Law Department, has identified ten potential pitfalls for NGCs. These pitfalls are asfollows:
1. Lack of a Clearly Identified Mission. NGCs must have specific goals and a clearly definedmission that is accepted by its members. Do not simply form an NGC because others belongto an NGC.
2. Inadequate Planning. Detailed plans for achieving the identified goals and mission must beestablished.
3. Failure To Use Advisors and Consultants. A team of knowledgeable and experiencedadvisors and consultants is usually necessary to the success of an NGC.
7
4. Lack of Member Leadership. Leadership must come from within the group. The drivingforce for NGC success should originate within its members. If an external leader hasinitiated the entire process, what will happen when this external source of inspiration leaves?
5. Lack of Member Commitment. Members must be committed to the project because it will notsucceed without their time, effort, and dedication. Often, the early years of an NGC are slowand frustrating. Member commitment is crucial during these times.
6. Inadequate Management. Selecting a manager is an extremely important, but often difficult,task for an NGC’s Board of Directors. This person can literally make or break an NGC.Supervising and establishing goals for the manager to achieve are also tasks delegated to theBoard of Directors.
7. Failure To Identify and Minimize Risks. Risk is inherent in any new endeavor, and while itcannot be completely eliminated, it can be minimized. It must first be identified andquantified, however.
8. Overly Optimistic Assumptions. Huge future profits may be on members’ minds during theorganizational phase; however, such profits cannot be automatically assumed, andspeculation can hurt the co-op.
9. Not Enough Capital. As is typically the case with small businesses, projects tend to outstripthe planned costs. To prevent difficulties from budget shortfalls, it is best to make sure thatfinancing is adequate by carefully planning for contingencies.
10. Inadequate Communication. During formation and the critical initial years of operation, highlevels of communication are essential so that members know what to expect and are notcaught short by unexpected difficulties.
Overview of Case Studies
Many if not most NGCs are formed for the following three reasons: (1) in response to sometype of market failure, (2) to secure additional profits through value-added enterprises, or (3) ascommunity economic development venture (Cook 1995). A secondary objective may be tosupport a specific interest or hobby, which, when successful, can become a secondary incomesource. In general, the NGCs presented in this collection of case studies come from one of theseapproaches with the majority being formed because of adverse market conditions for aprocessing plant or because of another market failure of some type.
As you read the following chapters, notice the commonalities among the NGCs studied. Keyleaders who get the job done, who have the ability to maintain cohesiveness among the group,and who remain faithfully devoted to the organization even in the most difficult of times arepriceless. Thorough market research and feasibility studies allow the new co-op members tounderstand the marketplace they are entering as well as the likelihood of success and practicality.It is often stated that “patience is a virtue.” These co-ops were not started overnight. For themajority of the NGCs studied, the time and expense to conduct all of the necessary studies and
8
research before beginning construction or operations was well worth it to ensure success in thefuture.
Poultry/Grain Co-opsGolden Oval. Golden Oval was formed in the midst of several successful NGCs. The
Renville, Minnesota area is known for its development of several successful co-ops. The GoldenOval NGC was formed from a need for increased profits because of the aging membership of itsparent company, Co-op Country Farmers Elevator. The board and management of Co-op CountryFarmers Elevator felt that they needed to develop a value-added entity that would increase theprofits of the elevator and local farmers by processing a crop grown by member-farmers with ahigh level of technology. After extensive study, the umbrella organization, Midwest Investors ofRenville, Inc., determined that adding value through a liquid egg production operation offered thegreatest return on investment for members. The founders of Golden Oval obtained the knowledgeneeded to enter and thrive in a niche market. The results suggest that they made an excellentchoice.
It is interesting that the group also explored a large hog confinement facility but opted not topursue that approach; however, interested parties in the group went on to see this option becomea reality in ValAdCo. This NGC was formed on the principle of adding value to corn throughswine production. The co-op’s facilities have now expanded to span four hog farms withapproximately 10,000 sows and breeding, gestation, farrowing, nursery finishing, and boarstation units (Merrett, Holmes, and Waner 1999).
Grain and Oilseed Co-opsMountain View Harvest. At the forefront of cooperative development, Mountain View
Harvest Cooperative adopted an entirely new approach to marketing. The co-op was formed in adesperate attempt to save a market for the producers’ wheat after a longtime traditional co-op,Farmers Marketing Association, went bankrupt. All of the former co-op’s elevators were thenunder the control of a single company, leaving the farmers little, if any, marketing alternative.
The members of Mountain View Harvest Cooperative soon became owners of the nation’sfirst farmer-owned bakery. The group purchased an existing successful bakery without makingany management changes but rapidly expanded the facility as the demand for their productincreased. In fact, the need for expansion was so swift that it kept the organization on a tightfinancial budget even though the group began with a sufficient sum of investment capital. Theadvantage of purchasing an existing bakery allowed the co-op to move rapidly into theproduction stage rather than struggling with construction of a new facility. Plus, the expertise ofthe employees substantially aided in the prosperity of the products.
Southwest Soy Cooperative. Poor commodity prices and declining farm incomes caused agroup of soybean producers to start Southwest Soy Cooperative. This co-op created a processingfacility where soybeans are turned into soybean meal and oil for use in animal feeds. Since itbegan in 1997, SSC operations have not met financial expectations. This was mainly due to threefactors: (1) The crush margin dropped lower than expected, to as low as $.13. The initialfeasibility study made it clear that changes in the margin could make the venture unprofitable;
9
(2) The SSC was unable to meet its production targets from the outset; (3) The importance of aneffective manager is paramount. The SSC lacked effective management capable of properlyidentifying the markets.
In December 1999, the SSC closed. The experience of the Southwest Soy Cooperative arenot necessarily unique. NGCs involve significant risks, especially in changing market conditions.There are several useful lessons to be learned from this venture. Market fluctuations can never becontrolled, or even anticipated, completely. Perhaps the most useful lesson to be learned fromthis experience is the importance of clearly identifying and/or establishing markets prior tostarting operations.
Golden Triangle Energy Cooperative, Inc. Golden Triangle seems to have developed from aslightly different mold. After unsuccessful attempts to bring existing ethanol industrycompetitors into their state, the Missouri Corn Growers Association and the Missouri CornMerchandising Council encouraged members to develop an ethanol plant through an NGC.
Other organizations greatly contributed to this co-op from the beginning. Basically, it wascreated more out of a desire for economic development than because of a market failure. Thejustification was that the surrounding area would benefit substantially from this facility with bothcorn producers and the state feeling the impact through potential amplified premiums and taxrevenues.
Organic Co-opsHeartland Organic Marketing Cooperative. Producers trying to keep more of the added-
value in the local economy by completing their own processing founded Heartland OrganicMarketing Cooperative. The NGC’s organic standards add value to its products. The currentfacility has reached full capacity, and the group plans to expand, creating a greater economicimpact on the surrounding communities. The dedication and leadership of the members ofHeartland Organic Marketing Cooperative played a major role in this group’s success. Keyleaders managed the organization, as well as their own farms, as there were no full-timeemployees in the co-op’s infancy.
Home Grown Wisconsin. HGW was organized to help organic producers expand theirmarketing area, as well as increase their profits. Farmers interested in sustainable agriculture setout to cooperatively enter new markets that they could not have without the volume productionof the group, since the most lucrative markets were restaurants in large cities. After a variety ofinitial setbacks which would have resulted in the failure of many co-ops, the co-op not onlyincreased the volume of high-quality local produce purchased in nearby Madison, Wisconsin, buteventually expanded to market the majority of their produce to the Chicago area.
Grape/Winemaking Co-opNorthern Vineyards Winery. This NGC was formed in an effort to save the market for
members’ grapes when an existing winery began making wines from its own grape varieties. Thegrape producers joined forces to form their own winery using the grapes they produced andadding a local flair.
10
The group was fortunate enough to have a member with winemaking equipment andexperience to assist them in the early operational stages of production. Another boon to NorthernVineyards Winery is its location. The scenic countryside and rich history combine to create apopular tourist attraction. Since its origin, the co-op has more than doubled its wine production.
Beef Co-opsU.S. Premium Beef. U.S. Premium Beef resulted from an effort by producers to save the beef
industry’s dwindling market share. Plagued by the difficulty of competing with verticallyintegrated meat protein sources and an inconsistency in beef carcass traits, the beef industryneeded revitalization in a short period of time. U.S. Premium Beef developed a coordinatedsystem to help members compete with meat industry giants.
This co-op had the good fortune to align with an industry powerhouse, Farmland NationalBeef, which is a subsidiary of Farmland Industries. By becoming a partial owner of FarmlandNational Beef, the co-op benefited from selling the product under brand names which werealready familiar to large market segments. The founders of U.S. Premium Beef had timing,knowledge of the industry, a well-known product, and marketing advantage to propel them tosuccess.
Ranchers’ Choice Cooperative. Unfortunately, not every NGC is a success. Ranchers’Choice Cooperative faced adversity from the beginning. Faced with low commodity prices and alack of competitive markets for cattle, these ranchers formed an NGC. After numerouscomplications, the group bought a slaughterhouse to produce a niche market product—kosherbeef. Lack of funding, dissension within the group, lack of marketing opportunities, and a naturaldisaster eventually destroyed the members’ dream.
A lesson learned is that investors must have a thorough understanding of the market theywill be entering. The members of this co-op were somewhat misinformed about the potentialmarket for the product in several specialty stores. Promising market analyses and feasibilitystudies must be examined carefully to see if the potential retailers are asked the appropriatequestions. It is also important to note the lack of sufficient financing and discontent within thegroup that played a key role in the co-op’s demise.
Of the NGCs examined in this collection, seven are operating successfully, and two havefailed. This is not to say that an average of only two out of nine NGCs will not make the grade.The failure rate is probably much higher as it is with small businesses in general.
Market failure or expansion of market share was the main rationale for the formation of sixNGCs described in this report; two were formed to add value to the crops currently produced andto increase profits; and one was formed to help spur economic development. Discussions withparticipants in many of the NGCs, however, demonstrated that local economic development wasa serious consideration in many, if not most, of the co-ops. In fact, expanded economicdevelopment is usually a requirement for capital investment by local economic development andfinancial institutions.
11
NGCs Across the Nation
During the spring and summer of 1999, the Illinois Institute for Rural Affairs conducted asurvey of NGCs in the United States to gather information about sources of funding,membership, the cost of shares, and other economic considerations. Of the 117 surveys mailed toNGCs and Limited Liability Companies (LLCs), 60 responded (51%).
Such ventures seem to be concentrated in the upper Midwest at the present time; however, asthe word of the successes of NGCs is spreading, so is the geographic area in which they exist. Ofthe survey respondents, nearly half are located in Minnesota with another 40 percent in NorthDakota and 6 percent in Iowa. Responses were also received from California, Colorado, Georgia,Hawaii, Illinois, Indiana, Kansas, Maine, Maryland, Michigan, Missouri, Nebraska, Oregon,South Dakota, Washington, and Wisconsin.
Either ethanol or some other corn derivative was the main product of 19 of the 60 surveyrespondents (32%). Various livestock NGCs were the second largest group, comprising 23percent of the survey respondents. Soybeans, other grains, fibers, vegetables, fruits/wineries,sugar beets, and organic products were also major categories of production with at least fourNGCs in each of the preceding categories. Responses were also received from dairy, fish, andpurchasing and service co-ops, as well as producer alliances.
Of the responses received, 72 percent were from closed co-ops. NGCs classified as openco-ops comprised 24 percent. LLCs only accounted for 4 percent of the responses. Closed co-opsare not selling new shares, but they may have sales drives from time to time as they expand,needing additional capital and commodity supplies.
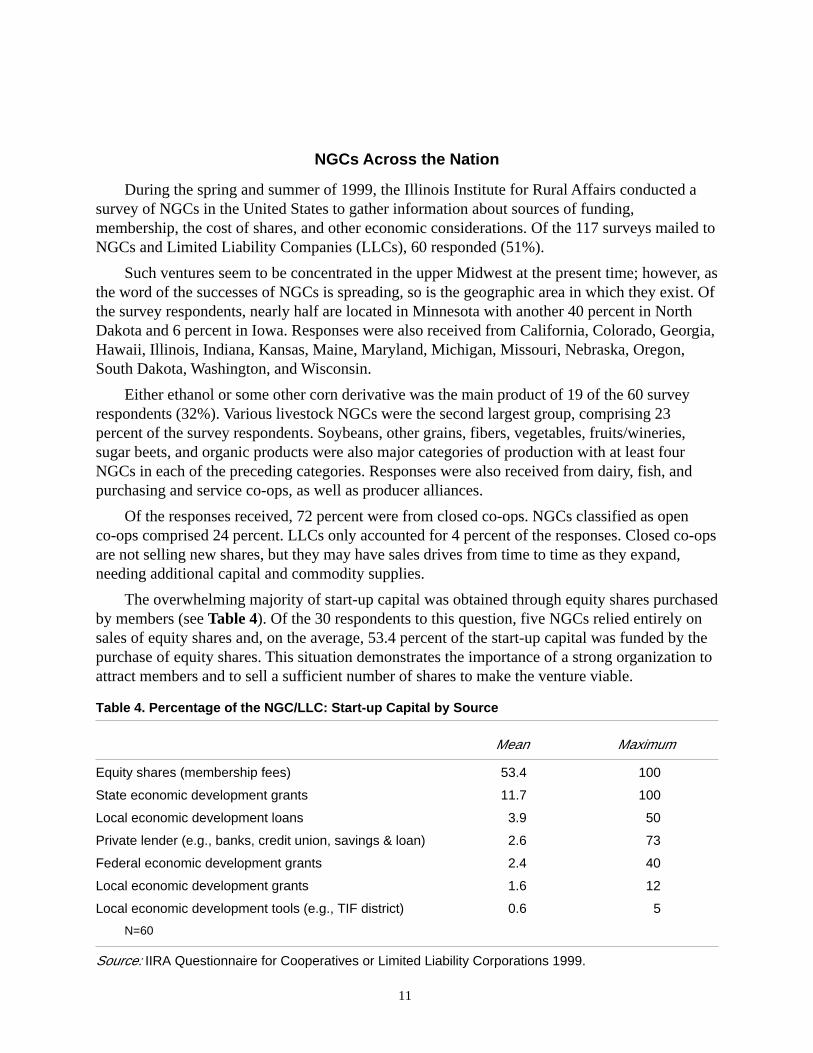
The overwhelming majority of start-up capital was obtained through equity shares purchasedby members (see Table 4). Of the 30 respondents to this question, five NGCs relied entirely onsales of equity shares and, on the average, 53.4 percent of the start-up capital was funded by thepurchase of equity shares. This situation demonstrates the importance of a strong organization toattract members and to sell a sufficient number of shares to make the venture viable.
Table 4. Percentage of the NGC/LLC: Start-up Capital by Source
Mean Maximum
Equity shares (membership fees) 53.4 100
State economic development grants 11.7 100
Local economic development loans 3.9 50
Private lender (e.g., banks, credit union, savings & loan) 2.6 73
Federal economic development grants 2.4 40
Local economic development grants 1.6 12
Local economic development tools (e.g., TIF district) 0.6 5
N=60
Source: IIRA Questionnaire for Cooperatives or Limited Liability Corporations 1999.
12
The NGCs and LLCs varied dramatically in the amount of total capital required. Amongrespondents to this question, the total capital requirement ranged from $17,500 to $24,000,000,with a mean of $7,820,850. As might have been expected, the cost per share also differed widely.Shares of equity ranged from a minimum of $2.00 to a maximum of $1,300,000, with a meancost per share of $44,119.
The entities surveyed also differed in size. Current memberships of these NGCs range from3 to 8,432 members. The mean number of members is 743 for 53 respondents to this question. Ofcourse, the number varies greatly depending upon the geographic area covered by the co-op andthe nature of its product(s).
The characteristics of the members differed as well. Five respondents noted that the averagefarm size of members was fewer than 100 acres, while two co-ops reported average member farmsizes of 101 to 200 acres. Co-ops producing fruit and vegetable products, nuts, and fisheries havemembers with smaller acreages due to the land intensive nature of these commodities. Oneresponded with 201 to 300; three returned an answer of 301 to 400; and five noted an averagefarm size of 401 to 500 acres. Finally, 16 groups reported over 500 acres per farm. These largerfarms are due to the nature of the commodity produced. Co-ops in these categories were mostlygrain and oilseed co-ops; however, beef farms were also among the larger sized groups due to theland required for pasture.
The geographic distribution of the members involved local groups as well as broad regions.Of 44 responses to a question on the area covered by the co-op, 41 percent had a membershipconcentrated within several counties, and 11 percent were statewide organizations. The groupswith a membership base covering several states comprised 36 percent while the remaining 11percent claimed other distributions. This variance can partially be explained by the local orregional nature of production of some commodities such as grapes or vegetables, while otherscan easily be produced in a much broader area such as wheat and corn. In addition, someperishable items must be grown in close proximity to one another for marketing purposes. On theother hand, some NGCs, such as U.S. Premium Beef, have members in an extremely diversegeographic area.
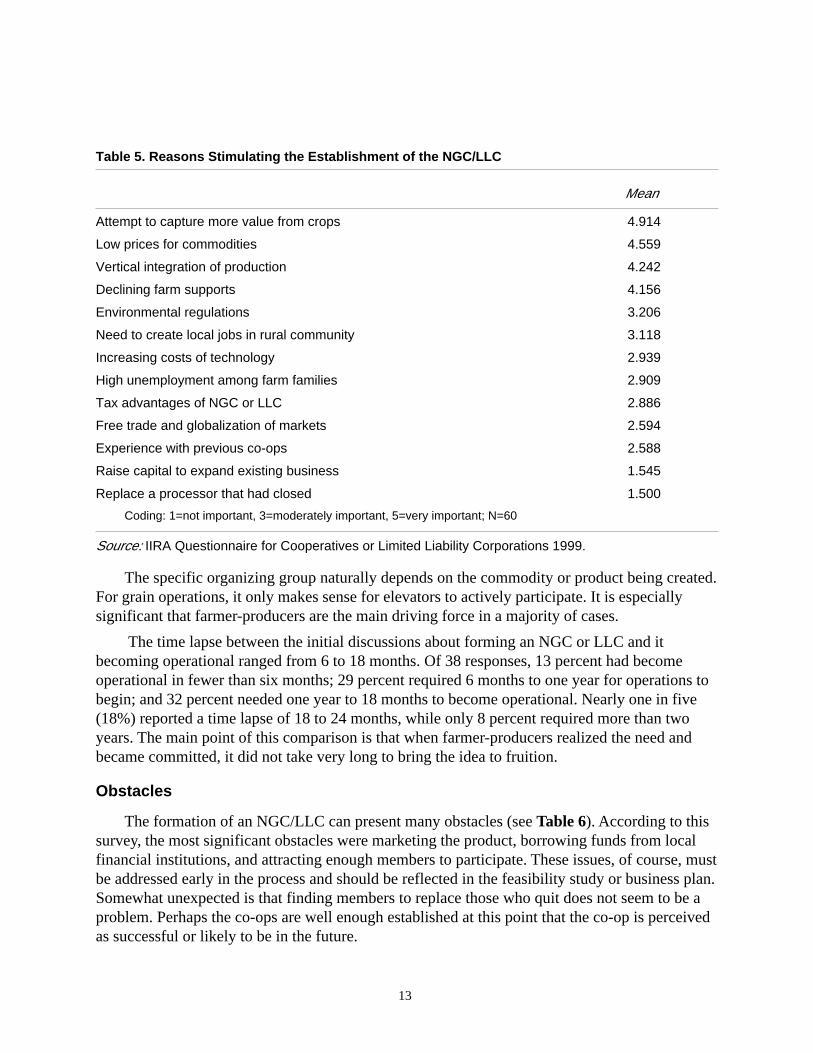
Survey results consistently show that capturing more of the added value of crops and lowcommodity prices are the dominant factors in NGC/LLC formation (see Table 5). Other issues ofnotable importance include vertical integration of production and declining farm supports.Surprisingly, replacement of an existing processor was not an important factor for the sample as awhole, although it provided the immediate stimulus for several. This comparison shows thewidely divergent reasons for NGCs and the fact that they can be used to address many concernsof producers.
The survey also asked who was instrumental in initiating discussions regarding theformation of the NGC/LLC. Fifty-seven responses to this question were received. Farmers-producers initiated the process in 86 percent of the cases. An existing grain elevator co-op wasresponsible in 21 percent of the responses. Local economic development groups were the drivingforce in 17 percent; investors seeking to enter new domestic markets initiated 2 percent; and theremaining 10 percent came from other sources.
13
Table 5. Reasons Stimulating the Establishment of the NGC/LLC
Mean
Attempt to capture more value from crops 4.914
Low prices for commodities 4.559
Vertical integration of production 4.242
Declining farm supports 4.156
Environmental regulations 3.206
Need to create local jobs in rural community 3.118
Increasing costs of technology 2.939
High unemployment among farm families 2.909
Tax advantages of NGC or LLC 2.886
Free trade and globalization of markets 2.594
Experience with previous co-ops 2.588
Raise capital to expand existing business 1.545
Replace a processor that had closed 1.500
Coding: 1=not important, 3=moderately important, 5=very important; N=60
Source: IIRA Questionnaire for Cooperatives or Limited Liability Corporations 1999.
The specific organizing group naturally depends on the commodity or product being created.For grain operations, it only makes sense for elevators to actively participate. It is especiallysignificant that farmer-producers are the main driving force in a majority of cases.
The time lapse between the initial discussions about forming an NGC or LLC and itbecoming operational ranged from 6 to 18 months. Of 38 responses, 13 percent had becomeoperational in fewer than six months; 29 percent required 6 months to one year for operations tobegin; and 32 percent needed one year to 18 months to become operational. Nearly one in five(18%) reported a time lapse of 18 to 24 months, while only 8 percent required more than twoyears. The main point of this comparison is that when farmer-producers realized the need andbecame committed, it did not take very long to bring the idea to fruition.
Obstacles
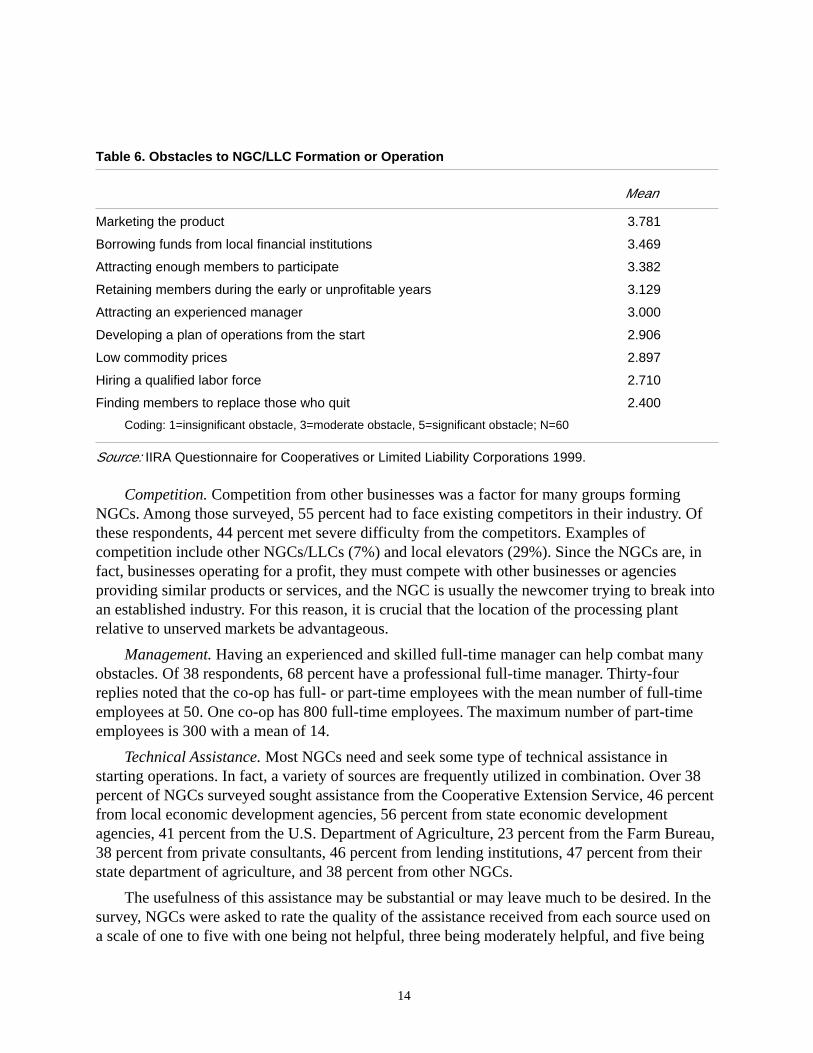
The formation of an NGC/LLC can present many obstacles (see Table 6). According to thissurvey, the most significant obstacles were marketing the product, borrowing funds from localfinancial institutions, and attracting enough members to participate. These issues, of course, mustbe addressed early in the process and should be reflected in the feasibility study or business plan.Somewhat unexpected is that finding members to replace those who quit does not seem to be aproblem. Perhaps the co-ops are well enough established at this point that the co-op is perceivedas successful or likely to be in the future.
14
Table 6. Obstacles to NGC/LLC Formation or Operation
Mean
Marketing the product 3.781
Borrowing funds from local financial institutions 3.469
Attracting enough members to participate 3.382
Retaining members during the early or unprofitable years 3.129
Attracting an experienced manager 3.000
Developing a plan of operations from the start 2.906
Low commodity prices 2.897
Hiring a qualified labor force 2.710
Finding members to replace those who quit 2.400
Coding: 1=insignificant obstacle, 3=moderate obstacle, 5=significant obstacle; N=60
Source: IIRA Questionnaire for Cooperatives or Limited Liability Corporations 1999.
Competition. Competition from other businesses was a factor for many groups formingNGCs. Among those surveyed, 55 percent had to face existing competitors in their industry. Ofthese respondents, 44 percent met severe difficulty from the competitors. Examples ofcompetition include other NGCs/LLCs (7%) and local elevators (29%). Since the NGCs are, infact, businesses operating for a profit, they must compete with other businesses or agenciesproviding similar products or services, and the NGC is usually the newcomer trying to break intoan established industry. For this reason, it is crucial that the location of the processing plantrelative to unserved markets be advantageous.
Management. Having an experienced and skilled full-time manager can help combat manyobstacles. Of 38 respondents, 68 percent have a professional full-time manager. Thirty-fourreplies noted that the co-op has full- or part-time employees with the mean number of full-timeemployees at 50. One co-op has 800 full-time employees. The maximum number of part-timeemployees is 300 with a mean of 14.
Technical Assistance. Most NGCs need and seek some type of technical assistance instarting operations. In fact, a variety of sources are frequently utilized in combination. Over 38percent of NGCs surveyed sought assistance from the Cooperative Extension Service, 46 percentfrom local economic development agencies, 56 percent from state economic developmentagencies, 41 percent from the U.S. Department of Agriculture, 23 percent from the Farm Bureau,38 percent from private consultants, 46 percent from lending institutions, 47 percent from theirstate department of agriculture, and 38 percent from other NGCs.
The usefulness of this assistance may be substantial or may leave much to be desired. In thesurvey, NGCs were asked to rate the quality of the assistance received from each source used ona scale of one to five with one being not helpful, three being moderately helpful, and five being
15
very helpful. Other NGCs received the highest rating with a mean of 3.818. State departments ofagriculture followed with a mean rating of 3.640. State economic development agencies andprivate consultants were ranked third with means of 3.500. Local economic developmentagencies (mean = 3.464), the USDA (mean = 3.346), lending institutions (mean = 3.333), and theCooperative Extension Service (mean = 3.192) all were rated better than average. The FarmBureau was rated slightly lower with a mean of 2.545.
Factors Contributing to Success
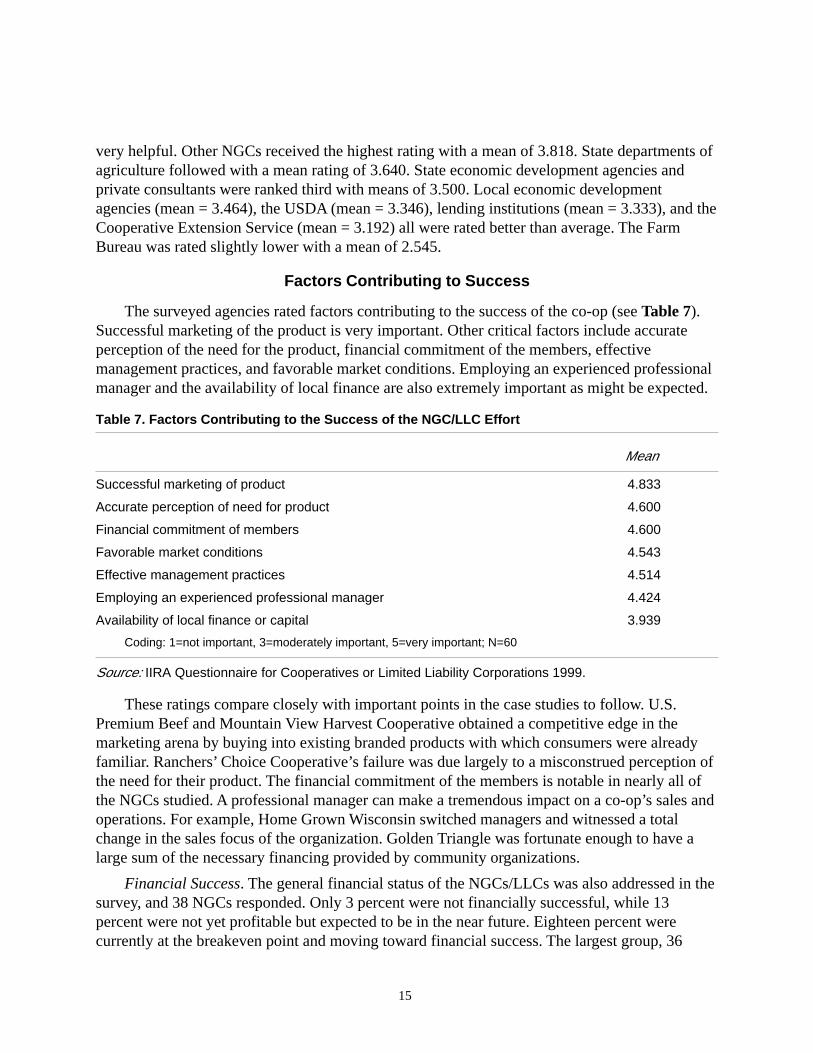
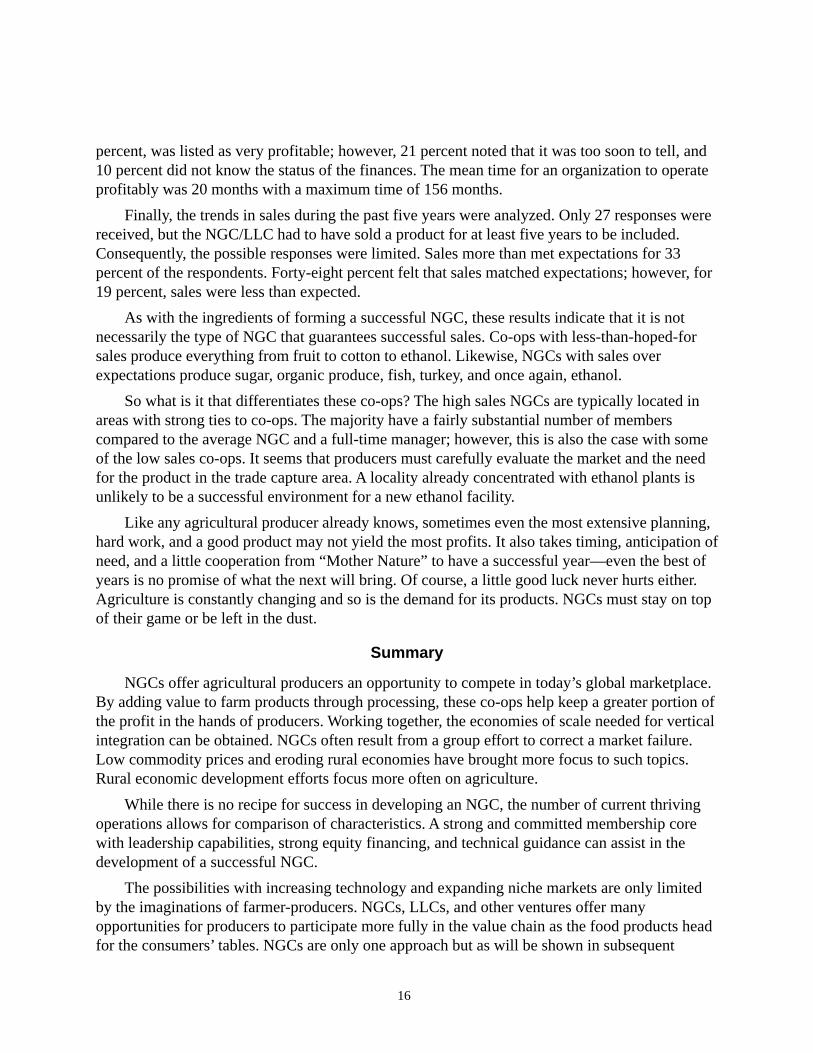
The surveyed agencies rated factors contributing to the success of the co-op (see Table 7).Successful marketing of the product is very important. Other critical factors include accurateperception of the need for the product, financial commitment of the members, effectivemanagement practices, and favorable market conditions. Employing an experienced professionalmanager and the availability of local finance are also extremely important as might be expected.
Table 7. Factors Contributing to the Success of the NGC/LLC Effort
Mean
Successful marketing of product 4.833
Accurate perception of need for product 4.600
Financial commitment of members 4.600
Favorable market conditions 4.543
Effective management practices 4.514
Employing an experienced professional manager 4.424
Availability of local finance or capital 3.939
Coding: 1=not important, 3=moderately important, 5=very important; N=60
Source: IIRA Questionnaire for Cooperatives or Limited Liability Corporations 1999.
These ratings compare closely with important points in the case studies to follow. U.S.Premium Beef and Mountain View Harvest Cooperative obtained a competitive edge in themarketing arena by buying into existing branded products with which consumers were alreadyfamiliar. Ranchers’ Choice Cooperative’s failure was due largely to a misconstrued perception ofthe need for their product. The financial commitment of the members is notable in nearly all ofthe NGCs studied. A professional manager can make a tremendous impact on a co-op’s sales andoperations. For example, Home Grown Wisconsin switched managers and witnessed a totalchange in the sales focus of the organization. Golden Triangle was fortunate enough to have alarge sum of the necessary financing provided by community organizations.
Financial Success. The general financial status of the NGCs/LLCs was also addressed in thesurvey, and 38 NGCs responded. Only 3 percent were not financially successful, while 13percent were not yet profitable but expected to be in the near future. Eighteen percent werecurrently at the breakeven point and moving toward financial success. The largest group, 36
16
percent, was listed as very profitable; however, 21 percent noted that it was too soon to tell, and10 percent did not know the status of the finances. The mean time for an organization to operateprofitably was 20 months with a maximum time of 156 months.
Finally, the trends in sales during the past five years were analyzed. Only 27 responses werereceived, but the NGC/LLC had to have sold a product for at least five years to be included.Consequently, the possible responses were limited. Sales more than met expectations for 33percent of the respondents. Forty-eight percent felt that sales matched expectations; however, for19 percent, sales were less than expected.
As with the ingredients of forming a successful NGC, these results indicate that it is notnecessarily the type of NGC that guarantees successful sales. Co-ops with less-than-hoped-forsales produce everything from fruit to cotton to ethanol. Likewise, NGCs with sales overexpectations produce sugar, organic produce, fish, turkey, and once again, ethanol.
So what is it that differentiates these co-ops? The high sales NGCs are typically located inareas with strong ties to co-ops. The majority have a fairly substantial number of memberscompared to the average NGC and a full-time manager; however, this is also the case with someof the low sales co-ops. It seems that producers must carefully evaluate the market and the needfor the product in the trade capture area. A locality already concentrated with ethanol plants isunlikely to be a successful environment for a new ethanol facility.
Like any agricultural producer already knows, sometimes even the most extensive planning,hard work, and a good product may not yield the most profits. It also takes timing, anticipation ofneed, and a little cooperation from “Mother Nature” to have a successful year—even the best ofyears is no promise of what the next will bring. Of course, a little good luck never hurts either.Agriculture is constantly changing and so is the demand for its products. NGCs must stay on topof their game or be left in the dust.
Summary
NGCs offer agricultural producers an opportunity to compete in today’s global marketplace.By adding value to farm products through processing, these co-ops help keep a greater portion ofthe profit in the hands of producers. Working together, the economies of scale needed for verticalintegration can be obtained. NGCs often result from a group effort to correct a market failure.Low commodity prices and eroding rural economies have brought more focus to such topics.Rural economic development efforts focus more often on agriculture.
While there is no recipe for success in developing an NGC, the number of current thrivingoperations allows for comparison of characteristics. A strong and committed membership corewith leadership capabilities, strong equity financing, and technical guidance can assist in thedevelopment of a successful NGC.
The possibilities with increasing technology and expanding niche markets are only limitedby the imaginations of farmer-producers. NGCs, LLCs, and other ventures offer manyopportunities for producers to participate more fully in the value chain as the food products headfor the consumers’ tables. NGCs are only one approach but as will be shown in subsequent
17
discussions, they have been very effective in helping producers organize in such a way that theycan capture a larger share of the food dollar. NGCs can truly help America’s rural populationenter the new millennium with hope for a better future.
References
Boehlje, M. 1996. Industrialization of agriculture: What are the implications? Choices (FirstQuarter): 30-33.
Bostrom, B. Potential pitfalls for new cooperatives. St. Paul: Minnesota Association ofCooperatives. Available online: <www.mncoop.org>.
Cook, M. 1995. The future of U.S. agricultural cooperatives: A neo-institutional approach.American Journal of Agricultural Economics 77(5): 1153-1159.
Cropp, R. 1996. New Generation Cooperatives defined. Presentation to New GenerationCooperatives Conference, University of Wisconsin Center for Cooperatives, Stevens Point,Wisconsin, April 1.
Illinois Institute for Rural Affairs (IIRA). 1999. IIRA questionnaire for cooperatives or limitedliability corporations. Macomb: IIRA.
Jacobs, Thomas. 1999. Tips for investing in co-op stocks. Successful Farming (Special Issue) 97(8): 17.
Merrett, C., M. Holmes, and J. Waner. 1999. Directory of New Generation Cooperatives.Macomb: IIRA.
Minnesota Association of Cooperatives. n.d. Financing new wave cooperative ventures. Availableonline: <www.mncoop.org>.
Stefanson, B., and M. Fulton. 1997. New Generation Co-operatives responding to changes inagriculture. Saskatoon, Canada: Centre for the Study of Co-operatives, University ofSaskatchewan.
Stefanson, B., M. Fulton, and A. Harris. 1995. New Generation Co-operatives: Rebuilding ruraleconomies. Saskatoon, Canada: Centre for the Study of Co-operatives, University ofSaskatchewan.
Thyfault, C. 1996. Developing New Generation Co-ops: Getting started on the path to success.Rural Cooperatives (July/August) 63(4): 26-30. Available online: <www.wisc.edu/uwcc/info/develngen.html>.

19
New Generation Cooperatives:A Short History of the Idea and the Enterprise1
by Igor Kotov
The development of cooperatives in the Upper Midwest from the 1970s through the 1990sprovides vivid examples of several new phenomena and trends. Among the most important arethe New Generation Cooperatives (NGCs). The term, used since the mid-1990s, was proposed bythe Centre for the Study of Cooperatives, University of Saskatchewan, Canada (Stefanson,Fulton, and Harris 1995, 1-7). These NGCs represent the newest wave of U.S. co-ops. Whileearlier generations had emerged in the 1900s, the 1920s, and again in the 1940s, NGCs haveseveral features that distinguish them from traditional farmers’ co-ops.
First, their major focus is value-added processing, which represents a departure from themain objective of commodity marketing held by predecessors. NGCs integrate the entire ventureof growing crops or feeding livestock, processing farmers’ products, and producing “ready forsale and consumption foods.” Building such an enterprise requires equity investment prior toestablishing delivery rights. Equity shares in NGCs are higher than in traditional co-ops, andeach share entitles a member to deliver one unit of a farm product (e.g., one bushel of wheat) tothe co-op and requires the co-op to take delivery of this product.
Thus, another major difference between traditional co-ops and NGCs is how theorganizations are capitalized. According to Bill Nelson, director of the North Dakota Center forCooperatives and an active promoter of NGCs, “In a new generation co-op you capitalize it inadvance and then you use it. In the traditional co-op, you used it and they retained some of theprofit margin to maintain the co-op” (Aksamit 1999, E2). Initially, it may be easier for a farmerto be a member of a traditional co-op since membership in a NGC has more obligations and ismore expensive.
Another feature distinguishing NGCs is restricted or limited membership. The number ofequity shares is limited by the requirements to build a plant or process a product. The admissionof members stops after all shares have been sold. On the other hand, NGCs preserve somefundamentals of traditional co-op structures. For example, decisions at the membership meetingsare made according to the principle “one member, one vote”; excess earnings are distributedamong members as dividends; and the board of directors is elected from the members by themembership.
While NGCs have grown in many states and involve livestock, grain, fruits, and vegetables,the Great Plains states were the early leaders in the development of NGCs and have some of themost successful ventures. This case study traces out the history of co-ops in these states and
1 This case study would have been impossible without help from the staff of the Quentin BurdockCenter for Cooperatives at the Agricultural Economics Department of the North Dakota State University:Bill Nelson, Frayne Olson, Kathy Doyle, and Ed Janzen.
20
provides insights into reasons why the NGCs became popular in the 1970s as well as the 1990s.The presentation has three main sections.
1. The adverse conditions faced by farmers as the processing industry grew andrepresented more and more of consumer spending for food items are discussed.
2. The shift to the co-op movement to control the cost of inputs and bring essentialservices to rural areas is presented along with the groundwork it laid for the NGCs tocome later.
3. An overview of several NGCs is presented to provide a backdrop for more extensivediscussions of specific NGCs to come later in this report.
History of Cooperatives
The concept and practices of co-ops in general and for NGCs in particular have a long andcomplicated history. Since the founding of the United States, and until the early 1900s,agriculture was the nation’s leading industry. A majority of the population was engaged infarming; at the same time, however, rural producers created the initial capital for industrialdevelopment in the United States.
The success of agriculture meant major changes for farmers’ in their work and lives.Farming ceased to be a primitive occupation as agricultural producers gained access totechnology previously enjoyed only by city residents. Concurrently, farming became less andless profitable compared with other industries and occupations because technology increasedproduction levels and reduced costs without an increase in commodity prices. This trend isvividly reflected in the so-called “cost-price squeeze.”
Farmers found the prices for their products lower compared with the nonfarm commoditiesthey had to buy. In 1923, Secretary of Agriculture Henry A. Wallace pointed out that a suit ofclothes which cost a North Dakota farmer 21 bushels of wheat in 1913 cost 31 bushels ten yearslater. Using the purchasing power of several basic farm commodities in 1913 as 100, the farmprice index had dropped to 75 in 1921 (Fite and Reese 1965, 559).
Another problem was the obvious disparity in distribution of incomes resulting from thesales of final food commodities among those who produced, processed, delivered, and sold thosegoods. In 1910, $.15 of every dollar generated in agriculture went to those who delivered inputsnecessary for farmers—seeds, equipment, fertilizers, and so on. The farmer’s share was $.41, andan additional $.44 was spent on transportation, processing, wholesale, and retail businesses. By1990, however, the farmer’s share had shrunk to $.09 while the agricultural suppliers received$.24, and the processing and marketing share rose to $.67 (Nadeau and Thompson 1996, 15).
Consequently, farming is no longer as attractive a business. This negative trend has been feltespecially in the Upper Midwest states whose economies traditionally have relied heavily onagriculture. The number of farms and the rural population have steadily declined during the pastcentury.
21
The declines in agriculture are not just an economic change; they are the phasing out of acornerstone of American life. Noted Arthur Capper (1931), a founding father of the 1922 Capper-Volstead Act, “Farming is more than a business. It is more than an art; it is a philosophy of life”(52). The Capper-Volstead Act almost completely exempted farmers’ co-ops from the antitrustlaws and gave them substantial privileges compared with noncooperative big businesses.
The 20th century farmer’s problem appears to be relatively simple. Agricultural producersshould seek a bigger share of the consumer dollar and move from selling commodities to sellingingredients or branded products. That goal is not easily realized, however, and since the late1800s, there have been many attempts to find a way out of the above-mentioned “cost-pricesqueeze” and income disparity. Political, economical, cultural, and technological strategies weretried, but mostly with little success.
Political Action
Decisive steps were taken by farmers in the Upper Midwest using the vigorous efforts of theNonpartisan League, one of the most famous of the U.S. farmers’ organizations. Thegrandparents and great grandparents of many current North Dakota farmers were active in theLeague from 1915 to 1922. According to J. H. Worst, former president of the then North DakotaAgricultural College in Fargo, in 1916, farmers in the state lost $55 million because of unfairpractices by middlemen in the grain trade (Morlan 1955, 3).
Farmers listened intently to presentations at numerous Nonpartisan League meetings, andthose explanations may be timeless. The Nonpartisan League spokesman said, ““Here is a dollar.For every dollar worth of stuff you raise on this farm you get just 46 cents.’ The speaker countedout one quarter, two dimes and a penny. ‘This is what you get. But here—laying in another pilethe other quarter, dime, three nickels, and four pennies—is what the other fellow gets—thefellow who didn’t put in a day plowing and planting and harvesting. Now what you want is moreof this pile. You want your share of that dollar the consumer pays for what you raise bybackbreaking work. The other fellow gobbles this because he is organized. He controls themarket—he makes the laws—he gets the money’” (Morlan 1955, 30).
A majority of leaders in the Nonpartisan League preferred political action to solve farmers’problems and they succeeded in state and federal elections. Nonpartisan League officers wereinstrumental in establishing several public elevators and mills in the state which, to some degree,eliminated the disadvantages created by the efforts of middlemen. These efforts were createdfrom the top, however; farmers themselves didn’t participate in the enterprises with theirproperty. Consequently, when the economy improved after 1922, prices proposed by privatebuyers of farm commodities increased and farmers ceased to support the Nonpartisan League’sinitiatives. Instead, they turned to their “main foe”—the notorious middleman.
Development of Cooperatives
Farmers’ co-ops offered another solution to the food consumer’s dollar share problem. In thelate 1800s, agricultural producers began to capture additional links in the “farmer-consumer
22
chain” by creating value-added processing co-op. The first enterprises of this type were co-opcreameries that processed farmers’ milk into cream, butter, and cheese. The profits were sharedamong farmers.
The first co-op creamery in Minnesota was organized in 1890. By the early 1920s, theMinnesota Cooperative Creamers’ Association had been founded as a sales and serviceassociation. It helped members to manufacture the highest quality butter, to standardize it incomposition and quality, and to secure the lowest possible freight rates to haul the butter tomarket. It also created an increased demand and a higher price through advertising to developnew markets. Co-op creameries in Minnesota proved their profitability for farmer-members.Throughout the 1920s, the co-op creameries paid farmers $.05-$.10 more per pound of butterfatthan was paid in communities without co-op creameries (McGuire 1925, 32-36). Thus, these co-ops added value to the farmers’ product, in this case milk, and brought a certain part of thatadded value to milk producers, giving them a larger share of the consumer’s dollar.
Another example of the success for a co-op creamery success in the Upper Midwest is inNorth Dakota. The oldest co-op creamery in the state was started in 1908, but most wereorganized in the late 1920s. They successfully survived during the Depression and the drought ofthe 1930s (DAL 1943, 3-6). By the end of the decade, North Dakota co-op creameries reportedfair financial returns, which improved even more during subsequent decades.
In 1943, co-op creameries in North Dakota were second among other co-ops with theaverage business transaction priced at $655 per stockholder. Co-op elevators led the co-opmovement with stock priced at $1,609 per share (DAL 1943, 11, 8). The co-op creameriesprovided convenient investments. The latter proved to be attractive for large food corporations aswell and resulted in the growth of competition that led to co-op creameries being squeezed out ofbusiness during the 1950-1960s.
The idea of a value-added co-op business or of vertical integration in agriculture representedby co-ops has been actively promoted by farm activists and political leaders since the 1920s.Many noted that the early American farms were highly integrated since many foods and othergoods were homemade. Until farmers had a surplus beyond their own needs, they had nothing tosell to improve their standard of living.
Industrialization changed the situation. Farming became primarily production agriculture,while processing, marketing, and farm services were provided by others for a profit. Foodproduction turned into a new type of industry, with successful corporations processing andmarketing agricultural commodities. The question was (and still is), “will agriculture beintegrated by and for the benefit of the farmers, or for the benefit of suppliers, processors, anddistributors at the expense of farmers?”
Sugar beet growers in the Red River Valley first attempted to create processing facilities inthe early 1920s through an initiative by H. A. Douglas, president of the privately ownedMinnesota Sugar. By 1923, the total acreage for sugar beets had grown sufficiently and hedeclared that his company would spend $1 million on a beet processing plant. This sum was not
23
enough for the construction, however. Douglas proposed that farmers raise another half milliondollars in stock capital.
By early 1924, commercial clubs in Grand Forks, North Dakota, and the surrounding areahad sold stock worth $300,000 and borrowed another $100,000. Soon the Red River SugarCompany was established to manage construction of the new plant. As a stock enterprise, itmight be seen as a first attempt to create farmer-owned processing facilities for their crops.
Soon Douglas received a proposal from a much larger company, the American Beet SugarCompany (later it was renamed American Crystal Company), to sell the company’s existingplants as well as all the assets of the nascent Red River Sugar Company for almost $3.5 million.The deal was completed in March 1925. The new owner managed the construction of the sugarbeet processing plant in Grand Forks, which was completed by the fall of 1926 (Shoptaugh 1997,18-20). The money raised by farmers and other potential stockholders was returned because thebeet growers had not created a co-op; rather, they had obtained excellent facilities and profitablerelations with a private business. These relations remained good until the 1960s.
During the Great Depression, several federal acts were passed containing substantialmeasures that provided financial support to farmers. Such support was furnished to sugar beetgrowers by the Jones-Costigan Act (the Sugar Act) signed by President Franklin D. Roosevelt inMay 1934. Farmers received federal payments for each unit of beets based on market prices thatsometimes were extremely low. The majority of farmers favored such supports, but many, as wellas officers in the co-ops, understood not only the usefulness of these payments, but also thepossible hazards. H. J. Beernink, president of the National Council of Farmers Cooperatives,noted in 1958, “The farmer, working through his cooperative in an integrated service, has achance to be competitive in today’s business world. . . .The controversial government pricesupport program is nothing more than a contract to buy farm commodities at a stipulated price”(3).
Role of Price Supports
The history of North Dakota agriculture shows that the government’s price support systemcannot stop negative drifts in commodity prices. Unfortunately, during the 1960s and 1970s,most of the efforts of North Dakota farm organizations were directed towards obtaining infusionsof state and federal funds.
Since the early 1950s, national farm referendums were held to assess the public’s attituderegarding the federal price support system. North Dakota farmers supported the system moreoften than the average American farmer in these surveys. For instance, during the 1957referendum, 98 percent of North Dakota farmers voted “yes” for a federal government pricesupport at 75 percent of parity. This meant farmers would receive three-quarters of the actualcost of their crops from the federal government. Nationally, only 86 percent of farmers voted infavor of the supports (Conrad and Conrad 1976, 183). The same attitudes were reflected in thefollowing decade. Strengthening the government’s financial support for farmers was a focus oflongtime North Dakota Senator, Quentin Burdock, who received overwhelming support fromfarmers during his many political campaigns.
24
Growing federal support for North Dakota farmers did not stop the negative financial trends,however. From 1959-1964, approximately 6,000 agricultural producers in the state quit farming(Conrad and Conrad 1976, 217). Moreover, there is evidence to support the hypothesis that thefinancial support started to undermine farmers’ incentives to be self-reliant and self-starters.
Governmental attitudes toward agriculture changed. The costly Vietnam War and NASA’sexpensive mission to reach the moon pressured the federal budget, and price supports haddropped to 65 percent of parity by December 1970. A majority of North Dakota farmers hadstopped buying farm machinery suggesting that farmers had begun to rely more and more ongovernmental support payments. The situation for American farmers, especially North Dakotawheat growers, did change for the better after 1972, when the Soviet Union started buying hugeamounts of American grain; however, these purchases were curtailed in the late 1970s.
New Generation Cooperative Successes
By contrast, other developments in North Dakota in the 1960s had brought farmers newhope. Alternative approaches to address farmers’ financial problems started to emerge amongRed River Valley sugar beet growers. By 1960, they were satisfied with their contracts for sugarbeet deliveries to the privately owned American Crystal Company, one of the largest sugarproducers in the world.
But a few years later, beet growers feared American Crystal’s business practices might behampered by the composition of its board of directors. A large block of the American Crystalstock was held by the Boettcher family in Denver, Colorado. This family controlled theBoettcher Foundation, a large charitable organization concerned with philanthropy within theenvirons of Denver. Some of American Crystal’s corporate profits were being transferred to theBoettcher Foundation for various causes. While legal, these transfers were contrary to the bestinterests of farmers who wanted profits to be invested in the sugar business (Shoptaugh 1997,129-130). This situation seemed to indicate that full reliance on private business, even thoughsuccessful and profitable for farmers, had potential pitfalls. Farmers depend heavily on such abusiness because it is a main foundation for their economy. On the contrary, private investorsusually have more options than farmers and can easily reject these interests.
The Red River Valley farmers/beet growers did not seek government intervention but,instead, took action to buy the processing plant. A prominent expert on remuneration offinancially ill businesses, Richard Barry (1981) of Fargo, raised the NGC idea:
In the fall of 1963 one day I asked a farmer from the Wahpeton-Breckenridge area,which did not have a refinery outlet, about an idea I had to raise millions of dollars inequity money. He said he’d be happy to invest approximately $1.00 per ton in equitycapital each year for ten years if I could teach him and other farmers how, as a group,they could own their own sugar factory. (29)
By the fall of 1964, 2,000 farmers in the Red River Valley organized development groups toobtain new factories. They were not growing sugar beets at that time, but they would consider
25
converting 10-15 percent of their acreage to sugar beet production. Their major obstacle wasattracting companies with the know-how and sufficient capital to build additional plants(Aksamit 1999, E2). Development of a value-added co-op owned by Red River Valley growersstarted in 1967, but it took six years to reach fruition. The most prominent role in this case wasplayed by Aldrich Bloomquist of Moorhead, who had initiated the effort that resulted in growerspurchasing the investor-owned sugar company.
Farmers formally acquired the American Crystal Sugar Company from the Boettchers onFebruary 21, 1973, with a transfer of ownership to the producers’ organization, Crystal GrowersCorporation. Growers raised $20 million of the equity capital at the rate of $100 per acre. Furtherfinancing came from the St. Paul Bank for Cooperatives, a bank specializing in granting credit tocooperative enterprises (Egerstrom 1994, 148-49). Crystal Growers Corporation provided amodel for future NGCs, started by farmers to achieve a better price for commodities and morecontrol of their businesses.
About the same time, that the American Crystal co-op was being formed, two other groupsof farmers were developing plans to obtain processing facilities to be operated as co-ops. InWahpeton, North Dakota, new sugar beet growers were considering entry into the processingindustry by constructing a facility. In 1974, Minn-Dak Farmers Cooperative began operatingwith the newest sugar beet processing plant in the country. Like the American Crystal efforts, theWahpeton group secured commitments from farmers to invest $200 for every acre planted,giving them one share of stock for every acre committed to the co-op. Additional debt financingwas supplied by St. Paul’s Bank for Cooperatives after growers signed a 15-year agreement withthe co-op.
Near Renville, Minnesota, sugar beets were planted sparingly and nearly abandoned in 1971when then privately-owned American Crystal closed the processing plant in Chaska. “We had theequipment and the know-how, but not the processing facility,” said Larry Johnson, a local beetfarmer. He and other members of a local growers’ association persuaded neighboring farmers toadd sugar beets to their operations. For every $200 per acre invested, growers received one shareof stock in the co-op. By the spring of 1975, 50,000 acres of sugar beets were sprouting and soonthe Southern Minnesota Beet Sugar Cooperative operated its processing facility (Jacobs 1990, 6).
This NGC, which was incorporated in 1975, did not do as well as the American Crystal co-op. Because of substantial losses and ineffective management, the banks foreclosed on the co-op’s loan in 1978. The banks had two choices: (1) to sell off the assets, or (2) to sell the plantback to the farmers at a greatly reduced price. The banks chose the latter. Consequently, thefarmers became the real owners of the plant, and the co-op got a second start. The co-op has beenprofitable ever since (Nadeau and Thompson 1996, 18).
The 1980s brought a lull in co-op development in the Upper Midwest. The situation mayhave resulted from increasing economic difficulties and sharp budget cuts to agriculture broughtabout by policies of the Reagan administration and the national recession. By the end of thedecade, an obvious economic and, to a certain degree, social decline was evident in NorthDakota. The state ended the 1980s with 634,000 people, down 18,000 from 1970. Most of the
26
loss was in the rural areas (Nillsson 1997, 32). It was clear that something new and effective wasneeded to help North Dakota agriculture.
Even during those difficult times, however, the sugar beet processing facilities of threevalue-added co-ops—American Crystal Sugar Company, Minn-Dak Farmers Cooperative, andSouthern Minnesota Beet Sugar Cooperative—helped provide jobs and economic stability formany small towns in the region. While the downturn in the farm economy during the mid-1980sadversely affected many agriculturally based communities of rural Minnesota and North Dakota,the sugar beet industry remained strong and mitigated the effects of the farm downturn bypumping badly needed dollars into the rural economy. In six of the seven communities with asugar beet processing facility, the co-ops were the largest employers and taxpayers (Jacobs 1990,4-5).
The business culture during the first half of the 1990s in the Upper Great Plains has beencalled “cooperative fever” because of how rapidly value-added co-ops were being created,developed, and distributed. By the end of the decade, 20 NGCs were operational in UpperMidwestern states. Thus far, a majority of them are operating successfully.
The overall impact of the co-ops on many local communities has been significant.Successful NGCs not only improve incomes for farmers, they generate jobs for the nonfarmpopulation too. The number of nonfarm employees hired by an NGC varies. However, theSunrise Energy Cooperative in Blairstown, Iowa, has hired 14 full-time nonfarm workers (Lucas1999). Other cooperatives such as Golden Oval Eggs in Renville, Minnesota, have hired over 60full-time employees (Persson 1999). In addition to generating higher farm incomes and nonfarmjobs, NGCs contribute to the local tax base and provide job opportunities for young, educatedpeople.
NGCs in the Upper Midwest process most commodities produced by farmers: wheat,soybeans, sugar beets, meat, poultry, and dairy products. They also produce different products aswell—from pasta and cheese to ethanol. The following success stories may motivate otheragricultural producers to form similar co-op structures.
Pasta GrowersOne of the most successful of the value-added co-ops operating in the Upper Midwest is the
Dakota Growers Pasta Company (DGPC), owned by approximately 1,000 wheat farmers fromNorth Dakota, western Minnesota, and eastern Montana. The NGC has a state-of-the-art, $40million pasta factory outside of Carrington, North Dakota. Groundbreaking for the plant washeld July 9, 1992, and it began operation in November 1993. In December 1993, Pasta Growersbrand pasta products arrived on store shelves across North Dakota. In the coming months, theywere distributed nationally. The plant created 180 new jobs in Carrington. All of the wheatprocessed at the plant is provided by farmer-members. According to Jack Dalrymple, chairmanof the board of directors, the impetus to build the plant came from a steering committee formedby the U.S. Durum Growers Association.
27
In 1995, DGPC produced about 100 million pounds of pasta in 50 different varieties underits own brand. After only its second year of operation, the co-op generated a profit of $.46 pershare, distributing $.31 per share in cash to farmer shareholders and retaining the reminder foroperating reserves. The farmer-members not only received the current market price for theDurham wheat sold to the co-op, but they also earned a 20 percent annual return on their co-opinvestment.
In early 1996, the co-op issued new equity stock in order to finance a $5 million expansionto double the milling capacity of the plant. The wheat growers had so much confidence in theirco-op that sales of stock far exceeded the stock sales target (Nadeau and Thompson 1996, 19). In1997, DGPC doubled its milling and pasta production capacity, and this year the co-op acquiredPrimo Piatto, Inc., a pasta processing company with two plants in the Minneapolis area. DGPC isnow constructing a $10 million mill next to the Carrington mill to keep pace with its increasedprocessing demands (Sorenson 1998, 9). DGPC shares, originally offered at $3.85 each,currently sell for $10 (Tonneson 1999, 8). As Randall Torgerson (1994), assistant administratorof the U.S. Department of Agriculture Cooperative Services, noted, “it had been the success ofthe pasta growers cooperative which breathed new life into other cooperative initiatives in NorthDakota, and generated the above-mentioned co-op fever” (12).
Heartland Grain FuelsFounded in 1993, Heartland Grain Fuels is a joint venture involving two co-ops—South
Dakota Wheat Growers and Farmland Industries—that operates the largest ethanol operation inSouth Dakota. Its Aberdeen plant processes 6,900 bushels of corn a day, seven days a week,producing more than 6 million gallons of ethanol annually. In addition to providing a new marketfor corn, the plant created 23 jobs and an $800,000 payroll in the community (Parsons 1995, 6).
Certainly, the success of NGCs is not guaranteed from the start. There are examples ofunsuccessful NGCs that had to quit operations after being unable to meet market realities andmembers’ needs. The next section expands on this cautionary note to describe some NGCfailures and the characteristics of NGC member and nonmembers farmers.
Evaluating Success and Failure Among NGCs
Northern Lights Vegetable Cooperative of Brooten, Minnesota, formed by 65 vegetableproducers as part of a joint venture with privately owned Patterson Frozen Foods, operated afrozen pea and sweet corn processing plant. In May 1998, the co-op folded and sold the plant toLakeside Foods, a corporation based in Manitowoc, Wisconsin, that processes and cans foodproducts for sale to private label companies.
Some of the co-ops’ former members chose individual production contracts with LakesideSnoFlake Products Cooperative in Oslo, Minnesota (Sorenson 1998, 11). This co-op wentbankrupt in the fall of 1997, a year after 60 producers bought a plant in Oslo, to process carrots.Under pressure from a depressed market, the co-op tried to combine its efforts with similardeveloping ventures in Hillsboro, Hatton, and Casselton, North Dakota, but without success.
28
Board member Tom Osowski identified the main downfall as haste: “We hurried too much. Butmaybe seeing our mistakes will make others more cautious” (Sorenson 1998, 12).
These and other NGC failures have not spread negative attitudes about co-ops, however.Farmers understand the value of co-ops for them, while at the same time realize that a co-op isnot in itself the panacea for their problems. Solutions may involve good, profitable, fairlymanaged co-ops as well as completely different ones. As a United Spring Wheat Growers co-opmember, Montana farmer Larry Johnson said, “You need capital to make the business work.Farmers who form these closed co-ops are able to gather huge amounts of cash and hire thepeople necessary to form the processing side of the business.” (Getting together: Farm forumroundtable 1999, 17). At the same time, as Steve Hofing, agriculture analyst of Savoy, Illinois,noted about the possibilities of NGCs, “There isn’t going to be a windfall. The key is todetermine what specifications your customer needs and whether you can serve them” (17).
Sociological investigations that have included interviews with leaders and members of theNGCs document the stability and usefulness of this business structure. Kibbe (1996) and laterOlson, Kibbe, and Olson (1998, 4) of North Dakota State University, surveyed more than 500North Dakota farmers using a questionnaire sent to members and nonmembers of value-addedco-ops. Nonmembers more strongly agreed with statements critical of the NGCs such as“Investments required from the farmers for joining value-added co-op are too high for them”;“contract co-ops benefit only the wealthy producers”; “delivery contracts are too strict”; “farmersshould not own food companies”; “the value-added contract co-ops offer inferior qualityproducts.” Nonmembers were also less confident regarding the contract co-ops’ abilities tocompete successfully with investor-owned firms (81-82). These findings indicate thatparticipation in value-added co-ops helps farmers overcome a prejudice against co-ops. Theeducational level of NGC members participating in the survey was higher than the nonmembers.Approximately 41 percent of the co-op members had a college degree compared with 18 percentof nonmembers (Olson, Kibbe, and Goreham 1998, 2).
For this report, a brief investigation regarding attitudes of Upper Midwest NGC leaders wasundertaken. A short questionnaire was given to CEOs and board members of approximately 20NGCs during an executive training program for leaders of New Generation ProcessingCooperatives in March 1999 in Alexandria, Minnesota. Nineteen answer sheets were returned.Most respondents had farmed and belonged to the NGCs for more than ten years. Almost half ofthem noted general unfavorable economic changes for farmers as the main reason for startingco-ops. One-third of respondents reported that private owners could not run the processing plantssuccessfully so co-ops were formed. All the respondents were convinced that the NGCs hadproven advantageous for their members. Only 10 percent of the respondents noted that NGCmembers would leave the co-op if market prices proposed by private buyers started risingsubstantially.
Recent developments in the Upper Great Plains confirm the popularity of value-addedco-ops among farmers. One example is activity in the small South Dakota community of Pollock.The farmers decided to organize the Pollock Area Dairy Cooperative, which is designed not onlyto market milk but also to run a local cheese plant that is currently at less-than-full capacity. Both
29
the residents of Pollock and surrounding farmers are interested in the co-op. The co-op willcreate additional jobs and provide farmers with an opportunity to sell milk more profitably andreceive additional money from the cheese plant. The initial steps show hope for the future of theco-op. An informational meeting held a year ago brought $17,000 in seed money to start theco-op. The city then received a credit of $30,000 to the would-be co-op to purchase the site forthe dairy facility (Johnson 1999, 6b).
Conclusions
The future of the NGC movement depends on the future of agriculture in America andthroughout the world. On the eve of the new millennium, agricultural techniques have comeclose to those of big industries (Saxowsky and Duncan 1998, 5-10). This means that technically,as well as economically, agribusiness may need to be run more like big industries. More successis expected when the entire chain of growing, processing to the stage of ready-for-consumptionproduct, and marketing is integrated into a single unit—not only technologically but alsoeconomically. This means vertical integration will become the norm for farmers’ co-ops. Even“old generation,” traditional agricultural co-ops are trying more vertical integration in foodprocessing. Greater integration will provide co-ops with additional markets for products, willhopefully enhance their share of the consumer dollar, and will help them maintain the qualitythat leads to consumer acceptability of produced goods. One of the problems that may bedifficult to solve in the near future is vertical integration of farmers’ co-ops into food retailing.The extreme competitiveness of this business will make it hard for co-ops.
Many co-op leaders in the 1990s were well-aware of the necessity to develop value-addedco-ops. As Jack Gherty, Land O’Lakes President, said, “We are operating in the most competitiveand value-oriented economy in history. To be successful in this economy, businessorganizations—and cooperatives are business organizations—must continually improve theirability to add value to their products, services and people” (Adding value essential forcooperative survival 1993, 11). In the case of successful value-added co-ops, the benefits forfarmers are clear: a share in processing earnings and facility ownership, improved market entryand development, access to additional production know-how, genetic sourcing, enhancedcontract longevity, the availability of additional financial options, and increased insulation frommarket variations.
Farmers have two alternatives: (1) they can find profitable agreements with food-processingand retailing investor-owned corporations; however, that means the co-op has to surrender somecontrol to so-called “big business”; or (2) connected with the development of an NGC. Farmersand residents in rural communities may be motivated first by a desire to preserve the social andeconomic fabric of rural America rather than merely to make money. That may be the coreprinciple driving the NGC movement to further success in the next millennium.
30
Bibliography
Adding value essential for cooperative survival. 1993. Farmer Cooperatives (October): 10-14.
Aksamit, Nichole. 1999. Spirit of cooperation endures. Fargo Forum (Sunday, March 14): E2.
Barry, R. H. 1981. Success From Within. Fargo, ND: Investors Management Foundation, Inc.
Beernink, N. J. 1958. Farmer cooperatives in today’s business world. In Blue Book NationalCouncil of Farmer Cooperatives edited by The American Institute of Cooperation.Washington, DC: National Council of Farmer Cooperatives.
Capper, A. 1931. Cooperation: The road to success. In American Cooperation, 52-55.Washington DC: The American Institute of Cooperation.
Conrad, Charles, and Joyce Conrad. 1976. 50 years North Dakota Farmers Union. Fargo: NorthDakota Farmers Union.
Department of Agriculture and Labor (DAL). 1943, January. North Dakota Division ofCooperatives. (Bulletin No. 42).
Egerstrom, Lee. 1994. Make No Small Plans: A Cooperative Revival for Rural America.Rochester, MN: Lone Oak Press.
Fite, G. C., and J. E. Reese. 1965. An Economic History of the United States. New York:Houghton Mifflin Company.
Getting together: Farm forum roundtable. 1999. Farm Forum (Spring): 17-19.
Jacobs, J. 1990. Sugar beet cooperatives major contributors to economics of Upper MidwestCommunities. Farmer Cooperatives (February): 4-6.
Johnson, A. 1999. Community Looks to Dairy Operation for Economic Development. Farm andRanch Guide (February 12): 6b.
Kibbe, T. F. 1996. Value-Adding Contract Cooperatives: Investors and Non-InvestorsDifferences. A Thesis for the Degree of Master of Science, Department of Sociology/Anthropology, North Dakota State University, Fargo.
Lucas, Marlene. 1999. Sunrise energy taking deliveries. Cedar Rapids Gazette (September 15).Online version <http://www.gazetteonline.com/agri/ag741.htm>.
McGuire, A. J. 1925. Development of the Cooperative Creamery in Minnesota. In AmericanCooperation 1925, 32-40. Vol. 2. Washington, DC: The American Institute of Cooperation.
Morlan, R. L. 1955. Political Prairie Fire: The Nonpartisan League 1915-1922. Minneapolis,MN: University of Minnesota Press.
Nadeau, E. G., and David J. Thompson. 1996. Cooperation Works! Rochester, MN: Lone OakPress.
Nillsson, J. 1997. New Generation Farmer Co-ops. International Cooperative Alliance Review 90(1): 32-38.
31
Olson, Frayne, Theron Kibbe, and Gary Goreham. 1998. New Generation CooperativeMembership: How Do Members Differ from Nonmembers? NDSU Extension Service,Extension Report No. 40, March. Fargo: North Dakota State University. Available online<http://www.ext.nodak.edu/extpubs/agecon/er/er40w.htm>.
Parsons, C. 1995. Making dust: New alliances explore the frontiers of cooperation. FarmerCooperatives (June): 4-7.
Patrie, W. 1998. Creating “Co-op Fever.” A Rural Developer’s Guide To Forming Cooperatives(Service Report 54). Washington, DC: U.S. Department Of Agriculture, Rural Business–Cooperative Service.
Persson, Dana. 1999. Are you ready for the 21st century? Presentation at Conference onInnovative Approaches to Agriculture, Collinsville, Illinois, December 2, sponsored by theIllinois Institute for Rural Affairs and the Illinois Council on Food and AgriculturalResearch.
Saxowsky, D. M., and M. R. Duncan. 1998. Understanding Agriculture’s Transition Into The21st Century (Agricultural Economics Miscellaneous Report No. 181). Fargo: North DakotaState University, Department of Agricultural Economics.
Shoptaugh, T. L. 1997. Roots of Success: History of the Red River Valley Sugar Beet Growers.Fargo: Institute for Regional Studies, North Dakota State University.
Sorensen, S. 1998. Low commodity prices can benefit value-added ag. Prairie Grains(December): 8-12.
Stefanson, B., M. Fulton, and A. Harris. 1995. New Generation Cooperatives: Rebuilding RuralEconomies. Saskatoon, Saskatchewan, Canada: Centre for the Study of Cooperatives,University of Saskatchewan.
Tonneson, L. 1999. Are we rich yet? The Farmer/Dakota Farmer (January): 8-12.
Torgerson, R. 1994. Co-op Fever: Cooperative renaissance blooming on Northern Plains. FarmerCooperatives (September): 12-14.

33
Golden Oval
by Patricia Buschette
For decades, Renville, Minnesota was a community where egg production was a matter ofhousing 200 laying hens in a small frame chicken house. Farmers brought cases of eggs to townto the local egg buyer or co-op, their check often used in the local grocery store. However thatpicture of egg production in Renville, Minnesota, has changed. Since 1996, sleek silver insulatedtankers with a distinctive yellow and blue Golden Oval logo travel from the Golden Oval plant inRenville, to locations as far as Canada, delivering liquid eggs to Golden Oval customers. Howdid this change happen? Quite simply, the world changed, and those who recognized change andits potential envisioned a new future.
History of the Renville Area
Renville, Minnesota, is in Renville County, 120 miles west of the Minneapolis-St. Paulmetropolitan area. Frank Svoboda (1976) in Looking Back: A History of Agriculture in RenvilleCounty, describes Renville County as a rolling countryside with a “rich, black clay loam” (22).The economic base of the City of Renville, organized in 1878, has always been agriculture. Foryears, farmers raised crops such as corn, flax, oats, wheat, and alfalfa. Later, flax and oats werephased out and soybeans were introduced in the 1950s. Much of this production went into on-farm animal production. Farm sizes changed as those traditionally ranging in size from 80-160acres enlarged. Larger farm machinery had made it possible for producers to operate larger tracts.The decreased farm population and regionalized services had a negative impact on the MainStreet economy and businesses suffered.
The economic well-being of the community, has traditionally paralleled the fortunes of thefarm economy. The city had grown since 1930 when residents numbered 1,004. The generalgrowth until the mid-1980s stopped when a drop in the health of the agricultural economy andfarm expansion adversely affected the local economy. Main Street mirrored the effects of thecountryside. Growth returned in the 1990s, however, and the population of 1,315 in 1990 hadgrown to 1,374 in 1997.
Renville is located on the Twin City and Western Railroad, a short line from the Twin Citiesto the western edge of Minnesota. Formerly the Milwaukee Road and the Soo Line, the railroadhas hauled the production of area farms to the centers of processing and further transportation.Farmers sold grain to the local co-op elevator, with future profits enjoyed by those who refinedand processed farm commodities to develop a product closer to the tables of American andInternational consumers.
History of Traditional Cooperatives
Minnesota’s lead in the development and participation in cooperatives has been recognizedthroughout the United States. This was not an unlikely development, since early settlers from
34
Norway, Sweden, Denmark, and Finland believed cooperative effort to be a way of life. Fromthis understanding of the value of shared resources, traditional co-ops were formed. According toa Minnesota Experiment Station bulletin released in 1915, 614 creameries, 270 grain elevators,and 115 livestock shipping associations operated in Minnesota at that time. Co-op organizationsprovided stores, fire insurance, and telephone companies. Renville residents had organized moreco-ops than any other county. These co-ops provided economic benefits to its members and tothe community by providing goods and services at a competitive price, and returning profits toshareholders through dividends. One was a member of the co-op simply by doing business with it.
History of Value-Added Cooperatives
One of the first local cooperative efforts to inspire area producers to seek new opportunitiesthrough a cooperative effort was Southern Minnesota Beet Sugar, a closed co-op formed bysugar beet producers. This co-op was formed soon after the American Crystal Sugar Companyprocessing plant in Chaska closed. Farmers in west central Minnesota who had delivered sugarbeets to the American Crystal Sugar Company as contract growers understood the value of thiscrop. In the 1970s, growers tried to develop interest in the development of a farmer-owned sugarproducing co-op. In a 1997 book commemorating the early years of the Southern Minnesota BeetSugar Cooperative, one of the co-op’s attorneys, Michael Trucano (1997), explained the reasonswhy farmers worked to develop the co-op: “They were driven by a vision of creating economicopportunity in rural Minnesota that would stabilize their local communities and staunch theexodus of young people out of the area.” While Trucano goes on to describe the economicsuccess brought to the women and men who envisioned and built the co-op, the theme of hisbook returns to the issue of economic development for the community. The fledgling co-opsuffered difficult start-up years. During construction of the factory, a strike of constructionworkers delayed production one year. The first year of start-up was hampered by inexperiencedworkers and a sugar mill flawed with construction defects that required adjustment. In the early1980s, producers struggled with production challenges, including infestation of the Cercosperaleaf spot fungus. Today, sugar beets are one of the most profitable crops grown in RenvilleCounty.
Following the development of Southern Minnesota Beet Sugar Cooperative, Minnesota CornProcessors (MCP) was legally formed in 1980. This corn wet milling company beganconstruction in 1982 in Marshall, Minnesota, in the southwestern section of the state,approximately 50 miles from Renville. The plant began grinding corn in 1983, processingethanol, starches, syrups, dextrose, feed, and corn oil. The members of this value-added co-opcovered a nine-county area that processed nearly 120 million bushels of corn sold by producersas a cash crop in 1980. This value-added cooperative continued to grow, and in 1992 beganconstruction of an expansion plant in Columbia, Nebraska. The members of the co-op wereenthusiastic but faced setbacks in 1996. The effect of high corn prices and low profits weredisastrous, and large cost overruns on expansion and renovation drained the co-op. The plant isnow making profits, however, and is experiencing more prosperous times.
35
Development of Golden Oval
Trends and changes in national agricultural economics have far-reaching effects and theseimpact on local business operations as well. The board and management of Co-op CountryFarmers Elevator (Co-op Country) considered the makeup of the co-op membership. Theyrealized that a large number of patrons would reach retirement age within a few years. At the ageof 72, members would be eligible to receive a portion of their equity in the co-op. Thesepayments of equity to retiring members and the estates of deceased members would diminish theco-op’s operating capital. As a part of its long-range planning, management of Co-op Countryanticipated the aging of farmer patrons. As the average age of patrons began to increase, theyrealized that the co-op would soon incur the liability of large equity payments. As a traditionalco-op, the only form of income was the profit on the purchase and sale of grains and feed andagronomy services. Between 1989 and 1990, Dana Persson, then the CEO of Co-op Country, andthe co-op’s board of directors determined that the co-op required an additional source of income.This income would provide the capital for continued operation of the co-op, and the resources tomeet the equity payments due to retired and deceased producers. Board and managementexplored ideas and set criteria for a value-added project. They agreed that the project could notbe dependent on government subsidies. It must process crops grown by the member farmers andemploy proven technology. The board considered the possibilities and decided to explore thefeasibility of a swine project that would use part of the 28-35 million bushels of corn grown inRenville County.
The Co-op Country board then moved toward the development of an organization for theproposed new value-added co-op and any other co-ops that would be formed in the future. Thisco-op would serve as an umbrella organization for a series of new value-added co-ops throughwhich area farmers could add value to crops they produced. While still on the drawing board, thenew co-op was envisioned as a profit center for Co-op Country. Co-op Country would provide 40percent of the capital and finance the remainder. Once the Co-op Country board had studied thepossibilities for a swine multiplier unit operation, the board organized small group meetings withmembers of Co-op Country to determine the interest and support of the membership for theproject.
The membership sent two messages to the board. Some members were opposed to the swineproject because they believed such a project to be in competition with individual swineproducers. The second message was that they supported the idea of a value-added project butproposed that the new co-op should be open to individual members as well as a Co-op Countryproject. The swine project was abandoned, and management and the board considered otheroptions.1
1While Co-op Country determined that they would not proceed with the swine project, members ofthe community who saw potential in shared effort joined together to form ValAdCo, through which localproducers could add value to their corn through a swine project. ValAdCo began with 39 corn producerswho built a 1,250 sow multiplier unit that by 1993 had grown to four sites housing 3,750 sows and theiroffspring. ValAdCo’s goal was to add profit to the corn that members produce by producing breedinggilts and animals for market.
36
Alternative options included turkey and broiler production. However, after studying theoptions, egg production proved to have the greatest promise. According to Persson, the groupstudied the industry for 31/2 years. “The cheapest dollars are spent in planning,” he explained asplanners interviewed leaders in the industry to gain insight into the development andmanagement in the egg production industry.
A start-up board was organized consisting of board members of Co-op Country, and the newvalue-added co-op was incorporated in the spring of 1994. It was known as Midwest Investors ofRenville, Inc., the name of the umbrella organization. The name was misleading, however, andmany who were unfamiliar with the co-op believed the organization to be a stock investmentcompany. To avoid confusion, the new egg producing entity was named Golden Oval. Anyonewho was an “at-risk” agricultural producer was eligible for membership. Membership in Co-opCountry or other value-added co-ops was not a requirement, although many members of GoldenOval are members of Co-op Country and other value-added co-ops.
Once planners decided to proceed with an egg production facility, the start-up boardmanaged the sale of shares. The group recruited Golden Oval members from the Co-op Countrymembership. They also sought leaders outside of the co-op to create interest and assist in amembership outside of Co-op Country. The marketing effort was successful and created theneeded enthusiasm. According to Persson, $4 million in investment funds were raised in thirtydays. Shares at this initial offering were sold for $3.50 a share. Along with the purchase of eachshare, members assumed the right and the obligation to deliver one bushel of corn each year.Persson believes that new investors were aware of the potential of value-added co-ops and wereseeking an opportunity. The goal of the co-op is expressed in its mission statement, “To provideeach farmer-producer, who is an owner of the company, a competitive return on theirinvestment.” One of the members of Golden Oval is Co-op Country, who through its block ofshares, successfully put in place a stream of income to augment its profit, to provide funds forfuture development, and to fulfill its responsibility of equity payments to retired members and tothe estates of deceased members.
Once 1,140 shares had been sold, an election was held and a board of directors was electedfrom within the membership. The start-up board that had presided over the share offering wasdissolved. As Persson explains, the City of Renville understood the economic advantages of thevalue-added co-op and aggressively worked with the co-op to assist. This assistance includedavailability of 40 acres of city property in its industrial park, as well as Tax Increment Financing(TIF).
Golden Oval began production in 1995 with one million laying hens and since then hasincreased production with an additional million laying hens. When the co-op’s managementobtained contracts for liquid eggs, the co-op chose to sell only liquid product, in part because ofits ease and savings in transportation. Under their uniform marketing agreement, the 411 co-opmembers deliver corn that is ground for feed and used for Golden Oval’s laying operation.
37
Feed Milling
Early in the stages of the development of Golden Oval, a feed milling facility wasconstructed as a joint project by Golden Oval, ValAdCo, and Co-op Country. ValAdCo, thevalue-added co-op that had developed the swine project rejected by Co-op Country members,required increasingly greater amounts of feed for its hog production. Golden Oval’s board knewthat because of future expansion, the feed requirement would continue to increase. While 14,530tons of feed were required in 1995, by 1996 that figure had grown to 51,791 tons and by 1997,usage had grown to 77,024 tons of feed. Local milling facilities were limited, however. A feedmill built in the 1930s by Co-op Country had been torn down, and a mill located in Olivia wasonly a few years newer and was slow and inefficient. A feed mill was needed not only to providethe feed for ValAdCo and Golden Oval, but for future expansion for Co-op Country. The presentfacilities were not sufficient, and future needs would require outside milling.
The leadership of the boards of Co-op Country, Golden Oval, and ValAdCo begandiscussions on how to meet increased feed requirements. According to Curt Watson, whorepresented ValAdCo, “We talked out disagreements,” as the representatives struggled withissues as they arose. A difficult problem to be resolved was how to integrate the needs of atraditional co-op and two value-added co-ops. United Mills would deliver milled product toCo-op Country, who would, in turn, sell milled product to their customers. On the other hand,Golden Oval and ValAdCo used the grain for their own production. During the negotiationprocess, Persson suggested a variation on the group’s philosophy. Rather than running the mill asa profit center, he proposed that it be run as a cost center. In such a scenario, the mill would beoperated on a nonprofit basis. That is, there would be no profit in producing ground feed. Each ofthe three collaborators would receive the product at a cost basis. ValAdCo and Golden Ovalwould use it to feed animals being produced, and Co-op Country would provide milled productto customers, generating a profit.
The project was approved by the three boards, and organizers worked with the St. Paul Bankfor Cooperatives, obtaining a loan to build the facility. Financing was supported by a TIF throughthe City of Renville and $750,000.00 in equity advanced by the three participants. The total costof the mill was approximately $1.6 million. Currently, United Mills employs 13 Renville arearesidents, and processes 4,000,000 bushels of corn per year, equivalent to an annual process of21 unit trains, each with 54 hopper cars.
Such a project had simply not been considered before, much less accomplished. Whileelevators merged with one another, and new co-ops were formed, the collaborative venturebetween a value-added co-op and a traditional co-op was a new idea. United Mills is governedby a nine-member board, three members each from Co-op Country, Golden Oval, and ValAdCo.
38
Golden Oval’s Production
Golden Oval’s strategy is what the co-op refers to as a “Totally Integrated Food System.”This system begins with a focus on the grain that shareholders produce for milling. Through theDifferentiated Global Positioning Satellites (DGPS) system, members apply fertilizer effectively,enhancing the nutritional value of the grain that is used for feed. Co-op Country makes itsagronomy department available to producers, making certain that the finest quality corn is grownfor use in feed. The agronomy department does soil testing and has DGPS equipment available toapply crop nutrients to support the next crop. All grain produced by members is handled throughCo-op Country Farmers Elevator, the grain handler for the co-op. Co-op Country tests the graindelivered and verifies that only quality corn is delivered to the feed mill. United Mills, thecollaborative effort of Co-op Country, ValAdCo, and Golden Oval, mills and blends feed,providing a consistent level of quality grain for feed.
Because Golden Oval has a management contract with The Pullet Connection, the pullets areraised and delivered to the co-op from a single source, reducing the risk of disease. Through itscontract with the owner of The Pullet Connection, Golden Oval has maintained the right todetermine the rations and health programs of the pullets delivered to the laying barns at 16 to 18weeks of age.
An important part of the integrated food system is the egg production. The laying barns aredesigned to provide comfort for the chickens and the workers. Outside air is pulled down fromceiling vents over the cages, providing circulation for the birds. This moving air continues downover the litter and is drawn out through fans. This process provides fresh moving air for the birds,and at the same time, dries the litter that has collected in the level beneath the cages. The litter islater removed for fertilizer, providing nitrogen, phosphorus, and potassium to area fields.
The environment of each of the 16 barns is monitored by computer that regulates movementof air and temperature. Water and feed for each barn is measured on a daily basis and iscompared with the number of eggs produced. Veterinarians check the flocks every six weeks toensure the health of the birds. An aspect of the co-op’s efficiency is its in-line production system.Eggs that leave the laying barns travel by conveyor through a washing, breaking, and processingsystem. The linking of the laying barns with the breaking and cooling processes results in asavings of transportation and time.
From the barns the eggs move into an area where they are washed, candled, and inspectedfor breakage and cleanliness. One of the technological features of Golden Oval’s production isthe efficiency of the breaking process. Six egg breakers can break and separate 216,000 eggs perhour. A portion of egg production is shipped to food processors whole, while a portion isseparated and then yolks and whites are blended to customer specifications. The quality of theegg product is maintained through a chilling process as it is pumped through stainless steelpipelines. Within a few minutes, the temperature of the eggs is dropped to approximately 35degrees.
39
Much of the co-op’s success is because of the quality of the egg that is delivered to grocerystores, restaurants, and kitchens. According to Persson, only six hours elapses from the time anegg is laid in the co-op’s facilities, brought to the egg breaking facility, cooled, and put on thetruck. The speed of this process results in a fresh, high-quality egg product. Trucks are sanitizedbefore and after each load, assuring a safe, healthy food product. A USDA official oversees allaspects of the egg breaking and loading process.
Another segment of the Golden Oval system is the production of starter pullets. The co-ophas contracted with Barb Frank, owner and operator of The Pullet Connection, to raise pulletsthat are delivered to Golden Oval. This farmer, who is a member of Golden Oval, redirected herefforts from crop production to the raising of pullets for Golden Oval. She contracts with GoldenOval to produce replacement birds and is paid on a per bird basis. The “closed system” that hasbeen contracted between the producer and the co-op eliminates disease spread among other birds.Feed from United Mills is also used for this operation and as the feed source for the laying hens.
Golden Oval and the Community
Farmer-owned co-ops have spent energy and resources in dealing with a negativephilosophy that has resulted in nationally high environmental standards promulgated by the Stateof Minnesota. The management of Golden Oval has undertaken an aggressive program tomaintain an environmentally sound facility. Rodents, mites, and flies are controlled through dailychecks. Management has incorporated natural biological controls through beneficial insects thatcontrol unwanted insect populations. While Golden Oval has met state environmental standards,pressure from environmental groups continues, and the co-op now directs its expansion efforts toareas where political pressure is not as great. Because of neighborhood concern, an expansion ofthe present facility from 2,000,000 to 2,750,000 hens is being postponed, and the co-op isdeveloping expansion facilities in Iowa. Golden Oval continues to strive to maintain a GoodNeighbor Policy with its neighbors and the city. The efforts of the co-op to mitigate odor and flyproblems is acknowledged, and the positive economic impact on the community is recognized.
The expansion effort into Iowa requires additional membership investment through the saleof additional equity stock and loans. New members will be expected to sign a UniformMarketing Agreement that renews each year. Golden Oval is working through AgVentures, anassociation of farmers and agribusinesses in northern Iowa. Their goal is to develop value-addedbusinesses and, in doing so, they are organizing informational meetings in Iowa allowing theco-op to explain the potential of investment.
Value to Members and the Community
Dana Persson is candid about the motivation for the co-op and for individual members tojoin value-added co-ops. While the development of value-added co-ops is a source of economicdevelopment for the community, its prime purpose is to enhance profit for its members, he pointsout. Projects such as Golden Oval have received support from the local community, however,and through combined effort, have provided profit and growth for Co-op Country, individualmembers of the co-op, and the City of Renville.
40
Members of value-added co-ops share in the profit of the cooperative. The amount of profitis determined when expenses are deducted from sales. Based on the number of shares owned,members share in that profit. Co-op Country, as a member of the value-added co-op, has a largestake in Golden Oval and has shared in Golden Oval’s profit of more than $3 million. The 411individual members also share in the profits, which in 1998 included a value-added payment fortheir corn. In that year, the average market price for corn at Co-op Country was $2.19; however,Golden Oval members received $3.77, or a value-added payment of $1.58.
According to a report from the USDA Minnesota Agricultural Statistics Service, the averagemarket value of agricultural products sold in 1997 in Renville County had increased 59 percentfrom 1992. Livestock sales accounted for 55 percent of the market value. The market value ofagricultural products sold on an average per farm increased 86 percent from 1992. NeighboringRedwood County demonstrated a 36 percent market value increase with a market value ofagricultural products sold increasing 46 percent in the same period. The development of value-added co-ops has affected livestock production in these two counties and has allowed producersto add value to the grains that they produce.
Golden Oval and Community Development
The City of Renville and the surrounding area has profited from the development andoperation of value-added co-ops such as Golden Oval. According to Persson, about $14 millionis spent annually in the operation of Golden Oval in terms of payroll, shareholder payments,feed, supplies, and other operating expenses. Local, state and federal taxes generated by theco-op total more than $1 million, a significant portion of which is property tax used to supportschools and local government. He also points to the health of Main Street Renville wherebusinesses provide a full range of goods and services that include medical and dental services,two hardware stores, a grocery store, a pharmacy, two florists, and two restaurants. Renvillebusinesses provide basic goods and services frequently unavailable in small communities. Insome cases, competition between related businesses results in competitive pricing. A golf courseopened in May of 1999 has added to the quality of life in the area. Golden Oval’s contribution tothe economy can be demonstrated through the co-op’s employment of approximately 80employees.
Success of Golden Oval
Golden Oval is a success story, and according to its 1998 annual report, the co-op closed itsfiscal year August 31, 1998, with 30 consecutive profitable months. In 1998, the co-op hadproduced more than 57 million pounds of eggs, an increase of 900,000 pounds from the previousyear. Much of the success is due to the sound planning of board and management. Eggproduction of 7,156,819 pounds in 1995 increased to 57,180,658 pounds in 1998. Positivereports from the American Journal of Clinical Nutrition have resulted in increased eggconsumption. Trends that include consumer habits of eating greater numbers of meals away fromhome and increased demand for convenience have bolstered the industry. The per capita
41
consumption of eggs has increased after a drop in the early 1990s. The low of 236 eggs percapita consumption in 1985 has now grown to 245.7.
The success of production, management, and marketing that has resulted in greater profit hascreated a gain in investors’ initial investment. Share prices for members have fluctuated from theinitial $3.50 purchase price per share; they have sold from $4.60 per share to as high as $5.42.2
This increase in value has resulted in a more positive balance sheet for producer members.
According to Delmar Mulder, Chair of the Golden Oval board of directors, value-added co-ops such as Golden Oval are an important component in the preservation of family farms. Now aproven investment, the only regret of some members of the co-op is that they cannot sell morecorn to the co-op.
The lessons learned by Renville County agricultural producers are ongoing. The agriculturalcommunity has succeeded in organizing and operating value-added co-ops, and whethermotivation is for personal profit or for community development, both the community andproducers have benefitted. There are hard lessons to be learned in risk management, and whileeffort never guarantees success, value-added co-op members believe that failure is often theresult of inaction. This understanding that cooperative effort has the potential for success hasresulted from years of experience. For others who have not worked through the challenges andfor whom this experience is not first-hand, the lessons may come more slowly.
A fragment of resentment of certain aspects of co-ops such as Golden Oval remains withsome who often are opposed to value-added co-ops. According to Lee Egerstrom (1994), a writerfor the St. Paul Pioneer Press, opposition is found in those anxious about the sociological andenvironmental issues, and others whose philosophies are difficult to identify. Egerstrom believesthat many of these are the “well-intentioned advocates of a family farm image who want toperpetuate a peasant society that has disappeared from the landscape, but not from agrarianmyth” (40).
Projects such as Golden Oval give producers a reason for pride as they find that they havethe potential of taking control of their future; however, such projects do not come easily.Planners must do their homework and consider the opportunities and the challenges of eachproject. A level of independence that was enjoyed by the early co-op members of RenvilleCounty is now balanced with the understanding of the value of cooperation, as producers worktogether, utilizing a desire to succeed, hard work, and a vision of success for themselves and theircommunities.
2This price is based on a per bushel price, and purchased and sold on a 1,000 bushel basis, to $3,500for a 1,000 bushel contract.
42
References
Delmar, Mulder, Chair of the Golden Oval board of directors. Personal interview with author.
Egerstrom, Lee. 1994. Make No Small Plans. Rochester, MN: Lone Oak Press, Ltd.
Persson, Dana. Personal interview with author.
Svoboda, Frank. 1976. Looking Back: A History of Agriculture in Renville County.
Trucano, Michael. 1997. Southern Minnesota Beet Sugar Cooperative: A History of the EarlyYears.
Warson, Curt. Personal interview with author.
43
Going Against the Grain:The Story of the Mountain View Harvest Cooperative
by David Carter
Introduction
The packaging room of Gerard’s French Bakery near Longmont, Colorado, hums withactivity these days. The aroma from 14 Revert Ovens fills the large room as workers in hairnetsand bakers’ white uniforms fill cases with freshly cooled loaves of peasant bread, cracked wheatsourdough, parmesan cheese rolls, boules, and three-foot long sandwich rolls.
It’s a scene similar to the activity in hundreds of bakeries throughout the United States eachday, but this one is different. The owners of this bakery do not just supply the capital foroperations, they also provide the wheat flour used in every loaf of bread. This is a dream fulfilledfor the wheat farmers and their families who donned crisp, white baker’s aprons in May 1997 topose for a photo around the sign of the bakery they had just purchased. It was a dream that grewfrom a vision held by a small band of producers struggling to salvage a failed co-op in early1994.
Raw determination, careful planning, and good fortune served as the recipe followed by theproducers as they organized the Mountain View Harvest Cooperative (MVHC) over a three-yearperiod and then generated $5 million in equity to purchase a state-of-the art bakery facility.
The farmers who chartered and capitalized the MVHC plowed new ground in thecooperative development arena. Not only did they pioneer the movement into value-addedproduction in the Rocky Mountain region, they also established the nation’s first major farmer-owned bakery (Senechal 1995a). These wheat farmers had generated the $5 million in equityneeded to establish the bakery largely because they expected to earn a return on investment bymoving forward in the food chain. This wasn’t just another business to most members. This was,at last, an opportunity to maintain a degree of ownership and control as wheat flowed from thefarm gate to the consumer’s table. As one producer later noted, “I always wanted to see mycustomer.”
“Field to table,” “seed to sandwich,” and other catchy phrases have been coined to describethe modern, vertically integrated marketplace. “Seeing our customers” connotes something moresignificant. It depicts an actual marketing relationship among agricultural producers and foodconsumers.
Farmers’ common lament that “Consumers think that food comes from the grocery store”captures the frustration that many producers feel about the lack of understanding today’scustomers have about the realities and rigors of American agriculture. The phrase also has a flipside. Most farmers do not know what happens to their commodities after delivery to the localgrain elevator. Some wheat gets shipped to domestic flour mills and food factories. Some flowsinto the international marketplace. The farmer only knows that someone else, somewhere else,
44
earns the lion’s share of profits in the American food system. Farmers today account for lessthan 6 percent of the gross domestic production of the food and fiber sector. Processing,marketing, and input supplies obtain the remaining 94 percent (USDA 1998, 1). In charteringMountain View Harvest and purchasing Gerard’s Bakery, 225 Colorado wheat farmers weredetermined to capture a share of that value-added profit.
Genesis of an Idea
The seeds for the MVHC were sewn among the rubble of a bankrupt Colorado grainmerchandising and feed milling co-op in 1994. Farmers Marketing Association (FMA) servedthe Rocky Mountain region as a viable grain handling and feed milling co-op since 1942. The co-op had experienced a series of unfortunate circumstances in the 1980s. A feed mill fire, adisastrous drop in livestock feed demand, and derailment of a shipment of grain in 1988triggered events forcing FMA to seek protection under Chapter 11 reorganization the same year.As a result of the bankruptcy, FMA’s three elevators were sold to Cargill (Carter and Lauridson1994). Cargill’s purchase of the FMA elevators was the opening salvo by the Minneapolis-basedcorporation in a major program to acquire grain merchandising facilities in Colorado. By 1989,Cargill owned 82 percent of the grain elevators in Colorado capable of loading unit trains(Nyberg 1992).
Colorado wheat farmers began to complain openly about the erosion of marketingalternatives for their crops. Even as the FMA board struggled to handle the co-op’sreorganization, they began to dream once again about reestablishing a presence in the grainmarket.
Reggie Wyckoff and Tom Lauridson, two producers on the FMA board, began to study co-op development successes in North Dakota. They were especially intrigued by the rapid growthof the Dakota Growers’ Pasta Company in Carrington. Wyckoff and Lauridson also noticed thatthe Rocky Mountain Farmers Union (RMFU) had recently begun to promote the idea of co-opdevelopment as a way for producers to regain more control over agricultural markets in the west(Wyckoff 1995).
Producers attending a series of “Community Forums” conducted by the RMFU in 1994expressed a strong desire to develop new locally based enterprises that provided viable, tangiblemarketing alternatives. Co-op development emerged from those forums as a tool for producers toaccomplish that goal.
Meanwhile, the FMA board met in May 1994 to generate ideas for reviving the grainmarketing co-op. Most of the discussion centered on traditional grain marketing ideas. Value-added processing was discussed only briefly. Participants agreed to enlist the RMFU’s assistancein exploring all ideas for emerging from Chapter 11.
Early Leadership
In discussions conducted through the summer, Wyckoff and Lauridson began to steer thedialogue toward an emphasis in value-added processing. They were an unlikely duo. Wyckoff, a
45
dark-haired wheat farmer from Colorado’s eastern plains, had devoted a lifetime to the Coloradowheat industry, had been active in the Wheat Growers’ Association, and had served as theNational Association of Wheat Growers president in the 1980s. By contrast, Lauridson, a tall,gregarious young farmer, had been struggling to maintain a viable wheat operation by tenantfarming for a series of landlords in Colorado’s rapidly urbanizing Front Range. The conservative,soft-spoken Wyckoff and the liberal, outspoken Lauridson were united by their doggeddetermination to revive the flailing farmer-owned co-op.
As FMA and the RMFU began to collaborate on the planning, Carter, as president of RMFU,was invited to serve on the co-op’s Board of Directors. Ideas were abundant throughout thesummer. Discussion ranged from producing specialty flours, and organic wheat products tononfood items such as fiberboard and insulation. The first task was to secure adequate funding toexplore the feasibility of these alternatives. From the board’s study of the North Dakota co-op,they knew the feasibility study might cost as much as $100,000. Lauridson got the chance topersonally request that funding from the U.S. Department of Agriculture (USDA) in September1994.
Testing the Feasibility
Participating in a RMFU legislative “Fly-In” that month, Lauridson was among about 15ranchers and farmers who met with Michael Dunn, administrator of the USDA’s Farmers HomeAdministration, to discuss an array of agricultural credit issues. He explained that the FMA wasworking to restart the co-op, and noted that the FMA board would be submitting a proposal forfunds to investigate processing and marketing alternatives for Colorado wheat producers.
Dunn indicated that FY94 federal funds were still available to fund that type of feasibilitystudy; however, Dunn added, the grant proposal would have to be delivered within 24 hoursbecause of the impending close of the fiscal year. That evening, Lauridson and Carter“borrowed” the National Farmers Union’s Washington, DC office to finalize that grant proposal.With FMA’s manager Gene Bevill furiously faxing material from Denver throughout the night,Lauridson and Carter worked to meet the complex criteria for the USDA funds. A formal grantproposal was hand-delivered to USDA the following afternoon. Approval of the grant request thefollowing month provided organizers with vital capacity to engage qualified professionals toassess the feasibility for value-added wheat processing.
Following a brief bidding process, FMA engaged the Massachusetts-based firm of Senechal,Jorgenson, and Hale to conduct the feasibility analysis. Senechal had extensive experience in thefood processing and retailing industry, and had carved out a niche during the past decadeworking with the value-added co-op sector. The feasibility study was conducted in two phases. Inthe first phase 14 alternatives for merchandising and processing Colorado-grown wheat wereanalyzed. Ideas examined included grain merchandising, ethanol production, wheat glutenmanufacturing, snack products, tortillas, pizza dough, frozen bread dough, and other bakeryproducts.
46
Each alternative was evaluated based on anticipated volume, profitability, risk, expectedmarket growth, capital requirements, and existing competition. The alternatives were given agreen light, yellow light, or red light score under each evaluation factor. Alternatives indicating ahigh degree of potential would be analyzed in greater detail during a second phase (Senechal1995).
FMA’s traditional business line as a delivery and merchandising elevator was quicklydismissed in the study’s first phase. That business emphasis, commonly known as grainorigination, was identified as a mature industry with low margins, which is dominated by ahandful of transnational corporations.
Flour milling and cereal manufacturing were also tagged as a mature industry with lowmargins, high capital costs, and significant barriers to entry. Ethanol production and wheat glutenproduction were considered to be extremely risky because those industries depend uponunpredictable government policies. Wheat gluten, for example, is a byproduct of starchproduction. According to Senechal, the European Union processes significant amounts of starchbut has not developed markets for the gluten by-products. The impending passage of the GeneralAgreement of Tariffs and Trade increased the risk that European gluten would be dumped on theworld marketplace.
The alternatives of bakery products, pizza crust, and tortilla manufacturing all indicatedrelatively high degrees of potential success. The in-depth analyses of these alternatives includedan overview of industry factors such as market segmentation, growth rates, competitors, andlikely outlook. Senechal (1995b) also developed a series of pro forma financial statements,complete with a sensitivity analysis and a risk/return trade-off assessment.
Choosing the Bakery Alternative
After a series of meetings with Senechal, the FMA board determined to pursue a proposal toproduce specialty bakery products. According to Senechal’s research breads and rolls dominatedthe bakery industry, accounting for more than $12 billion in sales, and for 47 percent of theconsumption of all baked goods in 1994.
While the overall volume growth in the industry was relatively flat, specific sectors weregrowing while others were declining: “In dollars, the market has been growing steadily, whilevolume figures show a market that is relatively flat. This suggests that prices have been risingand/or the market is turning toward higher value products such as variety breads and frozenbread products” (Senechal 1995b).
One small, but growing, segment of the market targeted by Senechal was the area ofproducing parbake products for the food service industry and for supermarket in-store bakeries.Parbake is a product that is baked to approximately 85 percent of completion and then is flash-frozen to preserve freshness. The end-user fresh-bakes breads by simply thawing the product andcompleting the baking process.
The study noted that parbake products were well-positioned to benefit from the shiftingdietary habits of modern consumers. More than 75 percent of all grocery stores had in-store
47
bakeries in 1993. That percentage was expanding rapidly as grocery stores focused upon the foodcategory known as Home Meal Replacement. Even so, scarcity of trained labor was listed as thenumber one concern of all supermarket in-store operators (Senechal 1995a). Consumers havealso indicated that they will make significant shifts in their bakery purchase patterns to in-storebakeries and away from the commercial bakery rack in supermarkets (Bakery Production andMarketing 1996).
Several major obstacles were evident in the initial feasibility analysis. First, Senechalestimated that construction of a new parbake facility would require $26 million in capitalization,of which $11 million would be provided as an equity investment by growers. The study alsoprojected that a bakery of this size would use only 349,000 bushels of wheat annually. “You canmake a lot of bread with a little dab of wheat,” Senechal reported to the FMA Board of Directors(Wyckoff 1995).
The FMA board estimated that no more than 500 Colorado wheat farmers were potentialinvestors in a value-added wheat co-op of this scope. Board members began to seriously questionthe ability to convince 500 growers to invest $22,000 each in a venture that would not even usethe wheat grown on 20 acres apiece.
The concept of parbake bread manufacturing marked a dramatic departure from FMA’straditional expertise in the grain handling and feed milling businesses. Senechal suggested thatFMA could address these factors by developing a partnership agreement with an existingindustry player in the parbake business. Acting on the study’s recommendation, the FMA boardentered into negotiations with a New York-based industry leader in October 1995.
The FMA board was far from its expertise in conducting negotiations of this nature. Theproposed business arrangements were extremely complex. In addition, the time commitmentrequired to move this project through the next phases exceeded the abilities of the volunteerboard of directors.
Rocky Mountain Farmers Union ’s for-profit subsidiary had recently helped organize alimited liability company operating under the name of Rural Business Ventures (RBV). Theprincipals of RBV included a Certified Public Accountant, an attorney, and a Merrill Lynchinvestment advisor. The RMFU for-profit subsidiary authorized a $25,000 interest-free loan toFMA to fund the work of RBV in assisting in the negotiations with the New York company.
Weathering the Storm
The months from December 1995 through July 1996 marked a stormy period in the co-opformation period. Much of that storm raged inside the FMA boardroom. The FMA boardchairman was a western Colorado rancher who had joined the co-op years ago because of FMA’sfeed milling business. Although he supported the movement into value-added production, heknew that the “new” co-op would primarily serve the farming community, not ranchers. Hestepped down from the board in December 1995.
The chief executive officer of FMA balked at the value-added concept. He was convincedthat export marketing of bulk, identity-preserved commodities represented the best future for
48
reviving FMA. He also resigned in December 1995. The remaining board rallied behind thevalue-added parbake concept, sometimes referring to the project as “the half-baked co-op,”wondering at times if the idea was in fact half-baked.
Negotiations with the New York company began to flounder. The RBV consultants analyzedthe company’s various proposals, determining that each placed the fledgling Colorado group at aserious disadvantage. Several offers amounted to little more than a “preferred provider”arrangement for marketing the wheat of participating Colorado growers to the New Yorkcompany.
A Critical Juncture
By July 1996, the project had hit a dead end. The prospect of generating $11 million fromColorado growers for a new facility seemed insurmountable, and the negotiations with theexisting industry player were going nowhere. Justin Eisenach, the investment advisor consultantwith RBV, had located two Colorado bakeries that might be available for purchase by acooperative of wheat farmers. One of those bakeries was already moving into the parbake arena.
The months of negotiations with the New York company had taken its toll. The board hadmet as often as every other week. So far, there was little progress to show for the effort. Energywas rapidly ebbing among the small core of dedicated board members who had driven theproject with the assistance of the RMFU and the RBV consultants. Any chance of movingforward would require renewed energy from a wider circle of wheat producers. After all, the co-op board of directors had made assumptions about the desires of Colorado’s wheat producers formore than 18 months. It was time to test those assumptions.
Project organizers held a dinner meeting in eastern Colorado in July 1996 and invited asmall group of leading area wheat farmers to review the status and outlook for the project. The14 farmers attending the dinner meeting in Limon listened as Wyckoff, Lauridson, Eisenach, andothers reviewed the developments of the past 18 months. They discussed the feasibility analysis,reviewed the failed negotiations with the New York company, and forwarded the idea ofexploring the purchase of one of the local bakeries.
Several producers at the meeting supported the idea of investigating the purchase of abakery, but they felt that the FMA structure added too much “baggage” to any economicdevelopment plan. After all, the co-op had struggled through eight years of bankruptcy and stilllisted many farmers among its list of creditors.
Mountain View Harvest Cooperative Comes to Life
The group agreed that evening to completely restructure the project. While four FMA boardmembers—including Wyckoff and Lauridson—continued to serve on the steering committee,five new members brought new perspectives and fresh energy to the project. The new groupagreed to move forward under the name of Mountain View Harvest Cooperative. The project wasenergized once again, and a flurry of activity unfolded during the next five months.
49
Legal documents were drafted formally establishing Mountain View Harvest Cooperative.One of the documents was a membership subscription agreement, which requested $500 frominterested producers. That money was dedicated solely for the purpose of funding the co-op’sformative process.
Initial inquiries were made with the owners of the Colorado bakeries. The owner of Gerard’sFrench Bakery near Longmont indicated some interest in selling his business to a group ofColorado wheat producers. This triggered a series of negotiations that led the committee intosome uncharted waters in co-op development.
Most co-op development efforts center on a brand-new business. Federal agencies and co-oplenders were accustomed to projects that propose green field construction or that purchase afacility with the intent to convert it to a new co-op enterprise. This situation was different.
Colorado wheat farmers were offering to purchase a bakery with an existing customer listand established annual sales of $6 million. The Colorado wheat producers were interested asmuch in the owner’s customer list as they were in the physical assets of the bakery, which wasmuch smaller than the enterprise recommended in the Senechal feasibility study. While thesmaller size reduced the amount of capital needed by the Colorado producers, it also reduced thepotential earnings that could be distributed among a large group of investors.
Eisenach and a CPA working through RBV developed a business plan around the idea of afarmer-owned co-op purchasing Gerard’s French Bakery. The plan indicated that co-opownership was feasible if the bakery engaged in an aggressive growth campaign in order togenerate patronage dividends necessary to entice adequate grower interest.
Intensive negotiations were conducted with the bakery owner. He agreed to sell the businessoperations and the equipment for $6 million; however he wished to retain ownership of thephysical facilities. That figure represented one dollar in purchase price for each dollar in annualsales. The co-op would have a ten-year lease, with two five-year rights of renewal on thebuilding.
Financing Poses a Challenge
This agreement limited the steering committee’s access to financing. Co-op lenders wantedto have physical assets as collateral against loans. Financing discussions became entangled withdisagreements over the issue of financing the “blue sky” value of an existing business.
When the steering committee and the bakery owner settled on a purchase price of one dollarfor each dollar of sales, the co-op lenders balked. Financing appeared unattainable. The owner,however, said that if the farmers could generate $5 million, he would carry the balance of thepurchase price.
The business plan was revised, and reanalyzed, in light of this scenario. The new planunderscored the need for an aggressive growth strategy. The steering committee knew that themaximum target audience for this project was approximately 500 commercial wheat producerswho were active in either RMFU or the Colorado Association of Wheat Growers. Not all of these
50
farmers were likely to invest in a project, however, so the committee decided to try to recruit400 wheat producers.
Several factors complicated efforts. The bakery’s flour consumption equaled less than200,000 bushels of wheat. One large wheat producer could supply all of the company’s annualflour needs. Eisenach (1999) explains, “We knew that there were other projects that would utilizemore wheat. But we felt the parbake end of the bakery business offered excellent potential forsuccess. We determined that, if we succeeded with a small operation, we could use that businessas a platform to move into other areas that would use more wheat.”
Milling the wheat into flour also posed a problem. Wyckoff knew that the new co-op had tobe able to control the quality of the product from the farmers’ bins to the bakery; however theonly major flour milling company in Colorado was owned by one of the corporate giants alreadyentrenched in the baking business. There was a consortium of local farmer co-ops which hadorganized Rocky Mountain Flour Milling, a limited liability company (LLC), for the purpose ofconstructing a flour mill in the nearby community of Platteville. That flour mill, however, wastargeting the organic flour market. Negotiations with the Platteville mill determined that thefacility could handle conventional wheat, as long as the equipment was cleaned between runs ofconventional flour and organic flour.
The next problem arose with delivery of wheat to the co-op. Project organizers knew that iffarmers were required to supply the high-quality wheat needed by the bakery, they must be ableto deliver at least one truckload each year. The board located a grain elevator facility for salenear the flour mill which was for sale. The facility was old but in working condition. The owneroffered to sell it to the new start-up group for $160,000.
After months of wrestling with the problem, the committee finalized a proposal to purchasethe bakery and elevator for a total of about $6.5 million, with $5 million coming in the form of aproducer equity investment. Farmers joining the new co-op would be obligated to deliver atruckload of wheat (900 bushels) to the co-op each year. The best wheat would be segregated,and the remainder merchandised on the open market. The segregated wheat would be transportedto the Platteville mill to be processed into flour, thus meeting the bakery’s specifications.
The committee determined to sell 400 shares in the co-op for $12,500 a piece, with eachshare carrying an obligation to deliver 900 bushels of wheat to the co-op each year. Wheat wouldbe purchased by the co-op at the market price, but investors would expect to earn a return ontheir equity investment in the new co-op.
But how many farmers could afford to pay $12,500? According to Eisenach (1999),
We needed to make investing in this new co-op as easy as buying a new pickup truck.So, we started working on a GMAC-type investment program for co-op shares. TheFarm Credit System stepped forward to work with the steering committee to devise anequity investment financing plan. Qualifying producers could obtain a five-yearsignature loan to purchase shares in the new co-op.
51
Equity Drive Launched
With a prospectus developed by the consulting attorney and a briefcase-full of solicitationmaterials, Eisenach, Wyckoff, and other members of the steering committee launched the equitydrive in November 1996. They conducted a whirlwind tour of 63 meetings over the next fourmonths of groups ranging from 2 to 20 individuals. By March 31, 1997, the last share of stockwas sold. While only 225 producers had joined the new co-op, several had purchased more thanone share of stock. Eisenach had worked on MVHC nearly full-time since July 1996. He nowagreed to serve as chief executive officer for the co-op. With the necessary equity in hand, theproducers completed the purchase on April 15, 1997. One month later, the co-op’s initial annualmeeting celebrated the purchase of the nation’s first major farmer-owned bakery.
Gerard’s French Bakery has experienced 35 percent annual growth in the two yearsfollowing that purchase. The rapid growth has required the co-op to plow revenues back into thebusiness. A $140 per share dividend was distributed to the members at the end of the first fiscalyear. Earlier this year, the board conducted a series of seven “Members’ Update” meetings withstockholders throughout the state. Members attending the meeting agreed to forego a dividend inthe current fiscal year to capitalize the purchase of additional processing and packagingequipment, as well as to invest in expanded freezer capacity.
Additional customers and expanded sales to existing clients pushed the sales volume above$1 million for the month of June 1999. The expanded sales pushed the bakery’s profitabilityabove the break-even level required by the new capital investments.
Though no formal market exists for trading stock in the co-op, the bylaws require the boardof directors to approve each transaction as a means to assure that the cooperative remains in thehands of active producers. The most recent shares of stock have traded for $15,000 per share.
Factors for Success
The following factors contribute to the ongoing success of Mountain View HarvestCooperative:
• The producers purchased an ongoing, successfully operating business. The new co-opwas spared the trials of wading through green field construction, initial marketpenetration, and other factors associated with many start-up businesses.
• The co-op retained the existing management. All of the key employees stayed with thebakery during the transition. Those employees were offered an opportunity to purchasestock in the bakery, thus sharing in the risks and rewards of ownership.
• The co-op brought in new expertise from the industry. When the board moved to hire anational sales manager and a production manager, it sought individuals with industryexperience. MVHC successfully located experienced personnel with large industryleader bakeries, who were excited about the prospect of joining a feisty, growingcompany. The new national sales manager brought contacts with major retail outlets
52
across the nation, while the new production manager built his career with a major companyon a specialized knowledge of unique variety breads.
• The board navigated a difficult transition period. As the project transformed from anorganizing effort to an operational business, the board changed its role from that of asteering committee to a formal board of directors. Two wheat producers on the steeringcommittee stepped aside at the outset, allowing the members to elect two new directorsat the initial annual meeting. During the next year, two other directors, includingWyckoff, resigned from the board. The board established a vacancy committee to selectnew directors who could bring solid experience in the wheat marketing industry. Onedirector brought with him an extensive background in private industry, and another hadserved as the executive director of the Colorado Wheat Administrative Committeesince the early 1980s.
• The co-op’s rapid success with the bakery created an immediate need for newequipment and other capital improvements. The addition of cryogenic tunnel freezers,the construction of additional loading docks and freezer space, and the purchase ofother packaging equipment increased the co-op’s fixed costs and, thus, pressured theshort-term bottom line.
• The grain elevator purchased by the co-op served as a drag on the bottom line. Thefacility was in worse shape than at first thought. The steering committee had relied onthe judgement of one of its members to determine the elevator’s viability. In the rush offinalizing the purchase agreements, other steering committee members failed toconduct adequate analyses. Extensive repairs of the elevator’s handling and storageequipment were required to keep the facility operational. Maintenance of the elevatordrained capital and management resources from the bakery. In early 1999, the MVHCBoard of Directors negotiated an arrangement with Rocky Mountain Flour Milling tohandle direct wheat deliveries at their facility. Rocky Mountain Flour Milling agreed toprovide MVHC exclusive use of a couple of their storage bins at the flour mill. Thearrangement included assurances that the wheat from the co-op’s members would notbe blended with nonmembers’ wheat. Because of the new agreement with RockyMountain Flour Milling, the board was able to lease the elevator to a private business.
Early Results
Mountain View Harvest Cooperative is now entering its third full year of operation as abakery. The growing pains inflicted by rapid growth have subsided as sales climbed above thebreak-even mark. Total sales for FY99 are projected to exceed $12 million, and Gerard’s wasselected as a recipient of the 1998 “Ten That Can” award presented each year by the ColoradoOffice of Economic Development.
Return on investment in the co-op has not yet matched the returns producers could haveanticipated in the stock market. Even so, participants in the venture seem enthusiastic about theirsuccess in establishing ownership in a growing segment of the food processing sector.
53
In fact, Eisenach (1999) notes, “When we went out to visit with shareholders about the needto retain our earnings to capitalize growth this year, we anticipated that some shareholders mighthave wanted to sell their stock. Instead, we came back with an increased waiting list of producerswanting to buy new shares. Our members believe that we are in the right business, at the righttime.”
“We haven’t yet made the 30 percent returns we’d like to make,” stockholder Jay Wisdom(1999) told a recent gathering of producers investigating another type of value-added co-op. “ButI figure that the two shares of stock my family bought were about the equivalent of a new pickuptruck. By now, that pickup would be pretty well depreciated. But my stock in Mountain View hasappreciated by 20 percent.”
As Colorado’s wheat farmers look toward the uncertainty of commodity prices for theircrops, 225 producers now know that they have successfully developed an ownership stake in ahigher, more profitable level of the food production business.
Bibliography
1996 Industry Outlook. 1996. Bakery Production and Marketing (January 15).
Carter, Dave, and Tom Lauridson. 1994. Proposal for a Feasibility Study for Development of aSpecialty Wheat Value Added and Marketing Cooperative. Grant proposal submitted to theU.S. Department of Agriculture.
Eisenach, Justin. 1999. Personal conversation with Dave Carter.
Nyberg, Bartell. 1992. Cargill’s Colorado drive sows concern. The Denver Post (June 24):Section G, 1.
Senechal, Don. 1995a. Farmers Marketing Association Growing Processing OpportunityScreening: Phase I—Working Session. Danvers, MA: Senechal, Jorgenson, Hale & Co., Inc.
Senechal, Don. 1995b. Farmers Marketing Association Growing Processing OpportunityScreening: Phase II —Working Session. Danvers, MA: Senechal, Jorgenson, Hale & Co.,Inc.
U.S. Department of Agriculture. 1998. The Status of U. S. Agriculture. Commission on 21stCentury Production Agriculture, U.S. Department of Agriculture.
Wisdom, Jay. 1999, July. Presentation to the Colorado Woolgrowers Association AnnualConvention, Grand Junction.
Wyckoff, Reggie. 1995, August. Discussion with Don Senechal.

55
Case Study of Southwest Iowa Soy Cooperative
by Norman Walzer and Mary Holmes
Depressed crop prices leading to lower incomes for farm producers across the United Stateshave motivated many groups to organize in an effort to improve the financial conditions forfarmers. The numerous approaches that have been attempted typically include finding newmarkets for current products, sometimes through niche marketing using an identity preservationtechnique. In other cases, farm producers have tried to reduce operating costs through jointpurchasing or marketing efforts. Still, other producers have tried to obtain economies of scale byincreasing their size of operation through the purchase or rental of additional land.
The specific approach adopted to increase farm incomes depends partly on historical trends,industry structure, market conditions, and the types of products grown in the region. In the GreatPlains and Upper Midwest, producers have had a history of forming cooperatives to lower inputcosts and market output. Many of these cooperatives were formed in the early 1990s, sometimesto bring better services to rural areas. In some cases, the cooperatives then moved on to provideservices beyond their members and even, at times, compete with the membership in servicedelivery.
The 1990s brought a new type of cooperative movement, which focused on adding value tofarm products before they left the producers’ control. These arrangements, New GenerationCooperatives (NGCs), are used in raising fruits and vegetables, corn, soybeans, and livestock.They typically are very different in structure and are unique in product and delivery. A commonfeature, however, is that their mission is to capture a greater share of the profit in the food chain,namely to bring producers a larger share of the profit from raising and delivering agriculturalproducts.
This case study examines an effort in central Iowa to build an NGC based on processingsoybeans into soybean meal and oil with the final products destined for animal feed. The NGC isstill in the early stages and has faced some difficulties reaching the expected market. At the sametime, it has been limited by a decline in the expected crush margin. In subsequent analyses, weexamine approaches used in creating this NGC and try to identify some of the obstacles that wereovercome and those that remain to make the effort profitable.
Background 1
The Southwest Soy Cooperative (SSC), located in Adams County, Iowa, grew out of thegeneral discontent with soybean market prices and a desire to stabilize farm incomes in 1995.Adams County is a rural area located 30 miles north of the Missouri line and 65 miles east of theNebraska line. The nearest major markets for soybeans grown in this area include Omaha (80
1Much of this material is based on a feasibility study which was prepared by Jeff Jobe, USDA-RD,Rural Business-Cooperative Specialist, in 1996. That information is supplemented by personal interviewswith Ray Gaesser, Roy Parsons, and Ken Pangburn which were conducted in July 1999.
56
miles west), Manning, Iowa (90 miles north) and Des Moines, (110 miles northeast). In addition,other smaller processors were setting up operations in the area surrounding Adams County.Previously, the markets were dominated by large conglomerates.
Against this setting of low prices and somewhat limited markets, the Raw AgriculturalProducts Committee (RAPC) of the Adams County Economic Development Corporation wascreated in 1994 to find ways to increase the profit stream from local crops. Several options wereconsidered including raising and cleaning corn to make it food grade, raising horticultural crops,and initiating a large feed lot operation to expand markets for local products. Concerns wereraised about some of the problems that had been experienced with large livestock operations, soattention shifted to processing soybeans into cattle or hog feed since livestock is an importantindustry in the area. For instance, Iowa leads the nation in hog production and is a major exporterof beef. In 1995, the RAPC recommended further exploration of a plant to process soybeans intoa meal for animals and into an oil with multiple commercial and industrial uses. In October 1995,the RAPC requested that the U.S. Department of Agriculture-Rural Development (USDA-RD)undertake a feasibility study of this type of business and make recommendations regarding anorganizational structure to bring it about with a goal of raising the price of soybeans by $1.00 perbushel for members.
Operational Feasibility
Undertaking this type of venture involved leadership from five key individuals, includingproducers and businesses who owned land, with moral and financial support from others in thearea. From the start, the venture was seen as a local economic development project, whichinvolved support from local financial institutions as well as producer members. There is a historyof co-ops in Iowa and neighboring states such as Wisconsin and Minnesota; however, it was anew experience for those involved in this specific endeavor.
The feasibility study, prepared by Jeff Jobe, clearly demonstrated the potential forprofitability of the proposed activity, but it also indicated that the profit margin could benegatively affected by many factors including crush margin (difference between the price paidfor soybeans and the price of soybean meal and oil produced). Likewise, to be profitable, theNGC had to market its output well and reach a specific volume of production. Informed localmanagement was also identified as crucial to the success of this venture. Several sensitivityanalyses were undertaken to illustrate the importance of these factors. Elements such as costs ofinputs, management structure, and markets are not unique to this endeavor. Virtually anybusiness operating on a relatively slim margin must pay attention to them as well. Because oftheir importance to others considering this type of effort, some time is spent on each elementbelow.
Soybeans as InputsThe SSC idea centers on Adams County but also recognizes the surrounding seven counties
as potential suppliers of soybeans. Building on assets of the region, especially as local inputs, isimportant to the success of this venture. Approximately 18.7 million bushels of soybeans are
57
produced in Adams County and the surrounding seven counties annually, with 1.8 millionbushels produced in Adams County alone according to Jobe’s 1996 feasibility study.
Producing soybeans is not the issue; retaining the income on the farm is the bigger question.Jobe estimates that 40 percent of the soybeans in Iowa are exported without further processing. Ifvalue is added to the soybeans, it mainly comes from feeding livestock and marketing the animalproducts. In 1996, Jobe estimated that 68.8 million bushels of soybeans were consumed bylivestock as soybean meal, and this meal was processed at 24 existing facilities.
The issue that faced the potential investors in the soybean processing cooperative, then, washow to organize and create a facility that could further process the soybeans and allow farmer-producers to capture a share of the income generated from this processing endeavor. At the sametime, if the venture created jobs, residents in nearby communities could gain. It was clear fromthe beginning, however, that a large number of full-time jobs would not be created in this type ofventure. Nevertheless, if the farmer-producers received higher incomes from soybeans produced,the additional income would be spent locally thereby stimulating the economies of surroundingcommunities. Thus, local business leaders and financial institutions had reason to invest in thistype of venture, and, in fact, the venture was supported by both financial institutions andcommercial business interests.
Structuring the Business VentureThere are two ways in which farmer-producers in this type of venture can earn additional
income. First, they can receive a premium for the grain supplied to the co-op. A premium forproducers, of course, means higher input costs to the business venture than would have occurredif the soybeans were purchased on the open market. The premium, however, provides animmediate benefit to co-op members and offers an incentive to join the overall effort.
Second, members of the co-op share in the returns from the enterprise if it makes a profit, ormay have to make additional financial contributions if the venture does not meet expectations.Assuming profitability of the co-op, members will receive a return on their investment. Thisreturn depends on the profits which, in turn, depend on accessing lucrative final markets andkeeping the production process as close to the final consumer as possible.
The soybean processing plant uses an Insta-Pro (R) extrusion-expelling process2 to convertthe soybeans into a meal and extract the oil. A detailed description of the precise process is notneeded here, but the extruder “generates heat through friction to cook, sterilize, stabilize,texturize, and dehydrate the soybean” (Jobe 1996). The process creates a high-quality animalfeed with a high fat content that is readily accepted by animals as a protein supplement.
Extruded-expelled soybean meal contains 45 percent crude protein and 7 percent crude fat.The extruded-expelled meal is produced by an environmentally sound process that does notrequire solvent extraction of the oil. Through this process, the meal does not assume the bittertaste typically associated with the solvent-extraction process. The meal is a golden color with a
2Manufactured by Insta-Pro International, 10301 Dennis Drive, Des Moines, IA 50322.
58
low moisture percentage. It is typically used to replace conventional soybean meal and some ofthe fat in any diet. It is ideal for pig starter where a low level of antinutritional factors arerequired. It is also an ideal source of the bypass amino acids required for milk production.
A 1994 study conducted at Kansas State University concluded that nutrient digestibilitiesand availabilities of indispensable amino acids tended to be greatest in extruded soybeans. TheInsta-Pro extrusion process was compared with conventional soybean meal and roasted soybeanmeal.
Potential MarketsInitially, the SSC targeted pork producers as a main market for the soybean meal as a protein
supplement. According to Jobe (1996, 12), the soybean meal contains 7 percent fat making it ahigh energy supplement which represents a 44-46 percent protein supplement. Iowa is numberone in the nation in pork production at 5.35 billion pounds of pork processed in 1997.
The intended market radius was approximately 40 miles wide with an expected 500 to 700potential hog producers. The revised market is 70 to 80 miles from the production point. SSC hasa production goal of 400 tons of meal per month and understands that, with recent consolidationsof hog production, growth in markets must come from dairy production, and efforts have beendirected to those customers. Thus far, in the Midwest, the dairy operations have not followed hogproduction patterns toward consolidation and vertical integration. However, interviews with SSCpersonnel demonstrated an understanding of the need to access new high volume and nichemarkets.
The local market for soybean meal was expected to be substantial. The feasibility studyindicated that in the eight counties, including Adams, there is a demand for 61,557 tons ofprotein supplement per year. Under the expected production targets, the SSC would produce13,456 tons per year or approximately 21.9 percent of the local demand, with the remaining mealobtained from the closest markets that are within an 80 mile radius of the processing facility.
In addition to the feed supplement, the soybean process generates a variety of oils forcommercial and industrial uses. Potential markets for these products were less well-defined butKraft Foods in Jacksonville, Illinois (309.4 miles away), and a local feed supplier in the eight-county area were identified in the feasibility study. With additional research and the possiblerefinement of the oil, it is possible that other industrial markets could be found, but reachingthese markets could mean additional processing facilities and higher subsequent costs to the co-op as well. While investors generally recognized these potential markets, they did notaggressively pursue them as part of the initial venture.
To assess local interest in starting a soybean processing venture, the steering committeeundertook a survey of farmer-producers in the region. In the winter of 1995, a local mediacampaign was conducted using newspapers and radio to generate an awareness of the effort andto possibly stimulate interest in becoming involved. A mail questionnaire had been sent toapproximately 4,000 residents to determine whether they would be interested in investing in thisventure and/or willing to purchase the soybean meal produced to use in their feeding operations.No effort was made to obtain a complete sample of soybean producers in the area; rather, the
59
intent was only to determine whether a sufficient number of producers were interested inengaging in this venture to make it succeed.
According to the feasibility study, the survey identified a willingness to commit 206,000bushels of soybeans to the process. Overall, 34 producers completed the surveys, 23 reportedbeing “very interested,” and 10 reported “an interest if more information could be provided.” The206,000 bushels reported as a possible commitment represented approximately two-thirds of theplanned production in the initial year. Thus, it was clear from the outset that additionalcommitments by farmer-producers would be needed to provide a stable supply of soybeans forthis processing plant. Likewise, concern was expressed in the feasibility study regarding theadequacy of the market for the soybean meal (Jobe 1996, p. 11).
In fact, many entrepreneurs experience difficulties accurately accessing the market(s) fortheir product, and this may be one of the most serious shortcomings in business start-ups,especially those involving farm products. In the past, farmer-producers relied on an extensivemarketing system for their products; namely, they delivered grain to a local elevator or riverterminal.
Engaging in value-added business, on the other hand, represents a set of entirely differenttasks, some of which producers have not had to deal with extensively in the past. Obtaining acommitment from producers to provide the inputs to the soybean processing plant is certainly atthe top of the list of tasks that need to be accomplished. Identifying markets to be served alsoranks high. Putting together a financial package to make the operations profitable requires skillsand familiarity with issues that not all farmer-producers possess.
Organizing the soybean processing activity, therefore, required professional skills inmarketing, finance, and production management. This combination of skills was not likely to befound among members of the proposed co-op. Thus, it was essential that a professional managerbe hired for the venture, and that decision was made early in the process. Hiring the managerearly in the process makes sense because then the manager can assist in organizing themembership drive. As is noted later, some difficulties arose with this position that may havedelayed the profitably of the enterprise.
To determine interest in joining the proposed venture, 200 surveys were mailed out tofarmer-producers, of which 130 responses were obtained with 70 of those indicating an interestin becoming members. A majority of the members purchased one or two shares. The memberstypically have larger than average farm size. Members must commit 1,300 bushels of soybeansper share per year, which represents approximately 29 acres of soybeans.
Several approaches could have been used to attract members and participants to the co-op.First, the basic membership should always be made up of the farmer-producers who supplysoybeans to the processing plant. Second, it is also possible to structure the co-op to includeusers of the final product. In this case, it would be pork producers who would receive a returnbased on the amount of soybean meal purchased. Including the users makes sense because ithelps solidify the markets. On the other hand, it can be difficult to attract these members due to
60
commitments they may already have with suppliers or competition from other purchasingcooperatives with established markets.
In fact, as hog producers increased in size, the industry, became vertically integrated,meaning that many large producers already have sources for purchasing feed. Competing withthese markets means that the SSC must establish its product as superior in weight-gainingpotential, lower cost, or providing some other advantage. In addition, it must establish a lastingpresence as a dependable supplier for users to shift from their existing feed sources. This hasproved difficult for SSC for several reasons.
1. The main advantage of the extruder process used by SSC is that animals gain moreweight per pound of meal fed than in the case of the feed supplied by competitors. Ashas been determined through interviews (see footnote 1), local informal tests byproducers have documented this fact. The estimated cost savings, based on informaltests, is between $35 and $40 per ton gained. However, for these gains to be acceptedby a large number of hog producers and cause them to shift from current suppliersrequires independent tests and documentation by an impartial source such as auniversity. These tests are estimated to cost between $30,000-$50,000. While fundsexist for tests and documentation of innovative productions, it is difficult to make thecase that what is being done by SSC should be included in the innovative category.These tests are somewhat expensive and have, to this point, been beyond the means ofthe SSC in its fledgling operations since 1997.
2. Meeting expected production levels to make the processing plant financially stablerequires a specific level of operation. The feasibility study is based on two eight-hourshifts. To reach this target, requires a larger market than the co-op currently has. Theupshot is that financial losses, even though manageable, have occurred, weakening theconfidence of purchasers that the co-op will survive. At the same time, without theadditional volume and markets, it is difficult for the co-op to prove that it can last. Inmany ways, these difficulties are not unexpected or unusual for a business in its earlyoperations but point out the importance of having adequate financial capital andmanagement in place when the venture begins.
Getting Started
The SSC began operations in 1997 as a closed co-op organized under Chapter 501 of theIowa Code. Selection of a co-op style of business was made mainly for the following reasons:(1) Iowa statutes limit the size of corporations to a maximum of 35 investors; since the intentwas to work with a larger number of farmer-producers in the soybean processing plant, analternative organizational structure was needed, and (2) co-ops provide tax advantages overlimited liability corporations.
The SSC started with 70 members in 1997, and the number has declined to 58 in 1999. Eachmember contributed $1,500 at the beginning plus a commitment of 1,300 bushels of soybeans tobe delivered to the processing plant annually. Operating losses forced a call for an additional
61
infusion of funds in 1999. It took between 18 and 24 months to go from the start of discussionsto the actual formation of the co-op. SSC is managed by a five-person board of directors, eachserving a three-year term. The terms are staggered so that each year approximately the samenumber of members are elected.
While initial plans called for a location in the Bluegrass Industrial Park in Corning, Iowa, analternative site was found in a vacant elevator that already contained storage facilities. Anarrangement was made with the owner to rent the facilities for $3,500—essentially the cost ofstorage fees for the soybeans—but the SSC had to rehabilitate the building for use and thisrehabilitation project was more expensive ($100,000) than had been budgeted ($40,000). Thehigh cost of rehabilitating the building, in turn, drained the funds for alternative uses such asmarket development or professional staff. The SSC also worked with utilities to obtain areduction of 5 to 6 percent in utility costs.
Financial Structure
In order to meet its anticipated capitalization needs of $530,000, the SSC is financedthrough several funding sources (Table 1):
1. Members contributed a total of $200,000 in cash from sales of 128 shares to 70members in 1997. This represents approximately 40 percent of the total financing.Because of operating losses in 1998 and expected losses in 1999, each member wasrequired to contribute an additional $650. In some instances, participants decided not tocontinue their membership and forfeited their initial investment.
2. The SSC borrowed $140,000 through a revolving loan fund from the Southwest IowaCoalition at 5 percent interest. This is a ten-year loan and demonstrates theparticipation of local economic development groups working with private businesses tostimulate the local economy.
3. The USDA-RD loaned the SSC $90,000 at 8.5 percent for 15 years under the DirectBusiness and Industry Loan program. This is a federal program designed to createadditional jobs in distressed areas. It provides a source of needed funds for manybusiness start-ups.
4. Iowa has a Rural Economic Value-Added Mentoring Program (REVAMP) to assist increating value-added businesses and to help provide jobs in rural areas. The SSCobtained two grants through this program totaling $25,000. The first grant was for$16,500. These funds were used to pay the Small Business Development Center fordeveloping the Business Plan, and the balance was used for legal costs incurred in thedevelopment of the organization. A second grant for $8,500 was used hire aprofessional consultant to work on a marketing plan.
5. The Iowa Farm Bureau and the Iowa Soybean Board each contributed $10,000. Thesefunds were used to retain a marketing and sales consultant to work with the SSC.
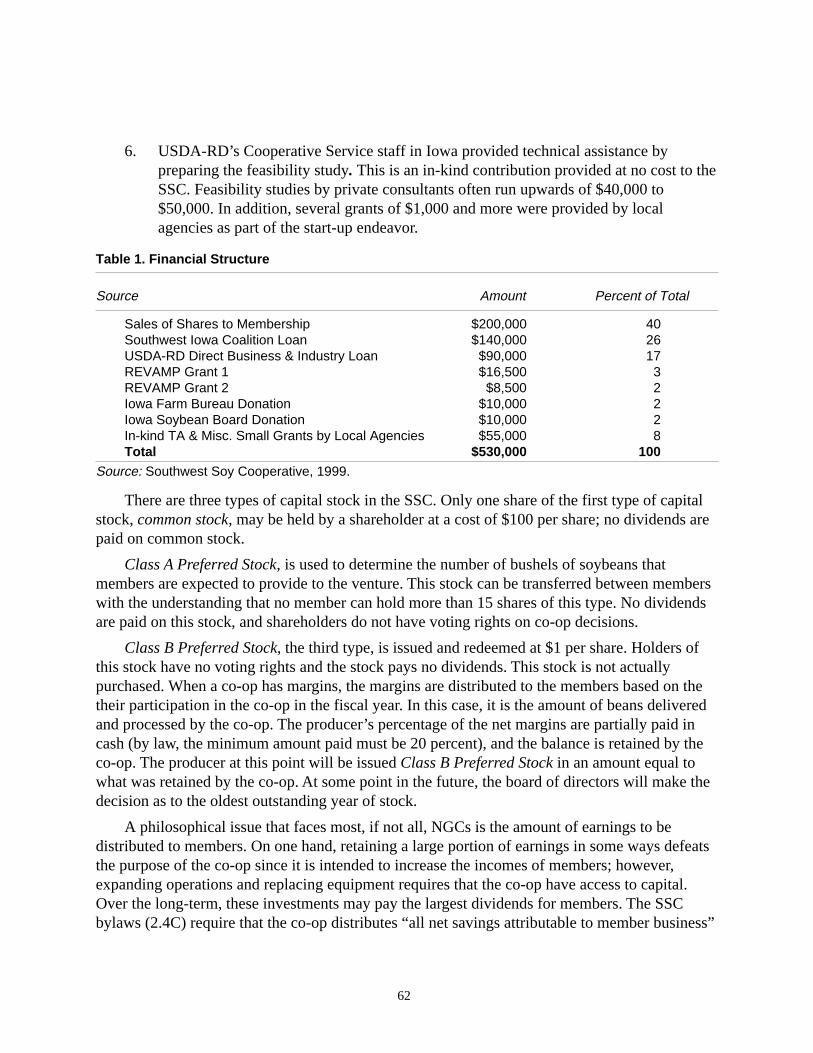
62
6. USDA-RD’s Cooperative Service staff in Iowa provided technical assistance bypreparing the feasibility study. This is an in-kind contribution provided at no cost to theSSC. Feasibility studies by private consultants often run upwards of $40,000 to$50,000. In addition, several grants of $1,000 and more were provided by localagencies as part of the start-up endeavor.
Table 1. Financial Structure
Source Amount Percent of Total
Sales of Shares to Membership $200,000 40Southwest Iowa Coalition Loan $140,000 26USDA-RD Direct Business & Industry Loan $90,000 17REVAMP Grant 1 $16,500 3REVAMP Grant 2 $8,500 2Iowa Farm Bureau Donation $10,000 2Iowa Soybean Board Donation $10,000 2In-kind TA & Misc. Small Grants by Local Agencies $55,000 8Total $530,000 100
Source: Southwest Soy Cooperative, 1999.
There are three types of capital stock in the SSC. Only one share of the first type of capitalstock, common stock, may be held by a shareholder at a cost of $100 per share; no dividends arepaid on common stock.
Class A Preferred Stock, is used to determine the number of bushels of soybeans thatmembers are expected to provide to the venture. This stock can be transferred between memberswith the understanding that no member can hold more than 15 shares of this type. No dividendsare paid on this stock, and shareholders do not have voting rights on co-op decisions.
Class B Preferred Stock, the third type, is issued and redeemed at $1 per share. Holders ofthis stock have no voting rights and the stock pays no dividends. This stock is not actuallypurchased. When a co-op has margins, the margins are distributed to the members based on thetheir participation in the co-op in the fiscal year. In this case, it is the amount of beans deliveredand processed by the co-op. The producer’s percentage of the net margins are partially paid incash (by law, the minimum amount paid must be 20 percent), and the balance is retained by theco-op. The producer at this point will be issued Class B Preferred Stock in an amount equal towhat was retained by the co-op. At some point in the future, the board of directors will make thedecision as to the oldest outstanding year of stock.
A philosophical issue that faces most, if not all, NGCs is the amount of earnings to bedistributed to members. On one hand, retaining a large portion of earnings in some ways defeatsthe purpose of the co-op since it is intended to increase the incomes of members; however,expanding operations and replacing equipment requires that the co-op have access to capital.Over the long-term, these investments may pay the largest dividends for members. The SSCbylaws (2.4C) require that the co-op distributes “all net savings attributable to member business”
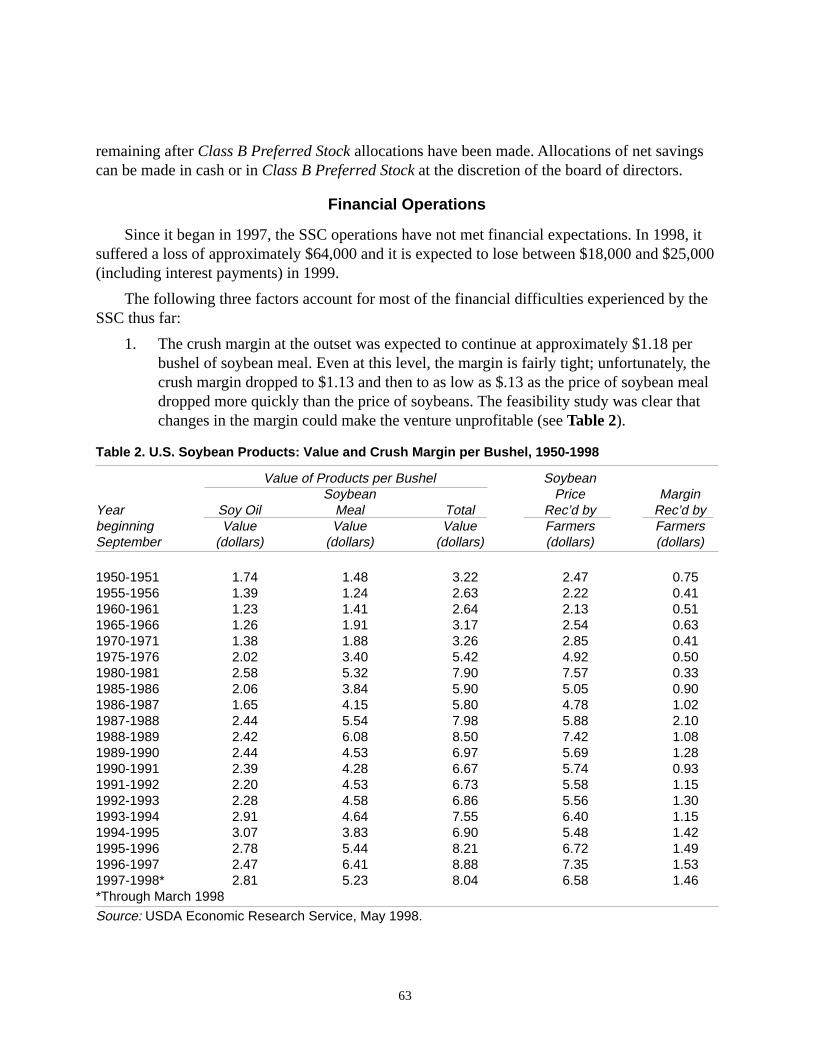
63
remaining after Class B Preferred Stock allocations have been made. Allocations of net savingscan be made in cash or in Class B Preferred Stock at the discretion of the board of directors.
Financial Operations
Since it began in 1997, the SSC operations have not met financial expectations. In 1998, itsuffered a loss of approximately $64,000 and it is expected to lose between $18,000 and $25,000(including interest payments) in 1999.
The following three factors account for most of the financial difficulties experienced by theSSC thus far:
1. The crush margin at the outset was expected to continue at approximately $1.18 perbushel of soybean meal. Even at this level, the margin is fairly tight; unfortunately, thecrush margin dropped to $1.13 and then to as low as $.13 as the price of soybean mealdropped more quickly than the price of soybeans. The feasibility study was clear thatchanges in the margin could make the venture unprofitable (see Table 2).
Table 2. U.S. Soybean Products: Value and Crush Margin per Bushel, 1950-1998
Value of Products per Bushel SoybeanSoybean Price Margin
Year Soy Oil Meal Total Rec’d by Rec’d bybeginning Value Value Value Farmers FarmersSeptember (dollars) (dollars) (dollars) (dollars) (dollars)
1950-1951 1.74 1.48 3.22 2.47 0.751955-1956 1.39 1.24 2.63 2.22 0.411960-1961 1.23 1.41 2.64 2.13 0.511965-1966 1.26 1.91 3.17 2.54 0.631970-1971 1.38 1.88 3.26 2.85 0.411975-1976 2.02 3.40 5.42 4.92 0.501980-1981 2.58 5.32 7.90 7.57 0.331985-1986 2.06 3.84 5.90 5.05 0.901986-1987 1.65 4.15 5.80 4.78 1.021987-1988 2.44 5.54 7.98 5.88 2.101988-1989 2.42 6.08 8.50 7.42 1.081989-1990 2.44 4.53 6.97 5.69 1.281990-1991 2.39 4.28 6.67 5.74 0.931991-1992 2.20 4.53 6.73 5.58 1.151992-1993 2.28 4.58 6.86 5.56 1.301993-1994 2.91 4.64 7.55 6.40 1.151994-1995 3.07 3.83 6.90 5.48 1.421995-1996 2.78 5.44 8.21 6.72 1.491996-1997 2.47 6.41 8.88 7.35 1.531997-1998* 2.81 5.23 8.04 6.58 1.46*Through March 1998
Source: USDA Economic Research Service, May 1998.
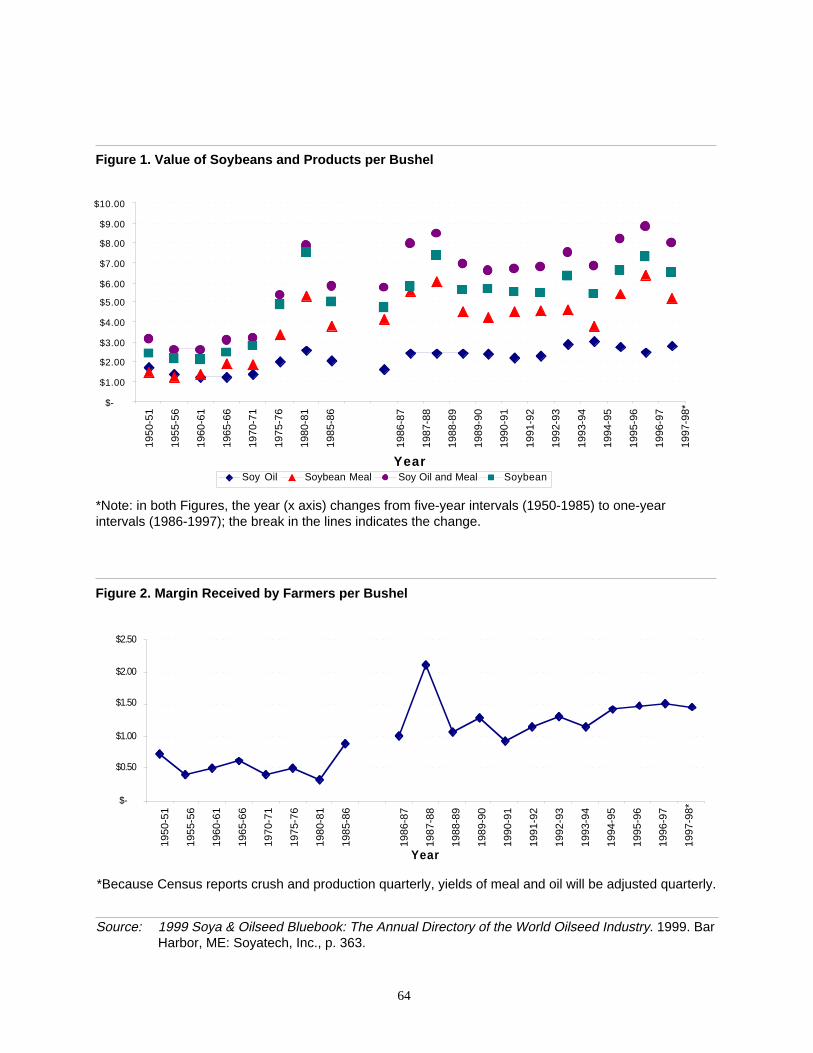
64
$-
$0.50
$1.00
$1.50
$2.00
$2.50
1950
-51
1955
-56
1960
-61
1965
-66
1970
-71
1975
-76
1980
-81
1985
-86
1986
-87
1987
-88
1988
-89
1989
-90
1990
-91
1991
-92
1992
-93
1993
-94
1994
-95
1995
-96
1996
-97
1997
-98*
Year
Source: 1999 Soya & Oilseed Bluebook: The Annual Directory of the World Oilseed Industry. 1999. BarHarbor, ME: Soyatech, Inc., p. 363.
*Because Census reports crush and production quarterly, yields of meal and oil will be adjusted quarterly.
*Note: in both Figures, the year (x axis) changes from five-year intervals (1950-1985) to one-yearintervals (1986-1997); the break in the lines indicates the change.
$-
$1.00
$2.00
$3.00
$4.00
$5.00
$6.00
$7.00
$8.00
$9.00
$10.00
1950
-51
1955
-56
1960
-61
1965
-66
1970
-71
1975
-76
1980
-81
1985
-86
1986
-87
1987
-88
1988
-89
1989
-90
1990
-91
1991
-92
1992
-93
1993
-94
1994
-95
1995
-96
1996
-97
YearSoy Oil Soybean Meal Soy Oil and Meal Soybean
1950
-51
1955
-56
1960
-61
1965
-66
1970
-71
1975
-76
1980
-81
1985
-86
1986
-87
1987
-88
1988
-89
1989
-90
1990
-91
1991
-92
1992
-93
1993
-94
1994
-95
1995
-96
1996
-97
1997
-98*
Figure 1. Value of Soybeans and Products per Bushel19
50-5
1
1955
-56
1960
-61
1965
-66
1970
-71
1975
-76
1980
-81
1985
-86
1986
-87
1987
-88
1988
-89
1989
-90
1990
-91
1991
-92
1992
-93
1993
-94
1994
-95
1995
-96
1996
-97
1997
-98*
Figure 2. Margin Received by Farmers per Bushel
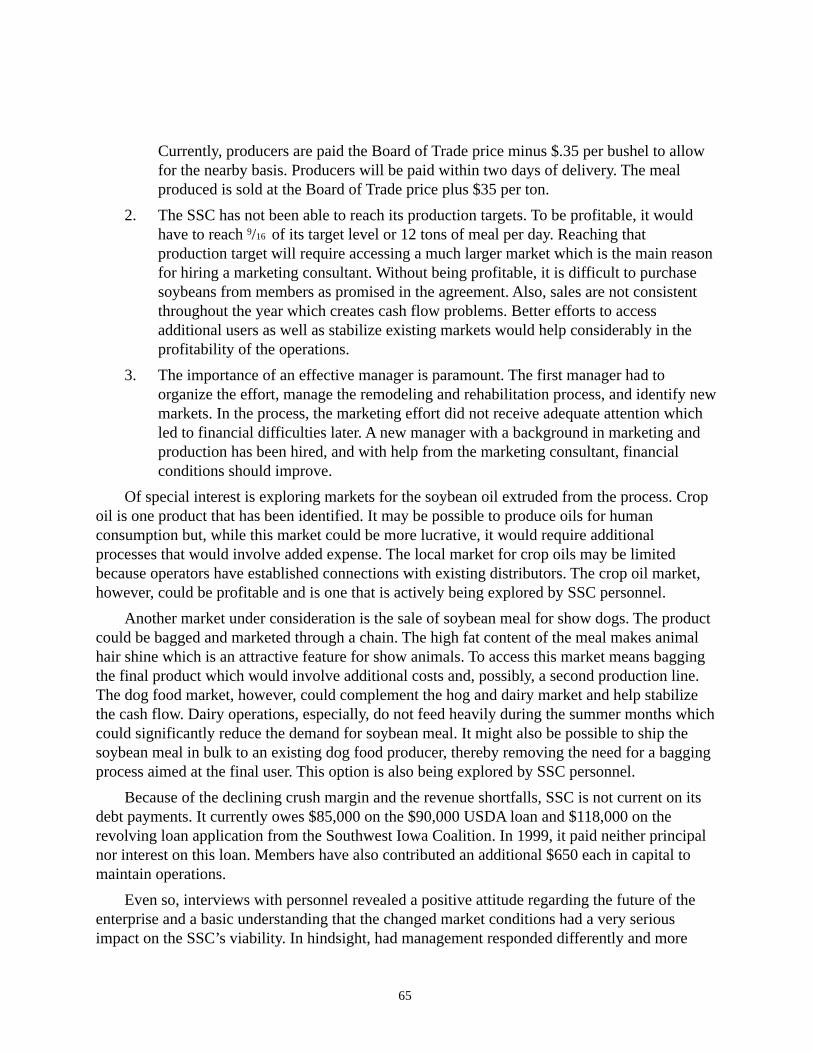
65
Currently, producers are paid the Board of Trade price minus $.35 per bushel to allowfor the nearby basis. Producers will be paid within two days of delivery. The mealproduced is sold at the Board of Trade price plus $35 per ton.
2. The SSC has not been able to reach its production targets. To be profitable, it wouldhave to reach 9/16
of its target level or 12 tons of meal per day. Reaching that
production target will require accessing a much larger market which is the main reasonfor hiring a marketing consultant. Without being profitable, it is difficult to purchasesoybeans from members as promised in the agreement. Also, sales are not consistentthroughout the year which creates cash flow problems. Better efforts to accessadditional users as well as stabilize existing markets would help considerably in theprofitability of the operations.
3. The importance of an effective manager is paramount. The first manager had toorganize the effort, manage the remodeling and rehabilitation process, and identify newmarkets. In the process, the marketing effort did not receive adequate attention whichled to financial difficulties later. A new manager with a background in marketing andproduction has been hired, and with help from the marketing consultant, financialconditions should improve.
Of special interest is exploring markets for the soybean oil extruded from the process. Cropoil is one product that has been identified. It may be possible to produce oils for humanconsumption but, while this market could be more lucrative, it would require additionalprocesses that would involve added expense. The local market for crop oils may be limitedbecause operators have established connections with existing distributors. The crop oil market,however, could be profitable and is one that is actively being explored by SSC personnel.
Another market under consideration is the sale of soybean meal for show dogs. The productcould be bagged and marketed through a chain. The high fat content of the meal makes animalhair shine which is an attractive feature for show animals. To access this market means baggingthe final product which would involve additional costs and, possibly, a second production line.The dog food market, however, could complement the hog and dairy market and help stabilizethe cash flow. Dairy operations, especially, do not feed heavily during the summer months whichcould significantly reduce the demand for soybean meal. It might also be possible to ship thesoybean meal in bulk to an existing dog food producer, thereby removing the need for a baggingprocess aimed at the final user. This option is also being explored by SSC personnel.
Because of the declining crush margin and the revenue shortfalls, SSC is not current on itsdebt payments. It currently owes $85,000 on the $90,000 USDA loan and $118,000 on therevolving loan application from the Southwest Iowa Coalition. In 1999, it paid neither principalnor interest on this loan. Members have also contributed an additional $650 each in capital tomaintain operations.
Even so, interviews with personnel revealed a positive attitude regarding the future of theenterprise and a basic understanding that the changed market conditions had a very seriousimpact on the SSC’s viability. In hindsight, had management responded differently and more
66
quickly to events when the operation was beginning, the financial condition might be somewhatdifferent. However, the main factors contributing to the delayed profitability have been theinability to market the soybean meal and oils effectively and the declines in the crush margin.While the former might have been affected by different management personnel and practices, thelatter is largely beyond the control of SSC personnel.
Lessons Learned and Ways To Proceed
While the SSC is still not profitable in its second full year of operation, this is not at alluncommon for businesses just starting up. SSC management seems cautiously optimistic at thispoint and has plans for expanding the market. The initial manager has been replaced, and theoperation is producing a high-quality product with a high weight-gain potential for animals.
At this point, one might ask what can be learned by other investors interested in startingcomparable ventures. Market fluctuations can never be controlled, or even anticipated,completely. Declines in the crush margin and the consequences for the co-op’s profitability arehard to avoid even though the feasibility study highlighted this issue and reported that even slightchanges in market conditions could have a serious effect on profits. Perhaps the lesson to belearned from this experience is to raise sufficient capital to weather revenue shortfalls in the earlyyears of operation. Insufficient capital is a problem faced by many, if not most, small businessesin their early years.
The cost of the new machinery for this production process was $89,450. The relatively softmarket currently has made used machinery available. New groups interested in replicating themachinery and equipment in the SSC plant could probably purchase the equipment used. Ofcourse, purchasing used equipment always holds a risk factor of dependability and potentiallyhigher costs of repairs. Indeed, some of the programs financing these operations may imposerestrictions regarding dependability of equipment, a requirement to purchase instate, or otherconsideration that could prevent a purchase of used equipment. Despite potential restrictions,serviceable used equipment can reduce the amount of initial capital needed and could allowfunds to be used for market development, management services, and other expenses instead.
Perhaps a more useful lesson to be learned from the experiences of this venture is theimportance of identifying and/or establishing markets prior to starting operations. The feasibilitystudy made clear that additional commitments were needed for the business to be profitable. Hadthe current effort of involving a professional marketing consultant been started earlier, thesemarkets might have made the difference in profitability.
The vertical integration in hog production with greater reliance on established suppliers hasbeen underway for several years, but its impact on the SSC might not have been evident at thestart. Once again, the importance of identifying solid markets is key to the profitability of thisbusiness, and additional research on market trends might have prevented several lean years in theoperation.
Finally, current efforts to identify alternative markets for both soybean oil and meal are keyto continued operations. If the dog food and dairy markets for meal materialize, they could
67
substantially improve the profitability of SSC and help stabilize the markets. A more positivecash flow would allow the manager to work with farm-producers on a regular delivery schedule.The uneven demands for beans makes it difficult for farm producers to know when they willhave to deliver soybeans to the plant.

69
Golden Triangle Energy Cooperative, Inc. Ethanol Plant
by Rodney Fink
Background/Profile of Cooperative
Statewide GuidanceThe Missouri Corn Growers Association (MCGA) and the Missouri Corn Merchandising
Council (MCMC) studied the potential for corn processing plants in the state and funded severaleconomic studies in the early 1990s. Officers of the Corn Board lobbied major ethanol producersand encouraged them to build a plant in the state. Companies such as Archer Daniels Midlands(ADM) and Farmland Industries were contacted but were unresponsive to expandingconstruction to north Missouri. Gary Marshall, Executive Director of the MCGA, encouragedseveral members to take the initiative and model a cooperative after those that had succeeded inMinnesota and the Dakotas. The Golden Triangle Energy Cooperative (GTEC), developed innorthwest Missouri, and the Northeast Missouri Grain Processing Cooperative is underconstruction in Macon, Missouri. (Ground breaking for the northeast Missouri plant was on April17, 1999.)
BeneficiariesAccording to studies by Van Dyne and Associates (Van Dyne 1993; Van Dyne and Braschler
1996; Van Dyne, Braschler, and Blase 1996) the state and area where the plant was locatedwould benefit. The economic effect of a successful plant would be felt in the community wherethe plants were located and would add economic advantage to the entire region. The state wouldbenefit from the taxes being generated in the state rather than in neighboring states with similarproduction units. Communities visited by the researchers were enthusiastic about the possibilityof new employment opportunities. The following positive benefits were cited in their studies:
• Positive balance of trade impact which would bring more income into the regionbecause products that were previously purchased would be produced locally andexported to other regions.
• Increased value-added to the corn crop which would benefit the producers and possiblyprovide more revenue to the local community.
• Increased investments in plants and equipment which would stimulate the localeconomy by providing construction jobs initially and the chance for full-timeemployment after the plant is completed.
• Net increase in jobs and income in each community and in the state would result duringconstruction and continue after the plant begins operation. Secondary employment isalso possible as associated industries develop as a result of plant byproducts becomingavailable at a competitive price.
70
• Increased local and state revenues collected from corn processing plant operationswould stimulate local and state tax revenues and provide funds for improvements to thecommunity and to the region.
• Likely increase in associated businesses resulting from the ethanol plant as theincreased numbers of jobs would require additional goods and services because of theexpanded workforce.
• Environmental benefits to the state from the use of ethanol-blended transportation fuelsin automobiles and other engines.
Positive Benefits from Ethanol PlantsMost states with corn processing plants have reported positive benefits from their operation.
In addition, many states offer financial incentives for corn processing plants; the benefits of theseincentives must be quantified so that the net value to the state can be identified and assessed. InMissouri, the state incentives include an annual $.20 per gallon production incentive (for up to12.5 million gallons and $.05 thereafter) for the first five years of plant operation. Plantownership also affects the increased revenues that accrue to local and state governments. InMinnesota, most corn processing plants are owned as New Generation Cooperatives (NGCs). Inthis ownership structure, assumed net earnings are distributed to member-owners, and local,state, and federal income taxes are paid by member-owners. When the plant operates as acorporation, income taxes are paid by the corporation, and dividends are distributed toshareholders who pay personal income tax on dividend earnings, creating double taxation. GTECis an NGC, and income taxes are assumed to be paid by the member-owners with no corporatetaxes collected.
Plant LocationA study by Van Dyne (1993) in the early 1990s found considerable enthusiasm for locating
an ethanol plant in communities of northwest Missouri. The state of Missouri designatedSt. Joseph a depressed economic region, and local leaders supported an ethanol plant for theregion. Members of the St. Joseph Area Chamber of Commerce promoted the program andassisted in raising venture capital. The original intent was to construct the facility in St. Josephbut difficulties in finding a site necessitated moving the facility to another town. One factorwhich necessitated the move was a requirement that a USDA loan guarantee is available only totowns with populations of less than 50,000. Craig, Missouri (population 347), surfaced as a goodsite since it had the physical characteristics needed for an ethanol plant—namely, (1) has anadequate water supply, (2) possesses a natural gas line, (3) is close to an interstate highway, and(4) has a major railroad line (the Burlington Northern passes through).
Approximately 40 acres are needed for the construction site, and adequate land wasavailable near Craig. The site selected contains 91 acres and is located along a BurlingtonNorthern Santa Fe (BNSF) railway line and less than one-half mile from the intersection ofInterstate 29 and U.S. Highway 59. The site can be served by two electric utility companies, anda gas pipeline is located under the site. GTEC plans to tie into the city of Craig for water and
71
sewer utilities. The site provides easy access for grain trucks moving through the area and islarge enough to house associated industries that wish to locate nearby.
Design, Construction, and LeadershipSeveral ethanol plant designers (including Broin Enterprises, Inc., of Sioux Falls, South
Dakota, and Delta T) and the likely contractor, Feagan, Inc., have met with the GTEC boardduring the planning process. Feagan Inc., and Broin Enterprises, Inc. expressed interest ininvesting in the cooperative that would require the creation of a Limited Liability Company(LLC).1 This would require joint governance by the GTEC and the LLC. Feagan, Inc. has builtplants in Minnesota and in the Dakotas and is an experienced builder of ethanol plants. TheBoard of Directors consists of 13 members who have been active throughout the process,providing input, decisions, direction, and financing.2 All GTEC board members have made amajor investment of time and money to help get the project underway.
Key PlayersMany key players exist in the project. The board president and the board members have all
been supportive, persevering, and diligent in the years since the project was initiated.3 Earlysupport and encouragement came from the MCGA and MCMC. They funded feasibility andbenefit studies, and the executive director of MCGA encouraged several individuals (now GTECboard members) to move ahead with the project. Support from a retired official of FarmlandIndustries and a local radio station director (who additionally serves as the Chamber ofCommerce farm committee chairman) also helped drive the project.4
The first venture capital committed to the project was $40,000 from the Kansas City/St.Joseph, Missouri, Diocese Catholic Charities organization. The director of Catholic Charitiessaid the organization wanted to support economic development in rural areas and liked the ideaof adding value to local products and creating jobs for local people.5 The MCMC (with check-offfunds) matched the $40,000 commitment of Catholic Charities and additional organizationsadded venture capital for a total of $180,000. The venture capital raised from these sources washeld in a Community Development Corporation named “AGRIVEST,” which was created tohold funds until needed for the organization.
The corporation plans to continue after GTEC begins operation and assist the formation ofadditional economic development ventures for the region. The board consists of officers(president, vice-president, and treasurer) from Catholic Charities and current members of theGTEC board. The cooperation of these people enabled the project to begin by providing the riskcapital that encouraged others to join as well. When the construction phase begins (when theinvestments, contracts, and loan are signed), all venture capital investors will be paid the initialinvestment plus a matching amount (thus Catholic Charities will receive $80,000). The paybackcan be retained by the contributing organizations, although the hope is that the funds will remainintact and be available for future economic ventures to support the region (share ownership inGTEC is also a possibility). Board members, who also made a considerable investment of time
72
and fundraising (in addition to their shares in the venture), will receive a payback when the finalloan fund is placed in operation.
The combination of organizations and individuals is a good model for economicdevelopment. Catholic Charities wanted to help the economy by creating jobs; the chamber ofcommerce also wanted to help the local economy; and the farmers involved wanted to add valueto their grain. The MCMC provided funding for the initial studies that generated interest byfarmers, and it also matched the funding by Catholic Charities. The reinvestment of funds tothese organizations by GTEC will provide further impetus to future economic developmentendeavors. The actions of these groups can provide a good model for other communities inpromoting economic development. Likewise, continued cooperation of these organizations cangenerate additional business opportunities for the St. Joseph area.
Start-Up FundingCatholic Charities is credited with providing the initial funding that enabled the project to
start. After providing much assistance during the Missouri River flood of 1993, the Kansas City/St. Joseph Diocese of the Catholic Church wanted to support economic development that wouldbenefit rural areas, especially the creation of jobs. Representatives of Catholic Charities met withSt. Joseph Area Chamber of Commerce officials and asked what projects might be available thatcould use assistance in the form of “seed money.” Among projects considered was GTEC.Catholic Charities initially intended to provide the funding as a grant, but the acceptance wasmade with the understanding that they would be repaid or would become shareholders. Theinitial commitment of Catholic Charities is credited with providing the momentum to start thecooperative. When groundbreaking took place, the St. Joseph/Kansas City Diocese leaders werekey participants.
Regional SupportThe St. Joseph Area Chamber of Commerce provided early assistance to the project with in
kind support such as accounting, office help, and general project assistance.4 The chamberpresident was supportive as was the Farm Committee Chairman, with one member, a FarmDirector of KFEQ (now Farm Director of WHO in Des Moines, Iowa), being a key player andpromoter. According to the Farm Committee Chairman, the St. Joseph Chamber served as theoffice and clearinghouse for the project as it developed. The Agribusiness Committee of theChamber existed before the Chamber of Commerce was established; however, it had beensomewhat inactive in recent years. The chamber president, a chamber employee, the FarmCommittee Chairman, and an interested and committed board nucleus supported and promotedthe creation of an ethanol plant.7 The chamber not only provided an office and served as acoordinating body for GTEC, it also lobbied the state legislature for incentives for ethanolproduction. [When Catholic Charities contacted the chamber in search of a job creation project,GTEC was suggested to them as a possibility. Catholic Charities liked the idea of adding value tolocal products and especially liked the job creation potential of an ethanol plant.] MalcomMcCance, an employee of the St. Joseph Chamber and GTEC board member (currentlyemployed by GTEC as working manager), conducted much of the initial coordination for GTEC
73
and assisted its Board in facilitating the project.8 According to Wergen, the ingredients that madethis project successful include the following:
• The presence of a good idea (ethanol plant)
• The presence of a good group of people to promote, invest in, and raise funds for theproject (GTEC Board)
• Support of a local group that could coordinate and help in the initial stages (the FarmCommittee of the St. Joseph Chamber of Commerce)
• The presence of groups willing to invest in the project (Catholic Charities and others)
Proposed Plant
Dry Milling Process
The proposed plant will utilize a dry milling process (in contrast to a wet milling process)that will produce ethanol and high protein dried distillers grains and solubles (DDGS). Carbondioxide is also produced in the processing; some plants recover it for sale while others do not. Inthe wet milling process, which is usually found in larger plants, a variety of products, in additionto ethanol, such as starch, corn syrup, corn gluten feed, corn oil, and carbon dioxide, can beproduced.
Plant Input and Output
Corn prices fluctuate widely, depending on weather and international demand; analysespredicting long-term benefits use long-term averages in the vicinity of $2.30 per bushel. Theoutput from a bushel of corn is about 2.7 gallons of ethanol and 16 pounds of DDGS. Assuminga sales price of $1.20 per gallon of ethanol and $120 per ton of DDGS (currently less but $120 isconsidered a long-term average), the value for ethanol is $3.24 and for DDGS $0.96 or a totalvalue of $4.20 per bushel of corn. Thus, the value-added is $1.90 per bushel of corn. At fulloperation, the plant is expected to process approximately 5.6 million bushels of corn annually fora total increase of about $10.65 million. This added value benefits the community and the state;however, the value added must also cover the processing costs for the plant (Van Dyne,Braschler, and Blase 1996).9
Ownership and ManagementThe sale of shares in GTEC has been an active project of board members, assisted by the St.
Joseph Chamber of Commerce. Initial offerings were $12,500 per share. For each sharepurchased, the shareholder had the right to deliver 5,000 bushels of corn for processing. After theinitial round of investing, the cost per share was increased to $13,000 per share. Subsequently,shareholders were allowed to add to their investment in increments of $1,000 which increasedtheir delivery rights by 385 bushels.
Additional investments can still be made as GTEC strives to increase the amount of moneyavailable for leveraging with the lending company (Stearns Bank of St. Cloud, Minnesota). Sincethe Craig, Missouri site has been selected, shareholders will have a chance to cancel their
74
obligations or add more shares as they desire. As of October 1, 1999, over $6 million ofinvestment has been received from 275 investors. Financing guarantees are anticipated from theUSDA loan guarantee program available to operations built in communities with population lessthan 50,000. When the loan agreement is signed, Stearns Bank will submit a request to USDAfor a loan guarantee. The USDA then conducts an environmental review and public commentperiod before giving such a guarantee. After opening its office GTEC employed a full-timemanaging director. As an NGC, farmers who invest in the plant will have the right to supply cornto the plant and receive an end-of-year value-added payment, similar to a stock dividend. Returnto investment is expected to be between 25 and 30 percent per year which is in line with thereturn paid by similar cooperatives in Minnesota and the Dakotas.
The plant will operate year-round and will buy corn throughout the year. On-site storage willaccommodate about 20 to 25 days of operation, so grain must be continuously purchased. Theboard and managing director are investigating additional operations, such as a poultry productionfeed mill, feeding operations, and other related operations, that could locate near the plant andtake advantage of the DDGS.
Assumed Economic Benefits of an Ethanol Plant in North MissouriThe economic assessments in northwest Missouri reported positive benefits from
construction of an ethanol plant. Initially, the corn industry requested production incentives foran ethanol plant in the amount of $.20 per gallon of ethanol produced for the first five years.Corn producers in Missouri need state incentives similar to other states; otherwise, Missouriproducers would be at a disadvantage in selling ethanol, either in or out of state. Other incentivescontinue to be considered by the Missouri legislature.
Balance of TradeSince virtually all of the liquid motor fuels used in Missouri are currently imported
(including ethanol used in gasoline blends and E-85 vehicles), the added value to motor fuelsaccrues to other states and to other nations. According to Van Dyne (1993) and the 1994 MissouriDepartment of Revenue statistics, about 3.7 billion gallons of gasoline, diesel fuel, and gasoholwere used in the state in 1994, an increase from 3.1 billion gallons in 1986. Of this amount, othersources indicate that at least 2 billion gallons are gasoline, with gasohol having an estimated10.46 percent market share of all gasoline sold in the state. Using an average wholesale price of$0.58 (without state and federal excise taxes), the deficit balance of trade for gasoline in 1994was $1.2 billion. The 15 million gallons of ethanol produced from an ethanol plant couldenhance Missouri’s balance of payments by $8.7 million annually (by reducing the volume ofgasoline imported into the state). Two plants could reduce imports into Missouri by $17.4million. In-state production reduces the outflow of money to other states and generates taxrevenues for the state. Likewise, jobs created also impact the local and state economy.
Plant InvestmentThe industry average for constructing an ethanol plant is less than $2.00 per gallon of annual
production (Van Dyne, Braschler, and Blase 1996), although GTEC anticipates a lower
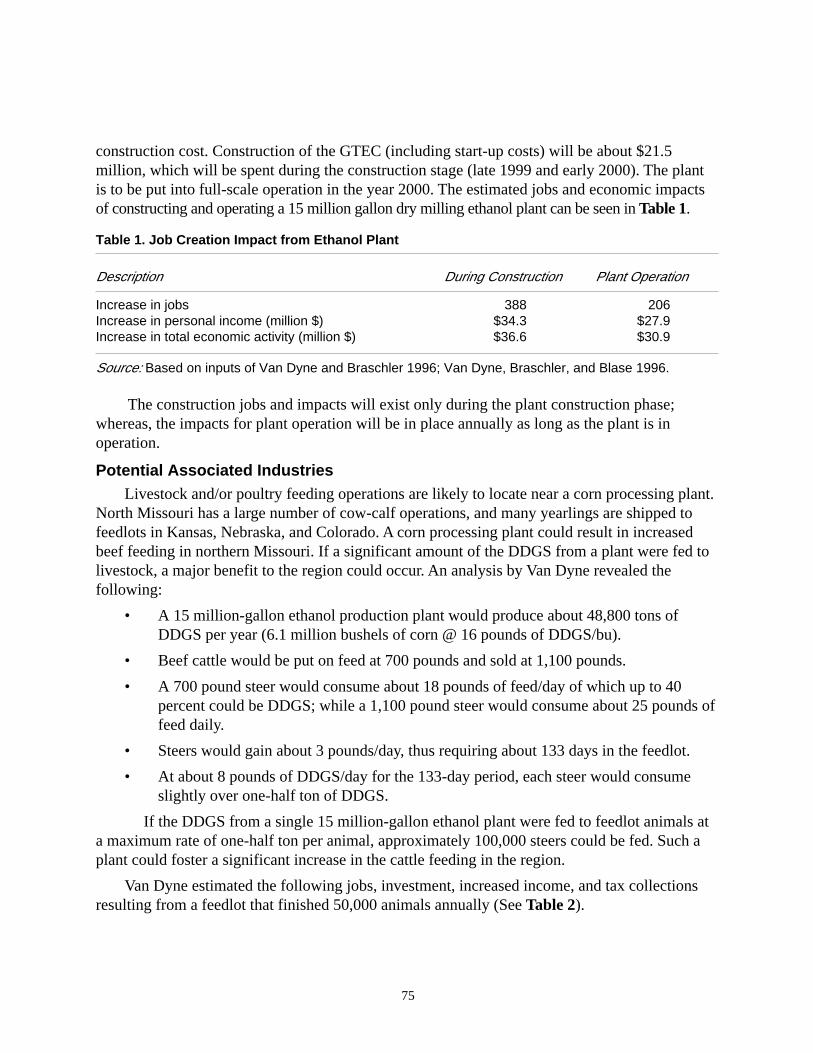
75
construction cost. Construction of the GTEC (including start-up costs) will be about $21.5million, which will be spent during the construction stage (late 1999 and early 2000). The plantis to be put into full-scale operation in the year 2000. The estimated jobs and economic impactsof constructing and operating a 15 million gallon dry milling ethanol plant can be seen in Table 1.
Table 1. Job Creation Impact from Ethanol Plant
Description During Construction Plant Operation
Increase in jobs 388 206Increase in personal income (million $) $34.3 $27.9Increase in total economic activity (million $) $36.6 $30.9
Source: Based on inputs of Van Dyne and Braschler 1996; Van Dyne, Braschler, and Blase 1996.
The construction jobs and impacts will exist only during the plant construction phase;whereas, the impacts for plant operation will be in place annually as long as the plant is inoperation.
Potential Associated IndustriesLivestock and/or poultry feeding operations are likely to locate near a corn processing plant.
North Missouri has a large number of cow-calf operations, and many yearlings are shipped tofeedlots in Kansas, Nebraska, and Colorado. A corn processing plant could result in increasedbeef feeding in northern Missouri. If a significant amount of the DDGS from a plant were fed tolivestock, a major benefit to the region could occur. An analysis by Van Dyne revealed thefollowing:
• A 15 million-gallon ethanol production plant would produce about 48,800 tons ofDDGS per year (6.1 million bushels of corn @ 16 pounds of DDGS/bu).
• Beef cattle would be put on feed at 700 pounds and sold at 1,100 pounds.
• A 700 pound steer would consume about 18 pounds of feed/day of which up to 40percent could be DDGS; while a 1,100 pound steer would consume about 25 pounds offeed daily.
• Steers would gain about 3 pounds/day, thus requiring about 133 days in the feedlot.
• At about 8 pounds of DDGS/day for the 133-day period, each steer would consumeslightly over one-half ton of DDGS.
If the DDGS from a single 15 million-gallon ethanol plant were fed to feedlot animals ata maximum rate of one-half ton per animal, approximately 100,000 steers could be fed. Such aplant could foster a significant increase in the cattle feeding in the region.
Van Dyne estimated the following jobs, investment, increased income, and tax collectionsresulting from a feedlot that finished 50,000 animals annually (See Table 2).
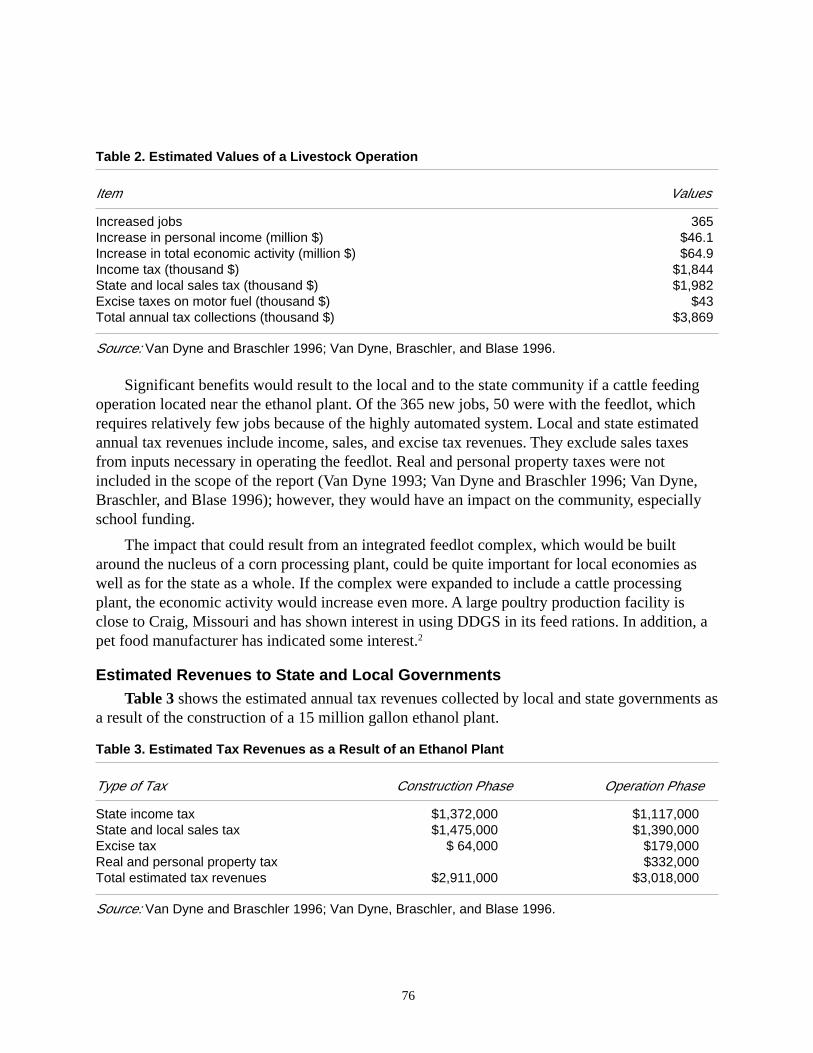
76
Table 2. Estimated Values of a Livestock Operation
Item Values
Increased jobs 365Increase in personal income (million $) $46.1Increase in total economic activity (million $) $64.9Income tax (thousand $) $1,844State and local sales tax (thousand $) $1,982Excise taxes on motor fuel (thousand $) $43Total annual tax collections (thousand $) $3,869
Source: Van Dyne and Braschler 1996; Van Dyne, Braschler, and Blase 1996.
Significant benefits would result to the local and to the state community if a cattle feedingoperation located near the ethanol plant. Of the 365 new jobs, 50 were with the feedlot, whichrequires relatively few jobs because of the highly automated system. Local and state estimatedannual tax revenues include income, sales, and excise tax revenues. They exclude sales taxesfrom inputs necessary in operating the feedlot. Real and personal property taxes were notincluded in the scope of the report (Van Dyne 1993; Van Dyne and Braschler 1996; Van Dyne,Braschler, and Blase 1996); however, they would have an impact on the community, especiallyschool funding.
The impact that could result from an integrated feedlot complex, which would be builtaround the nucleus of a corn processing plant, could be quite important for local economies aswell as for the state as a whole. If the complex were expanded to include a cattle processingplant, the economic activity would increase even more. A large poultry production facility isclose to Craig, Missouri and has shown interest in using DDGS in its feed rations. In addition, apet food manufacturer has indicated some interest.2
Estimated Revenues to State and Local GovernmentsTable 3 shows the estimated annual tax revenues collected by local and state governments as
a result of the construction of a 15 million gallon ethanol plant.
Table 3. Estimated Tax Revenues as a Result of an Ethanol Plant
Type of Tax Construction Phase Operation Phase
State income tax $1,372,000 $1,117,000State and local sales tax $1,475,000 $1,390,000Excise tax $ 64,000 $179,000Real and personal property tax $332,000Total estimated tax revenues $2,911,000 $3,018,000
Source: Van Dyne and Braschler 1996; Van Dyne, Braschler, and Blase 1996.
77
The state treasury is expected to spend $3 million annually to fund the producer incentive($.20 per gallon x 15 million gallon = $3 million). Based on estimates in the feasibility study, taxrevenues to fund the producer incentives will be offset by income to the state treasury during thefirst and subsequent years of operation. The producer incentive will expire in 2007 and, unlessextended, the state will then gain another $3 million annually.
State IncentivesThe State of Missouri has allocated a credit for the two ethanol plants being built in northern
Missouri. This incentive consists of $.20 per gallon for up to 12.5 million gallons per year and arate of $.05 for the next 2.5 million gallons produced for a period of five years. The incentiveapplies to only the two small plants currently underway in northern Missouri and will subsidizethe plant for a total of $13.15 million during the five-year period ($0.20 per year x 12.5 milliongallons x five years + $0.05 x 2.5 million gallons per year for five years). The legislationauthorizing the ethanol subsidy was recently submitted through the year 2007. After five years ofoperation, the current subsidy will terminate.
In addition to the $0.20 per gallon incentive, the legislature recently passed a tax credit (HB888) of up to $15,000 for investors in an NGC. In this legislation, one-half of up to $30,000 iseligible for tax credit with a cap of $1.5 million per entity. Thus, the GTEC plant will be eligiblefor up to $1.5 million in tax credit to investors (prorated among investors). Tax credits may becarried back three years, carried forward five years, and are saleable if farmers cannot use thecredits themselves. The legislation, passed by both the House and the Senate and signed by theGovernor, provides tax credits which may be utilized or sold. In addition to the tax credit,11 thebill provides for (1) value-added grants for items such as start-up costs and feasibility studies;and (2) a loan guaranty program for NGCs.3, 6, 8
Value Added Projections of the GTEC Ethanol Plant
The estimated value-added per bushel of corn was prepared using assumptions given bymembers of the GTEC board and from information provided by a design engineer.2, 9 They areaccepted as accurate, although, as inputs vary in price, major deviations can occur. The federalexemption for gasoline tax is now in place through the year 2007, and an amortization period ofseven years was used to place payout within this period (See Tables 4 and 5).
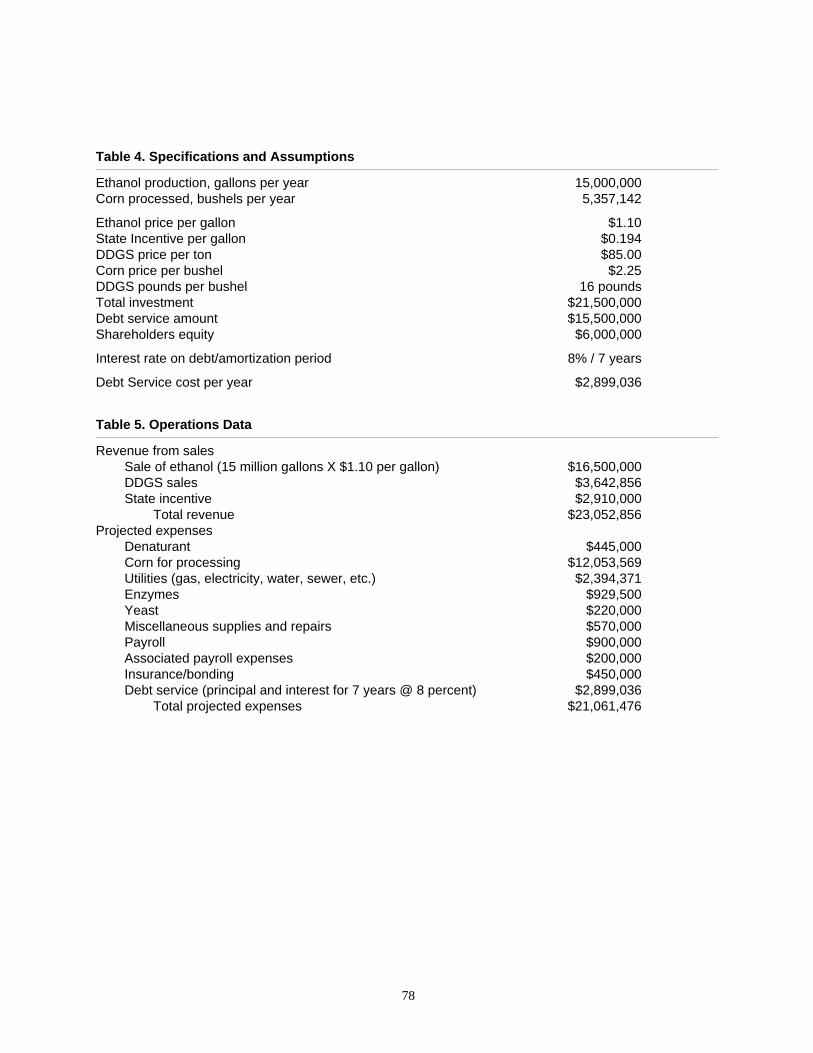
78
Table 4. Specifications and Assumptions
Ethanol production, gallons per year 15,000,000Corn processed, bushels per year 5,357,142
Ethanol price per gallon $1.10State Incentive per gallon $0.194DDGS price per ton $85.00Corn price per bushel $2.25DDGS pounds per bushel 16 poundsTotal investment $21,500,000Debt service amount $15,500,000Shareholders equity $6,000,000
Interest rate on debt/amortization period 8% / 7 years
Debt Service cost per year $2,899,036
Table 5. Operations Data
Revenue from salesSale of ethanol (15 million gallons X $1.10 per gallon) $16,500,000DDGS sales $3,642,856State incentive $2,910,000
Total revenue $23,052,856Projected expenses
Denaturant $445,000Corn for processing $12,053,569Utilities (gas, electricity, water, sewer, etc.) $2,394,371Enzymes $929,500Yeast $220,000Miscellaneous supplies and repairs $570,000Payroll $900,000Associated payroll expenses $200,000Insurance/bonding $450,000Debt service (principal and interest for 7 years @ 8 percent) $2,899,036
Total projected expenses $21,061,476
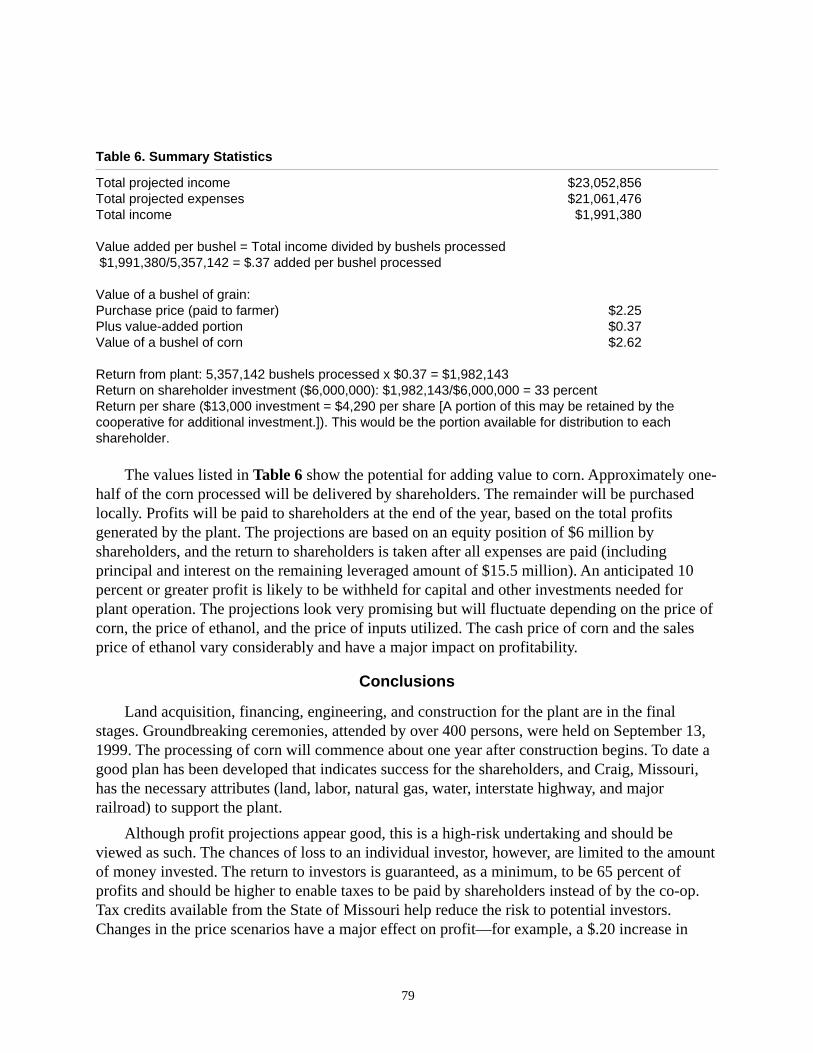
79
Table 6. Summary Statistics
Total projected income $23,052,856Total projected expenses $21,061,476Total income $1,991,380
Value added per bushel = Total income divided by bushels processed $1,991,380/5,357,142 = $.37 added per bushel processed
Value of a bushel of grain:Purchase price (paid to farmer) $2.25Plus value-added portion $0.37Value of a bushel of corn $2.62
Return from plant: 5,357,142 bushels processed x $0.37 = $1,982,143Return on shareholder investment ($6,000,000): $1,982,143/$6,000,000 = 33 percentReturn per share ($13,000 investment = $4,290 per share [A portion of this may be retained by thecooperative for additional investment.]). This would be the portion available for distribution to eachshareholder.
The values listed in Table 6 show the potential for adding value to corn. Approximately one-half of the corn processed will be delivered by shareholders. The remainder will be purchasedlocally. Profits will be paid to shareholders at the end of the year, based on the total profitsgenerated by the plant. The projections are based on an equity position of $6 million byshareholders, and the return to shareholders is taken after all expenses are paid (includingprincipal and interest on the remaining leveraged amount of $15.5 million). An anticipated 10percent or greater profit is likely to be withheld for capital and other investments needed forplant operation. The projections look very promising but will fluctuate depending on the price ofcorn, the price of ethanol, and the price of inputs utilized. The cash price of corn and the salesprice of ethanol vary considerably and have a major impact on profitability.
Conclusions
Land acquisition, financing, engineering, and construction for the plant are in the finalstages. Groundbreaking ceremonies, attended by over 400 persons, were held on September 13,1999. The processing of corn will commence about one year after construction begins. To date agood plan has been developed that indicates success for the shareholders, and Craig, Missouri,has the necessary attributes (land, labor, natural gas, water, interstate highway, and majorrailroad) to support the plant.
Although profit projections appear good, this is a high-risk undertaking and should beviewed as such. The chances of loss to an individual investor, however, are limited to the amountof money invested. The return to investors is guaranteed, as a minimum, to be 65 percent ofprofits and should be higher to enable taxes to be paid by shareholders instead of by the co-op.Tax credits available from the State of Missouri help reduce the risk to potential investors.Changes in the price scenarios have a major effect on profit—for example, a $.20 increase in
80
ethanol price or a $40 per ton increase in price of DDGS has a dramatic effect on the profitprojections.
Investors should consider the investment in an ethanol plant as a hedging tool. In years oflow corn prices, the returns from ethanol will be greater because of the lower cost of inputs to theplant. In years of higher corn prices, the return from ethanol could be less (depending on price ofethanol). The price of ethanol has varied widely in recent years and was as high as $1.70 pergallon recently. World and economic factors have a major effect on the prices received forcommodities, and ethanol and DDGS are no exceptions. The value of ethanol will be assisteduntil 2007 by the federal exemption of taxes for ethanol added to gasoline at a rate of 10 percentethanol per gallon. Some plants make additional profit from processing carbon dioxide as abyproduct. The GTEC plans to market carbon dioxide, as a potential market for it exists innorthwest Missouri. The availability of state incentives contributes to the potential success of thisventure. Without such incentives, finding investors would be more difficult. Projections showthat once operation commences, shareholders will collect a dividend each year (up to 30 percentof investment) and the plant debt will be repaid in seven years.
Assuming the success of this venture, key ingredients include a thorough feasibility studywhich outlines benefits, potential profitability, and regional support. This was combined withstrong board leadership and the support of other agencies interested in the development of therural economies of the state. Catholic Charities came forward with the initial venture capital thatadded enthusiasm to the potential success of the project. According to the board president,“another big plus for the Craig, Missouri site has been overwhelming support received fromofficials of Holt County and the city of Craig. Elected officials and citizens alike have been therefor GTEC every step of the way. We’re happy to be locating in the area.” Such support isnecessary if NGCs are to succeed in rural communities.
Bibliography
Van Dyne, Donald. April 1993. Potential Macroeconomic Impacts of an Ethanol Industry inMissouri. A report to the Missouri Corn Merchandising Council.
Van Dyne, Donald L., and Curtis H. Braschler. 1996. Estimated Benefits of Two Corn ProcessingPlants in North Missouri, an interim report to the Missouri Corn Growers Association andthe Missouri Corn Merchandising Council.
Van Dyne, Donald L., Curtis H. Braschler, and Melvin Blase. 1996, September 15-17.Macroeconomic and Fiscal Impacts of a 57 Million Liter Corn-to-Ethanol Plant in northMissouri. ASAE (The American Society of Agricultural Engineers) Proceedings of the ThirdLiquid Fuel Conference.
Endnotes
1. Personal conversation with Rob Broin (ethanol plant designer) of Broin Enterprises, Inc., on May12, 1999.
81
2. GTEC Board of Directors:
Richard Garst Rt. 4, Box 68W, Watson, Missouri
Charlie Hurst Rt. 2, Tarkio, Missouri
Ryland Utlaut Box 112, Grand Pass, Missouri
Ed Hesse 19515 S. Parris Rd., Pleasant Hill, Missouri
Herb Derks Rt. 2, Box 111, King City, Missouri
Bob Pile Rt. 1, Box 37, Oregon, Missouri
Glen Riekhof Rt. 1, Box 270, Concordia, Missouri
Steve Volker 319 Main, Tarkio, Missouri
Ronald Landess Rt. 1, Savannah, Missouri
Earl Grimes 10690 N.E. M Hwy, Osborn, Missouri
Byron Fink Rt. 1, Oregon, Missouri
Larry Davies Rt. 1, Box 99, Ludlow, Missouri
Malcom McCance P.O. Box 32, Camden Point, Missouri
3. Byron Fink, GTEC Board President. Numerous phone conversations.
4. Gary Wergen, Farm Director of WHO (formerly KFEQ Farm Director) in Des Moines, Iowa, byphone conversation on May 4, 1999.
5. Dr. Karen Hauser, St. Joseph, Missouri Area Director of Catholic Charities, by phone conversationon May 3, 1999.
6. Fred Stemme, Missouri Corn Growers Association, by phone conversation on May 7, 1999.
7. Plant site visit and meeting with Managing Director Malcom McCance and Board President ByronFink on May 12, 1999 (in Craig, Missouri).
8. Malcom McCance of the GTEC (formerly of St. Joseph Chamber of Commerce) by phoneconversation on May 7, 1999.
9. Personal conversation with Donald L. Van Dyne on April 30, 1999.
10. Meeting with members of site committee of Board of Directors and President of the Board, May12 and 13, 1999.
11. Missouri Value-Added Grant and Loan Guarantee Programs. Brochure describing the programadministered by the Missouri Agricultural and Small Business Development Authority.


83
The Role of Value-Added Cooperatives in Rural Economic Development:The Case of Heartland Organic Marketing Cooperative1
by Christopher D. Merrett
Introduction
Rural communities have witnessed a secular decline in the number of family farmers duringthe twentieth century (Davidson 1990). This decline has accelerated during the past two decadesdue to a range of macroeconomic forces including the interest rate-driven farm crisis of the1980s, the vertical integration of farm production, new technology such as precision farming,and the globalization of markets (Lobao and Lasley 1995; Schaefer 1997). The negative impactsof volatile commodity markets and low commodity prices have been further exacerbated, at leastfrom the perspective of some farmers, by the “Freedom to Farm” Act passed in 1996 (Hage1999). This federal act cuts farm subsidies on the theory that government support undermines theefficient operation of commodity markets; however, in the current era of low commodity prices,intensified market pressures have forced many farmers out of business.
The declining numbers of farmers have impacted the rural economy and society (Hobbs andWeagley 1995). With fewer farm families living in rural communities, businesses, churches,schools, and hospitals have had to restructure or even close due to declining clientele (Hage1999; Lobao and Lasley 1995). Because of this, some farmers are adopting new strategies tocounter intensified market pressures and consolidation in the farm sector. One promising newstrategy is evident in the numerous value-added or New Generation Cooperatives (NGCs)recently established in the upper Midwest (Egerstrom 1994; Merrett and Walzer 1999; Nadeauand Thompson 1996).
Cooperatives in general, and NGCs in particular, represent a local response tomacroeconomic changes in the agricultural sector (English 1995). Large producers andprocessors can achieve economies of scale, lowering the per unit cost of production. Individualfamily farms are too small to match these economies of scale. In order to compete, some farmersare collaborating to form NGCs, also known as producer cooperatives (Groshen 1994). Byjoining forces, producers can achieve economies of scale in purchasing inputs, processing,marketing, and distribution (Duffy 1995). At the same time, NGCs allow small farmers to retaina large measure of individual control over farm operations (Boes and Rosman 1999). In short, thecreation of NGCs appears to offer a successful strategy for individual producers to competeagainst much larger farms and agribusinesses. In the long term, NGCs may stabilize the farmpopulation, which will in turn help to stop overall rural outmigration.
I would like to acknowledge the generous financial support of the Illinois Council for Food andAgricultural Research (C-FAR). I would also like to thank Jim Boes and Ken Rosman of the HeartlandOrganic Marketing Cooperative for providing the interviews and background material which have greatlyfacilitated the writing of this case study.
84
The purpose of this case study is to examine a specific NGC to determine the reasons for itsformation and to examine the obstacles and opportunities confronted during the start-up phase,the impact of the cooperative on the surrounding rural community, and the future prospects of theNGC. The underlying goal of this case study is to determine whether or not NGCs offer apromising strategy for farmers and rural communities in Illinois.
Heartland Organic Marketing Cooperative (HOMC) was chosen as the subject for this casestudy for several reasons: (1) its members produce crops readily grown in Illinois; (2) HOMC islocated in a neighboring state with soils, climate, and community characteristics comparable tothose in central Illinois; and (3) HOMC was chosen because the board members of the co-opwere eager to share their experiences with us.
Background1
HOMC was founded in 1992. It is located in Greenfield, Iowa, the county seat for AdairCounty. Greenfield is located approximately 40 miles southwest of Des Moines and about 90miles due east of Omaha, Nebraska. HOMC started with 12 members concerned about findingdependable, long-term markets and fair prices for soybeans and corn. Currently, the HOMC has120 members who are located in Iowa, Missouri, Nebraska, and southwestern Wisconsin. It sellsorganic soybeans, corn, and oats to domestic markets in Iowa and foreign markets in Japan(Miller 1997; Rosman, Boes, Miller, and Thompson 1999).
Strictly speaking, the HOMC is not an NGC. NGCs are usually established by producerswho want to process crops in their community, instead of selling to an external processor. Eachmember of a co-op must contribute equity to build the processor. Membership also represents acontract between a producer and the NGC to sell a portion of the harvest to the NGC (Egerstrom1994). The rationale for creating an NGC is that by processing the commodities themselves,farmers are adding value to the crop locally, instead of allowing a processor outside thecommunity to receive the profits from processing. In short, the NGC allows value to be kept inthe community, directly raising income for the members and indirectly helping the localcommunity. It does so by converting a raw commodity into a new intermediate or final product(Stender 1994, 9).
By this definition, the HOMC is not an NGC because the soybeans and corn grown by theco-op members are shipped unchanged to market as soybeans and corn. The only “processing”done is to clean and bag the harvested crop. If, however, a more flexible notion of NGCs isadopted, which defines them as collaborative enterprises designed to help farmers increaseincome by moving specialty or value-added crops into niche markets, then the HOMC with itsemphasis on organic crops does fit the definition. Organic crops must meet stringent qualityguidelines and, therefore, require special handling separate from conventional crops that havechemical residues from fertilizers, pesticides, and herbicides (Miller 1997). It is the “chemical-
1 Material for this section came from the first and revised HOMC business plans completed byMiller (1997) and Rosman et al. (1999). I am grateful to the HOMC for sharing these documents.
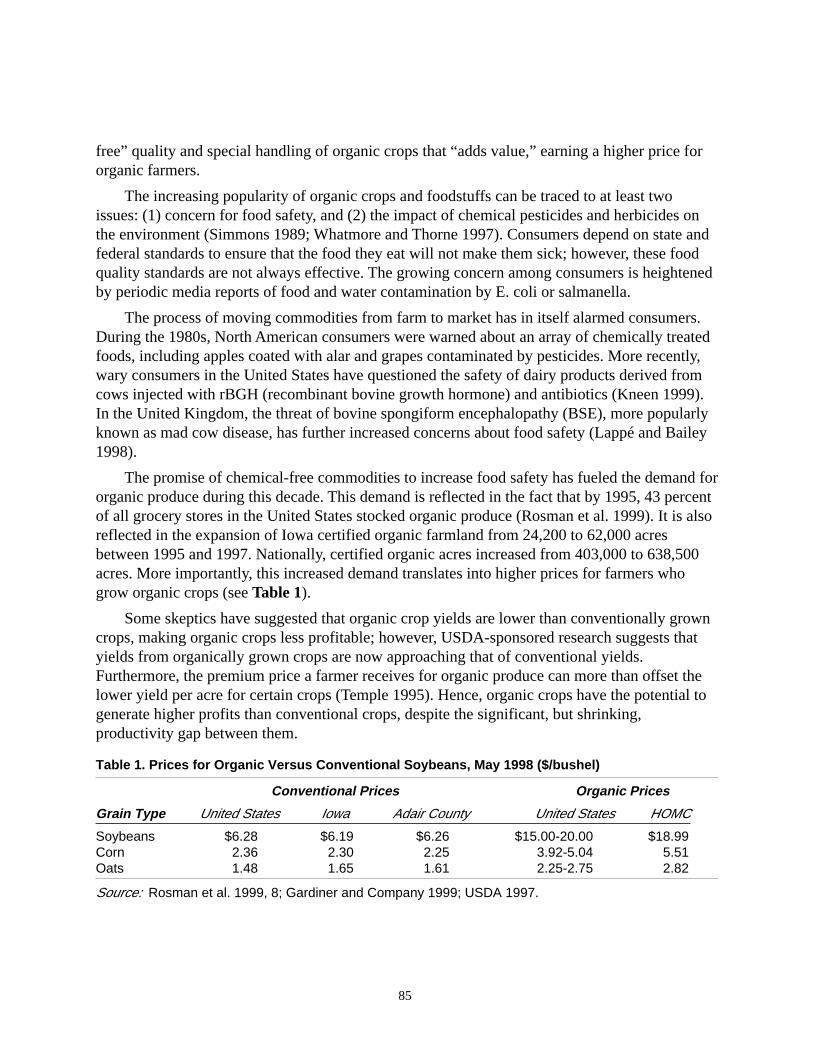
85
free” quality and special handling of organic crops that “adds value,” earning a higher price fororganic farmers.
The increasing popularity of organic crops and foodstuffs can be traced to at least twoissues: (1) concern for food safety, and (2) the impact of chemical pesticides and herbicides onthe environment (Simmons 1989; Whatmore and Thorne 1997). Consumers depend on state andfederal standards to ensure that the food they eat will not make them sick; however, these foodquality standards are not always effective. The growing concern among consumers is heightenedby periodic media reports of food and water contamination by E. coli or salmanella.
The process of moving commodities from farm to market has in itself alarmed consumers.During the 1980s, North American consumers were warned about an array of chemically treatedfoods, including apples coated with alar and grapes contaminated by pesticides. More recently,wary consumers in the United States have questioned the safety of dairy products derived fromcows injected with rBGH (recombinant bovine growth hormone) and antibiotics (Kneen 1999).In the United Kingdom, the threat of bovine spongiform encephalopathy (BSE), more popularlyknown as mad cow disease, has further increased concerns about food safety (Lappé and Bailey1998).
The promise of chemical-free commodities to increase food safety has fueled the demand fororganic produce during this decade. This demand is reflected in the fact that by 1995, 43 percentof all grocery stores in the United States stocked organic produce (Rosman et al. 1999). It is alsoreflected in the expansion of Iowa certified organic farmland from 24,200 to 62,000 acresbetween 1995 and 1997. Nationally, certified organic acres increased from 403,000 to 638,500acres. More importantly, this increased demand translates into higher prices for farmers whogrow organic crops (see Table 1).
Some skeptics have suggested that organic crop yields are lower than conventionally growncrops, making organic crops less profitable; however, USDA-sponsored research suggests thatyields from organically grown crops are now approaching that of conventional yields.Furthermore, the premium price a farmer receives for organic produce can more than offset thelower yield per acre for certain crops (Temple 1995). Hence, organic crops have the potential togenerate higher profits than conventional crops, despite the significant, but shrinking,productivity gap between them.
Table 1. Prices for Organic Versus Conventional Soybeans, May 1998 ($/bushel)
Conventional Prices Organic Prices
Grain Type United States Iowa Adair County United States HOMC
Soybeans $6.28 $6.19 $6.26 $15.00-20.00 $18.99Corn 2.36 2.30 2.25 3.92-5.04 5.51Oats 1.48 1.65 1.61 2.25-2.75 2.82
Source: Rosman et al. 1999, 8; Gardiner and Company 1999; USDA 1997.
86
While concern for food safety has spurred organic agriculture, other reasons exist too. Someconsumers and producers want to reduce the environmental impacts of commodity production.Chemicals used in farming are blamed for the contamination of ground water, eutrophication,and carcinogenic impacts on humans. Rachel Carson (1962) first made this point in her seminalbook, Silent Spring. She warned that the widespread use of chemicals in a range of industrialsettings, including agriculture, was a threat to wildlife and humans (Union of ConcernedScientists 1997).
The concern for chemicals in the environment is even more prevalent today. Farmingmethods such as no-till agriculture reduce soil erosion but require the application of herbicideson a large scale. The presence of genetically altered crops such as “Roundup Ready®” soybeansalso concern consumer advocates and environmentalists (Lappé and Bailey 1998, 78). Manyproducers farm organically as a matter of principle, so it is a mix of altruistic concern for foodsafety and the environment and a selfish concern for higher profits that motivates organicfarmers. It is within this context that the development of the HOMC can be understood.
The Start-up Phase for Heartland Organic Marketing Cooperative
The impetus behind HOMC’s formation is a combination of market conditions,environmental concerns, and serendipitous events. The initial stimulus came from two organicfarmers: Jim Boes from Greenfield, Iowa, and Ken Rosman from Harlan, Iowa. Their partnershipemerged from their joint membership in the Organic Crop Improvement Association (OCIA) andthe Iowa Soybean Association (ISA) (Boes and Rosman 1999). The OCIA is a nationalorganization devoted to setting standards and keeping farmers informed about organic farmingmarkets and techniques; and the ISA periodically sponsors meetings that bring togetherresearchers, farmers, economic development specialists, and purchasers to promote theproduction and sale of soybeans.
In 1992, the ISA hosted a meeting at Iowa State University in Ames, Iowa. At that meeting,Jim Boes and Ken Rosman met a soybean buyer from Japan. This buyer expressed an interest inpurchasing large quantities of organic soybeans to be processed into edible soybean productssuch as tofu and soymilk by food processors in Tokyo and Osaka (Miller 1997). With thepromise of a large foreign buyer and guaranteed prices, Boes and Rosman (1999) set aboutforming an organic marketing cooperative to meet the demands of this niche market.
The decision to form an organic co-op was also based on a set of environmental and socialvalues. Jim Boes describes himself as “a Lincoln protectionist” who worries that the verticalintegration of production and increasing free trade agreements represent a threat to small farmersand rural communities. He also believes that American agribusiness, with its increasing relianceon expensive inputs and genetic engineering, represents a form of “technological imperialism”that threatens to homogenize the world food system; whereas, an organic cooperative representsa local approach to sustainable agriculture that is more likely to coexist or even help preservelocal food systems and their inherent biodiversity (Boes and Rosman 1999).
87
In order to recruit members, Boes and Rosman (1999) mailed more than 100 letters tofriends and acquaintances throughout Iowa inviting them to attend an organizational meeting. Totheir dismay, only two people came to the meeting. Counting themselves, they only had fourmembers. This was an inadequate number to start a co-op because four farmers could notproduce enough soybeans to satisfy the Japanese buyers. Furthermore, four farmers could notraise adequate start-up capital to build and operate an organic soybean cleaning, packaging, andmarketing operation.
They bolstered interest in their fledgling co-op by making personal contacts with otherOCIA members from Iowa, Missouri, and Nebraska. After much effort, Boes and Rosman (1999)managed to recruit 12 farmers to form the co-op . By 1993, the founding members had settled onan administrative structure and had formally registered and incorporated as a cooperativeenterprise under code 499 of the State of Iowa Statutes (Miller 1997).
There were several challenges in addition to recruiting a sufficient number of producers intothe co-op. The founding members first considered writing a business plan in order to apply forgovernment grants and bank loans (Boes and Rosman 1999). They envisioned that they mightactually establish an NGC with processing facilities. Unfortunately, start-up costs for a newsoybean processing plant were estimated to approach $19 million (Adams 1995, 17). Raising thatmuch capital would have been impossible because in 1992, organic products were stillconsidered high-risk “fringe” commodities. Furthermore, the founding members believed that thebusiness plan needed to apply for grants and loans would restrict their operations by mandatingwhat they “needed to have and do” in order to be profitable. Hence, Boes and Rosman (1999)rejected writing a formal business plan during the early start-up phase.
Of course, the lack of substantial start-up money prevented this co-op from launching a full-fledged NGC. In the words of Miller (1997), the HOMC was a “highly leveraged company withfew assets” (4). The founders could, however, launch an organic marketing co-op withconsiderably less start-up capital. Jim Boes already had modest organic soybean cleaning andpackaging facilities on his farm that could be expanded to meet the needs of the HOMC as itgrew.
The founding members also established membership fees, an organizational structure, andoperating practices for the co-op. The Articles of Incorporation for the HOMC, included withinthe business plan produced by Miller (1997), provide many insights into the internal workings ofthis co-op. According to the Articles of Incorporation, producers are eligible for membership ifthey use the services or supplies of the HOMC. Membership eligibility is subject to the finalapproval of the co-op’s board of directors.
Once applicants have received approval, they must purchase a membership in the co-op(Miller 1997). The first $250 of the membership fee is converted into one share of commonstock. Each member of the co-op may only own one share of common stock. Voting on co-oppolicy is based on the principle that one share of common stock equals one vote. No dividendsare paid on common stock. Money paid over and above the $250 membership fee is convertedinto purchased preferred stock at a value of one share per dollar. The co-op agrees to pay acumulative dividend of 8 percent each year on this preferred stock. According to Shepherd and
88
Futrell (1982) this rate of return is typical of most American marketing co-ops (240). Noadditional voting rights are conferred to co-op members with the purchase of preferred stock.
Each year, the HOMC contracts with its members to purchase a certain amount of organicsoybean, corn, or oat production (Miller 1997). The HOMC does not guarantee a fixed price, butit does ensure a fair price and a guaranteed market for the commodities produced by themembers. In exchange for this secure market, farmers agree to meet or exceed OCIA standards.In addition to meeting standards for organic certification, farmers must also meet moreconventional standards for spoilage, grade, test weight, variety, and damage (Miller 1997, 11).HOMC arranges and pays for the transportation of the harvested organic crop from the farm tothe cleaning and packing facilities at the farm of Jim Boes in Greenfield, Iowa. Any crop rejectedfor not meeting organic or other standards is either sold as nonfood grade at a lower price or isshipped back to the farmer at the farmer’s expense.
As a member of the co-op, producers can expect to earn income in the following ways.Income is earned by selling the organic crop to the co-op for a unit price that exceeds unitproduction costs. According to Miller (1997), this has not been difficult in recent years becausethe prices received by producers for organic soybeans have been up to three times higher thanconventional soybean prices (8) (see Table 1). After purchasing the soybeans, HOMC serves as amiddleman, cleaning, bagging, and marketing the commodities to processors in Iowa and Japan.Transportation costs from HOMC to the processing plants in Iowa and Japan are borne by thebuyers.
The producer also has the potential to earn income from the co-op in the form of patronagedistributions (Shepherd and Futrell 1982). It quite often happens that after producers are paid fortheir crop, money remains within the co-op in the form of “net savings.” The Internal RevenueService, however, legally defines co-ops as “tax-exempt” business entities. They don’ttechnically earn profits and, hence, do not pay corporate income taxes. One way to understand“net savings” is that they are in effect a profit earned by the co-op, net of operating expenses.
In some ways, co-ops parallel publicly held enterprises that distribute net profits toshareholders at the end of a fiscal period (Shepherd and Futrell 1982, 241). The difference is thattraditional corporations pay dividends to stockholders as suppliers of capital, who may or maynot work at the corporation. A co-op, on the other hand, is formed with the explicit purpose ofhelping the working members, who have also provided the operating capital (Shepherd andFutrell 1982, 241). Net savings or patronage dividends are paid back to the members if the co-ophas had a successful year. Net savings are generated when the value of sales and servicescompleted by the co-op exceeds the value of operating costs (including payments to farmers forcrops purchased), taxes, and interest payments on loans.
The HOMC has stipulated in its Articles of Incorporation how these net savings are to bedistributed (Miller 1997). First, the co-op will set aside some savings as a reserve to pay for costsassociated with capital depreciation, obsolescence, and unplanned debt. Second, money will beset aside for “retained savings.” This represents money set aside for future capital improvementssuch as the purchase of new equipment or the expansion of operations. Third, HOMC states that
89
it will pay dividends on purchased preferred stock. Finally, co-op members receive anyremaining money based on the dollar value of business they did with the co-op in the previousfiscal period. Unfortunately, co-op can sometimes lose money. These losses are managed inseveral ways. Current losses can be paid from previous savings, passed on to co-op members, orcarried forward into the following fiscal year. The board of directors determines how net losseswill be managed in any given year.
At this point, it might be relevant to ask why producers might rely on co-ops to marketsoybeans, when higher returns might be earned by selling commodities directly to processors. Insome years, it is true that co-ops such as the HOMC do not always provide the highest price, butBoes and Rosman (1999) believe that there are advantages to the co-op business structure thatoffset this issue. First, the co-op may be better than individual farmers at finding good marketsfor the commodities, especially if it can hire a full-time manager (Shepherd and Futrell 1982).
Second, crop quality varies among the co-op members. This is especially true if themembers are dispersed over an extensive geographic area where regional variations in climate,soil, or moisture affect farm productivity in different ways. For example, HOMC has membersfrom 23 counties in Iowa, extending from the Missouri River to the Mississippi River. There arealso producers from four counties in northern Missouri, one county in northern Nebraska, andone county in southwestern Wisconsin. With a 1999 membership extending over 29 counties infour states, the soybeans purchased by HOMC are sure to vary in quality. The advantage of theco-op is that it pools good and mediocre quality soybeans which still meet OCIA standards toimprove the price received by lower-quality soybean producers (Boes and Rosman 1999).
The incentive for this behavior is that a producer might have a good crop one year followedby a bad crop the next year. In any one year, an individual farmer might receive a higher pricethan the co-op; however, one bad year might force an independent producer out of business.Members of a co-op are more likely to weather a poor quality harvest because the low price theymight have received, as an individual, will be augmented by the higher overall quality and priceof the soybeans sold by the co-op as a whole. In short, the co-op helps to spread risk for farmersover time and space.
Ongoing Operations of Heartland Organic Marketing Cooperative
By most standards, the HOMC has been a resounding success. Membership in the co-op hasgrown tenfold from 12 members in 1993 to 120 members in the summer of 1999. The HOMCexpects that at current growth rates, it will expand by about 50 members per year. This isremarkable, especially given that the transition from conventional to organic farming is sodifficult. Before conventional producers can grow organic crops, they must have their fieldscertified as organic. This can only occur after their fields have been free of synthetic fertilizers orother chemical treatments for three years. During this transition period, it is difficult to produce aprofitable crop in these fields (Rosman et al. 1999, 7).
These transition costs are not the only growing pains experienced by HOMC and itsmembers. When the co-op began, there were no full-time employees. Jim Boes and Ken Rosman
90
had to manage the co-op while simultaneously managing their own farms. By 1999, the co-ophad grown so much that HOMC hired three full-time and two part-time employees to handle thedaily administrative tasks.
The increasing complexity of the co-op also forced the HOMC to develop a business plan in1997, which has been revised in 1999 (Miller 1997; Rosman et al. 1999). Writing a business planwas justified by the need to borrow money to help expand operations. For example, the HOMCwas forced to buy a truck to haul the grain from member farms to the processing plant inGreenfield, Iowa. It has also had to expand office space in the Greenfield facility toaccommodate the growing administrative staff. Future expansion is also under discussionbecause the HOMC has reached its capacity of processing 200,000 bushels of soybeans eachyear. Furthermore, the HOMC has outstripped its on-site storage capacity of 38,000 bushels,which represents only 19 percent of its annual processing capacity. Because of the inadequatestorage facilities, members are asked to store their harvested crop until it is ready to be cleanedand shipped to market.
The most recent business plan reports that organic soybeans accounted for 90 percent ofHOMC sales during 1997 (Rosman et al. 1999, 10). Of this, 70 percent was sold to MycalCorporation of Jefferson, Iowa. Mycal uses a patented “flaking” process that facilitates theconversion of soybeans into tofu and soymilk. Another 25 percent of the soybeans are cleanedand shipped directly to Japan. The final 5 percent of the soybeans are prepared for salethroughout the United States. Popcorn sales account for about 8 percent of total sales. Theremaining 2 percent of sales come from the marketing of organic oats, seed, hay, and other smallgrains.
While the proportions of sales represented by soybeans, corn, and oats has remainedconstant from 1995 to the present, the total volume and value of commodities sold has increaseddramatically. A cursory glance at numbers from the HOMC income statement shows that fromFebruary 1995 to February 1999, the co-op has generated a fourfold increase in sales, a fivefoldincrease in gross profit, a ninefold increase in net income, and a tenfold increase in members’equity (see Table 2).
The reasons stated by Boes and Rosman (1999) for the dramatic growth mirror broadertrends in agriculture. They see the growth of HOMC as a local manifestation of the growingnational demand for organic foods, but this demand, itself, is prompting widespread restructuringin the organic farm sector. As the demand for organic commodities increases, consumers andgovernment agencies have been attempting to understand what is meant by the term “organic.” Itturns out that there is no single national standard. According to Rosman et al. (1999), only 20states have defined organic standards (5); however, there is wide variation among these states asto what constitutes an organically grown commodity. The fact that only 11 states actively enforcetheir standards confuses matters further.
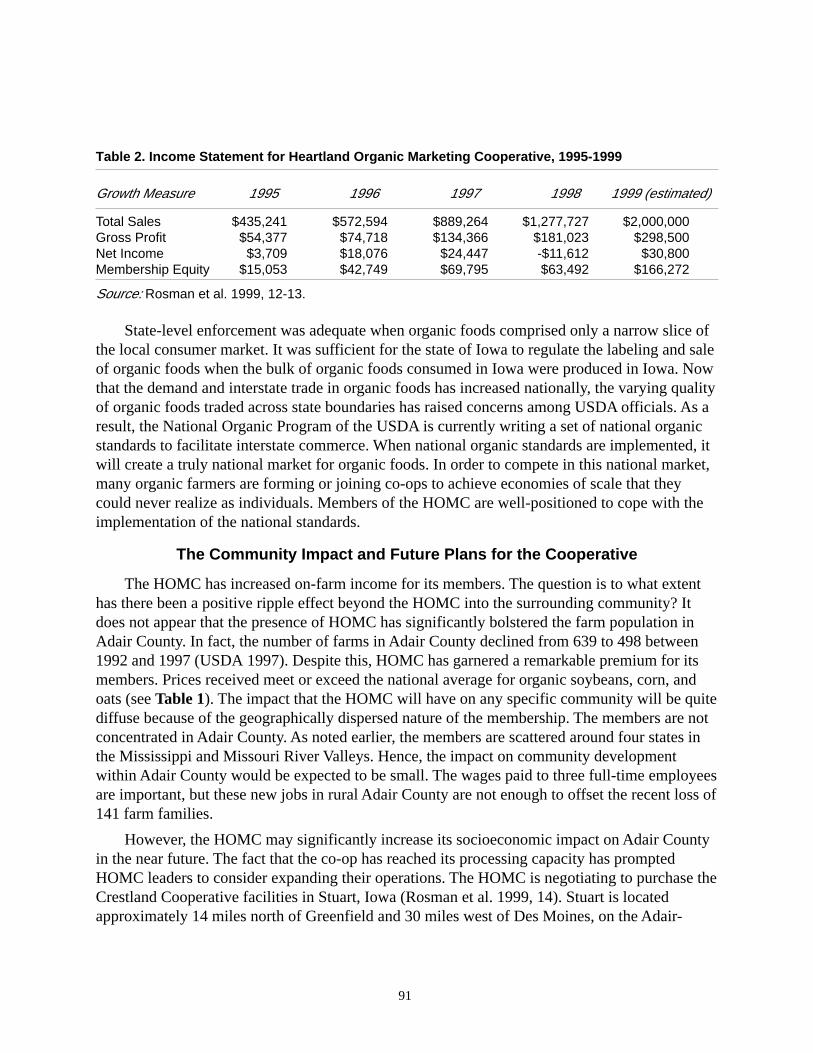
91
Table 2. Income Statement for Heartland Organic Marketing Cooperative, 1995-1999
Growth Measure 1995 1996 1997 1998 1999 (estimated)
Total Sales $435,241 $572,594 $889,264 $1,277,727 $2,000,000Gross Profit $54,377 $74,718 $134,366 $181,023 $298,500Net Income $3,709 $18,076 $24,447 -$11,612 $30,800Membership Equity $15,053 $42,749 $69,795 $63,492 $166,272
Source: Rosman et al. 1999, 12-13.
State-level enforcement was adequate when organic foods comprised only a narrow slice ofthe local consumer market. It was sufficient for the state of Iowa to regulate the labeling and saleof organic foods when the bulk of organic foods consumed in Iowa were produced in Iowa. Nowthat the demand and interstate trade in organic foods has increased nationally, the varying qualityof organic foods traded across state boundaries has raised concerns among USDA officials. As aresult, the National Organic Program of the USDA is currently writing a set of national organicstandards to facilitate interstate commerce. When national organic standards are implemented, itwill create a truly national market for organic foods. In order to compete in this national market,many organic farmers are forming or joining co-ops to achieve economies of scale that theycould never realize as individuals. Members of the HOMC are well-positioned to cope with theimplementation of the national standards.
The Community Impact and Future Plans for the Cooperative
The HOMC has increased on-farm income for its members. The question is to what extenthas there been a positive ripple effect beyond the HOMC into the surrounding community? Itdoes not appear that the presence of HOMC has significantly bolstered the farm population inAdair County. In fact, the number of farms in Adair County declined from 639 to 498 between1992 and 1997 (USDA 1997). Despite this, HOMC has garnered a remarkable premium for itsmembers. Prices received meet or exceed the national average for organic soybeans, corn, andoats (see Table 1). The impact that the HOMC will have on any specific community will be quitediffuse because of the geographically dispersed nature of the membership. The members are notconcentrated in Adair County. As noted earlier, the members are scattered around four states inthe Mississippi and Missouri River Valleys. Hence, the impact on community developmentwithin Adair County would be expected to be small. The wages paid to three full-time employeesare important, but these new jobs in rural Adair County are not enough to offset the recent loss of141 farm families.
However, the HOMC may significantly increase its socioeconomic impact on Adair Countyin the near future. The fact that the co-op has reached its processing capacity has promptedHOMC leaders to consider expanding their operations. The HOMC is negotiating to purchase theCrestland Cooperative facilities in Stuart, Iowa (Rosman et al. 1999, 14). Stuart is locatedapproximately 14 miles north of Greenfield and 30 miles west of Des Moines, on the Adair-
92
Guthrie County line. Of course, this purchase would represent another corporate merger—thekind of business activity co-op members usually disdain.
Even so, the purchase of the Crestland Cooperative facilities would represent a quantumleap for the HOMC (Rosman et al. 1999). The new facilities would expand existing storagecapacity from 38,000 to more than 500,000 bushels. The Crestland Cooperative also offerstransportation facilities such as rail sidings and interstate highway access that are not available inGreenfield.
Processing capacities would also increase dramatically. The HOMC could expand its currentcleaning capacity from 200,000 to 600,000 bushels of soybeans annually. Corn marketing couldbe expanded from 30,000 to 200,000 bushels per year. The expanded capacity, capitalimprovements, and transportation access would also allow the HOMC to seriously consider truevalue-added processing. In other words, the HOMC has long-range plans that include becomingan NGC. When that occurs, certainly more jobs and community development will come to Adairand Guthrie Counties.
As a final point, it may be worth considering the community development implications thatthe HOMC might have for rural communities in Illinois. Producers have certainly raised theirincomes by selling to the HOMC; even though, the benefits accruing to producers do not appearto have had a large impact on Greenfield or Adair Counties. The great distance between co-opmembers precludes a concentrated economic impact. Illinois farmers can and do take advantageof the burgeoning market for organic foods; however, if community development benefits will befelt in Illinois, policymakers and economic development professionals must help foster thecreation of co-ops with a concentrated membership.
Co-ops face other obstacles as well. During the start-up phase, a leader is required who hasboth entrepreneurial and technical skills. Entrepreneurial skills are needed to sell the idea of anNGC to other farmers, lenders, economic developers, and commodity buyers. Technical skills areneeded to understand the complexities of farming as well as processing. As this case studyshows, farmers did not initially rush to join the HOMC. It was only through the tenacity of thetwo original founders that the HOMC became operational.
Boes and Rosman (1999) believe that the hard work has paid off for them. They suggest thatthere are important community development benefits that naturally occur through the co-opmodel. In the early stages of development, co-ops attract a diverse group of farmers. There willbe opportunists looking for a quick profit as well as farmers who have a more philosophicalperspective on farming. When the price drops or difficult decisions must be made, opportunistsquickly drop out of the co-op. Over time, attrition leaves a core group of farmers who share acommon set of values based on commitment, cooperation, and mutual support (Boes andRosman 1999). This is a solid foundation for building stronger rural communities in Iowa,Illinois, and elsewhere in the Midwest.
93
References
Adams, Paul. 1994. Co-op seeking soybean producers. Year in Cooperation. 1(2): 17.
Boes, James, and Ken Rosman. 1999. Interview with Christopher D. Merrett, July 15, inGreenfield and Creston, IA.
Carson, Rachel. 1962. Silent Spring. New York: Houghton-Mifflin.
Davidson, Osha Gray. 1990. Broken Heartland: The Rise of America’s Rural Ghetto. New York:Anchor Books.
Duffy, Pat. 1995. Reaching up the chain: Famalette urges co-ops to pursue food processingprojects. Year in Cooperation. 1(2): 5.
Egerstrom, Lee. 1994. Make No Small Plans: A Cooperative Revival for Rural America.Rochester, MN: Lone Oak Press.
English, Glenn. 1995. Co-ops are built for the wild competitive ride of the 1990s. Year inCooperation. 1 (2): 24.
Gardiner and Company. 1999. Financial Statements for Heartland Organic MarketingCooperative, Incorporated. Compiled by Gardiner and Company, Certified PublicAccountants, Des Moines, Iowa.
Groshen, Ralph. 1994. Ethanol cooperatives reflect marketing strategy. Year in Cooperation.1(1): 23.
Hage, David. 1999. Bitter Harvest. The Nation (October 11): 3.
Hobbs, Daryl, and Robert Weagley. 1995. The agricultures of the Midwest and theirdemographic and economic environments. In Beyond the Amber Waves of Grain: AnExamination of Social and Economic Restructuring in the Heartland, edited by Paul Lasley,Larry Leistritz, Linda Lobao, and Katherine Meyer, pp. 29-49. Boulder, CO: WestviewPress.
Kneen, Brewster. 1999. Farmagedden: Food and the Culture of Biotechnology. Gabriola Island,BC: New Society Publishers.
Lappé, Marc, and Britt Bailey. 1998. Against the Grain: Biotechnology and the CorporateTakeover of Your Food. Monroe, ME: Common Courage Press.
Lobao, Linda, and Paul Lasley. 1995. Farm restructuring and crisis in the Heartland: Anintroduction. In Beyond the Amber Waves of Grain: An Examination of Social and EconomicRestructuring in the Heartland, edited by Paul Lasley, Larry Leistritz, Linda Lobao, andKatherine Meyer, pp. 1-27. Boulder, CO: Westview Press.
Merrett, Christopher D., and Norman Walzer. 1999. A Bibliography of Cooperatives andCooperative Development. Macomb: Illinois Institute for Rural Affairs.
Miller, Thomas. 1997. Heartland Organic Marketing Cooperative: Business Plan. Harlan, IA:USDA-Rural Business and Cooperative Service.
94
Nadeau, E.G., and David Thompson. 1996. Cooperation Works! Rochester, MN: Lone OakPress.
Rosman, Ken, Jim Boes, Thomas Miller, and Todd Thompson. 1999. Heartland OrganicMarketing Cooperative: Preliminary Business Plan. Harlen, IA.
Schaefer, Robert. 1997. Understanding Globalization: The Social Consequences of Political,Economic, and Environmental Change. New York, NY: Rowman & Littlefield.
Shepherd, Geoffrey, and Gene Futrell. 1982. Marketing Farm Products: Economic Analysis, 7thedition. Ames: Iowa State University Press.
Simmons, I. G. 1989. Changing the Face of the Earth: Culture, Environment, History.Cambridge, MA: Basil Blackwell.
Stender, Carol. 1994. “Close to the consumer . . .” The idea for a new farmer-owned cornprocessing plant. Year in Cooperation. 1(1): 9.
Temple, Steven. 1995. A Comparison of Conventional, Low-Input and Organic FarmingSystems: The Transition Phase and Long-Term Viability. Research Project Funded by theSustainable Agriculture Research and Education (SARE) Program of the USDA. ProjectSummary Available online: <http://www.sarep.ucdavis.edu/cgi-win/sare/sare.exe/id=1200>.
Union of Concerned Scientists. 1997. The Gene Exchange: A Public Voice on Biotechnology andAgriculture. Available online: <http://www.ucsusa.org/Gene/F97.sustainable_ag.html>.
United States Department of Agriculture (USDA). 1997. Census of Agriculture State Profile:Iowa. Washington, DC: National Agricultural Statistics Service. Available online: <http://www.nass.usda.gov/ia>.
Whatmore, Sarah, and Lorraine Thorne. 1997. Nourishing networks: Alternative geographies offood. In Globalising Food: Agrarian Questions and Global Restructuring, edited by DavidGoodman and Michael Watts, pp. 287-304. New York: Routledge.
95
Home Grown Wisconsin:The Story of a New Producer Cooperative
by Greg Lawless
The seeds of Home Grown Wisconsin (HGW) Cooperative were planted back in thespring and summer of 1994 with a series of lunch meetings at L’Etoile, a nationally renowned,upscale restaurant in Madison, Wisconsin. It would be fully two years before HGW would makeits first sale of organic produce, and another two years before the co-op would really show aprofit. The four intervening years offer many lessons and insights into the process of cooperativebusiness development. This case study presents a chronological summary of the efforts thatresulted in a new farmer-owned marketing company.
The Beginnings of Home Grown Wisconsin
The meetings at L’Etoile in 1994 were sponsored by a short-lived, informal organizationcalled Local Organic Agriculture for Markets (LOAM). The mission of this Wisconsin group wasto “work with farmers, restaurants, retailers, distributors, processors, etc. to improve themarketing infrastructure for handling local and sustainable agriculture products.” The core of thegroup included L’Etoile owner and chef Odessa Piper, organic vegetable farmers RichardDeWilde and Linda Halley, organic foods distributor Mark Dupre, his employee Joe Sonza-Novera, and Greg Lawless from the University of Wisconsin Center for Cooperatives (UWCC).
One of the main results of LOAM (which essentially disbanded later that year) was a $1,500survey of 301 sustainable farmers in Wisconsin, funded by Dupre and conducted by Lawless.The survey targeted farms that direct marketed fruit and vegetables, meat products, andprocessed foods, plus a number of organic dairy farms. The 126 farms that responded werepresented in the 1995 Directory of Wisconsin’s Sustainable Direct Market Farms.
The farmers, who self-identified their status as “organic,” “transitional,” “low chemical,”etc., also indicated strong interest in a variety of marketing initiatives that were suggested. Sixty-two percent, for instance, expressed interest in a farmer-owned enterprise that processed andmarketed organic produce.
Lawless used this data to support a grant proposal to the state’s Sustainable AgricultureProgram (SAP) in November 1994. Titled the “Farmer-Food Buyer Dialogue Project,” itspurpose was to bring together farmers and food buyers (a term used to encompass restaurateurs,retailers, and institutional food service providers) to explore ways to increase local sales andconsumption of locally and sustainably produced foods. The $10,000 proposal was fundedthrough June 1996.
Over the next 18 months, Lawless would also receive significant in-kind support fromanother unit on the University of Wisconsin-Madison campus, the Center for IntegratedAgricultural Systems (CIAS). A research team, consisting of Steve Stevenson, JohnHendrickson, Jasia Chitaranjan, and Doug Romig from CIAS, joined Lawless in a yearlong
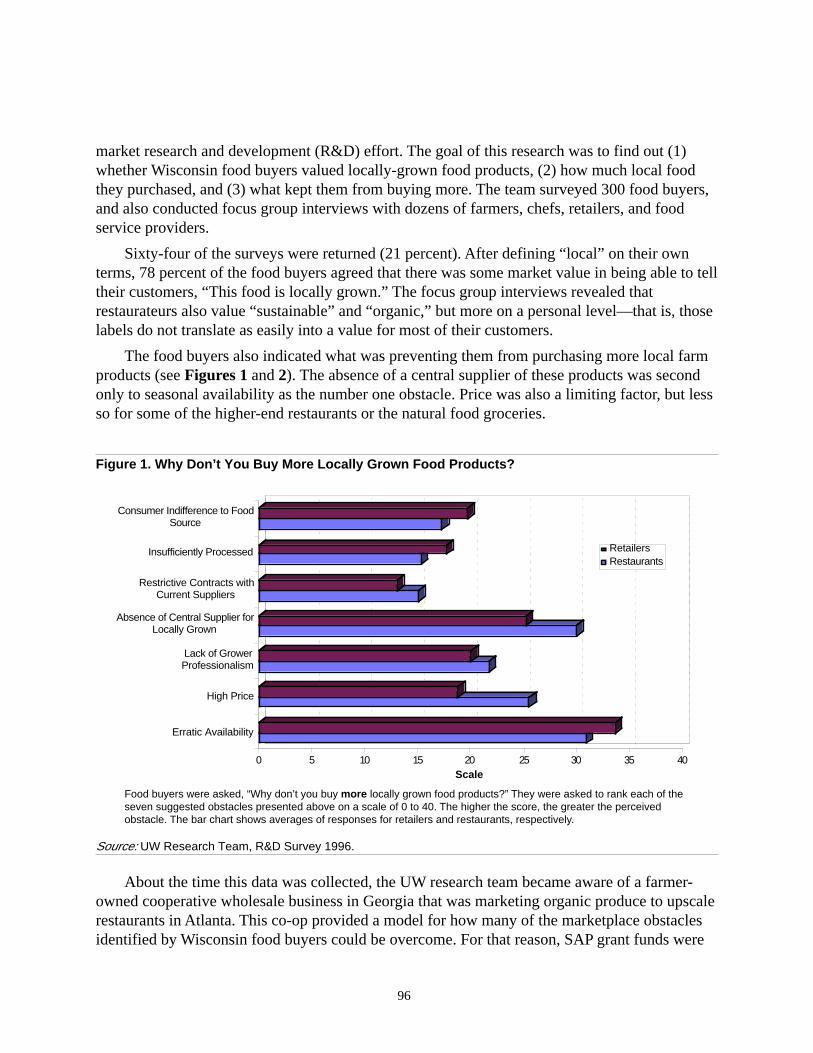
96
0 5 10 15 20 25 30 35 40
Erratic Availability
High Price
Lack of GrowerProfessionalism
Absence of Central Supplier forLocally Grown
Restrictive Contracts withCurrent Suppliers
Insufficiently Processed
Consumer Indifference to FoodSource
RetailersRestaurants
market research and development (R&D) effort. The goal of this research was to find out (1)whether Wisconsin food buyers valued locally-grown food products, (2) how much local foodthey purchased, and (3) what kept them from buying more. The team surveyed 300 food buyers,and also conducted focus group interviews with dozens of farmers, chefs, retailers, and foodservice providers.
Sixty-four of the surveys were returned (21 percent). After defining “local” on their ownterms, 78 percent of the food buyers agreed that there was some market value in being able to telltheir customers, “This food is locally grown.” The focus group interviews revealed thatrestaurateurs also value “sustainable” and “organic,” but more on a personal level—that is, thoselabels do not translate as easily into a value for most of their customers.
The food buyers also indicated what was preventing them from purchasing more local farmproducts (see Figures 1 and 2). The absence of a central supplier of these products was secondonly to seasonal availability as the number one obstacle. Price was also a limiting factor, but lessso for some of the higher-end restaurants or the natural food groceries.
Figure 1. Why Don’t You Buy More Locally Grown Food Products?
Scale
Food buyers were asked, “Why don’t you buy more locally grown food products?” They were asked to rank each of theseven suggested obstacles presented above on a scale of 0 to 40. The higher the score, the greater the perceivedobstacle. The bar chart shows averages of responses for retailers and restaurants, respectively.
Source: UW Research Team, R&D Survey 1996.
About the time this data was collected, the UW research team became aware of a farmer-owned cooperative wholesale business in Georgia that was marketing organic produce to upscalerestaurants in Atlanta. This co-op provided a model for how many of the marketplace obstaclesidentified by Wisconsin food buyers could be overcome. For that reason, SAP grant funds were
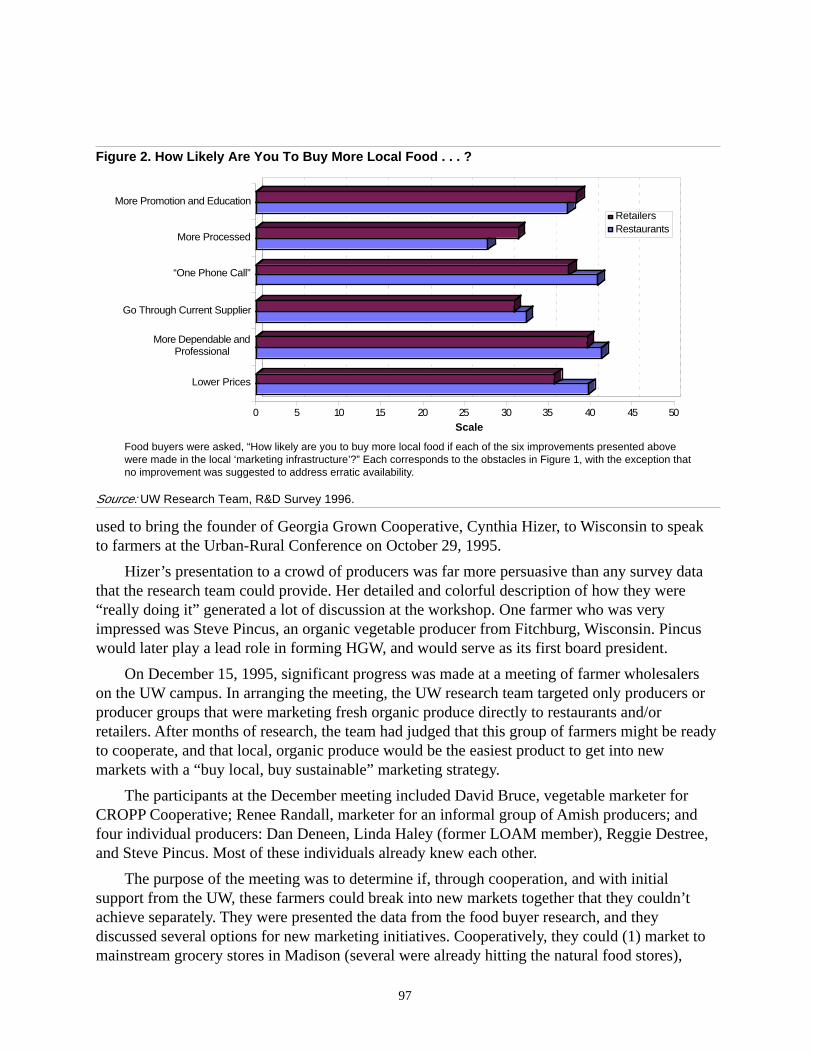
97
0 5 10 15 20 25 30 35 40 45 50
Lower Prices
More Dependable andProfessional
Go Through Current Supplier
“One Phone Call”
More Processed
More Promotion and EducationRetailersRestaurants
Figure 2. How Likely Are You To Buy More Local Food . . . ?
Scale
Food buyers were asked, “How likely are you to buy more local food if each of the six improvements presented abovewere made in the local ‘marketing infrastructure’?” Each corresponds to the obstacles in Figure 1, with the exception thatno improvement was suggested to address erratic availability.
Source: UW Research Team, R&D Survey 1996.
used to bring the founder of Georgia Grown Cooperative, Cynthia Hizer, to Wisconsin to speakto farmers at the Urban-Rural Conference on October 29, 1995.
Hizer’s presentation to a crowd of producers was far more persuasive than any survey datathat the research team could provide. Her detailed and colorful description of how they were“really doing it” generated a lot of discussion at the workshop. One farmer who was veryimpressed was Steve Pincus, an organic vegetable producer from Fitchburg, Wisconsin. Pincuswould later play a lead role in forming HGW, and would serve as its first board president.
On December 15, 1995, significant progress was made at a meeting of farmer wholesalerson the UW campus. In arranging the meeting, the UW research team targeted only producers orproducer groups that were marketing fresh organic produce directly to restaurants and/orretailers. After months of research, the team had judged that this group of farmers might be readyto cooperate, and that local, organic produce would be the easiest product to get into newmarkets with a “buy local, buy sustainable” marketing strategy.
The participants at the December meeting included David Bruce, vegetable marketer forCROPP Cooperative; Renee Randall, marketer for an informal group of Amish producers; andfour individual producers: Dan Deneen, Linda Haley (former LOAM member), Reggie Destree,and Steve Pincus. Most of these individuals already knew each other.
The purpose of the meeting was to determine if, through cooperation, and with initialsupport from the UW, these farmers could break into new markets together that they couldn’tachieve separately. They were presented the data from the food buyer research, and theydiscussed several options for new marketing initiatives. Cooperatively, they could (1) market tomainstream grocery stores in Madison (several were already hitting the natural food stores),
98
(2) market to upscale restaurants in Madison, (3) market to upscale restaurants in Chicago, or (4)explore value-added or food processing alternatives.
While there was interest in all four options, the group felt that (1) and (4) were moredifficult, requiring more capital and more momentum than the group could muster in the shortterm. In the restaurant market, Haley (with her husband DeWilde) was already marketing a smallportion of their production to Madison restaurants, and suggested the group target Chicago.Randall, however, was already marketing most of her Amish farmers’ produce to chefs inChicago.
By the end of the meeting, consensus was reached that both Madison and Chicago restaurantmarkets were worth exploring, with the possibility that any new efforts in Chicago could bemerged with Randall’s current business. Pincus, Deneen, and Randall agreed to work withUWCC and CIAS staff to explore these options, and a steering committee was formed.
The fact that six separate farmer-wholesalers could come to agreement on exploring acooperative strategy may be explained in the following ways. First, the “organic community” inWisconsin is fairly small, and these individuals had come to know each other, with some level oftrust and respect. This provided an opening for collaboration.
Second, while these farmers were competitors in a number of markets, it was not a fiercelycompetitive environment. By their own account (and bolstered by industry statistics), demand fororganic foods was growing by as much as 20 percent a year. Even if some individuals eventuallyopted out of the cooperative effort, there was room for more players, so most did not feelthreatened.
Third, everyone at the meeting was interested in expanding production and sales, but marketR&D is always a drain on resources. If the UW could use SAP grant funds to support this R&D,then at this point, there was very little risk in going along with the project.
Finally, there was the Capper Volstead Act of 1922. That federal legislation provides thelegal foundation for cooperative business in the United States. It gives farmers a limited antitrustexemption, which is why it was legally acceptable for these growers to meet and discuss marketshare and other business information, with the intent of cooperating for the benefit of theirindividual businesses.
Forming a Cooperative Venture
In January 1996, the steering committee began to take steps to form a new cooperative. Thefirst vegetable crops would be ready for sale by mid-to-late May, but planting responsibilitieswould limit farmers’ time long before that. Essentially, the committee had about three and a halfmonths to pull everything together.
Another survey was designed to send to farmers who, in the 1994 survey, had expressedsome interest in cooperative marketing. It was decided to target only the southern third ofWisconsin’s counties, simply for transportation reasons. In a cover letter to the farmers, thesteering committee explained the proposed venture. Among other things, the survey asked whatcrops they might market through the co-op.
99
Over time, some 25 producers would show interest, and ultimately 15 would join the co-op.The survey data enabled the steering committee to create a Crop Availability Sheet, listing 94different fruit and vegetable varieties. It also showed when each crop would be available, andthat a range from one to nine farms stood behind each product.
The farmers were not asked (then or since) why they would join HGW. In the years to come,they would market between 5 and 20 percent of the produce from their individual farms throughthe co-op. For these sales, they would receive a wholesale price, which would be less than whatthey could earn marketing directly to consumers or directly to restaurants themselves.
Presumably, each farmer found it economically advantageous to market some of theirproduce through the co-op because they produced more than they could market through theirexisting outlets, and because they could not get their products into new restaurants any cheaperthan the co-op could do it for them. In other words, the co-op offered an attractive complement totheir existing marketing strategies.
Narrowing the Target Market to MadisonThat first Crop Availability Sheet would become a primary tool for engaging restaurant
chefs. The earlier survey of food buyers provided estimates of how much money severalrestaurants had spent on local produce in 1995. Including purchases made directly from farmersand through other suppliers, 21 restaurants averaged over $20,000 the previous year (includingone restaurant that purchased $250,000 in local foods, and excluding a local pizza chain thatpurchased $2 million worth of Wisconsin cheese).
Of those 21 restaurants, 16 were in Madison. None were in Chicago. The group did have onesolid contact with a nationally renowned Chicago restaurateur, Rick Bayless of Frontera Grill,but the steering committee was increasingly leaning toward a focus on Madison for the first year.
There were at least three reasons for the focus on Madison. First, while committee memberRandall was already marketing to Chicago, there was not consensus to merge her business withthe new co-op effort. Second, aside from Randall, the committee had no data and only one goodcontact in Chicago. Finally, Chicago would involve higher transportation costs and othercomplications. The steering committee decided to wait and see how Randall’s second year inChicago went, and to focus on Madison in the meantime. About this time, Randall stepped offthe steering committee.
Two Individuals Step ForwardTwo individuals deserve special attention at this point: Steve Pincus and Joe Sonza-Novera.
While other committee members made important contributions, Pincus and Sonza-Novera wereparticularly critical.
By this point, the steering committee had elected Steve Pincus as its chairperson. After some20 years growing organic vegetables, Pincus had developed a successful business for himself bymarketing directly to consumers and to groceries. Most of the production from his 20 acres of
100
vegetables was (and continues to be) marketed within a ten mile radius of his farm, convenientlylocated on the southern edge of Madison.
Pincus’ personal success translated into several benefits for this co-op initiative: (1) hissuccess earned him the respect of many other producers in the region, so he was a goodspokesman for the project; (2) because his own operation had become systematized and stable,he was able to put some of his off-season time and energy toward a new project; and (3) he waswilling and able to take a modest financial risk in order to build new markets and expand hisproduction.
Twenty years prior, Pincus had been involved with the start-up of a cooperative naturalfoods grocery in Milwaukee, Wisconsin. His intervening years as an independent farmer did notdull those cooperative lessons, for as the months and meetings passed, his communication andprocess skills became very apparent. He guided the steering committee through a harrowingwinter and spring of complicated planning and decisionmaking.
Joe Sonza-Novera had participated in the LOAM discussions back in 1994. Since then, hehad quit his job as bookkeeper for Dupre’s organic distributing company, Needs Lettuce. (Duprewas primarily marketing out-of-state produce to natural foods stores in Wisconsin.) Sonza-Novera’s commitment to sustainable agriculture inspired him to contribute many volunteer hoursto HGW. Eventually, he would be hired as a consultant to manage the co-op through its first year,but there were no funds to pay for his early involvement, and there were no guarantees that theventure would even get started. His background in bookkeeping and his experience at NeedsLettuce was quite valuable to HGW in its first year.
While the UW research team was also critical to this development project, they participatedas paid employees of the state. On the other hand, Pincus, Sonza-Novera, and the other founderswould volunteer countless hours to starting the new co-op. Without that commitment, the doorsto the business would never have opened.
Developing Policies and ProceduresOn February 15, 1996, the steering committee held its first public meeting with farmers at a
community center in Mount Horeb. About a dozen producers attended. Market data from thefood buyer surveys was presented, as were the results from the recent farmer survey. TheGeorgia Grown Cooperative model was explained in detail.
The steering committee made it clear that a lot of work still needed to be done. Among theissues still to be worked out:
• Monitoring quality—setting standards and educating growers
• Setting prices and developing an accounting system
• Transportation and communication logistics
• Crop allocation and supply management
• Chef education—marketing and promotion
101
• Hiring and monitoring staff
• Organizational and legal issues— incorporation, liability, taxes, regulations, and so on
Interestingly, the list of issues presented to farmers that day did not include the financial costof getting the co-op up and running. Perhaps the steering committee foresaw that farmers wouldnot commit much capital to start the venture. Since the Georgia co-op was started “on ashoestring” and eventually became profitable, the committee hoped it could do the same.
Following that first public meeting, the steering committee refined four policy proposals andan operational system for the business. The first policy, called a Governing Structure, offered anunusual twist to the co-op model: both farmers and chefs would be welcomed into themembership. Each member would have one vote in the election of a board of directors, whowould hire and oversee a manager to run the operation. The board would consist of three farmersand three chefs, and those six would elect, by unanimous consent, a seventh “tie-breaking”member to the board.
A Capitalization Policy was also designed. Each member would contribute $75 to thecooperative as an annual membership fee. This amount was not based upon how much moneythe co-op needed to get started, but on how much the committee believed the farmers would bewilling to risk. To date, the company has not borrowed funds from commercial lenders.
Negotiations with Sonza-Novera, who was interested in the manager position, resulted in a$10 per hour rate for the manager’s time to run the business. Once sufficient sales levels wererealized, labor and all other operating costs would be covered by the co-op’s mark-up on theproduce. The trick to getting the co-op started then was to keep the fixed costs down.
A Pricing Policy stated that an average of other organic wholesalers’ prices would be thebasis for what HGW would pay its members and for what it would charge the chefs. Farmerswould receive 80 percent of that average price for each product, and chefs would be charged 30percent over what farmers received. (In reality, this complicated approach was never instituted.Eventually, farmers would submit to the manager how much they wanted for their produce, andhe or she would mark that up 40 percent for Madison sales, and 60 percent for Chicago,representing margins of 28 percent and 38 percent respectively. Those margins are quite high byindustry standards, reflecting the new co-op’s higher costs and inefficiencies.)
A Market Boundary Policy was developed that said that any member who was already doingbusiness with a restaurant could keep selling directly to that customer. However, off limits wouldbe any new accounts that the co-op established that a member did not already have. This policydid not work both ways: the co-op could market to restaurants that any of its members hadpreviously done business with.
In the future, this rule would be relaxed in the Madison marketplace, allowing members tocompete directly with the co-op regardless of who got the account first. The rationale was thatthe co-op should exist to serve its members: if the members could serve the Madison restaurantsdirectly on their own, they should be allowed to do so. However, that relaxed policy was not
102
extended to the more distant Chicago marketplace, where HGW would find success in futureyears.
Finally, an Operational Plan was developed for the business, modeled very closely after theGeorgia Grown Cooperative model. Every Sunday evening from May through November, eachfarmer-member would fax to the manager what fruit and vegetable crops they would haveavailable. The manager would compile these into one master product list and fax that list to therestaurants.
Chefs had until Tuesday afternoon to call in what produce they wanted to order. Themanager would then fax each farm to tell it what quantities of which produce it should deliver toa common delivery point in Madison. For the first year, this was the dock of another privateproduce distributor, Golden Produce of Madison.
Bobby Golden, who sold conventional (non-organic) produce to upscale restaurants inMadison, did not consider HGW a competitor. He judged correctly that HGW’s sales to his owncustomers would be rather minimal, and yet by helping to get fresh, organic, locally grownproduce to his accounts, he was distinguishing his business from his true competitors.
After producers got their produce to Golden’s refrigerated warehouse on Wednesday, earlyThursday morning the manager would arrange it for delivery and prepare the invoices. Theproduce was loaded onto Golden’s truck and delivered to the restaurants in Madison. Goldeninitially wanted to charge $2 per box, but he kindly reduced that to $1 at the request of StevePincus, whom he had known for years.
Over the years, all of these policies and procedures would be refined—some dramatically.The $10 per hour payment to the manager, for instance, would be replaced with a commissionapproach (15 percent of sales). Furthermore, about 18 months after these policies were presented,the farmers would vote, and the chefs would consent, to converting the co-op into a moreconventional farmer-owned cooperative. The chefs simply weren’t interested and/or didn’t havetime to attend the meetings.
The development of the policies and procedures that spring did serve an important purpose:they gave farmers some level of confidence in the proposed cooperative, which by now hadinformally taken the name Home Grown Wisconsin. On February 26, yet another survey wassent to the interested farmers. Attached to the survey were the proposed policies. Farmers wereasked if they would be willing to contribute $75 and become a member.
They were also asked to contribute a photograph and a short biography to describe theirfarm. As part of its marketing strategy, the co-op would always try to highlight the individualityof its member-farms. To this date, however, plans to create a calendar, a “glossy” brochure, orweb pages presenting each individual farm have never been carried through to fruition.
Gearing Up for BusinessIn the same weeks that the steering committee was busy developing policies and reaching
out to farmers, it was also reaching out to chefs as potential members and customers. OnFebruary 24, a letter was sent to the “sweet sixteen” Madison restaurants who had proven their
103
support of local farms in the past with their purchases. The chefs were presented with the samepolicy proposals that the farmers received, but it was more likely the Crop Availability Sheet thatcaught their attention. The letter also included a short questionnaire, which, they were told, theycould fill out when an HGW representative visited them.
By this time, Pincus, Sonza-Novera, and Lawless were essentially sharing the day-to-dayresponsibilities of moving the project forward. The rest of the steering committee guided andreviewed their progress at several meetings through March and April. These three individualsdivided up the 16 restaurants between them, or sometimes went in pairs, and met with the chefsin person.
Most of the chefs were interested. Many had recently become members of a national effortcalled Chefs Collaborative 2000, which was committed to supporting farmers and sustainableagriculture. Besides those idealistic reasons, the co-op did offer the promise of a professional,dependable source of a wide assortment of high-quality, locally grown produce. Some hesitatedat the idea of paying $75 and becoming a member of the co-op. They had justifiable questionsabout liability, for instance. They also had concerns about price—at that time they could only beoffered rough estimates.
Eventually, 11 chefs did contribute $75 to the co-op. More importantly, a number of thembecame involved on the steering committee, and later served on the board of directors. The directand meaningful feedback that the farmers received from Brian Boehm, Odessa Piper (formerLOAM member), Leah Caplan, and others was invaluable to the new business. In particular,these key informants advised about how to approach other chefs, about how restaurants operated,and about the quality of product and service that high-end restaurants demanded.
The questionnaires asked the chefs to indicate how much of which crops they would beinterested in receiving. It did not ask them to commit to any contracts, and it’s doubtful that anywould have done so. But together, the questionnaires and the discussions with the key informantsgave the steering committee some idea of how much of which crops would be in demand.
On April 18, 1996, HGW held is first quasi-official membership meeting. (“Quasi-official”because the business would not incorporate for several months, and would operate withoutbylaws for another two years!) Fifteen farms were represented. The bulk of the meeting wasspent “allocating” different crops to different members. For each crop variety, the co-op neededbetween one and three “priority growers” to meet projected demand.
Surprisingly, there was not much conflict over this issue. It was true then and in subsequentyears that members varied quite a bit in what they wanted to sell through the co-op. The earliercrop availability sheet had accurately predicted that the co-op would be able to offer a widerange of products throughout the summer.
In another interesting organizational twist, CROPP Cooperative of La Farge became a groupmember of HGW. While CROPP was concentrated on marketing to natural foods stores in theregion, they were willing to be a “back up” supplier on any crop when HGW’s priority growersfell short of demand. In the first three years of operations, this scenario rarely occurred, butCROPP’s cooperative support offered a degree of security.
104
At the end of the April meeting, the farmer membership was officially closed for the 1996season. One subtle effect of having an exclusive membership policy was that there was a risk tonot providing quality product or not following proper procedures—expulsion from the group.
Around this time, human resources to move the project forward were running pretty thin.Farmers were increasingly being called to their fields for planting. The SAP grant that supportedLawless’ involvement was drained dry. Sonza-Novera, the acting manager, could no longercontribute on a purely volunteer basis.
To address these pressures, one individual made a personal loan of $500 to the company sothat it could pay its manager until cash flow was generated. (That no-interest loan was repaid bythe co-op two years later.) In addition, Lawless wrote another grant proposal, this time to thestate’s Agriculture Diversification and Development (ADD) program. That grant was funded for$12,600 through June 1997, allowing him to justify continued involvement on university time.
In April and May, the last steps were taken to prepare for the coming season. The managerwould operate out of his own private office space, at no charge to the co-op. (This paralleledGeorgia Grown Cooperative, which operated out of Cynthia Hizer’s living room in its earlyyears.) Overnight storage and trucking would be purchased each week on a per-box rate fromBobby Golden. Remaining expenses would include the cost of goods sold, the manager’s salary,a $300 fax machine, phone bills, and assorted legal fees.
On April 15, Sonza-Novera submitted documents to get a federal ID number for thebusiness. Come October, that paperwork would trigger bureaucratic processes that would forcethe organization to backtrack and prove that its manager was not an employee, but anindependent contractor. The complicated issue of employees vs. consultants involvesgovernment-mandated employer costs, and penalties for failure to comply. (The following year,the co-op decided to avoid the risk of penalties and made its manager a formal employee.)
Over the course of the first year, HGW spent about $800 on legal fees, most of it fordeveloping Articles of Incorporation that fit with the co-op’s unique Governing Structure. TheseArticles, plus one short form, and about $30 were all that were needed to incorporate as a formalcooperative under Chapter 185 of the state code. Only then could the company legally add theword “Cooperative” to its business name.
The incorporated status was not granted until August, which means that the company didbusiness for three full months without any of the protections of corporate limited liability. On topof that, it would be another year before the co-op purchased business and product liabilityinsurance. As mentioned, the co-op’s bylaws were not completed until after the 1997 season wascompleted. Finally, no tax reports were filed with either the state or the federal government untilJune 1998!
There was simply so much to be done in that first year, and so little money to spread around,that, unfortunately, shortcuts and risks like these were often unavoidable. In subsequent years,turnover in the manager’s position meant that some details—like filing taxes—slipped throughthe cracks. This experience of HGW is certainly not something to model after closely! But
105
despite all of the challenges and limitations, on May 26, 1996, the co-op made its first sale oforganic produce.
Finally Doing BusinessIn that first week the co-op grossed only $162, mainly from the sale of asparagus. In
planning the season, Steve Pincus estimated that, to break even, the co-op would need to average$1,000 in gross sales each week through 26 weeks of business. He arrived at that very roughestimate based on the costs outlined above, and a guess as to how many hours the managerwould need to spend each week to arrange sales and prepare deliveries.
Looking back, his guesswork was not too far off. Unfortunately, the co-op never reached$1,000 in gross sales in any week that first season, averaging just under $500. Not long into theseason, it became clear that most chefs were not going to place an order unless continuallycalled, prodded, and convinced. In other words, their moral support for the co-op in April wasnot enough; the manager would need to aggressively market the produce.
The leadership of HGW underestimated how much work it would take to make sales eachweek. While the manager increased his efforts, Lawless, working under the new ADD grant,pursued new accounts for the business. He approached another 25 Madison restaurants in Juneand July. Sixteen showed interest, and began receiving weekly Crop Availability Sheets fromSonza-Novera. HGW’s sales did increase as the season progressed, due largely to the increasedselection of crops, and there was hope that the big harvest months of August and Septemberwould help the co-op catch up with its bills.
The steering committee met only once that summer, to sign the incorporation papers and toelect Pincus its interim board president. (With incorporation, the steering committee became theinterim board of directors, until formal elections could occur at the next full membershipmeeting.) Lawless and CIAS’s Hendrickson would serve as nonvoting advisory board members.
By now, however, the farmers were far too busy with their own businesses to give anyattention to their co-op. To everyone involved, HGW that first year was an experiment. As oneboard member put it recently, “It was a laissez faire approach.” Just enough was done in thepreseason that year to get the business up on its feet. After a season of real business, theexperiment would be judged on its own merits.
By the end of November, the co-op ceased deliveries. It had grossed only $11,000, far shortof the $26,000 break-even estimate set by Pincus. In actuality, the co-op would have neededcloser to $32,000 in sales to avoid a loss that first year. Instead, it ended about $3,200 in the red.The board called a General Membership meeting for November 23, and only three farmersshowed up! Sales to their co-op had represented only a small fraction of most members’ businessthat year. With these grim numbers, it was certainly difficult to judge the experiment a success.
Giving It Another ShotOver the next four months, the board of directors studied the 1996 season and considered
several issues. Pincus made a strong case that, despite the $3,200 loss, the operational plan (the
106
system of faxes and deliveries) had run very smoothly. Having set that system in place, it mightbe worth giving it another chance.
Second, they had to decide how to handle the $3,200 loss. They proposed dividing the lossamong the farmer members, in proportion to the sales each made to the cooperative. As thelargest of the farmers involved, Pincus had sold more than double any other member, and hissales represented a third of the co-op’s business in 1996. When he agreed to take on the largestshare of the debt, most of the other farmers were willing to follow suit—with the hope of beingrepaid eventually out of future co-op profits.
Third, to become profitable, the board knew that it had to improve in one major area—marketing. It needed to find new customers, and once found, they had to get a much harder salespitch each and every week. The board took two important steps to address this issue: it decidedto target Chicago restaurants for new business in 1997, and it hired Judy Hageman as itsmanager.
Of course, the idea of marketing to Chicago had always been there. Now that the co-op haddeveloped a working system of fax communication and deliveries, it was more willing to leapinto the larger Chicago restaurant scene. An earlier connection with restaurateur Rick Bayless ledto two meetings with him and other Chicago chefs in January and February.
In these meetings, Pincus and Lawless found that several chefs were not happy with theirexperience dealing directly with farmers in recent years. Even more than the Madison chefs, theydemanded top quality produce and very professional service. They were presented with anupdated HGW Crop Availability Sheet. When they heard that the co-op had done business for ayear with 14 respectable restaurants in Madison, they expressed strong interest.
However, like the Madison chefs, they would not sign contracts and were somewhat vagueas to what they would order. But their volume of sales and their menu prices far exceeded mostMadison restaurants. It was becoming clear that Chicago would be the key to HGW’s success.There were logistical issues to sort out—namely transportation—but it was the co-op’s best andonly hope.
After Sonza-Novera resigned as manager to take another job, the board hired Judy Hagemanaround the end of March. Hageman brought to the co-op not only her exceptional marketingskills, but also her connections. She and her husband Bill raised early season crops under hoophouses, and were already marketing their high value products to several top Chicago restaurants.She was certainly not intimidated about making weekly calls to chefs and “pushing product.”Hageman agreed to work for HGW on a percentage basis—15 percent of sales.
Having hired Hageman so late in the winter, the co-op’s second season began almost aschaotically as the first. Not only did she have to learn an unfamiliar business; she had to take thatbusiness into an entirely new market.
Despite these challenges, Hageman and the board prepared well for the 1997 season. Theywere able to secure weekly transportation from Madison to Chicago: an independent truckingfirm owned by one of the co-op’s original farmer-members, James Welch. The drop-off point for
107
both Madison and Chicago deliveries was moved from Golden’s warehouse to Pincus’ farm, amore convenient location with a new cooler that Pincus rented to the co-op.
At the same time, still supported with ADD grant funds, Lawless did a thorough comparisonof the co-op’s 1996 prices against other organic distributors. There was a lot of variation: withsome crops HGW was high, with others quite low. In some cases, adjustments were made.Lawless also visited each of the Madison restaurant customers, and he created a crude brochurefor promoting the co-op. Meanwhile, Hendrickson of CIAS was making contacts with the foodservice program at the university in Madison, offering a potential new market to the co-op.
With the hiring of Hageman and the prospects in Chicago, most of HGW’s farmer-membersrejoined for year two. The few that resigned were replaced by new members. Once again, cropswere allocated among the 15 farmers. By the end of April, Hageman was already making sales ofwatercress, as well as potatoes stored from the previous season. As the season progressed, salesin Madison increased somewhat over 1996, but it was the trips to Chicago that made all thedifference. In one week alone, a single Chicago restaurant purchased more than all of Madisoncombined.
By the end of the year, Hageman had sold $60,000 in produce, nearly a sixfold increase overthe first season. Another winter of meetings, adjustments, planning, and customer visits wasfollowed by a third season that reached $100,000 in sales. The debts incurred by the farmers thatfirst year were all repaid, and the business finally had a surplus to worry about. By the end of1998, however, Hageman announced her resignation. The challenge of running the co-op on topof her own farm and her family responsibilities proved too much for her.
Fortunately, Rink Davee took over where Hagemen left off. Davee brought a wealth ofexperience to the job. He once worked for Chez Panisse a nationally renowned restaurant inBerkeley. He worked for years as the produce manager at a natural foods store in Madison. Hequit that job to become an organic vegetable farmer, was an original member of HGW, andserved for a time as its board president. Under Davee’s leadership, halfway through its fourthyear of business, gross sales for the co-op are on a steady incline.
Some Closing Thoughts
An alternative title to this case study might have been “Home Grown Wisconsin: How NOTTo Start a Successful Cooperative!” Looking back at those early years, it is hard to admit all theshort cuts and mistakes. It was a chaotic experience. Rather than focusing on what went wrong,however, it will be useful to briefly consider what contributed to the co-op’s success.
First and foremost, it was the people. The dozen or so individuals who made substantialcontributions to the project not only offered their talents and their time, but they got along witheach other. That’s not to say that there weren’t difficult moments, but respect and friendship havecontinually strengthened this cooperative venture.
Other contributing factors included grant support from the state; market research; marketdemand; high-quality produce; professional service; and finally, marketing, marketing,marketing.
108
Without the support of two grants totaling $22,600, the project simply never would havehappened—period. That money made it possible to conduct the market research that showedthere was a demand for the co-op’s product. It enabled Lawless to support Sonza-Novera andthen Hageman in developing initial relationships with restaurant chefs.
Obviously, if those chefs did not purchase the co-op’s products, the business would havefailed. Fortunately, there appears to be a growing appreciation among many restaurant chefs, andpresumably among their customers, for fresh, high-quality, locally grown farm products.Furthermore, by developing a working system of communication, transportation, and accounting,HGW was able to offer a level of professional service that all restaurants demand.
Finally, the farmers of Home Grown Wisconsin Cooperative have come to realize that it isnot enough to produce good food. You must also find someone to buy it—preferably at thehighest possible price. That requires a marketing strategy that involves continuous research, risk-taking, and promotion. Even in the midst of the current season, the HGW board met recently todiscuss their experiment with a new organic farmers market in Chicago. They hired a new part-time employee to revisit chefs in Madison, where sales have been slipping. And they’re finallygetting around to developing that glossy promotional brochure, highlighting the unique characterof each member farm.
109
Northern Vineyards Winery
by Lee Egerstrom
The Minnesota Winegrowers Cooperative, a grape and wine co-op formed in 1983, hasevolved to a point in its business life where it now provides the economic benefits sought by itsfounders. Given its geographic location, it provides equally important societal benefits for itsprimary community and for the scattered communities in Minnesota and Wisconsin where itsmembers reside. Looking forward, it is certain to provide additional, intangible benefits forsociety by serving as a model for communities seeking wealth-creating economic development orpreservation of farmland and green space from urban sprawl. In fact, this is already happening.Groups of people as diverse as suburbanites around Columbus, Ohio, to economic plannersassisting the privatization of state-owned property in Hungary are considering efforts to replicatethe Minnesota Winegrowers model.
This case study examines the co-op and its business unit, Northern Vineyards Winery; thegeographical environment, including area demographics and economics; members, and how theyfunction within a cooperative society; and the obstacles they have overcome. At the same time,the analysis will identify the societal benefits of using the co-op’s model to promote landpreservation, resource diversification, and community economic development.
The Minnesota Winegrowers Cooperative and its Northern Vineyards Winery business unitdeserve attention from farmers, community developers, economic planners, and potentialinvestors in a community-based enterprise of nearly any ownership structure. Not everycommunity or region needs a winery. Most areas of the country are capable of producing a winegrape; fewer, however, are capable of producing a wine of marketable quality. The relevance forstudying Northern Vineyards Winery is that most areas have some land resources capable ofsupporting a unique crop or manufactured product that would have economic value for investorsand the resident community.
The Cooperative
The Minnesota Winegrowers Cooperative, doing business as Northern Vineyards Winery inStillwater, Minnesota, was founded on the east edge of the Minneapolis-St. Paul metropolitanarea. Following the historical pattern of most producer-owned co-ops worldwide, it started froma purely defensive position—that is, the growers were faced with a market failure or marketimperfection (Egerstrom 1994).1 The ten founders lost their grape market when an existingwinery changed its business strategy and began making different wines from new grape varietiesgrown in its own vineyards. The founders had little choice but to create a market for their grapes.The choices were to create their own, privately owned and operated wineries, or pool resourcesto create a business venture with greater scale and scope, either as an investor-owned firm (IOF)or incorporated as a co-op (Egerstrom 1998a).
One member created a winery but quickly learned that he now had three part-time jobs:(1) grape growing, his intended hobby and part-time activity; (2) winemaking; and (3) wine
110
marketing and retailing.2 Such large investment in time and money did not appeal to othergrowers. They chose instead to band together and form a co-op as has been the typical responseof growers and farmers in Minnesota and Wisconsin during the past century. In this case,however, the market failure was so complete that a handling and marketing co-op along the linesof early dairy and grain marketing co-ops would not be sufficient for their needs.
Faced with this market failure dilemma, they created what co-op specialists call an offensivestrategy co-op patterned after the three Minnesota and North Dakota sugar beet co-ops in theregion that are usually considered among the original New Generation Cooperatives (NGCs).3 Ingenerally accepted terms for describing co-ops, traditional co-ops that set out to correct marketfailures are considered to have defensive strategies, given their objectives. NGCs, in contrast, areconsidered offensive co-ops in that they seek ways to generate greater income for members’products in the markets. This is achieved from value-added processing and manufacturing and, insome cases, by providing higher-valued services to members and customers.
Each original member invested $2,000 to form the co-op, giving the company $20,000 instart-up capital. The original winery operator, David Macgregor, also donated his winemakingequipment as an initial investment in the firm. After incorporating as the Minnesota WinegrowersCooperative, members donated time to assist Macgregor in making the wine. In its second year,1984, the co-op rented space in an old warehouse in downtown Stillwater where it continues tohouse the winemaking equipment, store wine inventories, and operate a retail shop. NorthernVineyards Winery, the business unit of the cooperative association, was born. Sales of wine haveincreased at an annual average rate of 15 percent since the first wine was marketed in 1984.
Initial investments by founding members have been repaid along with a small, annualizedinterest payment on their initial investment. More importantly, the growers have been able torestore Northern Vineyards’ grape payments to co-op members at a rate of $.50 per pound, theprice necessary for members to keep and maintain the vineyards after the original marketdisappeared. Since 1990, the co-op has also been able to make payments to members from profitsgenerated by the winery. For example, a former University of Minnesota medical schoolprofessor who has 2.5 acres of grapes on his rural estate now receives annual payments of $7,500for his grapes and $600 in annual patronage payments that reflect his equity stake in the co-op’sprofits.
The Co-op’s Benefits to Members
The income received is sufficient for members to supplement household incomes and keepvineyards intact on country estates surrounding the Twin Cities metropolitan area and nearMinnesota communities. In doing so, Minnesota Winegrowers Cooperative is responsible for twostreams of income received by individual members: (1) it creates a market that rewards growersfor grapes and (2) it rewards membership and cooperative behavior by providing a stream ofincome from the co-op’s success, as measured by its profits.
No member has become wealthy by belonging to the co-op, observes Robin Partch, ascience and elementary education teacher who has become the chief winemaker for the co-op.
111
Prospects of a financial return from what is essentially a farming hobby, however, encouragemembers to stay in the co-op and retain their rural farm estates while enticing other ruralproperty owners to join the firm and grow grapes. So far, it has worked. The founders’ initialstock offering was valued at $10 per share. Each share provides delivery rights—and implieddelivery obligations if growing conditions permit production—of 100 pounds of grapes. Whileeach member has a delivery obligation, the co-op carries the risk that drought or other weatherconditions may preclude some or all members from delivering their quantity in a given year.Shares are sold in blocks so each member has rights to deliver at least 500 pounds of grapes.
After the initial subscription, or offering, the share price fell predictably to only $5 per share.This often happens with initial offerings of IOFs. Some initial members sold their stock back tothe co-op, and new members were found to buy the stock. The stock was valued at $27 per sharein 1998 and reached a high of $30 per share in 1999. At the start of 1999, the co-op had 16 full-fledged owner-members and had contracted with six other grape growers to deliver grapes to thewinery. The contract growers receive the same $.50 per-pound payment for the grapes but do notshare in the winery profits.
According to Partch, the contract growers have indicated that they will join the co-op in thefuture, rolling profits from grape growing into stock purchases. Moreover, some of the newergrowers are entering the co-op with an offensive strategy of their own. They view membership inthe co-op as a way to assure multiple streams of income to their households, not just as anincome stream to cover costs of their grape-growing hobbies or to keep their rural estates nearurban communities.
Reasons for Success
The GeographyNorthern Vineyards Winery has been successful during its first 15 years of operation for
reasons that combine good luck and good people. The latter will be considered in a later sectionon members. The good luck comes, in part, from geography and the timing of the people’sactions to utilize their land resources. Stillwater, Minnesota, is about ten miles straight east of St.Paul, and between 20 and 25 miles east of downtown Minneapolis. It is a historic frontier rivertown, the oldest continuing municipality in Minnesota, and a port city on the St. Croix River.That river is the border between Minnesota and Wisconsin to the east and north of St. Paul. Itmerges into the Mississippi River at Hastings, about 20 miles south of St. Paul, where the largerriver takes over as the border between the two states.
Stillwater’s importance for river navigation ended more than a century ago, but it is stillimportant for river recreation, the city having one of the few bridges that cross the scenic St.Croix. As a result, Stillwater is a bustling tourist town and a recreation crossing point for TwinCities area residents en route to Wisconsin lakes, resorts, and other recreation activities. It is alsoa daily crossing point for thousands of Wisconsin residents who commute to jobs and attendentertainment or business meetings in the metropolitan area. Three border counties of Wisconsin
112
have become extensions of the Twin Cities metro area and will likely be identified as membersof the Minneapolis-St. Paul Standard Metropolitan Area (SMA) in the near future.
The location provides an opportunity and a challenge for Northern Vineyards Winery. On theplus side, it has both a residential and transitory clientele for its wine as people pass throughStillwater on daily commutes or on weekend outings. Along with wine sales at liquor stores inthe Twin Cities, it has a customer base capable of buying its annual production with minimalmarketing costs. This works as long as the wine is of a pleasing quality; so far, the winery hasmade high-quality wines. On the negative side, however, is the attractiveness of the region. Thesame desirable features that produce visiting customers for wine also produce new immigrants tothe river bluffs, green spaces, and former farms on both sides of the St. Croix River. Theseimmigrants bring with them, or are preceded by, real estate developers who measure farms in lotsrather than acres. Washington County, the county surrounding Stillwater and reaching to the first-ring suburbs of St. Paul, has had Minnesota’s fastest growing population since the mid-1980s.
Not all 16 members and six contract growers for Northern Vineyards Winery live in thisscenic area that is now the magnet for urban sprawl. Nevertheless, some of the more distantmembers, whose vineyards are near other river towns; the medical center at Rochester,Minnesota; and lake resort developments in northern Minnesota, are experiencing similar landuse and land cost pressures on their vineyards/farms. The result is that all members face risingcosts for holding onto their land, be it from rising property taxes, pressure to sell as a result ofrising land values, or a combination of both.
Given that environment, most members entered the co-op seeking an income source tosustain their increasingly expensive hobby. “I don’t think it was anyone’s intention to makemoney on our grapes,” said member Howard Krosch, a retired aquatic biologist at the MinnesotaDepartment of Natural Resources who operates a vineyard near Stillwater. “It was more a matterof trying to find a way to make money from our hobby so we could afford to grow the grapes”(Egerstrom 1998a, 1E). While a seemingly modest objective, the goal relies on the same NGCstrategy used by corn grower co-ops that attempt to produce greater returns on labor andinvestment by converting corn into higher-valued ethanol fuel, pork, or egg products for the foodindustry. In the case of the grape growers, the goal is to convert a hobby expense—grapes—intoa higher-valued and profitable consumer product—wine.
The WineryThe winery tells customers in promotional brochures that there is no reason why grapes and
wine cannot be produced in Minnesota. The Twin Cities are at the same latitude as the Bordeauxregion of France (45 degrees North), “and several hundred miles farther south than the greatRheingau region of Germany” (Northern Vineyards Winery 1997). It doesn’t mention that partsof Russia’s Siberia have the same latitude, and that no one considers Siberia to be a prime wineregion.
113
The winery acknowledges that Minnesota isn’t exactly like Bordeaux. The state has whatgeographers call a continental climate. France and Northwest Europe have a marine, coastalclimate:
Early autumn frosts often cut short the growing season here (Minnesota). The severewinters sometimes damage even the hardiest of grapevines. The noble wine grapes ofEurope can neither ripen their fruit here nor survive our winters. So the challenge toMinnesota grape growers has been to find alternative grape varieties that can be grownwithin the limits imposed by our climate. (Northern Vineyards Winery 1997)
This it has done, the winery proudly notes, through adaptation of French-American hybridgrapes and by breeding improved varieties such as those produced during the past 50 years by aplant breeder who is a member of the co-op. To further maximize its resources, the winery hasalso started making dessert wines in recent years that are fermented from native American wildgrapes that grow along Minnesota and Wisconsin river banks.
Wine drinkers who have not visited Minnesota or western Wisconsin in recent years willrecognize only the names of French-American hybrid grapes identified in the wines. It is unlikelythat the uninitiated will have heard of the locally produced grapes, but that will change. Theoriginal winery in the area, Alexis Bailly Winery, and two new, privately owned wineries, havestarted, since 1996, to produce wines from successful new grape varieties. The current NorthernVineyards Winery portfolio of wines include three new offerings:
1. Frontenac—A full-bodied dinner wine from the Frontenac wine developed by theUniversity of Minnesota.
2. Ruby Minnesota—A fortified, red dessert wine made from wild riverbank grapes.
3. Mainstreet Red—A semisweet, fruity red that is a blend of local grapes with Fochgrapes brought in from Michigan.
The main wine portfolio, however, includes Northern Vineyards-bred varietals named St.Croix, Oktoberfest, a Pinot Noir hybrid, Leon Millot, and Prairie Smoke; and blended wines thatinclude grapes imported from Michigan, California, and other U.S. wine regions. These latterwines include such names as Columbine, Yellow Moccasin, Syval Blanc, Ladyslipper, PrairieRose, Rivertown Red, Ram’s Head Red, and Downtown Red. What local residents and touristsrecognize is that these wines salute native wildflowers that grow in the area or Stillwaterhistorical sites.
Production and the Wine MarketWine production in the U.S. is measured in English gallons for alcohol tax reasons. A gallon
of wine in the cask produces five internationally standard 750 ml bottles. Partch explains that thewinery had to produce 4,000 gallons or 20,000 bottles of wine per year to break even financially,given necessary labor requirements, licenses, insurance, taxes, and rents for winery and retailspace. The break-even point is based on wine prices ranging from $6 to $11 per bottle, withaverage prices for the portfolio of wine ranging from $6.50 to $8 per bottle. Members of theco-op donated time working in winemaking, retailing, and promotion until the winery’s break-
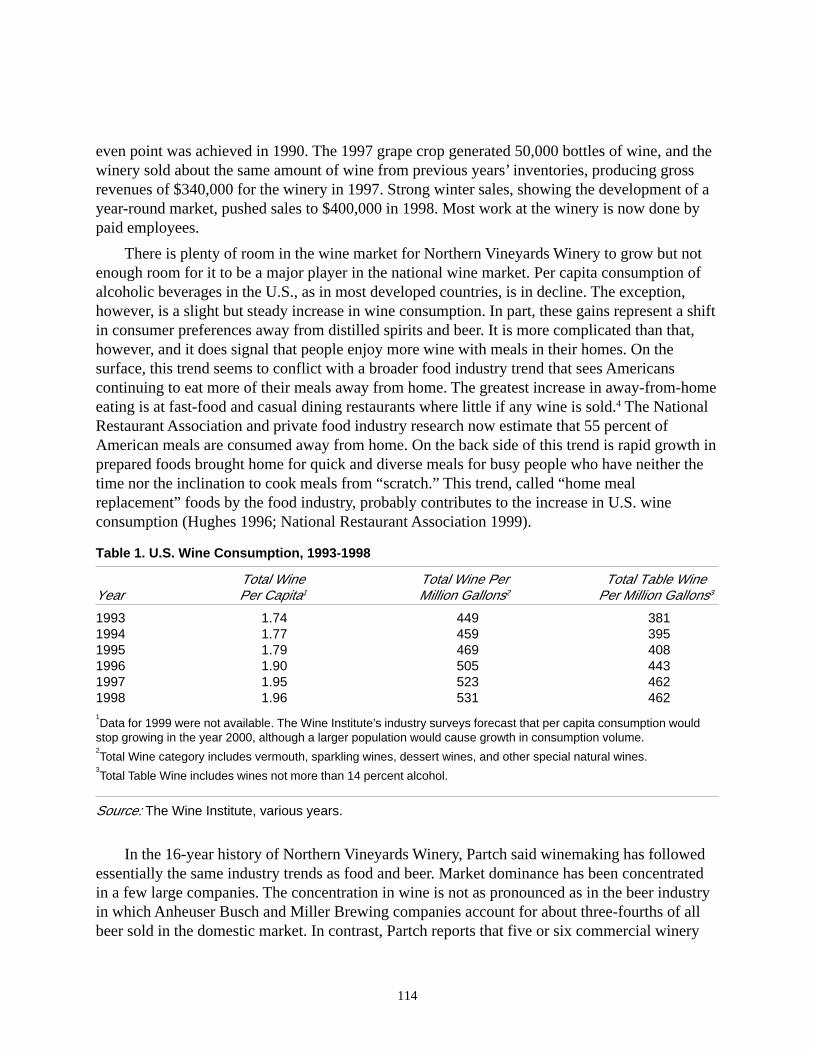
114
even point was achieved in 1990. The 1997 grape crop generated 50,000 bottles of wine, and thewinery sold about the same amount of wine from previous years’ inventories, producing grossrevenues of $340,000 for the winery in 1997. Strong winter sales, showing the development of ayear-round market, pushed sales to $400,000 in 1998. Most work at the winery is now done bypaid employees.
There is plenty of room in the wine market for Northern Vineyards Winery to grow but notenough room for it to be a major player in the national wine market. Per capita consumption ofalcoholic beverages in the U.S., as in most developed countries, is in decline. The exception,however, is a slight but steady increase in wine consumption. In part, these gains represent a shiftin consumer preferences away from distilled spirits and beer. It is more complicated than that,however, and it does signal that people enjoy more wine with meals in their homes. On thesurface, this trend seems to conflict with a broader food industry trend that sees Americanscontinuing to eat more of their meals away from home. The greatest increase in away-from-homeeating is at fast-food and casual dining restaurants where little if any wine is sold.4 The NationalRestaurant Association and private food industry research now estimate that 55 percent ofAmerican meals are consumed away from home. On the back side of this trend is rapid growth inprepared foods brought home for quick and diverse meals for busy people who have neither thetime nor the inclination to cook meals from “scratch.” This trend, called “home mealreplacement” foods by the food industry, probably contributes to the increase in U.S. wineconsumption (Hughes 1996; National Restaurant Association 1999).
Table 1. U.S. Wine Consumption, 1993-1998
Total Wine Total Wine Per Total Table WineYear Per Capita1 Million Gallons2 Per Million Gallons3
1993 1.74 449 3811994 1.77 459 3951995 1.79 469 4081996 1.90 505 4431997 1.95 523 4621998 1.96 531 4621Data for 1999 were not available. The Wine Institute’s industry surveys forecast that per capita consumption would
stop growing in the year 2000, although a larger population would cause growth in consumption volume.2Total Wine category includes vermouth, sparkling wines, dessert wines, and other special natural wines.
3Total Table Wine includes wines not more than 14 percent alcohol.
Source: The Wine Institute, various years.
In the 16-year history of Northern Vineyards Winery, Partch said winemaking has followedessentially the same industry trends as food and beer. Market dominance has been concentratedin a few large companies. The concentration in wine is not as pronounced as in the beer industryin which Anheuser Busch and Miller Brewing companies account for about three-fourths of allbeer sold in the domestic market. In contrast, Partch reports that five or six commercial winery
115
companies control slightly more than 50 percent of the U.S. wine market. The remaining marketis shared by an expanding number of small and regional wineries and imports from Europe,South America, and certain wine exporting countries in Africa and Oceania.
Just as there are writers who desire to write “the great American novel,” there are increasingnumbers of people who desire to make the perfect American beer or perfect American wine. Newbreweries are springing to life all across the nation while large national breweries continue tomerge or fold. The Stroh Brewing Company, the nation’s fourth-largest brewery, became thelatest major brewer to cease operations when it decided in 1998 to sell its beer brands and assets(Steinman 1996, 1997, 1998). Meanwhile, many of the new breweries are attempting to makeBelgian style, handcrafted beers, usually selling into regional markets. Others are simply makinga beer and trying to market it with a clever label or tie it to a locale.
The new wineries, in contrast, do seem to be serious attempts by serious hobbyists andentrepreneurs to produce unique, quality products. When Northern Vineyards Winery startedoperations, about 400 wineries held tax licenses in the U.S. According to Partch, in 1998, thenumber had more than doubled to about 900 wineries. Owning vineyards has become especiallypopular with motion picture and entertainment figures in California, he noted. Winery ownershipnow includes such personalities as the Smothers Brothers and movie producer Francis FordCoppola. Heirs to industrial fortunes have done the same, including a Maytag family memberfrom the home appliance manufacturing firm of that name and a Firestone family member fromthe insurance and automobile tire industries.
This trend of starting new wineries in California can also be found in the Upper Midweststates: Wisconsin has a small number of local wineries scattered among its regional brewerylocations, and Minnesota, which had no commercial wineries three decades ago, now has at leastsix that bring products to market, and two more produce grapes and wine that were set to beginmarketing in late 1999. A few are extremely small and produce fruit wines for tourists inrecreational resort communities. The Alexis Bailly Vineyards, which is also near the Twin Citiesalong the St. Croix and Mississippi river bluffs, is about the same size as Northern VineyardsWinery and may be slightly larger in production and sales volume. A new winery will soon jointhe Northern Vineyards and Bailly wineries as a serious commercial enterprise. Morgan CreekVineyards was created in southern Minnesota during the 1998 growing season and is owned andoperated by members of the Marti family of the August Schell Brewing Company at New Ulm.That brewery has made a high-quality line of regional beers for 150 years under the guidance offive generations of Schell-Marti family members.
There are clear signs that the domestic beer market is “overbuilt” and that future shakeoutsof large and small breweries can be expected. The wine industry may not sustain any more large,national wineries than the domestic beer market sustains national breweries, but the wine marketis still in a growth mode. The commitment to quality by upstart new entrants in regional winemarkets probably serves to build consumer interest in wines and brightens prospects forcontinuing growth at Northern Vineyards Winery.
116
The MembersWithout a doubt, the most difficult and unquantifiable element holding a cooperative
business venture together is the commitment of its membership. In this regard, MinnesotaWinegrowers Cooperative has been especially lucky, says Allen Gerber, the former president ofthe Minnesota Association of Cooperatives who gave the winegrowers technical assistance in thebeginning stages. The co-op had extraordinary people with grape growing technical expertise tomake the winery a success, he recalls. At the same time, Gerber admits that he doubted thesebusy and talented people would remain committed to making Northern Vineyards Winery anongoing concern.
A Qualification. Most co-ops formed in the U.S. were started by people with knowledge oftheir industry. For instance, farmers started agricultural co-ops when they recognized that part oftheir markets were not functioning properly or in their best interests. Gerber suspects that thisinherent knowledge of the market helps explain why cooperative business ventures have had farhigher survival rates during the past century than have businesses started by individualentrepreneurs and venture capital investors. In general, fewer than 50 percent of new businessventures survive for three years in most business sectors. Gerber adds that business schools donot track the failure rate of cooperative businesses separately from other entrepreneurial ventures,but he knows from personal experience gained from cooperative association work that more than90 percent of the co-ops that have started in the Upper Midwest states during the past 30 yearshave survived or merged into other co-ops. Many co-ops chose to go out of business during thattime, he said, by merging into larger, stronger regional co-ops. Such mergers and consolidationscame as members understood their markets, not because of economic failure of their firms. Thegrape growers who started Minnesota Winegrowers Cooperative were kindred spirits of thefounders of other producer-owned co-ops, and they, too, possessed knowledge of their market.These founders, however, were also extremely busy professional people, major commodityfarmers, business executives, and private entrepreneurs. This raised questions in Gerber’s mindabout the eclectic group’s willingness to do the work and support a new venture.
Looking back, the founders were fortunate for the expertise their members possessed and forthe advice they secured from outsiders. One founder, the physiologist at the University ofMinnesota Medical School, took a group to see Gerber at the Minnesota Association ofCooperatives office in St. Paul. Gerber provided basic information on the structure, governance,and tax implications of cooperative businesses incorporated under the Capper-Volstead Act. Hecontacted an attorney with a St. Paul law firm that had the longest continuing cooperative lawpractice in the nation. The attorney, who later became vice president and general counsel for theSt. Paul Bank for Cooperatives, was equally intrigued by the group’s intentions. The groupwanted to start an NGC with a closed membership structure ten years before NGCs were namedand defined.5 In addition, the founders pledged their time to winemaking chores and staffingretail and marketing operations as part of the initial investment. This made MinnesotaWinegrowers Cooperative a mixed co-op that would be both producer-owned and worker-owned.
117
Also, wine is a fun or romantic-type product. “I thought I might want to someday buy a smallfarm outside the Twin Cities and join the co-op,” attorney Phil Erickson recalls.
Seeking Expertise. The attorney incorporated the grape growers under Minnesota and U.S.cooperative laws. The group then reached out for additional founding members and expertise.They succeeded in bringing in one of the most extraordinary plant breeders in the UpperMidwest, a farmer at nearby Star Prairie, Wisconsin. His experiments with crops, especially hisefforts to perfect a table grape for the Upper Midwest, caught the attention of the University ofMinnesota, and he was given a plant breeding research position with the university Departmentof Horticulture. The gifted plant breeder had no interest in wine or alcoholic beverages prior tohis recruitment into the co-op, but by his coming to the aid of fellow growers, the co-op membersand other grape growers in Minnesota and Wisconsin now have four unique grape varieties thatmake excellent wines, two more under development, and hybrid grapes which have been bred towithstand the harshness of Upper Midwest winters.6
The reach for expertise went downstream from grape genetics. As already mentioned, in thefirst year, the winemaking talents of a founder who was already operating a small winery wereused. That member worked with two other members and then turned winemaking chores over tothem in the second year. The lead winemaker at that point was a food scientist for General MillsInc., the multinational food company based in the Minneapolis suburb of Golden Valley. Hisunderstudy was the science teacher Partch. The latter took over lead responsibilities when thefood scientist was transferred to another General Mills location away from the Twin Cities. Thewinemakers became paid employees as well as members. The other original members donatedtime to help with bottling the wine and operating the retail store.
A Shift in Attitudes. The co-op is now moving into a second generation of members. Whilethe founding generation was primarily interested in creating a market to continue growing grapesand to provide an income stream to justify the expense of this hobby, the second generation isshowing business attitudes consistent with members’ goals in other NGCs. One member, wholives in a rural area near Stillwater, said she wants her small vineyard to become an importantincome source for her preferred country lifestyle. She has grown children, went back to completeuniversity studies, and began working in the retail shop at the winery. She liked the work and thepeople, so she started growing grapes to supply the winery. That led her to buying a membership.“The perfect career for a liberal arts education,” she said jokingly.
While the co-op is in a transition period with new members joining, fun and camaraderieexists with a bond of both financial and emotional investments in the cooperative “community.”A common bond of shared interests binds the members even though members’ reasons forbelonging are changing.
Demographics and Economic Development
The diverse collection of business, professional, and farm people in the MinnesotaWinegrowers Cooperative may not be unique, given changes occurring in rural America. It mightbe wise for community leaders to take a local census of who lives on the farmsteads and who
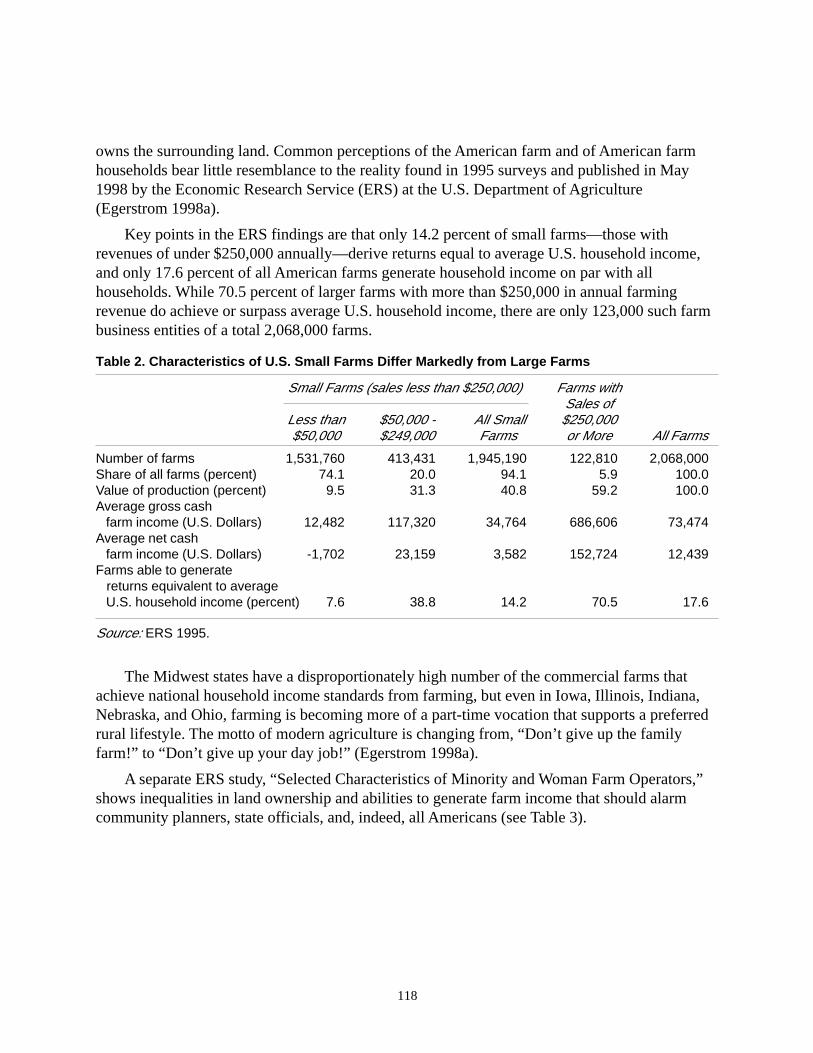
118
owns the surrounding land. Common perceptions of the American farm and of American farmhouseholds bear little resemblance to the reality found in 1995 surveys and published in May1998 by the Economic Research Service (ERS) at the U.S. Department of Agriculture(Egerstrom 1998a).
Key points in the ERS findings are that only 14.2 percent of small farms—those withrevenues of under $250,000 annually—derive returns equal to average U.S. household income,and only 17.6 percent of all American farms generate household income on par with allhouseholds. While 70.5 percent of larger farms with more than $250,000 in annual farmingrevenue do achieve or surpass average U.S. household income, there are only 123,000 such farmbusiness entities of a total 2,068,000 farms.
Table 2. Characteristics of U.S. Small Farms Differ Markedly from Large Farms
Small Farms (sales less than $250,000) Farms withSales of
Less than $50,000 - All Small $250,000$50,000 $249,000 Farms or More All Farms
Number of farms 1,531,760 413,431 1,945,190 122,810 2,068,000Share of all farms (percent) 74.1 20.0 94.1 5.9 100.0Value of production (percent) 9.5 31.3 40.8 59.2 100.0Average gross cash farm income (U.S. Dollars) 12,482 117,320 34,764 686,606 73,474Average net cash farm income (U.S. Dollars) -1,702 23,159 3,582 152,724 12,439Farms able to generate returns equivalent to average U.S. household income (percent) 7.6 38.8 14.2 70.5 17.6
Source: ERS 1995.
The Midwest states have a disproportionately high number of the commercial farms thatachieve national household income standards from farming, but even in Iowa, Illinois, Indiana,Nebraska, and Ohio, farming is becoming more of a part-time vocation that supports a preferredrural lifestyle. The motto of modern agriculture is changing from, “Don’t give up the familyfarm!” to “Don’t give up your day job!” (Egerstrom 1998a).
A separate ERS study, “Selected Characteristics of Minority and Woman Farm Operators,”shows inequalities in land ownership and abilities to generate farm income that should alarmcommunity planners, state officials, and, indeed, all Americans (see Table 3).
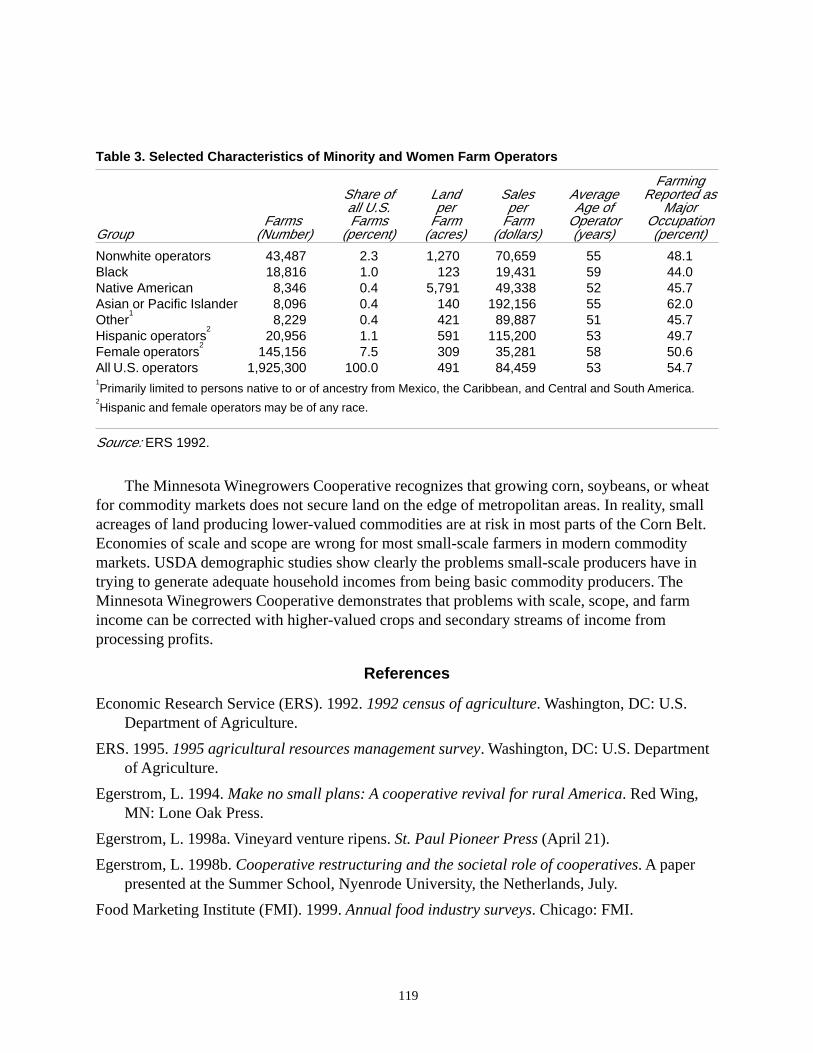
119
Table 3. Selected Characteristics of Minority and Women Farm Operators
FarmingShare of Land Sales Average Reported asall U.S. per per Age of Major
Farms Farms Farm Farm Operator OccupationGroup (Number) (percent) (acres) (dollars) (years) (percent)
Nonwhite operators 43,487 2.3 1,270 70,659 55 48.1Black 18,816 1.0 123 19,431 59 44.0Native American 8,346 0.4 5,791 49,338 52 45.7Asian or Pacific Islander 8,096 0.4 140 192,156 55 62.0Other
18,229 0.4 421 89,887 51 45.7
Hispanic operators2
20,956 1.1 591 115,200 53 49.7Female operators
2145,156 7.5 309 35,281 58 50.6
All U.S. operators 1,925,300 100.0 491 84,459 53 54.71Primarily limited to persons native to or of ancestry from Mexico, the Caribbean, and Central and South America.
2Hispanic and female operators may be of any race.
Source: ERS 1992.
The Minnesota Winegrowers Cooperative recognizes that growing corn, soybeans, or wheatfor commodity markets does not secure land on the edge of metropolitan areas. In reality, smallacreages of land producing lower-valued commodities are at risk in most parts of the Corn Belt.Economies of scale and scope are wrong for most small-scale farmers in modern commoditymarkets. USDA demographic studies show clearly the problems small-scale producers have intrying to generate adequate household incomes from being basic commodity producers. TheMinnesota Winegrowers Cooperative demonstrates that problems with scale, scope, and farmincome can be corrected with higher-valued crops and secondary streams of income fromprocessing profits.
References
Economic Research Service (ERS). 1992. 1992 census of agriculture. Washington, DC: U.S.Department of Agriculture.
ERS. 1995. 1995 agricultural resources management survey. Washington, DC: U.S. Departmentof Agriculture.
Egerstrom, L. 1994. Make no small plans: A cooperative revival for rural America. Red Wing,MN: Lone Oak Press.
Egerstrom, L. 1998a. Vineyard venture ripens. St. Paul Pioneer Press (April 21).
Egerstrom, L. 1998b. Cooperative restructuring and the societal role of cooperatives. A paperpresented at the Summer School, Nyenrode University, the Netherlands, July.
Food Marketing Institute (FMI). 1999. Annual food industry surveys. Chicago: FMI.
120
Hughes, D. 1996. A new look at countervailing power. Seizing control: The international marketpower of cooperatives, edited by L. Egerstrom, P. Bos, and G. van Dijk, 28-37. Red Wing,MN: Lone Oak Press.
National Restaurant Association. 1999. Away from home eating trends (Annual survey data,provided on request). Washington, DC: National Restaurant Association.
Northern Vineyards Winery. 1997. Brochure. Stillwater, MN: Northern Vineyards Winery.
Steinman, J. 1996, 1997, and 1998 editions. Beer Marketer’s Insights (trade newspaper),West Nyack, NY.
The Wine Institute. Various years. Annual wine consumption data provided on request.San Francisco: The Wine Institute.
Endnotes
1. The book explains that most co-ops were formed defensively to correct market problems rangingfrom market failures to market imperfections. It defines New Generation Cooperatives (NGCs) asoffensive business structures in which the cooperative society’s members seek to be players in marketsthat may be working well, but not for them. These members seek greater returns on their investment,knowledge, and labor by trying to capture more of the ultimate price of value-added products made fromcommodities originating on the members’ farms.
2. From interviews. As will be described later, the winemaker’s equipment was appraised and thenturned over to the co-op as this founding member’s initial investment.
3. The three sugar beet ventures that inspired NGCs in Minnesota and North Dakota are AmericanCrystal Sugar Co., Moorhead, Minnesota; Southern Minnesota Beet Sugar Co., Renville, Minnesota; andMinn-Dak Growers Association, Wahpeton, North Dakota.
4. This information is revealed in numerous research studies made public during the past three yearsby the National Restaurant Association, Washington, DC, and the Food Marketing Institute, Chicago, forbenefit of their associated members.
5. NGCs were given their name as a class or group of co-ops in 1994 in Egerstrom’s Make No SmallPlans. The name was selected to explain new co-ops then springing to life across Minnesota and NorthDakota. Slang names then in use to describe these ventures either wrongly implied existing co-ops did notdo value-added work for members, or they used terms that clashed with terms and concepts used indevelopmental economics. Definitions of NGCs and their differences from other cooperative structuresdrew heavily from the work of Dr. Michael Cook, the economist and cooperative business specialist at theUniversity of Missouri at Columbia, and other academic researchers.
6. The author does not pretend to be an expert on wine quality. Subjective references to NorthernVineyards Winery product quality, however, are based on reactions from Californians, Europeans, andJapanese whose judgment on wine are less circumspect.
121
Hard Choices:The Birth and Death of Ranchers’ Choice Cooperative
by David Carter
Introduction
As Clair Hull, the general manager, walked through the charred remains of the smallpacking plant in Colorado’s San Luis Valley in June 1997, the rubble seemed to symbolize thehopes and dreams of more than 100 limited resource ranchers. Only seven months earlier, rabbisand ranchers had joined to celebrate the grand opening of a new certified kosher beef processingco-op located in the heart of a hardscrabble valley dominated by small, Hispanic-owned ranches.Now, the last glimmer of hope for the survival of the struggling project had gone up in the smokeof an electrical fire that destroyed much of the co-op packing plant.
Ranchers’ Choice Cooperative was born out of the dreams and hard work of a small band ofthe valley’s ranchers. It rode a crest of optimism and enthusiasm over a two-year period beforecrashing into the harsh economic realities of an undercapitalized business with inexperiencedmanagement attempting to compete in a complex marketplace.
New Hope for a Depressed Region
The seeds for the Ranchers’ Choice Cooperative were sewn in February 1994 when RockyMountain Farmers Union (RMFU) conducted a community forum among a small group ofagricultural producers in the San Luis Valley. Persistent low commodity prices and the steadyerosion of competitive cattle markets frustrated ranchers across Colorado; however, the southernSan Luis Valley producers who attended the February meeting were particularly vulnerable to thevagaries of the livestock marketplace.
Conejos and Costilla Counties in the southern San Luis Valley are among the poorest regionsin the western United States. In 1992, per capita incomes in and Conejos and Costilla Countieswere $13,070 and $10,043 respectively, compared to $22,293 statewide (U.S. Department ofCommerce 1999).
More than 77 percent of the 637 ranches and farms in Conejos and Costilla Countiesmarketed less than $50,000 in products in 1992. The average per-farm net cash returns were$10,419 in the two counties in 1992, compared to a statewide average of $18,994 per farm (U.S.Census of Agriculture 1992).
Making a living was difficult in the southern San Luis Valley even during the best of times,despite the fact that families of many ranchers at the meeting could trace their ancestry in theregion back nearly 300 years. Descendants of Spanish settlers in the 1600s dominate manycommunities in the San Luis Valley. Residents of other communities descended from a band ofMormon missionaries sent to the valley by Brigham Young in the mid-1800s. The valley’sgeographic isolation, and its distance from major markets in Denver and Santa Fe severely
122
hamper the economics of agriculture, but the ranchers at the meeting also noted that thevalley’s unique climate and culture offer potential marketing opportunities.
Located on the border of Colorado and New Mexico, the San Luis Valley is a uniqueagricultural region larger than the state of Massachusetts. The 7,000-foot valley floor is rimmedby 14,000-foot mountains, creating a basin that traps sub-zero temperatures throughout much ofthe winter. The valley receives an average of nine inches of precipitation annually and isconsidered the nation’s leading solar basin, in which the sun shines an average of 340 days peryear.
A series of underground cross faults divide the basin into a northern and southern sections.The cross faulting in the northern basin created a closed basin aquifer which is rechargedannually from the snow melt in the surrounding Sangre de Cristo and San Juan Mountains(Emery 1979). Artesian water from the closed basin produces a cornucopia of barley, potatoes,spinach, alfalfa, and other crops. South of the major fault lines, neat circles of pivot-irrigatedfields give way to the rocky pastures and small alfalfa fields of Conejos and Costilla Counties.
Organic Opportunities
The high altitude, arid climate, and frigid winter temperatures limit the insect and weedpopulations. This has fostered the growth of organic production throughout the valley (Carter 1994,1).
Cultural and economic factors contributed to a history of de facto organic production inmany parts of the valley. Many of the Hispanic livestock producers in Conejos and CostillaCounties are descendants of families who first settled in the valley. These producers adhere totraditional practices of the Hispanic and pastoral cultures (Varela 1995). Many ranchers haveshunned growth hormones and low-level antibiotics simply because they cannot afford theinputs.
Olive and Demetrio Valdez, two ranchers at the meeting, enthusiastically grasped the idea ofcreating a program to process and market high-quality organic beef. Olive and other ranchers atthe meeting immediately decided to investigate the potential for developing such a marketingprogram. At a follow-up RMFU meeting, Olive, Demetrio and five other producers agreed toserve as a steering committee for the project.
Their initial investigation continued for nearly a year. Although the demand for organicproducts was increasing, beef producers were hampered by a lack of logical, consistentcertification standards. No federal standards had been developed for beef, and regional organiccertification groups lacked consensus on the requirements for certified beef products.
Kosher Processing Considered
Meanwhile, RMFU hosted the Israeli Minister of Agriculture on an agricultural tour in theregion. As part of that tour, RMFU arranged for a bison to be kosher slaughtered and delivered toIsrael as a goodwill gesture. Clair Hull, then working as a field representative for RMFU, jokedwith the San Luis Valley producers afterward that perhaps they should develop a kosher-
123
processing project. The Valdezes responded that the idea of kosher processing wasn’t soludicrous. Perhaps, just perhaps, the steering committee should investigate this aspect of meatprocessing.
Hull began to explore kosher certification for the steering committee. Star K KosherCertification Agency near Baltimore, Maryland, agreed to send a rabbi to demonstrate ritualslaughter, but only if the steering committee agreed to organize a community meeting inconjunction with the demonstration. On March 17, 1996, Rabbi Meyer Kurchfeld of Star KCertification brought kosher processing to the San Luis Valley.
It was a unique scene: An orthodox Rabbi standing beneath the Bingo board in the Knightsof Columbus Hall in LaJara, Colorado, as more than 60 Catholic, Mormon, and Protestantranchers listened intently to the philosophy of ritual slaughter. Ranchers emerged from thatsession enthusiastic about the prospects of building a co-op business relationship with the Jewishcommunity. After all, many aspects of kosher slaughter mirrored the process that small-scaleHispanic ranchers had historically used to process beef and lamb. Later, some of the ranchersdiscovered that the similarities were attributable in part to the fact that some early Spanishsettlers in the San Luis Valley were Jewish families fleeing from the Inquisition.
The owner of the small processing facility, in the nearby community of Sanford, where thedemonstration was conducted, indicated a willingness to sell his processing plant to acooperative of ranchers. The ranchers were immediately interested because the small plant wasthe only U.S. Department of Agriculture (USDA) inspected facility still operating in the valley.
Scarce Funding
Funding to examine the feasibility of such a project, however, was scarce. RMFU’sCooperative Development Center allocated $25,000 of in-kind resources toward the project,mainly in the form of Hull’s time and travel expenses. The Cooperative Development Centersuccessfully secured a $5,000 grant from Willie Nelson’s FarmAid and a $12,000 grant from theColorado Department of Agriculture. The FarmAid grant was restricted to directly assistproducer involvement in the project, and the Department of Agriculture funds were dedicated toassessing the project’s feasibility. A special account was established within the CooperativeDevelopment Center to administer the funds (Ranchers’ Choice Cooperative OfferingPresentation 1996).
The Cooperative Development Center also helped the steering committee develop amembership subscription agreement through which producers would pay a one-time membershipfee of $125. Producers were also allowed to meet the membership requirement through the valueof donated steers and lambs to be utilized in a series of test-slaughters (Ranchers’ ChoiceUniform Membership and Marketing Agreement 1996).
Members of the steering committee, assisted by Hull, actively began to recruit membersfrom throughout the valley to participate in the project. The steering committee was meeting atleast every other week to review the status and progress of the project and some dissension beganto set in. The Valdezes specialized in raising Blonde Aquitine cattle, a breed noted for extremely
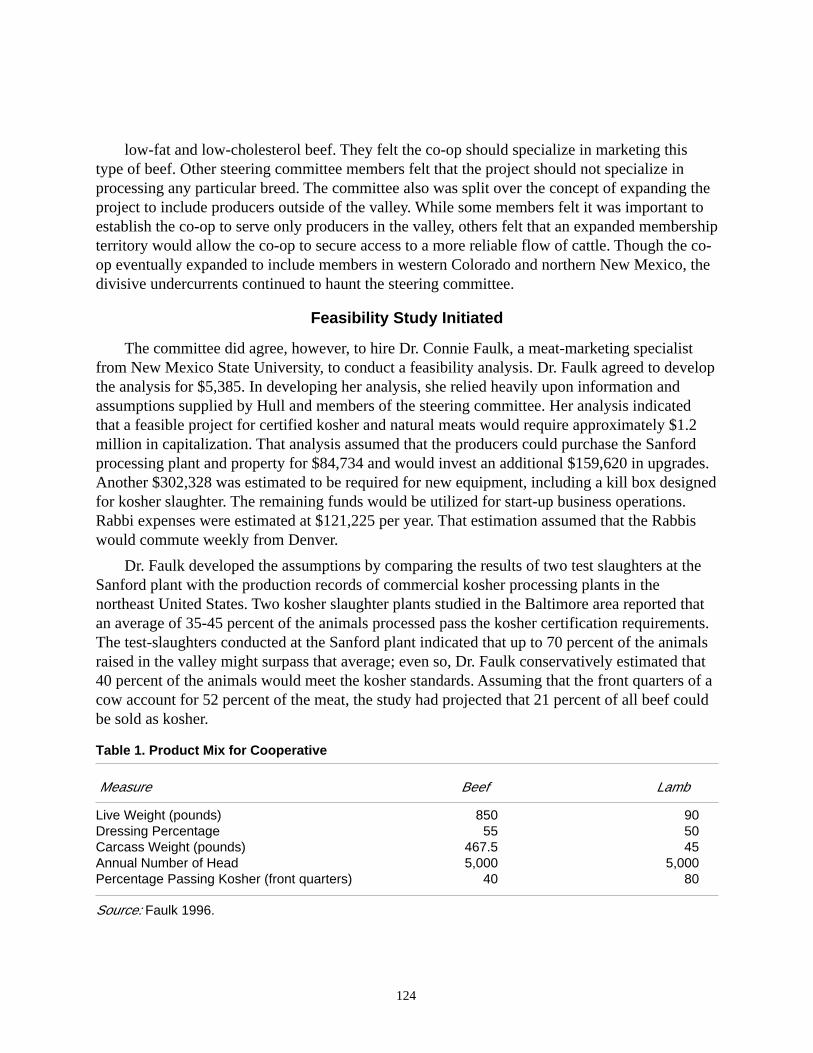
124
low-fat and low-cholesterol beef. They felt the co-op should specialize in marketing thistype of beef. Other steering committee members felt that the project should not specialize inprocessing any particular breed. The committee also was split over the concept of expanding theproject to include producers outside of the valley. While some members felt it was important toestablish the co-op to serve only producers in the valley, others felt that an expanded membershipterritory would allow the co-op to secure access to a more reliable flow of cattle. Though the co-op eventually expanded to include members in western Colorado and northern New Mexico, thedivisive undercurrents continued to haunt the steering committee.
Feasibility Study Initiated
The committee did agree, however, to hire Dr. Connie Faulk, a meat-marketing specialistfrom New Mexico State University, to conduct a feasibility analysis. Dr. Faulk agreed to developthe analysis for $5,385. In developing her analysis, she relied heavily upon information andassumptions supplied by Hull and members of the steering committee. Her analysis indicatedthat a feasible project for certified kosher and natural meats would require approximately $1.2million in capitalization. That analysis assumed that the producers could purchase the Sanfordprocessing plant and property for $84,734 and would invest an additional $159,620 in upgrades.Another $302,328 was estimated to be required for new equipment, including a kill box designedfor kosher slaughter. The remaining funds would be utilized for start-up business operations.Rabbi expenses were estimated at $121,225 per year. That estimation assumed that the Rabbiswould commute weekly from Denver.
Dr. Faulk developed the assumptions by comparing the results of two test slaughters at theSanford plant with the production records of commercial kosher processing plants in thenortheast United States. Two kosher slaughter plants studied in the Baltimore area reported thatan average of 35-45 percent of the animals processed pass the kosher certification requirements.The test-slaughters conducted at the Sanford plant indicated that up to 70 percent of the animalsraised in the valley might surpass that average; even so, Dr. Faulk conservatively estimated that40 percent of the animals would meet the kosher standards. Assuming that the front quarters of acow account for 52 percent of the meat, the study had projected that 21 percent of all beef couldbe sold as kosher.
Table 1. Product Mix for Cooperative
Measure Beef Lamb
Live Weight (pounds) 850 90Dressing Percentage 55 50Carcass Weight (pounds) 467.5 45Annual Number of Head 5,000 5,000Percentage Passing Kosher (front quarters) 40 80
Source: Faulk 1996.
125
She based the feasibility analysis on lightweight beef animals because of the absence offeedlot capacity in the valley. The co-op steering committee had intended to focus uponmarketing natural grass-fed beef.
She also utilized information provided by Hull regarding indications of interest frompotential kosher markets on the East and West coasts in her final feasibility report. The studyassumed that 50 percent of the kosher meats would be marketed in the Los Angeles region. TheSanta Fe and Denver markets were assumed to account for another 20 percent. The remainingkosher products were targeted toward outlets in Seattle, Dallas, and Atlanta. The nonkoshernatural meats were targeted for markets in the Denver and Santa Fe regions (Faulk 1996).
Promising Trends
Consumer trends in the kosher marketplace seemed promising at first glance. Faulk reportedthat, although an estimated 21,000 kosher food products are available in the marketplace, lessthan one-third of that market is influenced by traditional Jewish consumers in the 1990s.Muslims and Seventh-Day Adventists, along with nonreligious consumers concerned about foodhealth and safety, have contributed to the growth in demand for kosher products (Regenstein andRegenstein 1992).
The $2 billion kosher food market grew 2 percent in 1994 alone (Levine 1995), butinformation was scarce concerning the role that meat products played in the overall demand forkosher food. The steering committee requested funding from both the National Beef PromotionBoard and the Colorado Beef Board in 1995 to conduct research into demand trends for koshermeat (Carter 1995). The funding requests were denied on the basis that the exploration of kosherconsumption trends as a focus was deemed to be too narrow to warrant support from the beefcheck-off programs.
Kosher processing, per se, complicated the marketing analysis. Organizers of the Ranchers’Choice Cooperative had determined that the co-op would process its meat products inaccordance with Glatt rules that are very stringent for every step of the slaughter and processingprocedure. The committee’s decision was grounded upon Star K’s recommendation.
All animals intended for Glatt certification must be ritually slaughtered by a trained shocet.Any lesion, rip, broken bone, illness, puncture, or defect usually renders the animal treiff(nonkosher). Although some defects may be visible while the animal is alive, others requirevisual examination of internal organs to be sure that they are free of any defects and diseases thatcould render the animal nonkosher.
Glatt means smooth and refers to the lungs of the animal during inspection. The inspectors,or bodeks, examine certain organs of each animal, especially the lungs, for adhesions or otherdefects. The meat can still qualify as Glatt if the defects are removable, there are no more thantwo defects, and the lung is still inflatable. Otherwise, the meat is rendered treiff (Regenstein andRegenstein, 1988). Only front quarters of the animal qualify as kosher in the United States. Meatbelow the twelfth rib is not considered kosher, and all blood vessels visible in the front quartersmust be removed (Regenstein and Regenstein 1979).
126
Kosher meat must be soaked and salted within 72 hours of slaughter. Kosher meat must behosed down if it is not frozen or not koshered within 72 hours. The high moisture level isintended to prevent any blood from drying. The final step of koshering includes soaking the meatfor half an hour then covering it with course salt for an hour. The meat is then rinsed well withcold water to remove the blood (Regenstein and Regenstein 1979).
Dissension Increases
Dissension began to intensify among some members of the steering committee as the projectmoved toward an equity drive. Olive Valdez, whose vision and determination initially sparkedthe project, chaffed as new producers brought ideas and opinions to the project. In addition, Hullhad long since ceased to act as an impartial advisor and was devoting most of his time to theproject when some members of the steering committee approached him about assuming theformal role of manager of the envisioned co-op.
The steering committee agreed that the results of the feasibility analysis indicated anopportunity to develop a successful cooperative. With the assistance of RMFU’s legal counsel,Chuck Holum, a prospectus and marketing agreement were developed for the cooperative. InMarch 1996, the steering committee formally chartered Ranchers’ Choice Cooperative as aSubchapter T co-op and organized themselves formally as the initial board of directors.
The board utilized the feasibility study projection of $1.2 million in capitalization, with halfto be raised as equity from among ranchers. In April 1996, the new board of directors launched acampaign to sell the 1,500 shares of stock necessary to generate the $600,000 in producer equityto launch the project. The stock was priced at $400 per share, with a minimum of five sharesrequired per investor. Every producer investing in the plant also signed an enforceable marketingagreement with the co-op. That agreement committed the producer to deliver 5 cattle, 15 sheep,or 3 bison to the co-op for each share of stock owned. The marketing agreement specified thatproducers would receive $.15 per pound premium on any animals qualifying as kosher, and a$.05 per pound premium on animals satisfying natural standards (Ranchers’ Choice UniformMembership and Marketing Agreement 1996).
Equity Drive Lags
The enthusiasm producers expressed toward the co-op did not translate into capitalinvestment. Soon, the equity drive stumbled because many producers simply could not afford theminimum investment.
The steering committee approached several lenders about developing a program to financeproducers’ investments in the co-op, but the lenders shied away from the concept. By the end ofJune, less than $200,000 had been secured from producers.
Project organizers had already limited their opportunity to an exit strategy by that time. Theowner of the meat processing facility had threatened to find another buyer for his plant if theco-op did not act soon. Feeling pressured, the co-op signed a binding contract to purchase the
127
plant by mid-August. In addition, Hull had terminated his employment with RMFU in order toaccept the position of general manager of the Ranchers’ Choice Cooperative in early summer.
Positive media coverage fed the euphoria of project leaders, even as financial commitmentfrom producers failed to keep pace. CoBank agreed to provide the co-op with a financingpackage totaling $400,000. With that financing in place, the co-op moved to close its purchase ofthe Sanford meat plant.
Still, the equity drive was floundering. The deadline, which was originally set for June 30,was extended to July 31, and then to August 31. By the time project organizers finally closed theequity drive in October, only $320,000 had been generated from ranchers. Combined withborrowed funds from CoBank, the co-op launched operations with roughly half of the originallyprojected capital.
Problems plagued the business from the start. The actual slaughtering was delayed for morethan a month because of problems in remodeling the processing facility to handle therequirements of kosher certification. Expenses, however, started to pile up from day one. Still,optimism prevailed on November 14, 1996, as three rabbis joined about 100 local ranchers topreside over a grand opening and ribbon cutting ceremony at the Ranchers’ Choice Cooperativemeat processing facility.
Start-Up Woes
The facility’s aged equipment suffered frequent breakdowns as the new owners began toaccelerate the pace of processing. Construction of a new carcass cooling room fell behindschedule and was overbudget. Because of the geographic and cultural isolation of the valley,rabbis working for Star K were unwilling to relocate from the East Coast until the plant haddeveloped a proven track record. This saddled the co-op with high travel and lodging expenses toaccommodate the kosher processing.
Hull’s inexperience in the meat processing business created a steep learning curve during thestart-up phase. Also, several markets that had indicated a willingness to carry the co-op’sproducts failed to materialize as anticipated.
Less than two months after the grand opening, dissension among board members about theplant’s management was growing. Clear data about profitability was not available, meat yieldswere questioned, and construction of the new coolers lagged behind schedule. The co-op ended1996 with a net loss of $225,409 (Ranchers’ Choice 1996 Annual Report 1997).
By January 1997, several board members wanted to dismiss the manager. Other boardmembers advised a more patient approach. CoBank, meanwhile, signaled that a change inmanagement might jeopardize the status of the co-op’s loan package (Faulk 1998).
The co-op rapidly chewed through its working capital. By early 1997, the co-op was alreadydelinquent in paying ranchers for livestock delivered to the facility. The economic stressconfronting the co-op compounded the dissension inside the boardroom. Several board membersbegan to question Hull’s ability to manage the co-op and started to look for a new manager. By
128
early February, disagreement over management came to a head. The board members wishingto oust the manager lost the vote and resigned.
Kosher Economics
The economics of kosher processing turned against the co-op as well. The summer of 1996had been extremely dry in the San Luis Valley. Large numbers of animals suffered lung problemsbecause of the dust and drought. By early April 1997, only 19 percent of the meat produced bythe Ranchers’ Choice Cooperative qualified as kosher (Faulk 1998).
The kosher markets gradually developed but were often slow in paying for products. TheRanchers’ Choice Cooperative had developed a strong relationship with a small chain of naturalfood stores, which provided a profitable outlet for some of their natural meats. Two large grocerychains were also stocking a limited selection of Ranchers’ Choice Cooperative natural meats butpaid the cooperative no premium for the product over their conventional suppliers. Thesemarkets all sought the “primal” cuts of quality steaks. Demand for roasts and hamburger meatwas much slower. Consequently, the co-op began to stockpile a backlog of muscle meats andhamburger in a cold storage facility. This added yet another expense to the co-op’s growing pileof debts.
Acting upon the advice of the lender, the co-op began delaying payment for livestock to 45days from delivery. An angry room of ranchers thus gathered for the co-op’s annual meeting onApril 4, 1997. Hull and Board Chairman Lawrence Gallegos reviewed the co-op’s difficultieswith the members. Hull also discussed the co-op’s marketing efforts. Though no audit wasavailable for review by the members, the co-op’s accountant discussed some of the financialdetails of the business operation.
Board leaders asked members to have patience and to support the cooperative during thisdifficult period. The RMFU Cooperative Development Center stepped forward with a $5,000contribution to assist Ranchers’ Choice Cooperative in developing marketing materials for itsproducts. Ranchers voiced a willingness to pledge additional funds to help Ranchers’ Choice. Bythe time the meeting adjourned, the co-op had received roughly $90,000 in pledges.
The Last Gasp
The renewed spark quickly fizzled. The excitement emerging from the annual meetingprompted the co-op to increase its processing pace, but markets for the product failed tomaterialize. Less than $9,000 of the money pledged by members at the annual meeting wasultimately received by the co-op.
By early May, CoBank and the local lenders began talking about pulling the plug on theco-op. The IRS was contacting Ranchers’ Choice Cooperative about nonpayment of employeepayroll taxes, and, the USDA was questioning management about the failure to pay ranchers foranimals delivered to the plant. As the financial pressures mounted, Hull was forced to take timeaway from his marketing efforts to stave off creditors. The co-op’s collapse seemed inevitable.
129
The Colorado Department of Agriculture and the USDA’s Packers and StockyardsAdministration intervened to assure payment to producers for the animals they had delivered.The agencies informed Ranchers’ Choice Cooperative that $27,000 must be paid to producers byJune 30, with an additional $200,000 owed to producers to be paid shortly thereafter. Accountspayable to suppliers had mounted to $150,000, and $17,000 was owed to the Internal RevenueService for delinquent payroll taxes.
The end came on May 27, when an electrical short in the plant’s ancient wiring systemstarted a fire in the ceiling above the processing floor. Though the fire started while a full crewwas working on the kill floor, the flames quickly grew out of control. Before the local firedepartment could extinguish the blaze, the fire had destroyed the kill floor and damaged much ofthe processing area.
The Ranchers’ Choice Cooperative was out of business.
The board talked initially about utilizing insurance proceeds to rebuild the plant and restartthe operation. Many member ranchers wanted the co-op to use the proceeds to pay them for thelivestock previously delivered to the plant, but the lenders had first call on that money.
Hull worked briefly to try and reorganize the co-op but soon left to accept a position asmarketing director for the Denver Buffalo Company. Gallegos and a handful of remaining boardmembers continued to sort through the problems of the future for Ranchers’ Choice Cooperative.They still believed that a small specialty meat co-op could operate profitably in the San LuisValley.
Reorganization Attempts
RMFU intervened once again in late 1997 to assist the board in negotiating a write-downagreement with CoBank. RMFU agreed to guarantee an arrangement in which the Ranchers’Choice Cooperative board would secure funds to pay off the loan at the write-down value. Theboard’s inability to generate the needed capital by the required deadline ultimately transferredownership of the facility to RMFU. An investor group sanctioned by the co-op board formallypurchased the plant in February 1999. Reconstruction of the facility is now underway. A smallcore of ranchers continues to pursue the dream of restarting the co-op. Three former membershave filed liens against the remaining assets. Most of the members, though, have abandoned theidea of kosher processing and have surrendered any hope of receiving the money they are owedfor the animals they delivered to the co-op.
The new owners are exploring opportunities for small-scale processing and marketing ofcertified organic meat. New feasibility work is underway.
The dream of Ranchers’ Choice Cooperative, as a promise for the future for more than 100limited resource San Luis Valley growers, has largely faded into the lore of the San Luis Valley.
130
Conclusions and Summary
The brief history of Ranchers’ Choice Cooperative illustrates the dangers of substitutingenthusiasm for experience in co-op development. The project was plagued at the outset by theclash of individual agendas among members of the steering committee. One leader in the projectwanted to promote the marketing of a specific breed of cattle. Other members of the committeewanted to include all breeds but desired to limit participation to the limited resource producers inthe southern San Luis Valley. Still other members advocated expanding the field of membershipto include larger producers and ranchers in other regions.
As in many limited resource communities, the initial civility among steering committeemembers masked an inability to constructively resolve conflict. Thus, differences simmered untilthey boiled over at a critical juncture of the co-op.
Marketing projections for the co-op proved to be extremely over optimistic. During theexploratory phase, several marketing outlets in Los Angeles had expressed an interest inconsidering stocking kosher meat from Colorado. Few of those markets actually stocked productwhen the co-op began operation.
Undercapitalization and inexperienced management were critical weak links in thecooperative. Organizers launched the equity drive with the goal of securing the $600,000 inproducer investment as was recommended in the feasibility analysis. As efforts fell short of thatgoal, the project organizers scaled back their goal to meet actual performance. In committingearly on to purchase the Sanford facility and to hire Hull as manager, the co-op organizers hadeliminated their capacity to develop an exit strategy. As the equity drive failed to generate theneeded capital, the co-op board felt compelled to continue moving forward.
The lack of experienced management hampered the new business’s ability to analyze criticalproduction data and to recommend effective mid-course corrections. The lack of reliablefinancial records also kept the co-op board “in the dark” about critical yield data, cost of sales,rabbi expenses, and other information; and the lack of operating capital hampered the co-op’sability to weather the inevitable unforeseen obstacles that arise in the start-up of a newenterprise.
The Ranchers’ Choice Cooperative experience provided important information regarding thechallenges of New Generation Cooperative development in limited resource communities.Additional efforts invested in upfront analysis may spare organizers the pain of failing to meetoverly optimistic assumptions. Market analysis must be sophisticated and thorough in order toavoid the “build it and they will come” syndrome.
Ultimately, start-up projects in limited resource communities have little margin for error.Additional months invested in the analysis of a project may pay important dividends in theultimate survival and success of a business.
131
Bibliography
Carter, Dave. 1994. Concept Paper for San Luis Valley Organic Beef Marketing Project.
Carter, Dave. 1995. Proposal to Assess Market Demand Trends for Certified Kosher-ProcessedBeef Products. Proposal presented to Beef Promotion and Research Board.
Emery, Philip A. 1979, December. Geology of the San Luis Valley, Colorado, USA: TheHydrology of Areas of Low Precipitation. Proceedings of the Canberra Symposium.
Faulk, Constance. 1996. Feasibility Study for the Ranchers’ Choice Cooperative. Las Cruces:New Mexico State University.
Faulk, Constance. 1998. Ranchers’ Choice: A Case Study in the Natural Meat Market. LasCruces: New Mexico State University.
Joshua Levine 1995. You don’t have to be Jewish . . . . Forbes Magazine (April 24):154-156.
Ranchers’ Choice Cooperative Subscription Agreement. 1996.
Ranchers’ Choice Cooperative Offering Presentation. 1996.
Ranchers’ Choice Uniform Membership and Marketing Agreement. 1996.
Ranchers’ Choice 1996 Annual Report. 1997. 1st Annual Shareholders Meeting, April 4 1997.
Regenstein, Joe M., and Carrie E. Regenstein. 1992. The Kosher Food Market in the 1990’s—ALegal View. Food Technology (October) 46 (6): 122-126.
Regenstein, Joe M., and Carrie E. Regenstein. 1988. The Kosher Dietary Laws and TheirImplementation in the Food Industry. Food Technology (June) 42 (6): 86-94.
Regenstein, Joe M., and Carrie E. Regenstein. 1979. An Introduction to the Kosher Dietary Lawsfor Food Scientists and Food Processors. Food Technology (January) 33 (1): 89-99.
U.S. Department of Commerce. 1999. Regional Economic Information System: 1969-1997 onCD-ROM [machine-readable data files] Washington: The Bureau of Economic Analysis[producer and distributor] (May).
U. S. Census of Agriculture. 1992. National Agricultural Statistics Service, U.S. Department ofAgriculture. Available online: <www.nass.usda.gov/census/census92/atlas92/datafile/>
U.S. Department of Agriculture. 1998, December. The Status of U.S. Agriculture. U.S.Department of Agriculture, Commission on 21st Century Production Agriculture.
Varela, Maria. 1995. Concept Paper for San Luis Valley Organic Beef Marketing Project.

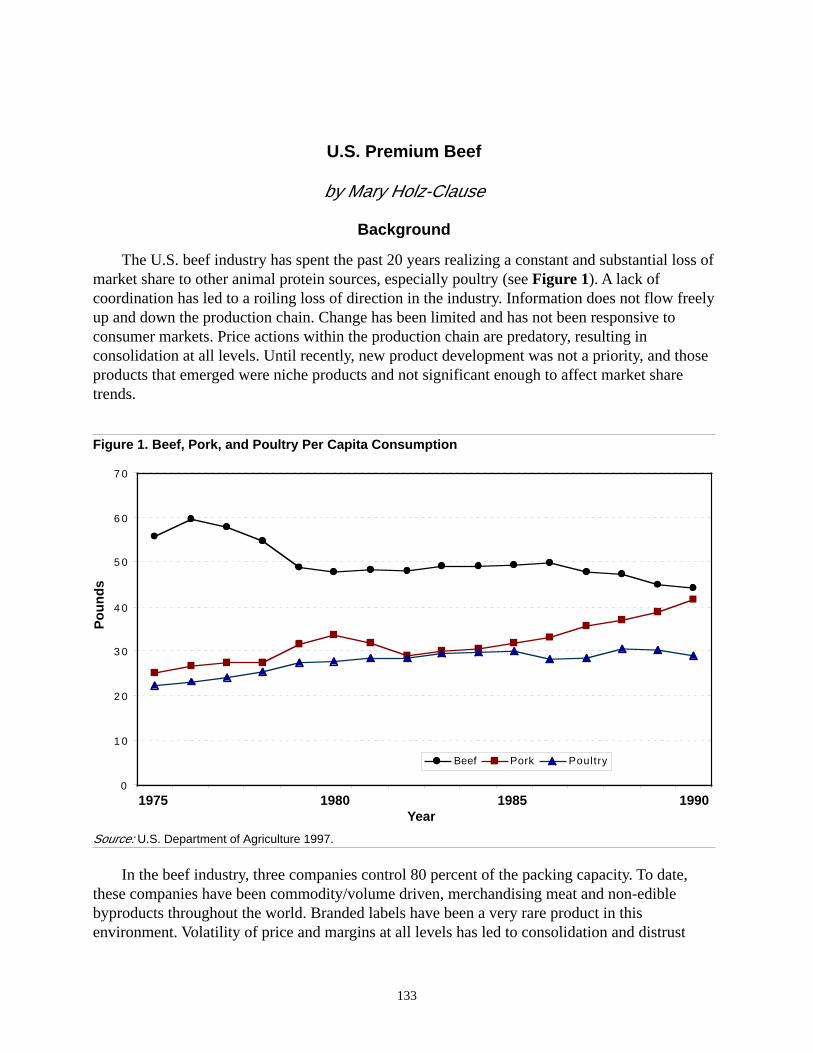
133
U.S. Premium Beef
by Mary Holz-Clause
Background
The U.S. beef industry has spent the past 20 years realizing a constant and substantial loss ofmarket share to other animal protein sources, especially poultry (see Figure 1). A lack ofcoordination has led to a roiling loss of direction in the industry. Information does not flow freelyup and down the production chain. Change has been limited and has not been responsive toconsumer markets. Price actions within the production chain are predatory, resulting inconsolidation at all levels. Until recently, new product development was not a priority, and thoseproducts that emerged were niche products and not significant enough to affect market sharetrends.
Figure 1. Beef, Pork, and Poultry Per Capita Consumption
Source: U.S. Department of Agriculture 1997.
In the beef industry, three companies control 80 percent of the packing capacity. To date,these companies have been commodity/volume driven, merchandising meat and non-ediblebyproducts throughout the world. Branded labels have been a very rare product in thisenvironment. Volatility of price and margins at all levels has led to consolidation and distrust
0
1 0
2 0
3 0
4 0
5 0
6 0
7 0
Beef Pork Poultry
1975 1980 1985 1990Year
Po
un
ds
134
along the production chain. Other competing industries, such as poultry, have integratedfunctions to enhance information flow and responsiveness to consumer markets. They have usedthe information to improve system efficiency at all levels, allowing cost to drop and volume toincrease while maintaining margin.
The beef industry is harder to integrate because of its huge land and capital needs andbecause of the types of individuals that dominate it. Nearly one million beef producers breed 80different kinds of cattle and send them to several hundred feedlots. The only thing ranchers andfeeders have in common is a distrust for the packers, who often pay the same price for superiorcattle as they do for the lower-quality kind (Conlin 1999, 76).
Many producers have reached a level of frustration, however, that makes them amenable tochange. The industry is vast, and the products are popular. Even with the erosion of market share,beef and kindred products remain dominant in overall value for all agriculture. The industry hasproven tough, emerging from two decades of health and safety scares and massive sophisticatedcompetition to remain the largest protein industry segment.
How Cattle Are Sold
Throughout the first 60 years of the century, live cattle were delivered to terminal marketssuch as Chicago. Large commission firms at these locations handled the selling of the cattle to apacking company. This trade was on a price per hundredweight negotiated on the day of sale.
In 1960, a start-up company called Iowa Beef Processors (IBP) revolutionized the processby moving beef packing to the areas where the cattle were finished and breaking the carcassesinto smaller cuts that fit into boxes. This approach cut freight costs, reduced the overhead ofstockyard space, and improved some quality factors. IBP also put buyers in cars with two-wayradios, eliminating the commission person from the selling process. The industry as a wholequickly followed suit and the central stockyards eventually disappeared.
In 1999, the majority of live cattle are sold on the cash market directly to a packingcompany. There is no middle person in this transaction, and the ownership of the cattle movescompletely from the feeding entity to the packing entity. The majority of these transactions arebased on only two factors: (1) the live weight of the animal minus a calculated shrink, usuallyfour percent (the buyer takes quality into the bid consideration to a certain degree); and (2) thenegotiated price per hundredweight—for example, a 1,250 pound steer minus 4 percent shrinktimes the live market price per hundredweight equals the amount paid to the feeder. This isknown as selling live.
The second most common method of selling is to use a negotiated price for the hot carcassweight of the animal. This selling method places with the feeder the risk of the percent of theanimal that actually ends up in a usable carcass (yield) at the packing plant. That risk can usuallygarner an extra return to the feeder unless the animals or his or her methods fall below averageexpectations. This method is known as selling “in the meat.”
Another method used with a significant percentage of the total cattle marketed is the grid orformula pricing method. This method uses a grid matrix of several value factors that represents
135
premiums and discounts depending on how the animal dresses out in the packing plant. Thesefactors include dressing percentage, lean meat cutability score, quality grade, fitting within theideal weight range for the carcass, and other factors that might make the carcass fall outsidedesirable specifications for the packer. The grid matrix is built around a base price that is usuallythe “in the meat” price previously described. The actual cost of the animal is reconstructed orformulated on an individual basis according to how it performed in each of the categories.
Grid or formula pricing places the risk on the feeder. Animals will be discounted forrealizing poor carcass specifications; however, the upside to this is if the cattle do perform abovethe average or norm. This method is an intermediate step toward value-based marketing. Theultimate extension into value-based pricing would be to take the various cuts of meat from theanimals to their final sale and add those values backward to reconstruct the live value of theanimal.
In a fully integrated system, the owners would have little interest in the live value of theanimal because the margins to that business would be derived throughout the system and notthrough transactions at segmented points of sale. The beef industry has not achieved suchintegration, nor is it likely to happen very soon; however, the need for better system efficiency isdriving change.
The lack of coordination or integration has meant information does not flow up or down theproduction/processing/marketing chain. Thus, market signals relative to quality factors or evensupply are very poor. Furthermore, although the free market has worked efficiently over a long-term cyclical pattern, it has created the undue volatility and dislocation in the short run thatarguably has led to consolidation. Remarkably, consolidation has not automatically led to bettercoordination of supply or quality. The lack of information or coordination has meant the supplychain is not responsive to end markets; therefore, a long-term loss of market share has occurred.
Significant numbers of cattle producers are trying to improve the long-term outlook for theirindustry. They almost universally understand that certain changes to marketing resulting ingreater profitability will also result in a positive change to the industry’s competitiveness. It wasin this context that U.S. Premium Beef was born.
Beginnings
U.S. Premium Beef (USPB) is deeply rooted in the cow-calf segment of the beef industry.USPB founders believed that working together and sharing information in a coordinated systemcould help them compete against others in the meat industry. “We could see that our industryneeded to change in order to survive,” said Steve Hunt, one of the four Kansas cattlemen whostarted USPB and who is now the company’s chief executive officer. “We had focused so muchenergy on competing with each other, we had taken our eye off of the ball” (Gilmore 1999, 22).
Teaming with Hunt, a fourth-generation cattleman from Arkansas City with work experiencein commercial banking and finance, were Terry Nelson, a commercial cow-calf producer,backgrounder, and cattle feeder from Long Island; Doug Laue, a custom backgrounder and cattlefeeder from Council Grove; and Terry Ryan, a commercial cattle feeder from Scott City.
136
The group had collectively and individually tried to determine how to get more value fromtheir animals. They first met in November 1995 to discuss the concept of forming a business.The group studied business structures and several successful agricultural co-ops, includingSunkist Oranges and Blue Diamond Almonds.
As the group continued its study, they decided if producers were to be committed toconsumer-oriented beef, they also had to be committed to ownership in the structure. Thus, theyproposed a marketing co-op in which members would be required to capitalize the co-op up-frontrather than through earnings (Smith 1998, 9).
Thus, USPB was established on July 1, 1996. The producer-owned business elected a six-member board of directors, representing all the beef industry segments. The board membershipwas later increased to seven members.
The Mission
To increase the quality of beef and long-term profitability of cattle producers bycreating a fully integrated producer-owned beef processing system that is a globalsupplier of high quality value-added beef products responsive to consumer desires.
In early September 1996, the board members held meetings with livestock associations andmedia organizations to explain their concept of the information-based organization, which wouldprovide feedback to the producers so that they could make changes desired by consumers in themarketplace. Five meetings were held with producers in Kansas. The road show was also takento California, Colorado, Iowa, Missouri, Nebraska, Oklahoma, and South Dakota.
According to Hunt (Suther 1996, 68),
As producers, we have watched ourselves selling on a commodity basis, allreceiving a similar price, no matter the quality of our product. Yet we hear consumerssay they are not totally satisfied with the product. It seems like the signal hasn’t beentransferred through the market, from consumer, to retailer, to purveyor, to processor,back to the producer, who could really make the difference.
Hunt indicated that through the co-op, members would obtain the 15-20 percent profit theprocessors currently get, and producers could impact quality sooner by culling cows to disposeof the outliers and sorting their better calves into the USPB program (Suther 1996, 68).
In its start-up phase, USPB faced several challenges. There was a lack of incentive toproduce higher quality beef cattle. Mark Gardiner, an early participant, explained, “Theeconomic signals have been blurred. It has been best to take a mismanaged animal that you buycheap and upgrade him to average” (Merlo 1998, 19).
Another difficulty faced by the co-op was the problem of a “mature” market. With beefdemand seemingly at its peak, fewer and fewer ranchers have entered the business. The averageage of a U.S. rancher is 57 years old. According to Kelly Giles, a third generation Kansas rancherand investor in USPB,
When you cannot bring in young people, that spells the end of an industry. In ClarkCounty, Kansas where I live, I know of only 10 producers younger than age 40. When
137
you’re just ten years away from retirement, you’re not willing to risk your neck on anew kind of investment (Merlo 1998, 21).
Despite the initial difficulties, however, within months, producers, representing more than80,000 head of cattle, committed to financing a business plan. The business plan offeredproducers an opportunity by adding value through increased premiums for quality carcasscharacteristics. Total start-up costs were more than $1 million, which included funding forresearch, legal services, and administrative and system set-up costs.
The newly formed company embarked on a membership drive. Members could join with alifetime membership fee of $500 plus a registration fee of $.50 per head of cattle that would bedelivered to USPB. (The registration fee later was raised to $2 per head.)
Purchasing a Beef Plant
At the same time, USPB began to explore ways to enter the beef-processing segment. Theboard decided that control of a harvesting facility was necessary to complete this objective. Thegroup analyzed a number of options, including building a new facility and custom-slaughteringcattle. In the end, they voted to partner with a successful existing company, Farmland NationalBeef (FNB), a subsidiary of Farmland Industries.
On July 31, 1997, USPB signed a letter of intent to purchase up to 50 percent of FNB. Tomake its purchase, USPB launched a stock offering at $55 per share and $38 million was raised.That offering closed in late November. On December 1, 1997, USPB became a part owner ofFNB. The co-op initially bought about 25 percent of the stock. USPB matched the amount ofstock raised with a loan from the Bank for Cooperatives (CoBank), located in Wichita, Kansas.In December 1997, USPB launched another stock offering, which closed a month later. With thenew stock, USPB bought more shares of FNB, but will not disclose its total percentage ofownership.
FNB operates two plants in Dodge City and Liberal, Kansas. It is the fourth largest beefpacker in the U.S. and processes 9 percent of all fed cattle in the country. The company marketsboxed beef, Prime, and Certified Angus Beef domestically and internationally. In addition, FNBmarkets further-processed and value-added products, primarily portion-controlled steaks, torestaurants, mail order catalogs, and foodservice and retail customers through the Kansas CitySteak Company, which it acquired in late 1997. FNB markets products under four brandedlabels: (1) Certified Angus Beef, (2) Farmland Black Angus Beef, (3) Farmland CertifiedPremium Beef, and (4) Kansas City Steak Company.
The key to USPB was the purchase of a processing facility, with associated brandedproducts. Without a brand recognizable to consumers, the beef business doesn’t have much goingfor it. In a good year, IBP, the biggest meatpacker, ekes out a 1.7 percent pretax margin. FNB’sresults last year were $43 million pretax net on sales of $2.2 billion; however, its sales ofbranded beef, at $100 million and growing 30 percent a year, exceed those of the three largestpackers combined. The profit margins on Black Angus Beef are 20 percent higher than on no-name beef, FNB’s CEO, John Miller said in a recent Forbes article (Conlin 1999, 76).
138
Like the poultry giant Tyson Foods, with its merchandising army, FNB tracks the beef allthe way to grocery store shelves. Distribution is helped by the fact that FNB already has anational branded presence in pork. The FNB beef brands are displayed in their own refrigerateddisplay cases to distinguish them from commodity meat. The branded beef products are now in800 plus stores, including chains such as Jewel in Chicago, Lucky in California, and AcmeMarkets on the East Coast (Conlin 1999, 76). In addition to the domestic market, FNB has anaggressive sales force in Japan and Korea and had restructured its Mexico operations in 1998 totake advantage of expected market growth there.
USPB CEO Hunt (1999) indicated that “through Farmland National Beef (FNB), our systemfor the first time on a large scale, gave producers an opportunity to realize profit from the valuegained through further processing beef all the way to consumers.” According to Hunt in aninterview for the Angus Journal, “By partnering with Farmland Industries in the ownership ofFNB, USPB producers gained market access to the consumer through Farmland’s namerecognition and already successful labels. As a result, highly desirable products could be soldthrough branded beef labels” (Gilmore 1999, 23).
John Miller took over as FNB’s CEO in 1992, after buying slaughterhouses and retrofittingthem with state-of-the-art equipment. To capitalize the business, he used the cash from a familybusiness (a meat packing business sold to ConAgra for $33 million in cash and stock), $25million from Farmland Industries, and borrowed $74 million from banks (Conlin 1999,76). According to Steve Kay, editor of Cattle Buyers Weekly, “John Miller’s put together one ofthe most functionally integrated beef systems in the U.S. If the big three packers aren’t lookingover their shoulders, they should be” (76).
Types and Conditions of Membership
USPB has two types of membership: (1) lifetime and (2) associate. In addition, producerscan lease shares from stockholders within the membership.
The lifetime associate membership fee for a stockholder is $500. A one-year associatemembership fee costs $100. Individuals do not become voting members until they havepurchased at least 100 shares of common stock in the co-op. Although membership commonstock and delivery rights are transferable under certain conditions, membership in the co-op isnot transferable. The co-op is not obligated to the member other than in its requirement to issue amembership certificate.
In addition to signing a membership application, the farmer/rancher seeking to be astockholder signs a Uniform Delivery and Marketing Agreement and commits to deliver onehead of cattle annually for each share of stock purchased. There is no refund of the membershipfee, but the stock is transferable.
Two forms of delivery agreements are available:
1. An agreement for “even slots,” that is an even monthly delivery of the deliverycommitment.
139
2. An agreement for “odd slots,” that is delivery of the delivery commitment during oneor more specific monthly periods each year. For odd slots, the specific monthlydelivery period(s) are to be selected by the designation and if overfilled, by analternative selection procedure.
If a person cannot meet the delivery schedule due to weather or other factors, USPB workswith the producer to deliver cattle when they will be ready for market. Although there is potentialfor seasonality of delivery because of the large geographic region USPB pulls from, they havebeen able to balance cattle deliveries to keep a consistent supply of cattle for their markets.
Associate members are not allowed to acquire shares of the common stock in the co-op or tobecome voting members in the co-op until they acquire at least 100 shares of membershipcommon stock. The lifetime associate membership fee is $500. The one-year associatemembership is $100. The lifetime associate membership fee is nonrefundable.
The co-op has the right to terminate membership if the member (1) fails to deliver cattle; (2)dies; (3) takes actions that will impede the co-op from accomplishing its purposes; or (4) takes orthreatens actions that adversely affect the interests of the Co-op or its members (By-Laws 1997).
Although USPB’s stock offering was legally closed on January 23, 1998, there are severalother ways in which interested producers can still participate in the company. Personsoccasionally have shares they are willing to lease to other producers. Likewise, normal businessattrition usually generates a limited amount of stock for sale from individual members. Thecompany will help potential customers locate members with shares for lease or purchase.
Getting Started
On December 1, 1997, USPB started processing cattle. Its more than 690 members from 24states delivered approximately 8,100 finished cattle each week through the end of 1998 topacking plants in Dodge City and Liberal, Kansas. Through April 1999, more than 600,000 cattlehave been marketed through the USPB system. Since December 1997, premiums of more than$9 million have been paid compared with selling on the cash market.
Features of U.S. Premium Beef
USPB membership in has the following features:
• Lease or ownership of shares for members
• An opportunity to partner with feed yards or other members in retaining ownership ofcattle
• No geographic restrictions on where members can do business (Members decide wherethe cattle will be fed. USPB cattle have been fed in more than 300 yards in 11 states.)
• Non-breed specific (except that cattle can not have a high percentage of Brahma, dairy,heiferettes, or bulls)
• Value-based grid pricing system that is very competitive
140
• Delivery dates determined by the owner at his or her perception of optimum endpoint
• Sharing of profits through stock dividends
• Transportation credit of up to $.55 per hundredweight
• Forward contracting available
• Individual carcass information free of charge for producers
• Advice and consultation from USPB field staff with assistance in management,genetics, economics, and animal health
• Access to market animals through value-added programs such as Certified Angus Beef,Farmland Black Angus Beef, and Farmland Premium Beef
Producers who lease shares can sell cattle on the grid, receive individual carcass data at nocharge, obtain up to a $.55 per hundredweight transportation credit, and earn any patronagedividend paid out to USPB members based on FNB’s earnings.
How Producers are Paid by USPB
The program is non-breed specific; however, cattle types with heavy Mexican influence donot support the product philosophy, regardless of grading characteristics, and are not encouragedto be marketed through the program. USBP does not accept heiferettes, Holsteins, cutting bulls,or cattle with a high percentage of Brahman influence.
The base live price for the grid is the weighted average in Kansas reported by the USDA forthe week previous to the week the cattle are delivered plus $.25 per hundredweight. The base liveprice is converted to a hot carcass price using the previous week’s plant average hot yield fornon-grid cattle purchased in Kansas by FNB.
Actual performance of the cattle marketed under USPB’s grid are compared to a base 52percent for Choice or better and the rolling average performance of Kansas non-grid cattle atFNB during the preceding four weeks for Yield Grade premium/discount calculations. Prime,Certified Angus, Hardbone, Ungraded (Standard, Dark Cutter), and carcass weight premiums/discounts are calculated with no comparison to plant averages. The Choice premium/discount iscalculated based on a four-week rolling average of USDA Heavyweights Choice/Select cutoutspread. Yield Grade 1 and 2 receive a premium for being above plant average but are notdiscounted if below the plant average. Yield Grade 4 and 5 receive a premium for being belowplant average and are discounted for greater than plant average (see Appendices A and B).
Unit Retain Fee
A unit retain fee is used in a closed marketing cooperative (such as USPB) to build a reservefund, and $12 per head is deducted from the cattle proceeds to fund the reserve account. USPBhad the choice of either deducting a unit retain fee, or increasing the purchase price of its stock tocreate a capital reserve fund. This unit retain fee is repaid one year from the date the cattle are
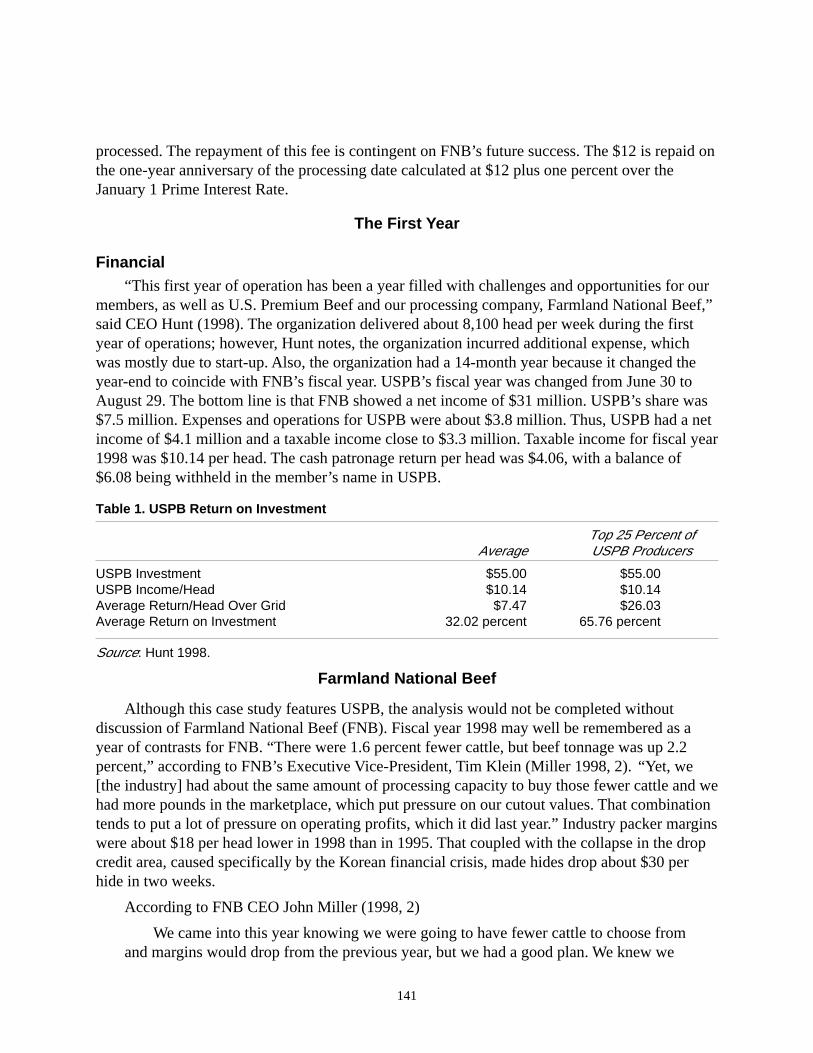
141
processed. The repayment of this fee is contingent on FNB’s future success. The $12 is repaid onthe one-year anniversary of the processing date calculated at $12 plus one percent over theJanuary 1 Prime Interest Rate.
The First Year
Financial“This first year of operation has been a year filled with challenges and opportunities for our
members, as well as U.S. Premium Beef and our processing company, Farmland National Beef,”said CEO Hunt (1998). The organization delivered about 8,100 head per week during the firstyear of operations; however, Hunt notes, the organization incurred additional expense, whichwas mostly due to start-up. Also, the organization had a 14-month year because it changed theyear-end to coincide with FNB’s fiscal year. USPB’s fiscal year was changed from June 30 toAugust 29. The bottom line is that FNB showed a net income of $31 million. USPB’s share was$7.5 million. Expenses and operations for USPB were about $3.8 million. Thus, USPB had a netincome of $4.1 million and a taxable income close to $3.3 million. Taxable income for fiscal year1998 was $10.14 per head. The cash patronage return per head was $4.06, with a balance of$6.08 being withheld in the member’s name in USPB.
Table 1. USPB Return on Investment
Top 25 Percent ofAverage USPB Producers
USPB Investment $55.00 $55.00USPB Income/Head $10.14 $10.14Average Return/Head Over Grid $7.47 $26.03Average Return on Investment 32.02 percent 65.76 percent
Source: Hunt 1998.
Farmland National Beef
Although this case study features USPB, the analysis would not be completed withoutdiscussion of Farmland National Beef (FNB). Fiscal year 1998 may well be remembered as ayear of contrasts for FNB. “There were 1.6 percent fewer cattle, but beef tonnage was up 2.2percent,” according to FNB’s Executive Vice-President, Tim Klein (Miller 1998, 2). “Yet, we[the industry] had about the same amount of processing capacity to buy those fewer cattle and wehad more pounds in the marketplace, which put pressure on our cutout values. That combinationtends to put a lot of pressure on operating profits, which it did last year.” Industry packer marginswere about $18 per head lower in 1998 than in 1995. That coupled with the collapse in the dropcredit area, caused specifically by the Korean financial crisis, made hides drop about $30 perhide in two weeks.
According to FNB CEO John Miller (1998, 2)
We came into this year knowing we were going to have fewer cattle to choose fromand margins would drop from the previous year, but we had a good plan. We knew we
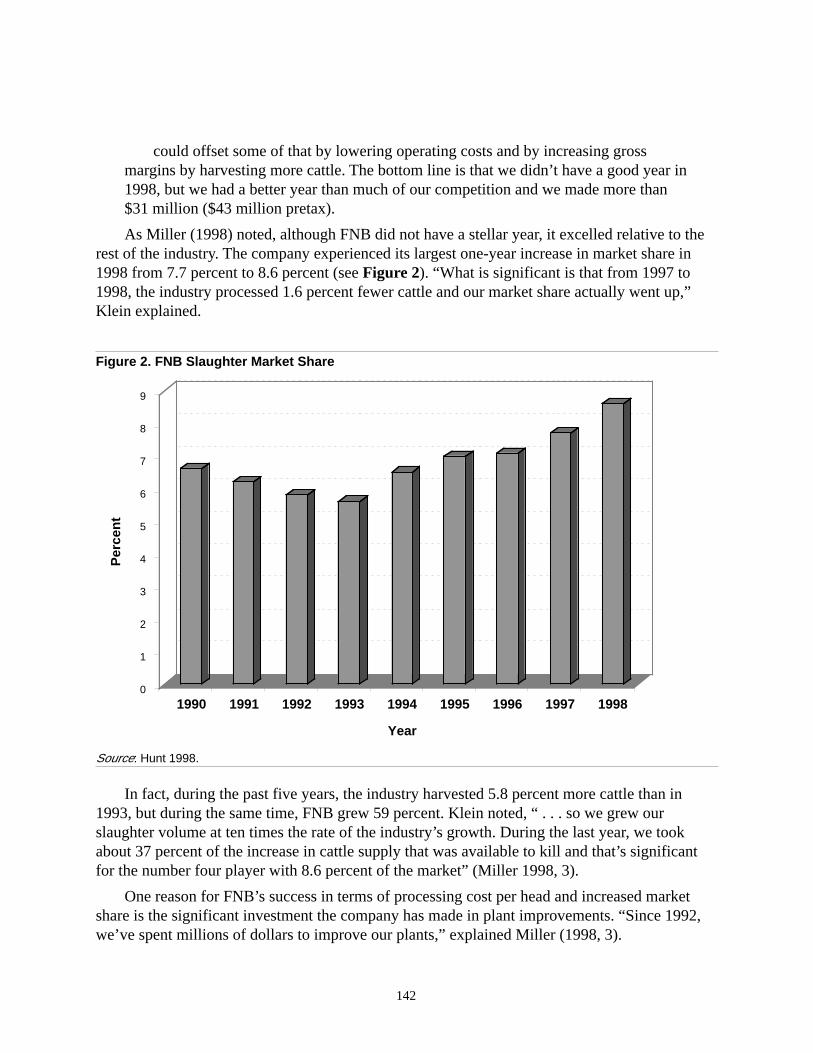
142
could offset some of that by lowering operating costs and by increasing grossmargins by harvesting more cattle. The bottom line is that we didn’t have a good year in1998, but we had a better year than much of our competition and we made more than$31 million ($43 million pretax).
As Miller (1998) noted, although FNB did not have a stellar year, it excelled relative to therest of the industry. The company experienced its largest one-year increase in market share in1998 from 7.7 percent to 8.6 percent (see Figure 2). “What is significant is that from 1997 to1998, the industry processed 1.6 percent fewer cattle and our market share actually went up,”Klein explained.
Figure 2. FNB Slaughter Market Share
1990 1991 1992 1993 1994 1995 1996 1997 1998
Year
Source: Hunt 1998.
In fact, during the past five years, the industry harvested 5.8 percent more cattle than in1993, but during the same time, FNB grew 59 percent. Klein noted, “ . . . so we grew ourslaughter volume at ten times the rate of the industry’s growth. During the last year, we tookabout 37 percent of the increase in cattle supply that was available to kill and that’s significantfor the number four player with 8.6 percent of the market” (Miller 1998, 3).
One reason for FNB’s success in terms of processing cost per head and increased marketshare is the significant investment the company has made in plant improvements. “Since 1992,we’ve spent millions of dollars to improve our plants,” explained Miller (1998, 3).
1 2 3 4 5 6 7 8 9
9
8
7
6
5
4
3
2
1
0
Per
cen
t
143
In addition to increased plant efficiencies, FNB’s growth in international sales, especially theJapanese market, played a large role in the company’s financial success in 1998. “We export tomore than 60 nations across the world,” Miller (1998, 4) pointed out. “We have an office inSeoul, South Korea and this year we opened an office in Japan. We have had tremendous successin that market since doing that.”
“We had about 7 percent of the chilled market in Japan in 1997, but that has climbedsignificantly since we opened our Tokyo office in January—to more than 12 percent in August”(Miller 1998, 4). Klein added, “Our objective in Japan is to at least double what our domesticshare is so if we’re at 9 percent in the U.S. market share, which is our objective for fiscal 1999,then our objective in Japan is to have at least 18 percent of that country’s chilled beef market.Our Japanese customers really like U.S. Premium Beef’s farm-to-table approach to producingbeef,” Miller (1998) pointed out. “We’ve taken a number of our Japanese customers on tours ofUSPB member operations and they really love the story. It’s been a great marketing tool for us.”
FNB has several line items that fit into the consumer home meal replacement market(HMR). “The idea of HMRs is just starting to catch on in the marketplace. We have precookedtop rounds, roasts, and flavored ground beef items,” reports Tracy Thomas (1999), director ofmarketing for USPB.
Producer Satisfaction
One of the concerns that many producers had initially was that if they sold cattle to USPB,other packers would not purchase cattle from their feedlots. “Our feedlots were initiallyconcerned about discrimination, but none have indicated that has been a problem,” said Thomas(1999).
Thomas (1999) noted, however, that selling cattle in a quality-based meat program versusselling live on the cash market was an initially difficult area for producers. Initially producerswere selling cattle at a discount. Thomas asserts, “Producers had to make changes inmanagement practices. Once they saw that they would be compensated for doing the right things,they changed. As genetic changes play out in the coming years, I anticipate we will continue tosee improvements in the premiums paid. So far, the changes have been primarily because ofmanagement.”
“There has been more than one USPB member who did not believe the carcass data sent tothem was from their cattle,” said Thomas (1999). The next time producers marketed cattle,however, they were invited to the packinghouse to see what was under the hide. Many producerswere surprised that the meat was not the quality they thought they were producing and havestarted to make the necessary changes.
Using TechnologyTo assist in more efficiently and accurately providing individual carcass data and making
genetic decisions, USPB is encouraging its producers to purchase and use electronicidentification (EID) tags. To help foster their use, USPB is rebating 50 percent of the tag cost to
144
producers who use them in 1999. EID allows a producer to keep track of the animal andrecord animal health history, including injections and site information that can easily be recordedand transferred to the cattle owner from the feedlot. The feedlot can use this system to trackaverage daily weight gain and then use the ultrasound data to project when animals should bemarketed. The EID system is then used at the FNB packing companies to provide feeders withindividual carcass data.
Marketing to ProducersUSPB must find producers willing to meet the quality standards and make the necessary
changes to ensure that this happens. The co-op attends trade shows of the state cattlemen’sassociations, attends national trade shows, and runs advertisements in popular industrymagazines. In addition, USPB staff members frequently speak at annual meetings of beeforganizations, banquets, and fairs.
Staff in PlaceIn its first 12-18 months of operation, the staff has grown to meet the needs of the
organization. Currently, there are two offices for the organization: one located in Kansas City,Missouri, and the other in Dodge City, Kansas.
Lessons Learned
In addition to sending carcass data to members within a week after slaughter, the companyassists producers in analyzing results. A field representative works with members to identifyproblem areas. USPB has held regional meetings, and producer-education manuals have beendistributed. “With information on more than 800,000 head of cattle, we now have a database thatis second to none,” Hunt says. “We are in a position to really help our members find out what isworking and what is not” (Gilmore 1999).
One early discovery: Pens of cattle that have not suffered from heavy or lightweightcarcasses or from Yield Grade (YG) 4s have consistently received premiums over the cashmarket. Also, a promising growth area with larger returns is the export market. In the last year,FNB opened offices in Tokyo, Japan, and Seoul, Korea, focusing on direct meat sales. Since lastsummer, sales in Japan have increased 50 percent. “We have had tremendous success in Japanwith the U.S. Premium Beef concept,” Hunt says. “The Japanese like dealing face-to-face. Theylike being able to trace back cattle to producers who are accountable for the meat” (Gilmore1999).
Future Plans
USPB will continually manage its expansion as market share increases. USPB started as aKansas-based company and has expanded into 24 states. As USPB expands the marketplace fromwhich it buys cattle, it may also be involved in increasing its processing capacity. “We willexpand in whatever way makes the most economic sense,” asserts Thomas (1999).
145
Another goal of USPB is to return producers’ investments within 5-10 years throughpremiums and patronage dividends. “Cooperatives can take years and years to be fullycapitalized. From the start, USPB was more than 50 percent capitalized. With our currentstructure, we should be fully capitalized within 12 years. At that point, earnings will go directlyto members,” said Thomas (1999).
USPB also intends to expand member communication with its members. According toThomas (1999), “We recently completed the development of our internal home page for use withour members. In the future we anticipate that our members will have a secure password and willhave access to their confidential member information on line. Additionally they will be able tocompare their individual data to that of other members to see how they are doing.”
In addition, USPB plans to continue its quest to develop quality products. In that definitionof quality, source verification and on-farm hazard analysis critical control points (HACCP)provide consumer assurance of quality and safety. USPB intends to implement usable, effectivesystems as they are developed. It also intends to work closely in developing quantifiable andpredictable standards for the cattle it markets. Asserts Thomas, “If you can’t measure it, youcan’t manage it. Our initial goal was not to be the savior of the beef industry, but to make ourproducers as much money as we could.”
For more information about the co-op, contact
U.S. Premium Beef10100 NW Executive Hills BoulevardSuite 105Kansas City, MO 64153Phone: (816) 891-2300fax: (816) 891-2310www.uspremiumbeef.com
Conclusion
It seems the USPB’s success in moving relatively quickly from concept to reality was tied tothe following five issues:
1. Through a process of rumination, the principal leadership of the USPB movement wasready for change. Many of the key players and early signatories have had industryinvolvement on a state or national level that exposed them to the decade-longdiscussions about reasons for loss of market share. They seem to have substantialseasoning in the business but also have many years ahead of them.
2. There is a mix of feeders and cow/calf or stocker operators. Other similar conceptshave failed to develop due to a lack of such comprehensive backing.
146
3. Emphasis was placed on information with application toward quality improvement.The group seems to have a powerful dual goal of improving individual profitability bydoing the things that are good for the industry as a whole.
4. The group was willing to think no small thoughts. They went for an ownershipposition, understanding the control that would come with it. Since the stock gives amember both the right and the obligation to deliver cattle to FNB, the commitment issolid with all parties.
5. They chose a company with premier management in Farmland National Beef. Thecompany had already committed huge amounts of money to process and productimprovement since 1992, so it was well-positioned to grow. Furthermore, FNB hadgood brand name presence in the domestic market, with a strong international reach inplace as well. The leadership of USPB was astute in recognizing the value of thebrands and the well-developed merchandizing structure of FNB.
The fact that USPB could reach a deal with Farmland was probably a matter of timing andphilosophy. Farmland itself could see a benefit from freeing capital it had invested in FNB.USPB was forming under a co-op structure that offered a good fit for the companies at the outset.Farmland had long recognized its connection to beef production, particularly at the cow/calflevel. Through the 1990s, it had reached out to vertically coordinate segments of the industryserved by the co-op. USPB would certainly fit the Farmland philosophy for improving returnsfor its members. The combination of meeting Farmland’s capital needs and fittingphilosophically was powerful in bringing the deal to fruition.
As the fourth largest packer, FNB has certainly had to feel competitive pressures from thebig three packers (Monfort, IBP, and Excel). The company has been a strong “spot market”purchaser over the years and not a big contract procurer of supply. By being tied to such anarrow region, there have certainly been times when the big three packers could make lifedifficult for FNB. In the interest of survival and profitability, it became apparent the companywould need to reach ahead and control some supply. It must have seemed fortuitous to FNB tohave a quality oriented group step forward with a willingness to supply in volume underspecifications. Once again, the timing helped open a door for negotiations.
Another timing factor is the growth of grid marketing and its acceptance. With a push forinformation, a producer has become more likely to sell on grid to get the data needed.Commercial feedlots want to offer service value to their clients, so special systems or marketswould fit well. They are also struggling to help clients achieve profits. More cow operators areseeking to retain ownership through slaughter. All these factors have converged to create criticalmass and ignite the fire that became USPB.
147
References
By-Laws of U.S. Premium Beef, Amended September 4, 1997.
Conlin, Michelle. 1999. Brand that cow. Forbes (April 19): 76.
Gilmore, Lori. 1999. Stepping up to the plate. Angus Journal (March).
Hunt, Steve. 1998. The state of U.S. Premium Beef. USPB Update (December 11).
Hunt, Steve. 1999. Welcome to U.S. Premium Beef. USPB News (April).
Merlo. Catherine. 1998. A co-op for the cowboys. Rural Cooperatives (January/February): 19.
Miller, Bill. 1998. FNB’s Year-end recap. USPB Update (December 11).
Smith, Rod. 1998. USPB’s Hunt said first-year results offer encouraging promises for growth.Feedstuffs (September 21): 9.
Suther, Steve. 1996. U.S. Premium is born. Beef Today (September).
Thomas, Tracy. 1999. Conversation with author on April 13, 1999.
U.S. Department of Agriculture (USDA). 1997. Census of Agriculture. Washington, DC: U.S.Department of Agriculture. Available online: <http://www.usda.gov/nass>
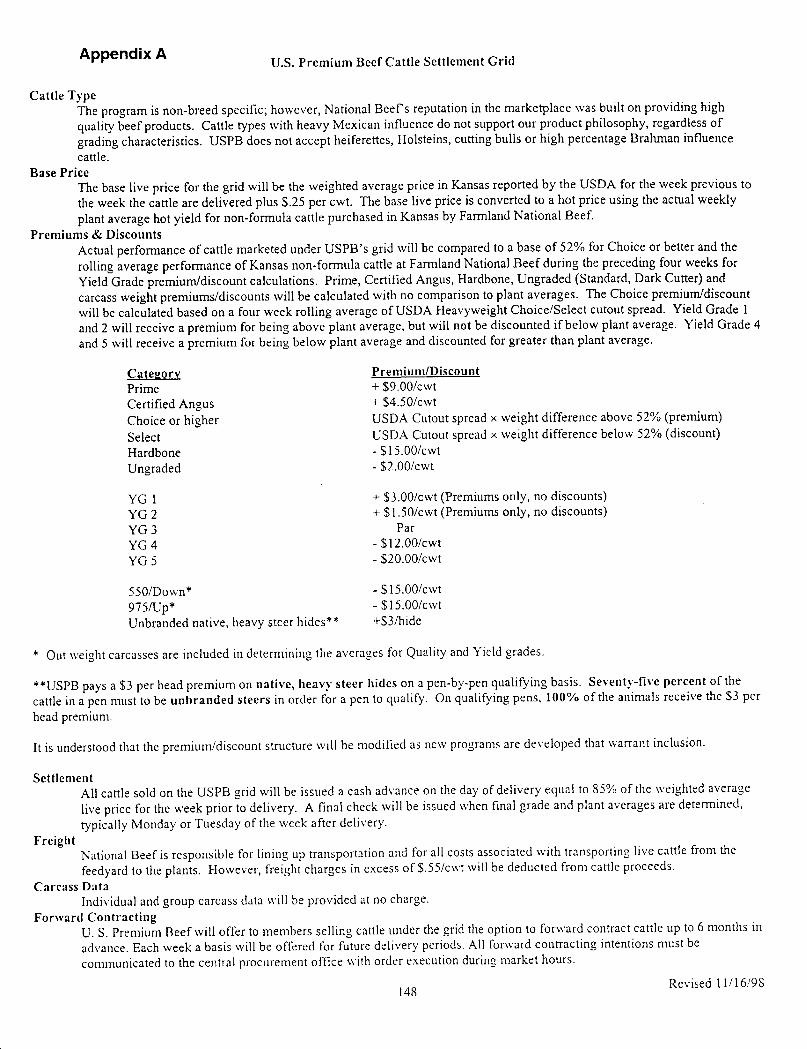
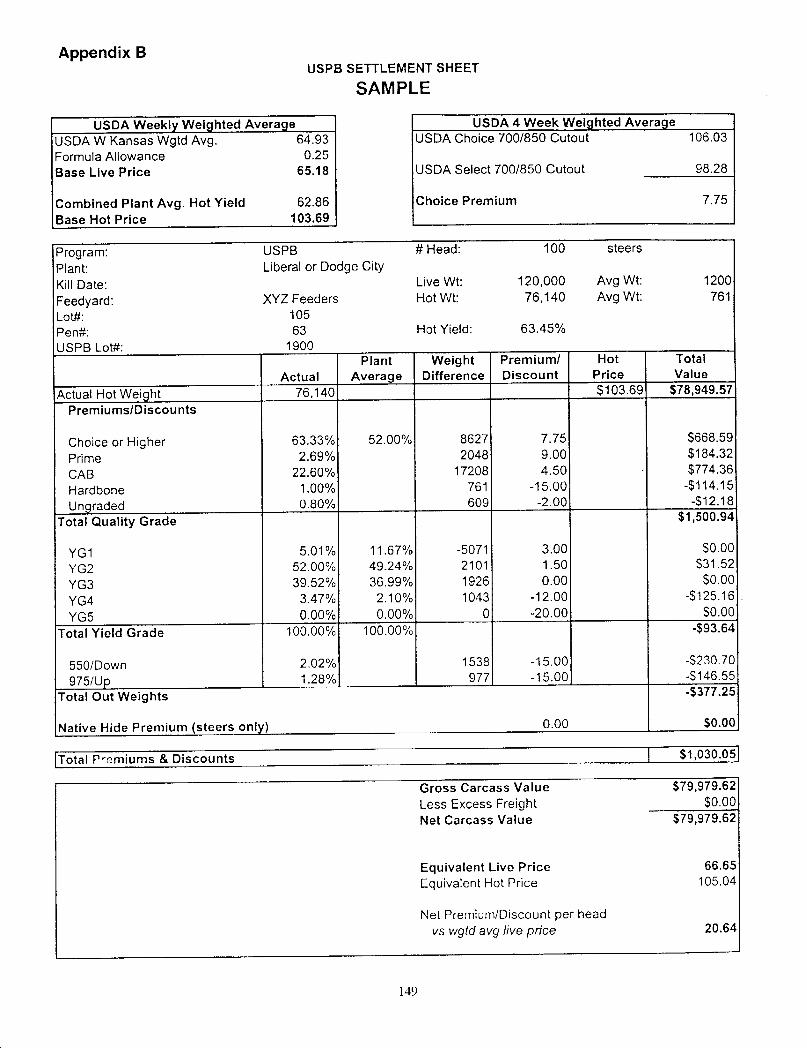

151
South Dakota Soybean Processors
by Rodney J. Fink
Abstract: South Dakota Soybean Processors, Inc. of Volga South Dakota has successfullyunited more than 2100 producers to provide the funds and management direction to initiate asuccessful cooperative. Producers from South Dakota, Minnesota, North Dakota and Iowaprovided more than $21 million to build the first soybean crushing facility in the U.S. since 1978.Initial crush was projected to be 16 million bushels per year and the crush has increased to acapability of 27 million bushels per year. After three years of operation, soybean basis for theregion has improved by about 25 cents per bushel (for all producers) and SDSP has paid mem-ber owners $9.2 million in cash patronage. Economic activity in the region, as a result of SDSP,has increased by at least $175 million.
South Dakota Soybean Processors, Inc., a new generation value-added cooperative, is ownedby 2,103 producers who live in Minnesota, South Dakota, North Dakota and Iowa. The missionstatement of South Dakota Soybean Processors (SDSP) follows:
“South Dakota Soybean Processors is a value-added cooperative of agriculturalproducers with emphasis on adding value to soybeans. Our goal is to be financiallystrong and make a maximum value-added payment to our members while maintaininggrowth and stock value. South Dakota Soybean Processors will maintain a competitiveposition in the marketplace by providing quality products to our customers with highlyefficient and cost-effective processes.”
“South Dakota Soybean Processors will ensure success through teams of dedicated andcompetent directors and associates. We will seek to meet the needs of our members in afriendly and professional manner, and to listen to suggestions from members, associates,and customers.”
Background InformationSDSP is located in east Central South Dakota (Brookings County) in the town of Volga,
about 30 miles from the Minnesota border. In 1990, Volga had a population of 1,263 (U.S.Bureau of the Census). By 1996 the population was estimated at 1,316 and population isassumed to have grown since that time. Brookings, the county seat of Brookings County (fourthmost populous county in S.D.) is located eight miles east of Volga. The 1997 estimatedpopulation of Brookings County was 26,186. The 1996 per capita income in Brookings Countywas $18,939, or 91 percent of the state’s average per capita income of $20,436 and 78 percent ofthe national per capita personal income average of $24,436 (US Bureau of the Census, 1998).
The author would like to acknowledge the time and assistance of South Dakota Soybean Processors(SDSP) CEO Rodney Christianson, Vice-Board Chairman Marvin Hope and others associated withSDSP. Their assistance is greatly appreciated.
152
South Dakota State University is located in Brookings and is a major employer in the region. Theregion served by SDSP consists of grain and livestock farmers with the main crops being corn,soybeans, wheat, oats and alfalfa. Membership in SDSP is primarily family farms although somelocal elevators and Hutterite communities have membership and equity units of participation.The Hutterite communities also purchase significant amounts of meal for their livestockoperations.
Planning for the cooperative started in 1992 when a feasibility study was sponsored by theSouth Dakota Soybean Research and Promotion Council. Organizers first tried to attract aprocessor to build a plant in the region, without success. After some thought, organizers said“Why don’t we do it ourselves?” The study suggested such a plant would be a good investmentand this led to 15 meetings of farmers throughout South Dakota in early 1993.
In late 1993, a group of soybean producers, acting as incorporators, established SouthDakota Soybean Processors. This group, serving as the initial board of directors, updated thefeasibility study and proceeded to plan for the building and operation of a soybean processingplant in South Dakota. Four sites were proposed for the facility and the board voted (November1994) to build the $32.5 million dollar plant in Volga, South Dakota. Ground breakingceremonies were held on August 21, 1995 and this signified the nation’s first new soybeancrushing plant to be built since 1978.
The early stages of organization required a great deal of effort. The nearby Minnesota CornProcessors found their new generation cooperative to be a good investment and this successmade fund raising easier. The current SDSP Board President and other organizers traveled toalmost 200 meetings, often two or three per day, and met with at least 6000 producers. Theyoften started out at 6:00 A.M. and returned after midnight. The current president recalls that inone day and one-half period, he received 120 phone messages. He reported his cellular phone billreached $435 during one month.
During the plant planning stages, the state’s soybeans (about 90 million bushels) wereshipped out of state annually for processing. About 40 percent were shipped back for feed. Thestate’s soybeans were sold to processors in Minnesota, Iowa, Nebraska and other neighboringstates. By building a plant, farmers hoped to gain in several ways. With lower shipping costs,prices will be higher for soybeans because the market is local, and farmers can purchase soybeanmeal without paying the added freight charges. Since crushing commenced in late 1996, the basisfor soybeans has narrowed by about 25 cents per bushel and the production of soybeans in thestate has increased to about 130 million bushels. Initial crush output was estimated to be 16million bushels per year but has increased to approximately 27 million bushels per year. Plantpromoters banked on a growing domestic and worldwide demand for soybean products. Morethan one-half of U.S. soybean production is crushed while roughly one-third is exported.Planners pointed to an increased demand by China and the possible use of soy fuel, a cleanburning fuel, for mass transit equipment.
The component of a bushel of soybeans contains approximately 11 pounds of oil and 48pounds of protein-rich meal. Food ingredients are the primary end use for oil, while meal is
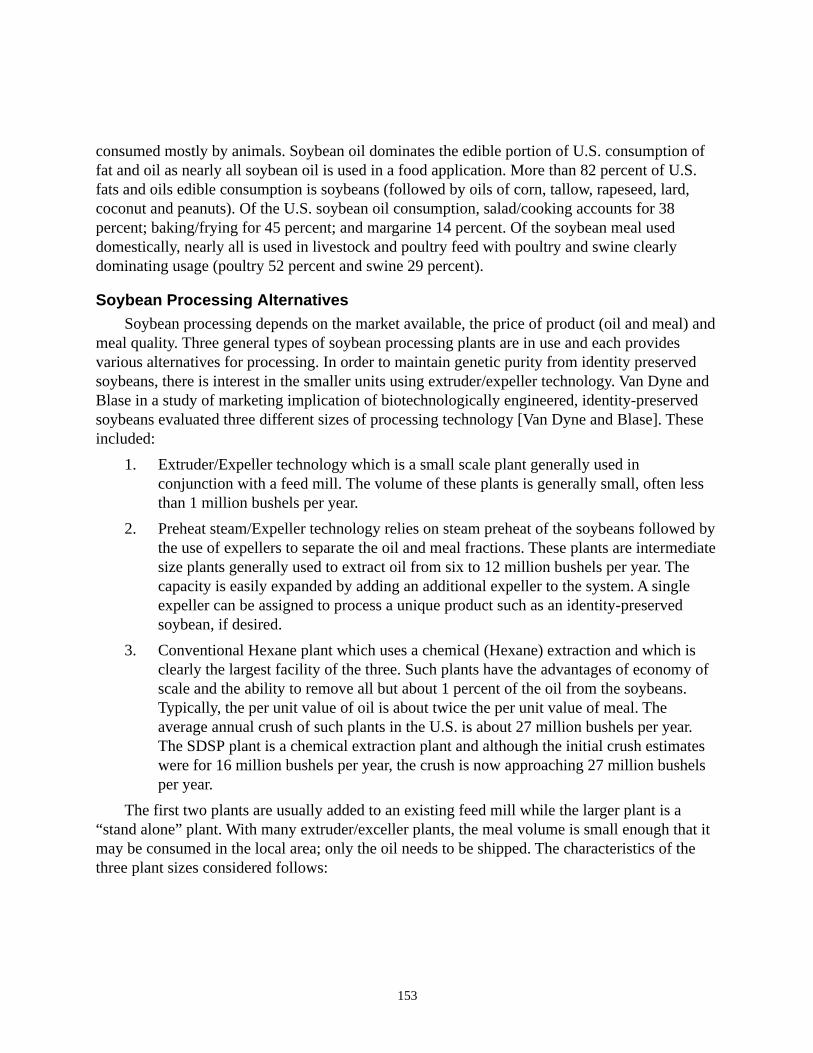
153
consumed mostly by animals. Soybean oil dominates the edible portion of U.S. consumption offat and oil as nearly all soybean oil is used in a food application. More than 82 percent of U.S.fats and oils edible consumption is soybeans (followed by oils of corn, tallow, rapeseed, lard,coconut and peanuts). Of the U.S. soybean oil consumption, salad/cooking accounts for 38percent; baking/frying for 45 percent; and margarine 14 percent. Of the soybean meal useddomestically, nearly all is used in livestock and poultry feed with poultry and swine clearlydominating usage (poultry 52 percent and swine 29 percent).
Soybean Processing AlternativesSoybean processing depends on the market available, the price of product (oil and meal) and
meal quality. Three general types of soybean processing plants are in use and each providesvarious alternatives for processing. In order to maintain genetic purity from identity preservedsoybeans, there is interest in the smaller units using extruder/expeller technology. Van Dyne andBlase in a study of marketing implication of biotechnologically engineered, identity-preservedsoybeans evaluated three different sizes of processing technology [Van Dyne and Blase]. Theseincluded:
1. Extruder/Expeller technology which is a small scale plant generally used inconjunction with a feed mill. The volume of these plants is generally small, often lessthan 1 million bushels per year.
2. Preheat steam/Expeller technology relies on steam preheat of the soybeans followed bythe use of expellers to separate the oil and meal fractions. These plants are intermediatesize plants generally used to extract oil from six to 12 million bushels per year. Thecapacity is easily expanded by adding an additional expeller to the system. A singleexpeller can be assigned to process a unique product such as an identity-preservedsoybean, if desired.
3. Conventional Hexane plant which uses a chemical (Hexane) extraction and which isclearly the largest facility of the three. Such plants have the advantages of economy ofscale and the ability to remove all but about 1 percent of the oil from the soybeans.Typically, the per unit value of oil is about twice the per unit value of meal. Theaverage annual crush of such plants in the U.S. is about 27 million bushels per year.The SDSP plant is a chemical extraction plant and although the initial crush estimateswere for 16 million bushels per year, the crush is now approaching 27 million bushelsper year.
The first two plants are usually added to an existing feed mill while the larger plant is a“stand alone” plant. With many extruder/exceller plants, the meal volume is small enough that itmay be consumed in the local area; only the oil needs to be shipped. The characteristics of thethree plant sizes considered follows:
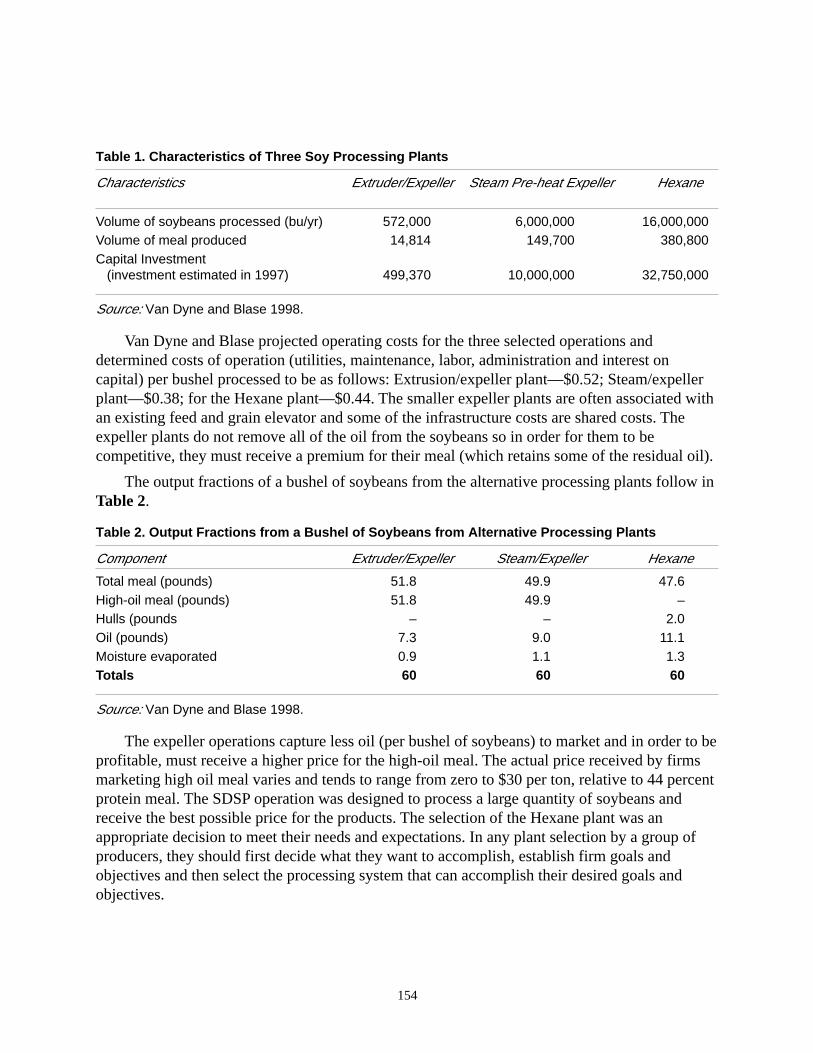
154
Table 1. Characteristics of Three Soy Processing Plants
Characteristics Extruder/Expeller Steam Pre-heat Expeller Hexane
Volume of soybeans processed (bu/yr) 572,000 6,000,000 16,000,000Volume of meal produced 14,814 149,700 380,800Capital Investment (investment estimated in 1997) 499,370 10,000,000 32,750,000
Source: Van Dyne and Blase 1998.
Van Dyne and Blase projected operating costs for the three selected operations anddetermined costs of operation (utilities, maintenance, labor, administration and interest oncapital) per bushel processed to be as follows: Extrusion/expeller plant—$0.52; Steam/expellerplant—$0.38; for the Hexane plant—$0.44. The smaller expeller plants are often associated withan existing feed and grain elevator and some of the infrastructure costs are shared costs. Theexpeller plants do not remove all of the oil from the soybeans so in order for them to becompetitive, they must receive a premium for their meal (which retains some of the residual oil).
The output fractions of a bushel of soybeans from the alternative processing plants follow inTable 2.
Table 2. Output Fractions from a Bushel of Soybeans from Alternative Processing Plants
Component Extruder/Expeller Steam/Expeller Hexane
Total meal (pounds) 51.8 49.9 47.6High-oil meal (pounds) 51.8 49.9 –Hulls (pounds – – 2.0Oil (pounds) 7.3 9.0 11.1Moisture evaporated 0.9 1.1 1.3Totals 60 60 60
Source: Van Dyne and Blase 1998.
The expeller operations capture less oil (per bushel of soybeans) to market and in order to beprofitable, must receive a higher price for the high-oil meal. The actual price received by firmsmarketing high oil meal varies and tends to range from zero to $30 per ton, relative to 44 percentprotein meal. The SDSP operation was designed to process a large quantity of soybeans andreceive the best possible price for the products. The selection of the Hexane plant was anappropriate decision to meet their needs and expectations. In any plant selection by a group ofproducers, they should first decide what they want to accomplish, establish firm goals andobjectives and then select the processing system that can accomplish their desired goals andobjectives.
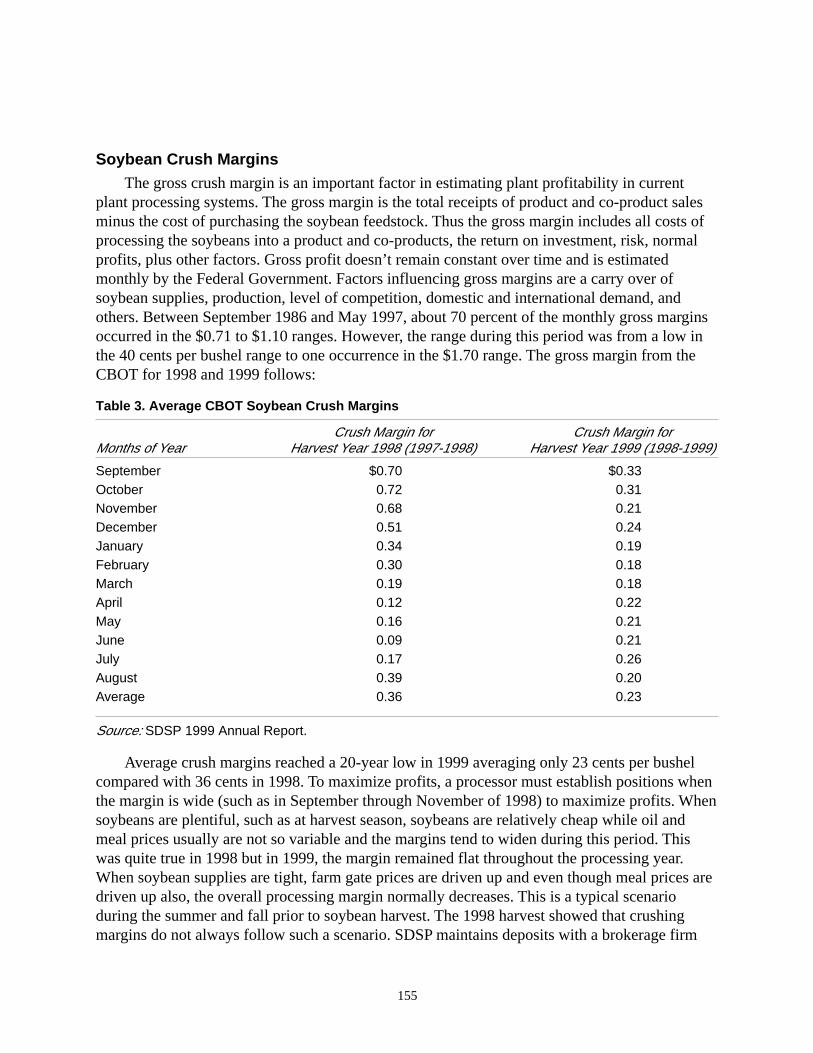
155
Soybean Crush MarginsThe gross crush margin is an important factor in estimating plant profitability in current
plant processing systems. The gross margin is the total receipts of product and co-product salesminus the cost of purchasing the soybean feedstock. Thus the gross margin includes all costs ofprocessing the soybeans into a product and co-products, the return on investment, risk, normalprofits, plus other factors. Gross profit doesn’t remain constant over time and is estimatedmonthly by the Federal Government. Factors influencing gross margins are a carry over ofsoybean supplies, production, level of competition, domestic and international demand, andothers. Between September 1986 and May 1997, about 70 percent of the monthly gross marginsoccurred in the $0.71 to $1.10 ranges. However, the range during this period was from a low inthe 40 cents per bushel range to one occurrence in the $1.70 range. The gross margin from theCBOT for 1998 and 1999 follows:
Table 3. Average CBOT Soybean Crush Margins
Crush Margin for Crush Margin forMonths of Year Harvest Year 1998 (1997-1998) Harvest Year 1999 (1998-1999)
September $0.70 $0.33October 0.72 0.31November 0.68 0.21December 0.51 0.24January 0.34 0.19February 0.30 0.18March 0.19 0.18April 0.12 0.22May 0.16 0.21June 0.09 0.21July 0.17 0.26August 0.39 0.20Average 0.36 0.23
Source: SDSP 1999 Annual Report.
Average crush margins reached a 20-year low in 1999 averaging only 23 cents per bushelcompared with 36 cents in 1998. To maximize profits, a processor must establish positions whenthe margin is wide (such as in September through November of 1998) to maximize profits. Whensoybeans are plentiful, such as at harvest season, soybeans are relatively cheap while oil andmeal prices usually are not so variable and the margins tend to widen during this period. Thiswas quite true in 1998 but in 1999, the margin remained flat throughout the processing year.When soybean supplies are tight, farm gate prices are driven up and even though meal prices aredriven up also, the overall processing margin normally decreases. This is a typical scenarioduring the summer and fall prior to soybean harvest. The 1998 harvest showed that crushingmargins do not always follow such a scenario. SDSP maintains deposits with a brokerage firm
156
which are used for risk management as they use futures and option’s contracts to manage the riskof commodity price volatility of soybeans, oil and meal.
SDSP BeginningsFollowing incorporation, SDSP was authorized to sell up to 2,500 shares of common stock
and 80,000 shares of preferred stock. Each voting member is required to purchase one share ofcommon stock and only the common stock was offered for sale. At least 85 percent of the votingshares must be owned by farmers and this includes landlords and tenants who receive as rent aportion of the products produced on the land (not to include timber or forest products). Eachmember must buy one share of common stock.
The cooperative is a closed cooperative, that is, one in which no new member-shareholderswill be admitted other than by transfer of existing shares or by an expansion of SDSP’s capacityto process soybeans. Distribution of patronage will be annually in cash, credits, capital stock,certificates of interest, revolving funds certificates, letters of advice, or other certificates orsecurities of SDSP or in any combination allocated to patrons on a patronage basis. Eachmember is entitled to one vote on all matters submitted to a vote by the members.
Original subscribers agreed to purchase one share of common stock at $200 (with par valueof $1.00) and a minimum of 2,500 equity units. One-half of the stock purchased was used asoperating money for organizers working capital to initiate the project. Each equity unit purchasedobligated the buyer to deliver one bushel of soybeans to SDSP annually. Equity units were soldat $2.00, 2.25 & 2.50 per unit with an average equity unit price of $2.19 with the averageinvestment per member of about $10,000. Originally 9,419,500 equity units were sold and, byaction of the board of directors, this was increased on a three for two basis so now 14,129,250equity units exist (increasing the requirement for each member to deliver soybeans).
Membership must consist of 85 percent active producers and this is maintained by onlyapproving transfers of shares to an active producer. Fund raising started in South Dakota and inthe first year $9 million was committed by South Dakota producers. Further efforts in Minnesotaincreased commitment up to $20 million (about one-half from Minnesota). The Board isrepresented by members from seven districts: four from South Dakota, two from Minnesota andone district representing all remaining Minnesota counties, all North Dakota counties and allstates located outside of South Dakota, Minnesota, Iowa, and North Dakota.
Transfer of Shares and Equity UnitsShareholders may generally transfer their stock and equity units to immediate family
members, a family farm corporation or partnership in which the member is a shareholder, anowner, partner or shareholder of a dissolved partnership or a new entity following completion ofa merger. Other transfers of shares and equity units must be to producers and can take place onlyafter the shares of common stock and equity participation have been offered to every othermember-shareholder of the cooperative. If more than one shareholder of the cooperative desiresto purchase additional shares, they may do so at the price offered. In the event no members of thecooperative want to purchase the shares and equity units of participation, the member,
157
shareholder, may, subject to the consent of the Board, transfer the common stock and equity unitsof participation to the originally proposed transferee, assuming the producing entity is eligiblefor ownership. Some shares have transferred to other ownership as the original number of equityowners was 2,087 and is currently at 2,103. The most recent sale of Equity Units was completedon April 18, 2000. They sold between $2.90 and $3.30, with an average price of $3.10 each.When Equity Units are offered for sale, members have a right to bid for increments of 250Equity Units and they have a right to better their bids. The offer to bid by members is containedin the monthly SDSP publication (Bean Stock).
Member Delivery of SoybeansEquity stock issued currently totals 14,219,500 shares. The Board will modify the call for
delivery each year to provide the volume of soybeans needed to meet the yearly business plan.Currently, the call per equity unit is 1.8 bushel. SDSP has a marketing pool which will purchasesoybeans on behalf of the equity owner. If the supply from farm delivery is insufficient,purchases can be made from other area grain elevators.
Board of Director RepresentationBoard members are elected for three year terms with three directors from each of the seven
districts. One-third of the members are elected each year and elections are held at the SDSPannual meeting. Amended SDSP bylaws allow for three (3) consecutive terms (vs. twooriginally). The Board generally meets monthly and whenever special meetings are called. TheSDSP annual meeting must be held within 180 days of the close of the cooperative’s fiscal year,at a time and date determined by the board of directors. Officers of the cooperative are apresident, vice-president, secretary and treasurer and are appointed by the board. Four standingcommittees (public relations, planning, governance and financial/audit) play an active role inproviding input and direction to the board and to the CEO.
The public relations committee consists of six board members who maintain good relationswith other cooperatives, the community and the broader public. They also strive to see that goodcommunications are provided to members and to help maintain harmony between diverse interestgroups of the organization. The committee goals are to maintain a strong and growing image ofSDSP’s business goals by realizing that the cultivation of financial or political support of itsfellow members, producers, the general public and government officials will help meet this goal.The committee will focus on the development of nonmember interest in the cooperative and toassist in increasing the value of owner shares.
The planning committee consists of eight board members who provide assistance to see thatthe cooperative is positioned for sound growth, sound planning, good budgeting procedures andrecommendations for changes in assets. The main committee goal is to provide direction,governance and resource allocation to SDSP’s associates in achieving their mission in futureyears. Execution of duties includes an annual review and recommendations to guide capitalinvestments, an annual audit of selected capital projects (and all projects exceeding a $500,000investment), review and recommendation of investment projects and other reviews called for bythe CEO or board.
158
The governance committee consists of four board officers and committee designates whoprovide assistance with the full board core responsibilities. They meet SDSP goals of providingdirection to the board of directors and CEO by providing supervisory guidance to the CEO,review and direction in SDSP’s legal responsibilities, approval of CEO’s selection of keymanagement personnel, selection and recommendation of SDSP’s CEO and to review andrecommend modification of organizational structure and salary schedules.
The financial audit committee consists of seven board members who assist the board byreviewing and recommending the fiscal year operating budget and to safeguard SDSP assets.The committee goal is to provide recommendations for the direction, governance and resourceallocation to SDSP associates. They help maintain the overall SDSP goal of remainingfinancially strong while making a maximum value-added payment to members, maintaininggrowth and stock value and safeguarding the assets of the cooperative.
During the construction stage, the board of directors was directly involved in the process ofmanaging the operation. The board continues to make contributions to the operation throughactive participation in regular meetings and through work on the standing and ad hoc committeesin operation. Several new innovations, including the idea of entering a partnership with UrethaneSoy Systems Company, Inc. came about as a result of a Board member’s idea. The CEO forSDSP had 20 years of experience with a major soybean processor prior to his selection andbrought a great deal of experience and expertise to the organization. The Board and CEO, inconcert with other key employees of the plant, are good “role models” of how an organizationcan work in harmony to achieve well-established goals of the organization.
SDSP has clear goals designed to serve the 2,100 plus members of the Cooperative. Theseare to:
1. Provide maximum value-added payment to shareholders. The intent, in general, is toreturn about 70 percent of the profit to cooperative members and use the other 30 percentfor retiring debt and growing the company.
2. Maintain the stock value, or value of equity units, of cooperative members.
3. Maintain a growth perspective of SDSP. This has been successfully accomplished as theyhave provided oil storage for the Chicago Board of Trade (a profitable operation),increased the plant capacity from 50 thousand to 80 thousand bushels per day, madeimprovements in their marketing procedures for soybean hulls and have expanded byforming a partnership with a new product, SoyOyl™ , a component of the Urethanebusiness (Oil Crops Yearbook, 1998).
Operational Process of the PlantSDSP is located on a 40-acre site on the east side of Volga, south of Highway 14 (main
highway through Volga). The entrance to the plant, located 8 miles west of Brookings, S.D. haschanged the flow of traffic since SDSP began processing. Some of the soybeans to be processedcome from other elevators but the majority, about 75 percent, come by truck delivery fromfarmers. The facilities are very streamlined for handling soybeans received either by rail or by
159
truck Trucks are weighed on a 120-foot scale and then proceed to truck and rail receiving wheresoybeans are sampled for moisture and grade and then pre-cleaned before being dried.
SDSP has a processing capacity of more than 80,000 bushels per day so they turn overquickly. The drying capacity is over 5,000 bushels per hour and after drying, they go to apreparation area where they are cleaned, cracked and dehulled and moved by conveyor for oilextraction. Oil is extracted and distilled using liquid Hexane in a washing process that removesthe oil. The exposure to Hexane draws oil from the flakes and in addition to oil, producessoybean meal. Each bushel of soybeans yields approximately 11 pounds of oil and 48 pounds ofmeal.
Oil goes to crude storage tanks where it is sampled for quality before being pumped intostorage. The oil is sold for the manufacture of products such as margarine, shortening, glycerin,printing ink, paints, soaps, linoleum, plastic, rubber substitutes and biodiesel fuel. The meal isfurther processed to meet customer’s specifications. If a customer wants a lower percentageprotein meal, the raw meal is blended with soybean hulls to lower the protein content. Meal isused for animal feed (or as a feed additive or ingredient). The final phase of the operation is theloading of the oil and meal on trucks and train cars for shipping to manufactures for furtherprocessing into final products.
They use a high-tech automated weighing system which enables SDSP to automate theticket process (http://www.agris.com). The weight is taken and automatically printed andrecorded with minimum chance of human error. The entire process is computer generated toprovide rapid, accurate and dependable records. With the large number of trucks coming eachday, the job of creating tickets by hand would be very difficult. When the truck pulls on thescales and the operator types in the license plate, information on the customer automaticallyappears on the screen. Weights and grades are automatically gathered from scales and gradingequipment and entered. Other high tech controllers are used in the plant such as theprogrammable logic controller which is monitored continuously for overall system monitoringand control.
Additional InnovationsOrganizers of SDSP had a vision of not only a soybean processing plant but also the develop-ment of a consumer business where even more value could be added to members’ soybeans bymoving one step closer to the consumer. A move in this direction was realized in late 1999 whenSDSP announced its partnership with Urethane Soy Systems Company, Inc., a manufacturer ofSoyOyl™ (http://www.brookings.net/sdsp/pr-soyoyl.html). The product utilizes crude soybeanoil, a renewable resource, as the base for countless industrial products, making today’s producera more environmentally friendly partner in the global universe. This technology is the only oneof its kind in the world and a portion of the technology is exclusive to SDSP. The board andmanagement of SDSP are looking for ways to return maximum value-added payments to mem-bers, and are continually pursuing such opportunities to strategically position the cooperative inthe soybean industry. Another innovative and profitable step made by the board and managementof SDSP was the construction of a large storage tank for soybean oil which is characterized as an
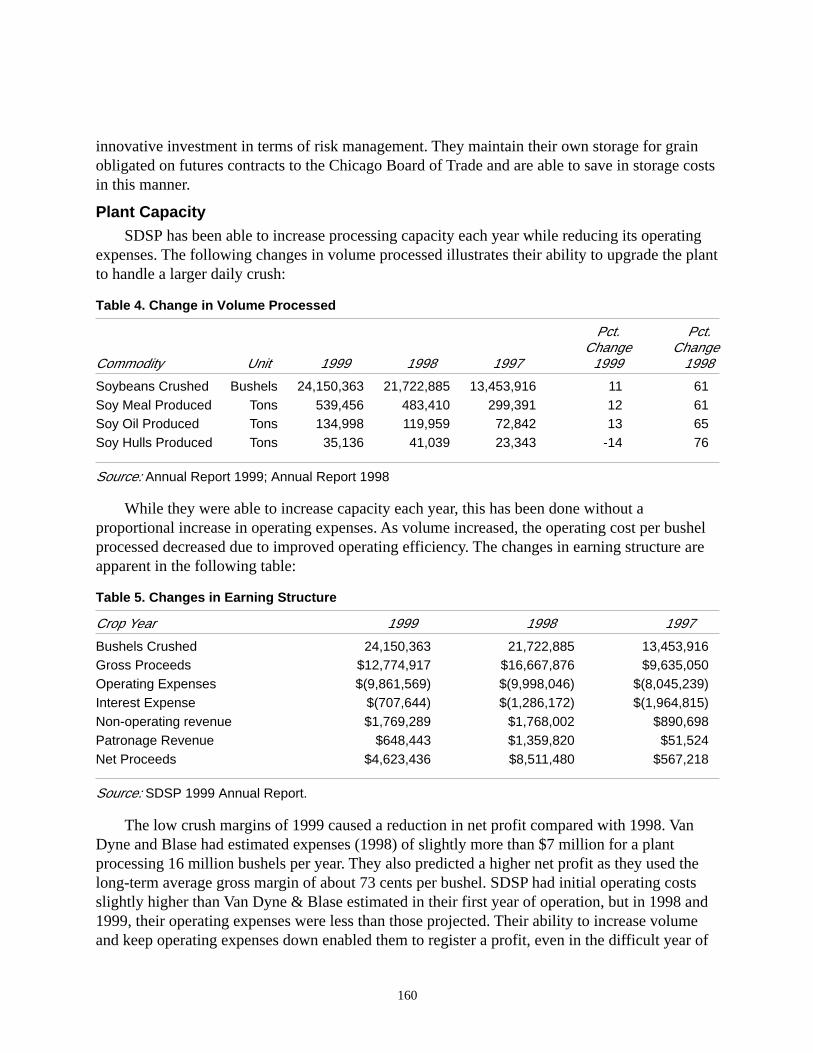
160
innovative investment in terms of risk management. They maintain their own storage for grainobligated on futures contracts to the Chicago Board of Trade and are able to save in storage costsin this manner.
Plant CapacitySDSP has been able to increase processing capacity each year while reducing its operating
expenses. The following changes in volume processed illustrates their ability to upgrade the plantto handle a larger daily crush:
Table 4. Change in Volume Processed
Pct. Pct.Change Change
Commodity Unit 1999 1998 1997 1999 1998
Soybeans Crushed Bushels 24,150,363 21,722,885 13,453,916 11 61Soy Meal Produced Tons 539,456 483,410 299,391 12 61Soy Oil Produced Tons 134,998 119,959 72,842 13 65Soy Hulls Produced Tons 35,136 41,039 23,343 -14 76
Source: Annual Report 1999; Annual Report 1998
While they were able to increase capacity each year, this has been done without aproportional increase in operating expenses. As volume increased, the operating cost per bushelprocessed decreased due to improved operating efficiency. The changes in earning structure areapparent in the following table:
Table 5. Changes in Earning Structure
Crop Year 1999 1998 1997
Bushels Crushed 24,150,363 21,722,885 13,453,916Gross Proceeds $12,774,917 $16,667,876 $9,635,050Operating Expenses $(9,861,569) $(9,998,046) $(8,045,239)Interest Expense $(707,644) $(1,286,172) $(1,964,815)Non-operating revenue $1,769,289 $1,768,002 $890,698Patronage Revenue $648,443 $1,359,820 $51,524Net Proceeds $4,623,436 $8,511,480 $567,218
Source: SDSP 1999 Annual Report.
The low crush margins of 1999 caused a reduction in net profit compared with 1998. VanDyne and Blase had estimated expenses (1998) of slightly more than $7 million for a plantprocessing 16 million bushels per year. They also predicted a higher net profit as they used thelong-term average gross margin of about 73 cents per bushel. SDSP had initial operating costsslightly higher than Van Dyne & Blase estimated in their first year of operation, but in 1998 and1999, their operating expenses were less than those projected. Their ability to increase volumeand keep operating expenses down enabled them to register a profit, even in the difficult year of
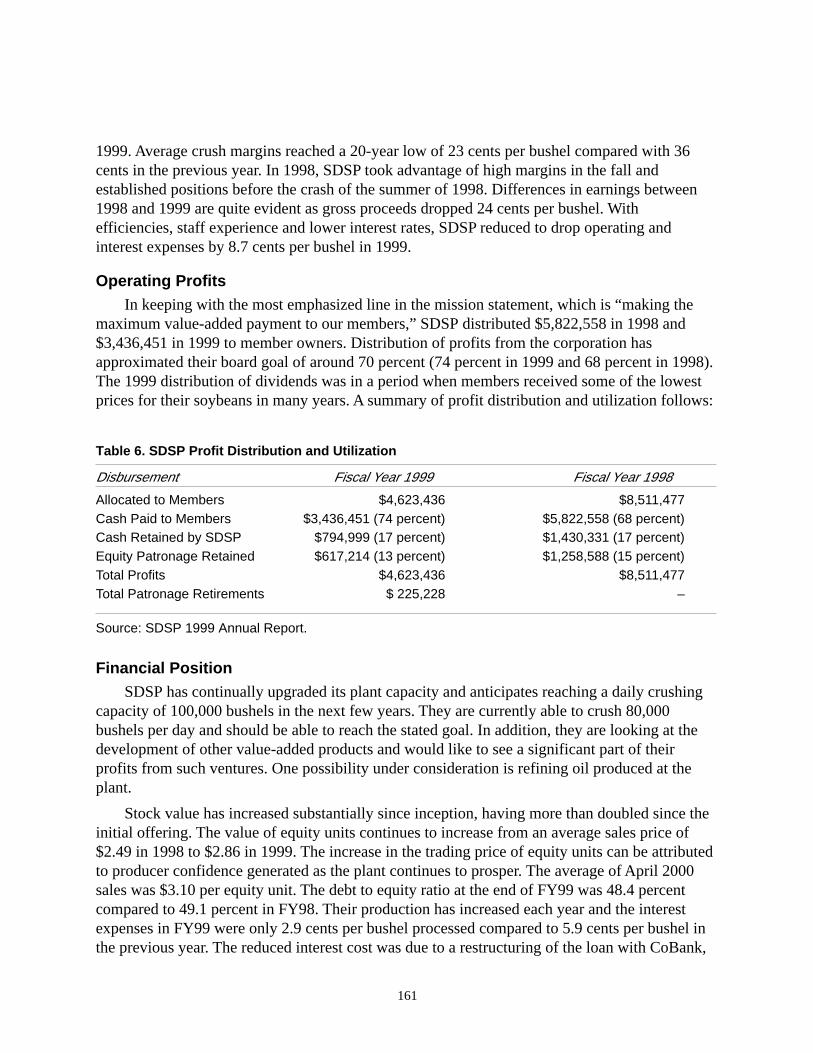
161
1999. Average crush margins reached a 20-year low of 23 cents per bushel compared with 36cents in the previous year. In 1998, SDSP took advantage of high margins in the fall andestablished positions before the crash of the summer of 1998. Differences in earnings between1998 and 1999 are quite evident as gross proceeds dropped 24 cents per bushel. Withefficiencies, staff experience and lower interest rates, SDSP reduced to drop operating andinterest expenses by 8.7 cents per bushel in 1999.
Operating ProfitsIn keeping with the most emphasized line in the mission statement, which is “making the
maximum value-added payment to our members,” SDSP distributed $5,822,558 in 1998 and$3,436,451 in 1999 to member owners. Distribution of profits from the corporation hasapproximated their board goal of around 70 percent (74 percent in 1999 and 68 percent in 1998).The 1999 distribution of dividends was in a period when members received some of the lowestprices for their soybeans in many years. A summary of profit distribution and utilization follows:
Table 6. SDSP Profit Distribution and Utilization
Disbursement Fiscal Year 1999 Fiscal Year 1998
Allocated to Members $4,623,436 $8,511,477Cash Paid to Members $3,436,451 (74 percent) $5,822,558 (68 percent)Cash Retained by SDSP $794,999 (17 percent) $1,430,331 (17 percent)Equity Patronage Retained $617,214 (13 percent) $1,258,588 (15 percent)Total Profits $4,623,436 $8,511,477Total Patronage Retirements $ 225,228 –
Source: SDSP 1999 Annual Report.
Financial PositionSDSP has continually upgraded its plant capacity and anticipates reaching a daily crushing
capacity of 100,000 bushels in the next few years. They are currently able to crush 80,000bushels per day and should be able to reach the stated goal. In addition, they are looking at thedevelopment of other value-added products and would like to see a significant part of theirprofits from such ventures. One possibility under consideration is refining oil produced at theplant.
Stock value has increased substantially since inception, having more than doubled since theinitial offering. The value of equity units continues to increase from an average sales price of$2.49 in 1998 to $2.86 in 1999. The increase in the trading price of equity units can be attributedto producer confidence generated as the plant continues to prosper. The average of April 2000sales was $3.10 per equity unit. The debt to equity ratio at the end of FY99 was 48.4 percentcompared to 49.1 percent in FY98. Their production has increased each year and the interestexpenses in FY99 were only 2.9 cents per bushel processed compared to 5.9 cents per bushel inthe previous year. The reduced interest cost was due to a restructuring of the loan with CoBank,
162
(so that better use could be made of excess cash during the year) and because of lower interestrates.
Incentives Provided SDSPMost of the capital and drive for this facility have come from organizing farmers and
shareholders. The original feasibility study was funded by the South Dakota Soybean Researchand Promotion Council and an additional $1 million low interest loan was obtained for theproject. A .5 million low interest rate loan was obtained for railroad spur and service andBrookings County agreed to phase in the property taxes over a five-year period.
Problems EncounteredThe creation of SDSP has demonstrated that it is possible for U.S. agricultural producers to
participate in and find success in value-added agriculture. It has also shown that it is possible forsuch an operation to compete successfully in an enterprise formerly dominated exclusively bylarge enterprises. The playing field, however, isn’t always level as has been experienced bySDSP. The core leadership needs innovative thinking and managerial skills outside theircompetencies. They must be able to see through feasibility studies by individuals or corporationsthey might work with who might work for the demise of the project. For example, two of thenations’ major soybean processors have shut down part of their capacity at this time and thiscould be a discouraging factor to farmers wanting to set up a value-added operation.
Value-added cooperatives must learn to cut the “red tape” that is a part of the requirementsfor funding availability of essential government programs and if SDSP decides to expand intoanother major project, they may need to raise additional capital to meet restrictions of such loanprograms. Railroad rates established by the Burlington Northern Santa Fe (BNSF) have beenunfavorable to SDSP. Rates established by BNSF apparently are market-based and as such,represent a greater cost for shipping meal exists for SDSP than for a similar product shippedfrom locations that are a greater distance than Volga. For example a shipper from Council Bluffsships meal to Sweet Grass, Montana for $1.38 per mile and SDSP pays $2.12 for only two-thirdsof the distance. This difference in rail cost gives the appearance that the rates established by theBNSF are based on the delivered price of meal rather than the actual cost of rail distance.
In addition, the Chicago Board of Trade has implemented changes that single out and targetSDSP while not affecting the other 40 delivery locations. The anti-competitive and nearmonopolistic practices of industry giants must be considered and guarded against in SDSP andother value-added operations.
Some of the hurdles that had to be crossed included finding a reasonable site with anadequate water supply, soil capable of supporting major structures, economical utilities (gas andelectricity), highway and rail access and availability of an air quality permit. Each of these stepstook considerable time and study by board members who led the drive.
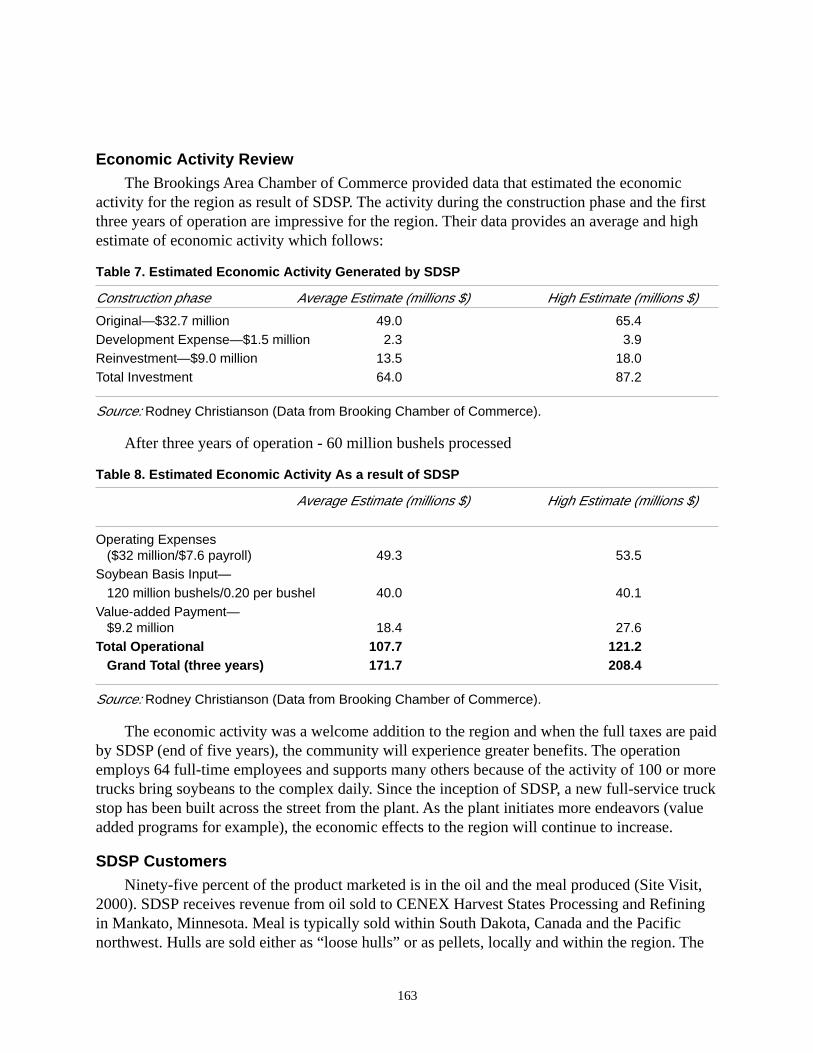
163
Economic Activity ReviewThe Brookings Area Chamber of Commerce provided data that estimated the economic
activity for the region as result of SDSP. The activity during the construction phase and the firstthree years of operation are impressive for the region. Their data provides an average and highestimate of economic activity which follows:
Table 7. Estimated Economic Activity Generated by SDSP
Construction phase Average Estimate (millions $) High Estimate (millions $)
Original—$32.7 million 49.0 65.4Development Expense—$1.5 million 2.3 3.9Reinvestment—$9.0 million 13.5 18.0Total Investment 64.0 87.2
Source: Rodney Christianson (Data from Brooking Chamber of Commerce).
After three years of operation - 60 million bushels processed
Table 8. Estimated Economic Activity As a result of SDSP
Average Estimate (millions $) High Estimate (millions $)
Operating Expenses ($32 million/$7.6 payroll) 49.3 53.5Soybean Basis Input— 120 million bushels/0.20 per bushel 40.0 40.1Value-added Payment— $9.2 million 18.4 27.6Total Operational 107.7 121.2 Grand Total (three years) 171.7 208.4
Source: Rodney Christianson (Data from Brooking Chamber of Commerce).
The economic activity was a welcome addition to the region and when the full taxes are paidby SDSP (end of five years), the community will experience greater benefits. The operationemploys 64 full-time employees and supports many others because of the activity of 100 or moretrucks bring soybeans to the complex daily. Since the inception of SDSP, a new full-service truckstop has been built across the street from the plant. As the plant initiates more endeavors (valueadded programs for example), the economic effects to the region will continue to increase.
SDSP CustomersNinety-five percent of the product marketed is in the oil and the meal produced (Site Visit,
2000). SDSP receives revenue from oil sold to CENEX Harvest States Processing and Refiningin Mankato, Minnesota. Meal is typically sold within South Dakota, Canada and the Pacificnorthwest. Hulls are sold either as “loose hulls” or as pellets, locally and within the region. The
164
South Dakota Hutterite communities have major livestock operations and are major purchasersof hulls and meal.
Summary and Lessons LearnedSDSP has been in operation since late 1996. Initial formation steps were taken in 1992
(Feasibility study), followed by a producer group’s interest in developing the idea in 1993, andby ground breaking in 1995. This was the nation’s first soybean crushing plant built since 1978.The producer’s group acted as incorporators and served as the initial SDSP board of directors.They updated the feasibility study, planned the building and operation of the processing plant,circulated a prospectus and offered stock to potential investors in South Dakota and Minnesota.
In November of 1993, the State of South Dakota granted cooperative status to SDSP. Theplant capacity has continually increased and proven to be profitable. This is true even in aperiod of very low soybean prices and narrow crush margins. The cooperative is a “newgeneration” cooperative owned by more than 2100 farm families from South Dakota,Minnesota, Iowa and North Dakota. The cooperative goals of adding value to members’soybeans, maintaining a financially strong business, and providing a major return of revenue tomember owners has been realized. In addition to crushing and processing soybeans into meal,oil and hulls, SDSP has been able to move a step closer to the consumer business by apartnership with Urethane Soy Systems. Inc., a manufacturer of SoyOyl™. Following thecompletion of SDSP’s third operational year (August, 1999) the cooperative had achieved thefollowing.
1. Added value to 60 million bushels of producers’ soybeans.
2. Generated between $175 and $208 million of economic activity in the region.
3. Returned $9.2 million in cash patronage to members.
4. Raised more than $21 million from farm families to build the business.
5. Committed or reinvested more than $20 million of additional capital into the business.
6. Reduced the basis for soybeans sold by farmers by about 25 cents per bushel, by thepresence of SDSP in the region, thus improving the income of both members and non-members.
Many lessons have been learned from the experiences of this new generation cooperative.The current board president and other soybean producers had a vision of creating a new, farmer-owned soybean processing facility. They were able to obtain good information through afeasibility study. By learning the mechanics of the business, they directed the creation of thecooperative. Farmer members conceived the idea and had the dedication and desire to committhe work that convinced other farmers (2,100 others) that this was a good idea and wouldenable producers to succeed in value added processing. By so doing, they could capture a largershare of the food dollar for the commodities grown. The success of this venture was possiblebecause the leaders were totally dedicated to the project and gave freely of their time and otherresources to make the idea a reality. The task was made somewhat easier, especially with the
165
Minnesota members, because Minnesota producers had already experienced success in value-added processing. The SDSP board recognized the value of a professional manager in thebusiness and had the foresight to select a CEO with experience in the field and was able toprovide additional guidance to grow the company. Board members continue to play a vital role inthe company through their regular meetings and activity on four major committees that provideguidance to the CEO and full board. Board members receive pay for their services and continueto grow in their ideas and service to the company.
Because of their experience in the formation and operation of the cooperative, boardmembers (or implementors of value-added cooperatives) have become very knowledgeable aboutthe business and continue to make substantial contributions to the business. For producers tocreate a value-added processing operation their leadership must be totally dedicated and bewilling to give freely of their time to the project. They must learn a new way of thinking andlearn new skills and business principles. The tasks that must be accomplished by such a groupare:
• Have a vision and visualize what is needed.
• Develop a feasibility study that predicts the potential success of the operation.
• From the feasibility study, create a prospectus that can be used to convince others thatthey should be a part of this venture.
• Create a business plan that can be used for acquiring capital to run the business.
• Create a capital formation plan, learn to understand the security laws of the state andconform to them.
• Be able to understand the steps necessary to obtain the necessary permits and documentsneeded for funding at the local, state and Federal (in the case of a USDA loan guarantee)levels.
• Develop an organizational structure for the cooperative that enables a diverse group ofowners to function in an orderly and decisive manner.
• Be ready to hire professional help (management for example) as needed to have the skillneeded for such an operation, and
• Be able to attract a sufficient number of producer members to provide both the capitaland the commodity to be processed for the operation.
• Networking between farmer-owned, value-added cooperatives becomes a necessity ifproducers plan to obtain a greater portion of the processors profit. The logical place forgroups interested in creating value-added cooperatives to seek help is throughcooperatives who have experienced success in the process (such as SDSP who hasindicated a willingness to consult with such groups). Producers should be willing to paysuccessful cooperatives for assistance with feasibility studies, operational techniques andmanagement assistance.
166
Growing such a business is a difficult, time-consuming task that has many potential pitfallsbut, as the members of SDSP have discovered, when successful it provides a great deal ofpersonal and financial satisfaction.
References
AGRIS automated software system. Available online: <www.agris.com>.
Christianson, Rodney. 2000. CEO, SDSP. Site visit and personal conversation, Volga, SouthDakota, May.
Christianson, Rodney. CEO, SDSP. Prepared Testimony to the House Committee on SmallBusiness: Helping Agricultural Producers “Re-Grow” Rural America, Volga, South Dakota.
Hope, Marvin . 2000. SDSP Board Vice Chairman, site visit and personal conversation, Volga,Minnesota, May.
South Dakota Soybean Processors. 1994. Confidential Offering Circular. May.
South Dakota Soybean Processors (SDSP). 1998 Annual Report.
South Dakota Soybean Processors (SDSP). 1999 Annual Report.
South Dakota Soybean Processors Bean Stock. 2000. A publication for members, customers andassociates of SDSP. Volume 3, Number 5, May.
SDSP News Release. Cooperative Announces New Venture. Dec. 1999. Available online:<www.brookings.net/sdsp/pr-soyoyl.html>.
SDSP Web site. Available online: <www.brookings.net/sdsp/>.
USDA, ERS OIL CROPS Situation and Outlook Yearbook. OCS-1997, Oct. 1997.
USDA Economics and Statistics System. 1998. Oil Crops Yearbook. Available online: <gopher://usda.mannlib.cornell.edu:70/11/data-sets/crops/89002>
U.S. Department of Commerce. 1998. Estimates of the Population of Counties. Washington, DC:U.S. Bureau of the Census, Population Estimates Program, Population Division. InternetAvailable online: <www.census.gov/population/estimates/county/co-97-1/97C1_46.txt>Release date: March 17, 1998.
Van Dyne, Donald L., and Melvin G. Blase. 1998. Marketing Implications of BiotechnologicallyEngineered, Identity-Preserved Soybeans in the Corn Belt. Final report presented to theFederal-State Market Improvement Program, USDA and the Missouri Department ofAgriculture, Market Development Division. July.
Zeuli, Kim, Gary Goreham, and Evert van der Sluis. 1998. South Dakota Soybean Processors. Areport for the USDA Fund for Rural America.
167
Iowa Turkey Growers Cooperative and West Liberty Foods
by Mary Swalla Holmes and Daniel Curry
The last thing any Iowa turkey grower wanted to do in 1996 was invest in a packing plant.Not one of them was looking forward to sitting on the board of a multimillion dollar business,negotiating deals with top food companies. As the food chain shortened and the turkey industryintegrated, however, choices became limited. When faced with one of the toughest decisions oftheir lives, the growers chose to remain independent by forming a cooperative. Forty-five Iowaturkey growers took the future into their hands, persevered through low prices and hard times,and came out on top. This is the story of the Iowa Turkey Growers Cooperative and West LibertyFoods.
Plant ClosingThe bad news hit in April 1996. Through a series of mergers in the quickly consolidating
poultry industry, the family-owned Louis Rich turkey processing plant in West Liberty, Iowa, hadbecome a subsidiary of Kraft foods, owned by Philip Morris. Kraft reviewed its holdings anddetermined two poultry plants were operating at half of their capacity. To increase efficiency, oneplant would shut down and one would gear up to full capacity. One plant was in South Carolina,the other in West Liberty, Iowa. The supply of turkeys in Iowa came from many individualproducers with medium-size operations. In South Carolina, consolidation of the poultry industrywas already well underway. Within miles of the plant, one or two contract growers could expandto meet the new demand. Even though the West Liberty processing plant had a stable, highlytrained workforce that manufactured consistently high-quality products, the disperse supply wasseen as a limiting factor to full-scale production. The decision was made to close theWest Liberty plant in six months.
Decisions to MakeIowa turkey growers were faced with the loss of their biggest and best market if the
processing plant in West Liberty closed. In addition, a feed mill in Ellsworth, Iowa, used bymany of the growers and owned by Kraft, would close, negatively affecting the input side ofturkey production. The West Liberty plant processed about half of the seven million turkeysproduced in Iowa in 1996. Iowa turkey producers grew birds under several differentarrangements, some on contract, some independently. The plant closing would affect everyproducer, as the local supply would far outstrip the processing capacity of the other two poultryplants in Iowa.
One of the top growers, an influential agri-businessman from Story City, Iowa, sold half ofthe 200,000 turkeys he produced annually to the West Liberty plant and half to another Iowaplant, BilMar (Sara Lee Corporation). To this grower, the idea of buying the plant was notappealing. He had been down that road before. In 1975, he and several other growers hadpurchased a plant in Storm Lake, Iowa, when it was in danger of closing. Two years later, thatplant closed and the producers involved lost millions of dollars. The pain of that failure was stillevident in early discussions of what to do about the imminent closing of the West Liberty plant.
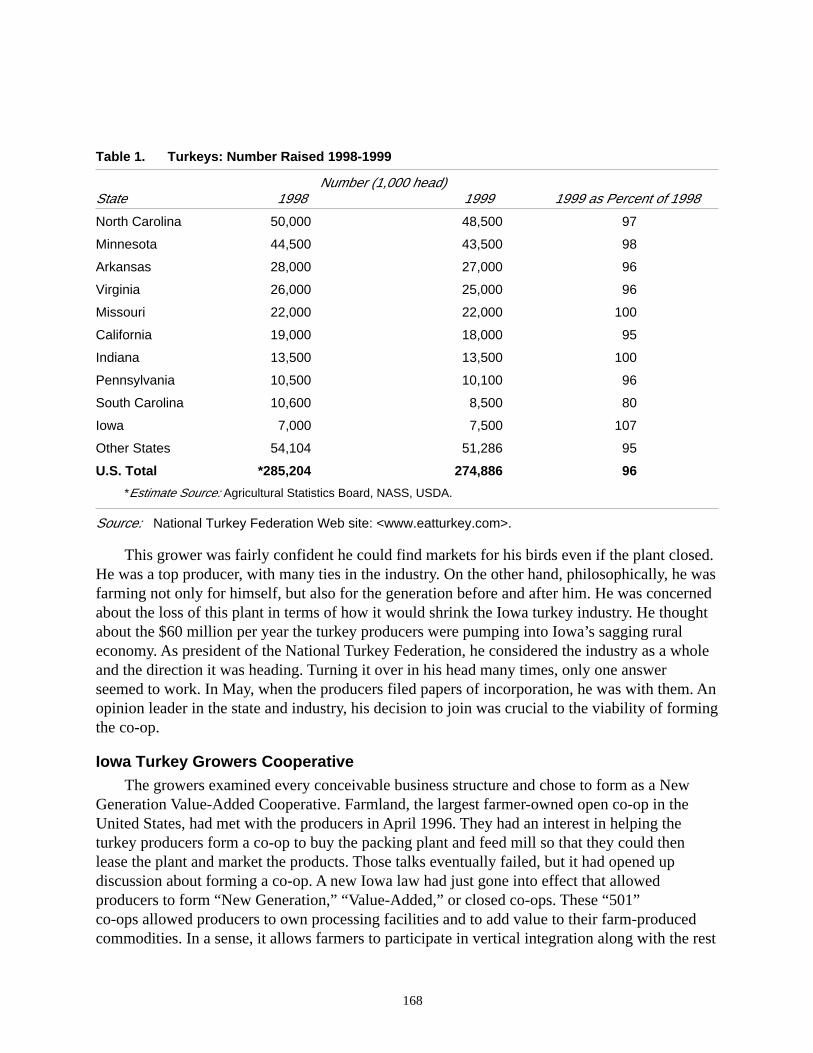
168
Table 1. Turkeys: Number Raised 1998-1999
Number (1,000 head)State 1998 1999 1999 as Percent of 1998
North Carolina 50,000 48,500 97
Minnesota 44,500 43,500 98
Arkansas 28,000 27,000 96
Virginia 26,000 25,000 96
Missouri 22,000 22,000 100
California 19,000 18,000 95
Indiana 13,500 13,500 100
Pennsylvania 10,500 10,100 96
South Carolina 10,600 8,500 80
Iowa 7,000 7,500 107
Other States 54,104 51,286 95
U.S. Total *285,204 274,886 96
*Estimate Source: Agricultural Statistics Board, NASS, USDA.
Source: National Turkey Federation Web site: <www.eatturkey.com>.
This grower was fairly confident he could find markets for his birds even if the plant closed.He was a top producer, with many ties in the industry. On the other hand, philosophically, he wasfarming not only for himself, but also for the generation before and after him. He was concernedabout the loss of this plant in terms of how it would shrink the Iowa turkey industry. He thoughtabout the $60 million per year the turkey producers were pumping into Iowa’s sagging ruraleconomy. As president of the National Turkey Federation, he considered the industry as a wholeand the direction it was heading. Turning it over in his head many times, only one answerseemed to work. In May, when the producers filed papers of incorporation, he was with them. Anopinion leader in the state and industry, his decision to join was crucial to the viability of formingthe co-op.
Iowa Turkey Growers CooperativeThe growers examined every conceivable business structure and chose to form as a New
Generation Value-Added Cooperative. Farmland, the largest farmer-owned open co-op in theUnited States, had met with the producers in April 1996. They had an interest in helping theturkey producers form a co-op to buy the packing plant and feed mill so that they could thenlease the plant and market the products. Those talks eventually failed, but it had opened updiscussion about forming a co-op. A new Iowa law had just gone into effect that allowedproducers to form “New Generation,” “Value-Added,” or closed co-ops. These “501”co-ops allowed producers to own processing facilities and to add value to their farm-producedcommodities. In a sense, it allows farmers to participate in vertical integration along with the rest
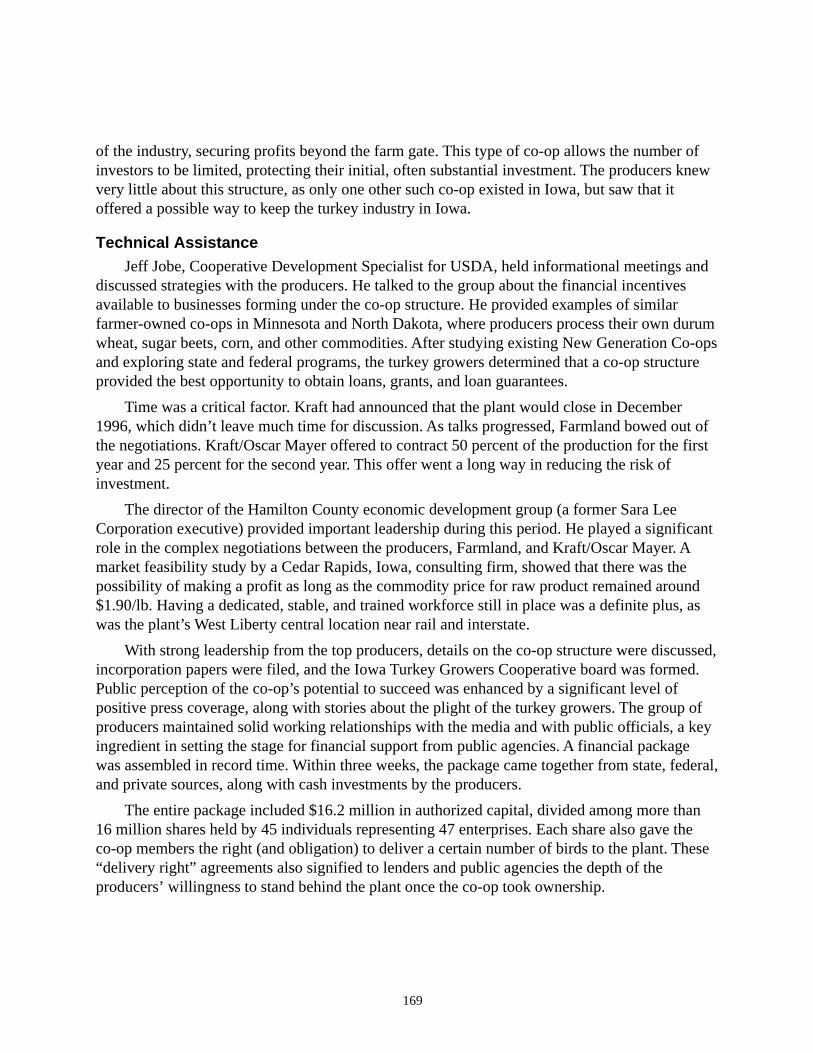
169
of the industry, securing profits beyond the farm gate. This type of co-op allows the number ofinvestors to be limited, protecting their initial, often substantial investment. The producers knewvery little about this structure, as only one other such co-op existed in Iowa, but saw that itoffered a possible way to keep the turkey industry in Iowa.
Technical AssistanceJeff Jobe, Cooperative Development Specialist for USDA, held informational meetings and
discussed strategies with the producers. He talked to the group about the financial incentivesavailable to businesses forming under the co-op structure. He provided examples of similarfarmer-owned co-ops in Minnesota and North Dakota, where producers process their own durumwheat, sugar beets, corn, and other commodities. After studying existing New Generation Co-opsand exploring state and federal programs, the turkey growers determined that a co-op structureprovided the best opportunity to obtain loans, grants, and loan guarantees.
Time was a critical factor. Kraft had announced that the plant would close in December1996, which didn’t leave much time for discussion. As talks progressed, Farmland bowed out ofthe negotiations. Kraft/Oscar Mayer offered to contract 50 percent of the production for the firstyear and 25 percent for the second year. This offer went a long way in reducing the risk ofinvestment.
The director of the Hamilton County economic development group (a former Sara LeeCorporation executive) provided important leadership during this period. He played a significantrole in the complex negotiations between the producers, Farmland, and Kraft/Oscar Mayer. Amarket feasibility study by a Cedar Rapids, Iowa, consulting firm, showed that there was thepossibility of making a profit as long as the commodity price for raw product remained around$1.90/lb. Having a dedicated, stable, and trained workforce still in place was a definite plus, aswas the plant’s West Liberty central location near rail and interstate.
With strong leadership from the top producers, details on the co-op structure were discussed,incorporation papers were filed, and the Iowa Turkey Growers Cooperative board was formed.Public perception of the co-op’s potential to succeed was enhanced by a significant level ofpositive press coverage, along with stories about the plight of the turkey growers. The group ofproducers maintained solid working relationships with the media and with public officials, a keyingredient in setting the stage for financial support from public agencies. A financial packagewas assembled in record time. Within three weeks, the package came together from state, federal,and private sources, along with cash investments by the producers.
The entire package included $16.2 million in authorized capital, divided among more than16 million shares held by 45 individuals representing 47 enterprises. Each share also gave theco-op members the right (and obligation) to deliver a certain number of birds to the plant. These“delivery right” agreements also signified to lenders and public agencies the depth of theproducers’ willingness to stand behind the plant once the co-op took ownership.
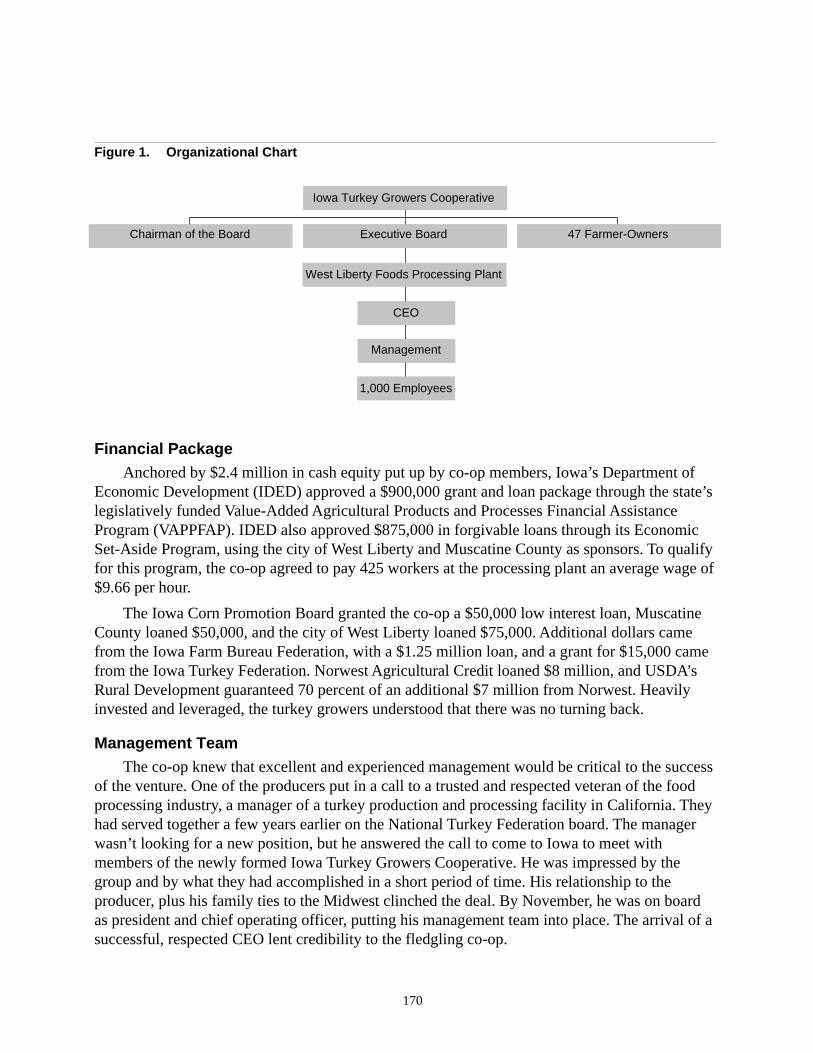
170
Financial PackageAnchored by $2.4 million in cash equity put up by co-op members, Iowa’s Department of
Economic Development (IDED) approved a $900,000 grant and loan package through the state’slegislatively funded Value-Added Agricultural Products and Processes Financial AssistanceProgram (VAPPFAP). IDED also approved $875,000 in forgivable loans through its EconomicSet-Aside Program, using the city of West Liberty and Muscatine County as sponsors. To qualifyfor this program, the co-op agreed to pay 425 workers at the processing plant an average wage of$9.66 per hour.
The Iowa Corn Promotion Board granted the co-op a $50,000 low interest loan, MuscatineCounty loaned $50,000, and the city of West Liberty loaned $75,000. Additional dollars camefrom the Iowa Farm Bureau Federation, with a $1.25 million loan, and a grant for $15,000 camefrom the Iowa Turkey Federation. Norwest Agricultural Credit loaned $8 million, and USDA’sRural Development guaranteed 70 percent of an additional $7 million from Norwest. Heavilyinvested and leveraged, the turkey growers understood that there was no turning back.
Management TeamThe co-op knew that excellent and experienced management would be critical to the success
of the venture. One of the producers put in a call to a trusted and respected veteran of the foodprocessing industry, a manager of a turkey production and processing facility in California. Theyhad served together a few years earlier on the National Turkey Federation board. The managerwasn’t looking for a new position, but he answered the call to come to Iowa to meet withmembers of the newly formed Iowa Turkey Growers Cooperative. He was impressed by thegroup and by what they had accomplished in a short period of time. His relationship to theproducer, plus his family ties to the Midwest clinched the deal. By November, he was on boardas president and chief operating officer, putting his management team into place. The arrival of asuccessful, respected CEO lent credibility to the fledgling co-op.
Figure 1. Organizational Chart
Iowa Turkey Growers Cooperative
Chairman of the Board Executive Board 47 Farmer-Owners
West Liberty Foods Processing Plant
CEO
Management
1,000 Employees
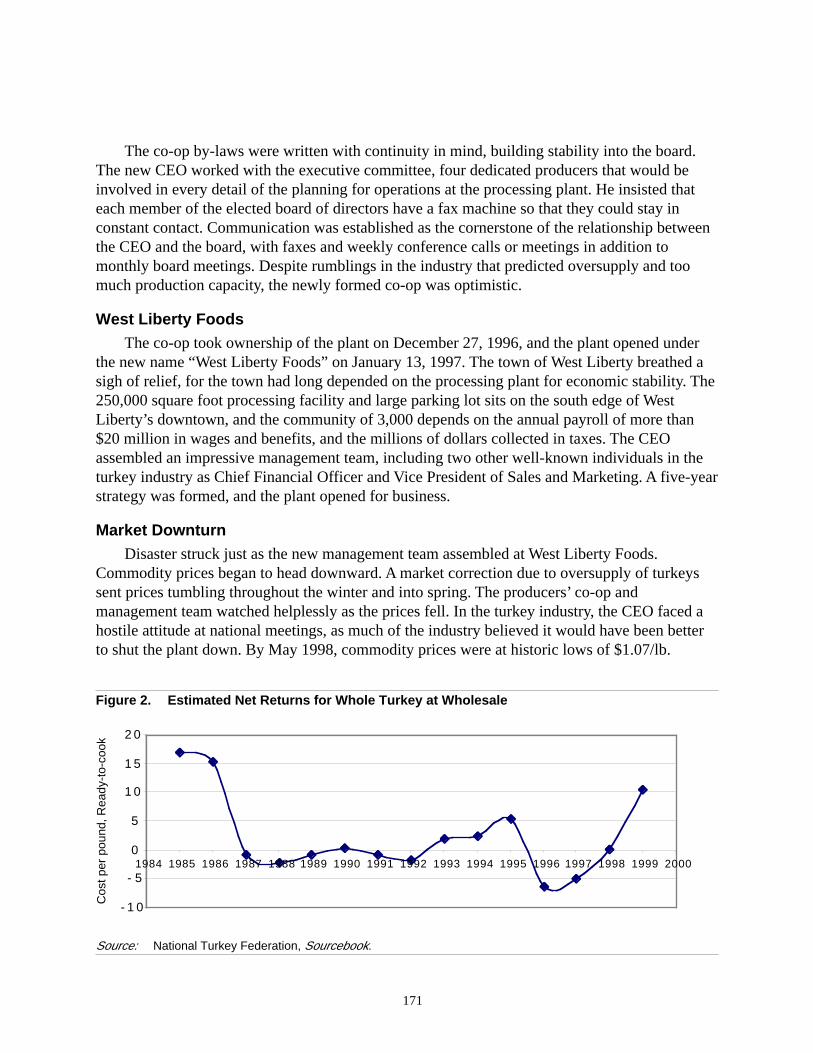
171
The co-op by-laws were written with continuity in mind, building stability into the board.The new CEO worked with the executive committee, four dedicated producers that would beinvolved in every detail of the planning for operations at the processing plant. He insisted thateach member of the elected board of directors have a fax machine so that they could stay inconstant contact. Communication was established as the cornerstone of the relationship betweenthe CEO and the board, with faxes and weekly conference calls or meetings in addition tomonthly board meetings. Despite rumblings in the industry that predicted oversupply and toomuch production capacity, the newly formed co-op was optimistic.
West Liberty FoodsThe co-op took ownership of the plant on December 27, 1996, and the plant opened under
the new name “West Liberty Foods” on January 13, 1997. The town of West Liberty breathed asigh of relief, for the town had long depended on the processing plant for economic stability. The250,000 square foot processing facility and large parking lot sits on the south edge of WestLiberty’s downtown, and the community of 3,000 depends on the annual payroll of more than$20 million in wages and benefits, and the millions of dollars collected in taxes. The CEOassembled an impressive management team, including two other well-known individuals in theturkey industry as Chief Financial Officer and Vice President of Sales and Marketing. A five-yearstrategy was formed, and the plant opened for business.
Market DownturnDisaster struck just as the new management team assembled at West Liberty Foods.
Commodity prices began to head downward. A market correction due to oversupply of turkeyssent prices tumbling throughout the winter and into spring. The producers’ co-op andmanagement team watched helplessly as the prices fell. In the turkey industry, the CEO faced ahostile attitude at national meetings, as much of the industry believed it would have been betterto shut the plant down. By May 1998, commodity prices were at historic lows of $1.07/lb.
Figure 2. Estimated Net Returns for Whole Turkey at Wholesale
Source: National Turkey Federation, Sourcebook.
- 1 0
- 5
0
5
1 0
1 5
2 0
1984 1985 1986 1987 1988 1989 1990 1991 1992 1993 1994 1995 1996 1997 1998 1999 2000
Cos
t per
pou
nd, R
eady
-to-
cook
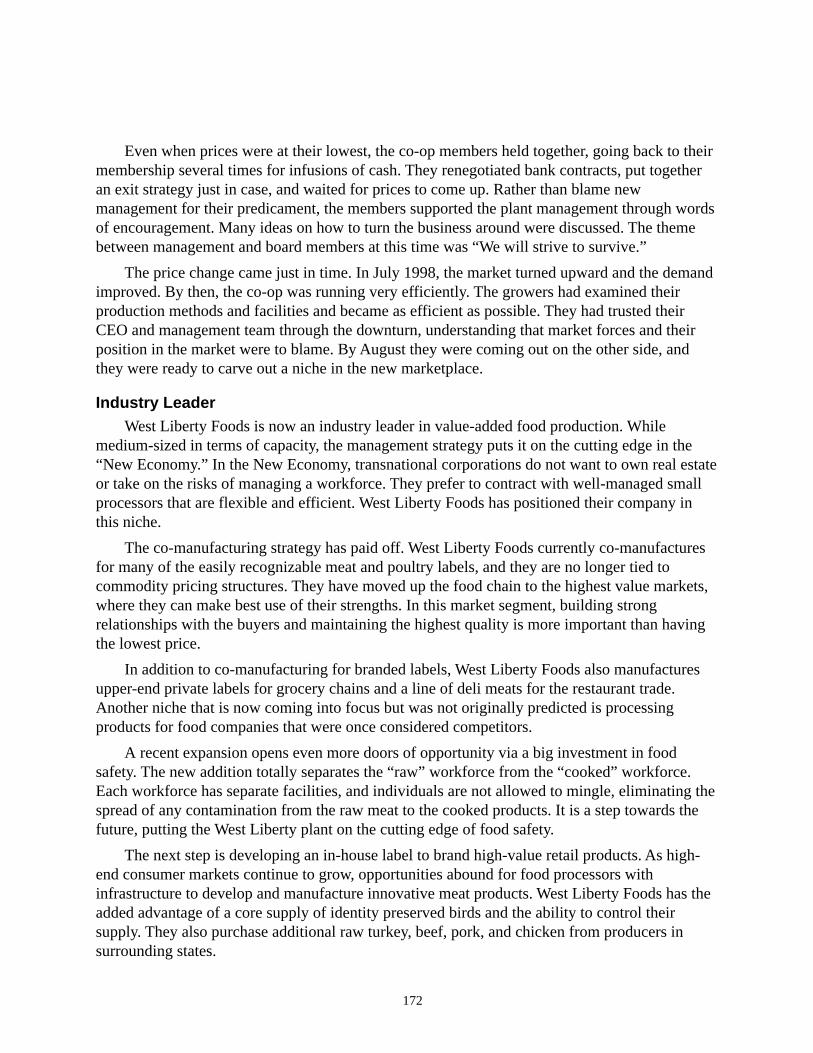
172
Even when prices were at their lowest, the co-op members held together, going back to theirmembership several times for infusions of cash. They renegotiated bank contracts, put togetheran exit strategy just in case, and waited for prices to come up. Rather than blame newmanagement for their predicament, the members supported the plant management through wordsof encouragement. Many ideas on how to turn the business around were discussed. The themebetween management and board members at this time was “We will strive to survive.”
The price change came just in time. In July 1998, the market turned upward and the demandimproved. By then, the co-op was running very efficiently. The growers had examined theirproduction methods and facilities and became as efficient as possible. They had trusted theirCEO and management team through the downturn, understanding that market forces and theirposition in the market were to blame. By August they were coming out on the other side, andthey were ready to carve out a niche in the new marketplace.
Industry LeaderWest Liberty Foods is now an industry leader in value-added food production. While
medium-sized in terms of capacity, the management strategy puts it on the cutting edge in the“New Economy.” In the New Economy, transnational corporations do not want to own real estateor take on the risks of managing a workforce. They prefer to contract with well-managed smallprocessors that are flexible and efficient. West Liberty Foods has positioned their company inthis niche.
The co-manufacturing strategy has paid off. West Liberty Foods currently co-manufacturesfor many of the easily recognizable meat and poultry labels, and they are no longer tied tocommodity pricing structures. They have moved up the food chain to the highest value markets,where they can make best use of their strengths. In this market segment, building strongrelationships with the buyers and maintaining the highest quality is more important than havingthe lowest price.
In addition to co-manufacturing for branded labels, West Liberty Foods also manufacturesupper-end private labels for grocery chains and a line of deli meats for the restaurant trade.Another niche that is now coming into focus but was not originally predicted is processingproducts for food companies that were once considered competitors.
A recent expansion opens even more doors of opportunity via a big investment in foodsafety. The new addition totally separates the “raw” workforce from the “cooked” workforce.Each workforce has separate facilities, and individuals are not allowed to mingle, eliminating thespread of any contamination from the raw meat to the cooked products. It is a step towards thefuture, putting the West Liberty plant on the cutting edge of food safety.
The next step is developing an in-house label to brand high-value retail products. As high-end consumer markets continue to grow, opportunities abound for food processors withinfrastructure to develop and manufacture innovative meat products. West Liberty Foods has theadded advantage of a core supply of identity preserved birds and the ability to control theirsupply. They also purchase additional raw turkey, beef, pork, and chicken from producers insurrounding states.
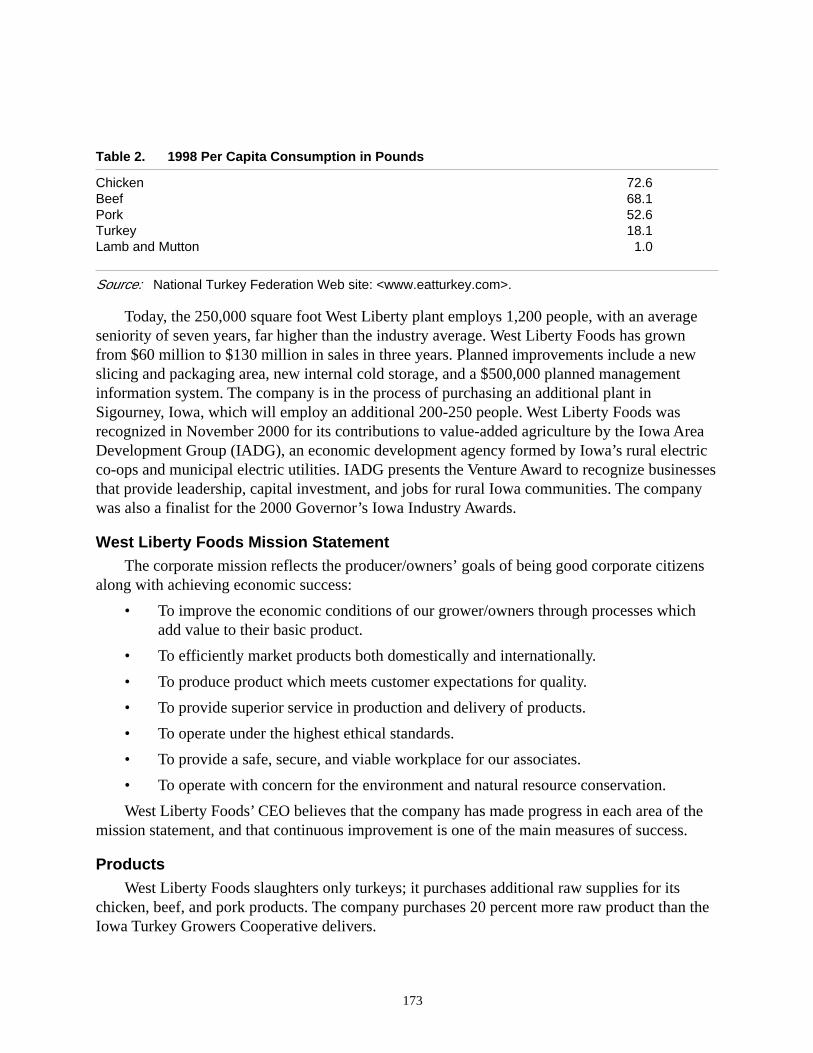
173
Table 2. 1998 Per Capita Consumption in Pounds
Chicken 72.6Beef 68.1Pork 52.6Turkey 18.1Lamb and Mutton 1.0
Source: National Turkey Federation Web site: <www.eatturkey.com>.
Today, the 250,000 square foot West Liberty plant employs 1,200 people, with an averageseniority of seven years, far higher than the industry average. West Liberty Foods has grownfrom $60 million to $130 million in sales in three years. Planned improvements include a newslicing and packaging area, new internal cold storage, and a $500,000 planned managementinformation system. The company is in the process of purchasing an additional plant inSigourney, Iowa, which will employ an additional 200-250 people. West Liberty Foods wasrecognized in November 2000 for its contributions to value-added agriculture by the Iowa AreaDevelopment Group (IADG), an economic development agency formed by Iowa’s rural electricco-ops and municipal electric utilities. IADG presents the Venture Award to recognize businessesthat provide leadership, capital investment, and jobs for rural Iowa communities. The companywas also a finalist for the 2000 Governor’s Iowa Industry Awards.
West Liberty Foods Mission StatementThe corporate mission reflects the producer/owners’ goals of being good corporate citizens
along with achieving economic success:
• To improve the economic conditions of our grower/owners through processes whichadd value to their basic product.
• To efficiently market products both domestically and internationally.
• To produce product which meets customer expectations for quality.
• To provide superior service in production and delivery of products.
• To operate under the highest ethical standards.
• To provide a safe, secure, and viable workplace for our associates.
• To operate with concern for the environment and natural resource conservation.
West Liberty Foods’ CEO believes that the company has made progress in each area of themission statement, and that continuous improvement is one of the main measures of success.
ProductsWest Liberty Foods slaughters only turkeys; it purchases additional raw supplies for its
chicken, beef, and pork products. The company purchases 20 percent more raw product than theIowa Turkey Growers Cooperative delivers.
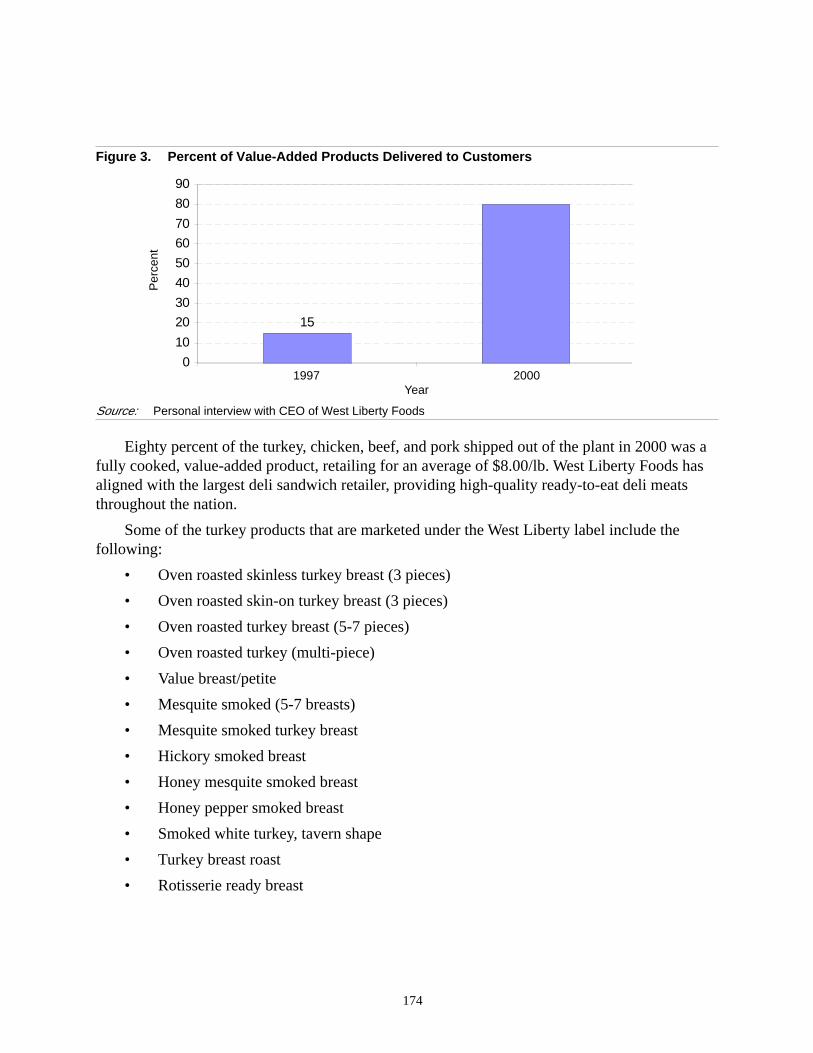
174
Figure 3. Percent of Value-Added Products Delivered to Customers
1997 2000Year
Source: Personal interview with CEO of West Liberty Foods
Eighty percent of the turkey, chicken, beef, and pork shipped out of the plant in 2000 was afully cooked, value-added product, retailing for an average of $8.00/lb. West Liberty Foods hasaligned with the largest deli sandwich retailer, providing high-quality ready-to-eat deli meatsthroughout the nation.
Some of the turkey products that are marketed under the West Liberty label include thefollowing:
• Oven roasted skinless turkey breast (3 pieces)
• Oven roasted skin-on turkey breast (3 pieces)
• Oven roasted turkey breast (5-7 pieces)
• Oven roasted turkey (multi-piece)
• Value breast/petite
• Mesquite smoked (5-7 breasts)
• Mesquite smoked turkey breast
• Hickory smoked breast
• Honey mesquite smoked breast
• Honey pepper smoked breast
• Smoked white turkey, tavern shape
• Turkey breast roast
• Rotisserie ready breast
15
0
10
20
30
40
50
60
70
80
90
Per
cent
175
Highlights of a Successful New Generation CooperativeLooking back on a business that has struggled and prevailed provides insight on
successful strategies that can be passed on to others. Seven conditions contributed to the successof this co-op.
First, the members were totally committed to the success of the co-op. Members knewwhen entering into the venture that their very livelihood as farmers depended upon the success ofthe co-op. They had leveraged part of their farming operations by joining, and they would dowhatever it took to make it succeed. Second, there has been no change in leadership on theboard since the beginning. The directors of the board also have remained in place, allowing plantmanagement to have consistent leadership through the tough times as well as the good times. Theco-op members believe while they are still a relatively new operation is not the time to rotateofficers on the board.
Third, the best management team possible was hired and given time to develop a businessstrategy. As past president of the National Turkey Federation, the CEO had the networkexperience to connect West Liberty Foods with the right people. As past president of twodifferent turkey-processing companies, he also had the experience to run West Liberty Foods.The Vice-President of Sales and Marketing was hired as an experienced marketing leader from agrowing food company. The past experience of these and other management team members havehelped to carry this fledgling plant into a market leader.
Fourth, the co-op members had the ability to withstand a low price cycle of their finishedproducts. Taking over ownership of a processing plant during a low price cycle was both a curseand a blessing. The curse was that the co-op barely survived, but the blessing is that the turkeygrowers learned to raise turkeys more efficiently, and to trust each other.
Fifth, the plant had a well-trained and experienced workforce already in place. In order toprove to customers that they could produce a quality product on a consistent basis, the plantneeded the skill of every employee in the plant. This skill was transferred to the customer in theform of trust. The employees are dedicated to producing the highest quality product in theindustry.
Sixth, there was open and constant communication between management and boardmembers. Management dealt with their fear of failure by constantly communicating with allprinciples of the organization, including the lenders and USDA officials.
Seventh, there was good timing in the marketplace. The low price “drought” changed thestructure of the turkey processing industry. Two other plants in the U.S. either closed or changedto processing something other than turkey. Once the low prices turned around, it was soon evident thatthere was not enough turkey processing plants in the U.S. to supply all of the demand; therefore,customers were willing to inquire and sign contracts with West Liberty Foods.
176
Strategy of a Successful Processing BusinessThe business within the co-op must have a marketing plan that will take the processing plant
from a “new kid on the block” status to an established, well-respected business. The managementof West Liberty Foods developed the strategy listed below before taking over the plant.Currently, they are in their fourth year of a five-year marketing plan.
• Become a co-manufacturer of high-end products—not commodity products. WestLiberty Foods would always hear the cry of “lower prices for my product” as long asthey sold into the commodity market. They determined from the start that if theircustomers were selling product at very high prices, then the customer was less likely torequest product at lower and lower prices.
• Process products for the upper-end private label brands. Major grocery chains nowbrand meats with their own label. They want only the highest quality meats to representtheir label. Again, this is targeting high-end products for their customers.
• Develop a market for the product before beginning processing. Even if it means hiringa co-manufacturer prior to a plant going on line, a demand must be developed for theproduct. Developing markets for the product is more important than building the plant.
• Discover niches in the market and develop a product line for this niche. Throughmarket research, West Liberty Foods has discovered market niches. Soon the companywill produce products for those niche markets.
• Align with nationally advertised retail shops and become their major supplier. Oftenretail shops demand a continuous supply of high-quality product. They also preferlong-lasting relationships.
• Produce more than one product to keep the customers loyal. The marketing departmentof West Liberty Foods has discovered that to keep customers loyal, they must provideother types of meat besides turkey; therefore, the company also provides beef, pork,and chicken products to their customers.
Model for the FutureThe Iowa Turkey Growers Cooperative and West Liberty Foods are a model for the new
agriculture that will lead the Midwest to rural prosperity. West Liberty Foods is positioned tocapture a significant percentage of the high-end specialty meat market, capitalizing on Iowa’sstrengths: a well-developed transportation infrastructure, a well-trained workforce, rich naturalresources, and abundant grain. Ultimately, value-added agriculture adds prosperity that will beshared among all of the producer/owners, and, in turn, it will be shared throughout thehometowns of the producers (See Table 3. Time Line on following page).
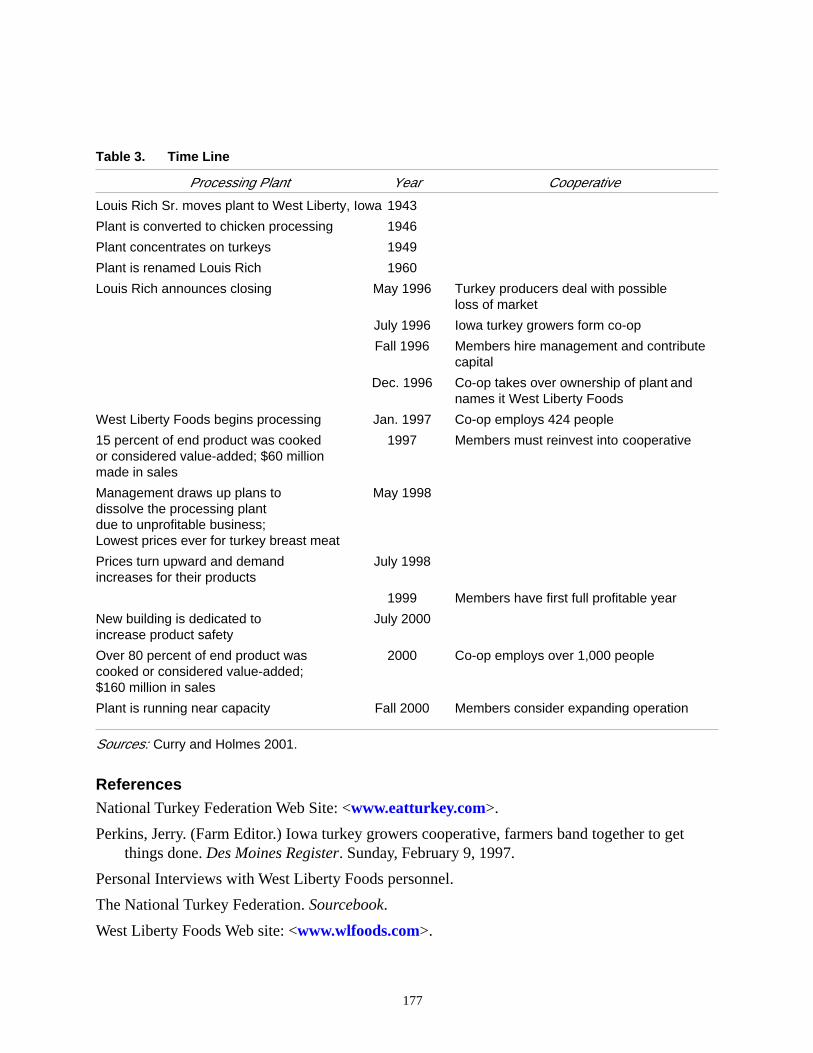
177
Table 3. Time Line
Processing Plant Year Cooperative
Louis Rich Sr. moves plant to West Liberty, Iowa 1943
Plant is converted to chicken processing 1946
Plant concentrates on turkeys 1949
Plant is renamed Louis Rich 1960
Louis Rich announces closing May 1996 Turkey producers deal with possibleloss of market
July 1996 Iowa turkey growers form co-op
Fall 1996 Members hire management and contributecapital
Dec. 1996 Co-op takes over ownership of plant andnames it West Liberty Foods
West Liberty Foods begins processing Jan. 1997 Co-op employs 424 people
15 percent of end product was cooked 1997 Members must reinvest into cooperativeor considered value-added; $60 millionmade in sales
Management draws up plans to May 1998dissolve the processing plantdue to unprofitable business;Lowest prices ever for turkey breast meat
Prices turn upward and demand July 1998increases for their products
1999 Members have first full profitable year
New building is dedicated to July 2000increase product safety
Over 80 percent of end product was 2000 Co-op employs over 1,000 peoplecooked or considered value-added;$160 million in sales
Plant is running near capacity Fall 2000 Members consider expanding operation
Sources: Curry and Holmes 2001.
ReferencesNational Turkey Federation Web Site: <www.eatturkey.com>.
Perkins, Jerry. (Farm Editor.) Iowa turkey growers cooperative, farmers band together to getthings done. Des Moines Register. Sunday, February 9, 1997.
Personal Interviews with West Liberty Foods personnel.
The National Turkey Federation. Sourcebook.
West Liberty Foods Web site: <www.wlfoods.com>.

179
Sunrise Energy Cooperative
by Rodney J. Fink
Abstract: Sunshine Energy Cooperative (SEC) is a farmer-owned co-op formed to add valueto its members’ commodities. The planned plant capacity is six million gallons of ethanolprepared from the purchase of approximately two million bushels of corn. Total by-productsproduced at maximum capacity are 40,000 tons of stillage and 5,000 tons of carbon dioxide(SEC 2000). The co-op was formed on May 30, 1995 (date of incorporation) and startedoperation on November 25, 1999. Operations through August 31, 1999, consisted primarily ofraising capital, obtaining additional debt and grant financing, designing and constructing theethanol grain processing facility, and performing administrative functions. The co-ops votingmembership is 228, and approximately 600 producers have corn delivery rights to the plant.
Background Information
Sunrise Energy Cooperative (SEC) (2000a) is located in Benton County in east-central Iowa,south of Blairstown, a community of approximately 672 people and approximately 290 families.Blairstown is west of Cedar Rapids, in a productive farming region close to the Amana Coloniesand 84 miles east of the Iowa state capital of Des Moines. The parent organization for SEC is theIowa Beef Cooperative. The original plan for the co-op was to operate an integrated business thatincluded the ethanol plant and a beef feedlot, which would use the stillage by-product of theethanol plant. Because of complications with the regulations regarding co-ops, two separateco-ops were formed, including the SEC (ethanol plant) and the Sunrise Benton Eastern IowaFarm Feeders (BEIFF). Both co-ops are adjacent to each other and share office space, scales, andother facilities.
SEC contracted with the Iowa Department of Natural Resources to develop an economicfeasibility study, computer model, and business plan for a hypothetical energy-producing farm.The information was designed to be a transferable resource for other producers and is availablefrom the Iowa Department of Natural Resources (Iowa Value-Added Resource Manual 2000).The hypothetical integrated energy farm comprises a variety of farming components thatcomplement and sustain each other.
An ethanol plant is the hub of the integrated energy farm, and it produces ethanol, heat,carbon dioxide, and animal feed. The heat is to be used in an aquaculture facility for raisingcommercial fish such as Tilapia. The carbon dioxide could be furnished to a commercialgreenhouse, and the high protein feed is fed to cattle. Methane could be captured from theanaerobic digestion of cattle manure and used as a supplemental source of energy for ethanol
The author would like to acknowledge the assistance of Greg Behounek (accountant), SteveThompson (shareholder), and other SEC employees. Their assistance is gratefully appreciated.
180
production. Digested manure can be sold or used on site to fertilize corn or cellulose feedstockfor ethanol production.
The integrated energy farm analysis model produced by SEC is a decisionmaking tool thatallows users to input financial data regarding corn to ethanol production, cattle feedlot operation,manure digestion and methane recovery, and aquaculture and greenhouse ventures. The model isa Microsoft Excel file called “Analysis Model for an Ethanol Plant” and is available on the IowaDepartment of Natural Resources Web site or as part of the Iowa Value-Added Resource Manual(2000). A model for a 40-million gallons per year plant is also available.
SEC currently has an ethanol plant, corn production (by member-owners), and a cattlefeedlot (a separate facility owned and operated by BEIFF). They plan to implement theaquaculture module within the next three years. The aquaculture facility, constructed at the site,may use waste heat captured from the ethanol plant to maintain the incoming water temperatureat a level sufficient for fish production. Wastewater from fish production has a potential planneduse for greenhouse plants.
The plan for the ethanol plant is to take delivery of most of the corn needed for the year atharvest time. High moisture corn is delivered and stored in a large bunker for use as neededthroughout the year. By buying most of the grain at harvest time, farmers can sell their cornwithout the expense of drying and on-farm storage. Most grain comes from local growers, whichminimizes transportation costs. Corn used in ethanol production may contain up to 32 percentmoisture and could save producers up to $40 per acre in drying costs. The high moisture corn isstored in a large bunker adjacent to the ethanol plant and is loaded for processing as needed. Theethanol is sold through Heartland Fuel and Grain of Aberdeen, South Dakota. Stillage is sold wetto the adjoining feedlot (BEIFF) and to other feeders in the region. Carbon dioxide, another by-product of an ethanol plant, is not utilized at this time as the output from a plant of this size isusually not sufficient to justify processing.
Ethanol Industry OverviewCurrently there are 57 producing ethanol production facilities in the United States with
several others under construction (Iowa Value-Added Resource Manual 2000). Total productionis slightly more than 1.8 billion gallons per year and total direct employment is more than 4,000full-time employees, plus thousands of indirect jobs which are created by the ethanol industry.The production capacity of plants varies from fewer than one million gallons per year to morethan 100 million gallons per year. The SEC plant capacity of less than six million gallons peryear places it in the category of a small plant.
The primary uses of ethanol is as an octane extender for gasoline, as a clean air additive inthe form of an oxygenate, and as an aid in the reduction of America’s dependence on importedoil (Iowa Value-Added Resource Manual 2000). To accomplish and encourage the use of ethanolby the petroleum industry, Congress established an incentive in the form of a tax credit duringthe mid-1970s. The tax incentive continues today and was recently extended to 2007. The $0.054per gallon tax credit is an exemption from the Federal Gasoline Excise Tax paid by gasoline
181
marketers. This allows them to provide a cleaner burning gasoline with a higher octane tocustomers and to reduce their tax liability in the process.
As clean air standards continue to tighten, ethanol gains a greater market share of thegasoline market. Ethanol’s primary competitor is Methyl Tertiary Butyl Ether (MTBE), andrecent discoveries of groundwater contamination from MTBE have spurred greater interest inethanol blends. Ethanol is a fully biodegradable product and stands ready to fill the void leftwhen, and if, MTBE is banned. Congress recognized the economic value of ethanol whenblended at a 10 percent level with gasoline. Ten percent ethanol-blending boosts the octane ratingof gasoline by an average of three points. Ethanol, a renewable energy, is energy efficient. Every100 BTU of energy used to produce ethanol (energy use includes planting, cultivating,harvesting, and processing) returns 135 BTU of ethanol. By comparison, for every 100 BTU ofenergy used to produce a gallon of gasoline returns only 85 BTU of gasoline or 55 BTU ofMTBE . Ethanol lowers harmful carbon monoxide emissions by 30 percent and reduces carbondioxide emissions by 27 percent. The Environmental Protection Agency credits reformulatedgasoline containing ethanol with the reduction and control of hazardous emissions whichthreaten air quality in many cities (Balderson 1999).
In 1990, Congress adopted regulations that would increase the manufacture and use ofalternatively fueled vehicles. Through the use of these low-emission vehicles, ethanol has anopportunity to meet the demands of these cars for fuel. Ford and Chrysler produced severalhundred E85 vehicles in 1999, which can use 85 percent ethanol and 15 percent gasoline. Thechallenge for the ethanol industry is to provide sufficient refueling sites to accommodate thesecars, which require very little modification from the standard vehicle (so little that there is noprice increase for the E85 vehicle).
Other uses are beginning to evolve for ethanol and the coproducts associated with itsproduction. Stationary and mobile fuel cells powered by ethanol are beginning to emerge, andethanol is gaining popularity as a road and power-line deicer.
Corn for Ethanol ProductionCorn components can be found in thousands of products—adhesives, cosmetics, food, and
paper, to name just a few. Approximately 61 percent of 1998 corn use was for livestock feed(Missouri Farm Facts, Corn n.d.), 18 percent for export, and 6 percent each for ethanol and highfructose products (all other uses were 9 percent). Ethanol, which is produced from corn, is aclean burning, domestic renewable fuel that reduces demand for foreign oil and provides amarket for more than 600 million bushels of corn annually. For every 100 million bushels of cornused for production of ethanol, corn prices may increase from four to eight cents per bushel(Missouri Farm Facts, n.d.; NCGA 1999). According to the National Corn Growers Association(NCGA) (1999), corn-based ethanol results in a 50 to 60 percent reduction in fossil energy useand a 35 to 46 percent reduction in greenhouse gases. They credit ethanol with reducing thedemand for foreign oil by 100,000 barrels a day.
Corn varieties differ in amount and types of starch, and the local Pioneer Hybrid (Pioneerand DuPont Specialty Grains) representatives have helped some farmer-members select high-
182
yielding hybrids with high amounts of extractable starch. In addition, the stockpile of wet corn atSEC is treated with an inoculant to help control the heat and the pH so that the starch content isnot lost (“With a Little Help from Some Friends” 1999). With better quality grain going into theplant, the amount of ethanol produced per bushel of corn may be higher.
One bushel of corn (56 pounds) will produce about 2.7 gallons of ethanol and 16 pounds ofdistillers dried grains with solubles (DDGS). The residual product of distillation is wholestillage, a mixture containing 10 percent solids from the grain and 90 percent water. For every5,000 bushels of grain ground, approximately 192,000 gallons of whole stillage is produced.Although whole stillage is an excellent cattle feed, most plants (including SEC) further processthe stillage to an easier-to-manage product. DDGS is produced when the condensed distillerssolubles (CDS) are returned to the centrifuge to be mixed with the distillers wet grains (DDG).This is the most common and highest volume form of feed derived from a dry mill ethanolfacility.
Although SEC is a dry mill operation, they market their stillage as distillers wet grains(DWG) and as a thin stillage called CDS. DWG leaves the centrifuge at 55 to 65 percentmoisture and makes excellent cattle feed (drying DWG may slightly damage the protein of thefeed) (Iowa Value-Added Resource Manual 2000). SEC leaves a higher level of moisture in theDWG and sells a product with about 75 percent moisture (NCGA 1999). Thin stillage, or CDS,contains 2 to 5 percent dry matter as “fines” that escape screening or centrifuging. Thecomposition of CDS varies according to the process technology of the plant, but usually containsbetween 5 and 10 percent proteins, fiber, fats, and oils. CDS may be sold to nearby livestock anddairy farmers, and once farmers become educated about the nutritional value and convenienthandling, it often becomes the feed supplement of choice.
BEIFF currently has about 2,600 cattle on feed and uses about 10 percent of the plant’sDDGs. The feedlot is being enlarged to house 5,000 cattle and will use about 20 percent of theDDGs produced by the plant. The remainders of the DDGs are sold within a 60-mile radius tolivestock producers (members have first priority on DDGs’ sales). Directly east of the plant site,a private company is developing a large dairy cow complex (reportedly for 2,600 dairy cows),which potentially will be a good source for marketing DDGs.
Plant History and ManagementThe idea for the integrated ethanol plant came from a videotape of an integrated operation in
Garden City, Kansas. Members of the original task force visited Reeves Agri-Energy in GardenCity and were impressed with the integrated ethanol plant, aquaculture (Tilapia production unit),and feedlot. The Reeve’s ethanol plant produces 10 million gallons per year output and hasserved as a model for the unit planned in Blairstown.
The Iowa Beef Cooperative is the parent organization, and the general manager of the co-opspent much of his time from 1992 until the present working to develop and promote the project.The first shares were sold to farmer-members in December 1995 when the first of approximately100 informational meetings was held for potential shareholders. To purchase shares, one had tobe a member of the Iowa Beef Cooperative or the Iowa Producers Cooperative (grain co-op).
183
Until late 1998, the general manager of the Beef Cooperative directed the activities of the co-opand remains firmly committed and involved at present. SEC hired a manager in December 1998who directed the operation through July 2000. A new manager is being hired at the present time.The co-op has entered into an agreement with a local community college for the reimbursementof certain employee training costs (2000a).
SEC was originally designed as an integrated co-op (ethanol plant, feedlot, aquaculture,etc.); however, in order to receive a USDA loan guarantee, the operations had to stand alone.Therefore, a separate general manager was employed for each entity (ethanol plant and feedlot),and each operation is independent. The general manager of the Sunrise Energy Feedlot alsomanages the Iowa Beef Cooperative. The two co-ops (Sunrise Energy Ethanol and SunriseEnergy Beef) work together and share an office and other common space. The original generalcontractor for the plant and the co-op had differences during the construction phase whichdelayed the plant completion.
On October 27, 1999, the co-op received a Demand for Arbitration from the generalcontractor responsible for the construction of the ethanol facility, alleging that the co-op failed totimely and completely pay the general contractor for work performed on the facility (SEC2000a). The Demand for distribution called for more than $900,000 for work performed, or tohave been performed, on the facility. The co-op alleges that the general contractor did notcomplete the facility in a timely manner and believes that the co-op is owed liquidated damagesdue to delay on the completion of the facility. In June 2000, a court awarded a judgment of$675,000 plus interest to the general contractor.
The issue of contract management of an ethanol plant has often been a prerequisite to someProcess Design Companies (PDCs) who take equity interest positions in new ethanol facilities.By taking an equity position, the PDC is often able to interject needed capital into the project tohelp make it a reality. In addition, financial institutions often have a greater comfort level withthe financing of the project if the company building the plant is also an investor (this is often truewith USDA guaranteed loans). Typically, the PDC will want a management contract for anextended period of up to three to five years, and they are usually renewed automatically unless awritten objection from the board is received at least one year prior to the sunset of the contract.Some boards do not like this arrangement, and others feel it helps ensure a profitable operation.Some boards are forced to accept such arrangements because of funding shortfalls.
When a PDC becomes a part of the operation, it is often necessary to create a LimitedLiability Company (LLC) with the co-op as the majority shareholder. In Iowa and some otherstates, financing from a co-op bank cannot be obtained unless farmer ownership is at least 80percent.
SEC didn’t choose to employ a PDC for management as they felt they had the expertise tomanage the plant properly without the added expense. The ideal position for a co-op such as SECis as follows (Iowa Value-Added Resource Manual 2000):
184
• Most or all of the equity is raised, and the farmer-members provide the crop.
• Co-op members do not commit a “risky” percentage of the crops they are capable ofraising.
• Farmer-members hold a large majority of the voting stock and control the board.
• Board members are skilled and committed to their role of serving the interests of thefarmer-members.
• The board does not try to manage the plant but, rather, hires a manager who, in mostcases, has ethanol experience and then gives him or her authority to do the job, whilehaving him or her remain accountable to the board.
• Fiscal and financial matters, including profitability, investment, and distribution ofdividends, are under the oversight and control of the board.
The SEC board has eight members who meet frequently to make decisions on managing theplant. They often meet every other week but hope to only have to meet monthly soon. Boardmembers have donated much time, effort, and expertise to the operation and currently receive nopay for their efforts. The operation of the ethanol plant is coordinated with the needs of theSunrise BEIFF co-op in meeting BEIFF’s needs for stillage.
Stock Categories and OwnershipSeveral share categories exist within SEC. The share categories were designed to meet
different categories of people participating in the co-op, including several farm organizations andpromoters:
• Class A Shares of Preferred Stock – Sold initially for a par value of $5,000, these sharesgave a producer the right to deliver 4,500 bushels of high-moisture corn to the co-op.Some Class A Shares are not owned by farmers but, instead, are owned by other investorswho sell delivery rights to farmers. According to the auditors’ report, 551.5 shares havebeen sold, with a value of $2,757,500. These are nondividend bearing shares and providedelivery rights for grain to the ethanol plant (SEC 2000a). Delivery rights may be sold,and a person can own Class A Shares without being a voting member. Currently, about600 people own delivery rights at an average value of approximately $5,000 each.
• Class B Voting Stock – To own voting stock, one must be a member of the Iowa BeefCooperative or the Iowa Producers Cooperative. The Class B Voting Stock has a parvalue of $1 and is designed to keep the voting of the co-op in the hands of the farmer-members.
• Class C Preferred Stock – The stock ($250,000) is held by the Iowa Farm Bureau andshould receive dividends at the annual rate of 7 percent of the par value, payable annuallyon the 31st day of March. The Iowa Farm Bureau has been supportive throughout the lifeof SEC.
185
• Class D Preferred Stock – Heartland Grain Fuels of Aberdeen, South Dakota holds a$200,000 share value of Class D Preferred Stock (Heartland Grain and Fuels have a 2.5year marketing agreement with SEC) and accrues annual cash dividends at the rate of 7percent of the par value, payable on the 31st day of March.
• Class E Shares – Class E Shares are issued when the SEC cannot pay farmers for grainand when the farmers who delivered the grain desire payment. In this situation, Class EShares are issued, which are a pledge for payment to a farmer and the Iowa Farm Bureau.Farmers issued Class E Shares may borrow money from the Iowa Farm Bureau at 7.5percent interest until the SEC makes payment for the grain. This category of stock wasissued when the company was ordered to stop accepting loads of corn by the Iowa GrainLicensing Bureau (Shareholders Resolve Dispute at Ethanol Plant 1999). State statutesrequire grain dealers to store grain whole until the debt is paid. SEC had offered itsproducers contracts calling for a deferred payment of their grain and had started to crackcorn before some of the contracts were signed (SEC 2000). The seller of grain can electto make a deferred sale and select a later pricing and payment date, or corn can be pricedon delivery at the previous days Chicago Board of Trade (CBOT) futures closing price.Dividends are not ordinarily paid on any Class E Shares issued, although some dividendpaying Class E Shares may be provided to organizations such as the Iowa Farm Bureauwho may help finance the recent indebtedness from the arbitration judgment.
Patronage DistributionsThe patronage distribution plan is for the board of directors to allocate the co-op’s cash
savings at the end of each fiscal year among the following items: (1) a reasonable reserve fordepreciation, bad debts, contingent losses, and contingent expenses; (2) retained savings to theextent deemed necessary by the board of directors based on an evaluation of the future needs ofthe co-op and the competitive position of the co-op, as defined in the co-op’s bylaws; and(3) distributions to the farmer-members in proportion to the amount of corn the co-op haspurchased from the farmer-member, up to the amount specified in the respective farmer-member’s letter of marketing intent. Distribution to farmer-members will be issued in the form ofeither cash or Class B Voting Stock. Any issuance of Class B Voting Stock will conform with therequirements of the Internal Revenue Code, section 1388(d), as a nonqualified written notice ofallocation.
Financing ActivitiesThe SEC is financed by farmer-members’ share funds, a loan, grants, and TIFF funds. A
breakout of the financing activities from the audit report through August 31, 1999 follows (SEC2000a).
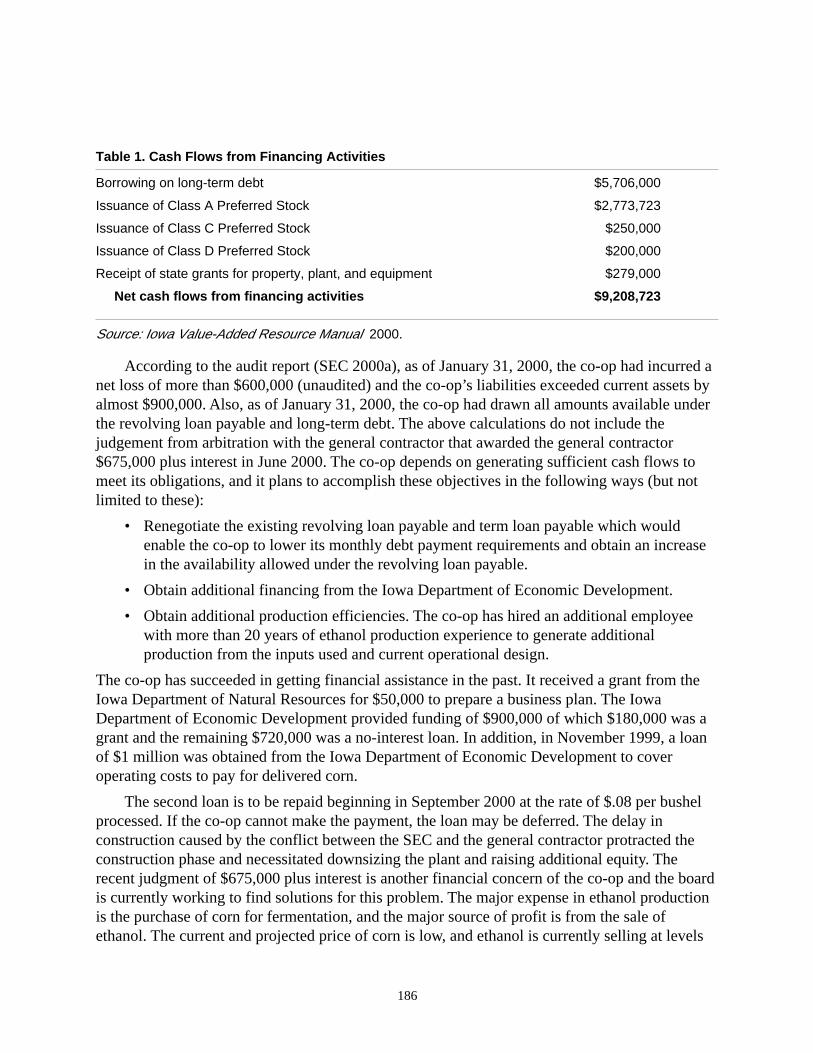
186
Table 1. Cash Flows from Financing Activities
Borrowing on long-term debt $5,706,000
Issuance of Class A Preferred Stock $2,773,723
Issuance of Class C Preferred Stock $250,000
Issuance of Class D Preferred Stock $200,000
Receipt of state grants for property, plant, and equipment $279,000
Net cash flows from financing activities $9,208,723
Source: Iowa Value-Added Resource Manual 2000.
According to the audit report (SEC 2000a), as of January 31, 2000, the co-op had incurred anet loss of more than $600,000 (unaudited) and the co-op’s liabilities exceeded current assets byalmost $900,000. Also, as of January 31, 2000, the co-op had drawn all amounts available underthe revolving loan payable and long-term debt. The above calculations do not include thejudgement from arbitration with the general contractor that awarded the general contractor$675,000 plus interest in June 2000. The co-op depends on generating sufficient cash flows tomeet its obligations, and it plans to accomplish these objectives in the following ways (but notlimited to these):
• Renegotiate the existing revolving loan payable and term loan payable which wouldenable the co-op to lower its monthly debt payment requirements and obtain an increasein the availability allowed under the revolving loan payable.
• Obtain additional financing from the Iowa Department of Economic Development.
• Obtain additional production efficiencies. The co-op has hired an additional employeewith more than 20 years of ethanol production experience to generate additionalproduction from the inputs used and current operational design.
The co-op has succeeded in getting financial assistance in the past. It received a grant from theIowa Department of Natural Resources for $50,000 to prepare a business plan. The IowaDepartment of Economic Development provided funding of $900,000 of which $180,000 was agrant and the remaining $720,000 was a no-interest loan. In addition, in November 1999, a loanof $1 million was obtained from the Iowa Department of Economic Development to coveroperating costs to pay for delivered corn.
The second loan is to be repaid beginning in September 2000 at the rate of $.08 per bushelprocessed. If the co-op cannot make the payment, the loan may be deferred. The delay inconstruction caused by the conflict between the SEC and the general contractor protracted theconstruction phase and necessitated downsizing the plant and raising additional equity. Therecent judgment of $675,000 plus interest is another financial concern of the co-op and the boardis currently working to find solutions for this problem. The major expense in ethanol productionis the purchase of corn for fermentation, and the major source of profit is from the sale ofethanol. The current and projected price of corn is low, and ethanol is currently selling at levels
187
above projections. July 2000 prices of approximately $1.40 per gallon of ethanol combined withcurrent projected corn prices should produce a positive cash flow for the co-op.
Site CharacteristicsFactors to consider in selecting a site for an ethanol plant are similar to those for other
industrial plants. Good location criteria encompass factors such as good drainage, sufficient roadand rail access, utility availability, and adequate on-site space to allow ease in movement oftrucks and equipment. Expansion possibilities must also be considered, along with road access,rail access, and acreage requirements. The SEC site is not close to a major highway or rail line;however, due to the design capacity of approximately six million gallons, the site may beadequate for the plant and to truck the ethanol to the delivery points. If the plant had a largercapacity (say 15,000,000 gallons per year or more), the presence of a rail line and spur wouldhave been very important. Much of the stillage is used on-site or locally. Also, the ethanol istrucked to users through a brokering arrangement with Heartland Fuel and Grain, and thearrangement seems to work well.
Water supply is important to the operation of an ethanol plant because about seven gallonsare required to process a bushel of corn. Much of the water required in an ethanol plant isrecycled back into the process; however, there are certain areas where fresh water is needed(probably around 12,500,000 gallons or more per year). Wastewater treatment is important;however, since much of the water can be recycled back into the process, the effluent isminimized. This has the long-term effect of lowering wastewater treatment costs. Today, manynew plants are at or near zero effluent facilities. The water in the cooling tower and the boilerblow-down water can be stored in a pond and eventually released to the environment. Watersupply for the operation appears to be adequate. SEC recycles much of its water (it has adequatewater from a rural water district and a well) and requires only about 800 gallons per day tooperate.
Fuel for the plant is important even though significant improvements have been made toreduce the energy intensiveness of ethanol production. Currently, about 45,000 BTU of energy isrequired to produce a gallon of ethanol, which contains 76,000 BTU of energy. Fifteen years ago,as much as 65,000 BTU of energy was required. SEC representatives have reported an efficiencyof 50 percent (Iowa Value-Added Resource Manual 2000). Natural gas is the preferred fuel foran ethanol plant, and SEC is located near a natural gas pipeline. Propane gas serves as a backupbut is generally 50 to 70 percent higher than natural gas. Both natural gas and electricity costshave exceeded earlier projections, even though a gas line goes through the property and theco-op received a good electric rate from the energy company.
Projected OperationsThe plant has yet to complete its first year of operation (the first grain was delivered on
September 7, 1999, and production started on November 25, 1999), so operating and profitinformation is not available. The production cost projections from the Iowa Value-AddedResource Manual (2000) provide a useful cash flow summary for the SEC’s ethanol unit.
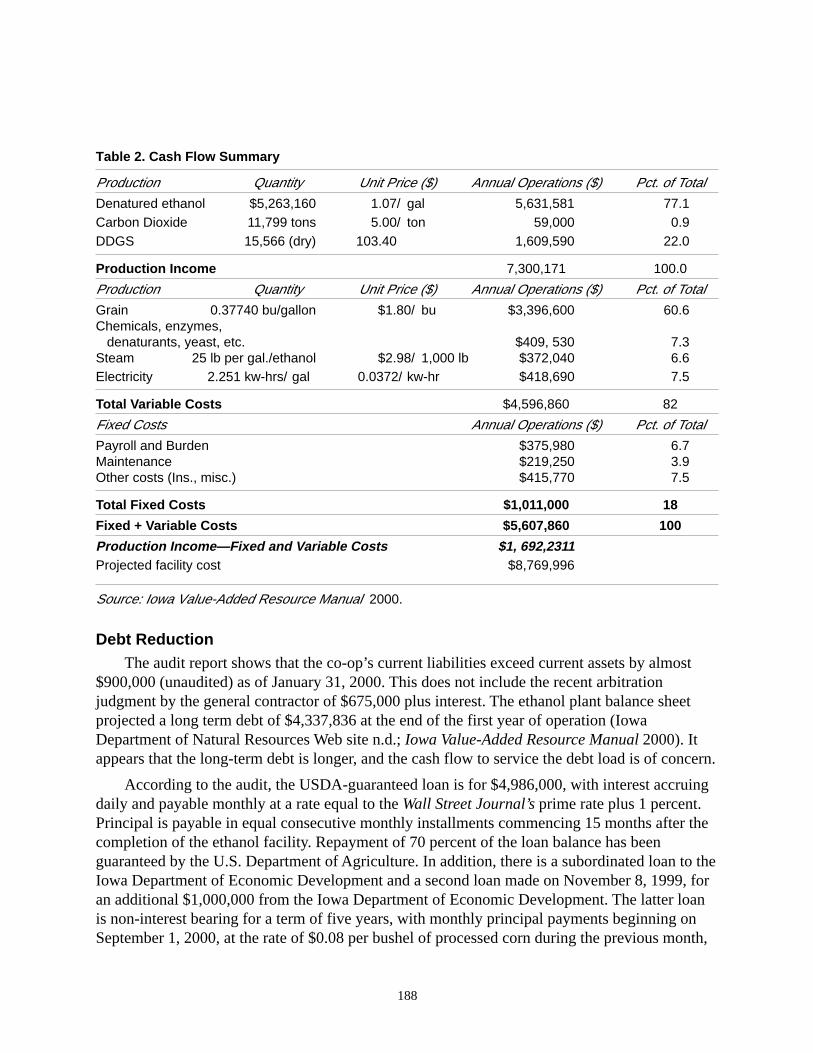
188
Table 2. Cash Flow Summary
Production Quantity Unit Price ($) Annual Operations ($) Pct. of TotalDenatured ethanol $5,263,160 1.07/ gal 5,631,581 77.1Carbon Dioxide 11,799 tons 5.00/ ton 59,000 0.9DDGS 15,566 (dry) 103.40 1,609,590 22.0
Production Income 7,300,171 100.0
Production Quantity Unit Price ($) Annual Operations ($) Pct. of TotalGrain 0.37740 bu/gallon $1.80/ bu $3,396,600 60.6Chemicals, enzymes, denaturants, yeast, etc. $409, 530 7.3Steam 25 lb per gal./ethanol $2.98/ 1,000 lb $372,040 6.6Electricity 2.251 kw-hrs/ gal 0.0372/ kw-hr $418,690 7.5
Total Variable Costs $4,596,860 82
Fixed Costs Annual Operations ($) Pct. of TotalPayroll and Burden $375,980 6.7Maintenance $219,250 3.9Other costs (Ins., misc.) $415,770 7.5
Total Fixed Costs $1,011,000 18
Fixed + Variable Costs $5,607,860 100
Production Income—Fixed and Variable Costs $1, 692,2311Projected facility cost $8,769,996
Source: Iowa Value-Added Resource Manual 2000.
Debt ReductionThe audit report shows that the co-op’s current liabilities exceed current assets by almost
$900,000 (unaudited) as of January 31, 2000. This does not include the recent arbitrationjudgment by the general contractor of $675,000 plus interest. The ethanol plant balance sheetprojected a long term debt of $4,337,836 at the end of the first year of operation (IowaDepartment of Natural Resources Web site n.d.; Iowa Value-Added Resource Manual 2000). Itappears that the long-term debt is longer, and the cash flow to service the debt load is of concern.
According to the audit, the USDA-guaranteed loan is for $4,986,000, with interest accruingdaily and payable monthly at a rate equal to the Wall Street Journal’s prime rate plus 1 percent.Principal is payable in equal consecutive monthly installments commencing 15 months after thecompletion of the ethanol facility. Repayment of 70 percent of the loan balance has beenguaranteed by the U.S. Department of Agriculture. In addition, there is a subordinated loan to theIowa Department of Economic Development and a second loan made on November 8, 1999, foran additional $1,000,000 from the Iowa Department of Economic Development. The latter loanis non-interest bearing for a term of five years, with monthly principal payments beginning onSeptember 1, 2000, at the rate of $0.08 per bushel of processed corn during the previous month,
189
estimated at approximately $13,000. The loan is collateralized by the general business assets ofthe co-op and personal guarantees by the members of the co-op’s board of directors (personalguarantees limited to a maximum of $500,000).
Start-up OperationsDelivery of high moisture corn to SEC, Iowa’s first farmer-owned ethanol plant, began in
September 1999 (Ethanol Promotion n.d.). The processing of ethanol commenced on November25, 1999. Subscribers were happy with the idea of harvesting their corn at a high moisture level(22 to 30 percent) and avoiding the drying cost. Taking in more than two million bushels of highmoisture corn, however, was more of a problem than anticipated because the unloading andgrinding of the corn slowed the process considerably. Reports of truckers waiting in line forhours to unload grain made those delivering grain unhappy. The co-op has located a high energyroller-crusher that will process 20,000 bushels per hour (versus 6,000 bu/hour last year), but therecent arbitration ruling has put that expenditure on hold for the time being. For the comingdelivery season, deliveries may need to be of dry corn, or those delivering grain may have to paya processing fee if they bring in high moisture corn.
When the Iowa Grain Licensing Bureau ordered SEC to stop accepting corn, the SEC votingmembers resolved the situation by changing the enterprise from 499 Cooperative Association(grain dealer) to a 501 Closed Cooperative. The 501 cooperative arrangement allows the SEC tostore grain and defer payments as well as use the corn for ethanol production (“ShareholdersResolve Dispute at Ethanol Plant” 1999). The issue was reported as an administrative problemtied to whether grain is worth more processed or unprocessed. Under the new rules, the co-opcontinues to buy grain only from those who own delivery rights.
Economic ImpactThe impact on the region is positive because 20 jobs have been created by the ethanol plant
and additional jobs are being created by the Sunrise BEIFF co-op. The addition of an adjacentdairy facility will also create economic growth for the region as will a proposed aquaculture unit.According to the Iowa Department of Natural Resources (energy bureau), the SEC is benefitingabout 300 farmers from the five million or more million gallons of ethanol produced there eachyear. In addition, the operation generates $8 million of economic activity (Ethanol Promotionn.d.). The marketing of the ethanol is handled by Heartland Grain and Fuels, which has a 2.5year marketing agreement at a 2.5 percent commission. The ethanol is priced daily and paid tothe co-op on a weekly basis, which is considered a good arrangement by SEC. Heartland Fueland Grain is a consortium of ethanol plants, and the consortium sells about 30 million gallons ofethanol per year. Farmer-members are projected to receive $3 per bushel for their corn (“SunriseEnergy Taking Deliveries” 1999).
Summary and Lessons LearnedSEC began operation in the fall of 1999. The idea for the plant started when a group of
growers from eastern Iowa saw a videotape about an ethanol plant in Garden City, Kansas(Reeves Agri-Energy, a 10 million gallons per year ethanol plant). The Kansas plant centerpiece
190
was the ethanol plant but also included were an integrated beef feedlot and aquacultureoperation. SEC processes more than two million bushels of wet corn each year, and the corn isprovided by about 600 owners of corn delivery rights who will make their deliveries in the fall.One major promoter for SEC was the general manager of the Iowa Beef Cooperative, and hisendless efforts, with the help of other farmer promoters and the support of the co-op, made theplant a reality.
The concept of the integrated plant is to provide producers a way to make a profit byprocessing their grain into ethanol. In addition, the product left over after the starch is removedto make ethanol is called stillage and is used for animal feed. About one of every four bushels ofcorn that goes into the ethanol plant comes back as animal feed and is sold to area beef feedersand milk producers. The presence of a feedlot on the plant site is a ready market for a majorportion of this feed, and the proximity of the plant and feedlot eliminates the cost oftransportation. The implementation of an integrated system, such as SEC, can serve as a modelfor other producer groups interested in creating new facilities. Also, the lessons learned (some ofthem difficult lessons) can help other groups in their planning.
SEC experienced some problems with its organizational planning. This was apparent whenthe Iowa Grain Licensing Bureau ordered SEC to stop accepting loads of corn in fall 1999. Thesituation was resolved, but it created a temporary problem for the co-op and those farmer-members delivering grain to the plant. SEC did not choose to utilize a PDC for its management,and it had a dispute with its general contractor which recently resulted in a judgment against theco-op. Because of the arbitration ruling, the delay in construction brought about by the dispute,and other early production problems associated with management, the cost of construction perbushel processed appears to be high. The total construction and start-up cost is more than $2 pergallon of ethanol produced, which is high when compared to some other recent ethanol plantseither completed or under construction such as, Golden Triangle and Northeast Missouri GrainProcessors who had construction and start-up costs of less than $1.50 per gallon processed.These plants are larger (15 million gallons per year) and both employed an experienced PDC forthe construction phase and for plant management. In both cases, the PDC made a substantialinvestment in the plant which helped with the financing.
The Iowa Department of Natural Resources has provided support for the project andinitiated a project to develop an economic feasibility study, computer model, and business planfor a hypothetical energy-producing farm.
SEC served as the general contractor for this project. Likewise, the Iowa Department ofEconomic Development provided much needed funding as difficult times evolved in the pre- andearly operational stages of the project.
Based on the auditors’ report (Redmond, Broghammer & Jonas, P.C.), the deficitaccumulated during the development stage and current liabilities exceed current assets by$900,000 (as of January 31, 2000) (SEC 2000a). In addition, recent arbitration awarded asignificant judgment to the general contractor at the expense of SEC. Based on these financialshortfalls, additional funding or financing is needed to sustain operations and pay the short-term
191
and long-term debt. The cash flow to meet the long-term debt payment is a concern that theboard of directors is continuously addressing.
The co-op has been responsive to problems as they evolve and generally has foundsatisfactory solutions. The problem of handling the delivery of more than two million bushels ofwet corn in early fall will exist when the corn is delivered in fall 2000, and plans to handle thisproblem are being considered. The support of the Iowa Department of Economic Development inproviding funding to support the issuance of Class E Shares when the co-op status was changedis evidence of the working relationship between the co-op and state agencies.
It is a major undertaking for a group of producers to create an operation of this magnitude.They have learned from mistakes made and have developed a model that could be useful forother producer groups. The integrated concept is a unique approach and one with the potentialfor assisting producer groups to benefit from value-added profits to their commodities.
Many lessons, such as the following, are learned from the creation of an operation such asthe SEC:
• There must be a vision and desire to generate a new program for adding profit toagricultural commodities.
• Promoters must learn and understand the steps in forming an organization that conformsto local and state laws and still protects the basic concept of the proposed organization (inthis case, an integrated energy farm).
• Promoters must be ready to hire professional help (e.g., management help) as needed tohave the proper skills for running such an operation.
• Creating an accurate business plan that can be used in acquiring capital is a necessity. Inaddition, if the project is not financed adequately, major problems at start-up will befaced.
• Promoters must consider selecting a PDC for the construction phase and possibly theinitial management phase. Selecting the proper general contractor is of utmostimportance.
• The product flow from producer to plant must be visualized so as to avoid unnecessaryhandling difficulties.
• Networking with other co-ops to share information and to work together to add value tofarmers’ commodities is a good idea. If possible, join with other farmer-owned co-ops injoint efforts (such as marketing) which provide mutual benefit.
Developing a new business such as the SEC requires the dedication of members who wantthe operation to succeed. This is certainly true of this co-op as the work of fundraising,organization, construction, and management were made possible because of the dedication ofmembers of the Iowa Beef Cooperative, loyal promoters, and a board of directors who wanted toturn their vision into a reality.
192
ReferencesBalderson, Karen. 1999. Ethanol, by-products good for Iowa. The Gazette (Cedar Rapids, Iowa).
(April 17).
Behounek, Greg. 2000. Accountant (Sunrise Energy Cooperative), personal interview, site visit,Benton County, Iowa. (June).
Blairstown Iowa resource guide: Facts and information. Available online: <www.pe.net/~rksnow/iacountyblairstown.htm>
Ethanol promotion. n.d. Des Moines: Bureau of Energy, Iowa Department of Natural Resources.Available online: <www.state.ia.us/dnr/energy/programs/ren/ethanol.htm>.
Iowa Department of Natural Resources Web site. n.d. Available online: <www.state.ia.us/dnr/>.
Iowa value-added resource manual. 2000. Manual prepared with the sponsorship of the IowaCorn Promotion Board, Iowa Department of Agricultural and Land Stewardship, IowaDepartment of Economic Development, Iowa Farm Bureau Federation, Iowa StateUniversity Extension, and the U.S. Department of Agriculture.
Lucas, Marlene. 1999. Sunrise Energy taking deliveries. 1999. The Gazette (Cedar Rapids,Iowa). (September 15).
Missouri farm facts, Corn—AgEBB. n.d. Available online: <http://agebb.missouri.edu/mass/indepth/corn/cornuse.htm>.
National Corn Growers Association (NCGA). 1999. The world of corn. St. Louis: NCGA.
Shareholders resolve dispute at ethanol plant: Sunshine Energy in Blairstown to changeenterprise status. The Gazette (Cedar Rapids, Iowa). (November 17).
Sunrise Energy Cooperative (SEC). 2000a. Financial statements for the year ended August 31,1999 (period from May 30, 1995 [date of incorporation] through August 31, 1999) andIndependent auditors’ report by Redmond, Broghammer and Jonas, P.C., Certified PublicAccountants.
SEC. 2000. High moisture corn agreement (Internal document of Sunrise Energy Cooperative).Blairstown, Iowa: SEC.
Thompson, Steve. 2000. Shareholder and board member (Sunrise Energy Cooperative), personalinterview, site visit, Benton County, Iowa (June).
With a Little Help from Some Friends. 2000. The Pioneer Innovator 4(5) (July): 5.
193
21st Century Alliance:Building Value-Added Agribusiness
by Roger Brown
Introduction
To create a successful business in an unfamiliar industry is difficult. Likewise, changing acultural environment from one of independence to one of interdependence is also a challenge. Itmight seem impossible to create a new business in an unfamiliar industry that requires a largegroup of independent-minded investors to work cooperatively for success, yet it can be done andis being done.
This case study examines the 21st Century Alliance and how it has helped farmers, mainly inKansas, increase the scale of their operations through value-added agribusiness. In just threeyears of operation, the Alliance has led to the formation of six New Generation Cooperatives(NGCs) and one Limited Liability Company (LLC). It is also worth noting that the NGCs in-clude relatively diverse agriculture products. The Alliance, at its core, is made up of a relativelysmall number of dedicated people working diligently to extend the value chain for farmers, alsoknown as Ag Producers, and, as a result, to improve rural economies. It is best described as anentrepreneurial agribusiness organization that is both focused and flexible in its business start-upactivity.
The Alliance focuses on identifying the critical issues in a new venture and resolving thoseissues to ensure that a new business has a reasonable chance of succeeding. Addressing issues toimprove the business is an ongoing process. Those projects that fall short during the feasibilityprocess are scrapped. Flexibility is demonstrated by an openness to considering unique ap-proaches to making a business work such as growing product in one state and processing it inanother. The key is whether the business can achieve its ultimate financial objective for themembership.
Background
The 21st Century Alliance organization is headquartered in Manhattan, Kansas—a locationthat is roughly at the center of America’s “breadbasket.” Kansas is proud of its farming heritage.According to the Kansas Department of Commerce and Housing, more than 90 percent of thestate’s land is used in agriculture, and the industry pumps $10 billion into the state’s economy. Itusually ranks number one or two nationally in wheat acreage harvested, wheat yield per acre,total production, and total value of wheat crop harvested. In 1998, farmers in Kansas produced495 million bushels of wheat, representing 19.4 percent of the total U.S. wheat production (U.S.Census Bureau 1999, 688). Even so, this success cannot hide the fact that agriculture in Kansas
This case study was prepared with the assistance of Chris Williams, Vice President of Operations forthe 21st Century Alliance. Any observations and opinions presented in this report are those of the author.
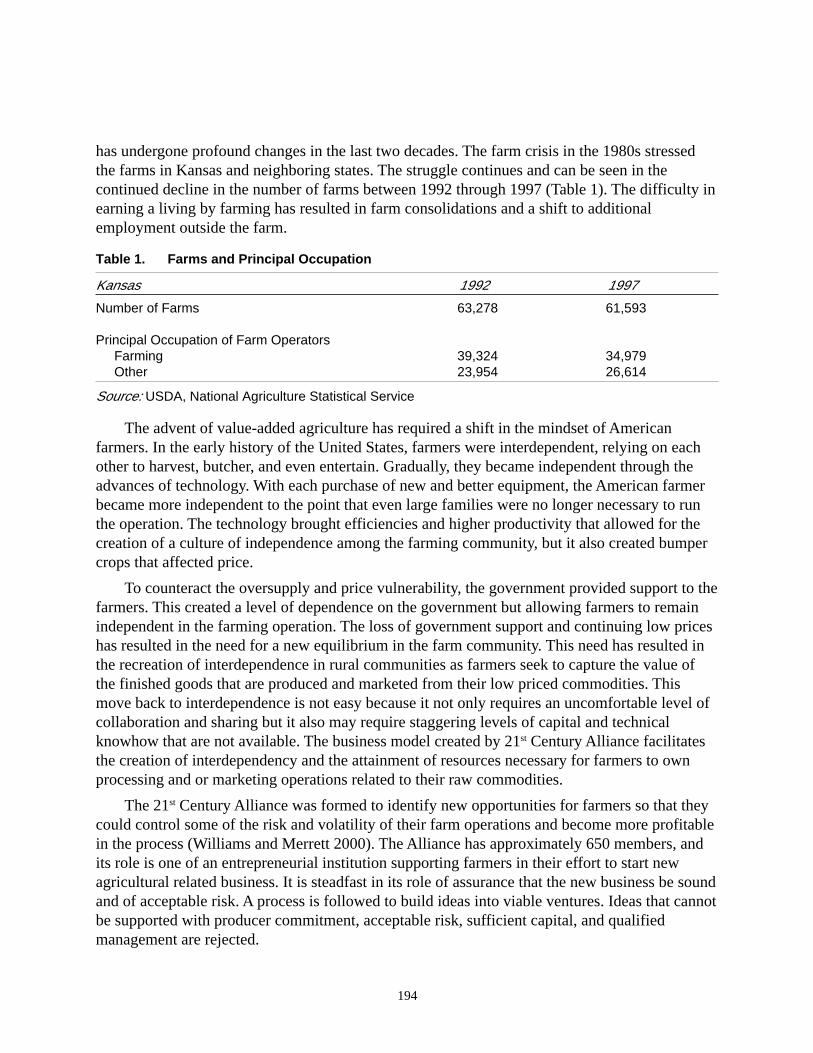
194
has undergone profound changes in the last two decades. The farm crisis in the 1980s stressedthe farms in Kansas and neighboring states. The struggle continues and can be seen in thecontinued decline in the number of farms between 1992 through 1997 (Table 1). The difficulty inearning a living by farming has resulted in farm consolidations and a shift to additionalemployment outside the farm.
Table 1. Farms and Principal Occupation
Kansas 1992 1997
Number of Farms 63,278 61,593
Principal Occupation of Farm Operators Farming 39,324 34,979 Other 23,954 26,614
Source: USDA, National Agriculture Statistical Service
The advent of value-added agriculture has required a shift in the mindset of Americanfarmers. In the early history of the United States, farmers were interdependent, relying on eachother to harvest, butcher, and even entertain. Gradually, they became independent through theadvances of technology. With each purchase of new and better equipment, the American farmerbecame more independent to the point that even large families were no longer necessary to runthe operation. The technology brought efficiencies and higher productivity that allowed for thecreation of a culture of independence among the farming community, but it also created bumpercrops that affected price.
To counteract the oversupply and price vulnerability, the government provided support to thefarmers. This created a level of dependence on the government but allowing farmers to remainindependent in the farming operation. The loss of government support and continuing low priceshas resulted in the need for a new equilibrium in the farm community. This need has resulted inthe recreation of interdependence in rural communities as farmers seek to capture the value ofthe finished goods that are produced and marketed from their low priced commodities. Thismove back to interdependence is not easy because it not only requires an uncomfortable level ofcollaboration and sharing but it also may require staggering levels of capital and technicalknowhow that are not available. The business model created by 21st Century Alliance facilitatesthe creation of interdependency and the attainment of resources necessary for farmers to ownprocessing and or marketing operations related to their raw commodities.
The 21st Century Alliance was formed to identify new opportunities for farmers so that theycould control some of the risk and volatility of their farm operations and become more profitablein the process (Williams and Merrett 2000). The Alliance has approximately 650 members, andits role is one of an entrepreneurial institution supporting farmers in their effort to start newagricultural related business. It is steadfast in its role of assurance that the new business be soundand of acceptable risk. A process is followed to build ideas into viable ventures. Ideas that cannotbe supported with producer commitment, acceptable risk, sufficient capital, and qualifiedmanagement are rejected.
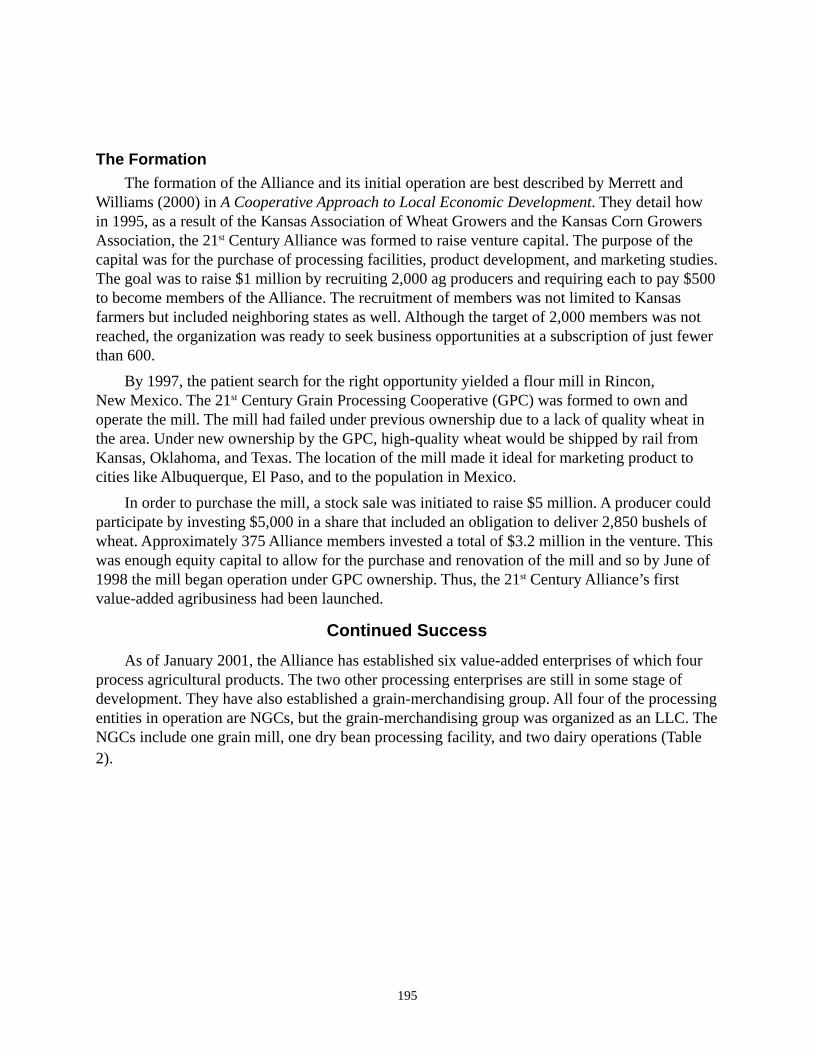
195
The FormationThe formation of the Alliance and its initial operation are best described by Merrett and
Williams (2000) in A Cooperative Approach to Local Economic Development. They detail howin 1995, as a result of the Kansas Association of Wheat Growers and the Kansas Corn GrowersAssociation, the 21st Century Alliance was formed to raise venture capital. The purpose of thecapital was for the purchase of processing facilities, product development, and marketing studies.The goal was to raise $1 million by recruiting 2,000 ag producers and requiring each to pay $500to become members of the Alliance. The recruitment of members was not limited to Kansasfarmers but included neighboring states as well. Although the target of 2,000 members was notreached, the organization was ready to seek business opportunities at a subscription of just fewerthan 600.
By 1997, the patient search for the right opportunity yielded a flour mill in Rincon,New Mexico. The 21st Century Grain Processing Cooperative (GPC) was formed to own andoperate the mill. The mill had failed under previous ownership due to a lack of quality wheat inthe area. Under new ownership by the GPC, high-quality wheat would be shipped by rail fromKansas, Oklahoma, and Texas. The location of the mill made it ideal for marketing product tocities like Albuquerque, El Paso, and to the population in Mexico.
In order to purchase the mill, a stock sale was initiated to raise $5 million. A producer couldparticipate by investing $5,000 in a share that included an obligation to deliver 2,850 bushels ofwheat. Approximately 375 Alliance members invested a total of $3.2 million in the venture. Thiswas enough equity capital to allow for the purchase and renovation of the mill and so by June of1998 the mill began operation under GPC ownership. Thus, the 21st Century Alliance’s firstvalue-added agribusiness had been launched.
Continued Success
As of January 2001, the Alliance has established six value-added enterprises of which fourprocess agricultural products. The two other processing enterprises are still in some stage ofdevelopment. They have also established a grain-merchandising group. All four of the processingentities in operation are NGCs, but the grain-merchandising group was organized as an LLC. TheNGCs include one grain mill, one dry bean processing facility, and two dairy operations (Table2).
196
Table 2. Organizations Created by the 21st Century Alliance
First StatesName Location Production Organ. Product Members Represented
21st Century GrainProcessing KS, NE, OK,Cooperative Rincon, NM June ‘98 NGC Flour mill 360 PA, TX, CO
21st CenturyBean ProcessingCooperative Sharon Springs, KS Fall ’99 NGC Dry edible beans 50 KS, CO, NE
21st CenturyDairies Cooperative:Washington County Linn, KS March ‘99 NGC Milk 96 KS
21st Century DairiesCooperative: LadderCreek Tribune, KS Dec. ‘99 NGC Milk 101 KS, IL, CO, NE
21st Century AgFiber ProcurementCooperative Under review NGC Fiberboard 120 KS
21st Century Grain GrainMerchandising, LLC Manhattan, KS July ‘00 LLC Merchandising 3 KS
Great Plains Corn DevelopmentProcessing Cooperative Plains, KS stage NGC Corn Masa Mill 82 KS
Source: 21st Century Alliance.
Grain Processing
Sales in the year 2000 were $5 million. The market for the mill’s wheat flour continues tobuild and, with it, the cash flow is increasing. The mill currently produces 17 truckloads of flourper week compared with three trucks per week in 1998. Thus, the business is growing and itappears to have a bright future. Even as management recognizes the burden of interest paymentson loans as an obstacle. These loans were needed to create the business; however, servicing thisdebt expense has severely affected cash flow. Now, as sales grow, the ability to service debt hasimproved. An additional stock sale was considered at one time in order to replace debt withequity and, thus, reduce interest payments. No stock sale is planned at this time, probably due tothe increased revenue from the business.
DairiesThe two dairies were developed simultaneously but are located in different regions of the
state. The first Alliance dairy facility to start production was the 21st Century DairiesCooperative: Washington County. This is a 1,500 cow facility with 100 participating producers.The other dairy, 21st Century Dairies Cooperative: Ladder Creek, began production in December
197
1999, just 10 months after the Washington County facility. Remarkably, from the initiation ofthe stock sale for the Ladder Creek Dairy to first production took only 11 months. More than $2million in equity was raised from 100 investors. The Ladder Creek facility milks approximately2,500 cows.
This is a difficult economic time for dairies throughout the country, and the two Alliancedairies have had to cope with low milk prices. In order to cope and compete, costs must bereduced. Two major expenses are debt and feed. In both cases, the structure of an NGC allowsfor control of the situation by issuing additional equity to reduce debt and by reducing the cost offeed. Even though business is tough at the moment, this is a business that the Alliance likes, and,in fact, it is looking at an additional dairy opportunity.
Dry BeansThe bean cooperative is the first Alliance agribusiness to provide dividends to its members,
and it has been able to return most of the original investment. The 21st Century Bean ProcessingCooperative is located in Sharon Springs, Kansas, but includes producers from Colorado andKansas. This cooperative marketed 165,000 cwt. in 1998, its first year of production. The co-opis now looking to expand its marketing effort on a national scale.
The Alliance Organization
The Alliance organization includes the members, a governing board, professionalmanagement and staff, and consultants as needed. Alliance membership includes ag producersfrom nine states, with the majority residing in the state of Kansas. The size of the membershipfluctuates between approximately 650 and 750 members. Members have an opportunity to investin each of the new businesses as it develops.
Management of the Alliance is the responsibility of the CEO, Vice President of Operations,and the Alliance Board. The board is composed of nine members with diverse backgrounds andskills but all possessing excellent credentials and leadership. In addition to extensive experiencein various types of agriculture, the current board has experience in finance, marketing, and grainlogistics. Board membership is for three years and is staggered in order to maintain continuity.Membership on the board is not limited to residents of Kansas; it currently includes a resident ofColorado and of Nebraska. There is a conscious effort to maintain a broad representation of skillsand background on the board. As part of the selection process, a nominating committee of at leasttwo members interviews candidates before nominating them to the full board at the annualmeeting.
The CEO of the Alliance is Lynn Rundell, who also is the general manager of the 21st
Century Grain Processing Cooperative that processes wheat in New Mexico for its members.The CEO leads the strategy of the organization specifically by seeking to identify and developnew opportunities and by playing a significant role in communicating the vision of the alliance tomembers, prospective members, ag groups in neighboring states, and industry. Chris Williams isthe Vice President of Operations and has primary responsibility for the oversight of operationsand for interfacing with external entities. The administrative staff includes a secretary and an
198
accounts manager. The Alliance shares office space with the Kansas Association of WheatGrowers.
Consultants are an important part of the organization. These consultants are retained toprovide technical expertise in key business activities. Skills and extensive experience in value-added agribusiness areas such as marketing, strategic planning, food processing, businessdevelopment, and trade with Mexico are available within the organization (21st Century Alliance2001a). This and other expertise are utilized in the service agreement that is put in place to dofeasibility and business planning for new businesses. This expertise is also used in improvingand building businesses to become more profitable.
The organization’s agenda includes four key elements:
1. An aggressive pursuit of new opportunities – Currently, the Alliance is activelyresearching four potential businesses.
2. A reduction in the risk of failure by doing the homework on the venture. A process is inplace to fully investigate the merits of new ventures, recognizing that more fail to belaunched than are launched. At the annual meeting it was pointed out that it is better tospend a little money up front to identify the risk than to spend a lot of money and fail.
3. The monitoring and refining of business plans of ongoing businesses – Managementmonitors the existing business metrics as well as the market and competition.
4. A spirit of cooperation to enhance business opportunities and promote a new approachto agribusiness – The alliance seeks business relationships across state and countryborders to improve profitability.
Members pay $100 per year, which creates an annual pool of $70,000. The Alliance alsocreates revenue through a 6 percent service fee generated from the sale of stock in each newventure. These funds allow the Alliance to carry out its role as an entrepreneur which specializesin the creation of value-added agricultural businesses, specifically by providing venture capitaland business start-up expertise. According to Williams, Vice President of Operations, the missionis to “provide profitable agricultural business opportunities for our members.”
The board focuses on strategic issues but remains open-minded to any opportunitypresented. This is evident in the type of value-adding efforts launched to date and the apparentlack of self-imposed boundaries such as site location, type of product, and the legal organizationform. The board meets when necessary to review and make decisions on ongoing projects. It alsomeets annually to specifically address strategy. Key questions addressed include (1) How are wedoing? and (2) What should be our business focus, including the choice of industries and specificprojects? In the first three years, the emphasis of these meetings dealt primarily with financialsurvival but, since then, the strategy is more about growing the ag economy (Williams 2000).
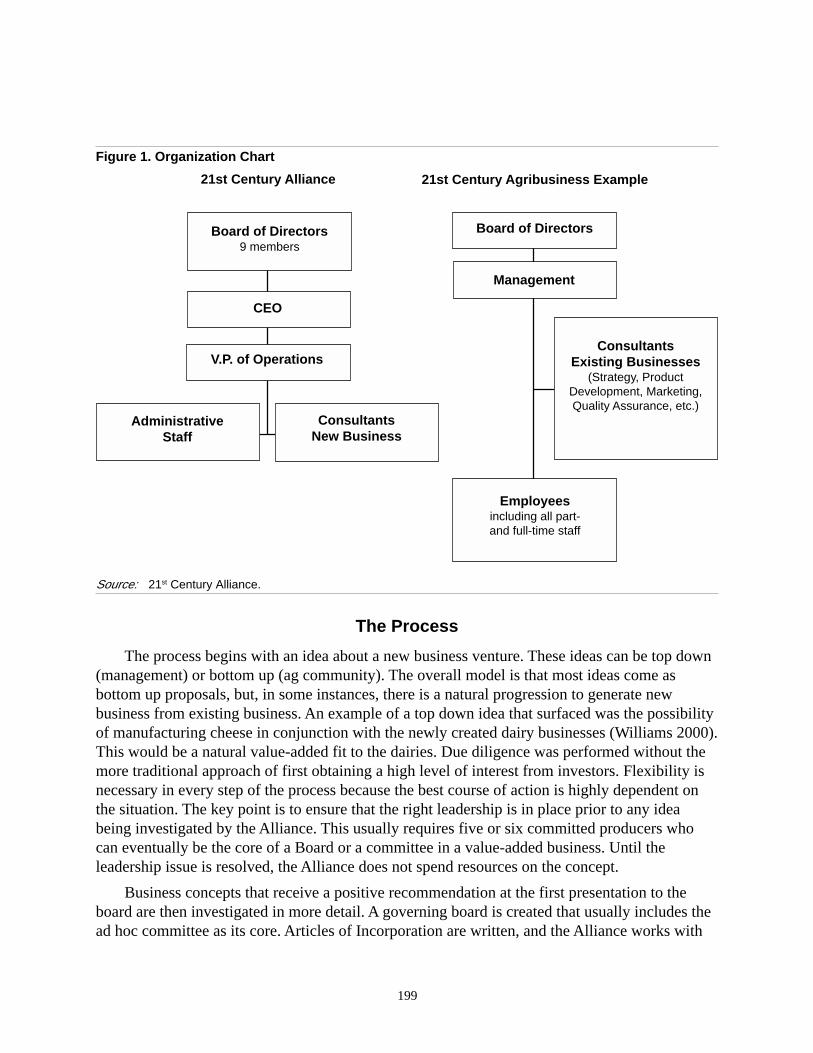
199
Figure 1. Organization Chart
Source: 21st Century Alliance.
The Process
The process begins with an idea about a new business venture. These ideas can be top down(management) or bottom up (ag community). The overall model is that most ideas come asbottom up proposals, but, in some instances, there is a natural progression to generate newbusiness from existing business. An example of a top down idea that surfaced was the possibilityof manufacturing cheese in conjunction with the newly created dairy businesses (Williams 2000).This would be a natural value-added fit to the dairies. Due diligence was performed without themore traditional approach of first obtaining a high level of interest from investors. Flexibility isnecessary in every step of the process because the best course of action is highly dependent onthe situation. The key point is to ensure that the right leadership is in place prior to any ideabeing investigated by the Alliance. This usually requires five or six committed producers whocan eventually be the core of a Board or a committee in a value-added business. Until theleadership issue is resolved, the Alliance does not spend resources on the concept.
Business concepts that receive a positive recommendation at the first presentation to theboard are then investigated in more detail. A governing board is created that usually includes thead hoc committee as its core. Articles of Incorporation are written, and the Alliance works with
21st Century Alliance
ConsultantsNew Business
V.P. of Operations
CEO
Board of Directors9 members
AdministrativeStaff
Board of Directors
Management
Employeesincluding all part-and full-time staff
ConsultantsExisting Businesses
(Strategy, ProductDevelopment, Marketing,Quality Assurance, etc.)
21st Century Agribusiness Example
200
the group to prepare a Development Service Contract. This Development Service Contractdetails the work to be done leading to start-up and the relationship with the 21st Century Alliance.The agreement covers items such as due diligence, marketing, engineering, financing, and relatedrequirements for partnerships. The alliance will make the arrangements for all necessary activity.Consultants are used in the feasibility and start-up activities. The work performed during the duediligence phase helps define the risk and solutions to problems. For various reasons manyprojects do not pass this stage.
A feasibility study is then conducted to determine the probability of a successful business. Ifthe feasibility study is positive, then the next step is to initiate the creation of a formalorganization for the business. Projects that still look favorable after feasibility work move to thefinal hurdle of capital formation and the membership drive. Actually, the work to raise moneyand membership begins after the first positive review. This is because it takes a tremendousamount of time and effort to collect the necessary resources, and it is worth the risk to beginbefore the feasibility work is complete. The new organization, NGC or LLC, must raise equitycapital to cover 40 percent of the venture.
In the final stage of the process, a contract is prepared that outlines the financialarrangement, including the type of financing and the terms of reimbursement to the Alliance. Inthe case of a stock sale, the Alliance will take a modest percent (6 percent) of the sale as aservice fee. The service fee is the means of reimbursement for the business development activityfinanced by the 21st Century Alliance.
The membership drive will determine the level of commitment in terms of equity andfeedstock delivery commitment. In addition to the capital raised through equity, the value-addedentity will likely need to secure loans if a processing facility is required. It is important to findbanks with lending experience in the type of commodity or process being developed. Clients ofthe Alliance look to local banks and to Farm Credit to service loan needs.
The form of incorporation depends on the circumstances of the business. If feedstockdelivery is critical, then the NGC form will be most suitable. The Alliance works with one legalfirm that specializes in incorporation issues for agriculture entities. This firm has a high level ofinteraction with the board of the newly formed, but yet to be incorporated, organization. Theboard and law firm jointly decide on the best legal organization form. The key point is that theproject dictates the type of organizational structure.
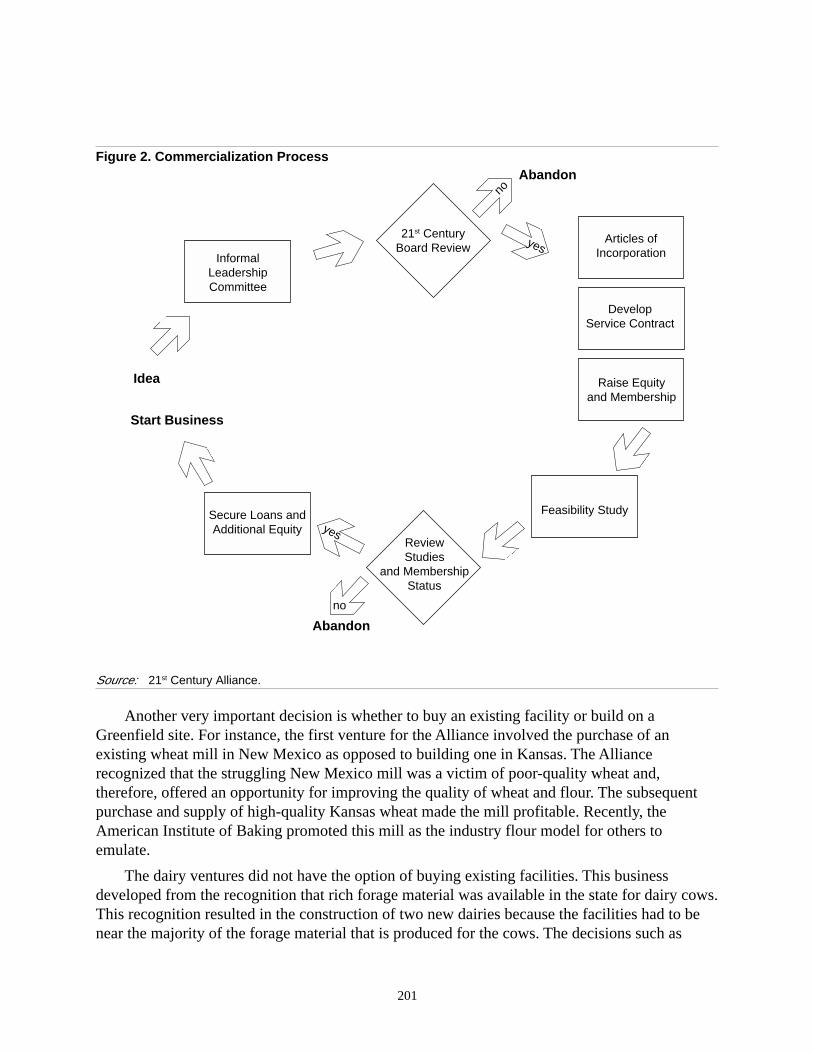
201
Figure 2. Commercialization Process
Source: 21st Century Alliance.
Another very important decision is whether to buy an existing facility or build on aGreenfield site. For instance, the first venture for the Alliance involved the purchase of anexisting wheat mill in New Mexico as opposed to building one in Kansas. The Alliancerecognized that the struggling New Mexico mill was a victim of poor-quality wheat and,therefore, offered an opportunity for improving the quality of wheat and flour. The subsequentpurchase and supply of high-quality Kansas wheat made the mill profitable. Recently, theAmerican Institute of Baking promoted this mill as the industry flour model for others toemulate.
The dairy ventures did not have the option of buying existing facilities. This businessdeveloped from the recognition that rich forage material was available in the state for dairy cows.This recognition resulted in the construction of two new dairies because the facilities had to benear the majority of the forage material that is produced for the cows. The decisions such as
Abandon
Start Business
Articles ofIncorporation
DevelopService Contract
Raise Equityand Membership
Idea
21st CenturyBoard Review
InformalLeadershipCommittee
Secure Loans andAdditional Equity
Abandon
Feasibility Study
no
yes
no
yes
ReviewStudies
and MembershipStatus
202
where to locate and whether to build or buy an existing facility are based on sound businessprinciples.
Impact on the Community
It is too early in the processing history to have measurable data on the impact of the newbusinesses in the various communities; however, the work of the 21st Century Alliance should notonly help the ag producer members, but also the member’s respective communities. For instance,the Ladder Creek Dairy employs approximately 30 people, most of whom live locally. The shiftworkers earn up to $1,800 per month (Griekspoor 2000). According to Griekspoor, officials inthe towns of Tribune and Oakley claim that the Ladder Creek facility provides local economicbenefit as a result of the new money. The construction phase alone required 80 workers at a costof $10 million.
The advent of the NGC dairies creates a special kind of dairy by being much larger thanthe traditional family dairy while still being farmer owned. According to Don Reith, manager ofthe Washington County Dairy Cooperative, the NGC dairy improves the quality of life of theemployees because the size of the operation allows employees to work normal shifts ascompared with the traditional dairy farmer who works long days (“The Farmer-Rancher Paper”2000).
Strategic Issues and Future Plans
The strategic emphasis on value-added agribusiness for its membership is apparent. Inaddition, the geographic context of this emphasis is much broader than just the state of Kansas.The “big picture” is to build market share and product value by forming alliances with co-opentities in other states. A network of statewide alliances, similar to 21st Century Alliance, couldfoster value-added enterprises for respective members and also work across the alliances to shareexpertise, gain leverage, and, thus, increase value. Currently, the Alliance is considering theopening of an office in Nebraska to widen the exposure to value-added opportunities. In addition,the 21st Century of Michigan is being organized, which will then become a partner with the 21st
Century Alliance.
The Alliance growth strategy has a strong focus on creating or acquiring businesses relatedto the existing portfolio as well as implementing needed changes to existing businesses toimprove profitability. Three strategic initiatives can be identified:
1. Expanding commodity direct marketing opportunities
The direct marketing opportunities include increasing the market share of the dry beanindustry and gaining new opportunities in grain merchandizing business.
2. Acquiring and/or building processing facilities of existing businesses
This initiative is to capitalize on the learning curve by expanding its business portfoliowith businesses similar to the existing ones. For example, processing businesses beinginvestigated include a dairy, a tortilla manufacturing company, and a corn flour millingplant.
203
3. Lengthening the value chain through forward integration
A cheese processing facility is being considered to add additional value to the dairybusiness. (21st Century Alliance. 2001b)
At the recent 21st Century Alliance annual meeting, an overview of external and internalconsiderations were reviewed in the form of a SWOT analysis. SWOT is the acronym forstrengths, weaknesses, opportunities, and threats.
StrengthsSome of the strengths recognized include the fact that the farmer starts with a strong base in
the value chain by controlling the land and providing the unprocessed resource, better known asa commodity, to the value chain. This strong position at the beginning of the chain, including theability to control the quality of products, creates a logical scenario for the farmer to continue thecontrol of each additional value-added process to the original product.
An additional strength lies in the blend of the current economic climate and the spirit of theproducer. The economic climate can be summed up by failure of the system to create adequatecommodity prices and by a decreasing consumer confidence in the integrity of the food supply.Starlink is just one example of a failure in product integrity. The situation creates strength forenterprising farmers and NGCs by allowing such individuals and entities to distinguishthemselves from the masses and build a reputation of quality.
WeaknessesThe size of the Alliance is a hindrance to growth and overall profitability. Six to seven
hundred members is not enough for the level of the Alliance’s operation. This membership is thesource for capital needed to increase the equity position in existing operations and for equity innew ventures. Not all members share the same desire to invest in certain businesses, so this is anadded strain.
An NGC is typically regional in its resources, which can lead to a relatively narrow focus inmarketing. This focus around resources has been described as a production emphasis when acustomer emphasis is what is really needed. The wheat mill is an example of a situation in whichthe decision to open new markets has steadily improved sales and the profitability of thebusiness.
OpportunitiesThe possession of land is both a strength and an opportunity for ag producers. The large
corporations cannot duplicate the farmer system, so competitive opportunities exist for the localag producer to capture niche markets. The opportunity to build business from this asset base isvery clear but it requires a change in mindset from the contract production mode to a differenthorizon on the value chain.
204
ThreatsA key threat is the inability or unwillingness to move from independence to interdependence
in value-added operations. It takes hard work, precious time, and the acceptance of a differenttype of risk to lengthen the value chain. Without the cooperative approach, it is likely thatfarmers will remain as price takers as they service contracts for various commodities.
Lessons Learned
The Alliance is relatively young, but its aggressive style of working to achieve its objectiveshas created much experience in a short amount of time. It is constantly refining its practices toimprove with each venture. Fortunately, there has not been a major breakdown in the process,and the Alliance management is comfortable with the outcome of the work to date. The numberof start-ups is impressive and may relate to a philosophy of being open-minded and to thediscipline of investing time and energy on the front-end of a project to define the opportunity.In other words, doing the homework. A case in point is the purchase of a New Mexico mill byKansas’s wheat farmers. The overriding objective was to add value to Kansas farmer’s wheat,and the best way to do this was to own a processing mill in New Mexico and to move the wheatto the mill. The key points are to be able to define for the members the opportunity as it relates toagriculture and then the profitability of the project. If both fall short of expectations, then thewise decision is to abandon the concept and to move on to the next one.
The experience of operating new businesses has highlighted the issue of servicing debtand, in general, the issue of being undercapitalized. Owner equity has tended to make up about30 percent of the capital as opposed to a target of 40 percent (Williams 2000). These issues haveimpacted the wheat mill and the dairies. Alliance management recognizes the importance ofachieving an equity capital target before launching a business and intends to meet the stock saleobjective on new businesses in the future (shareholder meeting).
The author notes a possible weakness in the overall entrepreneurial process of the Alliance.As mentioned earlier, the Alliance retains 6 percent of the stock sale proceeds but does not ownany part of a processing facility. Its stock sale commissions are used to fund new businessdevelopment; therefore, the Alliance must continually add new businesses in order to generatenew funds. This may be an issue since some businesses appear to have been launched prior toachieving the stock sale target.
In conclusion, the success of the Alliance has resulted in a search for growth into newareas, both geographic and product line. The Alliance will continue to consider ventures outsidethe state of Kansas and to seek vertical value-added opportunities in the form of processing farmproduction. It also is putting more effort into horizontal value-added opportunities such as grainmerchandising so that production from farms achieve maximum value. This is the age of the 21st
Century Alliance.
205
References
Development of 21st Century Dairies Cooperative announced. 2000. High Plains Journal: TheFarmer-Rancher Paper. (April). Available online: <www.hpj.com/archives/apr00/0307dairyopensconpmHTM.HTM>. Accessed August 24, 2000.
Griekspoor, Phyllis Jacobs. 2000, Dairy farming industry expands in western Kansas. TheWichita Eagle (March 26). Accessed through Lexis Nexis, September 21, 2000.
Kansas Department of Commerce and Housing web site: <www.kansascommerce.com>.
Progressive farmer names Mark Smith of Kansas man of the year. 1998. Progressive Farmer(February 17).
21st Century Alliance. 2001a. 2000 annual report. Manhattan, KS: 21st Century Alliance.
21st Century Alliance. 2001b. Shareholders annual meeting minutes (February 14).
U.S. Department of Agriculture (USDA), National Agricultural Statistics Service. 1997.Available online: <www.nass.usda.gov/census/census97/highlights/ks/ksst.txt>.
Williams, Chris. 2000. Vice President of Operations, 21st Century Alliance. Telephone interviewby Roger Brown on August 11, 2000.
Williams, Chris, and Christopher D. Merrett. 2000. Putting cooperative theory into practice: The21st Century Alliance. In A cooperative approach to local economic development, ed.Christopher D. Merrett and Norman Walzer, pp. 147-166. Westport, CT: Quorum Books.

207
About the Authors
Roger Brown is an instructor in the College of Business and Technology and a researchassociate for the Illinois Institute for Rural Affairs at Western Illinois University. He teaches forthe Management Department and the Marketing and Finance Department at Western IllinoisUniversity. Brown has provided technical support for rural farm groups evaluating agribusiness.
Patricia Buschette co-owns and operates Buschette Farms, Inc. a 1,300 acre corn, soybean,sugar beet, and wheat farm in Renville County located in South Central Minnesota. All of thecorn produced is delivered to value-added cooperatives for processing, including ethanolproduced at Minnesota Corn Processors in Marshall, Minnesota, pork produced at ValAdCo inRenville, Minnesota, and eggs, also produced at Renville. A portion of the soybean crop isdelivered to MINAQUA, a cooperative in Renville raising Tilapia fish. Buschette is currently aLegislative Assistant in Washington, DC for Congressman David Minge. She works onagricultural and environmental issues.
Dave Carter has more than 20 years experience in agricultural organizing and cooperativedevelopment issues. Carter began working for Rocky Mountain Farmers Union in 1978 asDirector of Communication. During the next nine years, Carter handled several facets of publicrelations and legislative work for the organization. In 1987, he became Secretary of the NationalFarmers Union. In that capacity, Carter worked with Farmers Union members in 23 states ongrassroots organizing and cooperative development projects. He was elected president of RockyMountain Farmers Union in November 1993. Under his leadership, the organization has beenactive in representing the concerns of independent agricultural producers in Colorado, Wyoming,and New Mexico.
Lee Egerstrom is a 30-year writer for the St. Paul Pioneer Press and Knight Ridder Newspapers.After serving as a Washington correspondent for Knight Ridder in the 1970s, he has focusedsince 1981 on agribusiness, rural economics, and food companies. He is a past president of theNational Association of Agricultural Journalists and is author or coauthor of three bookspublished in English and Dutch dealing with cooperative business and rural development themes.His 1994 book, Make No Small Plans (Lone Oak Press), coined the term New GenerationCooperatives to describe new cooperative businesses that have limited memberships, requiremember investment to join, and have delivery rights and obligations for adding value to thefarmers’ commodities.
Rodney Fink is Dean Emeritus of the College of Applied Sciences at Western IllinoisUniversity. He has a Ph.D. from the University of Missouri and has worked as an ExtensionAgronomist at Iowa State University and as an Instructor of Field Crops at the University ofPakistan. His recent activities have included consultancies to a number of developing countriesthrough programs supported by the U.S. Agency for International Development. Fink ownsfarmland and is a shareholder in the Golden Triangle Energy Cooperative, Inc. in NorthwestMissouri.
208
Mary Holmes is the manager of the Illinois Value-Added Rural Development Center a unit ofthe Illinois Institute for Rural Affairs at Western Illinois University. Holmes is responsible forcoordinating projects associated with the Illinois Council on Food and Agricultural Research (C-FAR), the Illinois Department of Agriculture (IDoA), and USDA-RD. She is also responsible fordesigning and implementing an agricultural community action planning program (ACAP) to helprural farm groups accelerate their efforts to develop agribusiness and/or value-added farmenterprises. She is a member of the Small Farms Task Force and the Tri-State Value-Added AgTask Force.
Mary Holz-Clause works for Iowa State Extension assisting start-up businesses in value-addedagriculture. She provides marketing and feasibility analysis for new products, processes, andmarkets. Prior to joining Iowa State University, she worked for the Iowa Department ofEconomic Development in the agriculture and research areas. Holz-Clause holds degrees ineconomics, agbusiness, and political science from Iowa State University. She is also activelyinvolved with her husband on their family farm and cattle operation.
Igor Kotov is an agricultural economist from Belarus. He was a Fulbright Scholar working at theQuentin Burdick Center for Cooperatives, North Dakota State University, in Fargo, NorthDakota. He is interested in how cooperative organizations developed in the capitalist system canbe used to help republics of the former Soviet Union make the transition to a market-basedeconomy.
Greg Lawless has been with the University of Wisconsin Center for Cooperatives since 1992. Inrecent years, Lawless has concentrated on “Cooperative Development” projects and topics. Acommon theme in this work has been to introduce the “new generation” cooperative approach toWisconsin farmers, including an organic produce wholesaling cooperative, an incubator forcommercial food processing, and a soybean processing venture. In April 1998, he helpedorganize the Cooperative Developers Training Conferences in Eau Claire and Madison,Wisconsin. In October, 1998, Lawless became co-leader of a new “team” of agriculturalextension agents, called the Emerging Agricultural Markets (EAM) Team.
Christopher D. Merrett is an associate professor of Geography, Illinois Institute for RuralAffairs, Western Illinois University. His current research includes the impact of free trade onregional development in North America, community development and the working poor in theMidwest; welfare reform and rural communities; the role of nongovernment organizations incommunity development; and gender issues and economic development. Teaching interestsinclude Political Geography, Regional Development, Nonmetropolitan Planning, and thePolitical Economy of International Trade.
Norman Walzer is professor of economics and directs the Illinois Institute for Rural Affairs atWestern Illinois University. Walzer is involved in a study of New Generation Cooperativesincluding why they are formed, expectations of the members, and factors that contribute to theirsuccess. He has written numerous publications on state and local public finance issues and hasstudied innovative economic development strategies in rural communities. He is a member of theRural Partners Advisory Board and the Governor’s Rural Affairs Council.

209
Jennifer Waner-Mowen, is a Community and Economic Development Educator withUniversity of Illinois Extension in Pike County. She is responsible for the coordination of PikeCounty Economic Development Corporation, as well as community and economic developmentprogramming including entrepreneurial education/business development, business retention andexpansion, local government issues, the Pike County Mayors and Village Presidents Forum,planning and visioning. She previously held an assistantship in the Illinois Institute for RuralAffairs through the C-FAR Value-Added Agriculture Program and ACAP.