Embed Size (px)
Citation preview
SPECIAL COLLECTION: APATITE: A COMMON MINERAL, UNCOMMONLY VERSATILE
New constraints on electron-beam induced halogen migration in apatite†k
Michael J. Stock1,*, Madeleine c.S. huMphreyS1,2, Victoria c. SMith3, roger d. JohnSon4, daVid M. pyle1, and eiMF5
1Department of Earth Sciences, University of Oxford, South Parks Road, Oxford, OX1 3AN, U.K.2Department of Earth Sciences, Durham University, Science Labs, Durham, DH1 3LE, U.K.
3Research Laboratory for Archaeology and the History of Art, University of Oxford, South Parks Road, Oxford, OX1 3QY, U.K.4Department of Physics, University of Oxford, Parks Road, Oxford, OX1 3PU, U.K.
5Edinburgh Ion Microprobe Facility, University of Edinburgh, Grant Institute, Edinburgh, EH9 3JW, U.K.
abStract
Fluorine and chlorine X‑ray count rates are known to vary significantly during electron probe mi-croanalysis (EPMA) of apatite. Since the rate, timing, and magnitude of this variation are a function of apatite orientation and composition, as well as EPMA operating conditions, this represents a signifi-cant problem for volatile element analysis in apatite. Although the effect is thought to be an intrinsic crystallographic response to electron-beam exposure, the mechanisms and causes of the count rate variability remain unclear. We tackle this by examining directly the effects of electron-beam exposure on apatite, by performing secondary ion mass spectrometry (SIMS) depth profiles of points previously subject to electron‑beam irradiation. During irradiation of fluorapatite, oriented with the c-axis parallel to the electron beam, halogens become progressively concentrated at the sample surface, even under a relatively low power (15 nA, 10–15 kV) beam. This surface enrichment corresponds to an observed increase in EPMA FKa X-ray count rates. After prolonged irradiation, the surface region starts to lose halogens and becomes progressively depleted, corresponding with a drop in EPMA count rates. Under normal EPMA operating conditions there is no halogen redistribution in fluorapatite oriented with the c-axis perpendicular to the electron beam, or in chlorapatite. We infer that anionic enrichment results from the migration of halogens away from a center of charge build-up caused by the implantation of electrons from the EPMA beam, assisted by the thermal gradient induced by electron-matter interactions. The process of surface enrichment is best explained by halogen migration through interstitial crystal-lographic sites in the c‑axis channel. This suggests that once the thermal and electric fields are removed, halogens may relax back to their original positions on very long timescales or with sample heating.
Keywords: Apatite, electron-probe microanalysis, secondary ion mass spectrometry, halogen migration, beam damage
introduction
Apatite group minerals are important in a diverse range of research areas. They represent the most common naturally oc-curring phosphate minerals on Earth and are present as acces-sory phases in most igneous rocks, as well as in sedimentary, metamorphic, and ore-forming systems (e.g., Shemesh 1990; Belousova et al. 2002; Piccoli and Candela 2002; Spear and Pyle 2002). Apatites are integral to many biologic hard tissues, comprising the inorganic component of bones and teeth (Young and Brown 1982; Wopenka and Pasteris 2005). They represent a potentially stable host for the disposal of nuclear waste (Dacheux et al. 2004) and the incorporation of U and Th also permits the use of apatite in radiometric (Zeitler et al. 1987) and fission
track dating (Gleadow et al. 2002). This variety of applications is largely facilitated by an extraordinarily high degree of flexibility in the apatite crystal lattice, which permits the incorporation of numerous trace components (Pan and Fleet 2002).
The general formula of igneous apatite is Ca5(PO4)3X, where X is F– (fluorapatite), Cl– (chlorapatite), or OH– (hydroxyl- apatite) (Elliott 1994). Coupled substitutions also allow incorpora-tion of CO3
2– and S6+ in trace amounts (Pan and Fleet 2002); thus apatite can incorporate each of the major volatile species present in magmatic systems (i.e., H2O, CO2, SO2, F, and Cl). Through the application of appropriate partition or exchange coefficients (e.g., Peng et al. 1997; Mathez and Webster 2005; Webster et al. 2009; Boyce et al. 2010) and with an adequate understanding of volatile diffusion rates (Brenan 1993), measurements of apatite composi-tion can be used to assess pre-eruptive magmatic volatile contents. Thus, petrologic studies are increasingly using variations in apatite composition to interpret magmatic, degassing, and ore-forming processes in terrestrial (e.g., Boyce and Hervig 2008, 2009; Diet-terich and de Silva 2010) and extraterrestrial (e.g., Patiño Douce
American Mineralogist, Volume 100, pages 281–293, 2015
0003-004X/15/0001–281$05.00/DOI: http://dx.doi.org/10.2138/am-2015-4949 281
* E-mail: [email protected]†kSpecial collection papers can be found on GSW at http://ammin.geoscienceworld.org/site/misc/specialissuelist.xhtml. Open access: Article available to all readers online.
STOCK ET AL.: ELECTRON-BEAM INDUCED HALOGEN MIGRATION IN APATITE282
and Roden 2006; Boyce et al. 2010, 2014) environments.Electron probe microanalysis (EPMA) represents the cheap-
est, easiest, and most commonly accessible technique for apatite chemical analysis, allowing direct measurement of F, Cl, and S concentrations and crude calculation of water concentrations “by difference”, assuming stoichiometry (Pyle et al. 2002). Furthermore, the EPMA technique has a high spatial resolution, permitting quantitative analysis on micrometer length scales. This is critical in the analysis of natural apatites, which com-monly occur as 100–300 mm acicular grains, and in the analysis of individual zones within larger apatite crystals. However, many EPMA-derived apatite F concentrations reported in the literature exceed 3.75 wt% (the stoichiometric limit for pure fluorapatite), attesting to significant uncertainties in the technique (Pyle et al. 2002 and references therein). Apatite EPMA is subject to sig-nificant anisotropic, time-dependent variation in FKa and ClKa X-ray count rates during prolonged electron-beam exposure (Stormer et al. 1993), and this largely accounts for erroneous halogen concentration measurements (Pyle et al. 2002). Similar temporal variability in X-ray count rates is observed during EPMA of natural glasses (Lineweaver 1963; Humphreys et al. 2006) and feldspars (Autefage and Couderc 1980), where alkali element X-ray counts drop exponentially during electron-beam exposure. However, in apatite, halogen X-ray count rates rise rapidly on initial beam exposure before more slowly decreasing below initial values (Stormer et al. 1993).
Several studies have investigated the time-dependent varia-tion in apatite halogen X-ray counts, with the aim of optimizing the reliability of apatite volatile analysis by EPMA (Stormer et al. 1993; Henderson 2011; Goldoff et al. 2012). The effect is most pronounced when the incident electron beam is oriented parallel to the crystallographic c-axis and is minimized when the beam is parallel to the a- or b-axis (Stormer and Pierson 1993). In addition to this crystallographic control, count rate variability is also dependent upon the apatite composition. The magnitude of the increase in FKa counts is lower in Cl-rich varieties than in end-member fluorapatite, but does not change systemati-cally with increasing Cl content in intermediate compositions (Goldoff et al. 2012). Conversely, the increase in ClKa count rates is more pronounced in more Cl-rich apatites (Goldoff et al. 2012). Electron-beam conditions also significantly affect halogen count rate variability. Varying the electron-beam ac-celerating voltage has little effect on the magnitude or rate of the initial increase in FKa counts, but it appears to control the rate at which counts subsequently decrease (Stormer et al. 1993) and the absolute number of halogen X-rays produced per unit time, for a fixed current (Goldoff et al. 2012). Irradiation with larger electron-beam diameters reduces the rate of change in halogen X-ray count rates through irradiation (Stormer et al. 1993) and the initial increase in X-ray counts is faster under higher beam currents (Goldoff et al. 2012). Henderson (2011) reports that the variability in halogen X-ray count rates can be reduced by rastering the electron beam or cryogenically cooling the sample during irradiation. One important observation is that re-analysis of the same point on an apatite crystal after a 16 h pause in ir-radiation, showed no recovery in X-ray counts, suggesting that the effect induced by the electron beam is stable over long time periods at ambient temperature (Stormer et al. 1993).
Most of the previous studies focused on optimization of the apatite EPMA procedure, rather than on constraining the physical processes responsible for the time-dependent varia-tion in halogen X-ray count rates. Migration is thought to occur through a vacancy-mediated mechanism, in response to the generation of an electric field within the sample, induced by electron implantation from the EPMA beam (Stormer et al. 1993). In this model, during the initial increase in X-ray count rates F is thought to rise through the sample and react with the surface, where FKa X-rays experience less matrix attenuation. The subsequent drop in count rates is suggested to result from the absorption of a critical energy, breaking the bonds holding F on the sample surface and causing F ions to volatilize into the vacuum (Stormer et al. 1993). Contamination and degradation of the carbon coat (Buse and Kearns 2014) on the apatite surface may also significantly contribute to the decrease in halogen X-ray counts (Stormer et al. 1993). However, these hypotheses have never been tested directly.
In this study, we used secondary ion mass spectrometry (SIMS) to depth-profile regions of apatite crystals that had previ-ously been subjected to electron-beam irradiation for different amounts of time. The novelty of this approach is that it allows us to observe directly any halogen redistribution caused by electron-beam irradiation under different conditions. The main aim of this investigation is to quantify any temporal variability in the location and degree of halogen redistribution within irradiated samples to constrain the processes responsible for the observed time-dependent variability in halogen X-ray count rates during EPMA, and hence test the mechanisms proposed by Stormer et al. (1993). This investigation follows a similar approach to that of Humphreys et al. (2006), in which SIMS depth profiling was successfully applied to determine alkali migration mechanisms in natural glasses.
experiMental MethodS
Apatite sample materialsExperiments in this study were conducted using large single crystals of
near-end-member fluorapatite and chlorapatite. The fluorapatite end-member was from Cerro de Mercado, Durango, Mexico (referred to as Durango), with the chlorapatite from Ødegården Quarry, Bamble, Norway (referred to as Bamble). Table 1 gives the compositions of the apatite standards used. Although not per-fectly homogeneous, Durango apatite is routinely used as a standard reference material (e.g., Boyce and Hervig 2009) and Bamble apatite has been proposed as potential standard in microanalytical studies of apatite halogen concentrations (Marks et al. 2012). Crystallographic orientation was carefully controlled, and checked through the measurement of apparent cleavage angles on the polished surface, and observation of crystal form.
Electron microprobe irradiationApatite samples were mounted in a single epoxy resin block and exposed
to an electron-beam using a JEOL 8600 4-spectrometer electron microprobe, controlled by SAMx software, in the Research Laboratory for Archaeology and the History of Art, University of Oxford. To test the effect of varying apatite composition and crystal orientation both fluorapatite and chlorapatite were ir-radiated, with the fluorapatite oriented both c-axis parallel and perpendicular to the incident electron beam. Prior to irradiation the resin block was polished and carbon coated to a standard thickness of 15 nm, monitored on a polished brass bar. Some thin polishing scratches were preserved to re-locate irradiated points accurately. The positions of irradiated points were documented using a reflected light microscope attached to the EPMA instrument. Apatite crystals were not im-aged using SEM, to avoid any premature electron-beam exposure. Electron-beam

STOCK ET AL.: ELECTRON-BEAM INDUCED HALOGEN MIGRATION IN APATITE 283
conditions and irradiation times were varied systematically between experiments, generally within a realistic range for quantitative analysis. Accelerating voltages were varied from 10 to 20 kV, with beam currents ranging between 10 and 30 nA. The beam diameter was 5 mm except where a focused electron beam was used to provide intense electron bombardment (Table 2). Beam exposure times were varied from 10 to 555 s, with most irradiations conducted for <360 s, as for typical analyses. Irradiation times were monitored using an external timer and a Faraday cage was manually inserted at the end of each irradiation to prevent prolonged electron-beam exposure during data processing. For each irradiation, time scans of raw X-ray counts (FKa, ClKa, CaKa, and PKa) were collected simultaneously on the four spectrometers to observe the time-dependent count rate variability under different operating conditions.
Secondary ion mass spectrometry depth profilingFollowing electron-beam exposure, irradiated areas were analyzed by SIMS,
with a time gap of 32–39 days between EPMA irradiation and SIMS analysis. The carbon coat was first removed by briefly wiping the sample with methanol. This technique was used, rather than re-polishing, to avoid removal of material from the crystal surfaces. The samples were then sputter-coated with Au for 200 s, resulting in a coat thickness of ~30 nm. The SIMS beam was manually lined up with each EPMA spot for each of the experiments by comparison with reflected light images, and using an inclined reflected light microscope attached to the SIMS instrument. In most cases there was no visible mark left from the EPMA irradiation, so scratches left on the sample surface during polishing were used to guide identification of the position of irradiated areas. The ion beam was used to sputter continuously down through the irradiated areas to create depth profiles showing the distribution of elements in damaged areas, as well as adjacent, non-irradiated parts of the crystal. These non-irradiated profiles were run for the same number of cycles as irradiated profiles and provide baseline values for each sample. Baseline profiles were also run at the start and end of each day and when moving between crystals, to check for instrument drift.
All SIMS analyses were conducted using the CAMECA ims-4f ion micro-probe, controlled by Charles Evans and Associates PXT interface and software, at the Ion Microprobe Facility, University of Edinburgh. A 0.2 nA O– primary
ion beam was used, with a net impact energy of 15 kV, yielding a beam diameter of 10–15 mm. The ion beam was not rastered on the sample surface and no field aperture was applied. Secondary ions were extracted at +4.5 keV energy, with no energy offset and a ±40 eV energy window. Mass 4.5 was analyzed to moni-tor the electron multiplier background count rate. 1H+, 12C+, 16O+, (16O1H)+, 19F+, 23Na+, 31P+, 37Cl+, and 42Ca+ were collected in each cycle for 5, 6, 3, 6, 6, 5, 1, 6, and 2 s, respectively. The number of cycles was kept constant at 70, correspond-ing to a counting time of ~1 h, because trial baseline profiles with greater cycle numbers showed large inconsistencies in baseline counts at >70–75 cycles, likely related to edge effects or fractionation of secondary ions escaping from deep pits.
The SIMS instrument was calibrated for the analyte secondary ions prior to each depth profile, on non-irradiated areas close to the actual analysis position. To avoid removal of potentially important surface layers, the depth profiles were ac-quired with no pre-sputter period; the first result in each depth profile is therefore affected by sputtering through the Au coat, seen as anomalously low concentra-tions of elements such as P in both baseline and irradiated depth profiles. The first cycle was therefore removed from the depth profiles and is not considered in further discussion. After one cycle the baseline profiles have approximately constant P and are therefore considered free of Au coat contamination.
All SIMS data are presented as counts per second (CPS) for each isotope, normalized to Ca. This approach removes artifacts in the depth profiles related to fluctuations in the primary ion beam. The CPS/Ca for each point in the irradiated depth profile was then normalized to the baseline CPS/Ca value at the same point (cycle number), permitting easy identification of differences between irradiated and non-irradiated depth profiles. Baseline profiles were all highly reproducible. This approach removes any charging, edge or matrix effects that may occur during depth profiling and cancels out any artifacts imposed by possible minor inhomogeneity in the starting materials.
Sputter rate calibrationSIMS sputtering rates are related to the primary ion beam conditions, physical
properties of sample media, and any existing topography on the sample surface. It must therefore be determined under conditions individual to each study. To do this, a series of calibration SIMS pits was created on non-irradiated areas of the fluorapatite standard, in both orientations, as well as the chlorapatite standard. Calibration pits were created by running for 10, 20, 30, 50, and 70 cycles.
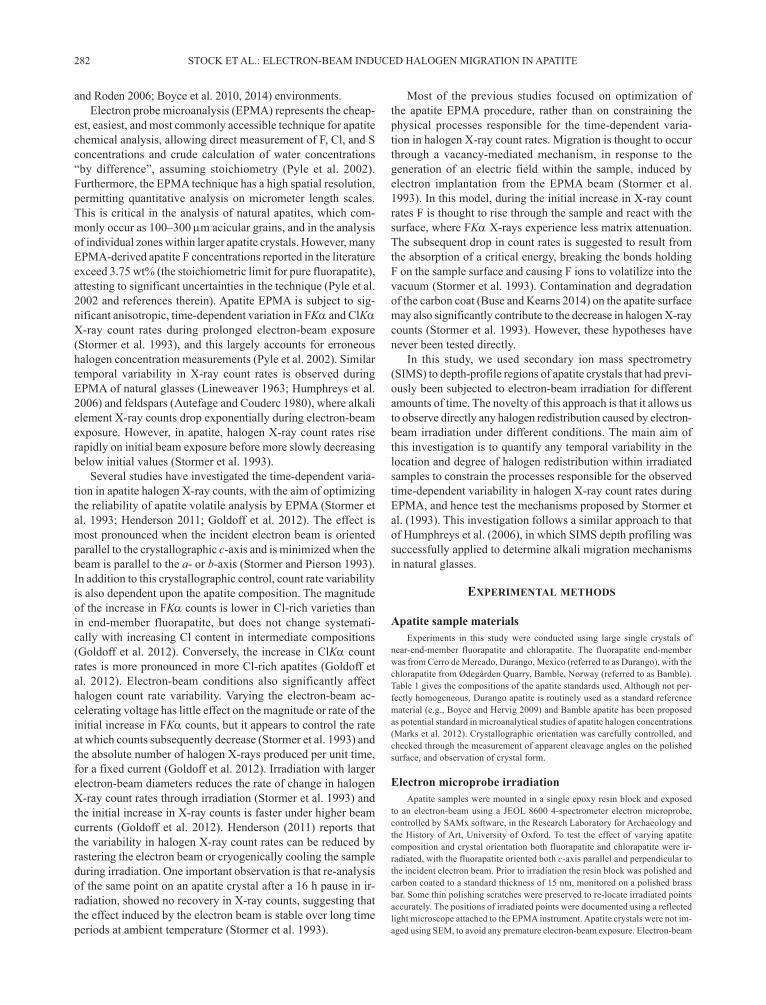
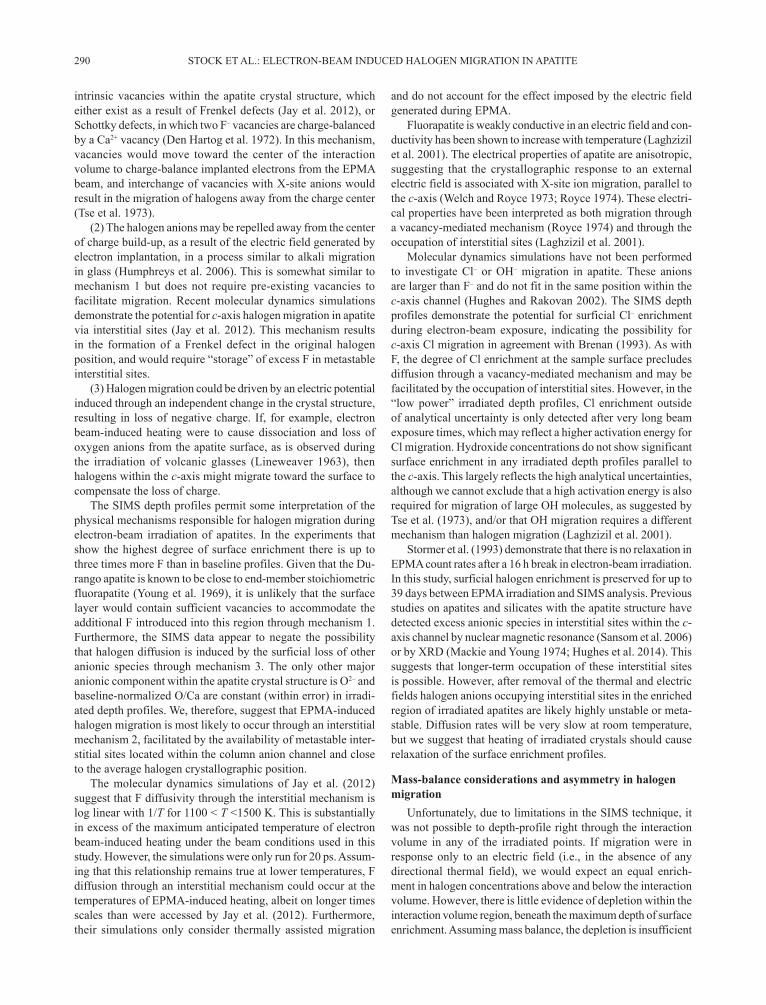
The depths of the calibration pits were measured using a 3D scanning Nano-Focus mSurf white light confocal optical profiler in the Department of Materials, University of Oxford. The system was operated using a 50× objective lens, with a vertical-axis step of 0.01–0.08 mm, depending on the absolute scan range in the z-direction. The profiler was calibrated on a pitted glass reference standard. The certified precision, estimated from multiple calibration measurements, was ±0.01%. The maximum widths of the SIMS pits at the surface are approximately 10–15 mm and thus significantly exceed the nominal diameter of the electron-probe spot. This is necessary to sample the whole EPMA interaction volume with the SIMS beam but may slightly dampen the observed electron-beam induced compositional variations. There is a good linear correlation between the number of cycles and the maximum depth of the SIMS pits (Fig. 1). Fluorapatite and chlorapatite show a difference in sputtering rate, but sputter rates were almost identical for fluorapatite parallel and perpendicular to the c-axis (Fig. 1). In each case, a zero-intercept linear regression through the calibration points was used to quantify the sputter rate. This approach gives maximum depths of 0.88, 0.77, and 0.76 mm in 70-cycle SIMS depth profiles measured in chlorapatite parallel to the c-axis, fluorapatite parallel to the c-axis, and fluorapatite perpendicular to the c-axis, respectively (Fig. 1).
X-ray diffraction experimentsThe published crystal structure of fluorapatite (Elliott 1994), and associated
anisotropic atomic displacement parameters, were refined against single-crystal X-ray diffraction (XRD) data, measured on a sample of Durango apatite with approximate dimensions 50 × 50 × 100 mm, using an Oxford Diffraction, Su-per Nova instrument in the Department of Physics, University of Oxford. An Oxford Cryosystems Cryostream 700 Plus was used to provide in situ sample temperatures from 100–500 K. Full spheres of diffraction data were measured at each temperature (100, 200, 300, 350, 400, 450, and 500 K). Data collection and reduction was performed using the Agilent CrysAlis Pro software package, giving integrated intensities of approximately 530 inequivalent reflections at each temperature. The structural refinement was then run against the reduced data sets using FULLPROF (Rodríguez-Carvajal 1993). Excellent reliability factors of RF
2 < 4% were achieved in all refinements.
Table 1. Published major and trace element compositions of the Durango (fluorapatite) and Bamble (chlorapatite) standards used in the EPMA experiments
wt% Durangoa fluorapatite Bambleb chlorapatiteP2O5 40.78 41.23CaO 54.02 52.73SiO2 0.34 0.05Na2O 0.23 0.40FeOt 0.05 0.08MnO 0.01 0.01SrO 0.07 0.06SO3 0.37 F 3.53 0.08Cl 0.41 6.37–O=F,Cl 1.58 1.47
Total 98.24c 99.54c
XApFluorapatite
d 0.93 0.02XAp
Chlorapatited 0.06 0.94
XApHydroxylapatite
d 0.01 0.04Note: The calculated mole fractions of fluorapatite, chlorapatite, and hydroxyl-apatite are also given.a Young et al. (1969).b Carlson et al. (1999), monoclinic chlorapatite.c Total adjusted for F and Cl in place of O.d Mole fraction of F, Cl, and OH in crystal.
Table 2. Summary of the electron-beam operating conditions used in this study
Operating condition “Goldoff”a “Low power” “Routine” “Extreme”Accelerating voltage (kV) 10 10 15 20Probe current (nA) 4 15 15 30Beam diameter (µm) 10 5 5 Focuseda The recommended conditions of Goldoff et al. (2012), given for comparison.
STOCK ET AL.: ELECTRON-BEAM INDUCED HALOGEN MIGRATION IN APATITE284
reSultS
X-ray diffraction dataAt room temperature, 99% of all measured reflections for
the Durango fluorapatite sample were indexed with the lattice parameters a = b = 9.3955(1) Å, c = 6.8801(1) Å, a = 90°, b = 90°, and g = 120°, consistent with those published by Elliott (1994). (A CIF file is on deposit1.) The diffraction intensities were in agreement with the reflection conditions and Laue class of space group P63/m, giving Rint = 4.78%. This space group symmetry was consistent across all data sets. The structural model, based upon published atomic fractional coordinates, was refined to high accuracy and with good reliability factors (RF
2 = 3.95%, wRF
2 = 7.25%, RF = 2.47%). The apatite crystal structure has 10 calcium ions in the unit cell. Six of these (Ca2 sites) are located on mirror planes at z = ¼ and z = ¾ (Wyckoff position 6h), equivalent by the 63 symmetry operation, and forming two calcium plaquettes with a trigonal planar geometry. In fluorapa-tite, F anions are also located on the mirror planes in the center of the plaquettes, hence surrounded by (and bonded to) three nearest neighbor Ca cations. In contrast, Cl in chlorapatite is located between the mirror planes with six nearest neighbor Ca cations. Thus, in apatite, X-site species occupy a channel-like structure of Ca ions that extends along the crystallographic c-axis (Elliott 1994). Fluorine thermal ellipsoids, defined with a 90% probability, have an elongate, cigar shape, with the major axis extending along the c-axis channel.
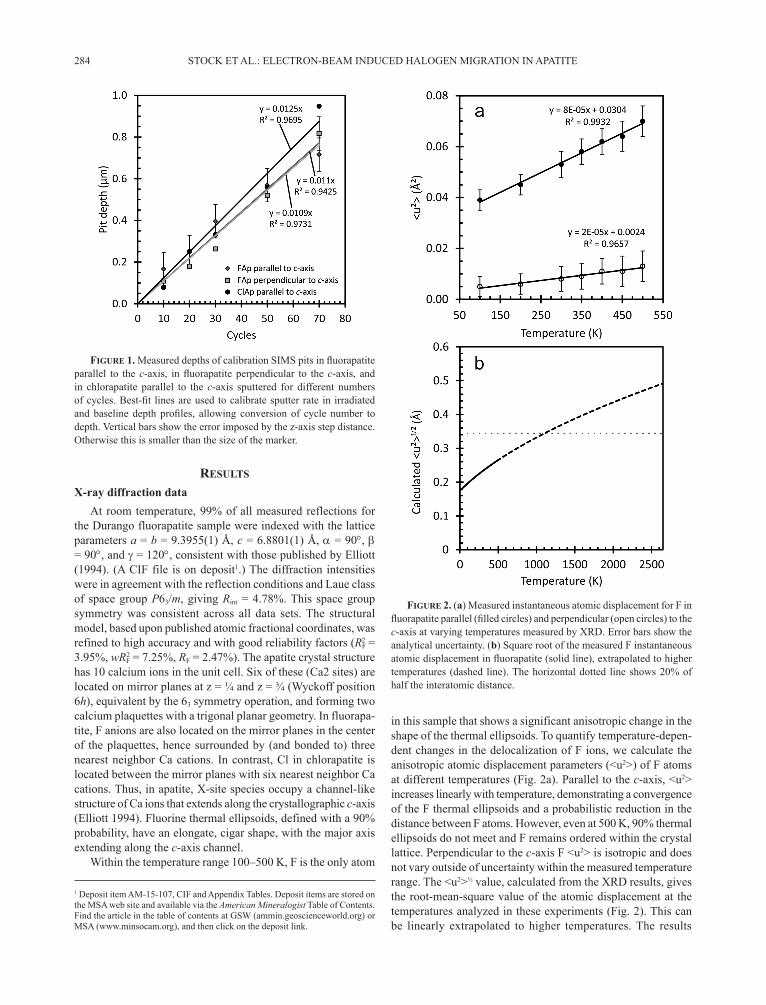
Within the temperature range 100–500 K, F is the only atom
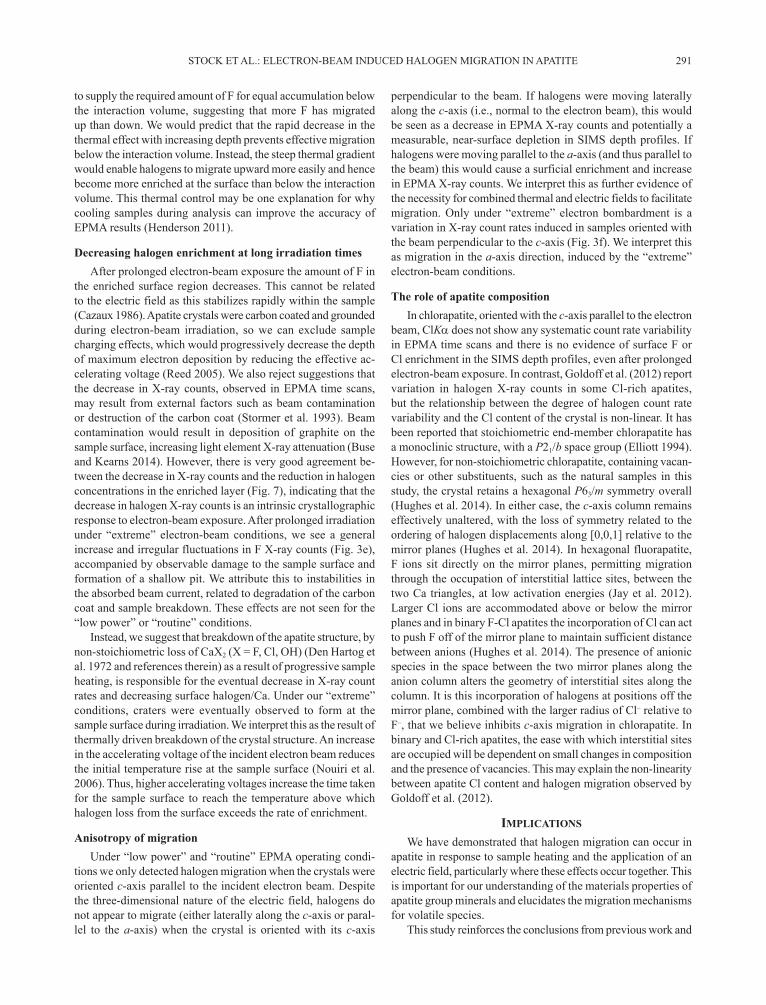
in this sample that shows a significant anisotropic change in the shape of the thermal ellipsoids. To quantify temperature-depen-dent changes in the delocalization of F ions, we calculate the anisotropic atomic displacement parameters (<u2>) of F atoms at different temperatures (Fig. 2a). Parallel to the c-axis, <u2> increases linearly with temperature, demonstrating a convergence of the F thermal ellipsoids and a probabilistic reduction in the distance between F atoms. However, even at 500 K, 90% thermal ellipsoids do not meet and F remains ordered within the crystal lattice. Perpendicular to the c-axis F <u2> is isotropic and does not vary outside of uncertainty within the measured temperature range. The <u2>½ value, calculated from the XRD results, gives the root-mean-square value of the atomic displacement at the temperatures analyzed in these experiments (Fig. 2). This can be linearly extrapolated to higher temperatures. The results
Figure 1. Measured depths of calibration SIMS pits in fluorapatite parallel to the c‑axis, in fluorapatite perpendicular to the c-axis, and in chlorapatite parallel to the c-axis sputtered for different numbers of cycles. Best‑fit lines are used to calibrate sputter rate in irradiated and baseline depth profiles, allowing conversion of cycle number to depth. Vertical bars show the error imposed by the z-axis step distance. Otherwise this is smaller than the size of the marker.
Figure 2. (a) Measured instantaneous atomic displacement for F in fluorapatite parallel (filled circles) and perpendicular (open circles) to the c-axis at varying temperatures measured by XRD. Error bars show the analytical uncertainty. (b) Square root of the measured F instantaneous atomic displacement in fluorapatite (solid line), extrapolated to higher temperatures (dashed line). The horizontal dotted line shows 20% of half the interatomic distance.
1 Deposit item AM-15-107, CIF and Appendix Tables. Deposit items are stored on the MSA web site and available via the American Mineralogist Table of Contents. Find the article in the table of contents at GSW (ammin.geoscienceworld.org) or MSA (www.minsocam.org), and then click on the deposit link.
STOCK ET AL.: ELECTRON-BEAM INDUCED HALOGEN MIGRATION IN APATITE 285
show that at >1100 K the atomic displacement of F in the c-axis direction exceeds 20% of half the interatomic distance (where the interatomic spacing is half of the c-axis lattice parameter) (Fig. 2b). Above this temperature, the Lindemann criterion states that F will become delocalized within the c-axis channel (Chakravarty et al. 2007).
Electron microprobe time scansX-ray count rates were collected every 1.4–1.7 s under elec-
tron-beam conditions typical of normal analysis, as well as under more severe electron-beam conditions with a high energy density, which would be expected to induce high count rate variability (EPMA time scan data are provided in Supplementary Tables A1−A61). The electron-beam conditions used in experiments in this study are summarized in Table 2. The “routine” beam conditions are slightly adapted from the recommended operating procedure of Goldoff et al. (2012) (Table 2), using 15 nA instead
of 4 nA to achieve adequate precision for minor elements (Fe, Mn, Mg, S) and for F and Cl concentrations in natural near-end-member chlorapatite and fluorapatite, respectively. Reducing the spot size from 10 to 5 mm gives greater flexibility in the size of natural grains to be analyzed, and had little impact on the amount of halogen count rate variability. Goldoff et al. (2012) recommend analysis using a 10 kV accelerating voltage, but acknowledge that 15 kV is required for quantification of heavy elements (e.g., Fe). We therefore tested both of these conditions (“low power” and “routine” conditions, respectively) in fluor-apatite oriented with the c-axis parallel to the electron beam.
Our X-ray count rate time scans broadly agree with the results of previous studies (Stormer et al. 1993; Goldoff et al. 2012). There was no change in PKa and CaKa count rates within any of the time scans collected under “routine” or “low power” condi-tions (Fig. 3). In fluorapatite, analyzed parallel to c-axis under “routine” conditions, the FKa count rates rise rapidly on initial
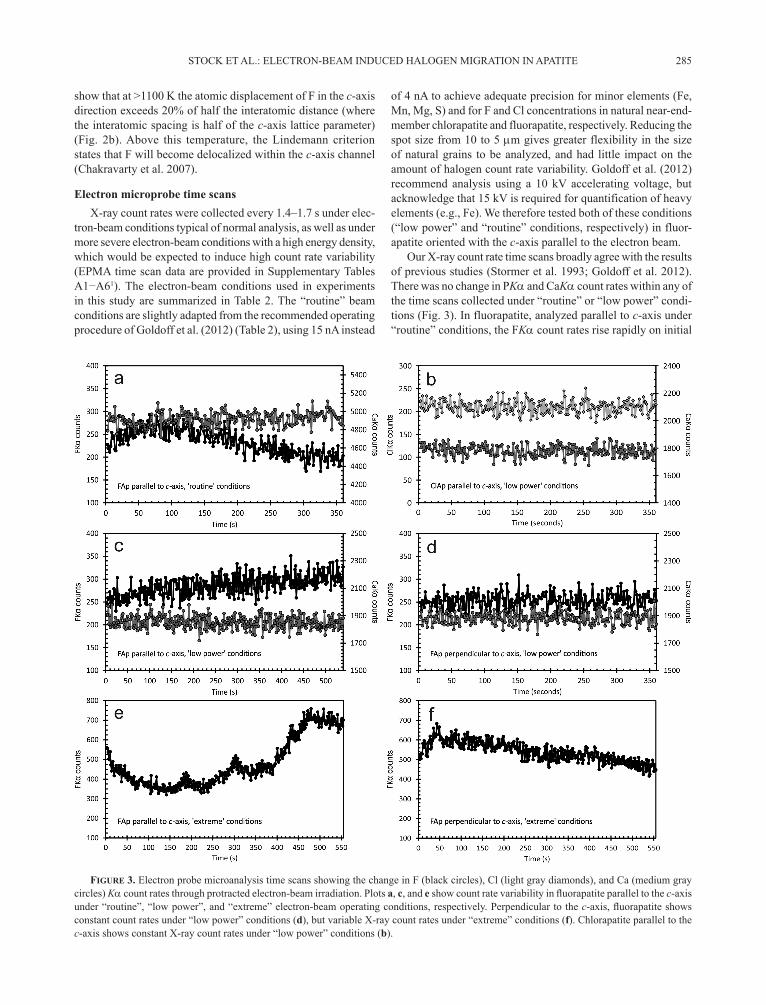
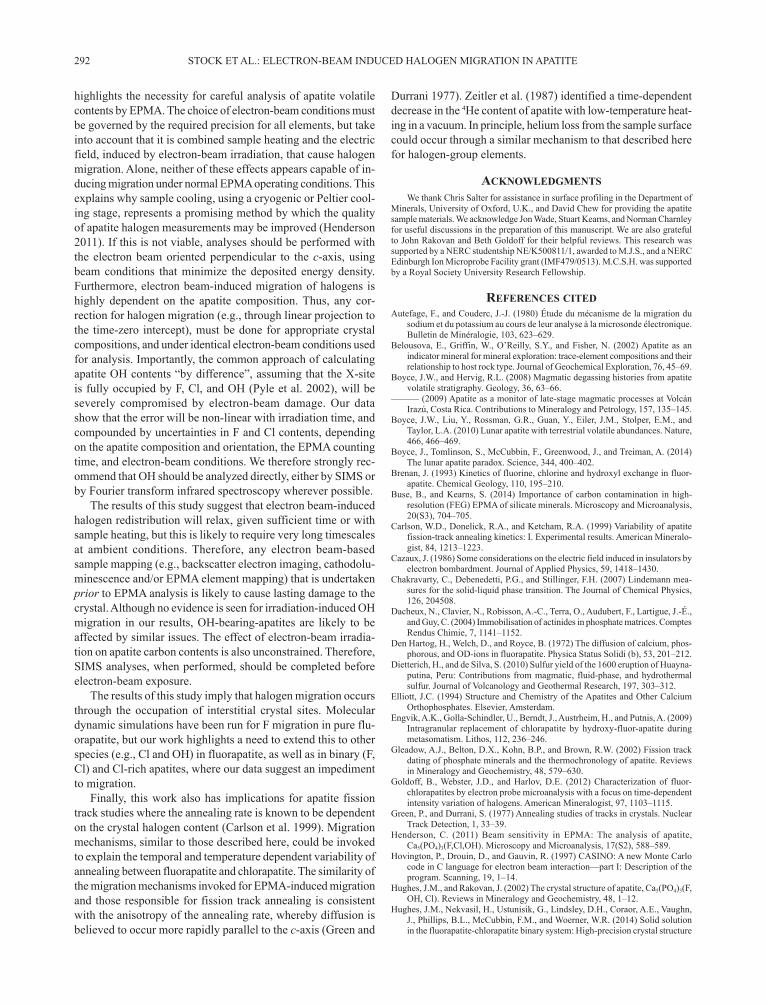
Figure 3. Electron probe microanalysis time scans showing the change in F (black circles), Cl (light gray diamonds), and Ca (medium gray circles) Ka count rates through protracted electron-beam irradiation. Plots a, c, and e show count rate variability in fluorapatite parallel to the c-axis under “routine”, “low power”, and “extreme” electron-beam operating conditions, respectively. Perpendicular to the c‑axis, fluorapatite shows constant count rates under “low power” conditions (d), but variable X-ray count rates under “extreme” conditions (f). Chlorapatite parallel to the c-axis shows constant X-ray count rates under “low power” conditions (b).
STOCK ET AL.: ELECTRON-BEAM INDUCED HALOGEN MIGRATION IN APATITE286
electron-beam exposure (Fig. 3a). They reach a maximum, after the first 80 s of analysis, at which time FKa X-ray counts are ~30% higher than initial values. The peak in intensity is followed by a drop in count rates down below the initial values over the fol-lowing 280 s of electron-beam exposure. As previously reported (Stormer et al. 1993), changing the electron-beam accelerating voltage from 15 to 10 kV extends the period over which FKa X-ray counts increase. In fluorapatite, analyzed under “low power” conditions, the FKa increased continually over 540 s of analysis, with X-ray counts ~30% higher than initial values at the end of the irradiation (Fig. 3c). Although FKa did not start to decrease within this time scan, the experiments of Stormer et al. (1993) suggest that this would happen with continued irradiation. Under both “routine” and “low power” electron-beam conditions ClKa count rates are below the detection limit in fluorapatite.
Under “low power” analytical conditions FKa counts in fluorapatite oriented with the c-axis perpendicular to the incident electron beam are comparable to starting values in time scans for crystals oriented with their c-axis parallel to the beam, but count rates do not change during the experiment (Fig. 3d).
The chlorapatite time scans were measured only under “low power” operating conditions, where the crystal was oriented with the c-axis parallel to the incident electron beam (Fig. 3b). Under these conditions there was no change in the ClKa X-ray count rates over 360 s of analysis. Count rates remained ap-proximately constant, close to initial values. This is in contrast to the data presented by Goldoff et al. (2012), in which Cl-rich apatites show a drop in ClKa X-ray counts with time using a 10 kV beam. Under these beam conditions FKa was below the detection limit in chlorapatite.
Under “extreme” electron-beam conditions, time scans show a different trend for FKa in fluorapatite (Figs. 3e and 3f). Flu-orapatite, oriented with the c-axis parallel to the electron beam, shows an anomalously high initial value followed by a decrease of 40–50% in FKa over the first 140 s of electron-beam expo-sure. After reaching a minimum, counts sharply increase again, exceeding initial values and showing erratic fluctuations for the remainder of the experiment (Fig. 3e). Fluorapatite analyzed with the electron beam oriented perpendicular to c-axis shows an in-crease in FKa counts of 25% over the first 50 s of electron-beam exposure (Fig. 3f). After this, count rates decrease gradually, below initial values, for the remainder of the 555 s irradiation.
Baseline SIMS depth profiles for fluorapatite and chlorapatite
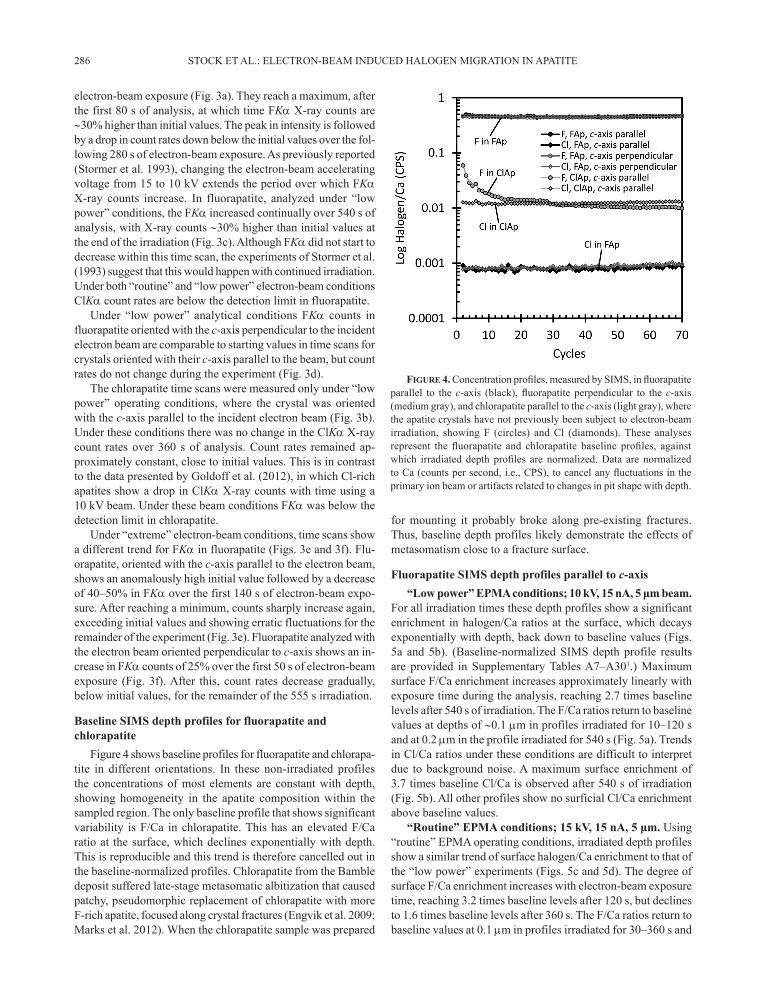
Figure 4 shows baseline profiles for fluorapatite and chlorapa-tite in different orientations. In these non-irradiated profiles the concentrations of most elements are constant with depth, showing homogeneity in the apatite composition within the sampled region. The only baseline profile that shows significant variability is F/Ca in chlorapatite. This has an elevated F/Ca ratio at the surface, which declines exponentially with depth. This is reproducible and this trend is therefore cancelled out in the baseline-normalized profiles. Chlorapatite from the Bamble deposit suffered late-stage metasomatic albitization that caused patchy, pseudomorphic replacement of chlorapatite with more F-rich apatite, focused along crystal fractures (Engvik et al. 2009; Marks et al. 2012). When the chlorapatite sample was prepared
for mounting it probably broke along pre-existing fractures. Thus, baseline depth profiles likely demonstrate the effects of metasomatism close to a fracture surface.
Fluorapatite SIMS depth profiles parallel to c-axis“Low power” EPMA conditions; 10 kV, 15 nA, 5 μm beam.
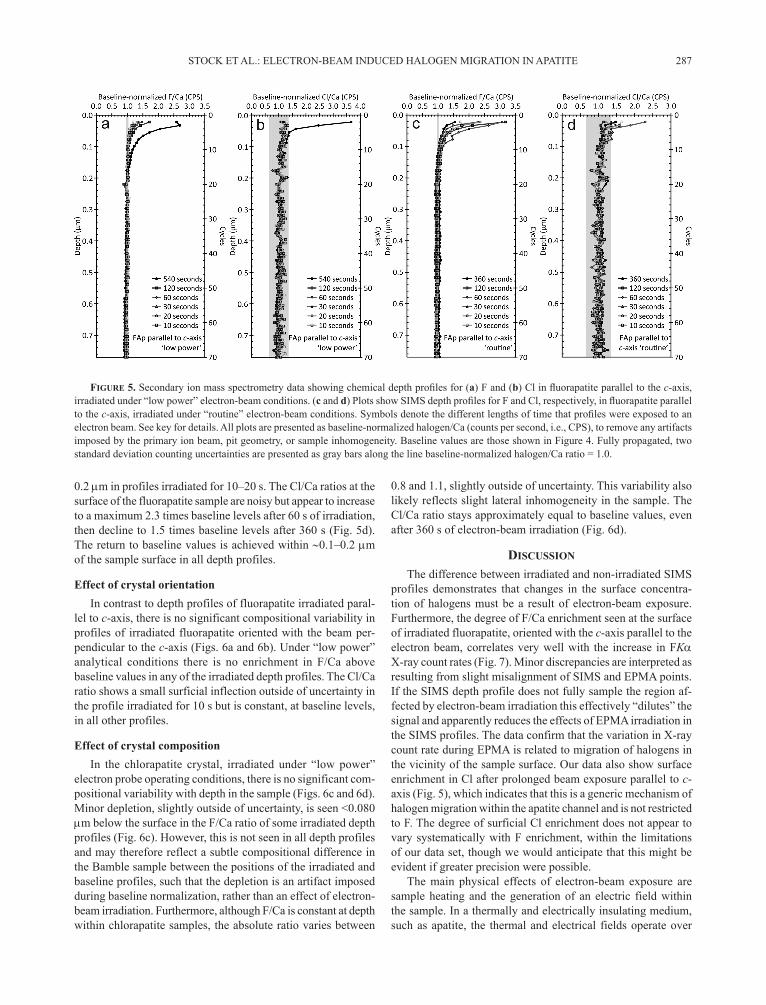
For all irradiation times these depth profiles show a significant enrichment in halogen/Ca ratios at the surface, which decays exponentially with depth, back down to baseline values (Figs. 5a and 5b). (Baseline-normalized SIMS depth profile results are provided in Supplementary Tables A7–A301.) Maximum surface F/Ca enrichment increases approximately linearly with exposure time during the analysis, reaching 2.7 times baseline levels after 540 s of irradiation. The F/Ca ratios return to baseline values at depths of ~0.1 mm in profiles irradiated for 10–120 s and at 0.2 mm in the profile irradiated for 540 s (Fig. 5a). Trends in Cl/Ca ratios under these conditions are difficult to interpret due to background noise. A maximum surface enrichment of 3.7 times baseline Cl/Ca is observed after 540 s of irradiation (Fig. 5b). All other profiles show no surficial Cl/Ca enrichment above baseline values.
“Routine” EPMA conditions; 15 kV, 15 nA, 5 μm. Using “routine” EPMA operating conditions, irradiated depth profiles show a similar trend of surface halogen/Ca enrichment to that of the “low power” experiments (Figs. 5c and 5d). The degree of surface F/Ca enrichment increases with electron-beam exposure time, reaching 3.2 times baseline levels after 120 s, but declines to 1.6 times baseline levels after 360 s. The F/Ca ratios return to baseline values at 0.1 mm in profiles irradiated for 30–360 s and
Figure 4. Concentration profiles, measured by SIMS, in fluorapatite parallel to the c‑axis (black), fluorapatite perpendicular to the c-axis (medium gray), and chlorapatite parallel to the c-axis (light gray), where the apatite crystals have not previously been subject to electron-beam irradiation, showing F (circles) and Cl (diamonds). These analyses represent the fluorapatite and chlorapatite baseline profiles, against which irradiated depth profiles are normalized. Data are normalized to Ca (counts per second, i.e., CPS), to cancel any fluctuations in the primary ion beam or artifacts related to changes in pit shape with depth.
STOCK ET AL.: ELECTRON-BEAM INDUCED HALOGEN MIGRATION IN APATITE 287
0.2 mm in profiles irradiated for 10–20 s. The Cl/Ca ratios at the surface of the fluorapatite sample are noisy but appear to increase to a maximum 2.3 times baseline levels after 60 s of irradiation, then decline to 1.5 times baseline levels after 360 s (Fig. 5d). The return to baseline values is achieved within ~0.1–0.2 mm of the sample surface in all depth profiles.
Effect of crystal orientationIn contrast to depth profiles of fluorapatite irradiated paral-
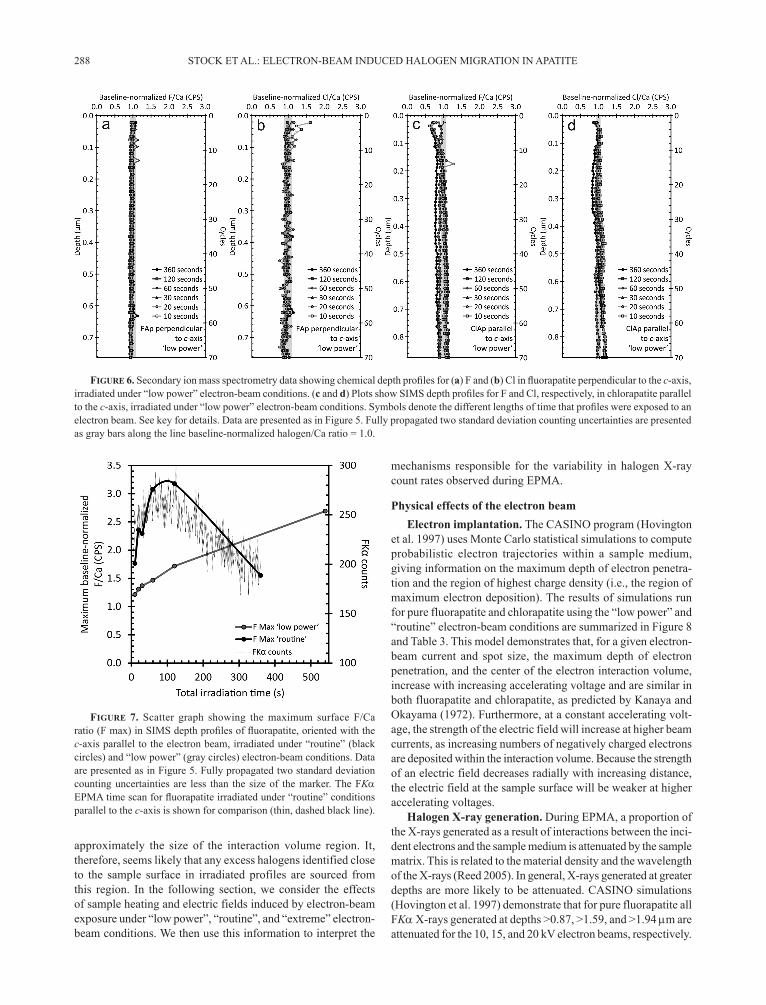
lel to c-axis, there is no significant compositional variability in profiles of irradiated fluorapatite oriented with the beam per-pendicular to the c-axis (Figs. 6a and 6b). Under “low power” analytical conditions there is no enrichment in F/Ca above baseline values in any of the irradiated depth profiles. The Cl/Ca ratio shows a small surficial inflection outside of uncertainty in the profile irradiated for 10 s but is constant, at baseline levels, in all other profiles.
Effect of crystal compositionIn the chlorapatite crystal, irradiated under “low power”
electron probe operating conditions, there is no significant com-positional variability with depth in the sample (Figs. 6c and 6d). Minor depletion, slightly outside of uncertainty, is seen <0.080 mm below the surface in the F/Ca ratio of some irradiated depth profiles (Fig. 6c). However, this is not seen in all depth profiles and may therefore reflect a subtle compositional difference in the Bamble sample between the positions of the irradiated and baseline profiles, such that the depletion is an artifact imposed during baseline normalization, rather than an effect of electron-beam irradiation. Furthermore, although F/Ca is constant at depth within chlorapatite samples, the absolute ratio varies between
0.8 and 1.1, slightly outside of uncertainty. This variability also likely reflects slight lateral inhomogeneity in the sample. The Cl/Ca ratio stays approximately equal to baseline values, even after 360 s of electron-beam irradiation (Fig. 6d).
diScuSSion
The difference between irradiated and non-irradiated SIMS profiles demonstrates that changes in the surface concentra-tion of halogens must be a result of electron-beam exposure. Furthermore, the degree of F/Ca enrichment seen at the surface of irradiated fluorapatite, oriented with the c-axis parallel to the electron beam, correlates very well with the increase in FKa X-ray count rates (Fig. 7). Minor discrepancies are interpreted as resulting from slight misalignment of SIMS and EPMA points. If the SIMS depth profile does not fully sample the region af-fected by electron-beam irradiation this effectively “dilutes” the signal and apparently reduces the effects of EPMA irradiation in the SIMS profiles. The data confirm that the variation in X-ray count rate during EPMA is related to migration of halogens in the vicinity of the sample surface. Our data also show surface enrichment in Cl after prolonged beam exposure parallel to c-axis (Fig. 5), which indicates that this is a generic mechanism of halogen migration within the apatite channel and is not restricted to F. The degree of surficial Cl enrichment does not appear to vary systematically with F enrichment, within the limitations of our data set, though we would anticipate that this might be evident if greater precision were possible.
The main physical effects of electron-beam exposure are sample heating and the generation of an electric field within the sample. In a thermally and electrically insulating medium, such as apatite, the thermal and electrical fields operate over
Figure 5. Secondary ion mass spectrometry data showing chemical depth profiles for (a) F and (b) Cl in fluorapatite parallel to the c-axis, irradiated under “low power” electron-beam conditions. (c and d) Plots show SIMS depth profiles for F and Cl, respectively, in fluorapatite parallel to the c‑axis, irradiated under “routine” electron‑beam conditions. Symbols denote the different lengths of time that profiles were exposed to an electron beam. See key for details. All plots are presented as baseline-normalized halogen/Ca (counts per second, i.e., CPS), to remove any artifacts imposed by the primary ion beam, pit geometry, or sample inhomogeneity. Baseline values are those shown in Figure 4. Fully propagated, two standard deviation counting uncertainties are presented as gray bars along the line baseline-normalized halogen/Ca ratio = 1.0.
STOCK ET AL.: ELECTRON-BEAM INDUCED HALOGEN MIGRATION IN APATITE288
approximately the size of the interaction volume region. It, therefore, seems likely that any excess halogens identified close to the sample surface in irradiated profiles are sourced from this region. In the following section, we consider the effects of sample heating and electric fields induced by electron-beam exposure under “low power”, “routine”, and “extreme” electron-beam conditions. We then use this information to interpret the
mechanisms responsible for the variability in halogen X-ray count rates observed during EPMA.
Physical effects of the electron beamElectron implantation. The CASINO program (Hovington
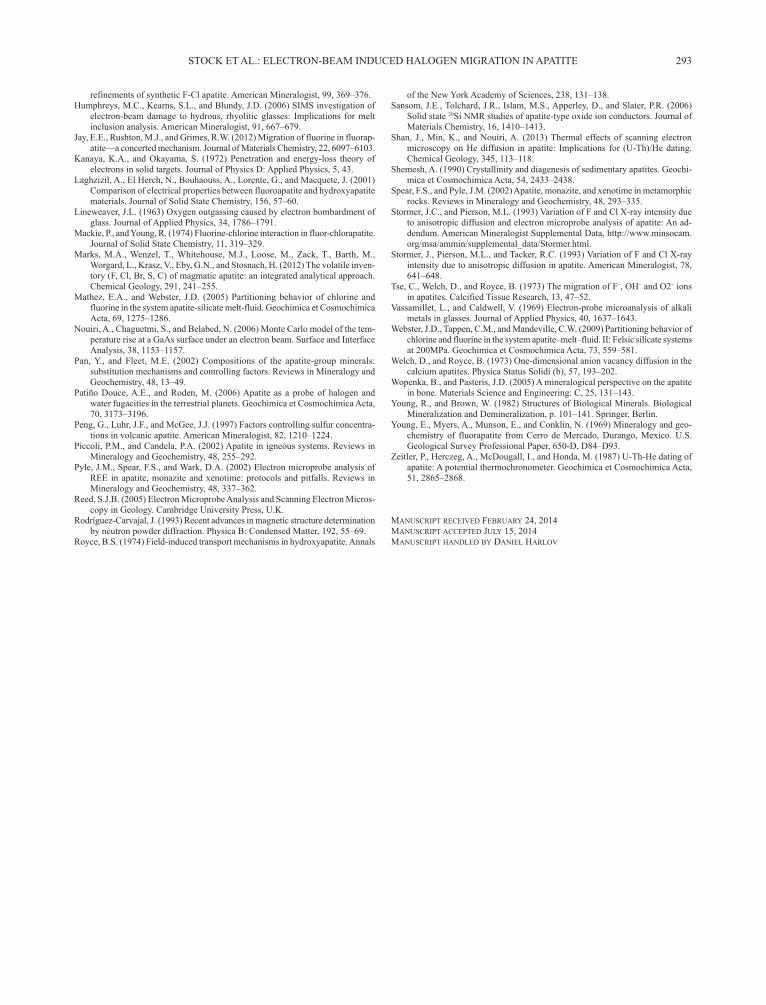
et al. 1997) uses Monte Carlo statistical simulations to compute probabilistic electron trajectories within a sample medium, giving information on the maximum depth of electron penetra-tion and the region of highest charge density (i.e., the region of maximum electron deposition). The results of simulations run for pure fluorapatite and chlorapatite using the “low power” and “routine” electron-beam conditions are summarized in Figure 8 and Table 3. This model demonstrates that, for a given electron-beam current and spot size, the maximum depth of electron penetration, and the center of the electron interaction volume, increase with increasing accelerating voltage and are similar in both fluorapatite and chlorapatite, as predicted by Kanaya and Okayama (1972). Furthermore, at a constant accelerating volt-age, the strength of the electric field will increase at higher beam currents, as increasing numbers of negatively charged electrons are deposited within the interaction volume. Because the strength of an electric field decreases radially with increasing distance, the electric field at the sample surface will be weaker at higher accelerating voltages.
Halogen X‑ray generation. During EPMA, a proportion of the X-rays generated as a result of interactions between the inci-dent electrons and the sample medium is attenuated by the sample matrix. This is related to the material density and the wavelength of the X-rays (Reed 2005). In general, X-rays generated at greater depths are more likely to be attenuated. CASINO simulations (Hovington et al. 1997) demonstrate that for pure fluorapatite all FKa X-rays generated at depths >0.87, >1.59, and >1.94 mm are attenuated for the 10, 15, and 20 kV electron beams, respectively.
Figure 6. Secondary ion mass spectrometry data showing chemical depth profiles for (a) F and (b) Cl in fluorapatite perpendicular to the c-axis, irradiated under “low power” electron-beam conditions. (c and d) Plots show SIMS depth profiles for F and Cl, respectively, in chlorapatite parallel to the c‑axis, irradiated under “low power” electron‑beam conditions. Symbols denote the different lengths of time that profiles were exposed to an electron beam. See key for details. Data are presented as in Figure 5. Fully propagated two standard deviation counting uncertainties are presented as gray bars along the line baseline-normalized halogen/Ca ratio = 1.0.
Figure 7. Scatter graph showing the maximum surface F/Ca ratio (F max) in SIMS depth profiles of fluorapatite, oriented with the c-axis parallel to the electron beam, irradiated under “routine” (black circles) and “low power” (gray circles) electron-beam conditions. Data are presented as in Figure 5. Fully propagated two standard deviation counting uncertainties are less than the size of the marker. The FKa EPMA time scan for fluorapatite irradiated under “routine” conditions parallel to the c-axis is shown for comparison (thin, dashed black line).

STOCK ET AL.: ELECTRON-BEAM INDUCED HALOGEN MIGRATION IN APATITE 289
The intensity of the emitted X-rays is at a maximum close to the sample surface and decreases exponentially with depth (Fig. 8). ClKa X-rays have a higher energy than FKa X-rays and so the degree of attenuation is much lower for a given composition and set of beam conditions. In apatite, under a 10 kV electron beam, 90% of the emitted ClKa X-rays are derived from the top 0.46 mm of the sample (cf. 0.37 mm for FKa at 10 kV) and all ClKa X-rays generated at depths >0.93 mm are attenuated. In other words, FKa X-ray counts reflect variability in the concentration of F very close to the sample surface, above the depth of maxi-mum charge density, while ClKa counts reflect a bulk average of the Cl concentrations extending deeper into the sample and within the electron interaction volume.
Electron beam‑induced heating. Inelastic collisions during electron-sample interactions convert a significant portion of the electron-beam energy into heat within the sample, through excita-tion of lattice oscillations (Nouiri et al. 2006). The amount of heat generated within the interaction volume increases with higher beam power (current × accelerating voltage), and with decreas-
ing spot size and thermal conductivity. Empirical expressions derived by Vassamillet and Caldwell (1969) and Reed (2005) both give a DT of a few degrees, averaged over the interaction volume, for the electron-beam conditions used in the EPMA ir-radiations, assuming an apatite thermal conductivity of 0.0133 W·cm–1·K–1 (Table 3) (Shan et al. 2013). However, because the number of electron-matter interactions decreases outward from the center of the interaction volume, neither model adequately addresses the spatial variability of the beam-induced thermal field. Monte Carlo simulations of electron trajectories in GaAs, taking into account this spatial variability in the electron density, demonstrate an exponential decrease in DT with depth through the interaction volume, with the steepness of the thermal gradient dictated by the accelerating voltage (Nouiri et al. 2006). Shan et al. (2013) further show that the degree of surface heating increases with prolonged electron-beam exposure, due to more electron-matter interactions. These models demonstrate the prin-ciple that electron-beam exposure may induce a steep thermal gradient within the interaction volume (Fig. 8). After 384 s of irradiation, under a 16.5 kV, 1 nA electron beam, apatite crystals may experience a temperature rise of ~30 K close to the sample surface, which decays to <5 K within the top ~0.3 mm (Shan et al. 2013). However, Nouiri et al. (2006) demonstrate that small changes in the primary beam current can greatly increase the degree of surface heating, particularly at lower accelerating voltages. We therefore consider it feasible that the crystals in this study may experience a temperature rise of >200 K close to the sample surface.
New constraints on the halogen migration mechanism in fluorapatite
Fluorine remains localized in all of our XRD results, demon-strating that thermally induced diffusion alone cannot occur at the temperatures experienced during electron-beam irradiation. Therefore, surface halogen enrichment must be related to the combined influence of the thermal and electric fields imposed by the beam. This is consistent with the greater electrical con-ductivity of apatite at higher temperatures, explained by charge transfer through anionic migration (Laghzizil et al. 2001). The observed mobility of halogen anions is likely facilitated by their local crystallographic environment.
During electron-beam exposure several physical mechanisms may be responsible for the transportation of halogen ions along the c-axis channel:
(1) Vacancy-mediated migration (Tse et al. 1973; Welch and Royce 1973). This mechanism requires the presence of
Figure 8. Summary diagram showing the combined effects of electron-beam exposure under different electron-beam conditions. (left) Histogram showing the implantation depths of electrons in apatite, modeled using the CASINO Monte Carlo simulation (Hovington et al. 1997). Light gray = “extreme” conditions (20 kV), medium gray = “routine” conditions (15 kV), and black = “low power” conditions (10 kV). (center) Intensity of halogen X-rays, generated within the sample that are emitted at the surface (i.e., unattenuated), calculated using CASINO (Hovington et al. 1997). Grayscale as above. The labeled light gray line shows Cl X-ray attenuation in chlorapatite under “low power” conditions. (right) Schematic thermal gradient within fluorapatite during electron-beam irradiation at 16.5 kV, adapted from Shan et al. (2013).
Table 3. Summary of model outputs, showing the simulated electron penetration and average heating under different electron-beam operating conditions; the maximum depth of F enrichment in fluorapatite parallel to the c-axis is shown for comparison
Simulation conditions Maximum electron Depth of maximum DTVCb
(K) DTRc
(K) Maximum depth of penetration depth (µm)a electron density (µm)a F enriched region (µm)Fluorapatite “low power” 0.9 0.5 7.2 10.8 0.21Chlorapatite “low power” 0.9 0.5 – – –Fluorapatite “routine” 1.9 0.8 10.8 16.2 0.19Fluorapatite “extreme” 3.1 1.5 28.7 43.3 –Notes: Fluorapatite density = 3.10 g/cm–1, chlorapatite density = 3.17 g/cm–1. Thermal conductivity for fluorapatite = 0.0133 W·cm–1·K–1 (Shan et al. 2013). Focused electron-beam diameter = 0.2 µm. a Modeled for pure fluorapatite or chlorapatite using the CASINO simulation (Hovington et al. 1997).b Estimate of electron-beam induced heating averaged over the entire interaction volume from Vassamillet and Caldwell (1969).c Estimate of electron-beam induced heating averaged over the entire interaction volume from Reed (2005).
STOCK ET AL.: ELECTRON-BEAM INDUCED HALOGEN MIGRATION IN APATITE290
intrinsic vacancies within the apatite crystal structure, which either exist as a result of Frenkel defects (Jay et al. 2012), or Schottky defects, in which two F– vacancies are charge-balanced by a Ca2+ vacancy (Den Hartog et al. 1972). In this mechanism, vacancies would move toward the center of the interaction volume to charge-balance implanted electrons from the EPMA beam, and interchange of vacancies with X-site anions would result in the migration of halogens away from the charge center (Tse et al. 1973).
(2) The halogen anions may be repelled away from the center of charge build-up, as a result of the electric field generated by electron implantation, in a process similar to alkali migration in glass (Humphreys et al. 2006). This is somewhat similar to mechanism 1 but does not require pre-existing vacancies to facilitate migration. Recent molecular dynamics simulations demonstrate the potential for c-axis halogen migration in apatite via interstitial sites (Jay et al. 2012). This mechanism results in the formation of a Frenkel defect in the original halogen position, and would require “storage” of excess F in metastable interstitial sites.
(3) Halogen migration could be driven by an electric potential induced through an independent change in the crystal structure, resulting in loss of negative charge. If, for example, electron beam-induced heating were to cause dissociation and loss of oxygen anions from the apatite surface, as is observed during the irradiation of volcanic glasses (Lineweaver 1963), then halogens within the c-axis might migrate toward the surface to compensate the loss of charge.
The SIMS depth profiles permit some interpretation of the physical mechanisms responsible for halogen migration during electron-beam irradiation of apatites. In the experiments that show the highest degree of surface enrichment there is up to three times more F than in baseline profiles. Given that the Du-rango apatite is known to be close to end-member stoichiometric fluorapatite (Young et al. 1969), it is unlikely that the surface layer would contain sufficient vacancies to accommodate the additional F introduced into this region through mechanism 1. Furthermore, the SIMS data appear to negate the possibility that halogen diffusion is induced by the surficial loss of other anionic species through mechanism 3. The only other major anionic component within the apatite crystal structure is O2– and baseline-normalized O/Ca are constant (within error) in irradi-ated depth profiles. We, therefore, suggest that EPMA-induced halogen migration is most likely to occur through an interstitial mechanism 2, facilitated by the availability of metastable inter-stitial sites located within the column anion channel and close to the average halogen crystallographic position.
The molecular dynamics simulations of Jay et al. (2012) suggest that F diffusivity through the interstitial mechanism is log linear with 1/T for 1100 < T <1500 K. This is substantially in excess of the maximum anticipated temperature of electron beam-induced heating under the beam conditions used in this study. However, the simulations were only run for 20 ps. Assum-ing that this relationship remains true at lower temperatures, F diffusion through an interstitial mechanism could occur at the temperatures of EPMA-induced heating, albeit on longer times scales than were accessed by Jay et al. (2012). Furthermore, their simulations only consider thermally assisted migration
and do not account for the effect imposed by the electric field generated during EPMA.
Fluorapatite is weakly conductive in an electric field and con-ductivity has been shown to increase with temperature (Laghzizil et al. 2001). The electrical properties of apatite are anisotropic, suggesting that the crystallographic response to an external electric field is associated with X-site ion migration, parallel to the c-axis (Welch and Royce 1973; Royce 1974). These electri-cal properties have been interpreted as both migration through a vacancy-mediated mechanism (Royce 1974) and through the occupation of interstitial sites (Laghzizil et al. 2001).
Molecular dynamics simulations have not been performed to investigate Cl– or OH– migration in apatite. These anions are larger than F– and do not fit in the same position within the c-axis channel (Hughes and Rakovan 2002). The SIMS depth profiles demonstrate the potential for surficial Cl– enrichment during electron-beam exposure, indicating the possibility for c-axis Cl migration in agreement with Brenan (1993). As with F, the degree of Cl enrichment at the sample surface precludes diffusion through a vacancy-mediated mechanism and may be facilitated by the occupation of interstitial sites. However, in the “low power” irradiated depth profiles, Cl enrichment outside of analytical uncertainty is only detected after very long beam exposure times, which may reflect a higher activation energy for Cl migration. Hydroxide concentrations do not show significant surface enrichment in any irradiated depth profiles parallel to the c-axis. This largely reflects the high analytical uncertainties, although we cannot exclude that a high activation energy is also required for migration of large OH molecules, as suggested by Tse et al. (1973), and/or that OH migration requires a different mechanism than halogen migration (Laghzizil et al. 2001).
Stormer et al. (1993) demonstrate that there is no relaxation in EPMA count rates after a 16 h break in electron-beam irradiation. In this study, surficial halogen enrichment is preserved for up to 39 days between EPMA irradiation and SIMS analysis. Previous studies on apatites and silicates with the apatite structure have detected excess anionic species in interstitial sites within the c-axis channel by nuclear magnetic resonance (Sansom et al. 2006) or by XRD (Mackie and Young 1974; Hughes et al. 2014). This suggests that longer-term occupation of these interstitial sites is possible. However, after removal of the thermal and electric fields halogen anions occupying interstitial sites in the enriched region of irradiated apatites are likely highly unstable or meta-stable. Diffusion rates will be very slow at room temperature, but we suggest that heating of irradiated crystals should cause relaxation of the surface enrichment profiles.
Mass-balance considerations and asymmetry in halogen migration
Unfortunately, due to limitations in the SIMS technique, it was not possible to depth-profile right through the interaction volume in any of the irradiated points. If migration were in response only to an electric field (i.e., in the absence of any directional thermal field), we would expect an equal enrich-ment in halogen concentrations above and below the interaction volume. However, there is little evidence of depletion within the interaction volume region, beneath the maximum depth of surface enrichment. Assuming mass balance, the depletion is insufficient
STOCK ET AL.: ELECTRON-BEAM INDUCED HALOGEN MIGRATION IN APATITE 291
to supply the required amount of F for equal accumulation below the interaction volume, suggesting that more F has migrated up than down. We would predict that the rapid decrease in the thermal effect with increasing depth prevents effective migration below the interaction volume. Instead, the steep thermal gradient would enable halogens to migrate upward more easily and hence become more enriched at the surface than below the interaction volume. This thermal control may be one explanation for why cooling samples during analysis can improve the accuracy of EPMA results (Henderson 2011).
Decreasing halogen enrichment at long irradiation timesAfter prolonged electron-beam exposure the amount of F in
the enriched surface region decreases. This cannot be related to the electric field as this stabilizes rapidly within the sample (Cazaux 1986). Apatite crystals were carbon coated and grounded during electron-beam irradiation, so we can exclude sample charging effects, which would progressively decrease the depth of maximum electron deposition by reducing the effective ac-celerating voltage (Reed 2005). We also reject suggestions that the decrease in X-ray counts, observed in EPMA time scans, may result from external factors such as beam contamination or destruction of the carbon coat (Stormer et al. 1993). Beam contamination would result in deposition of graphite on the sample surface, increasing light element X-ray attenuation (Buse and Kearns 2014). However, there is very good agreement be-tween the decrease in X-ray counts and the reduction in halogen concentrations in the enriched layer (Fig. 7), indicating that the decrease in halogen X-ray counts is an intrinsic crystallographic response to electron-beam exposure. After prolonged irradiation under “extreme” electron-beam conditions, we see a general increase and irregular fluctuations in F X-ray counts (Fig. 3e), accompanied by observable damage to the sample surface and formation of a shallow pit. We attribute this to instabilities in the absorbed beam current, related to degradation of the carbon coat and sample breakdown. These effects are not seen for the “low power” or “routine” conditions.
Instead, we suggest that breakdown of the apatite structure, by non-stoichiometric loss of CaX2 (X = F, Cl, OH) (Den Hartog et al. 1972 and references therein) as a result of progressive sample heating, is responsible for the eventual decrease in X-ray count rates and decreasing surface halogen/Ca. Under our “extreme” conditions, craters were eventually observed to form at the sample surface during irradiation. We interpret this as the result of thermally driven breakdown of the crystal structure. An increase in the accelerating voltage of the incident electron beam reduces the initial temperature rise at the sample surface (Nouiri et al. 2006). Thus, higher accelerating voltages increase the time taken for the sample surface to reach the temperature above which halogen loss from the surface exceeds the rate of enrichment.
Anisotropy of migrationUnder “low power” and “routine” EPMA operating condi-
tions we only detected halogen migration when the crystals were oriented c-axis parallel to the incident electron beam. Despite the three-dimensional nature of the electric field, halogens do not appear to migrate (either laterally along the c-axis or paral-lel to the a-axis) when the crystal is oriented with its c-axis
perpendicular to the beam. If halogens were moving laterally along the c-axis (i.e., normal to the electron beam), this would be seen as a decrease in EPMA X-ray counts and potentially a measurable, near-surface depletion in SIMS depth profiles. If halogens were moving parallel to the a-axis (and thus parallel to the beam) this would cause a surficial enrichment and increase in EPMA X-ray counts. We interpret this as further evidence of the necessity for combined thermal and electric fields to facilitate migration. Only under “extreme” electron bombardment is a variation in X-ray count rates induced in samples oriented with the beam perpendicular to the c-axis (Fig. 3f). We interpret this as migration in the a-axis direction, induced by the “extreme” electron-beam conditions.
The role of apatite compositionIn chlorapatite, oriented with the c-axis parallel to the electron
beam, ClKa does not show any systematic count rate variability in EPMA time scans and there is no evidence of surface F or Cl enrichment in the SIMS depth profiles, even after prolonged electron-beam exposure. In contrast, Goldoff et al. (2012) report variation in halogen X-ray counts in some Cl-rich apatites, but the relationship between the degree of halogen count rate variability and the Cl content of the crystal is non-linear. It has been reported that stoichiometric end-member chlorapatite has a monoclinic structure, with a P21/b space group (Elliott 1994). However, for non-stoichiometric chlorapatite, containing vacan-cies or other substituents, such as the natural samples in this study, the crystal retains a hexagonal P63/m symmetry overall (Hughes et al. 2014). In either case, the c-axis column remains effectively unaltered, with the loss of symmetry related to the ordering of halogen displacements along [0,0,1] relative to the mirror planes (Hughes et al. 2014). In hexagonal fluorapatite, F ions sit directly on the mirror planes, permitting migration through the occupation of interstitial lattice sites, between the two Ca triangles, at low activation energies (Jay et al. 2012). Larger Cl ions are accommodated above or below the mirror planes and in binary F-Cl apatites the incorporation of Cl can act to push F off of the mirror plane to maintain sufficient distance between anions (Hughes et al. 2014). The presence of anionic species in the space between the two mirror planes along the anion column alters the geometry of interstitial sites along the column. It is this incorporation of halogens at positions off the mirror plane, combined with the larger radius of Cl– relative to F–, that we believe inhibits c-axis migration in chlorapatite. In binary and Cl-rich apatites, the ease with which interstitial sites are occupied will be dependent on small changes in composition and the presence of vacancies. This may explain the non-linearity between apatite Cl content and halogen migration observed by Goldoff et al. (2012).
iMplicationS
We have demonstrated that halogen migration can occur in apatite in response to sample heating and the application of an electric field, particularly where these effects occur together. This is important for our understanding of the materials properties of apatite group minerals and elucidates the migration mechanisms for volatile species.
This study reinforces the conclusions from previous work and
STOCK ET AL.: ELECTRON-BEAM INDUCED HALOGEN MIGRATION IN APATITE292
highlights the necessity for careful analysis of apatite volatile contents by EPMA. The choice of electron-beam conditions must be governed by the required precision for all elements, but take into account that it is combined sample heating and the electric field, induced by electron-beam irradiation, that cause halogen migration. Alone, neither of these effects appears capable of in-ducing migration under normal EPMA operating conditions. This explains why sample cooling, using a cryogenic or Peltier cool-ing stage, represents a promising method by which the quality of apatite halogen measurements may be improved (Henderson 2011). If this is not viable, analyses should be performed with the electron beam oriented perpendicular to the c-axis, using beam conditions that minimize the deposited energy density. Furthermore, electron beam-induced migration of halogens is highly dependent on the apatite composition. Thus, any cor-rection for halogen migration (e.g., through linear projection to the time-zero intercept), must be done for appropriate crystal compositions, and under identical electron-beam conditions used for analysis. Importantly, the common approach of calculating apatite OH contents “by difference”, assuming that the X-site is fully occupied by F, Cl, and OH (Pyle et al. 2002), will be severely compromised by electron-beam damage. Our data show that the error will be non-linear with irradiation time, and compounded by uncertainties in F and Cl contents, depending on the apatite composition and orientation, the EPMA counting time, and electron-beam conditions. We therefore strongly rec-ommend that OH should be analyzed directly, either by SIMS or by Fourier transform infrared spectroscopy wherever possible.
The results of this study suggest that electron beam-induced halogen redistribution will relax, given sufficient time or with sample heating, but this is likely to require very long timescales at ambient conditions. Therefore, any electron beam-based sample mapping (e.g., backscatter electron imaging, cathodolu-minescence and/or EPMA element mapping) that is undertaken prior to EPMA analysis is likely to cause lasting damage to the crystal. Although no evidence is seen for irradiation-induced OH migration in our results, OH-bearing-apatites are likely to be affected by similar issues. The effect of electron-beam irradia-tion on apatite carbon contents is also unconstrained. Therefore, SIMS analyses, when performed, should be completed before electron-beam exposure.
The results of this study imply that halogen migration occurs through the occupation of interstitial crystal sites. Molecular dynamic simulations have been run for F migration in pure flu-orapatite, but our work highlights a need to extend this to other species (e.g., Cl and OH) in fluorapatite, as well as in binary (F, Cl) and Cl-rich apatites, where our data suggest an impediment to migration.
Finally, this work also has implications for apatite fission track studies where the annealing rate is known to be dependent on the crystal halogen content (Carlson et al. 1999). Migration mechanisms, similar to those described here, could be invoked to explain the temporal and temperature dependent variability of annealing between fluorapatite and chlorapatite. The similarity of the migration mechanisms invoked for EPMA-induced migration and those responsible for fission track annealing is consistent with the anisotropy of the annealing rate, whereby diffusion is believed to occur more rapidly parallel to the c-axis (Green and
Durrani 1977). Zeitler et al. (1987) identified a time-dependent decrease in the 4He content of apatite with low-temperature heat-ing in a vacuum. In principle, helium loss from the sample surface could occur through a similar mechanism to that described here for halogen-group elements.
acknowledgMentSWe thank Chris Salter for assistance in surface profiling in the Department of
Minerals, University of Oxford, U.K., and David Chew for providing the apatite sample materials. We acknowledge Jon Wade, Stuart Kearns, and Norman Charnley for useful discussions in the preparation of this manuscript. We are also grateful to John Rakovan and Beth Goldoff for their helpful reviews. This research was supported by a NERC studentship NE/K500811/1, awarded to M.J.S., and a NERC Edinburgh Ion Microprobe Facility grant (IMF479/0513). M.C.S.H. was supported by a Royal Society University Research Fellowship.
reFerenceS citedAutefage, F., and Couderc, J.-J. (1980) Étude du mécanisme de la migration du
sodium et du potassium au cours de leur analyse à la microsonde électronique. Bulletin de Minéralogie, 103, 623–629.
Belousova, E., Griffin, W., O’Reilly, S.Y., and Fisher, N. (2002) Apatite as an indicator mineral for mineral exploration: trace-element compositions and their relationship to host rock type. Journal of Geochemical Exploration, 76, 45–69.
Boyce, J.W., and Hervig, R.L. (2008) Magmatic degassing histories from apatite volatile stratigraphy. Geology, 36, 63–66.
——— (2009) Apatite as a monitor of late-stage magmatic processes at Volcán Irazú, Costa Rica. Contributions to Mineralogy and Petrology, 157, 135–145.
Boyce, J.W., Liu, Y., Rossman, G.R., Guan, Y., Eiler, J.M., Stolper, E.M., and Taylor, L.A. (2010) Lunar apatite with terrestrial volatile abundances. Nature, 466, 466–469.
Boyce, J., Tomlinson, S., McCubbin, F., Greenwood, J., and Treiman, A. (2014) The lunar apatite paradox. Science, 344, 400–402.
Brenan, J. (1993) Kinetics of fluorine, chlorine and hydroxyl exchange in fluor-apatite. Chemical Geology, 110, 195–210.
Buse, B., and Kearns, S. (2014) Importance of carbon contamination in high-resolution (FEG) EPMA of silicate minerals. Microscopy and Microanalysis, 20(S3), 704–705.
Carlson, W.D., Donelick, R.A., and Ketcham, R.A. (1999) Variability of apatite fission-track annealing kinetics: I. Experimental results. American Mineralo-gist, 84, 1213–1223.
Cazaux, J. (1986) Some considerations on the electric field induced in insulators by electron bombardment. Journal of Applied Physics, 59, 1418–1430.
Chakravarty, C., Debenedetti, P.G., and Stillinger, F.H. (2007) Lindemann mea-sures for the solid-liquid phase transition. The Journal of Chemical Physics, 126, 204508.
Dacheux, N., Clavier, N., Robisson, A.-C., Terra, O., Audubert, F., Lartigue, J.-É., and Guy, C. (2004) Immobilisation of actinides in phosphate matrices. Comptes Rendus Chimie, 7, 1141–1152.
Den Hartog, H., Welch, D., and Royce, B. (1972) The diffusion of calcium, phos-phorous, and OD-ions in fluorapatite. Physica Status Solidi (b), 53, 201–212.
Dietterich, H., and de Silva, S. (2010) Sulfur yield of the 1600 eruption of Huayna-putina, Peru: Contributions from magmatic, fluid-phase, and hydrothermal sulfur. Journal of Volcanology and Geothermal Research, 197, 303–312.
Elliott, J.C. (1994) Structure and Chemistry of the Apatites and Other Calcium Orthophosphates. Elsevier, Amsterdam.
Engvik, A.K., Golla-Schindler, U., Berndt, J., Austrheim, H., and Putnis, A. (2009) Intragranular replacement of chlorapatite by hydroxy-fluor-apatite during metasomatism. Lithos, 112, 236–246.
Gleadow, A.J., Belton, D.X., Kohn, B.P., and Brown, R.W. (2002) Fission track dating of phosphate minerals and the thermochronology of apatite. Reviews in Mineralogy and Geochemistry, 48, 579–630.
Goldoff, B., Webster, J.D., and Harlov, D.E. (2012) Characterization of fluor-chlorapatites by electron probe microanalysis with a focus on time-dependent intensity variation of halogens. American Mineralogist, 97, 1103–1115.
Green, P., and Durrani, S. (1977) Annealing studies of tracks in crystals. Nuclear Track Detection, 1, 33–39.
Henderson, C. (2011) Beam sensitivity in EPMA: The analysis of apatite, Ca5(PO4)3(F,Cl,OH). Microscopy and Microanalysis, 17(S2), 588–589.
Hovington, P., Drouin, D., and Gauvin, R. (1997) CASINO: A new Monte Carlo code in C language for electron beam interaction—part I: Description of the program. Scanning, 19, 1–14.
Hughes, J.M., and Rakovan, J. (2002) The crystal structure of apatite, Ca5(PO4)3(F, OH, Cl). Reviews in Mineralogy and Geochemistry, 48, 1–12.
Hughes, J.M., Nekvasil, H., Ustunisik, G., Lindsley, D.H., Coraor, A.E., Vaughn, J., Phillips, B.L., McCubbin, F.M., and Woerner, W.R. (2014) Solid solution in the fluorapatite-chlorapatite binary system: High-precision crystal structure
STOCK ET AL.: ELECTRON-BEAM INDUCED HALOGEN MIGRATION IN APATITE 293
refinements of synthetic F-Cl apatite. American Mineralogist, 99, 369–376.Humphreys, M.C., Kearns, S.L., and Blundy, J.D. (2006) SIMS investigation of
electron-beam damage to hydrous, rhyolitic glasses: Implications for melt inclusion analysis. American Mineralogist, 91, 667–679.
Jay, E.E., Rushton, M.J., and Grimes, R.W. (2012) Migration of fluorine in fluorap-atite—a concerted mechanism. Journal of Materials Chemistry, 22, 6097–6103.
Kanaya, K.A., and Okayama, S. (1972) Penetration and energy-loss theory of electrons in solid targets. Journal of Physics D: Applied Physics, 5, 43.
Laghzizil, A., El Herch, N., Bouhaouss, A., Lorente, G., and Macquete, J. (2001) Comparison of electrical properties between fluoroapatite and hydroxyapatite materials. Journal of Solid State Chemistry, 156, 57–60.
Lineweaver, J.L. (1963) Oxygen outgassing caused by electron bombardment of glass. Journal of Applied Physics, 34, 1786–1791.
Mackie, P., and Young, R. (1974) Fluorine-chlorine interaction in fluor-chlorapatite. Journal of Solid State Chemistry, 11, 319–329.
Marks, M.A., Wenzel, T., Whitehouse, M.J., Loose, M., Zack, T., Barth, M., Worgard, L., Krasz, V., Eby, G.N., and Stosnach, H. (2012) The volatile inven-tory (F, Cl, Br, S, C) of magmatic apatite: an integrated analytical approach. Chemical Geology, 291, 241–255.
Mathez, E.A., and Webster, J.D. (2005) Partitioning behavior of chlorine and fluorine in the system apatite-silicate melt-fluid. Geochimica et Cosmochimica Acta, 69, 1275–1286.
Nouiri, A., Chaguetmi, S., and Belabed, N. (2006) Monte Carlo model of the tem-perature rise at a GaAs surface under an electron beam. Surface and Interface Analysis, 38, 1153–1157.
Pan, Y., and Fleet, M.E. (2002) Compositions of the apatite-group minerals: substitution mechanisms and controlling factors. Reviews in Mineralogy and Geochemistry, 48, 13–49.
Patiño Douce, A.E., and Roden, M. (2006) Apatite as a probe of halogen and water fugacities in the terrestrial planets. Geochimica et Cosmochimica Acta, 70, 3173–3196.
Peng, G., Luhr, J.F., and McGee, J.J. (1997) Factors controlling sulfur concentra-tions in volcanic apatite. American Mineralogist, 82, 1210–1224.
Piccoli, P.M., and Candela, P.A. (2002) Apatite in igneous systems. Reviews in Mineralogy and Geochemistry, 48, 255–292.
Pyle, J.M., Spear, F.S., and Wark, D.A. (2002) Electron microprobe analysis of REE in apatite, monazite and xenotime: protocols and pitfalls. Reviews in Mineralogy and Geochemistry, 48, 337–362.
Reed, S.J.B. (2005) Electron Microprobe Analysis and Scanning Electron Micros-copy in Geology. Cambridge University Press, U.K.
Rodríguez-Carvajal, J. (1993) Recent advances in magnetic structure determination by neutron powder diffraction. Physica B: Condensed Matter, 192, 55–69.
Royce, B.S. (1974) Field-induced transport mechanisms in hydroxyapatite. Annals
of the New York Academy of Sciences, 238, 131–138.Sansom, J.E., Tolchard, J.R., Islam, M.S., Apperley, D., and Slater, P.R. (2006)
Solid state 29Si NMR studies of apatite-type oxide ion conductors. Journal of Materials Chemistry, 16, 1410–1413.
Shan, J., Min, K., and Nouiri, A. (2013) Thermal effects of scanning electron microscopy on He diffusion in apatite: Implications for (U-Th)/He dating. Chemical Geology, 345, 113–118.
Shemesh, A. (1990) Crystallinity and diagenesis of sedimentary apatites. Geochi-mica et Cosmochimica Acta, 54, 2433–2438.
Spear, F.S., and Pyle, J.M. (2002) Apatite, monazite, and xenotime in metamorphic rocks. Reviews in Mineralogy and Geochemistry, 48, 293–335.
Stormer, J.C., and Pierson, M.L. (1993) Variation of F and Cl X-ray intensity due to anisotropic diffusion and electron microprobe analysis of apatite: An ad-dendum. American Mineralogist Supplemental Data, http://www.minsocam.org/msa/ammin/supplemental_data/Stormer.html.
Stormer, J., Pierson, M.L., and Tacker, R.C. (1993) Variation of F and Cl X-ray intensity due to anisotropic diffusion in apatite. American Mineralogist, 78, 641–648.
Tse, C., Welch, D., and Royce, B. (1973) The migration of F–, OH– and O2– ions in apatites. Calcified Tissue Research, 13, 47–52.
Vassamillet, L., and Caldwell, V. (1969) Electron-probe microanalysis of alkali metals in glasses. Journal of Applied Physics, 40, 1637–1643.
Webster, J.D., Tappen, C.M., and Mandeville, C.W. (2009) Partitioning behavior of chlorine and fluorine in the system apatite–melt–fluid. II: Felsic silicate systems at 200MPa. Geochimica et Cosmochimica Acta, 73, 559–581.
Welch, D., and Royce, B. (1973) One-dimensional anion vacancy diffusion in the calcium apatites. Physica Status Solidi (b), 57, 193–202.
Wopenka, B., and Pasteris, J.D. (2005) A mineralogical perspective on the apatite in bone. Materials Science and Engineering: C, 25, 131–143.
Young, R., and Brown, W. (1982) Structures of Biological Minerals. Biological Mineralization and Demineralization, p. 101–141. Springer, Berlin.
Young, E., Myers, A., Munson, E., and Conklin, N. (1969) Mineralogy and geo-chemistry of fluorapatite from Cerro de Mercado, Durango, Mexico. U.S. Geological Survey Professional Paper, 650-D, D84–D93.
Zeitler, P., Herczeg, A., McDougall, I., and Honda, M. (1987) U-Th-He dating of apatite: A potential thermochronometer. Geochimica et Cosmochimica Acta, 51, 2865–2868.
Manuscript received February 24, 2014Manuscript accepted July 15, 2014Manuscript handled by daniel harlov