Embed Size (px)
Citation preview
New climate scenarios and possible consequences for air pollution control
Detlef van Vuuren
How low can we go? Detlef van Vuuren – 2 February 2009
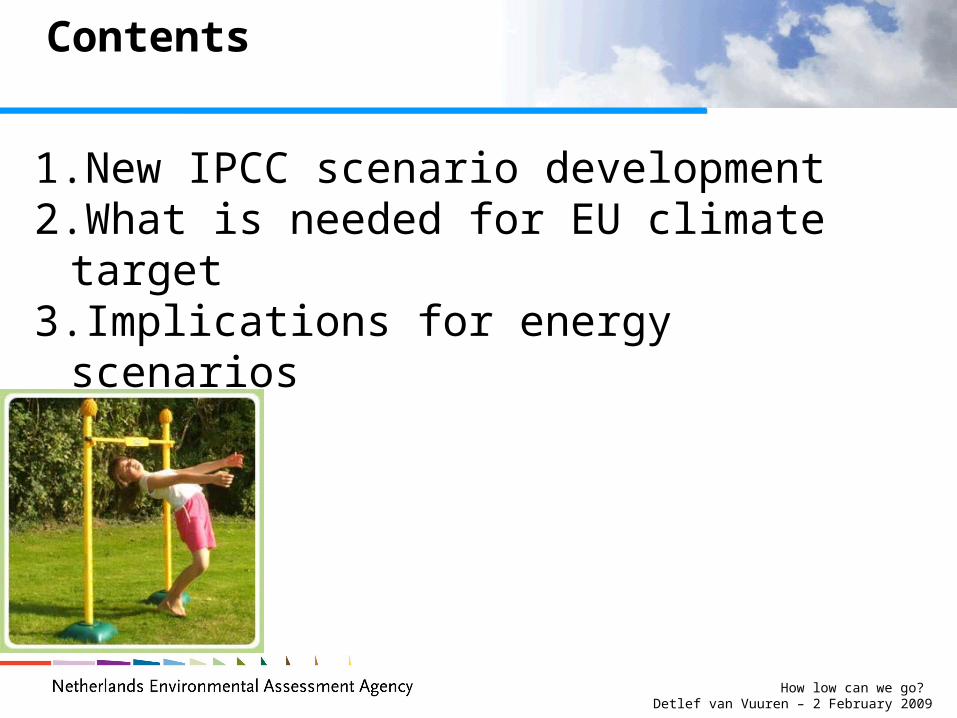
Contents
1.New IPCC scenario development 2.What is needed for EU climate target3.Implications for energy scenarios
How low can we go? Detlef van Vuuren – 2 February 2009
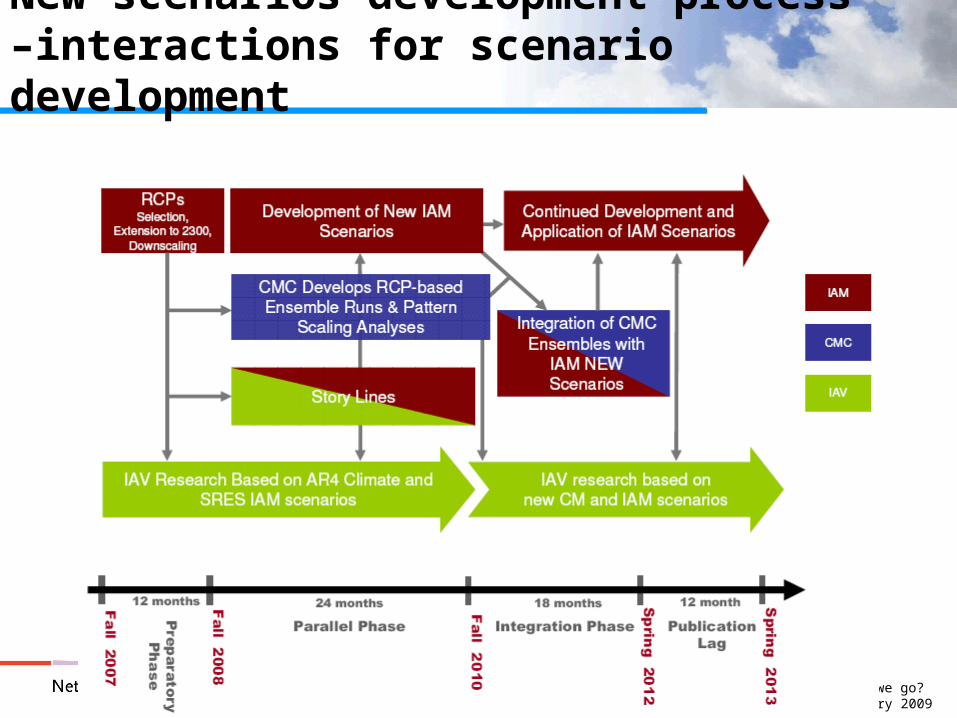
New scenarios development process –interactions for scenario development
How low can we go? Detlef van Vuuren – 2 February 2009
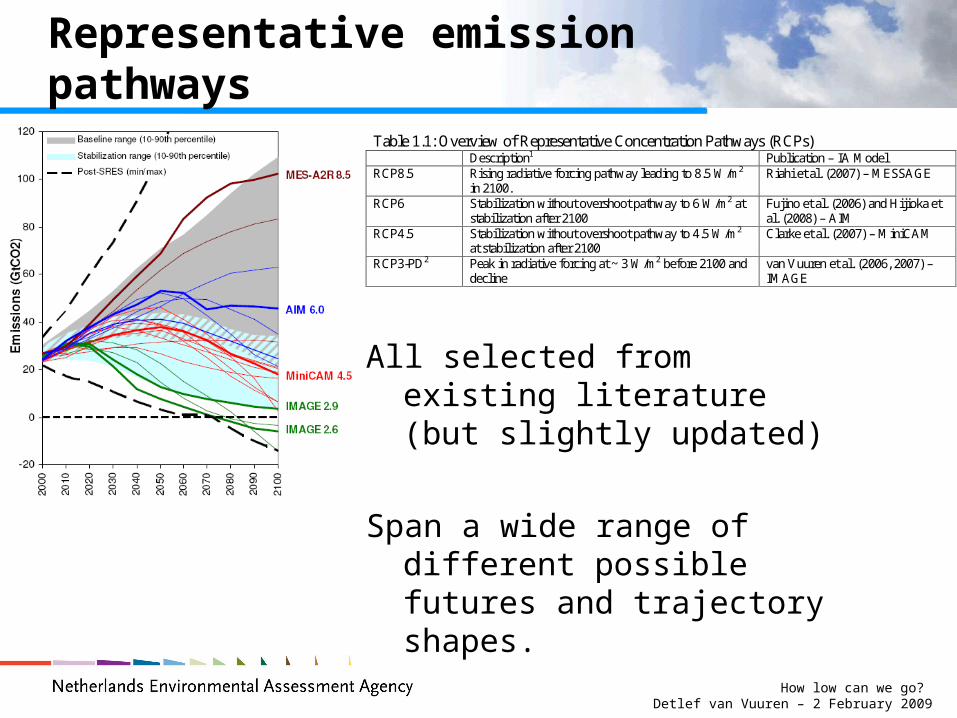
Representative emission pathways
Table 1.1: Overview of Representative Concentration Pathways (RCPs) 1 Description1 Publication – IA Model RCP8.5 Rising radiative forcing pathway leading to 8.5 W/m2
in 2100. Riahi et al. (2007) – MESSAGE
RCP6 Stabilization without overshoot pathway to 6 W/m2 at stabilization after 2100
Fujino et al. (2006) and Hijioka et al. (2008) – AIM
RCP4.5 Stabilization without overshoot pathway to 4.5 W/m2 at stabilization after 2100
Clarke et al. (2007) – MiniCAM
RCP3-PD2 Peak in radiative forcing at ~ 3 W/m2 before 2100 and decline
van Vuuren et al. (2006, 2007) – IMAGE
2
All selected from existing literature (but slightly updated)
Span a wide range of different possible futures and trajectory shapes.
How low can we go? Detlef van Vuuren – 2 February 2009
CO2
CH4
N2OSOy
BCOCCONOx
VOCNH3
HFCsPFCsCFCsSF6
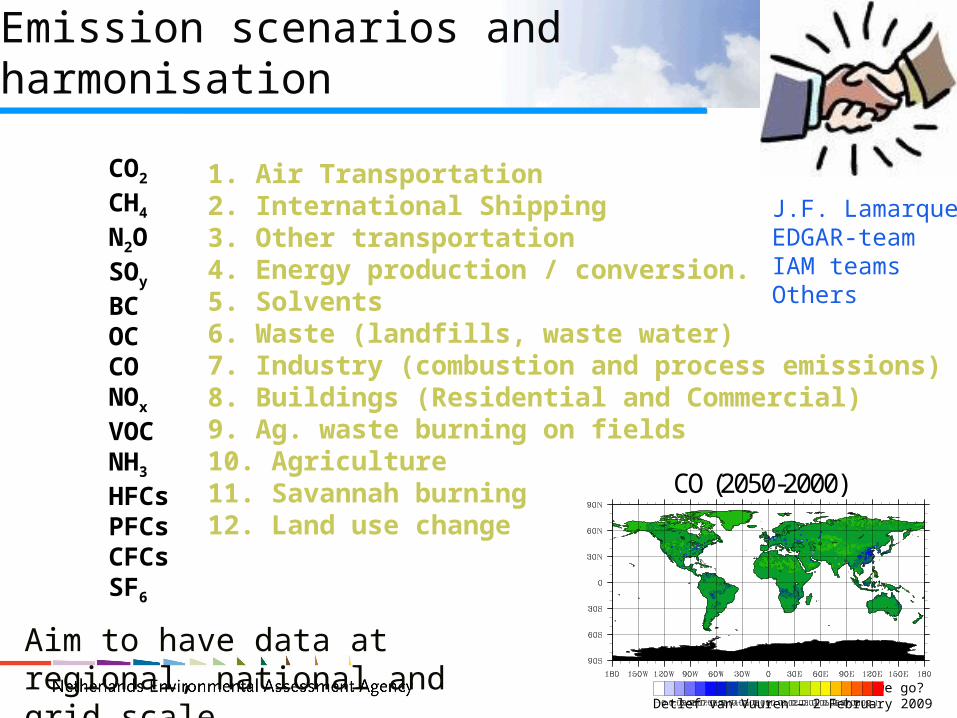
Emission scenarios and harmonisation
1. Air Transportation2. International Shipping3. Other transportation4. Energy production / conversion.5. Solvents6. Waste (landfills, waste water)7. Industry (combustion and process emissions)8. Buildings (Residential and Commercial)9. Ag. waste burning on fields10. Agriculture11. Savannah burning12. Land use change
CO (2050-2000)
Aim to have data at regional, national and grid scale
J.F. LamarqueEDGAR-teamIAM teamsOthers
How low can we go? Detlef van Vuuren – 2 February 2009
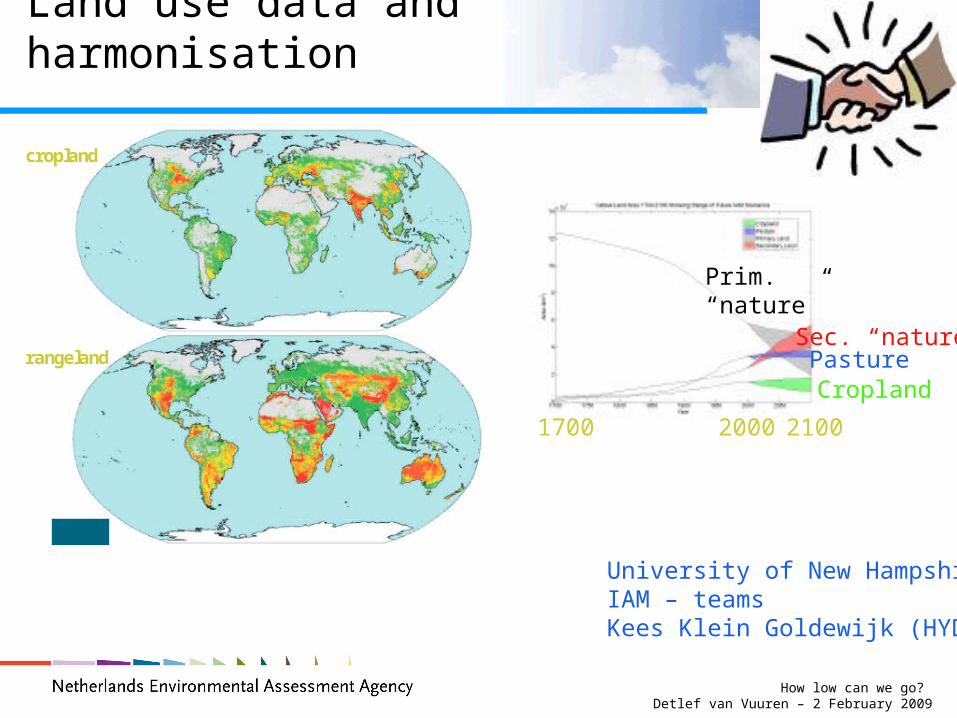
Land use data and harmonisation
cropland
rangeland
Cropland
Sec. “nature”
Prim. “nature”
Pasture
1700 2000 2100
University of New HampshireIAM – teamsKees Klein Goldewijk (HYDE)
How low can we go? Detlef van Vuuren – 2 February 2009
What could happen if we do nothing?
How low can we go? Detlef van Vuuren – 2 February 2009
1850 1900 1950 2000 2050 21000
200
400
600
800
1000
1200
Ene
rgy
cons
umpt
ion
(EJ)
Hout Kolen Olie Gas Waterkracht Nuclear Zon/wind Mod. bioenergie
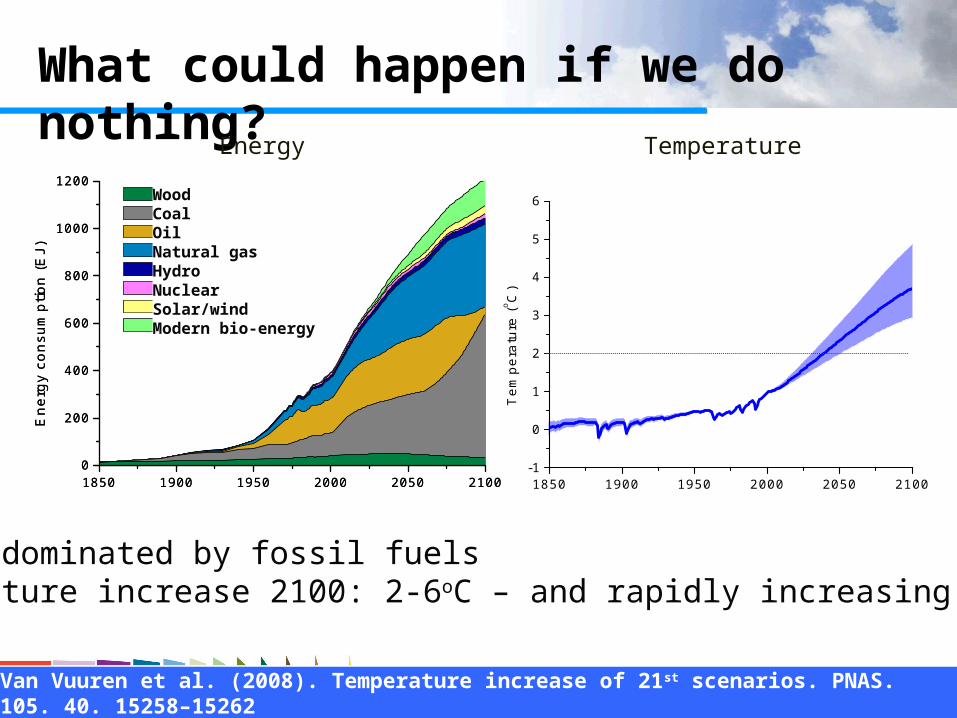
What could happen if we do nothing?
1850 1900 1950 2000 2050 21000
200
400
600
800
1000
1200
Ene
rgy
cons
umpt
ion
(EJ)
Hout Kolen Olie Gas Waterkracht Nuclear Zon/wind Mod. bioenergie
Future dominated by fossil fuelsTemperature increase 2100: 2-6oC – and rapidly increasing still!
WoodCoalOilNatural gasHydroNuclearSolar/windModern bio-energy
Van Vuuren et al. (2008). Temperature increase of 21st scenarios. PNAS. 105. 40. 15258–15262
1850 1900 1950 2000 2050 2100-1
0
1
2
3
4
5
6
Tem
pera
ture
(o C
)
Energy Temperature
How low can we go? Detlef van Vuuren – 2 February 2009
Where do we want to aim for?
How low can we go? Detlef van Vuuren – 2 February 2009
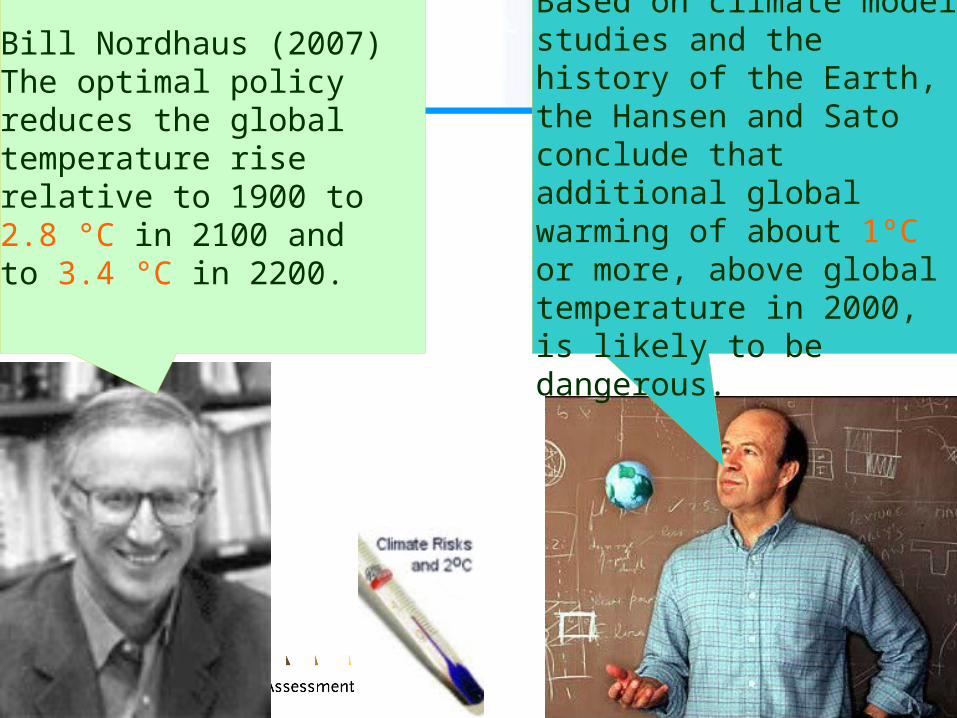
Bill Nordhaus (2007)The optimal policy reduces the global temperature rise relative to 1900 to 2.8 °C in 2100 and to 3.4 °C in 2200.
Jim Hansen (2007):Based on climate model studies and the history of the Earth, the Hansen and Sato conclude that additional global warming of about 1ºC or more, above global temperature in 2000, is likely to be dangerous.
How low can we go? Detlef van Vuuren – 2 February 2009
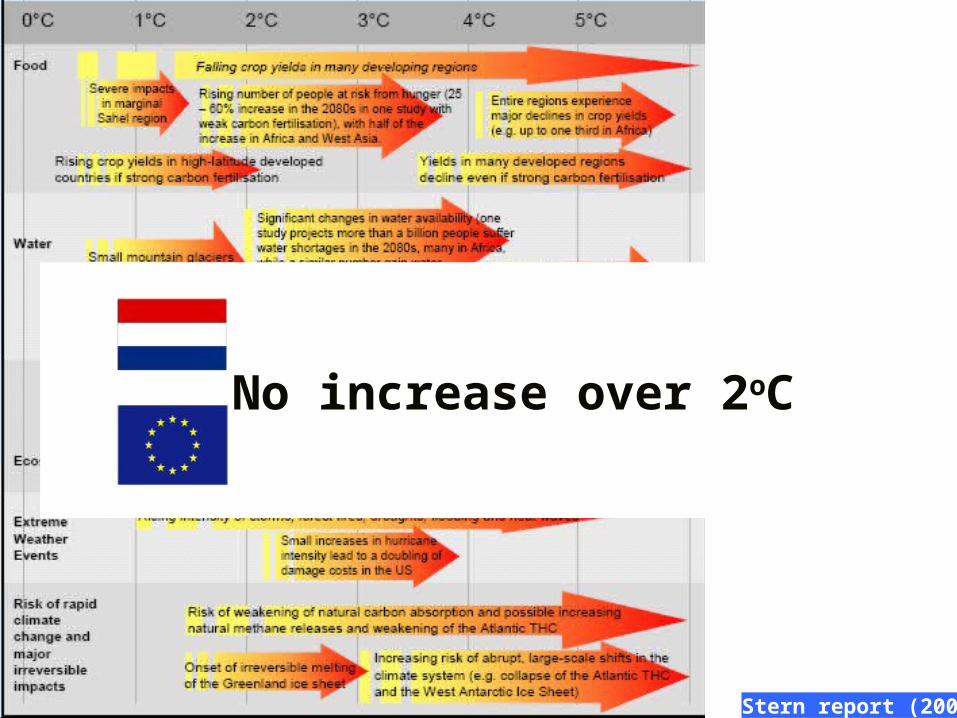
Impacts
No increase over 2oC
Stern report (2006).
How low can we go? Detlef van Vuuren – 2 February 2009
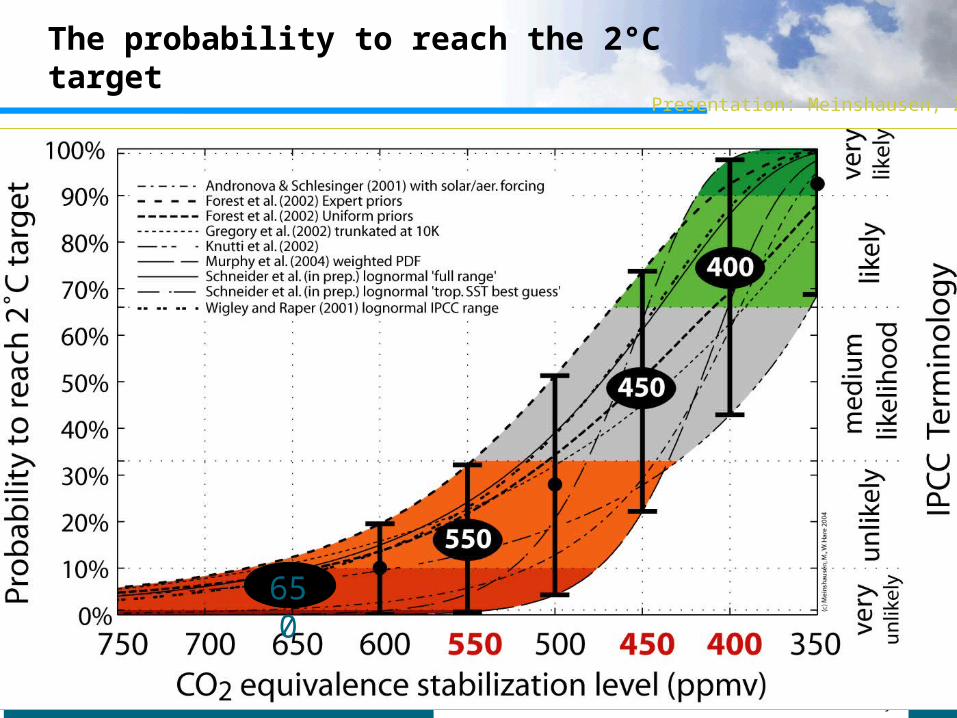
The probability to reach the 2°C target
650
Presentation: Meinshausen, 2004
How low can we go? Detlef van Vuuren – 2 February 2009
2000 2020 2040 2060 2080 2100-20
0
20
40
60
80
100
Em
issi
es (
GtC
O2)
400 600 800 10000
2
4
6
8
10
Tem
pera
tuur
stijg
ing
(o C)
Broeikasgasconcentratie (ppm CO2-eq)
2 Graden
2000 2020 2040 2060 2080 2100-20
0
20
40
60
80
100
Em
issi
es (
GtC
O2)
400 600 800 10000
2
4
6
8
10
Tem
pera
tuur
stijg
ing
(o C)
Broeikasgasconcentratie (ppm CO2-eq)
2 Graden
2000 2020 2040 2060 2080 2100-20
0
20
40
60
80
100
Em
issi
es (
GtC
O2)
400 600 800 10000
2
4
6
8
10
Tem
pera
tuur
stijg
ing
(o C)
Broeikasgasconcentratie (ppm CO2-eq)
2 Graden
2000 2020 2040 2060 2080 2100-20
0
20
40
60
80
100
Em
issi
es (
GtC
O2)
400 600 800 10000
2
4
6
8
10
Tem
pera
tuur
stijg
ing
(o C)
Broeikasgasconcentratie (ppm CO2-eq)
2 Graden
2000 2020 2040 2060 2080 2100-20
0
20
40
60
80
100
Em
issi
es (
GtC
O2)
400 600 800 10000
2
4
6
8
10
Tem
pera
tuur
stijg
ing
(o C)
Broeikasgasconcentratie (ppm CO2-eq)
2 Graden
2000 2020 2040 2060 2080 2100-20
0
20
40
60
80
100
Em
issi
es (
GtC
O2)
400 600 800 10000
2
4
6
8
10
Tem
pera
tuur
stijg
ing
(o C)
Broeikasgasconcentratie (ppm CO2-eq)
2 Graden
2000 2020 2040 2060 2080 2100-20
0
20
40
60
80
100
Em
issi
es (
GtC
O2)
400 600 800 10000
2
4
6
8
10
Tem
pera
tuur
stijg
ing
(o C)
Broeikasgasconcentratie (ppm CO2-eq)
2 Graden
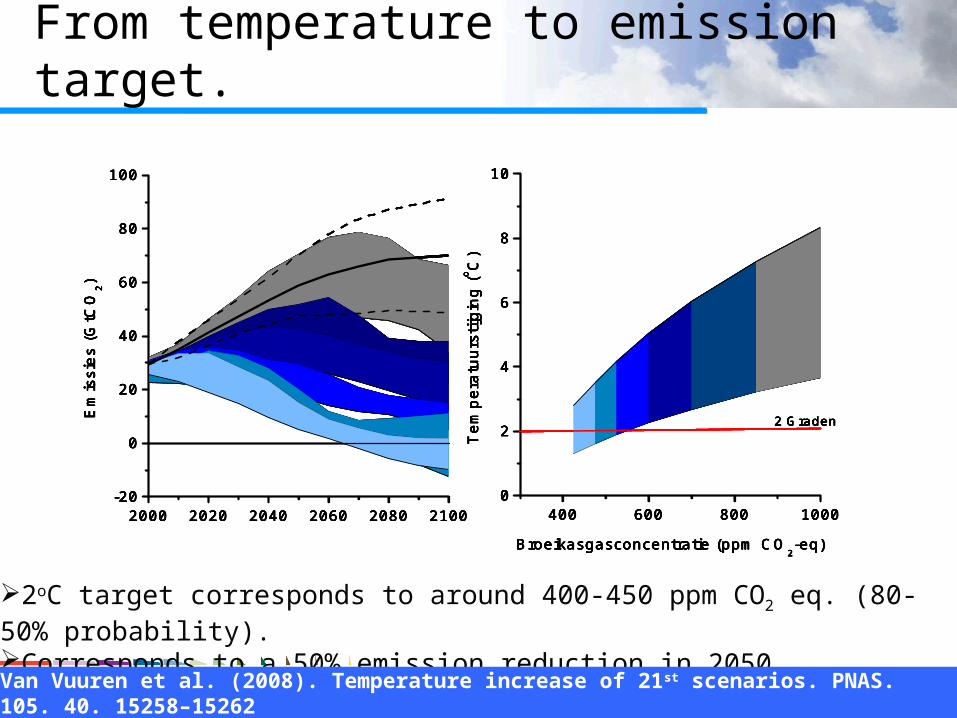
2oC target corresponds to around 400-450 ppm CO2 eq. (80-50% probability). Corresponds to a 50% emission reduction in 2050
Van Vuuren et al. (2008). Temperature increase of 21st scenarios. PNAS. 105. 40. 15258–15262
From temperature to emission target.
How low can we go? Detlef van Vuuren – 2 February 2009
650 CO2-eq 550 CO2-eq 450 CO2-eq
Integrated analysis: combination of options based on technical feasibility and cost-effectiveness
0
5
10
15
20
25
30
1970
1990
2010
2030
2050
2070
2090
Em
issi
ons
(GtC
-eq)
0
5
10
15
20
25
30
1970
1990
2010
2030
2050
2070
2090
Em
issi
ons
(GtC
-eq)
0
5
10
15
20
25
30
1970
1990
2010
2030
2050
2070
2090
Em
issi
ons
(GtC
-eq)
Sinks
Non-CO2
Other
Fuel switch
CCS
Biofuels
Nuclear, renewable
Efficiency
From emissions to reduction measures (B2)
Van Vuuren et al. Stabilising GHG emissions at low concentration levels.Climatic Change 81: 119-159.
How low can we go? Detlef van Vuuren – 2 February 2009
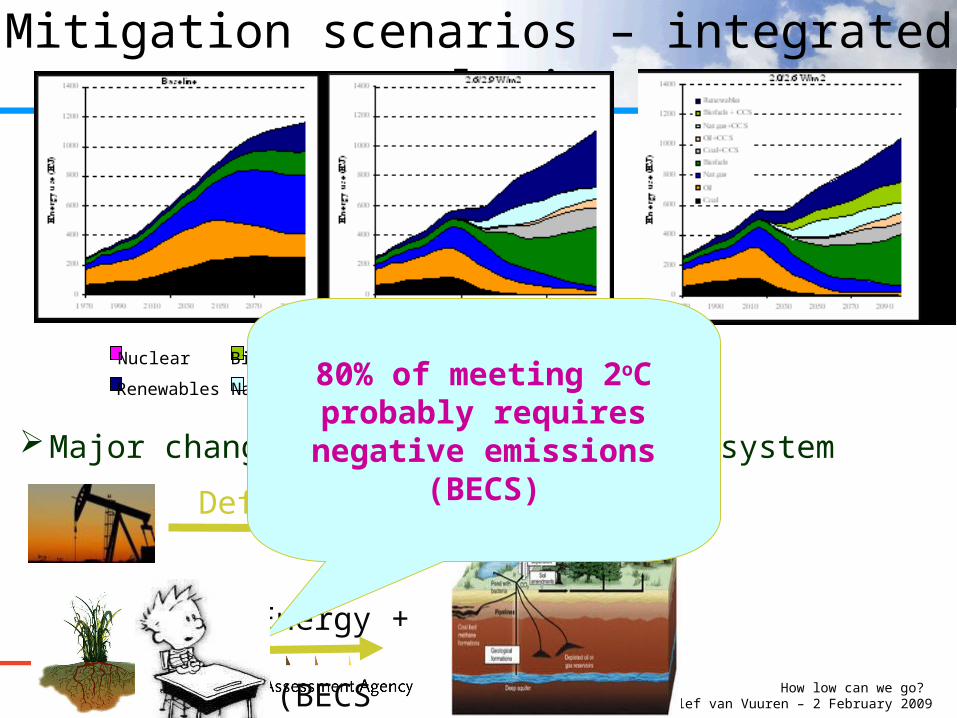
Mitigation scenarios – integrated analysis
Nuclear
Renewables
Biofuels + CCS
Natural gas+CCS
Oil+CCS
Coal+CCS
Biofuels
Natural gas
Oil
Coal
Major changes in the global energy system
BioEnergy +
CCS (BECS
Default
80% of meeting 2oC probably requires negative
emissions (BECS)
How low can we go? Detlef van Vuuren – 2 February 2009
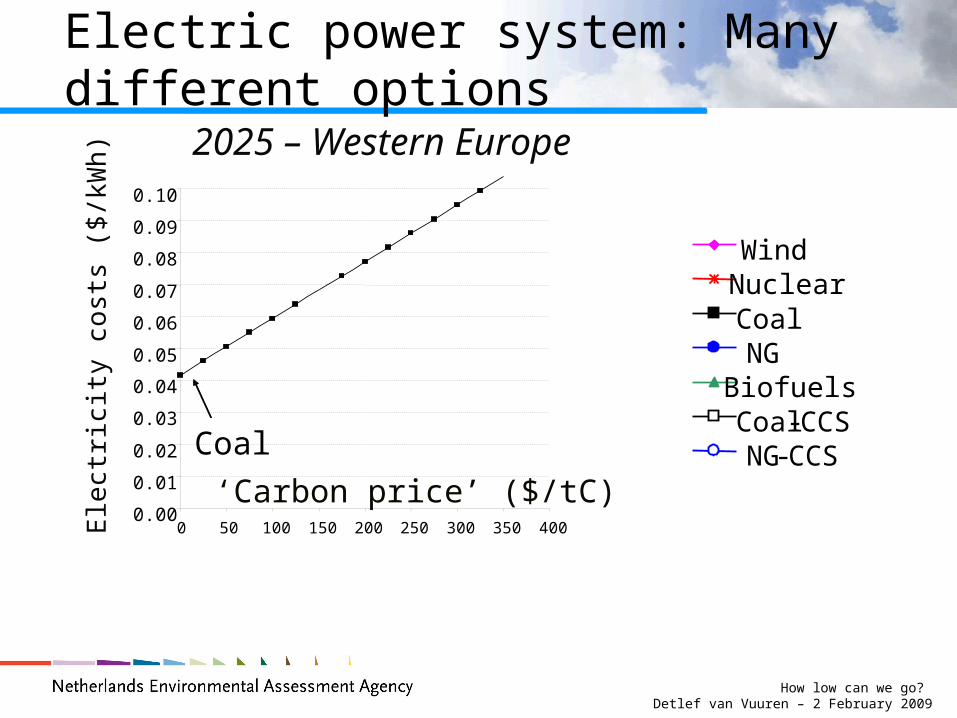
Electric power system: Many different options
2025 – Western EuropeE
lect
ricity
co
sts
($/k
Wh)
0.00
0.01
0.02
0.03
0.04
0.05
0.06
0.07
0.08
0.09
0.10
0 50 100 150 200 250 300 350 400
Coal
‘Carbon price’ ($/tC)
WindNuclearCoalNGBiofuelsCoal-CCSNG-CCS
How low can we go? Detlef van Vuuren – 2 February 2009
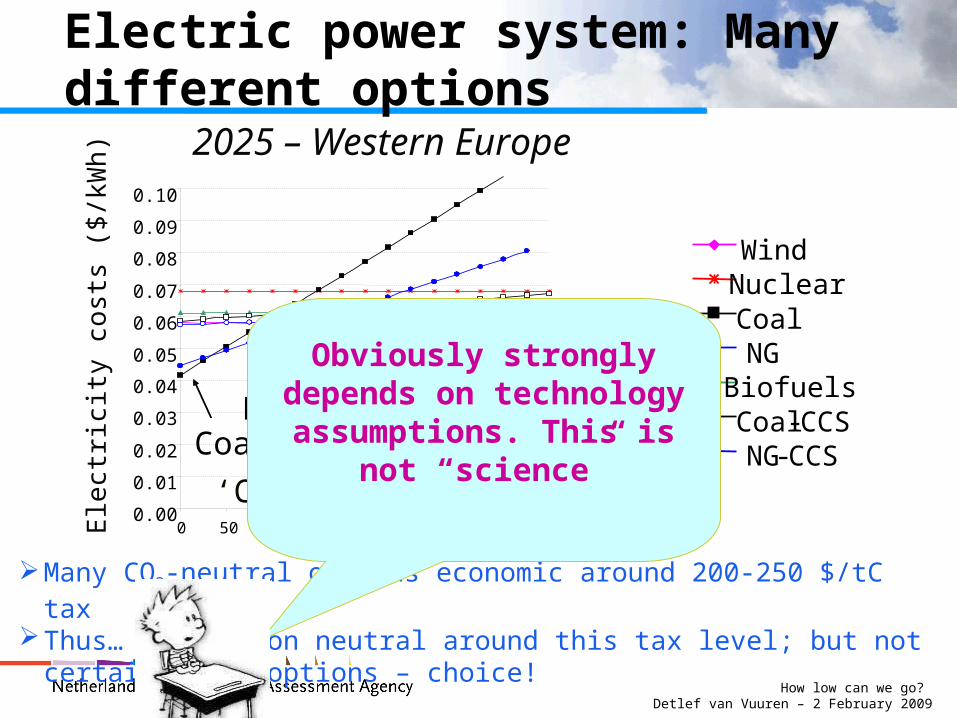
Electric power system: Many different options
Many CO2-neutral options economic around 200-250 $/tC taxThus… EPG carbon neutral around this tax level; but not certain which
options – choice!
2025 – Western EuropeE
lect
ricity
co
sts
($/k
Wh)
0.00
0.01
0.02
0.03
0.04
0.05
0.06
0.07
0.08
0.09
0.10
0 50 100 150 200 250 300 350 400
CoalNatural Gas
Wind
‘Carbon price’ ($/tC)
WindNuclearCoalNGBiofuelsCoal-CCSNG-CCS
Obviously strongly depends on technology assumptions. This is not
“science”
How low can we go? Detlef van Vuuren – 2 February 2009
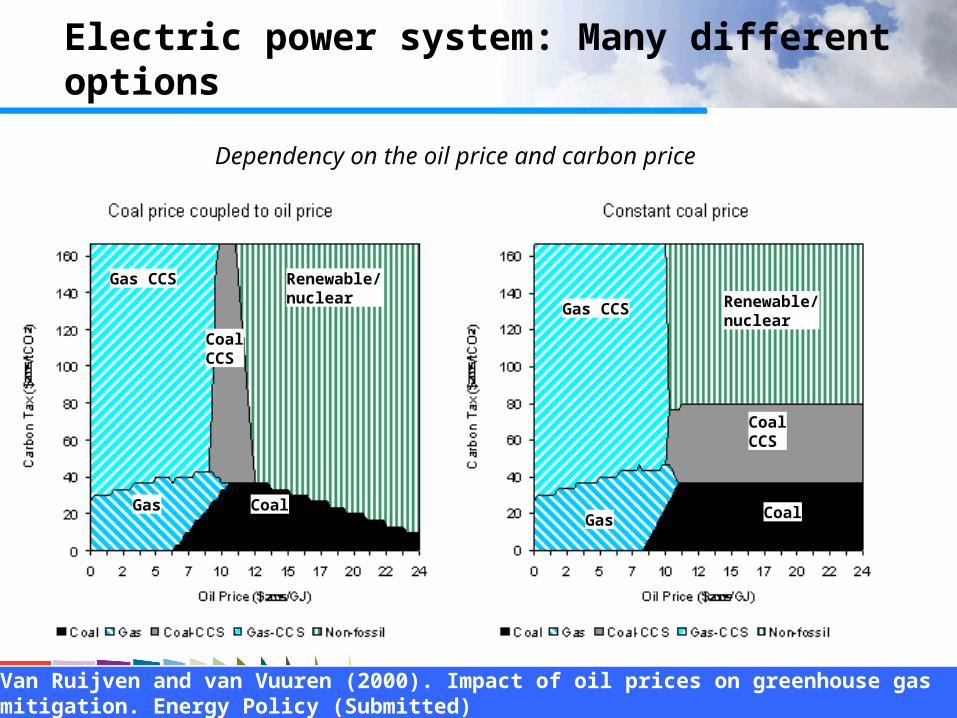
Renewable/nuclear
Gas CCS
Gas Coal
CoalCCS
Gas CCS
Gas Coal
Renewable/nuclear
CoalCCS
Electric power system: Many different options
Dependency on the oil price and carbon price
Van Ruijven and van Vuuren (2000). Impact of oil prices on greenhouse gas mitigation. Energy Policy (Submitted)
How low can we go? Detlef van Vuuren – 2 February 2009
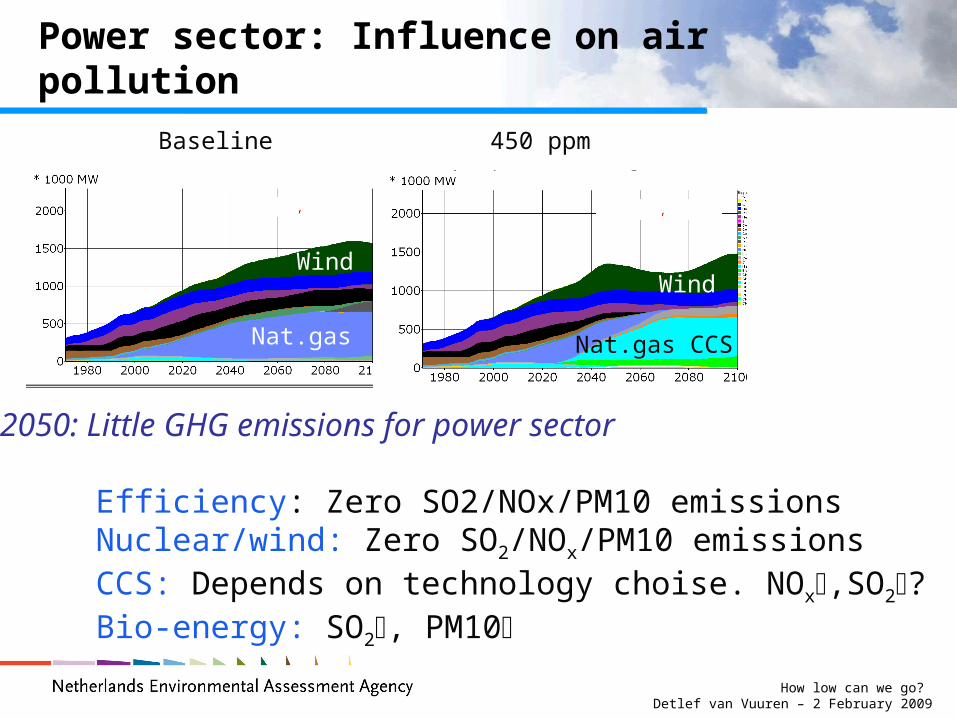
Power sector: Influence on air pollution
2050: Little GHG emissions for power sector
Efficiency: Zero SO2/NOx/PM10 emissionsNuclear/wind: Zero SO2/NOx/PM10 emissionsCCS: Depends on technology choise. NOx,SO2?Bio-energy: SO2, PM10
Baseline 450 ppm
Nat.gas Nat.gas CCS
WindWind
How low can we go? Detlef van Vuuren – 2 February 2009
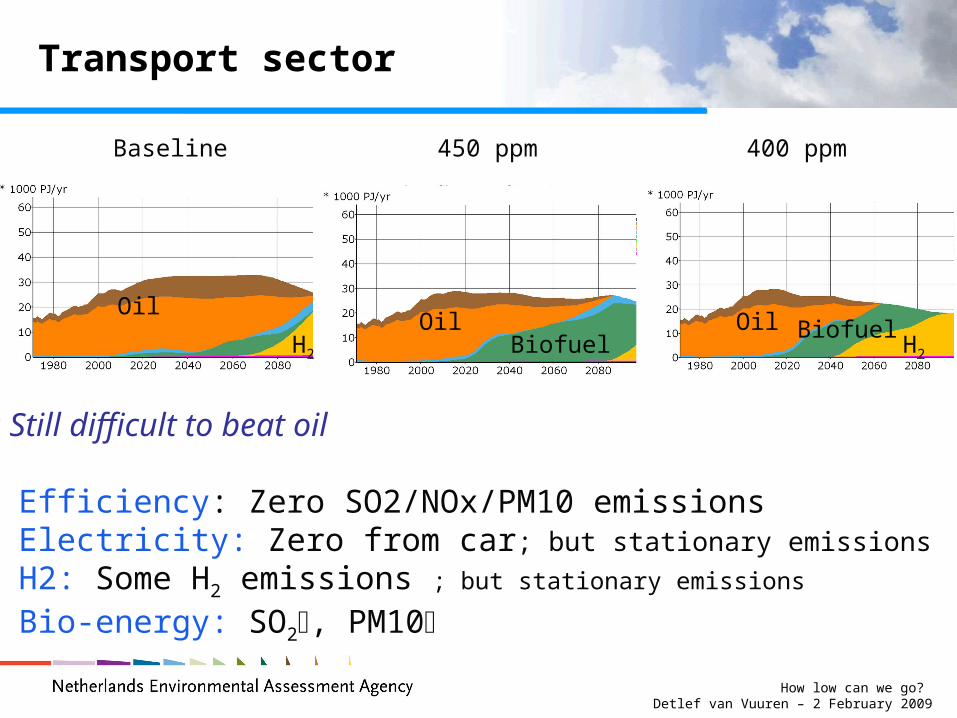
Transport sector
2050: Still difficult to beat oil
Efficiency: Zero SO2/NOx/PM10 emissionsElectricity: Zero from car; but stationary emissions
H2: Some H2 emissions ; but stationary emissions
Bio-energy: SO2, PM10
Baseline 450 ppm 400 ppm
OilOil Oil
BiofuelH2 H2
Biofuel
How low can we go? Detlef van Vuuren – 2 February 2009
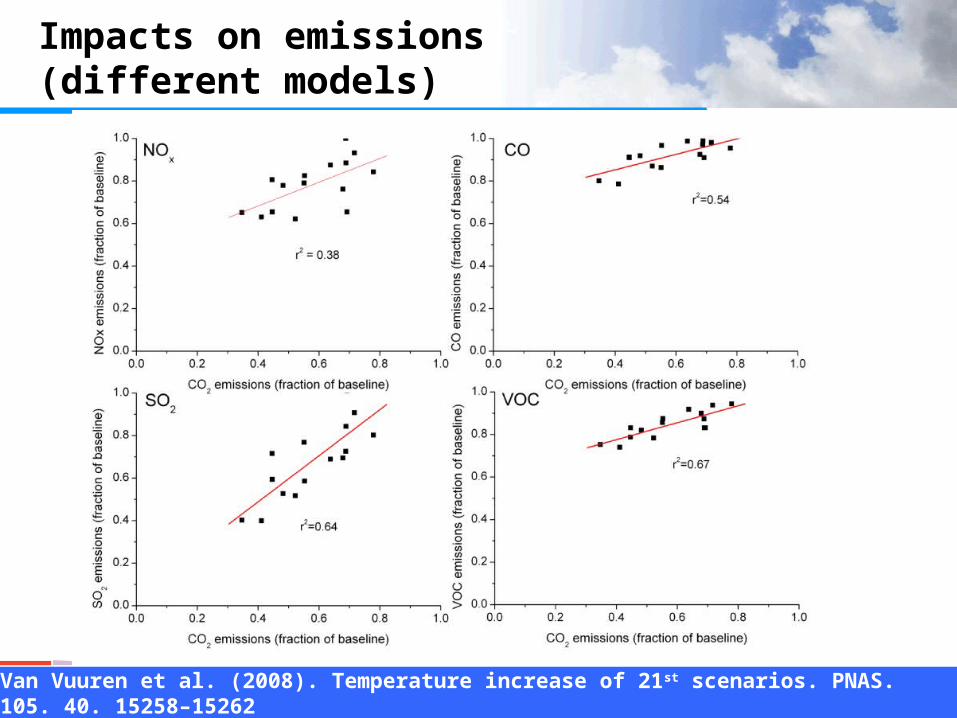
Impacts on emissions (different models)
Van Vuuren et al. (2008). Temperature increase of 21st scenarios. PNAS. 105. 40. 15258–15262
How low can we go? Detlef van Vuuren – 2 February 2009
Findings
Stabilizing GHG concentration at low levels in order to meet 2 degrees requires very ambitious emission reductions.
Target technically feasible (with ‘known techniques’)… but just!
Portfolio of options needed: Likely substantial contribution CCS and efficiency
Implications on emissions… likely to be substantial for SO2.
How low can we go? Detlef van Vuuren – 2 February 2009
Thank you for your attention
For further information: [email protected]
How low can we go? Detlef van Vuuren – 2 February 2009
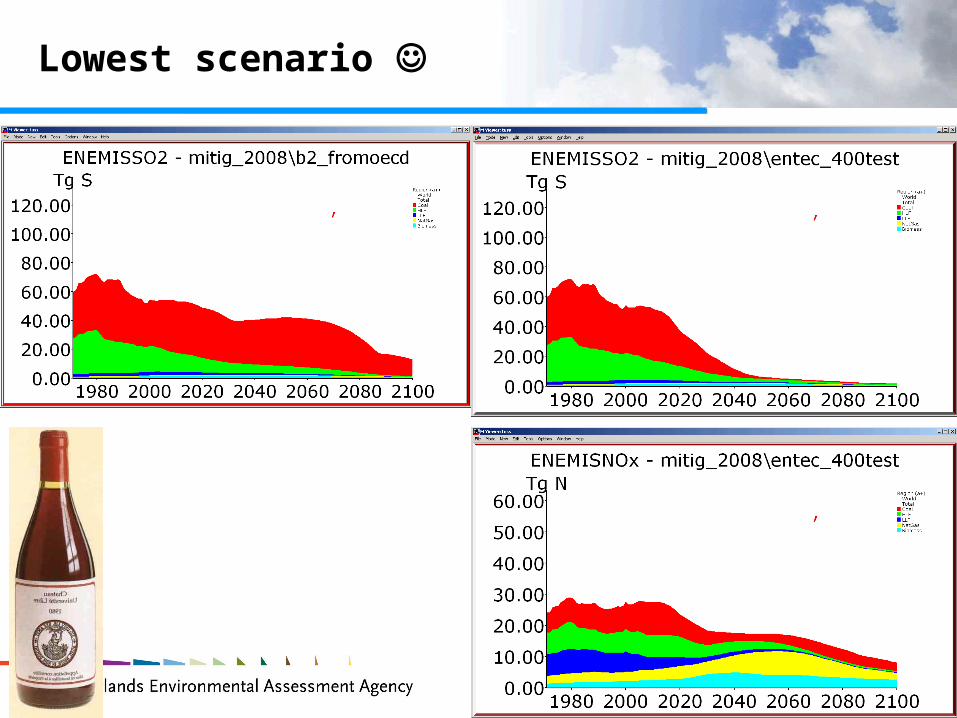
Lowest scenario
How low can we go? Detlef van Vuuren – 2 February 2009
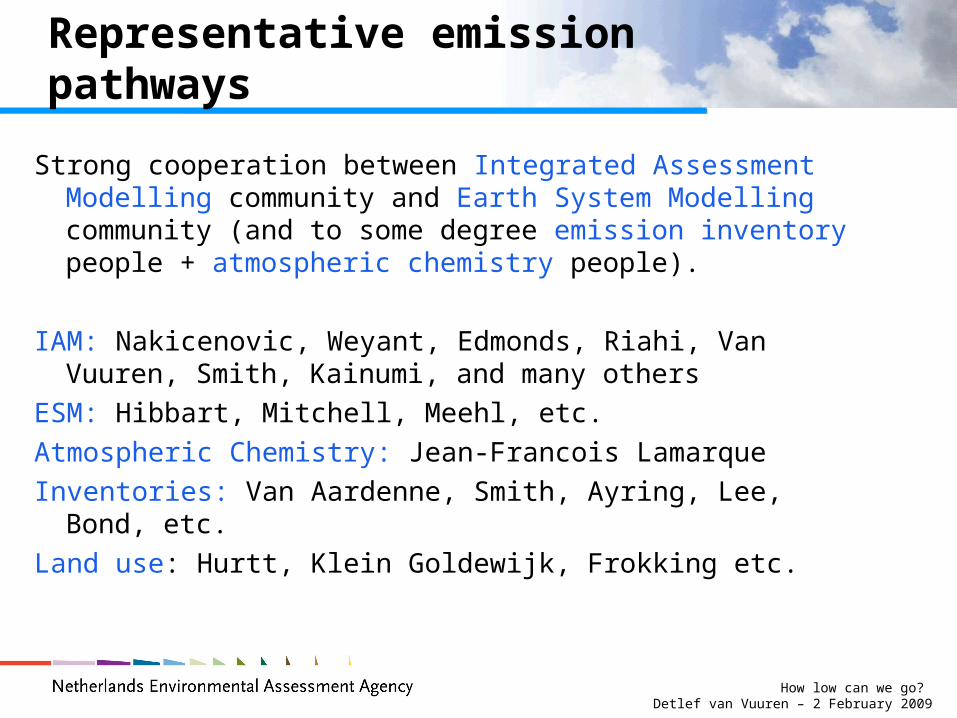
Representative emission pathways
Strong cooperation between Integrated Assessment Modelling community and Earth System Modelling community (and to some degree emission inventory people + atmospheric chemistry people).
IAM: Nakicenovic, Weyant, Edmonds, Riahi, Van Vuuren, Smith, Kainumi, and many others
ESM: Hibbart, Mitchell, Meehl, etc.
Atmospheric Chemistry: Jean-Francois Lamarque
Inventories: Van Aardenne, Smith, Ayring, Lee, Bond, etc.
Land use: Hurtt, Klein Goldewijk, Frokking etc.
How low can we go? Detlef van Vuuren – 2 February 2009
Costs of stabilising emissions
0
100
200
300
400
500
600
700
800
1970 1990 2010 2030 2050 2070 2090
Car
bon
tax
($/t
C-e
q)
650 CO2-eq
550 CO2-eq
450 CO2-eq
0.0
0.5
1.0
1.5
2.0
2.5
1970 1990 2010 2030 2050 2070 2090M
itii
gati
ons
cost
s (%
GD
P)
650 CO2-eq
550 CO2-eq
450 CO2-eq
Carbon tax Abatement costs (%GDP)
Substantial costs But nothing to disrupt the economy
Van Vuuren et al. Stabilising GHG emissions at low concentration levels.Climatic Change 81: 119-159.
How low can we go? Detlef van Vuuren – 2 February 2009
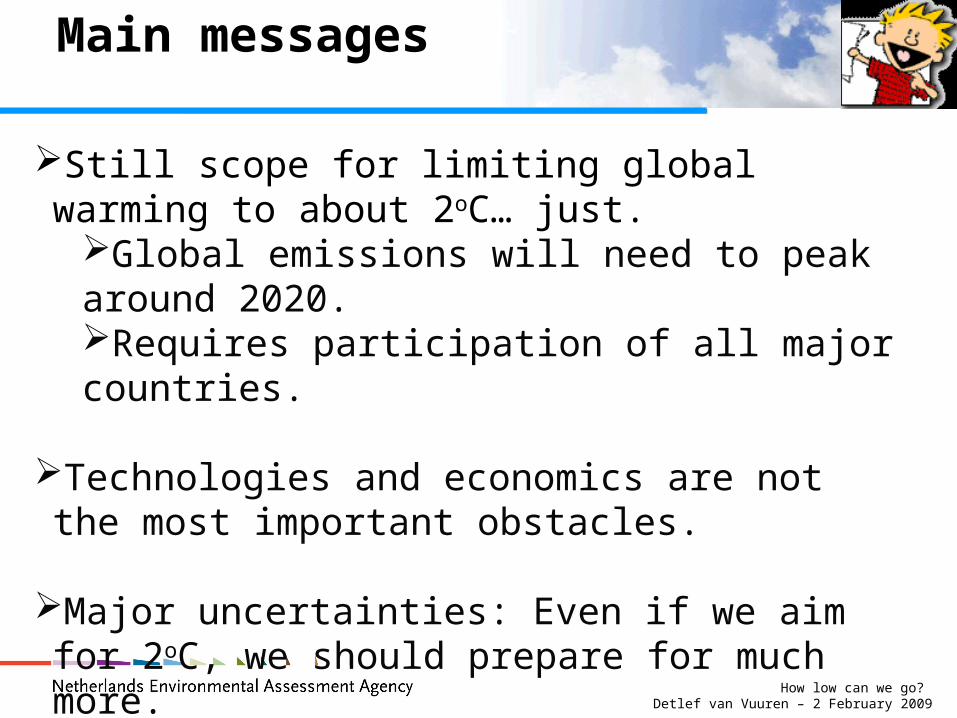
Main messages
Still scope for limiting global warming to about 2oC… just.
Global emissions will need to peak around 2020.Requires participation of all major countries.
Technologies and economics are not the most important obstacles.
Major uncertainties: Even if we aim for 2oC, we should prepare for much more.
How low can we go? Detlef van Vuuren – 2 February 2009
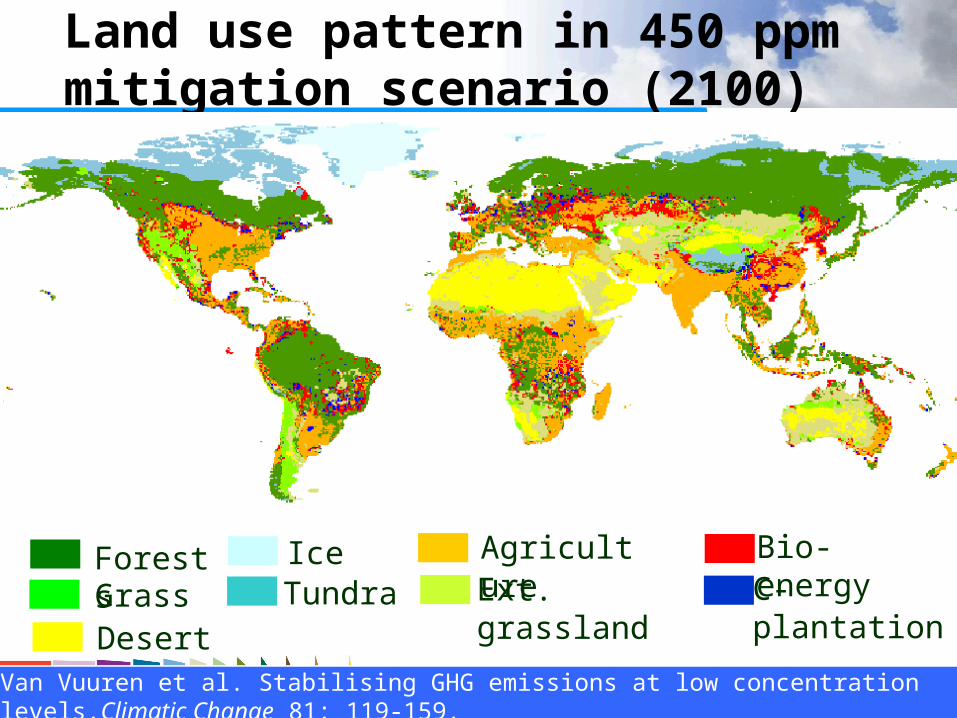
Land use pattern in 450 ppm mitigation scenario (2100)
Forests
Desert
AgricultureIceTundra Ext. grasslandGrass
Bio-energyC-plantation
Van Vuuren et al. Stabilising GHG emissions at low concentration levels.Climatic Change 81: 119-159.