Embed Size (px)
Citation preview

1New climate analysis informs NSW’s regional water strategies
New climate analysis informs NSW’s regional water strategies
With our 12 regional water strategies, the New South
Wales Government aims to deliver the right amount
and quality of water to meet all our needs, including
those of the environment.
The development of the strategies has been informed
by a new four-step approach to past and future
climate risk. This approach recognises the absolute
importance of climate risk to our future water supplies.
In the first step, we look at our past 130 years of
recorded climate data and the climate drivers
that influence past and present climate. But we
recognise that 130 years of records are not enough
to understand extreme events, especially long-term
droughts.
The next step adds 500 years of climate history
to our knowledge by analysing things such as tree
rings, river sediments and ice cores that have spent
a long time in our landscape and carry tell-tale
marks of events and changes in climate.
In the third step, researchers apply stochastic
modelling to our 500-year picture of past climate
to look at possible climate sequences with 10,000
years of data.
Researchers use the fourth step to incorporate
climate-change projections into our water modelling.
This is because we recognise that historical patterns
we see in the climate record will be altered by
climate change.
This new approach has shown us that NSW’s surface
water supplies are likely to be less secure than we
thought. More work is required to apply the new
climate data to our understanding of groundwater
systems to determine how secure groundwater
supplies will be in the future.
With our regional water strategies, we are taking
this modelling into account so they will provide a
roadmap for the next 20–40 years.
Regional water strategies informed by a new approach to past and future climate risksThe NSW Government is developing 12 regional
water strategies to make sure there is the right
amount of water, of the right quality, delivered in the
right way to meet the needs of our communities,
Aboriginal people, industry and the environment.
These strategies are being informed by a new approach that brings together our records and investigations of the climate in the past with projected climate change.
The strategies are a roadmap for the next 20–40
years. In them, we look at how much water a region
will need to meet future demand. They reflect
the challenges and choices involved in meeting
those demands. We look at what we need to do to
manage risks to the amount of water available from
our surface water and groundwater systems.
Pete
r R
ob
ey/
DP
IE

2 New climate analysis informs NSW’s regional water strategies
Water planning based on modelling climate risk
Climate is the most critical risk in water planningOur climate determines how much water we have
available. Australia has a highly variable climate, and
rainfall is especially variable. This makes it vital that
we understand as much as we can about our climate
risks so we can work out how we manage our water
supplies.
The 12 strategies will include policy, planning and
infrastructure solutions to help meet our current
and future water needs. They are built on the best
available evidence about climate risk, whether the
risk is caused by natural variability or by changes
we anticipate. This includes understanding our
vulnerability to extreme events such as droughts,
which are the largest risk to our water supplies.
NSW’s surface water and groundwater resources are
managed by sharing water between different users,
including the environment. In determining how our
water is shared, we need to consider economic and
social risks, although climate is the most critical risk
to understand.
Models integrate complex interactionsWe use models to integrate complex interactions
between the natural environment (labelled
biophysical in the diagram below) and human-
constructed environment (labelled management).
Water models assess climate risk by integrating the interactions between biophysical and management processes. This diagram shows a simplified model outputting a daily series of water flows and use. Models can produce other outputs, including water storage, allocations and crop area.
A water model provides information to help us understand how the whole water system interacts
3New climate analysis informs NSW’s regional water strategies
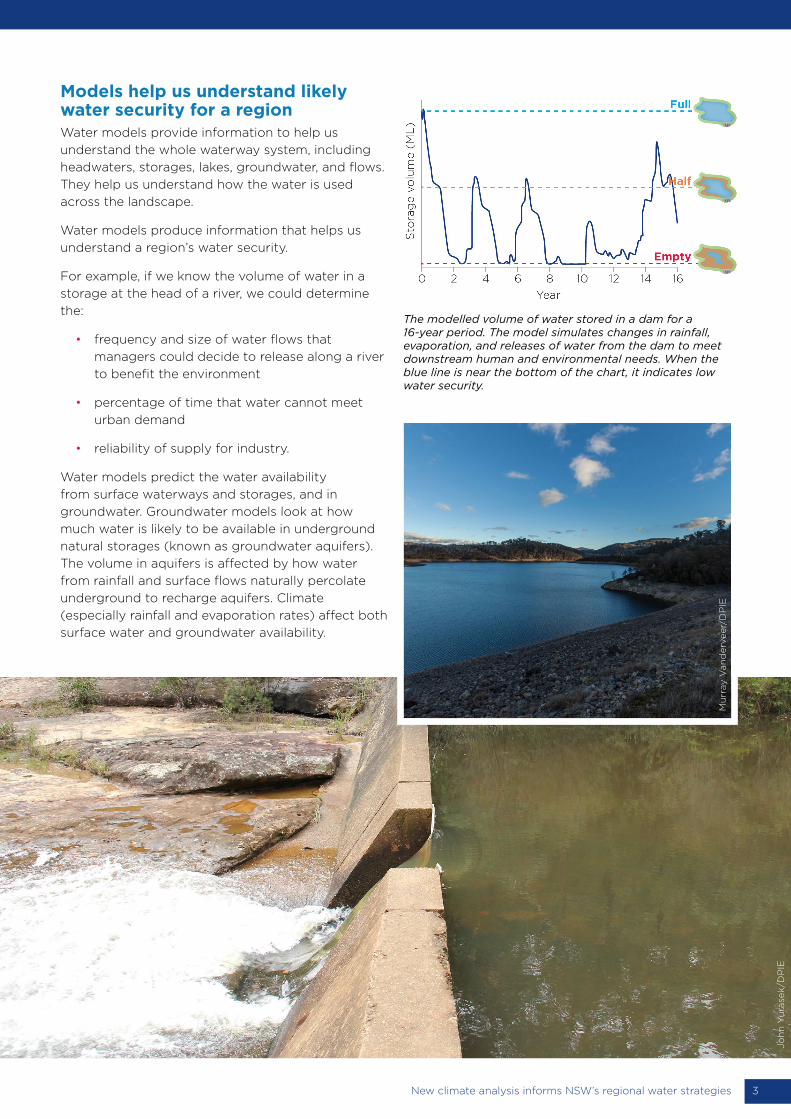
Models help us understand likely water security for a regionWater models provide information to help us
understand the whole waterway system, including
headwaters, storages, lakes, groundwater, and flows.
They help us understand how the water is used
across the landscape.
Water models produce information that helps us
understand a region’s water security.
For example, if we know the volume of water in a
storage at the head of a river, we could determine
the:
• frequency and size of water flows that
managers could decide to release along a river
to benefit the environment
• percentage of time that water cannot meet
urban demand
• reliability of supply for industry.
Water models predict the water availability
from surface waterways and storages, and in
groundwater. Groundwater models look at how
much water is likely to be available in underground
natural storages (known as groundwater aquifers).
The volume in aquifers is affected by how water
from rainfall and surface flows naturally percolate
underground to recharge aquifers. Climate
(especially rainfall and evaporation rates) affect both
surface water and groundwater availability.
The modelled volume of water stored in a dam for a 16-year period. The model simulates changes in rainfall, evaporation, and releases of water from the dam to meet downstream human and environmental needs. When the blue line is near the bottom of the chart, it indicates low water security.
Mu
rray V
an
derv
eer/
DP
IE
Jo
hn
Yu
rase
k/D
PIE
4 New climate analysis informs NSW’s regional water strategies
Increasing our knowledge of past and future climate helps us make better-informed decisions
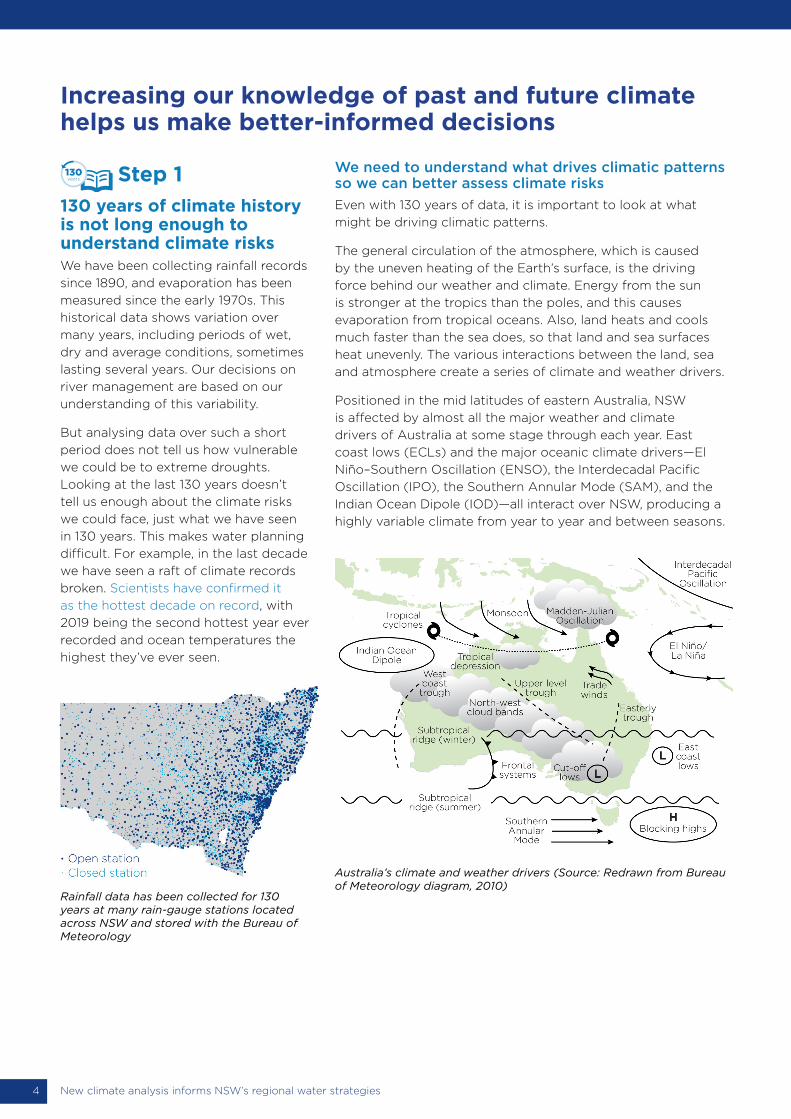
Rainfall data has been collected for 130 years at many rain-gauge stations located across NSW and stored with the Bureau of Meteorology
130 years of climate history is not long enough to understand climate risksWe have been collecting rainfall records
since 1890, and evaporation has been
measured since the early 1970s. This
historical data shows variation over
many years, including periods of wet,
dry and average conditions, sometimes
lasting several years. Our decisions on
river management are based on our
understanding of this variability.
But analysing data over such a short
period does not tell us how vulnerable
we could be to extreme droughts.
Looking at the last 130 years doesn’t
tell us enough about the climate risks
we could face, just what we have seen
in 130 years. This makes water planning
difficult. For example, in the last decade
we have seen a raft of climate records
broken. Scientists have confirmed it
as the hottest decade on record, with
2019 being the second hottest year ever
recorded and ocean temperatures the
highest they’ve ever seen.
We need to understand what drives climatic patterns so we can better assess climate risksEven with 130 years of data, it is important to look at what
might be driving climatic patterns.
The general circulation of the atmosphere, which is caused
by the uneven heating of the Earth’s surface, is the driving
force behind our weather and climate. Energy from the sun
is stronger at the tropics than the poles, and this causes
evaporation from tropical oceans. Also, land heats and cools
much faster than the sea does, so that land and sea surfaces
heat unevenly. The various interactions between the land, sea
and atmosphere create a series of climate and weather drivers.
Positioned in the mid latitudes of eastern Australia, NSW
is affected by almost all the major weather and climate
drivers of Australia at some stage through each year. East
coast lows (ECLs) and the major oceanic climate drivers—El
Niño–Southern Oscillation (ENSO), the Interdecadal Pacific
Oscillation (IPO), the Southern Annular Mode (SAM), and the
Indian Ocean Dipole (IOD)—all interact over NSW, producing a
highly variable climate from year to year and between seasons.
Australia’s climate and weather drivers (Source: Redrawn from Bureau of Meteorology diagram, 2010)
years130 Step 1
5New climate analysis informs NSW’s regional water strategies
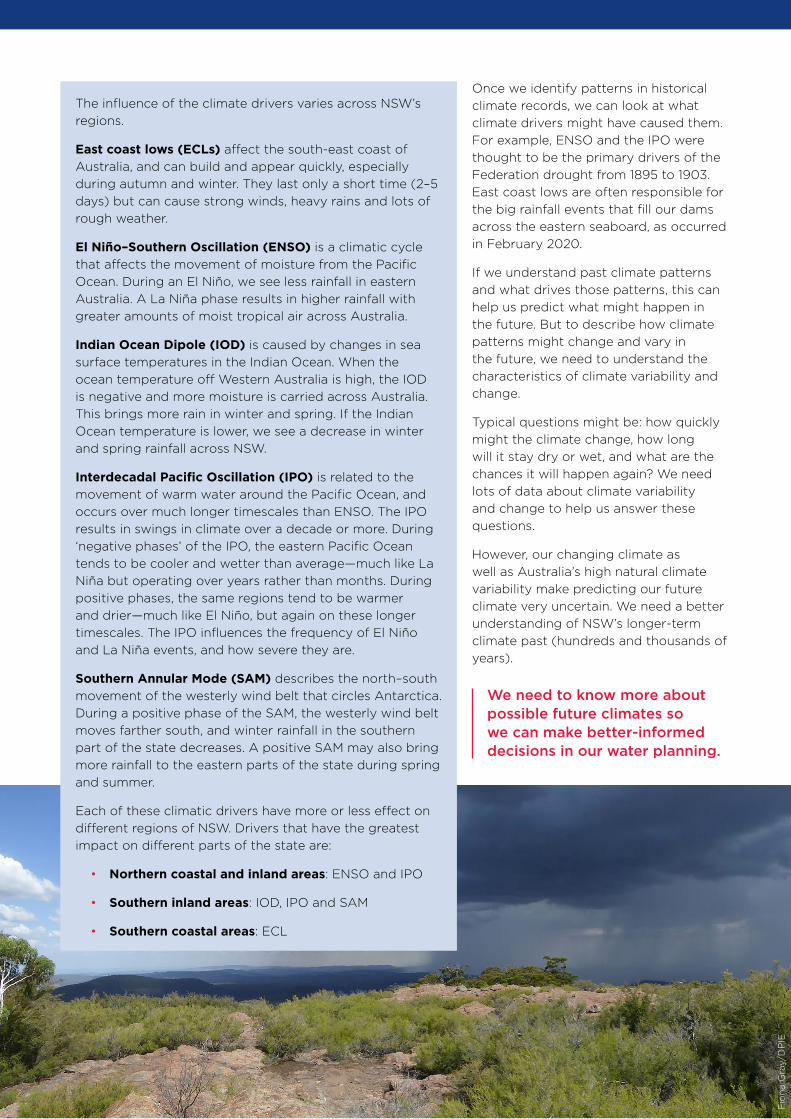
The influence of the climate drivers varies across NSW’s
regions.
East coast lows (ECLs) affect the south-east coast of
Australia, and can build and appear quickly, especially
during autumn and winter. They last only a short time (2–5
days) but can cause strong winds, heavy rains and lots of
rough weather.
El Niño–Southern Oscillation (ENSO) is a climatic cycle
that affects the movement of moisture from the Pacific
Ocean. During an El Niño, we see less rainfall in eastern
Australia. A La Niña phase results in higher rainfall with
greater amounts of moist tropical air across Australia.
Indian Ocean Dipole (IOD) is caused by changes in sea
surface temperatures in the Indian Ocean. When the
ocean temperature off Western Australia is high, the IOD
is negative and more moisture is carried across Australia.
This brings more rain in winter and spring. If the Indian
Ocean temperature is lower, we see a decrease in winter
and spring rainfall across NSW.
Interdecadal Pacific Oscillation (IPO) is related to the
movement of warm water around the Pacific Ocean, and
occurs over much longer timescales than ENSO. The IPO
results in swings in climate over a decade or more. During
‘negative phases’ of the IPO, the eastern Pacific Ocean
tends to be cooler and wetter than average—much like La
Niña but operating over years rather than months. During
positive phases, the same regions tend to be warmer
and drier—much like El Niño, but again on these longer
timescales. The IPO influences the frequency of El Niño
and La Niña events, and how severe they are.
Southern Annular Mode (SAM) describes the north–south
movement of the westerly wind belt that circles Antarctica.
During a positive phase of the SAM, the westerly wind belt
moves farther south, and winter rainfall in the southern
part of the state decreases. A positive SAM may also bring
more rainfall to the eastern parts of the state during spring
and summer.
Each of these climatic drivers have more or less effect on
different regions of NSW. Drivers that have the greatest
impact on different parts of the state are:
• Northern coastal and inland areas: ENSO and IPO
• Southern inland areas: IOD, IPO and SAM
• Southern coastal areas: ECL
Once we identify patterns in historical
climate records, we can look at what
climate drivers might have caused them.
For example, ENSO and the IPO were
thought to be the primary drivers of the
Federation drought from 1895 to 1903.
East coast lows are often responsible for
the big rainfall events that fill our dams
across the eastern seaboard, as occurred
in February 2020.
If we understand past climate patterns
and what drives those patterns, this can
help us predict what might happen in
the future. But to describe how climate
patterns might change and vary in
the future, we need to understand the
characteristics of climate variability and
change.
Typical questions might be: how quickly
might the climate change, how long
will it stay dry or wet, and what are the
chances it will happen again? We need
lots of data about climate variability
and change to help us answer these
questions.
However, our changing climate as
well as Australia’s high natural climate
variability make predicting our future
climate very uncertain. We need a better
understanding of NSW’s longer-term
climate past (hundreds and thousands of
years).
We need to know more about possible future climates so we can make better-informed decisions in our water planning.
Fio
na G
ray/
DP
IE
6 New climate analysis informs NSW’s regional water strategies
years500 Step 2
Adding 500 years of paleoclimatic climate dataTo go beyond 130 years and find out
more about past climate, we need to
investigate things that have spent a
long time in our landscape: tree rings,
cave stalactites and stalagmites, river
sediments, soil patterns, and ice cores.
When we study the data discovered in
these longer records of time, we can
detect past patterns of wet and dry that
go back 500 to 1,000 years. For example,
we can see there were a number of
droughts that went for several decades
between the 11th and 14th centuries.
This research provides us with a much
more extensive picture of past climates.
We can investigate this picture to
see how climate patterns and drivers,
especially the IPO, have changed over a
very long time. This helps us to see what
might happen in the future under similar
circumstances as in the past.
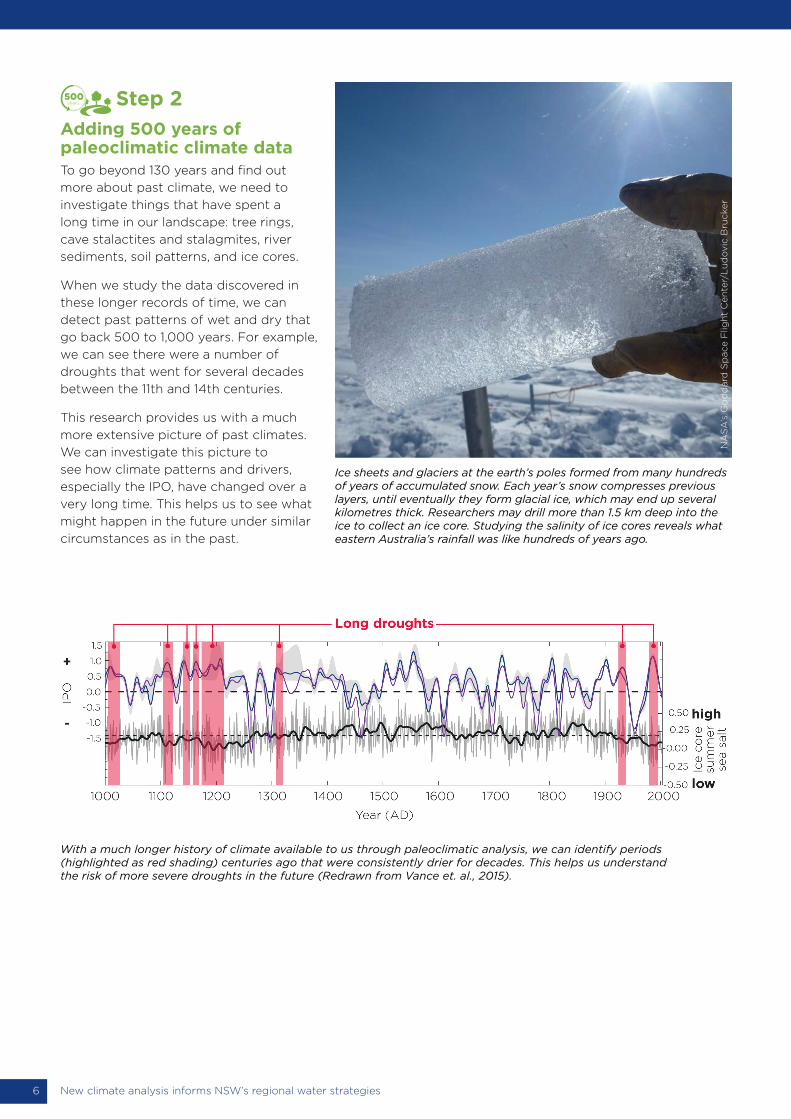
With a much longer history of climate available to us through paleoclimatic analysis, we can identify periods (highlighted as red shading) centuries ago that were consistently drier for decades. This helps us understand the risk of more severe droughts in the future (Redrawn from Vance et. al., 2015).
Ice sheets and glaciers at the earth’s poles formed from many hundreds of years of accumulated snow. Each year’s snow compresses previous layers, until eventually they form glacial ice, which may end up several kilometres thick. Researchers may drill more than 1.5 km deep into the ice to collect an ice core. Studying the salinity of ice cores reveals what eastern Australia’s rainfall was like hundreds of years ago.
NA
SA
’s G
od
dard
Sp
ace F
ligh
t C
en
ter/
Lu
do
vic
Bru
cker

7New climate analysis informs NSW’s regional water strategies
years10,000 Step 3Looking at the past to understand 10,000 years of climate dataAfter collecting a 500-year history of
climate data, we worked with researchers
to extend the past record of climate into
a 10,000-year record of the possible
future climates. We were especially
interested in the periods of wet and dry.
We extend the past data into longer
periods of climate through stochastic
modelling, which we use to look at how
observed data varies. We use that to
make a number of datasets for long
periods. For example, if we look at the
minimum, maximum and average rainfall
for a region, we can investigate questions
such as: how likely is one wet year to
follow another; or what are the chances
of multiple days of rainfall? Once we
understand these characteristics of past
climate, we can then construct extended
datasets that show similar patterns of
wet and dry climate periods to those
seen in the paleoclimate record. At
the same time, we introduce a random
component to model the range of
possible future patterns.
We splice together many different
patterns of climatic variation at a number
of different locations across NSW. This
gives us a wealth of climate data that
we can use in our water models to test
how resilient our water resources and
waterways are likely to be under all
possible combinations of droughts and
flooding rains.
In particular, this type of modelling tells
us much more about possible climatic
extremes. We now have a much better
understanding of the probability of long-
term droughts in the future.
Once we have set up our stochastic
models, we can look at how different
sequences of climate might affect the
availability of water to NSW’s water
resources.
However, this modelling is still based on
our knowledge of the past climate. It
doesn’t tell us what might happen under
a changing climate.
Sh
aro
n B
ow
en
/DP
IE
8 New climate analysis informs NSW’s regional water strategies
Step 4Using climate-change projections to improve our understanding of future risks Using historical climate data, even
500 years’ worth of it, assumes that
everything will stay the same. But
climate scientists say this is very unlikely.
Moving from a fixed point in history to
a changing future means that climate
processes and patterns that happened in
the past won’t necessarily occur in
the future.
The two main climate features that are
important for water modelling are rainfall
and evaporation of water (from the
surface of water and through plants). For
rainfall, which is highly variable, we need
to know characteristics of daily, seasonal,
yearly and decadal changes. These
characteristics, in particular, affect how
much water is available.
Global climate models are useful for
providing broad predictions of likely
variations and changes in rainfall, rather
than providing specific regional details.
For NSW, they indicate that there is
unlikely to be much change in rainfall in
the north of the state. But in the south,
winter and spring rains are likely to be
less. Along the south coast, changes in
the patterns of east coast lows are likely,
with an increase in the intensity of rainfall.
Global climate models are much
more accurate at predicting future
temperatures, which drive evaporation
rates, as there is less variability in
evaporation rates compared to rainfall. All
models predict increases across the state.
However, global climate models are
unable to predict the future climate
in any detail at a regional scale. This
means we need to use our historical
knowledge of climate variability across
NSW to produce climate information
that is useful in water models. Modellers
use a process called downscaling, which
overlays our historical knowledge of how
rainfall varies across the state with the
broad predictions about rainfall change.
The best way to downscale is to use
regional climate models such as the NSW
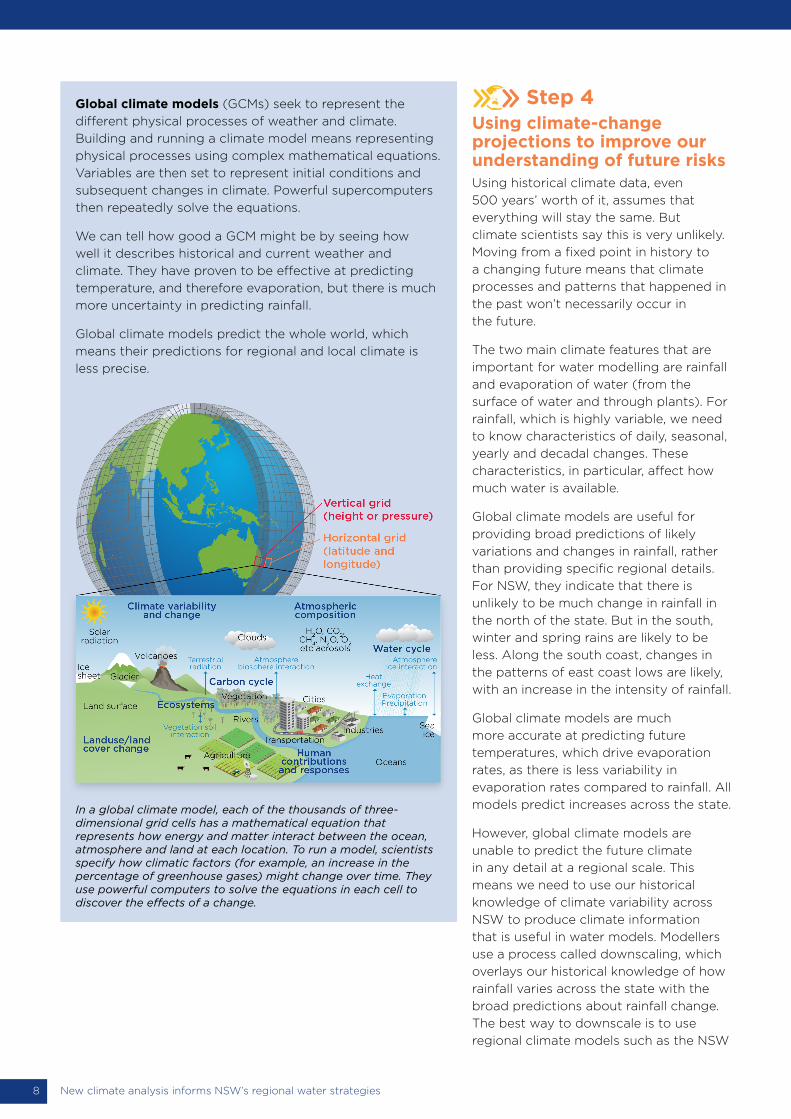
Global climate models (GCMs) seek to represent the
different physical processes of weather and climate.
Building and running a climate model means representing
physical processes using complex mathematical equations.
Variables are then set to represent initial conditions and
subsequent changes in climate. Powerful supercomputers
then repeatedly solve the equations.
We can tell how good a GCM might be by seeing how
well it describes historical and current weather and
climate. They have proven to be effective at predicting
temperature, and therefore evaporation, but there is much
more uncertainty in predicting rainfall.
Global climate models predict the whole world, which
means their predictions for regional and local climate is
less precise.
In a global climate model, each of the thousands of three-dimensional grid cells has a mathematical equation that represents how energy and matter interact between the ocean, atmosphere and land at each location. To run a model, scientists specify how climatic factors (for example, an increase in the percentage of greenhouse gases) might change over time. They use powerful computers to solve the equations in each cell to discover the effects of a change.
9New climate analysis informs NSW’s regional water strategies
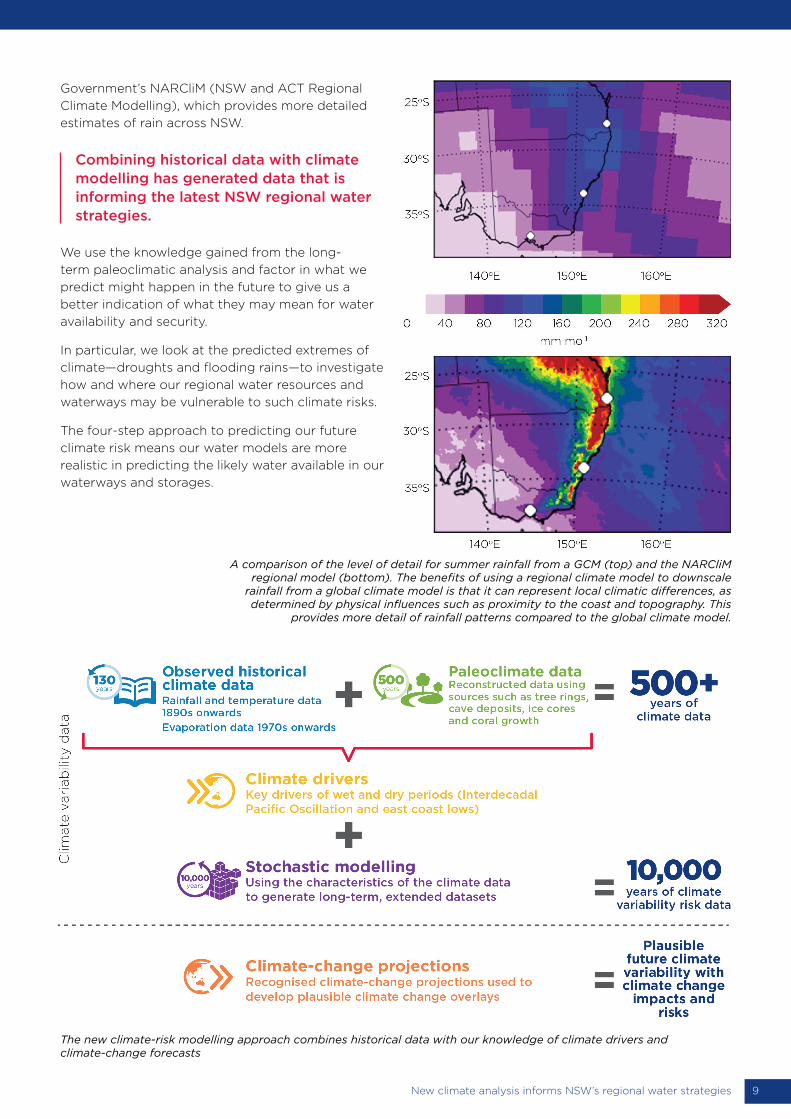
Government’s NARCliM (NSW and ACT Regional
Climate Modelling), which provides more detailed
estimates of rain across NSW.
Combining historical data with climate modelling has generated data that is informing the latest NSW regional water strategies.
We use the knowledge gained from the long-
term paleoclimatic analysis and factor in what we
predict might happen in the future to give us a
better indication of what they may mean for water
availability and security.
In particular, we look at the predicted extremes of
climate—droughts and flooding rains—to investigate
how and where our regional water resources and
waterways may be vulnerable to such climate risks.
The four-step approach to predicting our future
climate risk means our water models are more
realistic in predicting the likely water available in our
waterways and storages.
A comparison of the level of detail for summer rainfall from a GCM (top) and the NARCliM regional model (bottom). The benefits of using a regional climate model to downscale
rainfall from a global climate model is that it can represent local climatic differences, as determined by physical influences such as proximity to the coast and topography. This
provides more detail of rainfall patterns compared to the global climate model.
The new climate-risk modelling approach combines historical data with our knowledge of climate drivers and climate-change forecasts
10 New climate analysis informs NSW’s regional water strategies
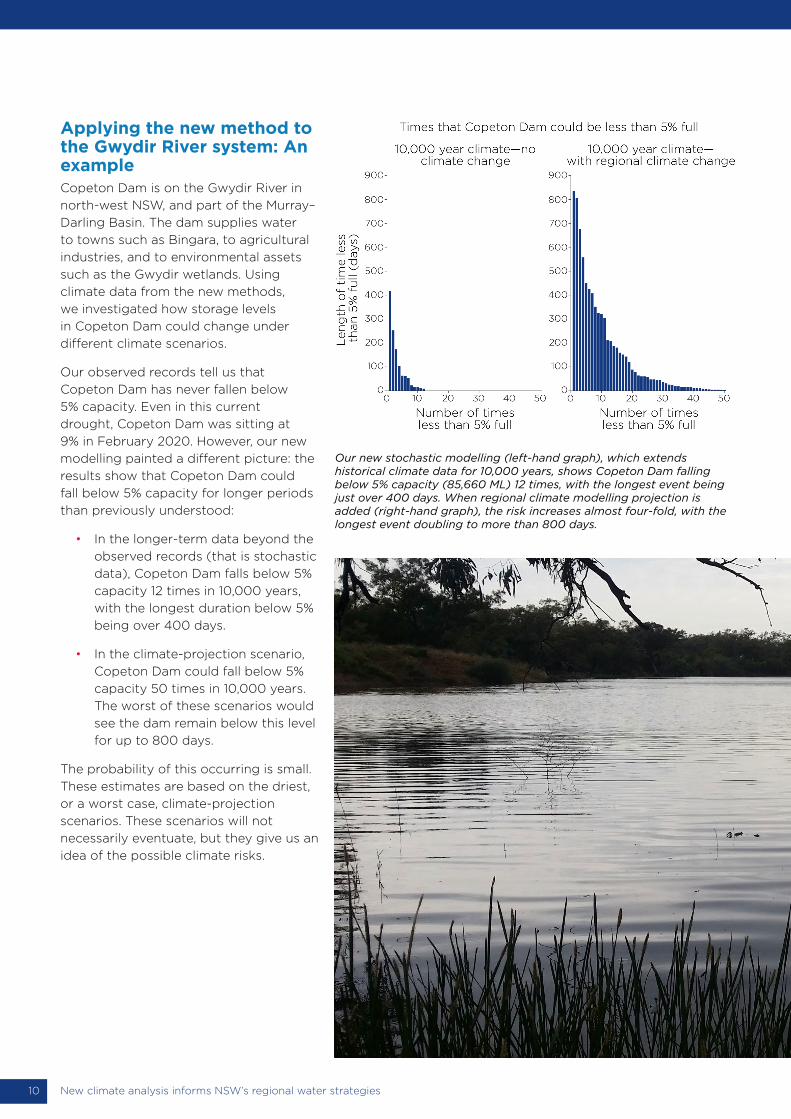
Our new stochastic modelling (left-hand graph), which extends historical climate data for 10,000 years, shows Copeton Dam falling below 5% capacity (85,660 ML) 12 times, with the longest event being just over 400 days. When regional climate modelling projection is added (right-hand graph), the risk increases almost four-fold, with the longest event doubling to more than 800 days.
Applying the new method to the Gwydir River system: An exampleCopeton Dam is on the Gwydir River in
north-west NSW, and part of the Murray–
Darling Basin. The dam supplies water
to towns such as Bingara, to agricultural
industries, and to environmental assets
such as the Gwydir wetlands. Using
climate data from the new methods,
we investigated how storage levels
in Copeton Dam could change under
different climate scenarios.
Our observed records tell us that
Copeton Dam has never fallen below
5% capacity. Even in this current
drought, Copeton Dam was sitting at
9% in February 2020. However, our new
modelling painted a different picture: the
results show that Copeton Dam could
fall below 5% capacity for longer periods
than previously understood:
• In the longer-term data beyond the
observed records (that is stochastic
data), Copeton Dam falls below 5%
capacity 12 times in 10,000 years,
with the longest duration below 5%
being over 400 days.
• In the climate-projection scenario,
Copeton Dam could fall below 5%
capacity 50 times in 10,000 years.
The worst of these scenarios would
see the dam remain below this level
for up to 800 days.
The probability of this occurring is small.
These estimates are based on the driest,
or a worst case, climate-projection
scenarios. These scenarios will not
necessarily eventuate, but they give us an
idea of the possible climate risks.
11New climate analysis informs NSW’s regional water strategies
A note of caution: There is always a
level of uncertainty with this type of
modelling, which needs to be taken
into account as part of any decision-
making and planning for water
security.
In some instances, this may mean
managing risks to our water
security by being prepared and
resilient, rather than relying on firm
predictions.
As the science develops further, we
will be able to reduce or quantify
some of these uncertainties.
The message from the new modelling to date is that our water supplies in NSW could be less secure than we thought. This is because we have factored in that droughts longer than those of the last 130 years are likely at some point, and that we could see higher temperatures and less rainfall.
The degree of security varies across regions, and in our regional
water strategies we are seeking to address areas where water
resources and waterways are most vulnerable.
This is compared to when we used only 130 years of climate
records for our assessments. These assessments could not
look at the range of possible future climates based on our
new knowledge of long-term climate historical variability and
possible future climate changes.
Jan
e H
um
ph
ries/
DP
IE
12 New climate analysis informs NSW’s regional water strategies
For more information
www.dpie.nsw.gov.au/new-climate-data-and-modelling
Expert review points the way to further improving our understandingAn expert panel evaluated our new climate-risk assessment
method. The NSW Office of the Chief Scientist and Engineer
convened the panel, which was commissioned by the NSW
Minister for Water, Property and Housing to ensure the
method’s rigour and validity.
The panel found that the method is ‘fit for purpose’ in providing
the best available knowledge of climate risk to inform NSW’s
regional water strategies. They found that the method was
consistent with best practice in the field and a major advance
over using only historical records or only climate models.
The expert panel noted that this is an area where the science
is still developing. They recommended ongoing work to
continuously improve the method and keep up to date with the
latest scientific findings.
The NSW Government is considering all of the
recommendations made by the panel and is preparing a
response to show how these may be addressed.
Jo
hn
Sp
en
cer/
DP
IE
PUB20/435
© State of New South Wales through Department of Planning, Industry and Environment 2020. The information contained in this publication is based on knowledge and understanding at the time of writing (June 2020). However, because of advances in knowledge, users are reminded of the need to ensure that the information upon which they rely is up to date and to check the currency of the information with the appropriate officer of the Department of Planning, Industry and Environment or the user’s independent adviser.