Embed Size (px)
Citation preview

New cell based assays and tools for epigenetics, biologics, metabolic markers and more......
Craig Malcolm: Product Manager Cell Analysis & Proteomics
Cell-Based Assay Tour - March2014

Outline
Brief outline of Promega’s epigenetics portfolio
new isozyme-selective cell-based histone deacetylase assays
Cell based assays for Biologics characterisation Reporter gene bioassays for antibody-dependent cellular cytotoxicity (ADCC)
Additional reporter gene assays for other biologic therapeutic mAb’s
Recently launched suite of luminescence read-out metabolite assays
New assays for oxidative stress (ROS-Glo)
2

Epigenetics - definition
• heritable changes in gene expression that arise from changes in chromosomes without alteration of DNA sequence
• changes occur throughout all stages of development or in response to environmental factors such as exposure to toxins or chronic stress and are implicated in diseases such as cancer
• Epigenetic mechanisms of gene regulation, which collectively make up the epigenome, include modifications to DNA and histone components of nucleosomes as well as expression of noncoding RNAs (ncRNAs)
• modifications can affect gene accessibility to DNA-binding and regulatory proteins such as methyl-CpG-binding proteins, transcription factors, RNA polymerase II and other components of the transcriptional machinery, ultimately altering transcription patterns, often in tissue- and cell-specific ways
3

Typical epigenetic modifications
4
Epigenetic mechanisms involved in regulation of gene expression Cytosine residues within DNA can be methylated, and lysine and arginine residues of histone proteins can be modified. Me = methylation, Ac = acetylation, P = phosphorylation, Ub = ubiquitination.

Promega’s epigenetics portfolio - I
• Non-cell based assays
• MethylEdge™ Bisulfite Conversion System
• efficient DNA conversion and recovery with reduced template fragmentation using a protocol that can be completed in less than two hours
• kit includes includes desulphonation and cleanup. Component
• no additional cleanup kit required
• Methylation-Specific Restriction Enzymes eg. HpaII, MboI, MspI, and Sau3AI
• valuable tools for studying DNA methylation patterns
• coupled with robust DNA purification and PCR reagents - allow for detection of methylation-specific events
5

Promega’s epigenetics portfolio - II
• Methyltransferase (MTase-Glo) – in development
• Universal assay
• Based on production of s-adenosylhomocysteine (SAH)
• Designed for characterising the effects of compounds on DNA, protein and small molecule methyltransferases
6
CH3

Promega’s epigenetics portfolio - III
• Cell-based & biochemical assays - simple luminescence-based assays for
• histone deacetylase (HDAC) & sirtuin (SIRT) activities
• HDAC-Glo™ Assays are used to determine histone deacetylase activity in cell-based or biochemical formats
• flexible, sensitive bioluminescent assays provide a highly predictive, easy-to-use method for accurate and efficient inhibitor profiling.
• DUB-Glo™ Protease Assay
• homogeneous, bioluminescent assay that measures the activity of numerous deconjugating enzymes including deubiquitinating (DUB), deSUMOylating (SENP) and deneddylating (NEDP) proteases
• hese proteases reverse the protein modification by ubiquitin and ubiquitin-like proteins (Ubl proteins) and thus are integral components in the complex mechanisms of post-translational protein regulation in eukaryotes.
7
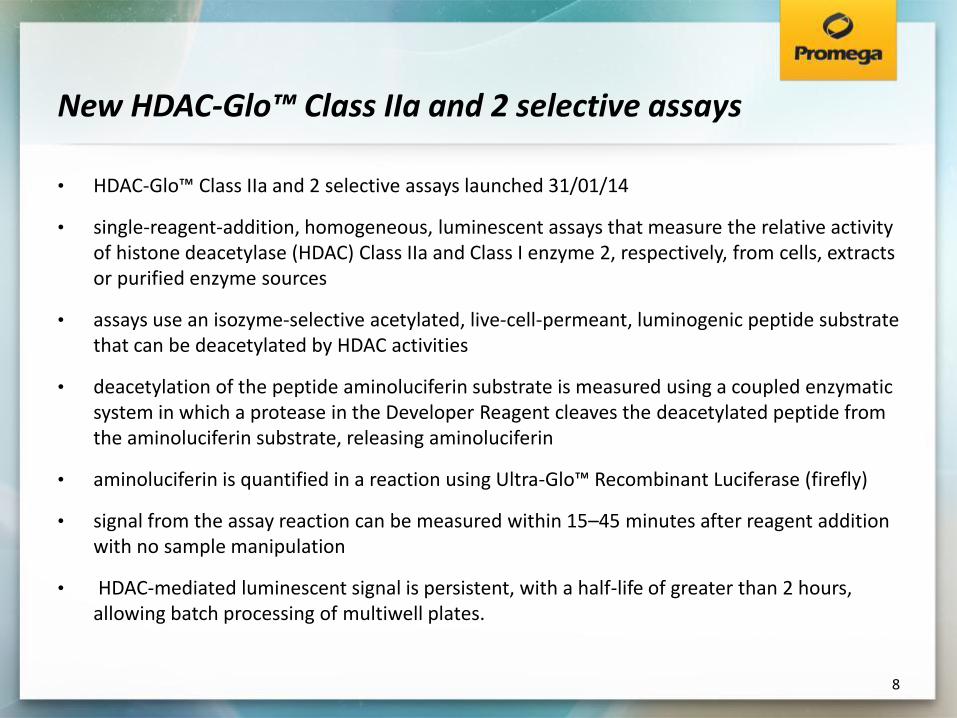
New HDAC-Glo™ Class IIa and 2 selective assays
• HDAC-Glo™ Class IIa and 2 selective assays launched 31/01/14
• single-reagent-addition, homogeneous, luminescent assays that measure the relative activity of histone deacetylase (HDAC) Class IIa and Class I enzyme 2, respectively, from cells, extracts or purified enzyme sources
• assays use an isozyme-selective acetylated, live-cell-permeant, luminogenic peptide substrate that can be deacetylated by HDAC activities
• deacetylation of the peptide aminoluciferin substrate is measured using a coupled enzymatic system in which a protease in the Developer Reagent cleaves the deacetylated peptide from the aminoluciferin substrate, releasing aminoluciferin
• aminoluciferin is quantified in a reaction using Ultra-Glo™ Recombinant Luciferase (firefly)
• signal from the assay reaction can be measured within 15–45 minutes after reagent addition with no sample manipulation
• HDAC-mediated luminescent signal is persistent, with a half-life of greater than 2 hours, allowing batch processing of multiwell plates.
8

HDAC-Glo™ Class IIa - mechanism
9

HDAC-Glo Class IIa data
10
• biochemical assay format • compare HDAC 4, 5, 7 and 9 • 384-well format • assay volume 20µl
• cell-based assay format • compare lytic/non-lytic assay • using K562 cells as HDAC IIa source • 2,500 cell/well (lytic) • 10,000 cells/well (non-lytic) • 384-well format • assay volume 40µl
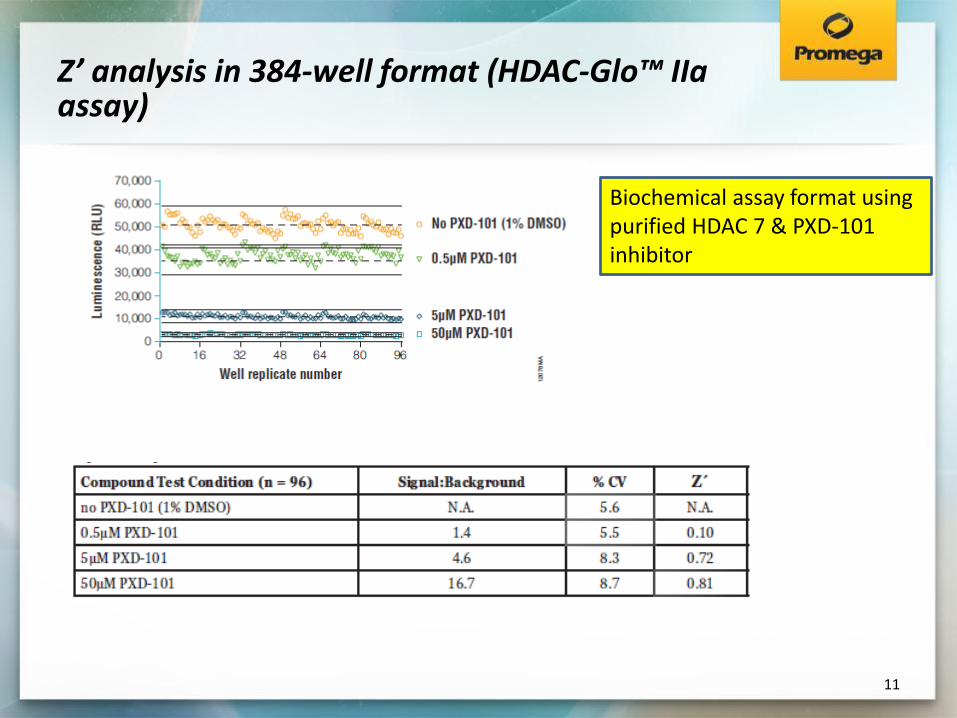
Z’ analysis in 384-well format (HDAC-Glo™ IIa assay)
11
Biochemical assay format using purified HDAC 7 & PXD-101 inhibitor

HDAC-Glo™ Class 2 - mechanism
12

HDAC-Glo Class 2 data
13
• biochemical assay format • Recombinant HDAC 2 • Inhibitors SAHA & LBH-589 • 384-well format • assay volume 20µl
• cell-based assay format • compare lytic/non-lytic assay • using K562 cells as HDAC 2 source • 750 cells/well (lytic) • 5,000 cells/well (non-lytic) • 384-well format • assay volume 40µl

Z’ analysis in 384-well format (HDAC-Glo™ 2 assay)
14
Biochemical assay format using purified HDAC 2 & SAHA inhibitor
Tools for biologics – ADCC reporter assays and other cell-based assays for mAb characterisation

What is ADCC?
16
Image source: Wikipedia
Antibody-dependent cell-mediated cytotoxicity (ADCC) is the main MOA of antibodies through which virus-infected or other diseased cells are targeted for destruction by components of the cell-mediated immune system, such as NK cells
effector cell
target cell

Mechanism of action (MOA) for mAb - definitions
Classification of therapeutic
antibodies based on their
putative mechanisms of action
Class I: mAbs bind cell surface
antigens and the Fc effector function
is part of the MOA
Class II: mAbs bind cell surface
antigens but MOA does not involve Fc
effector function
Class III: mAbs bind and neutralize
soluble antigens, blocking ligand from
binding to its cognate receptor (e.g.,
Avastin)

Antibody structure
18
Fab domain - binds to antigen expressed on target cells eg. cancer cells, virus infected cells
Fc domain – binds to Fc receptor (eg. FcƴIIIR, CD16) on immune system effector cells

Traditional ADCC Assays
Effector cells
PBMCs (peripheral blood mononuclear cells)
Natural killers cells (NK) from PBMCs
NK cell lines (eg. NK92)
Target cells
Load with chromium-51 or Eu
Monitor cell lysis (LDH, Calcein AM, GAPDH, CytoTox-Glo™)
19
CytoTox-Glo™ Cytotoxicity Assay
difficult to isolate & purify, variable yields & efficacy
stability of Fc receptor expression an issue
spontaneous release, radioactive
additional assay step

Target cell Y = NFAT-RE-luc
Reduced variability by replacing NK cells with genetically engineered stable cell line
FcgRIIIa (V158) NFAT-RE luc2
Improved bioassay performance with
robust reagents and assay design
FcgRIIIa
Antibody
Effector cell = engineered
Jurkat
Reporter-based ADCC bioassay
Glo
Target cell Y Primary NK
effector cell
Antibody
FcgRIIIa
High variability of assay - mainly due to primary NK cells
Spontaneous lysis of target & effector
cells results in high background
Classic ADCC assay
Signal is from target cell Signal is from effector cell
20
Cell lysis
Classic ADCC assay vs ADCC reporter bioassay

Image source: Leibson-PJ, Immunity 1997
Luciferase reporter is readout of pathway
activation state
Target-cell bound Ab binds to FcgRIIIa on effector cell – activating pathway
Scientific basis of ADCC reporter bioassay
21
New reporter gene bioassay measures a
step earlier in the pathway

ADCC reporter bioassay - development
Low Variability NFAT-RE luciferase bioassay 1. Effector cells are engineered to
express FcgRIIIa (V158) and NFAT-RE luc2 luciferase
2. ‘Cells as reagents’ (thaw-and-use)
3. Homogeneous assay format – simple ‘add-mix-read’ bioluminescent assay
4. Optimized and robust assay reagents and protocol
5. Performance characteristics that meet needs of stability testing, lot release and Ab characterization
Developed & tested using: • CD20 and Her2 Ab drugs • CD20+ and Her2+ target cells • Frozen, thaw-and-use, or
continuously cultured cells
• Extensive ‘alpha’ evaluations: - tested in multiple global biopharma & biotechs - tested in multiple systems
22

ADCC reporter bioassay protocol
1. Incubate control, reference or test antibody with target cells.
2. Add engineered effector cells containing: - FcgRIIIa (V158) - NFAT-RE luc2 luciferase
3. Incubate to allow for pathway activation (as short as 6 hours).
4. Add luciferase detection reagent and measure luminescence.
Single day bioassay – no cell preparation!
23
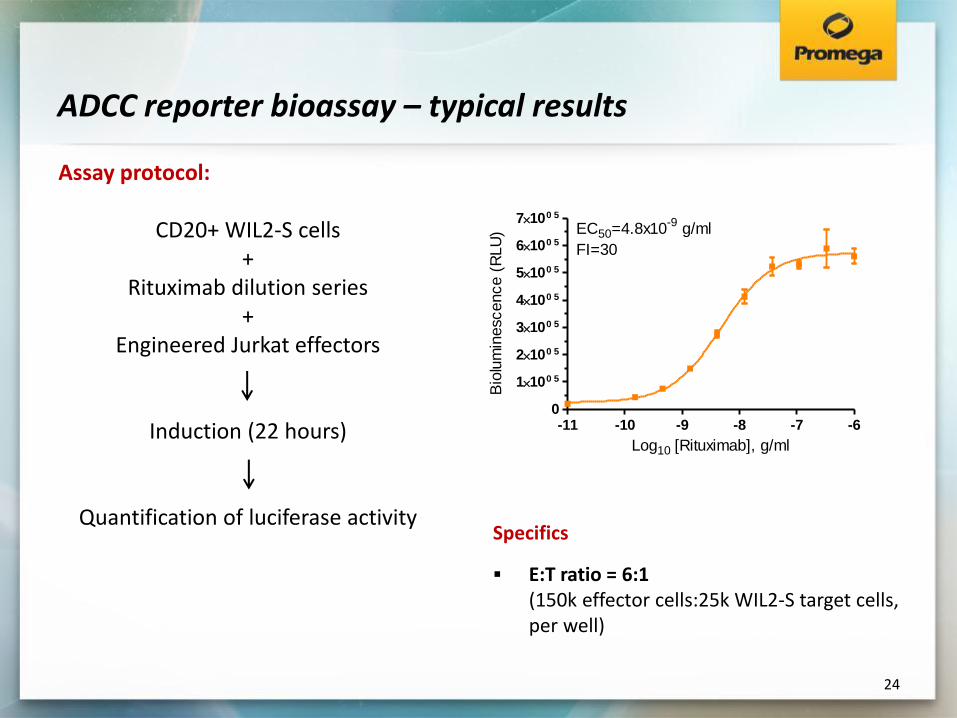
ADCC reporter bioassay – typical results
Specifics
E:T ratio = 6:1 (150k effector cells:25k WIL2-S target cells, per well)
24
Assay protocol:
CD20+ WIL2-S cells +
Rituximab dilution series +
Engineered Jurkat effectors
Induction (22 hours)
Quantification of luciferase activity
-11 -10 -9 -8 -7 -60
1100 5
2100 5
3100 5
4100 5
5100 5
6100 5
7100 5
EC50=4.8x10⁻⁹
g/ml
FI=30
Log10 [Rituximab], g/ml
Bio
lum
inescence (
RLU
)

CD20+ B cell lines (suspension) as target cells Her2+ breast cancer cell lines (adherent) as target cells
Suspension or adherent target cells can be used
25
Use of different target cells
Rituximab (anti-CD20) Trastuzumab (anti-Her-2)

Reflective of the mechanism of action (MOA) of the biological product
Well controlled (precise, accurate, robust, reproducible)
Stability-indicating
Usable as a QC lot-release assay
26
An ideal bioassay…

ADCC reporter bioassay is specific and reflective of the mechanism of action of the biologic material
Target cells, effector cells and specific antibody
No Target cells
No Effector cells or no FcgRIIIa
No antibody or non-specific antibody
Assay signal is dependent on: Presence of Target cells + Presence of FcgRIIIa receptor + Appropriate specific antibody
27 Reflects correct MOA

Bioassay characteristics - ICH guideline Q2 [R1]
Validation of Analytical Procedures: Accuracy Precision:
Repeatability (intra-assay precision)
Intermediate precision (day to day, analyst-to analyst)
Reproducibility (lab to lab) Specificity Linearity Range Robustness
Design: • Two analysts • Three days • Four plates per day 100% vs 50% 100% vs 75% 100% vs 125% 100% vs 150% -10 -9 -8 -7 -6 -5
0
5
10
15
20
25
30
35
100%
50%
150%
Log10 [B1 antibody], g/ml
Fo
ld o
f In
ductio
n
-10 -9 -8 -7 -6 -50
5
10
15
20
25
30
35plate1
plate2
plate3
plate4
Log10 [B1 antibody], g/ml
Fo
ld o
f In
du
cti
on
Y=1.026X-5.126 R2=0.995
Relative potency
Repeatability Linearity
Log [control antibody], g/ml
Log [control antibody], g/ml
28
Assay is well controlled (precise, accurate, robust, reproducible)

Stability indicating for Fc effector function – activity of heat-treated antibody drugs
EC50 = 5.77ng/ml
EC50 = 31.0ng/ml
Rituximab
Tositumomab
Trastuzumab
Activity of heat-treated antibody drugs
29
Assay is stability-indicating & usable as a QC lot-release assay

30
Rituximab and Trastuzumab: Linear correlation obtained between percentage of N-glycosylated antibody in blended antibody samples and relative luciferase reporter activity in ADCC reporter bioassay
y = 0.0127x - 0.0314R² = 0.966
-0.100
0.000
0.100
0.200
0.300
0.400
0.500
0.600
0.700
0 10 20 30 40 50 60
Re
lati
ve a
ctiv
ity
in r
ep
ort
er
AD
CC
Percent N-glycosylated sample
y = 0.0125x - 0.0095R² = 0.9926
0.000
0.100
0.200
0.300
0.400
0.500
0.600
0.700
0 10 20 30 40 50 60
Re
lati
ve a
ctiv
ity
in r
ep
ort
er
AD
CC
Percent N-glycosylated sample
Rituximab
Trastuzumab
Small differences in Fc effector activity in ADCC pathway activation are easily distinguished in the ADCC reporter bioassay
ADCC reporter bioassay activity correlates with amount of antibody N-glycosylation
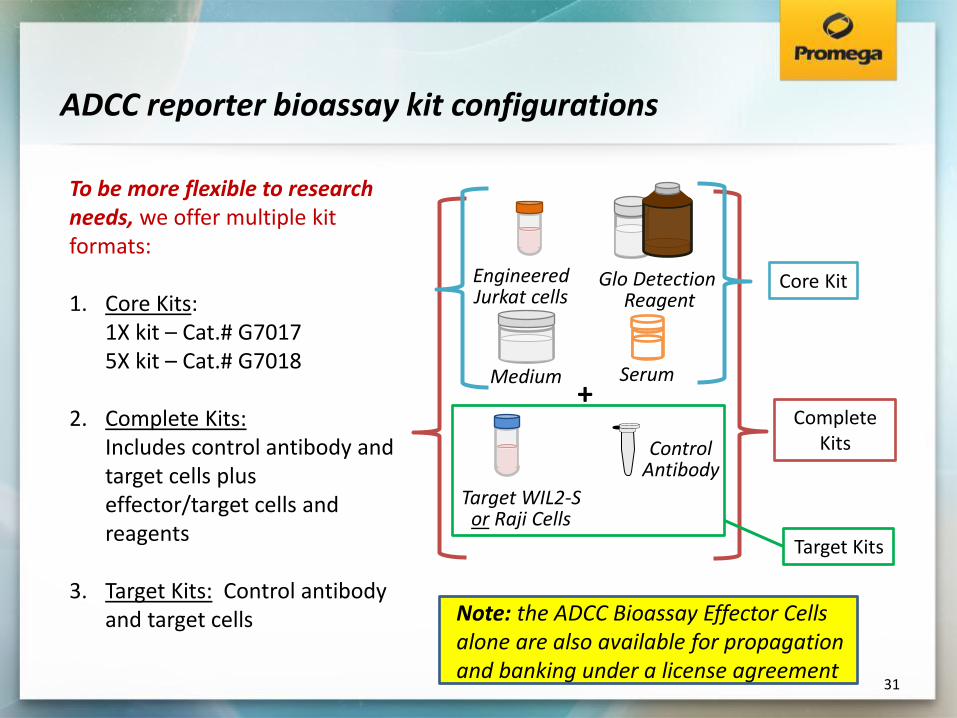
ADCC reporter bioassay kit configurations
Engineered Jurkat cells
Glo Detection Reagent
Control Antibody
Target WIL2-S or Raji Cells
Core Kit
Complete Kits
+ Medium Serum
To be more flexible to research needs, we offer multiple kit formats: 1. Core Kits:
1X kit – Cat.# G7017 5X kit – Cat.# G7018
2. Complete Kits: Includes control antibody and target cells plus effector/target cells and reagents
3. Target Kits: Control antibody and target cells
Target Kits
Note: the ADCC Bioassay Effector Cells alone are also available for propagation and banking under a license agreement
31
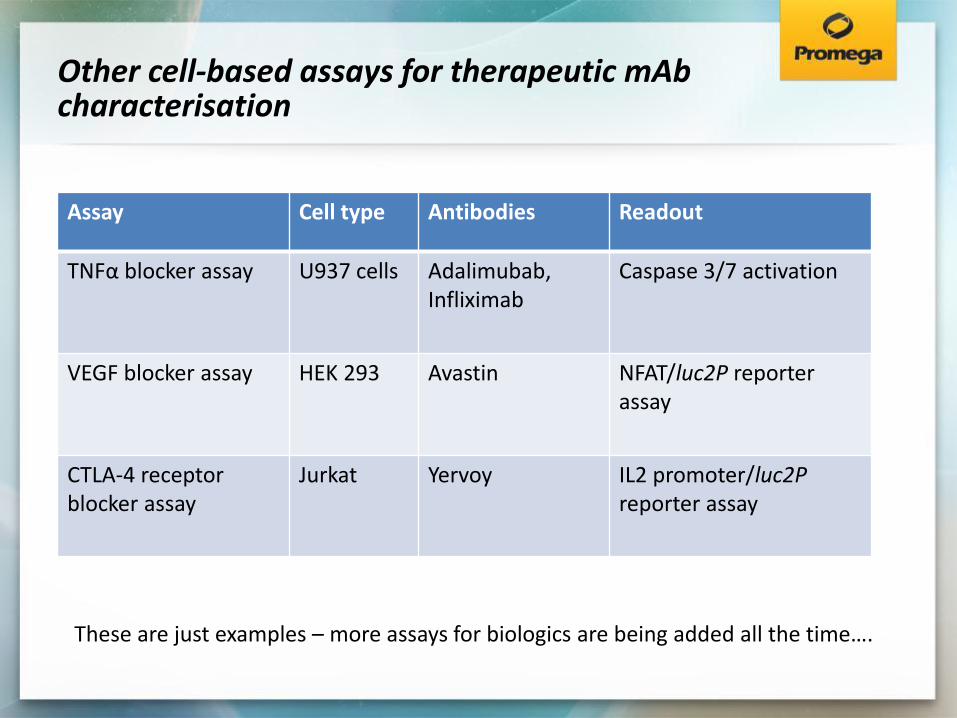
Other cell-based assays for therapeutic mAb characterisation
Assay Cell type Antibodies Readout
TNFα blocker assay U937 cells Adalimubab, Infliximab
Caspase 3/7 activation
VEGF blocker assay HEK 293 Avastin NFAT/luc2P reporter assay
CTLA-4 receptor blocker assay
Jurkat Yervoy IL2 promoter/luc2P reporter assay
These are just examples – more assays for biologics are being added all the time….

TNFα blocker assay
Apoptosis is a mechanism of action of TNFa and suitable as a bioassay readout TNFa
TNFa receptor
DD TR
AD
D
FAD
D
pro
casp
ase
8
casp
ase
8
casp
ase
3
Apoptotic cell death
Bid
Cell death
Cytoplasm
Nucleus
NF-kB
NF-kB activation
translocation
Rip
TRAF 2
ASK1 MEKK1 IkBa degradation
Cell survival
MKK7 JNK
translocation
AP-1 Cell differentiation

Bioluminescent TNFα blocker apoptosis bioassay
Response duration (2.5hr)
Add Caspase-Glo® 3/7 Bioassay Reagent
Glo
Protocol: 1. TNFa and anti-TNFa Ab are
co-incubated; the TNFa and
anti-TNFa mix is added to thaw-and
use U937 cells in assay medium.
2. Response is induced in as little as
2.5hr.
3. Caspase-Glo® 3/7 Assay is added
and luminescence is measured
immediately.
Frozen, Thaw-and-Use
U937 Cells
Apoptosis readout: quantifying blocker activity against TNFa
TNFa/anti-TNFa Ab (1 hr preincubation)
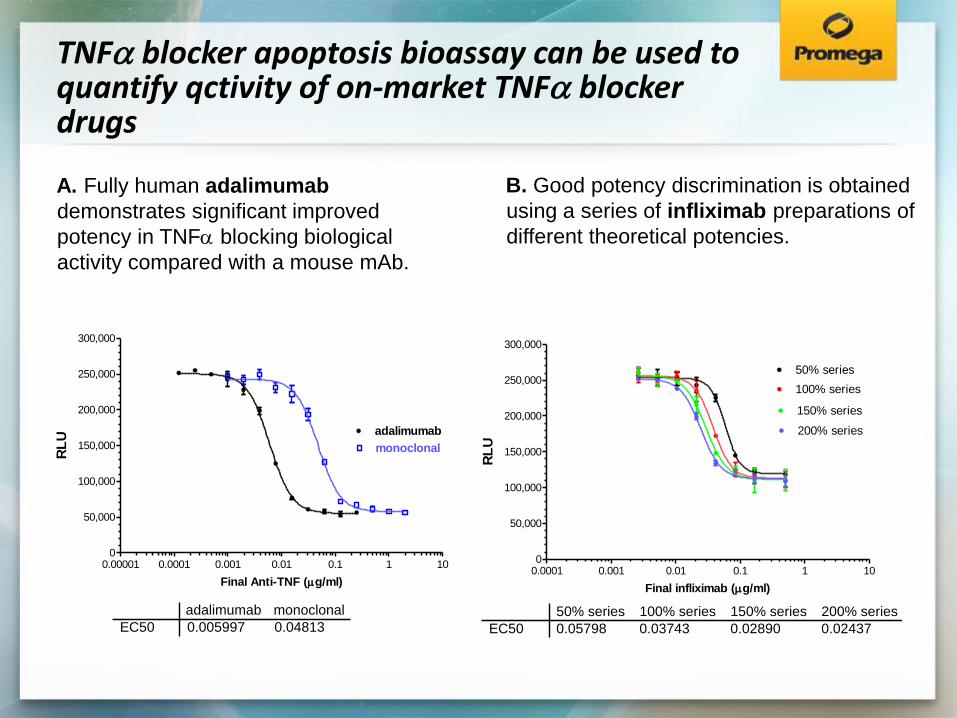
TNFa blocker apoptosis bioassay can be used to quantify qctivity of on-market TNFa blocker drugs
A. Fully human adalimumab
demonstrates significant improved
potency in TNFa blocking biological
activity compared with a mouse mAb.
B. Good potency discrimination is obtained
using a series of infliximab preparations of
different theoretical potencies.
0.00001 0.0001 0.001 0.01 0.1 1 100
50,000
100,000
150,000
200,000
250,000
300,000
EC50
adalimumab
0.005997
monoclonal
0.04813
monoclonal
adalimumab
Final Anti-TNF (g/ml)
RL
U
0.0001 0.001 0.01 0.1 1 100
50,000
100,000
150,000
200,000
250,000
300,000
Remicade neutralizations with multiple potency series
60 min. pre-incubation at 37C
June 10, 2010 45 min data at room temp
EC50
50% series
0.05798
100% series
0.03743
150% series
0.02890
200% series
0.02437
HillSlope
50% series
-3.783
100% series
-3.053
150% series
-2.700
200% series
-2.813
50% series
100% series
150% series
200% series
Final infliximab (g/ml)
RL
U
A. Fully human adalimumab
demonstrates significant improved
potency in TNFa blocking biological
activity compared with a mouse
monoclonal Ab
B. Good potency discrimination
is obtained using a series of
infliximab preparations of
different theoretical potencies.

VEGF blocker assay principle

Avastin titration
Raw data Fold increase

Yervoy/CTLA-4 assay principle
38

Jurkat/IL2-luc2P/CTLA-4 Delta stable cell line performance
39
Raw data Fold increase

New assays for metabolic markers
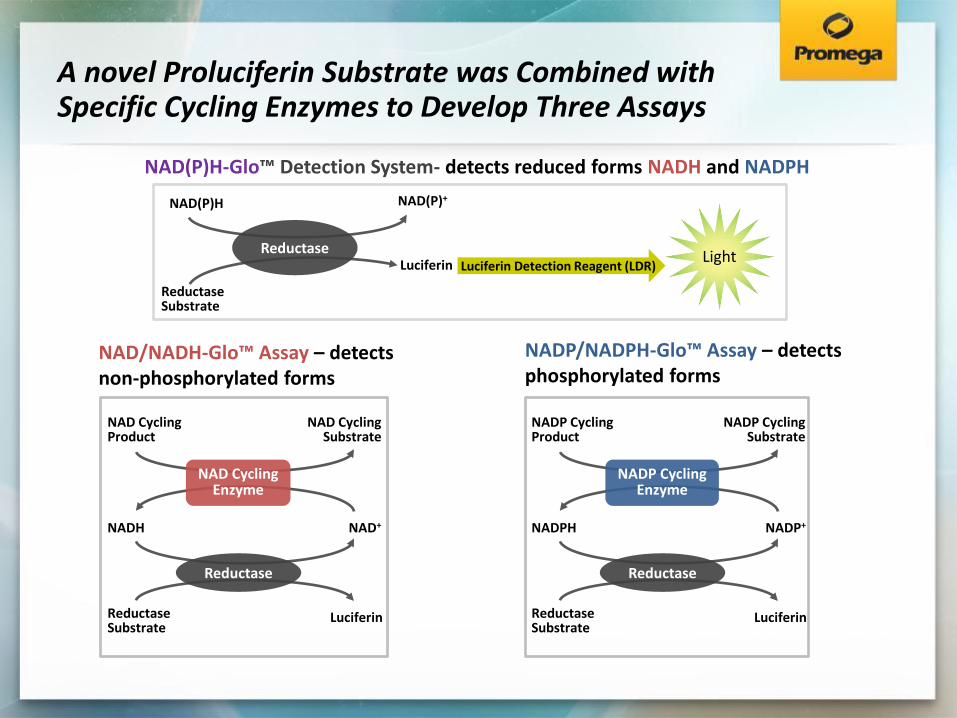
A novel Proluciferin Substrate was Combined with Specific Cycling Enzymes to Develop Three Assays
NAD(P)H-Glo™ Detection System- detects reduced forms NADH and NADPH
Reductase
NAD(P)H NAD(P)+
Reductase Substrate
Luciferin Luciferin Detection Reagent (LDR) Light
NAD/NADH-Glo™ Assay – detects non-phosphorylated forms
NADP/NADPH-Glo™ Assay – detects phosphorylated forms
Reductase
NADH NAD+
Reductase Substrate
Luciferin
NAD Cycling Product
NAD Cycling Substrate
NAD Cycling Enzyme
Reductase
NADPH NADP+
Reductase Substrate
Luciferin
NADP Cycling Product
NADP Cycling Substrate
NADP Cycling Enzyme

Features of the assays: sensitivity , specificity and wide assay window
NAD(P)H-Glo Detection system
NAD/NADH-Glo Detection system
NADP/NADPH-Glo Detection system
Limit of Detection (LOD)
25nM (625fmol/25l) 1nM (25fmol/25l) 1nM (25fmol/25l)
Linearity 25nM – 50M 1 – 500nM 1 – 500nM
Signal-to-background (S/B max)
~400 ~250 ~250
Cells/well for Total dinucleotides
NA 500 -25,000 500 – 12,000
Cells/well for Individual dinucleotides
NA 2,000 -100,000 2,000 – 100,000

Sample preparation for measuring NAD+ /NADH or NADP/NADPH individually
Both assays employ an sample acidification or heat-treatment (60oC) step to selectively destroy a specific metabolite

ROS-Glo™ H2O2 Assay
ROS-Glo™ H2O2 assay
ROS-Glo™ H2O2 Assay is a homogeneous, fast and sensitive bioluminescent assay that measures the level of hydrogen peroxide (H2O2), a reactive oxygen species (ROS), directly in cell culture or in defined enzyme reactions
A derivatised luciferin substrate is incubated with sample and reacts directly with H2O2 to generate a luciferin precursor
Addition of ROS-Glo™ Detection Solution converts the precursor to luciferin and provides Ultra-Glo™ Recombinant Luciferase to produce light signal that is proportional to the level of H2O2 present in the sample.
45

ROS-Glo™ mechanism & protocol
46

ROS-Glo™ assay data
47
• Hep G2 cells • 96-well plate format • 20µM menadione • 10,000 cells/well • 2 hour incubation with menadione • Add ROS-Glo™ Detection Solution • Luminescence read after 20 minutes

ROS-Glo™ - multiplexing
48
Multiplexing a fluorescent cytotoxicity readout with luminescence ROS-Glo™ to obtain both readings from the same population of cells (Hep G2 plated at 2,000 cells/well in 384-well plate)
After 2 hours compound treatment, ROS-Glo™assays are conducted on media aliquoted into a separate plate followed by addition of CellTiter-Glo viability reagent to original plate. (Hep G2 plated at 2,000 cells/well in 384-well plate)

Questions??


![Cell-Based Assays for Biologics - Total Solution for Bio ... Assays for Biologics ... target-specific cell-based assays that support various stages of bio- ... Histamine [M] Assay](https://img.pdfslide.us/doc/110x75/5b046e557f8b9a2d518d9500/cell-based-assays-for-biologics-total-solution-for-bio-assays-for-biologics.jpg)