Embed Size (px)
Citation preview

New calculations of mental health expectancy from EPReMeD
Carol Jagger
Funded by the EUROPA Public Health Programme 2003-2008

EPReMeD
European Policy Information Research on Mental Disorders (EPREMED) aims to:• qualitatively and quantitatively improve mental
health policy practices and potential in Europe • using recently completed ESEMeD/MHEDEA
survey and other related European studies and through
• analyses• data synthesis including mental health expectancy• effective dissemination to relevant stakeholders• provision of training and mobility

ESEMeD/MHEDEA survey design
• Cross-sectional, stratified, multistage, clustered area, probability sample design
• 21 425 adults aged 18+ from Belgium, France, Germany, Italy, the Netherlands and Spain between Jan 2001 and Aug 2003
• Sample frame generally a register of residents or postal registries (France - a commercial list of telephone numbers)
• Non-institutionalised individuals speaking language of their national survey was delivered
• The Composite International Diagnostic Interview (WMH-CIDI) was administered by home interviews using Computer Assisted Personal Interview (CAPI) technology
• Response rate varied from 78.6% (Spain) to 45.9% (France)

Methods for Mental HE
• Sullivan’s method
• Life tables from the EHEMU Information System for the 6 countries • Belgium, France, Germany, Italy, Netherlands, Spain
• Age and sex specific 12 month prevalence of 4 mental disorders (ICD10)• anxiety disorder • major depression episode • dysthymia• mood disorder
• Data weighted to adjust for sampling probabilities, differences between the age and gender characteristics of the national samples and the census distributions of their general populations, and for differences in population size of the countries involved

Results
• Context• LE at birth in 6 countries
• Cross-national comparison of LE with each of 4 mental disorders• LE with and without anxiety at age 25
• Cross-national comparison of proportion of remaining life with each of 4 mental disorders• Proportion of remaining life at age 25 with anxiety
• Relative burden of disorders at age 25• radar plots of proportion of remaining life at age 25 by
gender

Context: LE at birth for 6 countries 1995-2004
LE at birth
72
74
76
78
80
82
84
1994 1995 1996 1997 1998 1999 2000 2001 2002 2003 2004 2005
Year
Exp
ecte
d y
ears
of
life
Belgium F France F Germany F Italy F Netherlands F Spain F
Belgium M France M Germany M Italy M Netherlands M Spain M
WOMEN
MEN
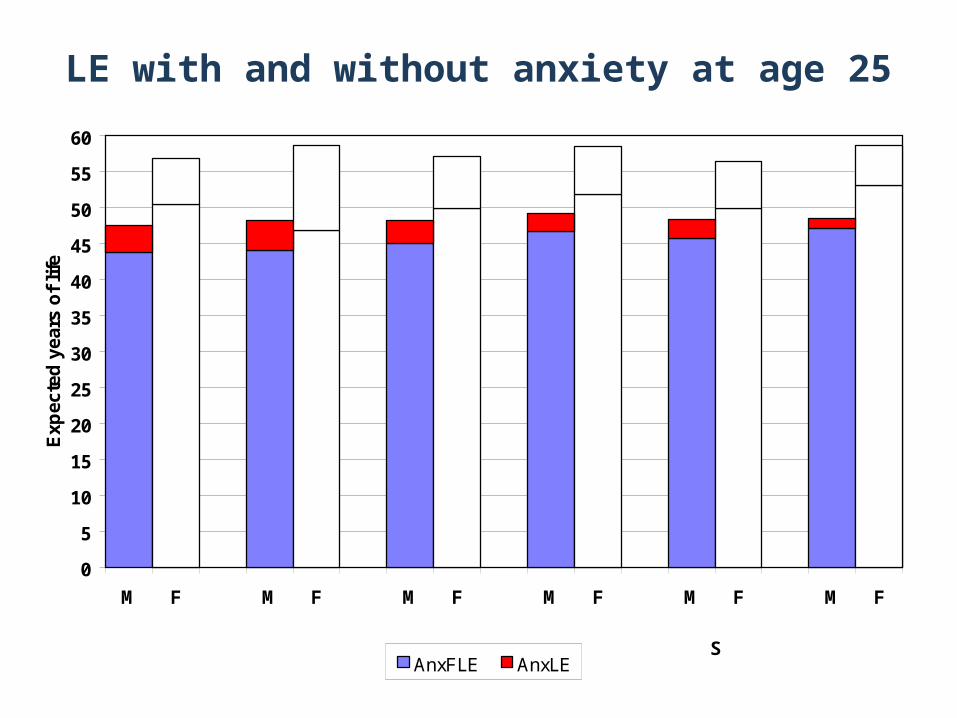
LE with and without anxiety at age 25
0
5
10
15
20
25
30
35
40
45
50
55
60
M F M F M F M F M F M F
Exp
ecte
d y
ears
of
life
AnxFLE AnxLE
BELGIUM FRANCE GERMANY ITALY NETHERLANDS
SPAIN

Proportion of LE with anxiety at age 25
0%
10%
20%
30%
40%
50%
60%
70%
80%
90%
100%
M F M F M F M F M F M F
Pro
po
rtio
n o
f re
mai
nin
g l
ife
AnxFLE AnxLE
BELGIUM FRANCE GERMANY ITALY NETHERLANDS
SPAIN

Relative burden of disorders at age 25Women
0.0
5.0
10.0
15.0
20.0
25.0Anxiety
Major depression
Dysthymia
Mood disorder
Belgium
France
Germany
Italy
Netherlands
Spain
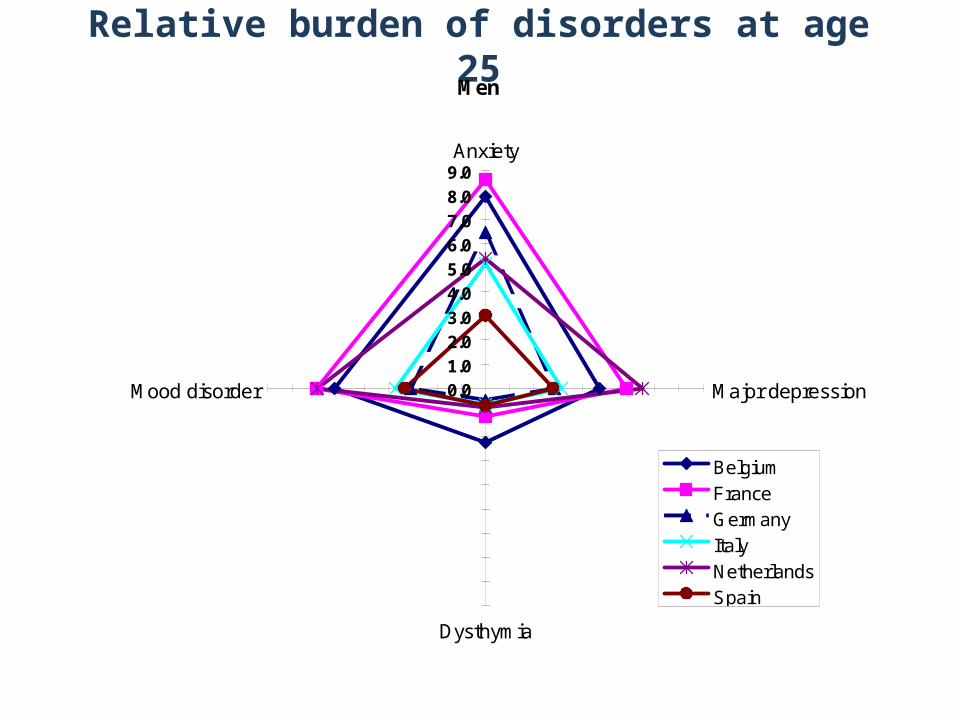
Relative burden of disorders at age 25Men
0.0
1.0
2.03.0
4.0
5.0
6.0
7.0
8.0
9.0Anxiety
Major depression
Dysthymia
Mood disorder
Belgium
France
Germany
Italy
Netherlands
Spain

Dissemination
• Scientific papers
• Focus groups with policy makers
• Country report

Design of country report
Four A4 pages on folded A3• Front
• HE background

What is HE
Mental HE
Calculating HE
Data sources
Index of report
European Policy I nformation Research on Mental Disorders
Country Reports December 2006
MENTAL HEALTH EXPECTANCY I N BELGI UM
What is health expectancy?
Health expectancies were first developed to address whether or not longer life is being accompanied by an increase in the time lived in good health (the compression of morbidity scenario) or in bad health (expansion of morbidity). So health expectancies divide life expectancy into life spent in different states of health, from say good to bad health. In this way they add a dimension of quality to the quantity of life lived.
How is the effect of longer life measured?
The general model of health transitions (WHO, 1984) shows the differences between life spent in different states: total survival, disability-free survival and survival without disabling chronic disease. This leads naturally to life expectancy (the area under the 'mortality' curve), disability-free life expectancy (the area under the 'disability' curve) and life expectancy without chronic disease (the area under the 'morbidity' curve).
The general model of health transition (WHO, 1984): observed mortality and hypothetical morbidity and disability survival curves for females, USA, 1980.
There are in fact as many health expectancies as concepts of health. The commonest health expectancies are based on subjective health and physical functioning. There have been a few mental health expectancies in single countries previously calculated based on
dementia or cognitive impairment
depression.
How do we compare health expectancies?
Health expectancies are independent of the size of populations and of their age structure and so they allow direct comparison of different population sub-groups: e.g.
sexes, socio-professional categories, as well as countries within Europe.
Health expectancies are most often calculated by the Sullivan method (Sullivan, 1971). However to make valid comparisons, the underlying health measure should be truly comparable. The ESEMeD/MHEDEA project (Alonso et al., 2002), funded by the EU, was conducted between 2001 and 2003. This survey was designed to produce comparable data on prevalence, risk factors, burden, and service use of individuals with mental disorders in six European countries (Belgium, France, Germany, Italy, the Netherlands, Spain) representing about 213 million adult and elderly Europeans aged 18 years and over.
What is in this report?
This report is produced by the European Policy Information Research for Mental Disorders (EPReMeD) project as part of its aim to maximise the production of policy relevant information of ESEMeD to the individual countries. In the report we present:
a description of the main purpose of health expectancies
country specific health expectancies based on anxiety, major depression, dysthymia and mood disorder at ages 25, 35 45 and 55
comparison of the proportion of remaining life at ages 25 and 55 spent with each of the disorders in each of the six countries.
References
World Health Organization. The uses of epidemiology in the study of the elderly: Report of a WHO Scientific Group on the Epidemiology of Aging. Geneva: WHO, 1984 (Technical Report Series 706).
Sullivan DF (1971) A single index of mortality and morbidity. HSMHA Health Reports 86:347-354.
Alonso J, Ferrer M, Romera B, et al. The European Study of the Epidemiology of Mental Disorders (ESEMeD/MHEDEA 2000) Project: rationale and methods. International Journal of Methods in Psychiatric Research 2002;11(2): 55-67.
Further details on the calculation and interpretation of health expectancies can be found on www.ehemu.eu and in Robine JM, Jagger C, Mathers CD, Crimmins EM Suzman RM, Eds. Determining health expectancies. Chichester UK: Wiley, 2003.
Format
Four A4 pages on folded A3• Front
• HE background
• Back• Comparison of relative burden (proportion of LE) of all
disordersOR• Bar charts of years spent in good mental health (free of
any disorder) by country

Relative burden age
25
Contact details
Relative burden age
55
Further inf ormation on EPREMED can be f ound on www.epremed.org or contact ????????. Further inf ormation on health expectancies in Europe can be f ound on the European Health Expectancy Monitoring Unit – EHEMU – website: http:/ / www.ehemu.eu
Cross-national comparison of the proportion of life with and without 12 month anxiety disorder, major depression, dysthymia and mood disorder at ages 25 and 55 (Source: ESEMeD/MHEDEA 2001-2)
The radar plots1 below show the proportion of life expectancy at each of the ages 25 and 55 spent with each of the mental disorders by each of the six countries and separately for males and females. The key points are:
Life expectancies in 2001-2 in the six countries ranged from 47.5 years (Belgium) to 49.2 years (Italy) in men and 56.5 years (Netherlands) to 58.7 (France) in women at age 25.
There appeared to be more variation between countries in the proportion of life spent with disorders in men than women.
The proportion of life spent with dysthymia showed the least variation between countries. France had the greatest proportion of life spent with most disorders, particularly anxiety, in women.
Men age 25 Women age 25
0.01.02.03.04.05.06.07.08.0
9.0Anxiety
Major depression
Dysthymia
Mood disorder
BelgiumFranceGermanyItalyNetherlandsSpain
0.0
5.0
10.0
15.0
20.0
25.0Anxiety
Major depression
Dysthymia
Mood disorder
Belgium
France
Germany
Italy
Netherlands
Spain
Men age 55 Women age 55
0.0
1.0
2.0
3.0
4.0
5.0
6.0Anxiety
Major depression
Dysthymia
Mood disorder
BelgiumFranceGermanyItalyNetherlandsSpain
0.0
4.0
8.0
12.0
16.0Anxiety
Major depression
Dysthymia
Mood disorder
BelgiumFranceGermanyItalyNetherlandsSpain
1 Radar plots are a useful way to illustrate the different patterns of mental disorders in the six countries. Plotting the proportion of life
expectancy with each of the disorders takes into account the different life expectancies in the six countries. If the patterns are the same
for all countries then the six quadrilaterals should be the same shape. If the same proportion of remaining life is spent with each of the
disorders then the resulting shape will be a square.
About EPReMeD The European Policy Information Research for Mental Disordersw (EPReMeD) is funded by the European Public Health Programme (2004-2007). It aims to qualitatively and quantitatively improve mental health policy practices and potential in Europe through implementing effective dissemination strategies to different key audiences: the scientific community, the policy-makers, the civil and society, and the mass media. The project includes an active plan of training and mobility together with a formal evaluation of dissemination activities will be performed.
Format
Four A4 pages on folded A3• Front
• HE background
• Back• Comparison of relative burden (proportion of LE) of all
disorders
• Middle• Left – LE with and without each disorder by gender age
25 and definition of disorders• Right – LE with and without each disorder by gender age
55 and references to other country specific mental HE and HE

MHE at age 55 by
gender and
disorder
Key results
Other HE references
Life expectancy with and without 12 month anxiety disorder, major depression, dysthymia and mood disorder at age 55 for Belgium (Source: ESEMeD/MHEDEA 2001-2)
Age 55
19.4
26.3
19.1
27.0
19.5
28.1
18.8
26.6
0.4
2.1
0.7
1.5
0.4
0.4
1.0
1.8
0
5
10
15
20
25
30
Men Women Men Women Men Women Men WomenE
xpec
ted
yea
rs o
f li
fe
LE free of disorder LE with disorder
Anxiety DysthymiaDepression Mood disorder
Published results of health expectancies for Belgium
Bossuyt N, Gadeyne S, Deboosere P, Van Oyen H. Socio-economic inequalities in health expectancy in Belgium. Public Health 2004; 118(1):3-10.
Van Oyen H, Bossuyt N, Deboosere P, Gadeyne S, Tafforeau J. Differences in health expectancy indicators in Belgium by region. Archives of Public Health 2002; 60:341-362.
Key points: In 2002, LE at age 65 in Belgium was 19.7 years for women and 15.9 years for men. Based on the Eurobarometer 58, at age 65, women spent 7.9 years in good health, 9.3 years in fair
health and 2.5 years in bad health (see above for definition of good health). Men of the same age spent 8.3 years in good health compared to 5.7 and 1.8 years in fair or bad
health respectively. Although total years lived by men were less than those for women, the years spent in good health
according to the generic indicator were greater for men than women. These results should be interpreted cautiously given the small sample size (in Belgium 127 women and 88 men aged 65+ years) and the lack of the institutional population. However they serve as an example of future yearly calculations of the “Years of Healthy Life” and other health expectancy indicators which will be possible once the SILC-survey data become routinely available.
Key points: Life expectancy at age 55 in 2001 was 19.8 years for men and 28.4 years for women. The remaining years with mental disorders at age 55 ranged in men from 0.4 years with dysthymia to
1.0 years with mood disorders and in women from 0.4 years with dysthymia to 2.1 years with anxiety.
As at earlier ages, women spend more years and a greater proportion of remaining life than men with anxiety, depression and mood disorders at age 55.
Men at age 55 spend 2.1% of their remaining life at age 55 with anxiety, 3.6% with depression, 1.9% with dysthymia and 5.2% with mood disorders.
Women at age 55 spend 7.44% of their remaining life at age 55 with anxiety, 5.2% with depression, 1.4% with dysthymia and 6.5% with mood disorders.