Embed Size (px)
Citation preview
New aspects of enzymes working in lignocellulosedegradation
Hanžek, Marija
Master's thesis / Diplomski rad
2017
Degree Grantor / Ustanova koja je dodijelila akademski / stručni stupanj: University of Zagreb, Faculty of Food Technology and Biotechnology / Sveučilište u Zagrebu, Prehrambeno-biotehnološki fakultet
Permanent link / Trajna poveznica: https://urn.nsk.hr/urn:nbn:hr:159:913919
Rights / Prava: In copyright
Download date / Datum preuzimanja: 2022-02-09
Repository / Repozitorij:
Repository of the Faculty of Food Technology and Biotechnology
UNIVERSITY OF ZAGREB
FACULTY OF FOOD TECHNOLOGY AND BIOTECHNOLOGY
GRADUATE THESIS
Zagreb, November 2017. Marija Hanžek
861/BPI
NEW ASPECTS OF ENZYMES
WORKING IN LIGNOCELLULOSE
DEGRADATION

Experiments for this Graduate thesis were done at the Institute of Food Technology,
University of Natural Resources and Life Sciences, Vienna. The thesis was made under
guidance of Priv.-Doz. Dr. Roland Ludwig and with the help of Dipl.-Ing. Erik Breslmayr.

I would like to use this opportunity to thank Priv.-Doz. Dr. Roland Ludwig for accepting my
application and giving me the chance to learn from him and be a part of his amazing team. I
would also like to thank Dipl. Ing. Erik Breslmayr for all the help and patience during
experiments to support this thesis (Institute of Food Technology, University of Natural
Resources and Life Sciences, Vienna).
Furthermore, a big thanks to prof.dr.sc. Božidar Šantek for his advice and supervision
(Department of Biochemical Engineering, Faculty of Food Technology and Biotechnology,
Zagreb).
I na kraju, želim se neizmjerno zahvaliti svojoj obitelji te dečku i prijateljima, za potpunu
podršku, bodrenje i razumijevanje.
TEMELJNA DOKUMENTACIJSKA KARTICA
Diplomski rad
Sveučilište u Zagrebu
Prehrambeno-biotehnološki fakultet
Zavod za biokemijsko inženjerstvo
Laboratorij za biokemijsko inženjerstvo, industrijsku mikrobiologiju i tehnologiju slada i piva
Znanstveno područje: Biotehničke znanosti
Znanstveno polje: Biotehnologija
NOVI ASPEKTI ENZIMA KOJI SUDJELUJU U RAZGRADNJI LIGNOCELULOZE
Marija Hanžek 861/BPI
Sažetak: Zbog povećane globalne potražnje za energijom, fosilne izvore potrebno je zamijeniti
obnovljivim izvorima energije (npr. biomasom). Otkriće LPMO (litičke polisaharid monooksigenaze)
bilo je ključno za razumijevanje prirodne razgradnje biomase. Glavna prepreka u istraživanju LPMO
je nedostatak jednostavnog protokola za istraživanje enzimske aktivnosti pomoću spektroskopije.
Sukladno tome, cilj ovog rada bio je razviti i potvrditi protokol za utvrđivanje enzimske aktivnosti te
istodobno okarakterizirati LPMO izoliranu iz plijesni Neurospora crassa. Dokazano je da je reduktant
2,6-DMP (2,6-dimetoksifenol), zajedno sa novootkrivenim kosupstratom H2O2, najbolja kromogenska
komponenta sa visokim molarnim apsorpcijskim koeficijentom (24.8 mM-1cm-1) u vidljivom dijelu
spektra (469 nm). Optimalna aktivnost LPMO je u neutralnom prema bazičnom pH području. Najniža
koncentracija LPMO koja može biti izmjerena i koja se razlikuje od vrijednosti slijepe probe je
~0.0125 μM.
Ključne riječi: LPMO, 2,6-dimetoksifenol, vodikov peroksid, analiza, spektrofotometrija
Rad sadrži: 58 stranica, 27 slika, 9 tablica, 32 literaturna navoda, 2 priloga
Jezik izvornika: engleski
Rad je u tiskanom i elektroničkom obliku (pdf format) pohranjen u: Knjižnica Prehrambeno-
biotehnološkog fakulteta, Kačićeva 23, Zagreb
Mentor na Prehrambeno - biotehnološkom fakultetu: prof. dr. sc. Božidar Šantek
Neposredni voditelj: priv. doz. dr. Roland Ludwig, University of Natural Resources and Life
sciences, Vienna
Pomoć pri izradi: dipl. ing. Erik Breslmayr
Stručno povjerenstvo za ocjenu i obranu:
1. Prof. dr. sc. Blaženka Kos
2. Prof. dr. sc. Božidar Šantek
3. Priv. doz. dr. Roland Ludwig
4. Doc. dr. sc. Andreja Leboš Pavunc (zamjena)
Datum obrane: 08. prosinac 2017.
BASIC DOCUMENTATION CARD
Graduate Thesis
University of Zagreb
Faculty of Food Technology and Biotechnology
Department of Biochemical Engineering
Laboratory for Biochemical Engineering, Industrial Microbiology and Malting and Brewing
Technology
Scientific area: Biotechnical Sciences
Scientific field: Biotechnology
NEW ASPECTS OF ENZYMES WORKING IN LIGNOCELLULOSE DEGRADATION
Marija Hanžek, 861/BPI
Abstract: Fossil fuels have to be replaced by renewable energies (e.g. biomass) due to increasing
global demand for energy. The discovery of LPMOs (lytic polysaccharide monooxygenases) was a
breakthrough in understanding of how nature degrades biomass. The main obstacle in LPMO research
is the lack of an easy to use spectroscopic activity assay. Accordingly, the aim of this thesis was to
develop and validate an activity assay and concomitantly characterize the LPMO from the fungi
Neurospora crassa. 2,6-DMP (2,6-dimethoxyphenol) as reductant in addition with the new co-
substrate H2O2 was proven to be the best chromogenic compound with a high extinction coefficient
(24.8 mM-1cm-1) in the visible range (469 nm). The optimal LPMO activity was observed in the
neutral to basic pH range. The lowest concentration of LPMO, which could be measured and
distinguished from blank reactions, was ~0.0125 μM.
Keywords: LPMO, 2,6-dimethoxyphenol, hydrogen peroxide, assay, spectrophotometry
Thesis contain: 58 pages, 27 figures, 9 tables, 32 references, 2 supplements
Original in: English
Graduate Thesis in printed and electronic (pdf format) version deposited in: Library of the
Faculty of Food Technology and Biotechnology, Kačićeva 23, Zagreb
Mentor at Faculty of Food Technology and Biotechnology: Božidar Šantek, PhD, Full professor
Principal investigator: Roland Ludwig, PhD, Priv.-Doz., University of Natural Resources and Life
Sciences, Vienna
Technical support and assistance: Erik Breslmayr, Dipl. Ing.
Rewievers:
1. Blaženka Kos, PhD, Full professor
2. Božidar Šantek, PhD, Full professor
3. Roland Ludwig, PhD, Priv.- Doz.
4. Andreja Leboš Pavunc, PhD, Assistant professor (substitute)
Thesis defended: 08 December 2017
Contents
1. INTRODUCTION ................................................................................................................................... 1
2. THEORY ................................................................................................................................................ 2
2.1. ENZYME ASSAYS ........................................................................................................................... 2
2.1.1. Dependence on substrates .................................................................................................... 3
2.1.2. Buffers and ions ..................................................................................................................... 3
2.1.2.1. Solvents .......................................................................................................................... 4
2.1.3. Influence of pH ...................................................................................................................... 4
2.1.4. Influence of temperature ...................................................................................................... 4
2.1.5. Limit of Detection (LoD) ........................................................................................................ 5
2.1.5.1. Limit of Blank (LoB) ......................................................................................................... 6
2.1.6. Enzyme kinetics ..................................................................................................................... 6
2.2. LIGNOCELLULOSIC BIOMASS ........................................................................................................ 7
2.2.1. Cellulose ................................................................................................................................ 8
2.2.2. Hemicellulose ........................................................................................................................ 9
2.2.3. Lignin ..................................................................................................................................... 9
2.3. CHITIN ......................................................................................................................................... 10
2.4. ENZYME CLASSIFICATION ........................................................................................................... 11
2.4.1. LPMO classification.............................................................................................................. 11
2.4.2. Cellulases classification ....................................................................................................... 12
2.5. LPMO STRUCTURES .................................................................................................................... 12
2.6. LPMO ACTIVITY ........................................................................................................................... 16
2.6.1. H2O2 as a co-substrate ......................................................................................................... 19
2.6.2. 2,6-dimethoxyphenol (DMP) ............................................................................................... 19
3. MATERIALS & METHODS ................................................................................................................... 22
3.1. ENZYME ...................................................................................................................................... 22
3.2. CHEMICALS ................................................................................................................................. 22
3.3. SUBSTRATE SCREENING .............................................................................................................. 23
3.4. CHARACTERIZATION - VOLUMETRIC AND SPECIFIC ACTIVITY .................................................... 24
3.4.1. Standard LPMO activity assay ............................................................................................. 24
3.4.2. Control experiments ............................................................................................................ 25
3.4.3. CuSO4 and CuCl2 instead of LPMO ....................................................................................... 25
3.4.4. Stability assays ..................................................................................................................... 25
3.4.5. pH profile ............................................................................................................................. 26
3.4.6. Temperature effect ............................................................................................................. 27
3.4.7. Kinetic constants - KM and Vmax values ................................................................................ 28
3.4.8. Limit of Detection ................................................................................................................ 29
4. RESULTS & DISCUSSION ..................................................................................................................... 31
4.1. SUBSTRATE SCREENING .............................................................................................................. 31
4.2. BASIC LPMO ASSAYS ................................................................................................................... 34
4.2.1. Negative assays for LPMO ................................................................................................... 34
4.2.2. Copper compounds instead of LPMO .................................................................................. 35
4.2.3. Stability assays ..................................................................................................................... 36
4.3. pH PROFILE ................................................................................................................................. 37
4.3.1. Anionic buffers .................................................................................................................... 37
4.3.2. Kationic buffers ................................................................................................................... 39
4.3.3. Buffer combinations ............................................................................................................ 40
4.4. TEMPERATURE EFFECT ON LPMO .............................................................................................. 42
4.5. LPMO KINETICS ........................................................................................................................... 44
4.5.1. KM and Vmax values measured for H2O2 ................................................................................ 44
4.5.2. KM and Vmax values measured for DMP................................................................................ 47
4.6. LIMIT OF DETECTION (LoD) ........................................................................................................ 51
5. CONCLUSIONS ................................................................................................................................... 54
6. REFERENCES ...................................................................................................................................... 55
7. APPENDIX .......................................................................................................................................... 59
7.1. KM AND Vmax VALUES MEASURED FOR H2O2 IN SUCCINIC-PHOSPHORIC BUFFER AT pH 7.5 ..... 59
7.2. LIST OF ABBREVIATIONS ............................................................................................................. 61
1
1. INTRODUCTION
Increasing global demand for energy together with global warming and decreasing
reserves makes it obvious that fossil fuels must be replaced by alternative sources such as
renewable energies (Dimarogona et al., 2012). The largest and also the most promising source
for the production of fuels is biomass. In the form of energy, it provides around 10% of the
global energy supply. Bioethanol is the biofuel which is produced in the biggest volume with
an annual production of 84 billion liters (2010) projected to reach 175 billion liters until this
year (2017). Present bioethanol is mostly produced from starch and sugars which are also
potential food sources. A lot of researches have been done in order to develop biofuels based
on biomass such as algal biomass or lignocellulosic materials, which are not used as food.
Biofuels developed from lignocellulosic biomass are second-generation biofuels and can be
produced in two ways, with thermochemical or biochemical processes (Horn et al., 2012). Of
main interest are biochemical processes with lignocellulosic biomass. The conversion of
lignocellulosic biomass to ethanol consists of two processes: cellulose and hemicellulose have
to be degraded into simple sugars (saccharification) and afterwards these sugars are converted
to ethanol by microorganisms (Dimarogona et al., 2013). The most sustainable technology for
saccharification is enzyme technology, but there are limiting factors like the disparity of the
plant cell wall and the recalcitrance of the individual components (cellulose, hemicelluloses,
lignin). Formerly it was thought that only hydrolytic enzymes have a part in the degradation
of these components. This system consists of enzymes acting randomly in the polysaccharide
chain and acting at chain ends (Horn et al., 2012). However, because of the crystallinity of
polysaccharide chains, which are tightly packed and not accessible for hydrolases, this
mechanism was reconsidered when lytic polysaccharide monooxygenases (LMPOs) were
discovered. The discovery of LPMOs was a significant breakthrough in our understanding of
how nature degrades recalcitrant biomass (Hemsworth et al., 2013; Hemsworth et al., 2015).
LPMOs are copper-dependent monooxygenases which require molecular oxygen and an
external electron donor to function properly. These enzymes enhance efficiency of cellulases
by acting on the surface of the insoluble substrate (Dimarogona et al., 2013; Kittl et al., 2012).
Because of very big importance of LPMOs in the future degradation of biomass, the aim of
this thesis was to develop and validate an activity assay (pH and temperature effects, limit of
detection) and concomitantly characterize the LPMO from the fungi Neurospora crassa
(NcLPMO9C, also known as NcU02916).
2
2. THEORY
2.1. ENZYME ASSAYS
Enzyme assays are done for two reasons, to identify an enzyme and prove its presence
or absence in given sample and to determine the amount of an enzyme in the assay. There are
two different approaches for enzyme assays: qualitative, in which positive or negative result is
satisfactory and quantitative approach, in which data should be as accurate as possible.
Enzymes have the advantage that they can be identified by their catalyzed reaction, but the
problem is that even the same assay performed under identical conditions may yield different
results because enzyme activity depends on numerous factors and general understanding of
distinct enzyme is required, which cannot be described in all details in the enzyme assay
protocol. Nature and strength of ions, pH and temperature are the conditions that must be
strictly monitored if assays want to be reliably compared. Because of the great diversity of
enzymes, assay procedures are adjusted to the features of the individual enzyme. When
determining enzyme assay, it has to be considered that enzyme reactions depend not only on
conditions mentioned above, but also on the concentration of all assay components. It is also
important to be aware that compounds not directly involved in the reaction can influence the
results (interactions of hydrophobic substances or detergents with the protein surface, metal
ions, etc.).
Although each enzyme has its own characteristics and properties, there are some
general rules valid for all enzyme assays. The aim of every assay is to monitor the time-
dependent conversion of substrate in the product and procedure must have the ability to
identify it. Since product formation is directly connected with the disappearance of the
substrate, its decreasing can be a measure of the reaction. In case of two or more substrates, it
is enough to measure only one of them. The main problem in measuring is that every method
is more or less susceptible to scattering. It can have different origins and some of them cannot
be avoided (instability of the instruments or measurements in turbid solutions), but some of
them can at least be reduced by careful handling (contaminations, dust, air bubbles, etc.). It is
also very important that only the observed component shows the signal (e.g. absorption), so
the reaction actually starts at zero and any change in signal refers to ongoing reaction.
The simplest way to monitor the reaction is appearance and disappearance of the
coloured compound. Invisible UV range can also be observed with spectrophotometers, and
since practically all the compounds show absorption in this area, this extends the observation
3
range remarkably. Spectrophotometers are easy to handle and have low sensibility against
disturbances so they are used very often. On the other hand, if an enzymatic reaction cannot
be observed this way, some other optical methods (e.g. fluorimetry) are used. Beside optical
methods, electrochemical methods are also in use. The mentioned methods can perform
continuous and discontinuous assays. Continuous assays are very important in detecting
reaction velocity and for evaluating the enzyme activity. They also enable detection of
incorrect influence and the control of the reaction course (progress curve). Catalyzed reactions
initially show a linear correlation, however, the substrate consumption slows down and finally
breaks off the reaction. Therefore it is very important to determine enzyme velocity from the
linear part of the curve. In order to determine velocity for a discontinuous (stopped) assay,
reactions must be stopped after some time and the sample has to be analyzed with a separation
method like HPLC. These methods provide only one single point and velocity is calculated
from the slope of a line connecting that point and the blank (Bisswanger, 2014).
2.1.1. Dependence on substrates
Beside the enzyme, substrates and cofactors are the main components of the enzyme
assay. Their purity, stability and state are crucial and therefore the highest demands have to be
made. Usually, enzymes have a defined substrate according to their physiological function,
however, many enzymes show wide specificity. A synthetic one can replace physiological
substrate. In order to determine efficiency of the substrate, KM and Vmax values are calculated.
The lower the KM, the better is the affinity to the substrate. It is not always the case to take the
most efficient substrate, because availability, stability, solubility and the accessibility to a
detection method have to be considered. The conclusion is that a physiological substrate is not
always used, because to compare results it is more important to use the same substrate in all
assays (Bisswanger, 2014).
2.1.2. Buffers and ions
Assays have to be done in buffers due to their role in adjustment and stabilization of
the desired pH value. They consist of a weak acid and strong basic component. Not only pH
range is important when choosing the buffer, but also its ionic strength, concentration and the
4
nature of its components. The more concentrated buffer system, the higher is the ability to
stabilize the desired pH. However, the best concentration range is from 0.05 to 0.2 M. Ions
affect enzyme activity both by their nature and ionic strength. The activity of an enzyme can
differ if observed in two different buffer systems, even though they have the same pH and
concentration. The capacity range of buffer is narrow, so if a broader pH range is required,
several buffer systems can be combined (Bisswanger, 2014).
2.1.2.1. Solvents
Because of the cellular environment, water is the standard solvent for enzyme assays.
However, for some enzymes, organic solvents have to be used in order to ensure that an
essential component, which is not soluble in water, is also dissolved (Bisswanger, 2014).
2.1.3. Influence of pH
pH in the assay mixture can have big influence in enzyme activity. Most enzymes
follow a bell-shaped curve, showing zero activity in the strong acid region, followed by
increase up to the maximum value and decrease to zero in the strong alkaline region. This is
the consequence of two effects, the native, three-dimensional protein structure of an enzyme
and the state of protonation of the functional groups of amino acids and cofactors involved in
the reactions. The maximum of the bell-shaped curve shows the highest activity of an enzyme
and pH detected at this value is the pH optimum, which is usually chosen as the standard pH
used in the assay of the distinct enzyme. The pH optimum of many enzymes is within the
physiological range, ~7.5 (Bisswanger, 2014).
2.1.4. Influence of temperature
The curve showing correlation between temperature and enzyme activity is also bell-
shaped as in previous case, increasing with rising temperature, reaching the maximum and
decreasing afterwards. The maximum is also referred to temperature optimum, however, that
temperature does not necessarily exist for all enzymes. The velocity of any chemical reaction
5
increases with the temperature, ~2-3 times every 10°C. On the other hand, 3D structure of
enzymes is thermo-sensitive and high temperature can lead to denaturation, which is
responsible for decrease of the activity. Therefore, for enzymes that have not been
investigated yet, it should be ensured that the assay temperature is within the stability range.
That temperature is determined by plotting activity versus different temperatures. After
Arrhenius plot is made, the lower temperature range should be a straight line, indicating the
area of stable enzyme. Because of denaturation, a straight line should show deviations in
higher temperature range. One of three favoured temperatures is usually chosen, 25, 30 or
37°C (Bisswanger, 2014).
2.1.5. Limit of Detection (LoD)
One of the very important conditions is that substrate and product differ in observed
characteristics. The product may be very well detected with the chosen method, but if the
substrate shows a similar signal, no turnover can be observed. Often both substrate and
product show a small difference in signal which is hard to quantify because the small signal
becomes lost within the noise. As a rule, intensity of the reaction signal must be one or two
factors higher than the noise. This is the reason why the limit of detection is determined
(Bisswanger, 2014).
If an analyte (enzyme) is present, the produced signal should be high enough to
reliably be distinguished from the analytical noise (signal produced in the absence of analyte).
LoD is the lowest analyte concentration that can be reliably emphasized from the LoB. LoD is
determined by using both the measured LoB and samples known to contain a low
concentration of analyte. LoD = LoB + 1.645(SDlow concentration sample). Assuming a Gaussian
distribution of the low concentration samples, 95% of values will go beyond the previously
defined LoB, and only 5% of low concentration samples will go below the LoB and
incorrectly appear to contain no analyte. A typical approach to estimate LoD consists of
measuring replicates, usually ~20, of a blank sample, determining the mean value and
standard deviation (SD), and calculating LoD as the mean +2x SD. The mean +3, 4 or even
10x SD can also be calculated, to provide a more conservative LoD. (Armbruster and Pry,
2008).
6
2.1.5.1. Limit of Blank (LoB)
Limit of Blank is defined as the highest apparent analyte concentration expected to be
found when testing the replicates of a sample which contains no analyte. It is important that
although there is no analyte, a blank can produce an analytical signal that might be in
accordance with a low concentration of analyte. Detection of LoB is done by measuring
replicates of a blank sample and then calculating the mean value and the SD (LoB = mean
blank + 1.645(SDblank). Again assuming a Gaussian distribution of the raw analytical signals
from blank samples, the LoB represents 95% of the observed values. The other 5% can be a
response that could be produced by a sample which contains a very low analyte concentration
(Armbruster and Pry, 2008).
2.1.6. Enzyme kinetics
One of the most important approaches in studying the mechanism of enzymatic
reactions is to determine the rate of the reaction and how changing experimental parameters
influences it. A key factor that affects the rate is the substrate concentration [S], which can be
complicated by the fact it changes during in vitro reaction because it is converted into
product. Usually, kinetic experiments are simplified by measuring initial rate (initial velocity,
V0), when concentration of substrate is much higher than the concentration of an enzyme [E].
If only the beginning of the reaction is monitored, [S] can be regarded as a constant and V0
can be explored as a function of [S]. In a case when [E] remains constant and [S] is changing,
the effect on V0 is shown in Figure 1. When [S] is low, the slope is almost linear and by
increasing [S], the velocity is also increasing proportionally to [S]. Finally, the curve reaches
a plateau where velocity is constant. This region is close to maximum velocity, Vmax. The
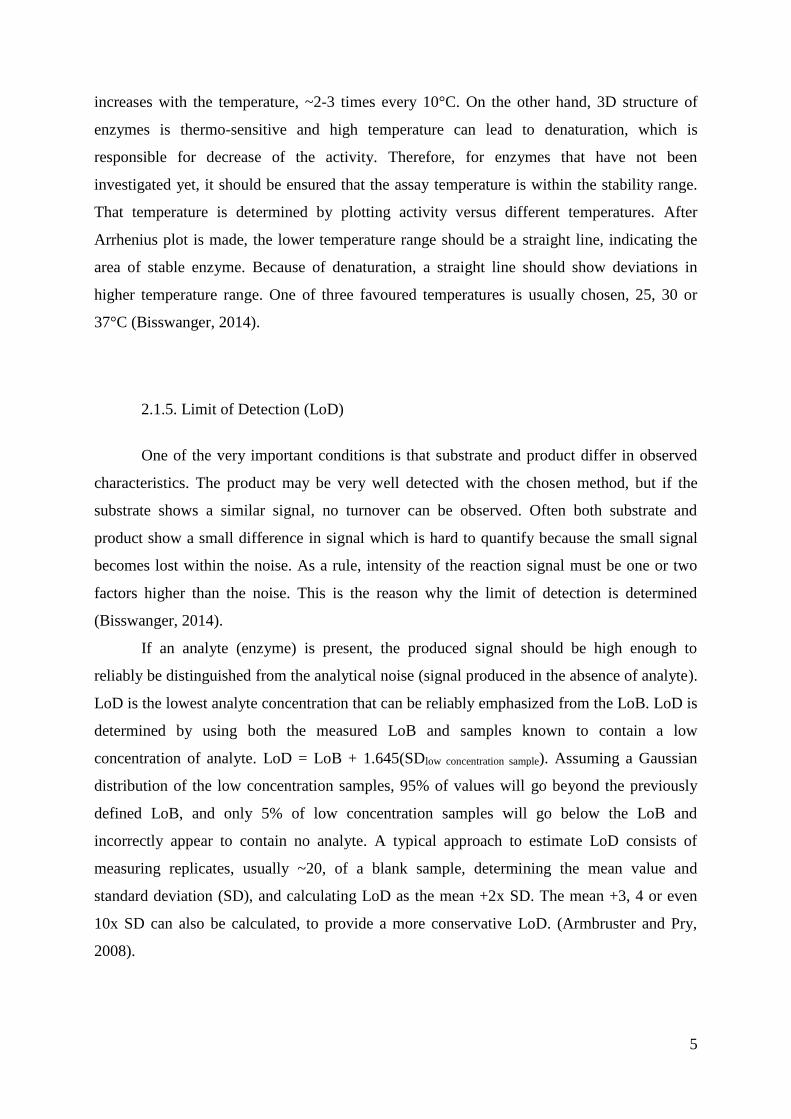
substrate concentration at ½ Vmax is the Michaelis constant; KM (Nelson and Cox, 2012).
7
Figure 1. Michaelis-Menten curve of an enzyme reaction showing the relation between
substrate concentration [S] and initial velocity (V0) (Nelson and Cox, 2012).
The curve in Figure 1 has the same general shape as the rectangular hyperbola for
most enzymes. It can be expressed algebraically by the Michaelis-Menten equation:
V0=Vmax * [S]
KM + [S] [1]
The KM is often used as an indicator of the affinity of an enzyme for its substrate
(Nelson and Cox, 2012).
2.2. LIGNOCELLULOSIC BIOMASS
Lignocellulosic biomass is a renewable resource which can substitute fossil resources
for the production of biofuels (Isaksen et al., 2014). There are three different types of
lignocellulosic biomass: graminaceous plants (grasses), gymnosperms (softwoods) and
angiosperms (hardwoods) (Horn et al., 2012). Nonedible plant material is composed mostly of
two polysaccharides: cellulose and hemicellulose. Third major component is lignin, very
important phenolic polymer that ensures structural strength to the plant (Sluiter et al., 2010).
Apart from latter, there are also minor components such as proteins, soluble sugars, minerals,
8
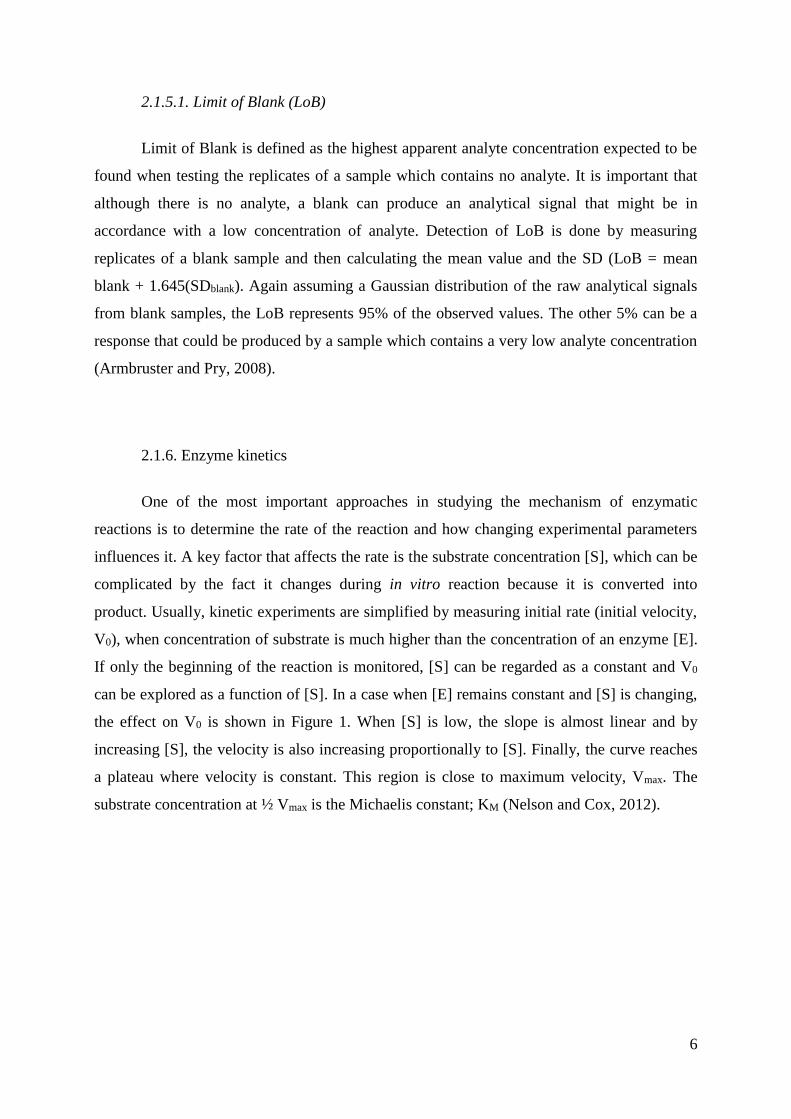
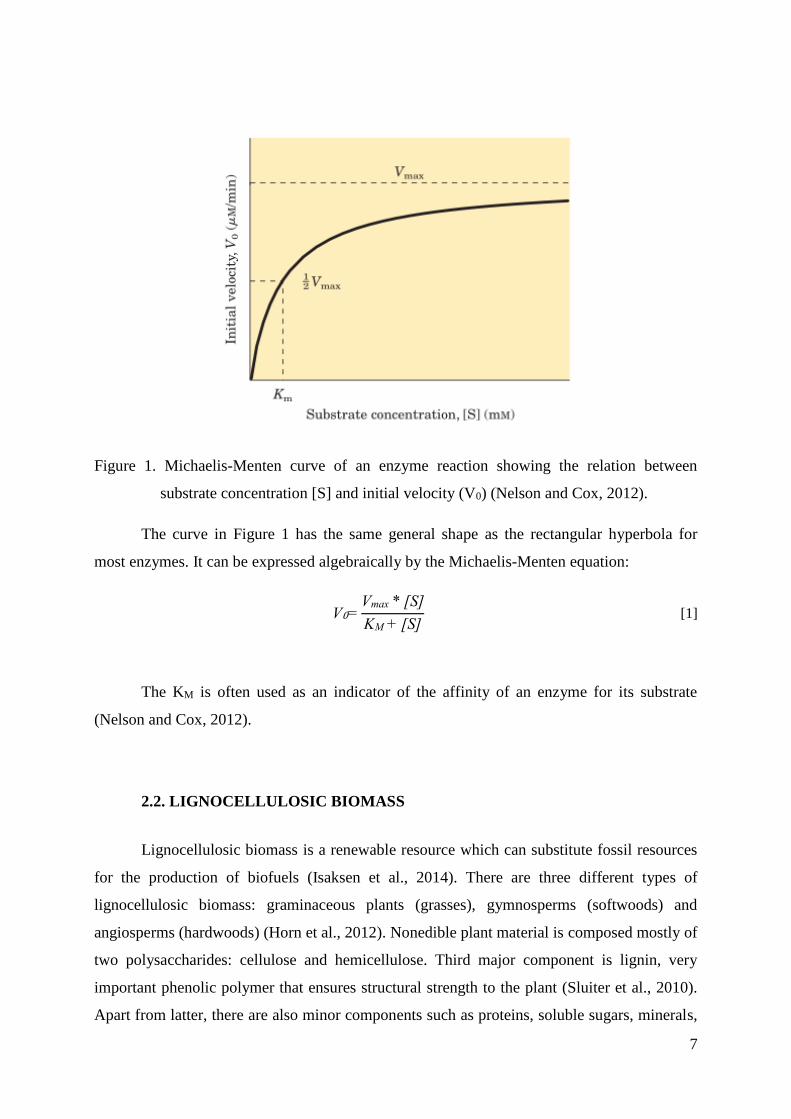
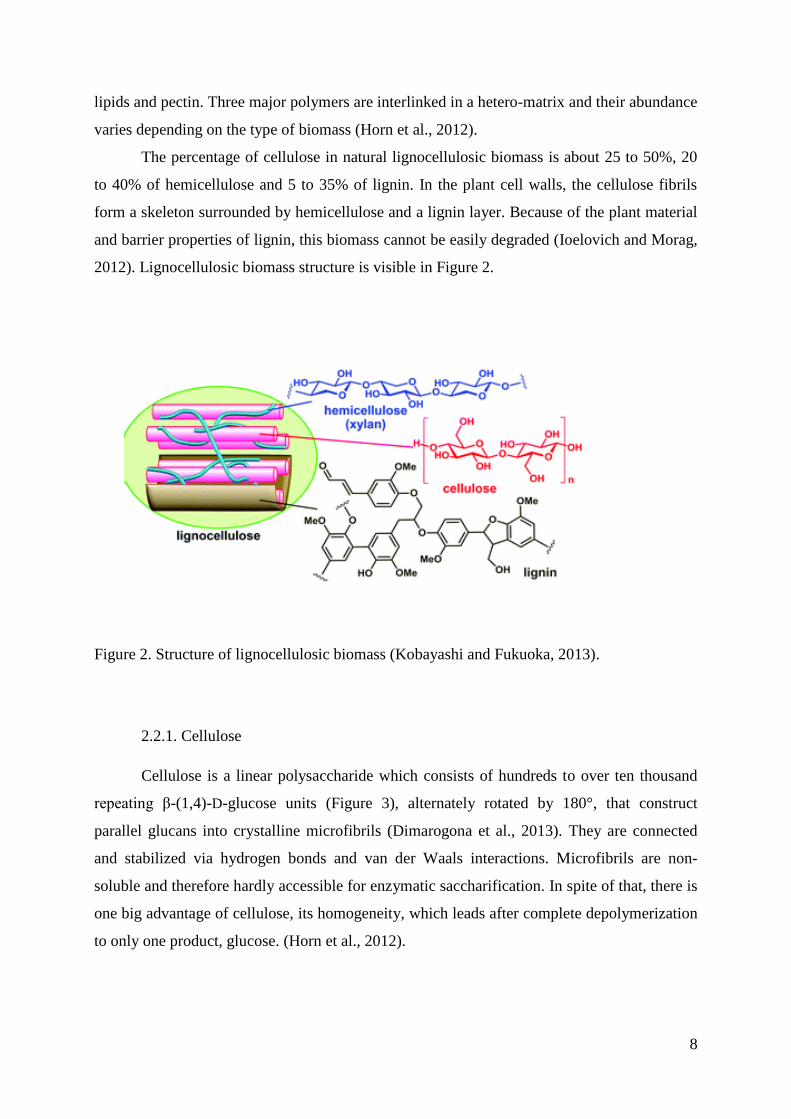
lipids and pectin. Three major polymers are interlinked in a hetero-matrix and their abundance
varies depending on the type of biomass (Horn et al., 2012).
The percentage of cellulose in natural lignocellulosic biomass is about 25 to 50%, 20
to 40% of hemicellulose and 5 to 35% of lignin. In the plant cell walls, the cellulose fibrils
form a skeleton surrounded by hemicellulose and a lignin layer. Because of the plant material
and barrier properties of lignin, this biomass cannot be easily degraded (Ioelovich and Morag,
2012). Lignocellulosic biomass structure is visible in Figure 2.
Figure 2. Structure of lignocellulosic biomass (Kobayashi and Fukuoka, 2013).
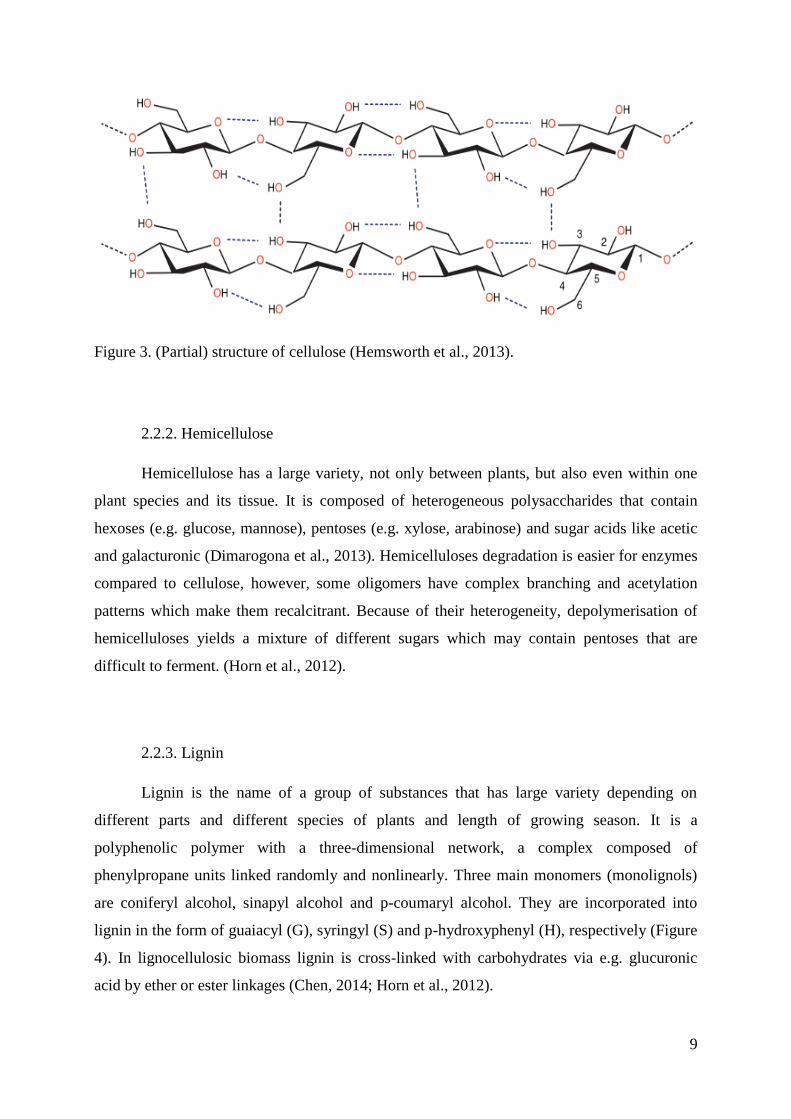
2.2.1. Cellulose
Cellulose is a linear polysaccharide which consists of hundreds to over ten thousand
repeating β-(1,4)-D-glucose units (Figure 3), alternately rotated by 180°, that construct
parallel glucans into crystalline microfibrils (Dimarogona et al., 2013). They are connected
and stabilized via hydrogen bonds and van der Waals interactions. Microfibrils are non-
soluble and therefore hardly accessible for enzymatic saccharification. In spite of that, there is
one big advantage of cellulose, its homogeneity, which leads after complete depolymerization
to only one product, glucose. (Horn et al., 2012).
9
Figure 3. (Partial) structure of cellulose (Hemsworth et al., 2013).
2.2.2. Hemicellulose
Hemicellulose has a large variety, not only between plants, but also even within one
plant species and its tissue. It is composed of heterogeneous polysaccharides that contain
hexoses (e.g. glucose, mannose), pentoses (e.g. xylose, arabinose) and sugar acids like acetic
and galacturonic (Dimarogona et al., 2013). Hemicelluloses degradation is easier for enzymes
compared to cellulose, however, some oligomers have complex branching and acetylation
patterns which make them recalcitrant. Because of their heterogeneity, depolymerisation of
hemicelluloses yields a mixture of different sugars which may contain pentoses that are
difficult to ferment. (Horn et al., 2012).
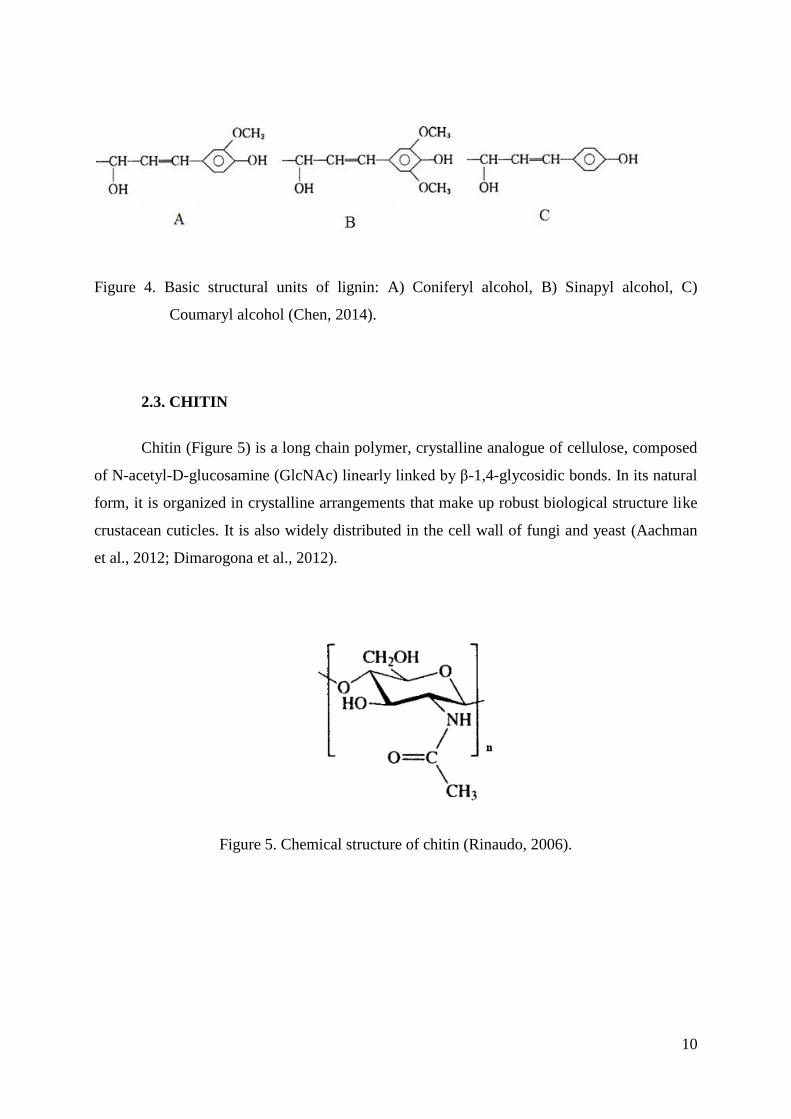
2.2.3. Lignin
Lignin is the name of a group of substances that has large variety depending on
different parts and different species of plants and length of growing season. It is a
polyphenolic polymer with a three-dimensional network, a complex composed of
phenylpropane units linked randomly and nonlinearly. Three main monomers (monolignols)
are coniferyl alcohol, sinapyl alcohol and p-coumaryl alcohol. They are incorporated into
lignin in the form of guaiacyl (G), syringyl (S) and p-hydroxyphenyl (H), respectively (Figure
4). In lignocellulosic biomass lignin is cross-linked with carbohydrates via e.g. glucuronic
acid by ether or ester linkages (Chen, 2014; Horn et al., 2012).
10
Figure 4. Basic structural units of lignin: A) Coniferyl alcohol, B) Sinapyl alcohol, C)
Coumaryl alcohol (Chen, 2014).
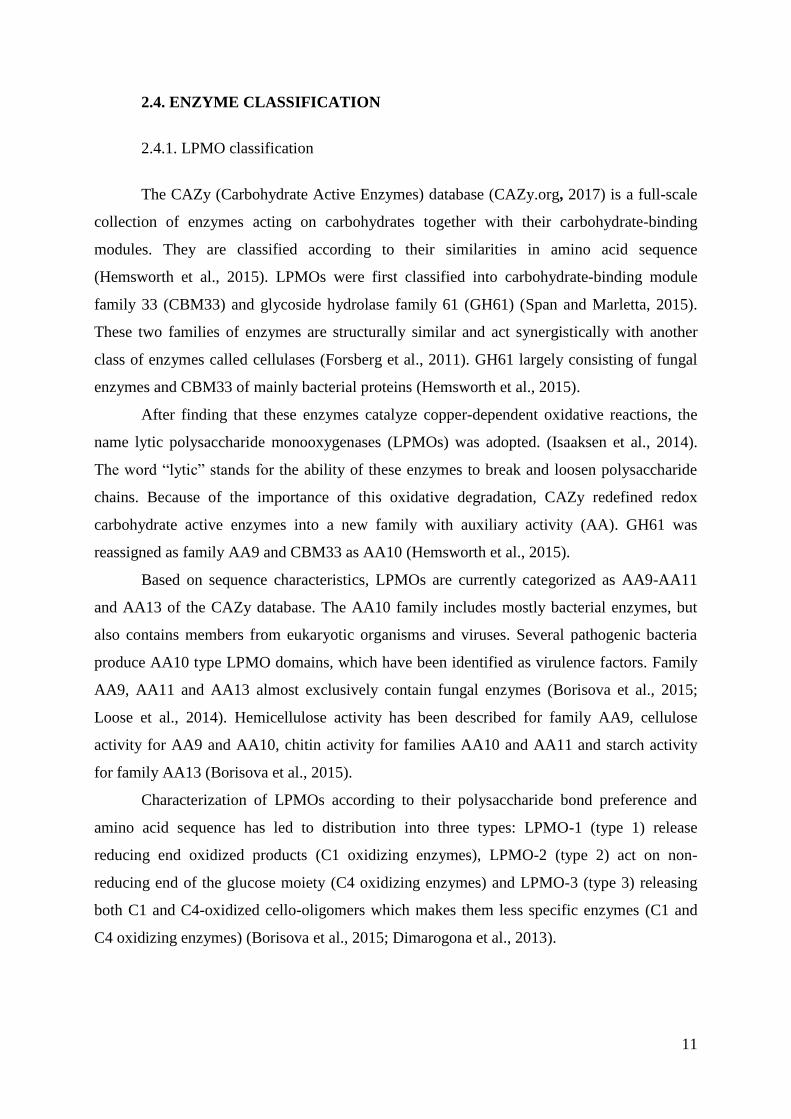
2.3. CHITIN
Chitin (Figure 5) is a long chain polymer, crystalline analogue of cellulose, composed
of N-acetyl-D-glucosamine (GlcNAc) linearly linked by β-1,4-glycosidic bonds. In its natural
form, it is organized in crystalline arrangements that make up robust biological structure like
crustacean cuticles. It is also widely distributed in the cell wall of fungi and yeast (Aachman
et al., 2012; Dimarogona et al., 2012).
Figure 5. Chemical structure of chitin (Rinaudo, 2006).
11
2.4. ENZYME CLASSIFICATION
2.4.1. LPMO classification
The CAZy (Carbohydrate Active Enzymes) database (CAZy.org, 2017) is a full-scale
collection of enzymes acting on carbohydrates together with their carbohydrate-binding
modules. They are classified according to their similarities in amino acid sequence
(Hemsworth et al., 2015). LPMOs were first classified into carbohydrate-binding module
family 33 (CBM33) and glycoside hydrolase family 61 (GH61) (Span and Marletta, 2015).
These two families of enzymes are structurally similar and act synergistically with another
class of enzymes called cellulases (Forsberg et al., 2011). GH61 largely consisting of fungal
enzymes and CBM33 of mainly bacterial proteins (Hemsworth et al., 2015).
After finding that these enzymes catalyze copper-dependent oxidative reactions, the
name lytic polysaccharide monooxygenases (LPMOs) was adopted. (Isaaksen et al., 2014).
The word “lytic” stands for the ability of these enzymes to break and loosen polysaccharide
chains. Because of the importance of this oxidative degradation, CAZy redefined redox
carbohydrate active enzymes into a new family with auxiliary activity (AA). GH61 was
reassigned as family AA9 and CBM33 as AA10 (Hemsworth et al., 2015).
Based on sequence characteristics, LPMOs are currently categorized as AA9-AA11
and AA13 of the CAZy database. The AA10 family includes mostly bacterial enzymes, but
also contains members from eukaryotic organisms and viruses. Several pathogenic bacteria
produce AA10 type LPMO domains, which have been identified as virulence factors. Family
AA9, AA11 and AA13 almost exclusively contain fungal enzymes (Borisova et al., 2015;
Loose et al., 2014). Hemicellulose activity has been described for family AA9, cellulose
activity for AA9 and AA10, chitin activity for families AA10 and AA11 and starch activity
for family AA13 (Borisova et al., 2015).
Characterization of LPMOs according to their polysaccharide bond preference and
amino acid sequence has led to distribution into three types: LPMO-1 (type 1) release
reducing end oxidized products (C1 oxidizing enzymes), LPMO-2 (type 2) act on non-
reducing end of the glucose moiety (C4 oxidizing enzymes) and LPMO-3 (type 3) releasing
both C1 and C4-oxidized cello-oligomers which makes them less specific enzymes (C1 and
C4 oxidizing enzymes) (Borisova et al., 2015; Dimarogona et al., 2013).
12
2.4.2. Cellulases classification
Glycoside hydrolases are a group of enzymes that hydrolyse the glycosidic bond
between two or more carbohydrates or between non-carbohydrate and carbohydrate part of
the molecule. The nomenclature of enzymes in this group is based on their substrate
specificity and molecular mechanism. Cellulases (endo-β-1,4-glucanases) belong to GH
Family 5 and GH Family 8. They are responsible for endohydrolisis of β-(1,4)-D-glycosidic
bonds in cellulose, lichenin and cereal β-D-glucans (CAZy.org, 2017).
2.5. LPMO STRUCTURES
The first LPMO structures were resolved in 2008 using techniques like X-ray
crystallography and NMR. Currently, there are 30 tertiary structures of LPMOs reported in
the protein data bank (PDB, 2017); 12 structures are from the fungal AA9 family, 16
structures from the bacterial AA10 family, and 1 structure in each AA11 and AA13 family
(CAZy.org, 2017) (Figure 6).
13
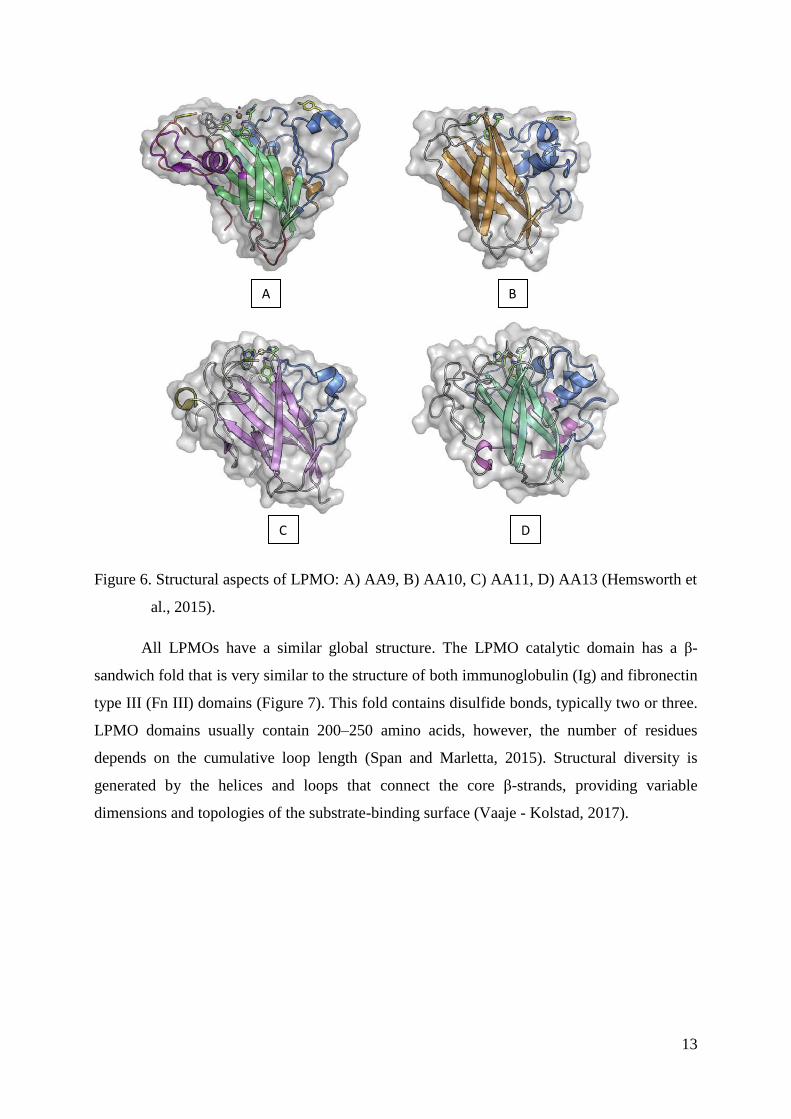
Figure 6. Structural aspects of LPMO: A) AA9, B) AA10, C) AA11, D) AA13 (Hemsworth et
al., 2015).
All LPMOs have a similar global structure. The LPMO catalytic domain has a β-
sandwich fold that is very similar to the structure of both immunoglobulin (Ig) and fibronectin
type III (Fn III) domains (Figure 7). This fold contains disulfide bonds, typically two or three.
LPMO domains usually contain 200–250 amino acids, however, the number of residues
depends on the cumulative loop length (Span and Marletta, 2015). Structural diversity is
generated by the helices and loops that connect the core β-strands, providing variable
dimensions and topologies of the substrate-binding surface (Vaaje - Kolstad, 2017).
D C
B A
14
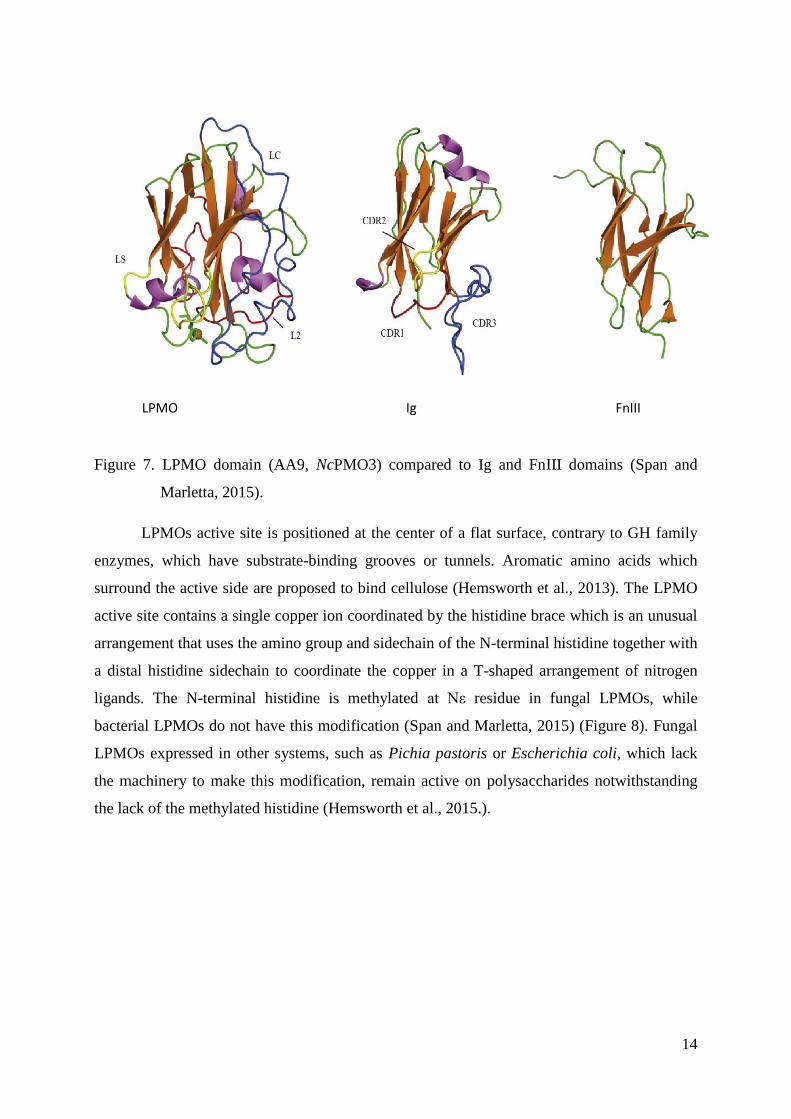
Figure 7. LPMO domain (AA9, NcPMO3) compared to Ig and FnIII domains (Span and
Marletta, 2015).
LPMOs active site is positioned at the center of a flat surface, contrary to GH family
enzymes, which have substrate-binding grooves or tunnels. Aromatic amino acids which
surround the active side are proposed to bind cellulose (Hemsworth et al., 2013). The LPMO
active site contains a single copper ion coordinated by the histidine brace which is an unusual
arrangement that uses the amino group and sidechain of the N-terminal histidine together with
a distal histidine sidechain to coordinate the copper in a T-shaped arrangement of nitrogen
ligands. The N-terminal histidine is methylated at Nε residue in fungal LPMOs, while
bacterial LPMOs do not have this modification (Span and Marletta, 2015) (Figure 8). Fungal
LPMOs expressed in other systems, such as Pichia pastoris or Escherichia coli, which lack
the machinery to make this modification, remain active on polysaccharides notwithstanding
the lack of the methylated histidine (Hemsworth et al., 2015.).
LPMO Ig FnIII
15
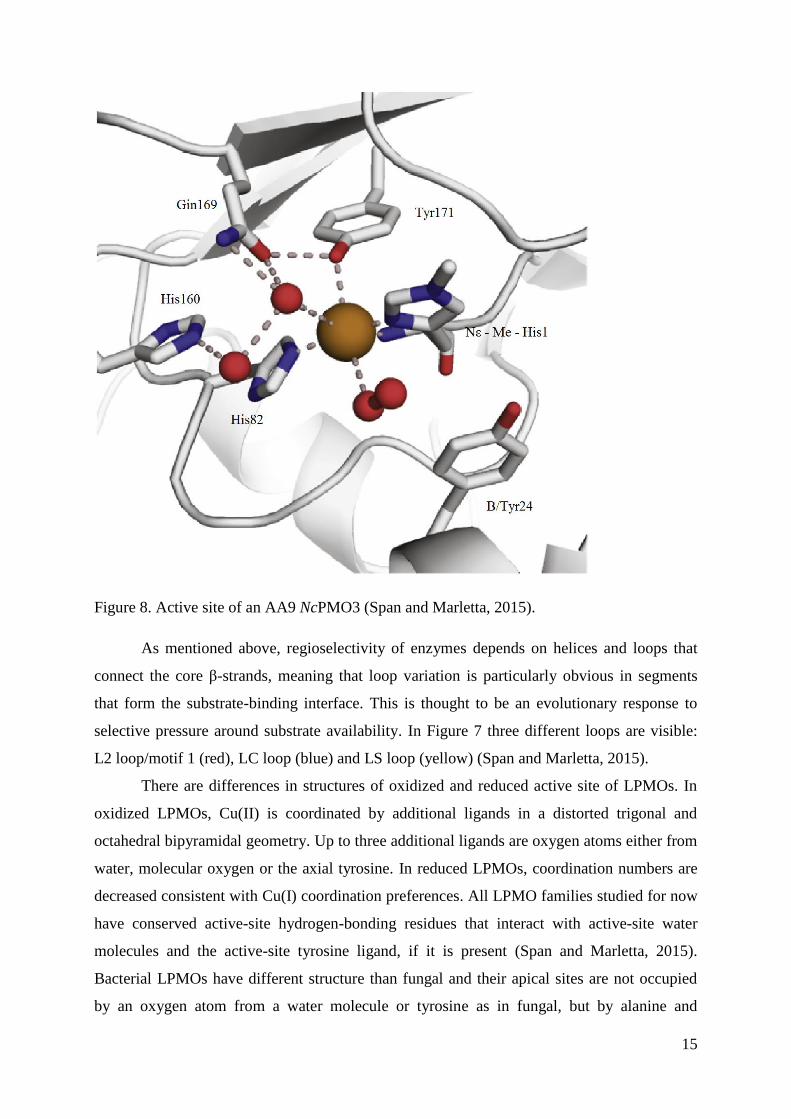
Figure 8. Active site of an AA9 NcPMO3 (Span and Marletta, 2015).
As mentioned above, regioselectivity of enzymes depends on helices and loops that
connect the core β-strands, meaning that loop variation is particularly obvious in segments
that form the substrate-binding interface. This is thought to be an evolutionary response to
selective pressure around substrate availability. In Figure 7 three different loops are visible:
L2 loop/motif 1 (red), LC loop (blue) and LS loop (yellow) (Span and Marletta, 2015).
There are differences in structures of oxidized and reduced active site of LPMOs. In
oxidized LPMOs, Cu(II) is coordinated by additional ligands in a distorted trigonal and
octahedral bipyramidal geometry. Up to three additional ligands are oxygen atoms either from
water, molecular oxygen or the axial tyrosine. In reduced LPMOs, coordination numbers are
decreased consistent with Cu(I) coordination preferences. All LPMO families studied for now
have conserved active-site hydrogen-bonding residues that interact with active-site water
molecules and the active-site tyrosine ligand, if it is present (Span and Marletta, 2015).
Bacterial LPMOs have different structure than fungal and their apical sites are not occupied
by an oxygen atom from a water molecule or tyrosine as in fungal, but by alanine and
16
phenylalanine which are limiting the copper ion coordination to equatorial sites only
(Dimarogona et al., 2013). Few functions are suggested for these residues such as hydrogen-
bonding to a substrate bound in the available equatorial position, modification of the
electronic environment of the copper center and stabilization of the second histidine ligand
(Span and Marletta, 2015).
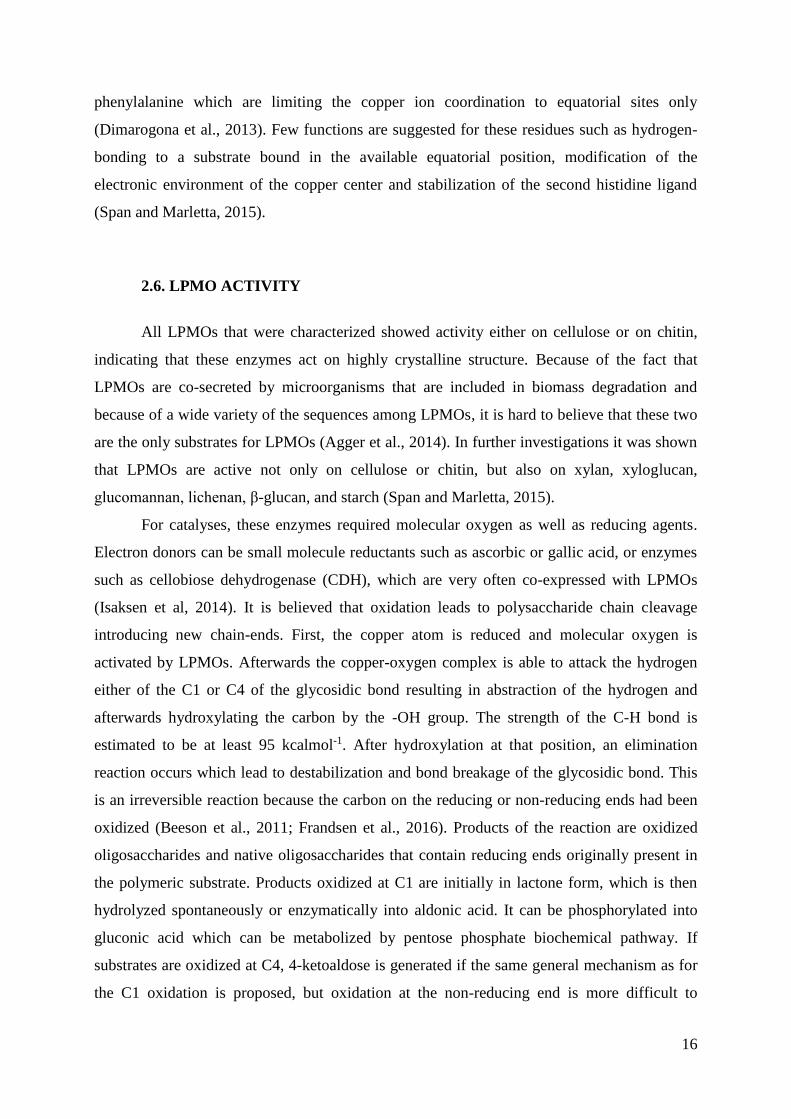
2.6. LPMO ACTIVITY
All LPMOs that were characterized showed activity either on cellulose or on chitin,
indicating that these enzymes act on highly crystalline structure. Because of the fact that
LPMOs are co-secreted by microorganisms that are included in biomass degradation and
because of a wide variety of the sequences among LPMOs, it is hard to believe that these two
are the only substrates for LPMOs (Agger et al., 2014). In further investigations it was shown
that LPMOs are active not only on cellulose or chitin, but also on xylan, xyloglucan,
glucomannan, lichenan, β-glucan, and starch (Span and Marletta, 2015).
For catalyses, these enzymes required molecular oxygen as well as reducing agents.
Electron donors can be small molecule reductants such as ascorbic or gallic acid, or enzymes
such as cellobiose dehydrogenase (CDH), which are very often co-expressed with LPMOs
(Isaksen et al, 2014). It is believed that oxidation leads to polysaccharide chain cleavage
introducing new chain-ends. First, the copper atom is reduced and molecular oxygen is
activated by LPMOs. Afterwards the copper-oxygen complex is able to attack the hydrogen
either of the C1 or C4 of the glycosidic bond resulting in abstraction of the hydrogen and
afterwards hydroxylating the carbon by the -OH group. The strength of the C-H bond is
estimated to be at least 95 kcalmol-1. After hydroxylation at that position, an elimination
reaction occurs which lead to destabilization and bond breakage of the glycosidic bond. This
is an irreversible reaction because the carbon on the reducing or non-reducing ends had been
oxidized (Beeson et al., 2011; Frandsen et al., 2016). Products of the reaction are oxidized
oligosaccharides and native oligosaccharides that contain reducing ends originally present in
the polymeric substrate. Products oxidized at C1 are initially in lactone form, which is then
hydrolyzed spontaneously or enzymatically into aldonic acid. It can be phosphorylated into
gluconic acid which can be metabolized by pentose phosphate biochemical pathway. If
substrates are oxidized at C4, 4-ketoaldose is generated if the same general mechanism as for
the C1 oxidation is proposed, but oxidation at the non-reducing end is more difficult to
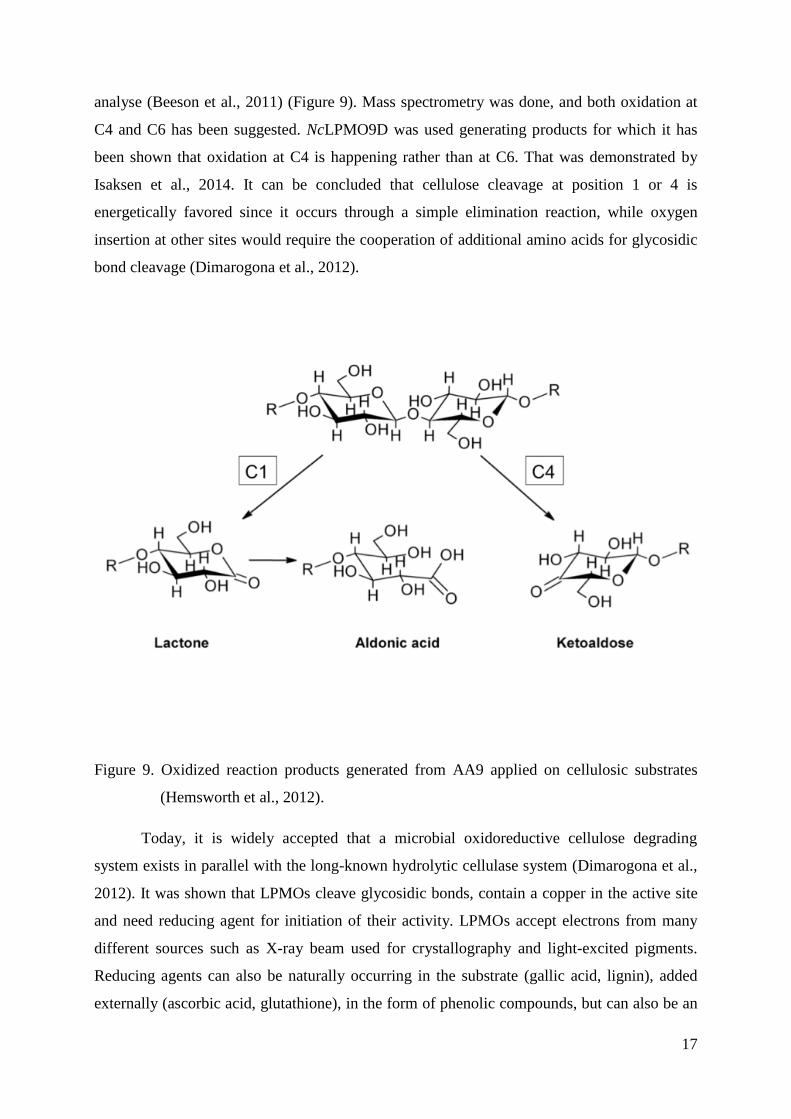
17
analyse (Beeson et al., 2011) (Figure 9). Mass spectrometry was done, and both oxidation at
C4 and C6 has been suggested. NcLPMO9D was used generating products for which it has
been shown that oxidation at C4 is happening rather than at C6. That was demonstrated by
Isaksen et al., 2014. It can be concluded that cellulose cleavage at position 1 or 4 is
energetically favored since it occurs through a simple elimination reaction, while oxygen
insertion at other sites would require the cooperation of additional amino acids for glycosidic
bond cleavage (Dimarogona et al., 2012).
Figure 9. Oxidized reaction products generated from AA9 applied on cellulosic substrates
(Hemsworth et al., 2012).
Today, it is widely accepted that a microbial oxidoreductive cellulose degrading
system exists in parallel with the long-known hydrolytic cellulase system (Dimarogona et al.,
2012). It was shown that LPMOs cleave glycosidic bonds, contain a copper in the active site
and need reducing agent for initiation of their activity. LPMOs accept electrons from many
different sources such as X-ray beam used for crystallography and light-excited pigments.
Reducing agents can also be naturally occurring in the substrate (gallic acid, lignin), added
externally (ascorbic acid, glutathione), in the form of phenolic compounds, but can also be an
18
enzyme, such as cellobiose dehydrogenase (CDH). CDHs are often encoded by wood
degrading fungi and act as an electron donor to AA9. It is even discovered that CDH is also
able to activate Neurospora crassa AA13 to attack starch (Hemsworth et al., 2015). It consists
of two domains (N-terminal heme domain which carries a cytochrome b type heme and C-
terminal flavin domain which contains FAD, connected via flexible linker) and catalyzes the
two-electron oxidation of cellobiose (the product of cellobiohydrolases) to cellobionolactone,
while also generating hydrogen peroxide. Oxidation of cellobiose occurs in the flavin domain
with subsequent electron transfer to the heme domain (Johansen et al., 2016; Philips et al.,
2011). The CDH/LPMO system was shown to improve the degradation of cellulose in
combination with cellulases (Kittl et al., 2012). During CDH reaction, the Cu(II) center must
be reduced into Cu(I) before activating O2. It is suggested that FADH2 is re-oxidised to FAD,
electrons are shuttled from CDH via its cytochrome domain to AA9, presumably reducing
Cu(II) to Cu(I), that makes LPMO active. In the proposed mechanism, CDH is interacting
with a patch on the side of AA9 and electrons are passed via its cytochrome domain along
wires of hydrophilic side chain within the core of the LPMO leading to the copper active side
(Hemsworth et al., 2015). After that, oxygen activation, hydrogen-atom abstraction (HAA)
and oxygen insertion, on the substrate carbon occurs. There are two possible scenarios, in one
HAA and oxygen insertion are happening before the second reduction and in this case direct
ET (electron transfer) requires binding of LPMO and substrate and dissociation in between
the two reductions. Second scenario is that second reduction happens before HAA, however,
in this case direct ET would still require the LPMO traveling back and forth between substrate
and redox partner CDH. For bacterial LPMOs ET pathways have not been clear yet because
bacteria do not contain CDH and therefore completely depend on other electron donors, like
reductants. All in all, the LPMO domain looks perfect for LPMO catalysis; it contains the
core with conserved ET-competent residues, the loops for substrate binding. It is presumed
that components closer to the active site help in binding oxygen and directing electrons and
protons to the reactive intermediate (Span and Marletta, 2015). The concerted activity of
LPMOs and CDHs in oxidative cleavage of cellulose should not be overestimated, because
not all organisms have genes encoding for both enzymes in their genomes. (Dimarogona et
al., 2012). In addition to CDH, single-domain flavoenzymes such as glucose dehydrogenase
and aryl-alcohol quinone oxidoreductases can also play an important role of electron donors
for LPMOs (Johansen, 2016).
19
2.6.1. H2O2 as a co-substrate
H2O2 represents a potentially efficient way to supply the protons, electrons and oxygen
that are needed for the ‘monooxygenase’ reaction and is naturally present in ecological niches
where plant biomass decomposition occurs and LPMOs are present (Bissaro et al., 2017). By
using enzyme assays, mass spectrometry and experiments with labeled oxygen atoms, it is
shown that H2O2, and not O2 as previously thought, is the co-substrate of LPMOs. A catalytic
mechanism in which an H2O2-derived oxygen atom, rather than one derived from O2, would
be introduced into the polysaccharide chain is suggested. In that mechanism, first occurs
priming reduction of the Cu(II) to Cu(I) in the catalytic center of the enzyme. H2O2 is then
binding to the Cu(I) and homolytic bond cleavage would produce a hydroxyl radical. It is
thought that this leads to Cu(II)-hydroxide intermediate formation and a substrate radical.
Eventually, the reaction between copper-hydroxyl intermediate and the substrate radical leads
to substrate hydroxylation and regeneration of the Cu(I) center which is then able to perform a
new catalytic cycle (Bissaro et al., 2016). Addition of exogenous H2O2 alone did not lead to
cellulose oxidation, however, had a positive effect on LPMO activity when a reductant was
also added. Furthermore, high concentrations of H2O2 inactivate the enzyme. If H2O2 is added
responsibly, an initial increase in LPMO activity is revealed at lower H2O2 concentrations and
progressively rapid enzyme inactivation with increasing H2O2 concentration. It is also proven
that oxidases can induce LPMO activity if a reductant is available. In this matter, abundant
phenols derived from plants and fungi have recently been implicated in the reductive
activation of LPMOs (Bissaro et al., 2017).
2.6.2. 2,6-dimethoxyphenol (DMP)
Polyphenols are largely present in plant in the form of monomers or polymers
structures. They are limited for use because of their lower solubility and stability. 2,6-
dimethoxyphenol is a monophenolic compound that is used for the measurement of laccase
(EC 1.10.3.2) and peroxidase (EC 1.11.1.7) activity. Laccases are multi-copper-containing
enzymes, which reduce molecular oxygen to water and simultaneously perform one-electron
oxidation of various substrates such as diphenols, methoxy-substituted monophenols, etc.
(Adelakun et al., 2012). Peroxidases are heme proteins with histidine as ligand. The iron in
the resting enzyme is Fe(III). They use two phenolic electron donors to reduce H2O2 into two
20
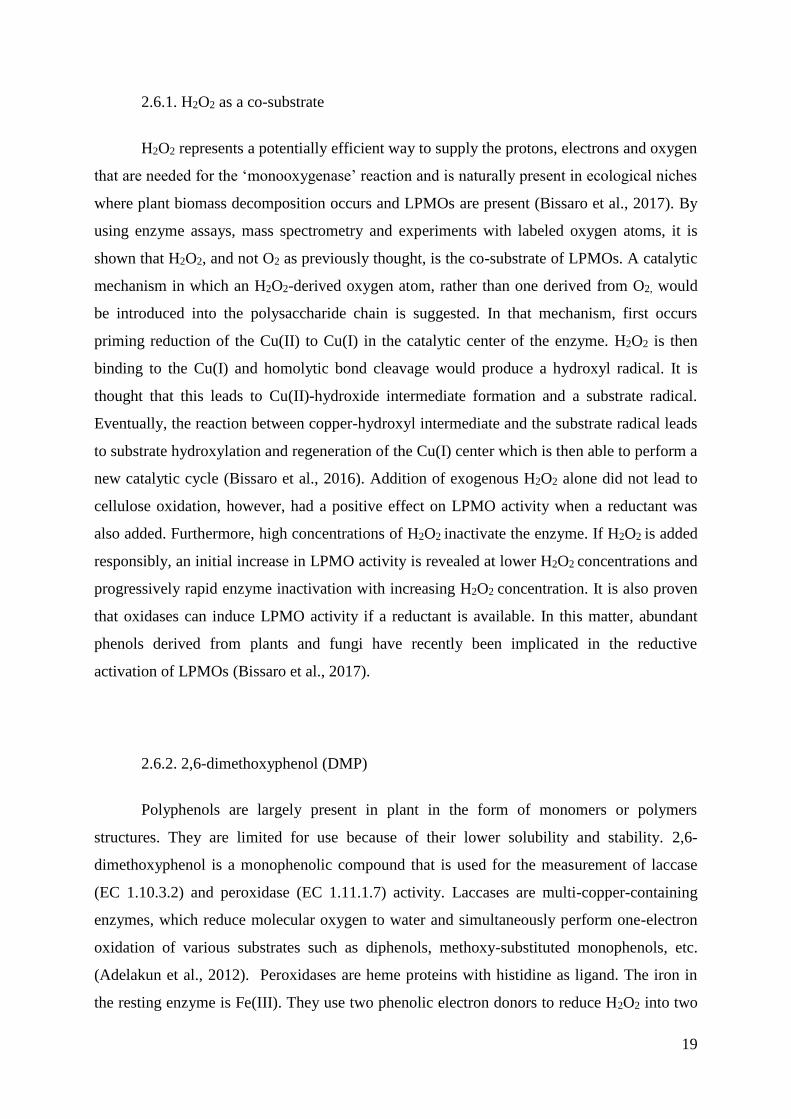
water molecules (CAZy.org, 2017). The mechanism for the oxidation of DMP catalyzed by
laccases and peroxidases was suggested and it is shown in Figure 10. Two DMP molecules
are oxidized at the hydroxyl group, two electrons are transferred to the electron acceptor
(manganese, iron, copper) and further reduction of hydrogen peroxide to two water molecules
occurs. The two DMP phenoxy radicals spontaneously dimerise to hydrocoerulignone, which
is again an electron donor. One hydrocoerulignone is oxidized to one coerulignone under
reducing hydrogen peroxide to water. Coerulignone (oxidized DMP quinone dimer) shows a
strong absorptivity at 469 nm. In the reaction two DMP molecules are oxidized under
reduction of two H2O2 molecules with a stoichiometry of 2:1 for DMP:H2O2. (Wariishi et al.,
1992).
Figure 10. Proposed mechanism for oxidation of 2,6-dimethoxyphenol catalyzed by
manganese peroxidase (Wariishi et al., 1992).
21
Since we know that H2O2 is a co-substrate for LPMO, all phenolic compounds
reacting less with LPMO and not showing activity in a spectrophotometric assay, should be
re-tested if the reactivity in the presence of H2O2 instead of only O2 is increased. The
advantage of chromogenic compounds like DMP, which is already well studied, to measure
the activity of LPMO in such a spectrophotometric assay is big.
In this graduate thesis we show that DMP reacts with LPMO and H2O2 as a co-
substrate and that it is suitable to develop a fast and sensitive spectrophotometric assay to
easily detect activity for characterization of LPMOs.
22
3. MATERIALS & METHODS
3.1. ENZYME
The enzyme that was used in the experiments is lytic polyssacharide monooxygenase
(LPMO - 02916) isolated from fungi Neurospora crassa.
3.2. CHEMICALS
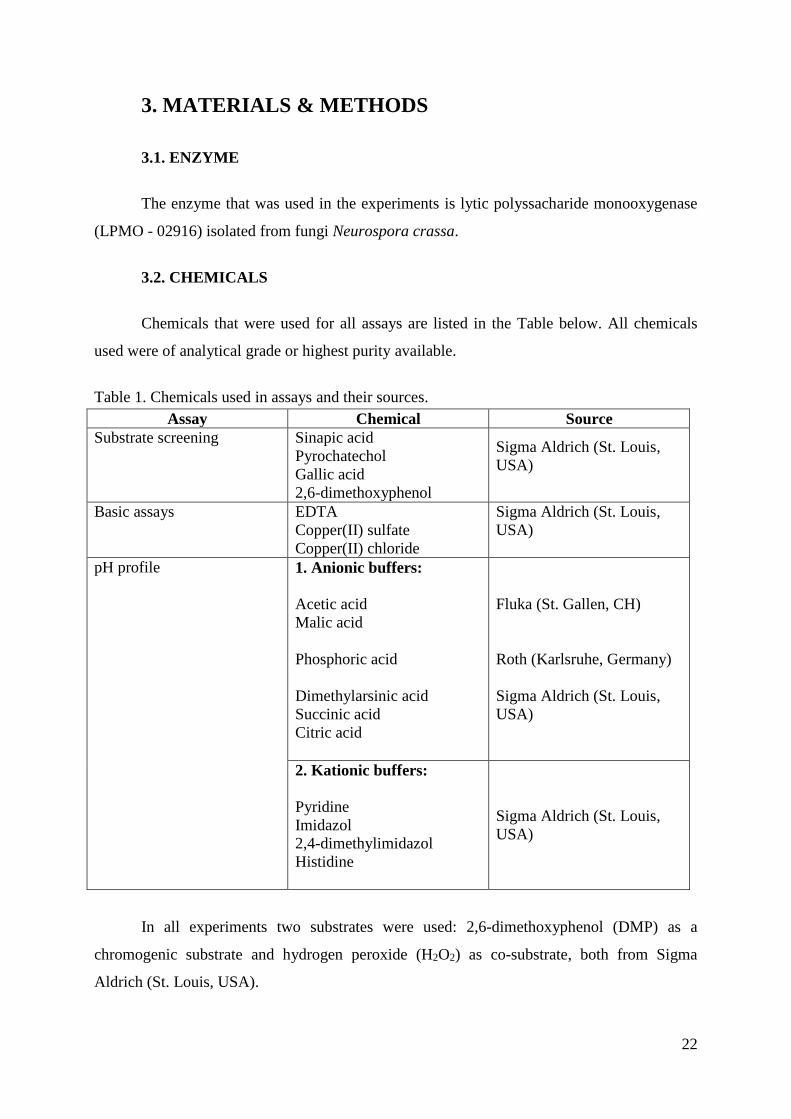
Chemicals that were used for all assays are listed in the Table below. All chemicals
used were of analytical grade or highest purity available.
Table 1. Chemicals used in assays and their sources.
Assay Chemical Source
Substrate screening Sinapic acid
Pyrochatechol
Gallic acid
2,6-dimethoxyphenol
Sigma Aldrich (St. Louis,
USA)
Basic assays EDTA
Copper(II) sulfate
Copper(II) chloride
Sigma Aldrich (St. Louis,
USA)
pH profile 1. Anionic buffers:
Acetic acid
Malic acid
Phosphoric acid
Dimethylarsinic acid
Succinic acid
Citric acid
Fluka (St. Gallen, CH)
Roth (Karlsruhe, Germany)
Sigma Aldrich (St. Louis,
USA)
2. Kationic buffers:
Pyridine
Imidazol
2,4-dimethylimidazol
Histidine
Sigma Aldrich (St. Louis,
USA)
In all experiments two substrates were used: 2,6-dimethoxyphenol (DMP) as a
chromogenic substrate and hydrogen peroxide (H2O2) as co-substrate, both from Sigma
Aldrich (St. Louis, USA).
23
All aqueous solutions were prepared using reverse osmotic water (RO-H2O) or water
purified and deionized (di-H2O, 17 MΩ cm) with a HQ water system (Ultra Clear basic UV,
SG, Siemens, Berlin/Munich, Germany).
3.3. SUBSTRATE SCREENING
In order to determine the most suitable chromogenic substrate for all characterization
assays, the substrates sinapic acid, pyrochatechol, gallic acid and DMP were screened.
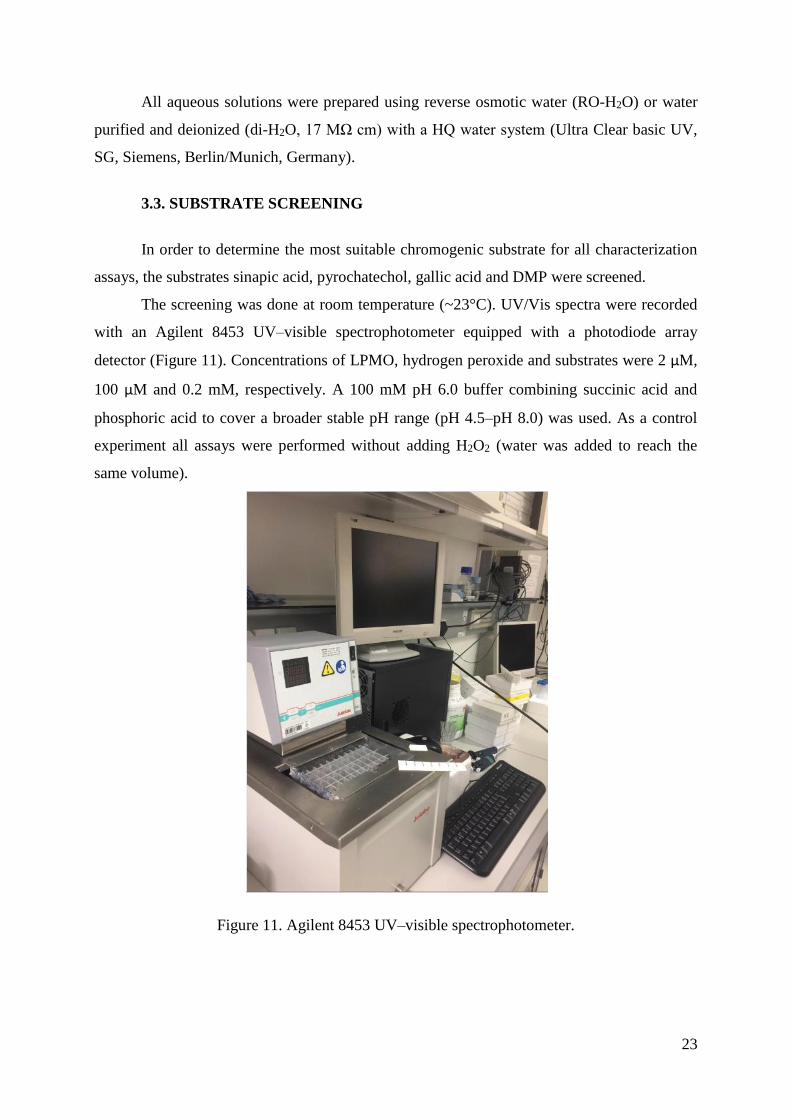
The screening was done at room temperature (~23°C). UV/Vis spectra were recorded
with an Agilent 8453 UV–visible spectrophotometer equipped with a photodiode array
detector (Figure 11). Concentrations of LPMO, hydrogen peroxide and substrates were 2 μM,
100 μM and 0.2 mM, respectively. A 100 mM pH 6.0 buffer combining succinic acid and
phosphoric acid to cover a broader stable pH range (pH 4.5–pH 8.0) was used. As a control
experiment all assays were performed without adding H2O2 (water was added to reach the
same volume).
Figure 11. Agilent 8453 UV–visible spectrophotometer.
24
3.4. CHARACTERIZATION - VOLUMETRIC AND SPECIFIC ACTIVITY
LPMO activity was measured at 30°C by monitoring the oxidation of 1 mM 2,6-
dimethoxyphenol (DMP) in 100 mM succinic-phosphoric buffer at pH 7.5. The absorption
maximum of oxidised DMP which forms coerulignone (the chromogenic endproduct) is at
469 nm and the corresponding extinction coefficient is ε469 = 49.6 mM-1cm-1 (Wariishi et al.,
1992). Cuvettes with a volume of 1 mL and 1 cm path length (d) were used to measure the
kinetic slope over time, to further calculate the volumetric activity in units per milliliter. The
enzyme activity is usually defined as amount of substrate converted to product per time unit.
According to the SI system, concentration of product must be in mol and time in seconds. The
enzyme unit 1 katal is defined as the amount of enzyme converting 1 mol substrate forming 1
mol product in one second. However, besides katal, international unit is more often used
(Bisswanger, 2014). One unit of enzymatic activity is defined as the amount of enzyme to
produce one micromole chromogenic product per minute (1U = 1 μmolmin-1). The enzyme
factor was calculated by dividing the extincion coefficient with a factor of 2 (ε469 = 24.8 mM-1
cm-1), considering coerulignone is a dimer. The calculation was done by multiplying the
kinetic slope with the enzyme factor and the dilution of enzyme.
Enzyme factor was calculated with following formula:
EF [s-1]= total volume [mL] *60
enzyme volume [mL] * d [cm] * ε [mM-1cm-1]=60.5 s-1 for DMP [2]
After the volumetric activity, specific activity was also calculated by dividing
volumetric activity with concentration of the NcLPMO_02916 which is 51.75 mgmL-1.
3.4.1. Standard LPMO activity assay
860 μL succinic-phosphoric buffer, pH 7.5, concentration 116 mM, 20 μL LPMO,
concentration 25 μM, 20 μL H2O2, concentration 5 mM and 100 μL DMP, concentration 10
mM were added in cuvette to get the final concentrations of buffer 100 mM, LPMO 0.5 μM,
H2O2 100μM and DMP 1mM. Everything was mixed and measurement lasted for 300 s.
25
3.4.2. Control experiments
Different assays were performed in the same way as in the standard assay, apart from
adding 100 μL of water instead of the DMP (effect of no substrate), 20 μL of water instead of
H2O2 (effect of no co-substrate) and 20 μL of buffer for enzyme dilution (10 mM succinic-
phosphoric buffer) instead of LPMO (effect of no enzyme).
3.4.3. CuSO4 and CuCl2 instead of LPMO
Different standard assays were performed by exchanging the enzyme (LPMO) either
with copper(II)sulfate (CuSO4) or copper(II)chloride (CuCl2) with tree different
concentrations of copper (0.5 μM, 5μM and 50 μM). To see the effect of the co-substrate, the
standard assay with CuSO4 instead of LPMO was also performed without H2O2.
860 μL succinic-phosphoric buffer, pH 7.5, concentration 116 mM and 100 μL DMP,
concentration 10 mM were added in every assay. Final concentrations in cuvettes were: buffer
100 mM and DMP 1mM. Everything was mixed and measurement lasted for 300 s.
3.4.4. Stability assays
In order to define stability of the LPMO, assays with ethylenediaminetetraacetic acid
(EDTA) and heat inactivated LPMO were done. The absorbance was measured for 300 s at
the Diode array.
For the heat test four solutions were made in eppendorf tubes by adding 1075 μL of
succinic-phosphoric buffer, pH 7.5, concentration 100 mM and 25 μL LPMO, concentration
0.5 μM. Eppendorf tubes were vortexed and then transferred into a heating block at 100°C for
30 minutes, 60 minutes, 2 hours and 4 hours. After the incubation, eppendorf tubes were put
on ice and 880 μL of each enzyme solution were transferred into a cuvette. Reaction was
started by adding 20 μL of H2O2, concentration 50μM and 100 μL of DMP, concentration 1
mM.
There were two different concentrations of EDTA included in the stability test: 1 mM
and 2 mM. EDTA solution was prepared with original stock of EDTA disolved in 10 mM
succinic-phosphoric buffer at pH 6.0. LPMO (final concentration 0.5 µM) was added and
incubated for 30 minutes. 860 μL of succinic-phosphoric buffer at pH 7.5, concentration 116
26
mM (final concentration 100 mM); 20 μL 5 mM H2O2 (final concentration 100μM) and 100
μL 10 mM DMP (final concentration 1 mM) were added in the cuvette which was completed
by adding 20 μL of EDTA and LPMO solution.
3.4.5. pH profile
Two types of pH-profiles were done, with anionic and kationic buffer species. Anionic
buffers were prepared from acetic acid, succinic acid, malic acid, citric acid, dimethylarsinic
acid and phosphoric acid and assays were done in a pH range from 3.5 to 8.5. Kationic buffers
were prepared from pyridine, imidazol, 2,4-dimethylimidazol and histidine in a pH range
from 4.0 to 9.5. All buffers were prepared by diluting mentioned compounds in highly pure
water.
The relationship between pH and the buffer components is described by Henderson-
Hasselbach equation:
pH = pKa - log [HAc]
[Ac-] [3]
pH = - log [H+]; negative logarithm of the proton concentration
pKa = - log Ka; negative logarithm of Ka, the dissociation constant of buffer components
HAc = acid in the non-dissociated form
Ac-= acid in the dissociated form
The pKa value is very important since that value indicates pH at which buffer is half
dissociated and shows the highest buffer capacity. The capacity range of buffer is narrow and
includes two pH units at best (Bisswanger, 2014). For that reason, before deciding which
buffer species should be used, pKa values of kationic and anionic buffer compounds have to
be checked in order to decide which pH range can be covered. When analyzing the pH
dependence of an enzyme, a broader pH range is required, so several buffer systems may be
combined (Bisswanger, 2014). This is the reason of using numerous buffers in the pH profile
assays.
In measuring cuvettes 100 mM buffer, 25 mM DMP and 100 μM H2O2 were mixed to
a total volume of 980 μL. 20 μL LPMO was added in the end to start the reaction. For all
buffers different concentrations of the enzyme were used to reach a reliable activity. The
change in absorbance over time was recorded with a UV/Vis photometer (Lambda 35, Perkin
27
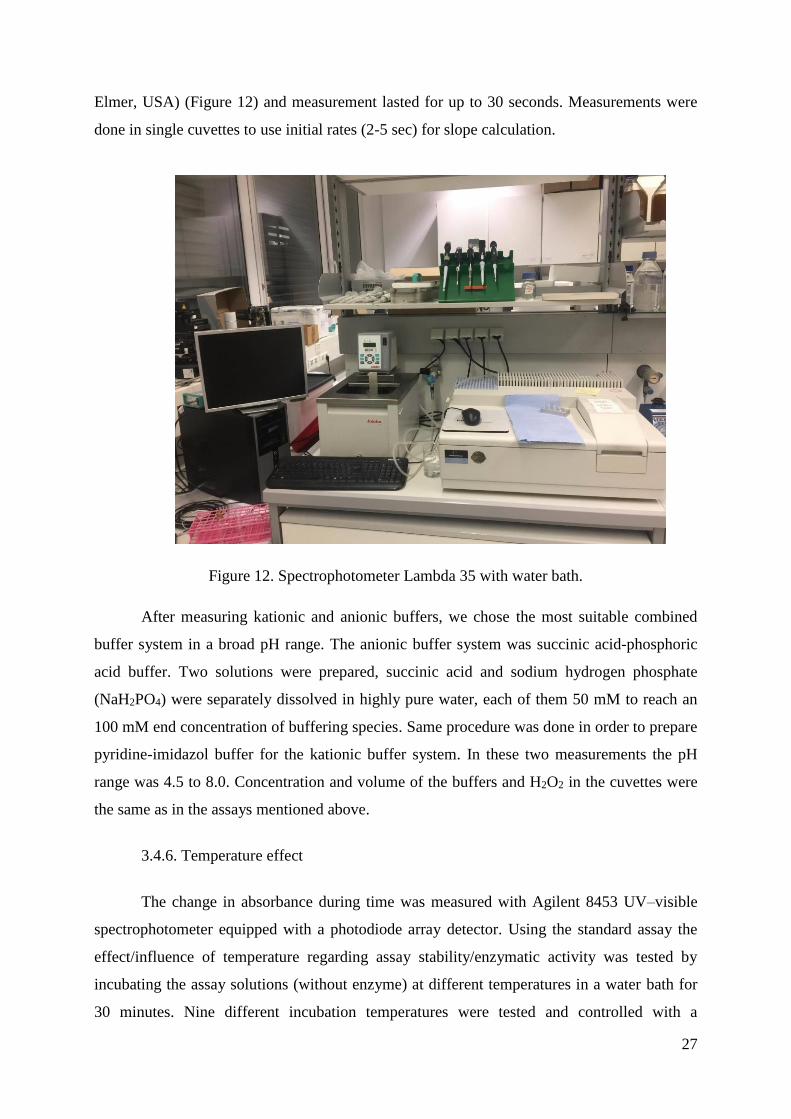
Elmer, USA) (Figure 12) and measurement lasted for up to 30 seconds. Measurements were
done in single cuvettes to use initial rates (2-5 sec) for slope calculation.
Figure 12. Spectrophotometer Lambda 35 with water bath.
After measuring kationic and anionic buffers, we chose the most suitable combined
buffer system in a broad pH range. The anionic buffer system was succinic acid-phosphoric
acid buffer. Two solutions were prepared, succinic acid and sodium hydrogen phosphate
(NaH2PO4) were separately dissolved in highly pure water, each of them 50 mM to reach an
100 mM end concentration of buffering species. Same procedure was done in order to prepare
pyridine-imidazol buffer for the kationic buffer system. In these two measurements the pH
range was 4.5 to 8.0. Concentration and volume of the buffers and H2O2 in the cuvettes were
the same as in the assays mentioned above.
3.4.6. Temperature effect
The change in absorbance during time was measured with Agilent 8453 UV–visible
spectrophotometer equipped with a photodiode array detector. Using the standard assay the
effect/influence of temperature regarding assay stability/enzymatic activity was tested by
incubating the assay solutions (without enzyme) at different temperatures in a water bath for
30 minutes. Nine different incubation temperatures were tested and controlled with a
28
thermometer in the cuvettes: room temperature, 25°C, 30°C, 35°C, 40°C, 45°C, 50°C, 55°C
and 60°C. After incubation, reaction was started by adding 0.5 μM LPMO.
Apart from calculating volumetric and specific activity, Arrhenius equation to
calculate the activation energy of the reaction was used:
ln k= ln A - Ea
R*
1
T [4]
k = rate constant [Ug-1]
A = pre-exponential factor, a constant for each chemical reaction
Ea = activation energy for the reaction [kJmol-1]
R = universal gas constant; 8.314 [Jmol−1K−1]
T = absolute temperature [K]
The natural logarithm (ln) of the specific activity [Ug-1] was plotted versus the inverse
temperature (1/T). The slope in the linear range multiplied by the gas constant is equal to the
activation energy.
3.4.7. Kinetic constants - KM and Vmax values
KM and Vmax values for both DMP and H2O2 were measured with UV/Vis photometer
(Lambda 35, Perkin Elmer, USA). Assays for each substrate were made in 100 mM succinic-
phosphoric buffer both at pH 6.0 and pH 7.0.
In order to determine KM and Vmax values for DMP and H2O2, eight concentrations of
DMP (0.5 mM, 1 mM, 2 mM, 10 mM, 25 mM, 50 mM, 85 mM and 115 mM) and six
concentrations of H2O2 (2 μM, 5 μM, 25 μM, 100 μM, 300 μM and 1000 μM) were used.
LPMO concentration at pH 6 was 1.5 μM, and in the case of pH 7 it was 0.10 μM.
In addition, kinetic constans for H2O2 were also measured at pH 7.5. In this case eight
different concentrations of H2O2 could be used: 2 μM, 5 μM, 10 μM, 25 μM, 50 μM, 75 μM,
100 μM, 500 μM with only two concentrations of DMP: 0.5 mM and 1 mM. In this assay
LPMO concentration was 0.01 μM.
29
3.4.8. Limit of Detection
Before carrying out this test, the lowest LPMO concentration which gives a three
times higher linear slope compared to the noise had to be determined. In order to do this, a
few different LPMO concentrations were measured using the standard assay.
After finding out the approximately lowest activity range of the reaction, it was
decided that the highest concentration is D0 (dilution zero, original stock for the assay) and
the lowest one is D800 (dilution 1:800). Twelve different concentrations of LPMO were made
in between to cover the whole range (for example, D80 means 1:80 dilution, D200 1:200
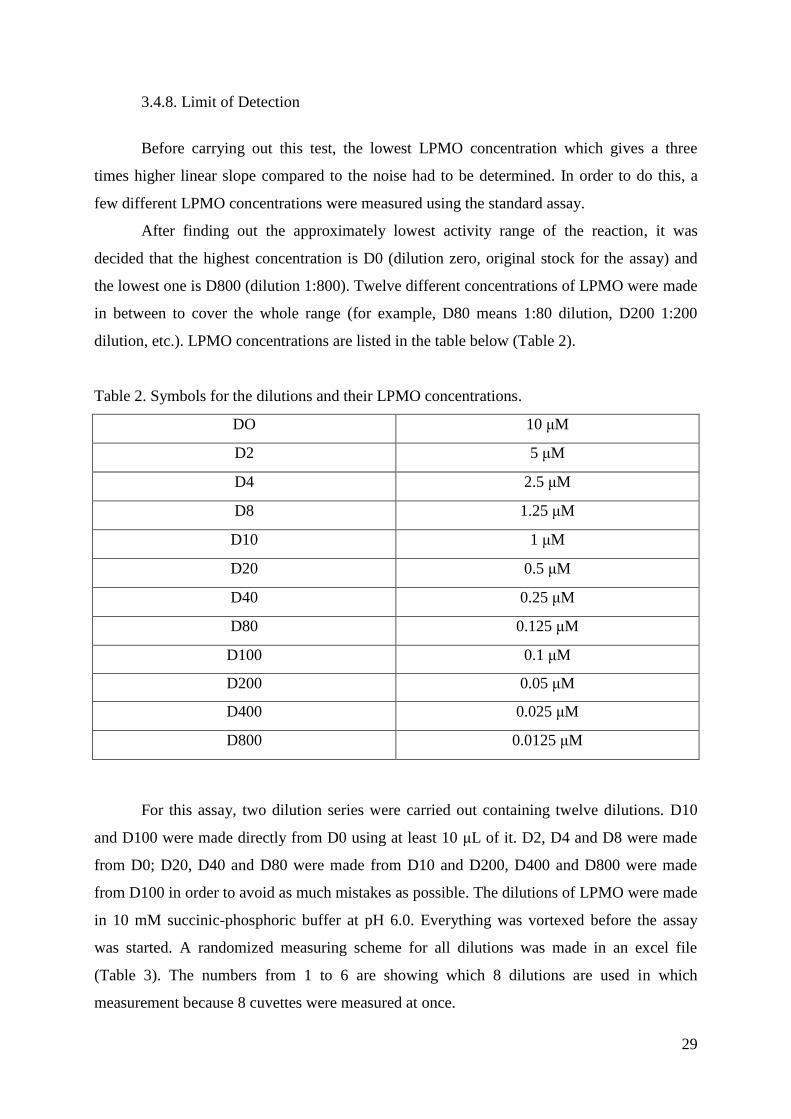
dilution, etc.). LPMO concentrations are listed in the table below (Table 2).
Table 2. Symbols for the dilutions and their LPMO concentrations.
DO 10 μM
D2 5 μM
D4 2.5 μM
D8 1.25 μM
D10 1 μM
D20 0.5 μM
D40 0.25 μM
D80 0.125 μM
D100 0.1 μM
D200 0.05 μM
D400 0.025 μM
D800 0.0125 μM
For this assay, two dilution series were carried out containing twelve dilutions. D10
and D100 were made directly from D0 using at least 10 μL of it. D2, D4 and D8 were made
from D0; D20, D40 and D80 were made from D10 and D200, D400 and D800 were made
from D100 in order to avoid as much mistakes as possible. The dilutions of LPMO were made
in 10 mM succinic-phosphoric buffer at pH 6.0. Everything was vortexed before the assay
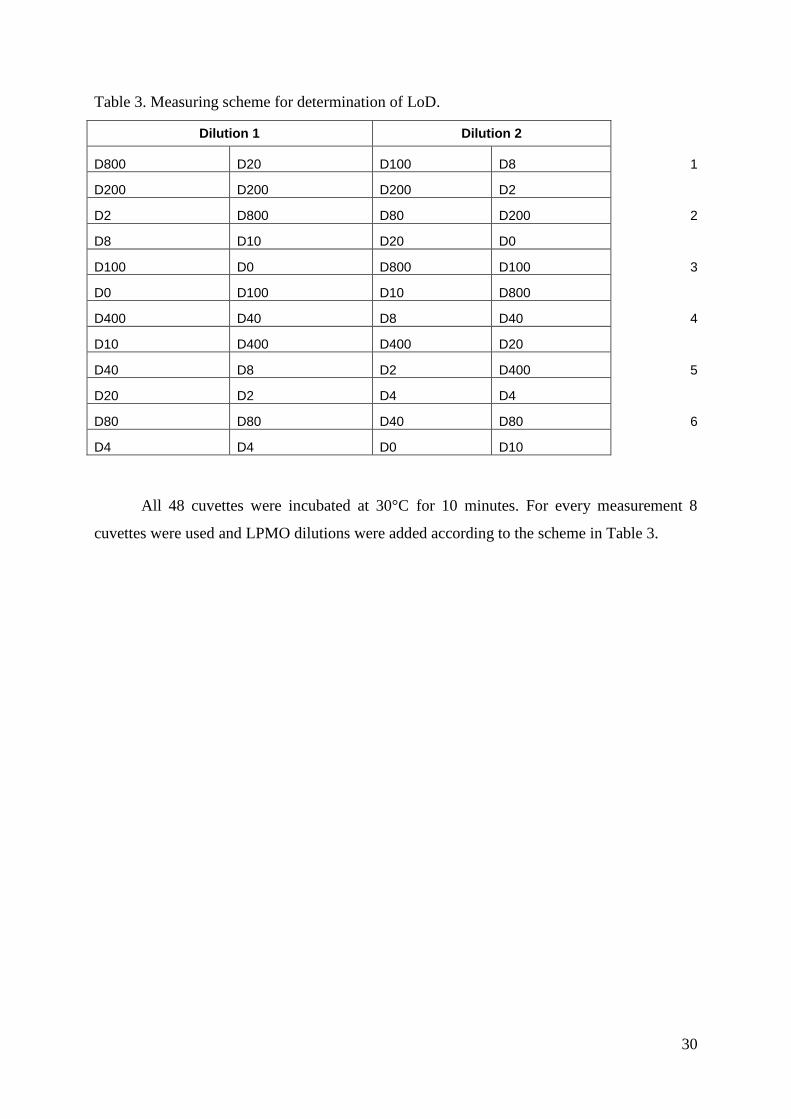
was started. A randomized measuring scheme for all dilutions was made in an excel file
(Table 3). The numbers from 1 to 6 are showing which 8 dilutions are used in which
measurement because 8 cuvettes were measured at once.
30
Table 3. Measuring scheme for determination of LoD.
Dilution 1 Dilution 2
D800 D20 D100 D8 1
D200 D200 D200 D2
D2 D800 D80 D200 2
D8 D10 D20 D0
D100 D0 D800 D100 3
D0 D100 D10 D800
D400 D40 D8 D40 4
D10 D400 D400 D20
D40 D8 D2 D400 5
D20 D2 D4 D4
D80 D80 D40 D80 6
D4 D4 D0 D10
All 48 cuvettes were incubated at 30°C for 10 minutes. For every measurement 8
cuvettes were used and LPMO dilutions were added according to the scheme in Table 3.
31
4. RESULTS & DISCUSSION
4.1. SUBSTRATE SCREENING
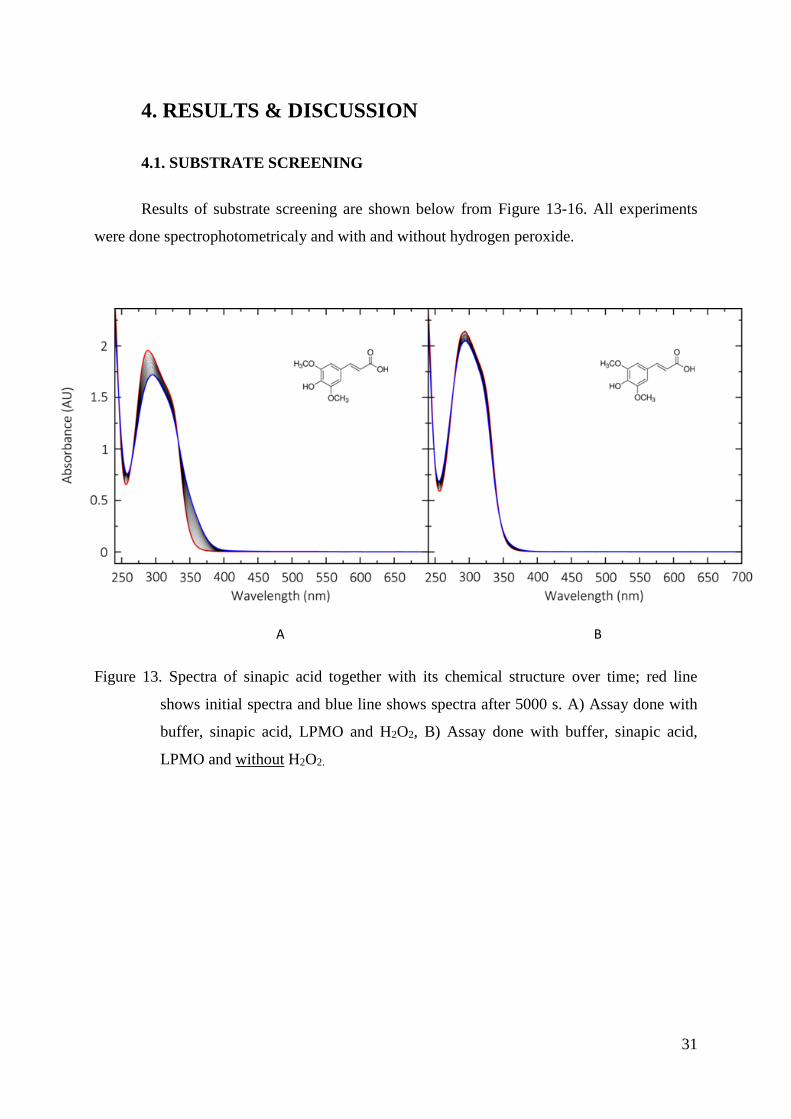
Results of substrate screening are shown below from Figure 13-16. All experiments
were done spectrophotometricaly and with and without hydrogen peroxide.
Figure 13. Spectra of sinapic acid together with its chemical structure over time; red line
shows initial spectra and blue line shows spectra after 5000 s. A) Assay done with
buffer, sinapic acid, LPMO and H2O2, B) Assay done with buffer, sinapic acid,
LPMO and without H2O2.
A B
32
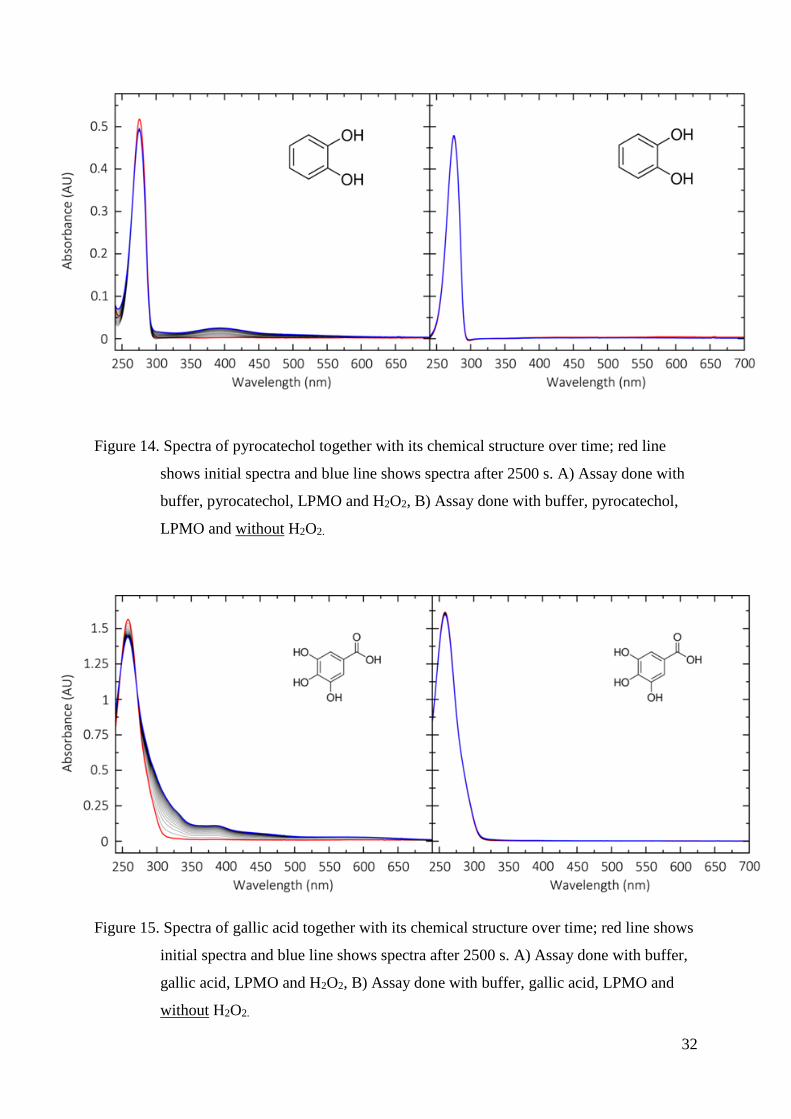
Figure 14. Spectra of pyrocatechol together with its chemical structure over time; red line
shows initial spectra and blue line shows spectra after 2500 s. A) Assay done with
buffer, pyrocatechol, LPMO and H2O2, B) Assay done with buffer, pyrocatechol,
LPMO and without H2O2.
Figure 15. Spectra of gallic acid together with its chemical structure over time; red line shows
initial spectra and blue line shows spectra after 2500 s. A) Assay done with buffer,
gallic acid, LPMO and H2O2, B) Assay done with buffer, gallic acid, LPMO and
without H2O2.
33
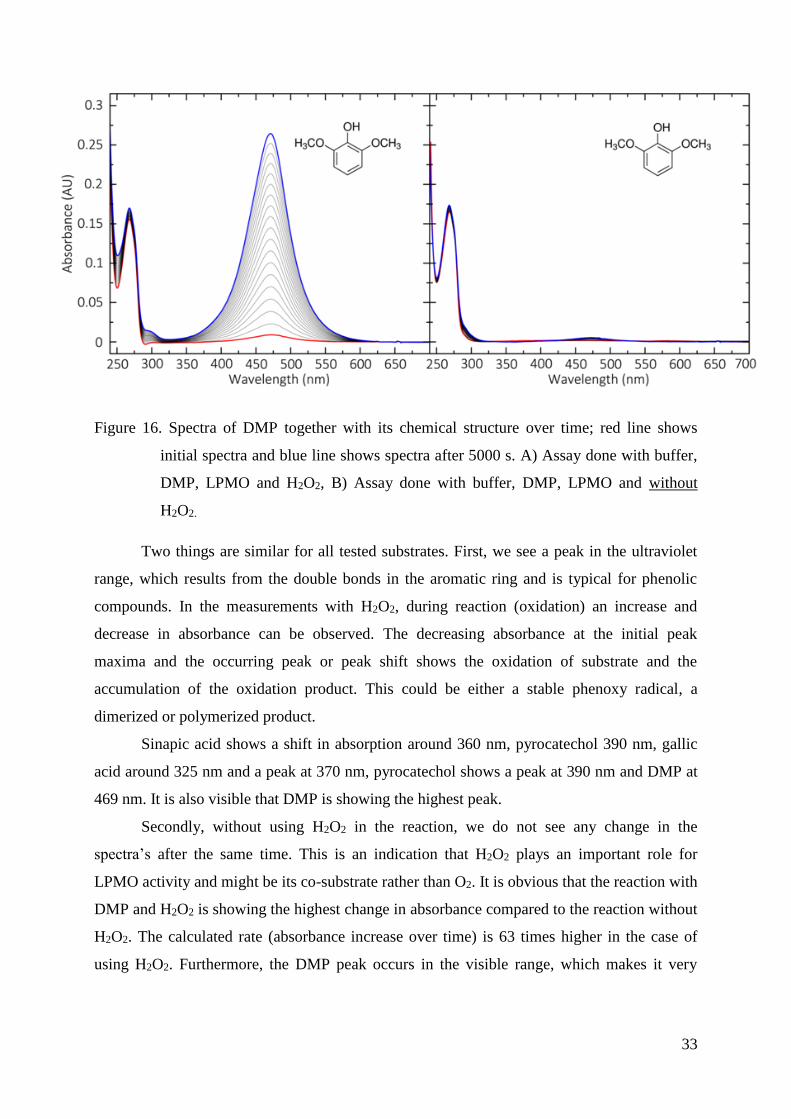
Figure 16. Spectra of DMP together with its chemical structure over time; red line shows
initial spectra and blue line shows spectra after 5000 s. A) Assay done with buffer,
DMP, LPMO and H2O2, B) Assay done with buffer, DMP, LPMO and without
H2O2.
Two things are similar for all tested substrates. First, we see a peak in the ultraviolet
range, which results from the double bonds in the aromatic ring and is typical for phenolic
compounds. In the measurements with H2O2, during reaction (oxidation) an increase and
decrease in absorbance can be observed. The decreasing absorbance at the initial peak
maxima and the occurring peak or peak shift shows the oxidation of substrate and the
accumulation of the oxidation product. This could be either a stable phenoxy radical, a
dimerized or polymerized product.
Sinapic acid shows a shift in absorption around 360 nm, pyrocatechol 390 nm, gallic
acid around 325 nm and a peak at 370 nm, pyrocatechol shows a peak at 390 nm and DMP at
469 nm. It is also visible that DMP is showing the highest peak.
Secondly, without using H2O2 in the reaction, we do not see any change in the
spectra’s after the same time. This is an indication that H2O2 plays an important role for
LPMO activity and might be its co-substrate rather than O2. It is obvious that the reaction with
DMP and H2O2 is showing the highest change in absorbance compared to the reaction without
H2O2. The calculated rate (absorbance increase over time) is 63 times higher in the case of
using H2O2. Furthermore, the DMP peak occurs in the visible range, which makes it very
34
useful as a substrate for enzymatic activity assays. Due to these facts we decided to use DMP
as chromogenic substrate to develop an activity assay for LPMOs.
4.2. BASIC LPMO ASSAYS
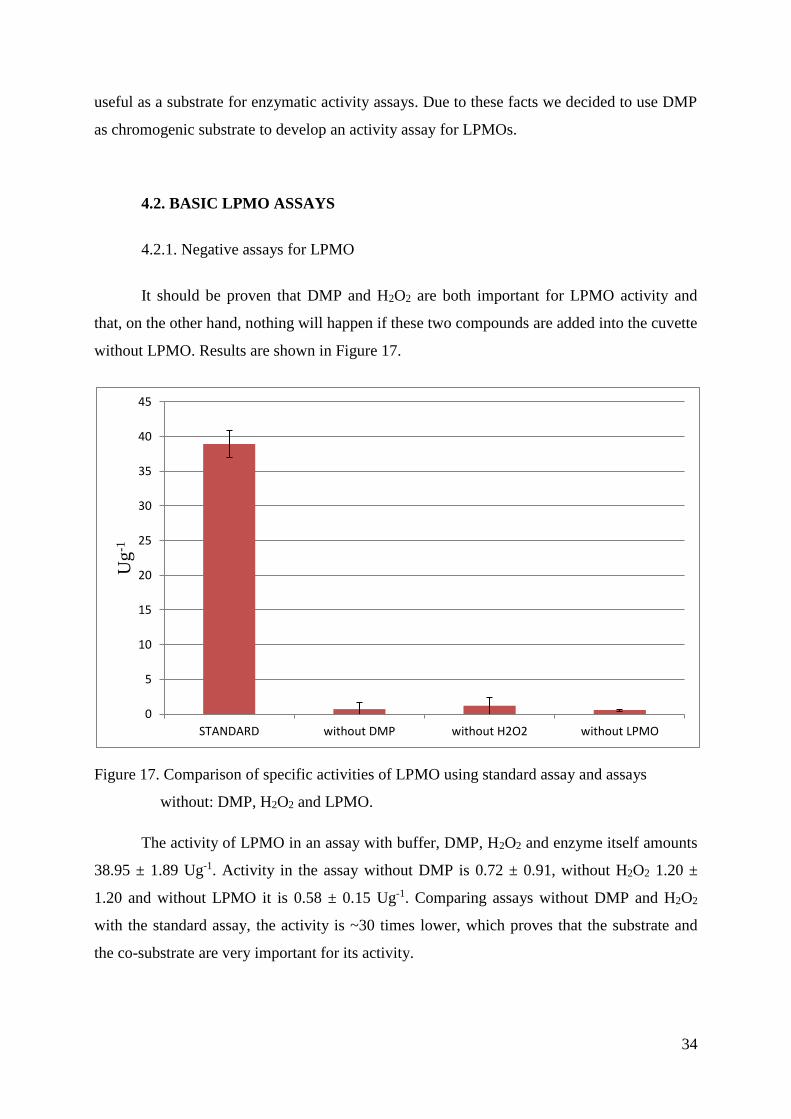
4.2.1. Negative assays for LPMO
It should be proven that DMP and H2O2 are both important for LPMO activity and
that, on the other hand, nothing will happen if these two compounds are added into the cuvette
without LPMO. Results are shown in Figure 17.
Figure 17. Comparison of specific activities of LPMO using standard assay and assays
without: DMP, H2O2 and LPMO.
The activity of LPMO in an assay with buffer, DMP, H2O2 and enzyme itself amounts
38.95 ± 1.89 Ug-1. Activity in the assay without DMP is 0.72 ± 0.91, without H2O2 1.20 ±
1.20 and without LPMO it is 0.58 ± 0.15 Ug-1. Comparing assays without DMP and H2O2
with the standard assay, the activity is ~30 times lower, which proves that the substrate and
the co-substrate are very important for its activity.
0
5
10
15
20
25
30
35
40
45
STANDARD without DMP without H2O2 without LPMO
Ug
-1
35
4.2.2. Copper compounds instead of LPMO
As mentioned above, LPMO contains a single copper ion coordinated by the histidine
brace in its active side. Using copper compounds instead of LPMO should rule out the
possibility that in all those assays LPMO was not the main compound responsible for
absorbance shown in spectrophotometric measurements.
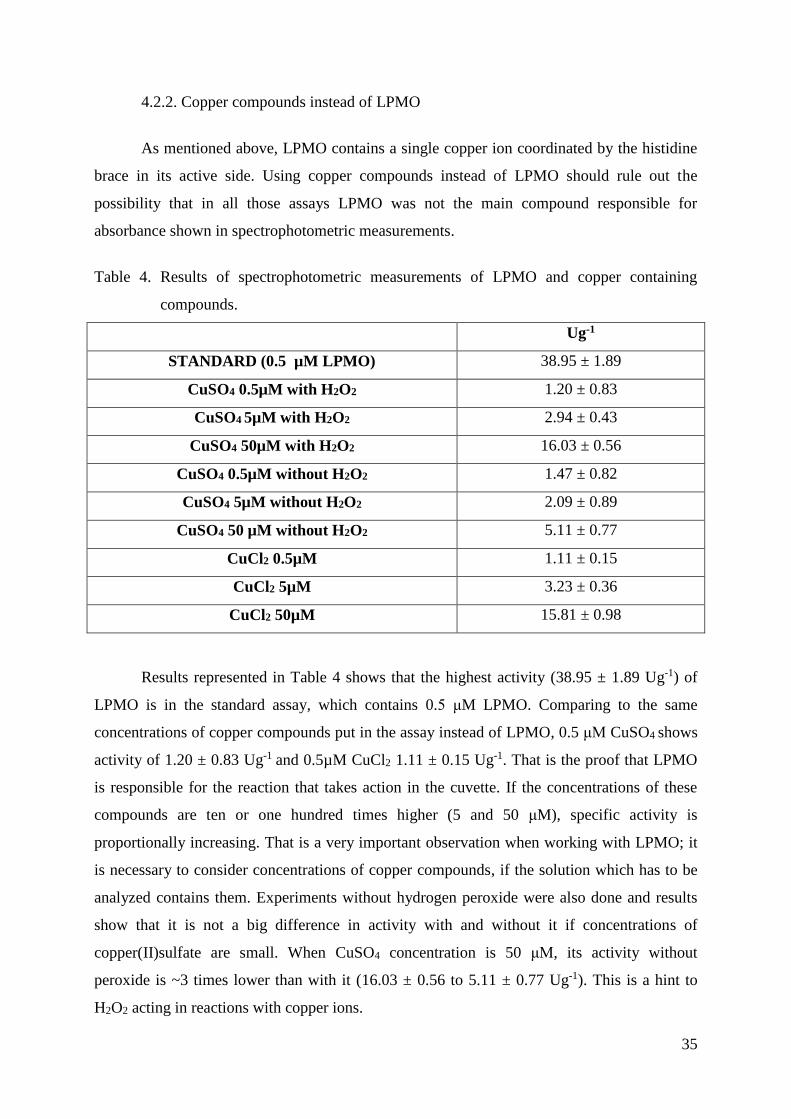
Table 4. Results of spectrophotometric measurements of LPMO and copper containing
compounds.
Ug-1
STANDARD (0.5 µM LPMO) 38.95 ± 1.89
CuSO4 0.5µM with H2O2 1.20 ± 0.83
CuSO4 5µM with H2O2 2.94 ± 0.43
CuSO4 50µM with H2O2 16.03 ± 0.56
CuSO4 0.5µM without H2O2 1.47 ± 0.82
CuSO4 5µM without H2O2 2.09 ± 0.89
CuSO4 50 µM without H2O2 5.11 ± 0.77
CuCl2 0.5µM 1.11 ± 0.15
CuCl2 5µM 3.23 ± 0.36
CuCl2 50µM 15.81 ± 0.98
Results represented in Table 4 shows that the highest activity (38.95 ± 1.89 Ug-1) of
LPMO is in the standard assay, which contains 0.5 μM LPMO. Comparing to the same
concentrations of copper compounds put in the assay instead of LPMO, 0.5 μM CuSO4 shows
activity of 1.20 ± 0.83 Ug-1 and 0.5µM CuCl2 1.11 ± 0.15 Ug-1. That is the proof that LPMO
is responsible for the reaction that takes action in the cuvette. If the concentrations of these
compounds are ten or one hundred times higher (5 and 50 μM), specific activity is
proportionally increasing. That is a very important observation when working with LPMO; it
is necessary to consider concentrations of copper compounds, if the solution which has to be
analyzed contains them. Experiments without hydrogen peroxide were also done and results
show that it is not a big difference in activity with and without it if concentrations of
copper(II)sulfate are small. When CuSO4 concentration is 50 μM, its activity without
peroxide is ~3 times lower than with it (16.03 ± 0.56 to 5.11 ± 0.77 Ug-1). This is a hint to
H2O2 acting in reactions with copper ions.
36
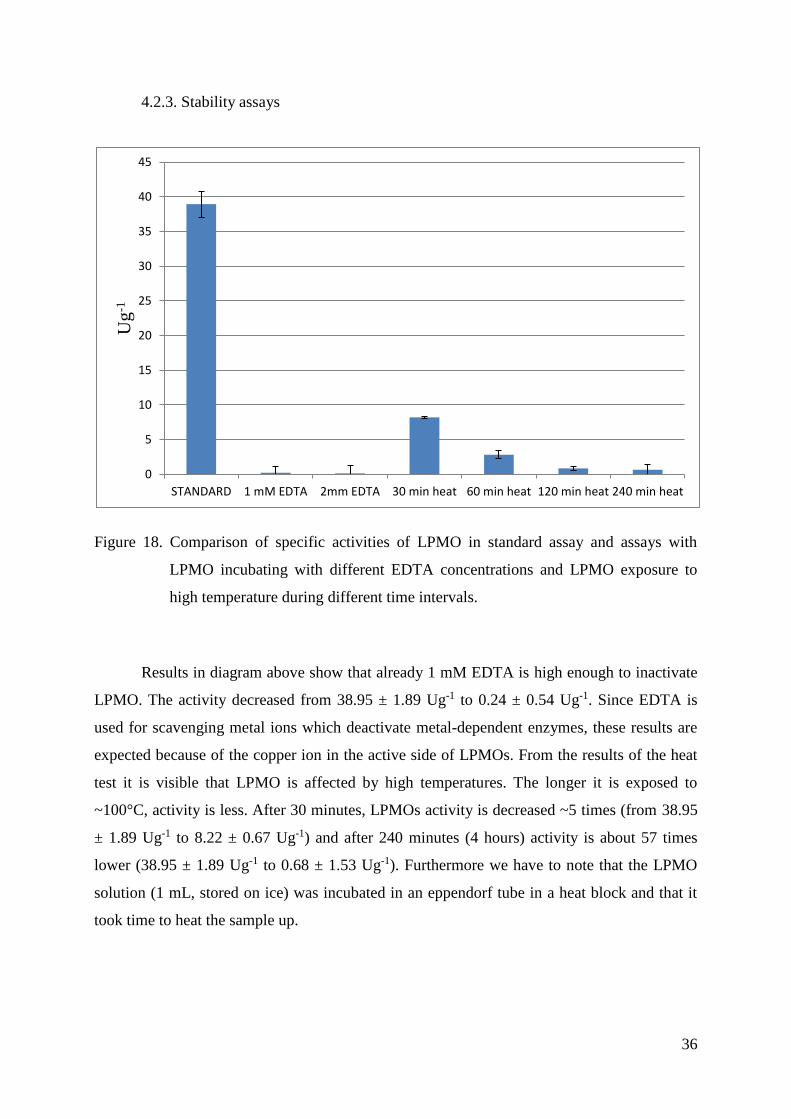
4.2.3. Stability assays
Figure 18. Comparison of specific activities of LPMO in standard assay and assays with
LPMO incubating with different EDTA concentrations and LPMO exposure to
high temperature during different time intervals.
Results in diagram above show that already 1 mM EDTA is high enough to inactivate
LPMO. The activity decreased from 38.95 ± 1.89 Ug-1 to 0.24 ± 0.54 Ug-1. Since EDTA is
used for scavenging metal ions which deactivate metal-dependent enzymes, these results are
expected because of the copper ion in the active side of LPMOs. From the results of the heat
test it is visible that LPMO is affected by high temperatures. The longer it is exposed to
~100°C, activity is less. After 30 minutes, LPMOs activity is decreased ~5 times (from 38.95
± 1.89 Ug-1 to 8.22 ± 0.67 Ug-1) and after 240 minutes (4 hours) activity is about 57 times
lower (38.95 ± 1.89 Ug-1 to 0.68 ± 1.53 Ug-1). Furthermore we have to note that the LPMO
solution (1 mL, stored on ice) was incubated in an eppendorf tube in a heat block and that it
took time to heat the sample up.
0
5
10
15
20
25
30
35
40
45
STANDARD 1 mM EDTA 2mm EDTA 30 min heat 60 min heat 120 min heat 240 min heat
Ug
-1
37
4.3. pH PROFILE
4.3.1. Anionic buffers
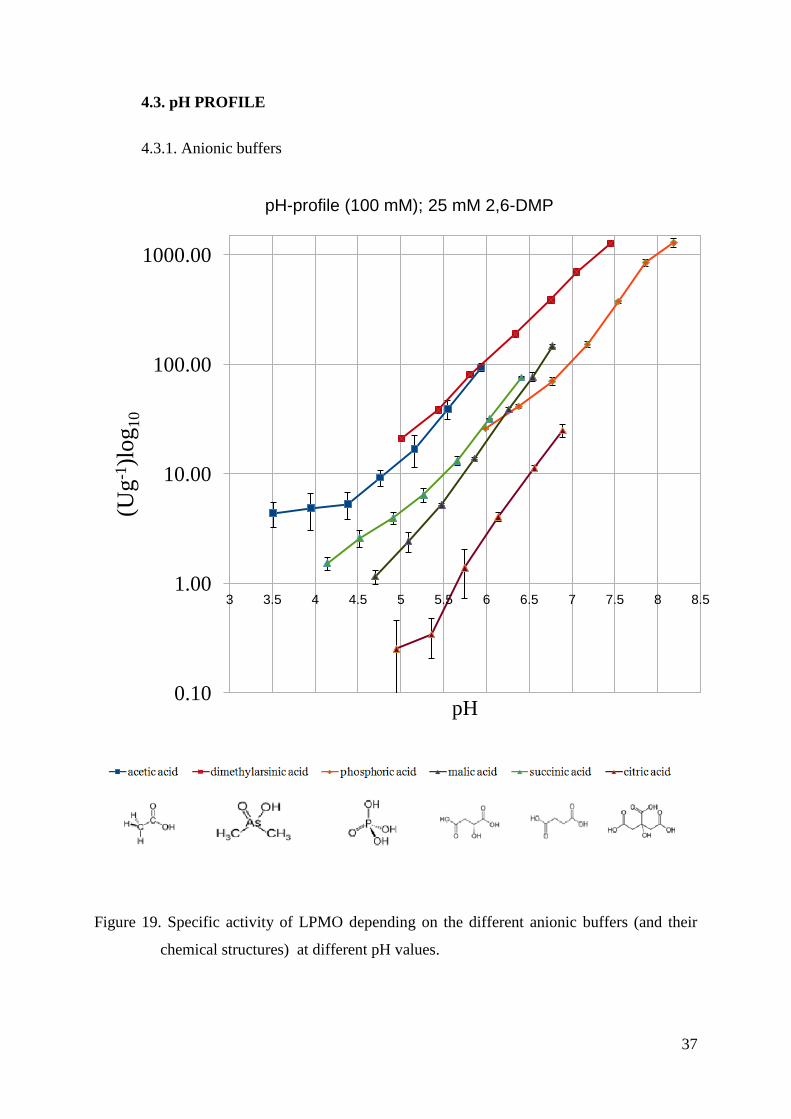
Figure 19. Specific activity of LPMO depending on the different anionic buffers (and their
chemical structures) at different pH values.
0.10
1.00
10.00
100.00
1000.00
3 3.5 4 4.5 5 5.5 6 6.5 7 7.5 8 8.5
(Ug
-1)l
og
10
pH
pH-profile (100 mM); 25 mM 2,6-DMP
38
From the results shown in Figure 19, it is clear that LPMO activity is increasing
together with the increase of pH. Acetic acid, succinic acid, malic acid and citric acid buffers
have similiar slopes, however, the overall activity is decreasing. According to the chemical
structures of these acids, it can be concluded that LPMO activity is higher in buffers with less
carboxylic groups and hydroxylic groups. Dimethylarsinic acid and phosphoric acid buffers
are, according to the graph, the best anionic buffers for LPMO assays. Its activity can be
detected in the pH range from 5.0 to 8.19 and it is 1284.5 ± 111.7 Ug-1 for phosphoric acid
and 1266.4 ± 40.4 Ug-1 for dimethylarsinic acid. Comparing to the buffers mentioned above,
the highest LPMO activity was measured in malic acid buffer at pH 6.77 and it is 146.6 ± 5.0
Ug-1 which is ~8.8 and ~ 8.6 times lower than phosphoric acid buffer and dimethylarsinic acid
buffer, respectively. For dimethylarsinic acid and phosphoric acid, a similar effect as for the
other buffers regarding increasing activity with less hydroxyl groups can be observed.
39
4.3.2. Kationic buffers
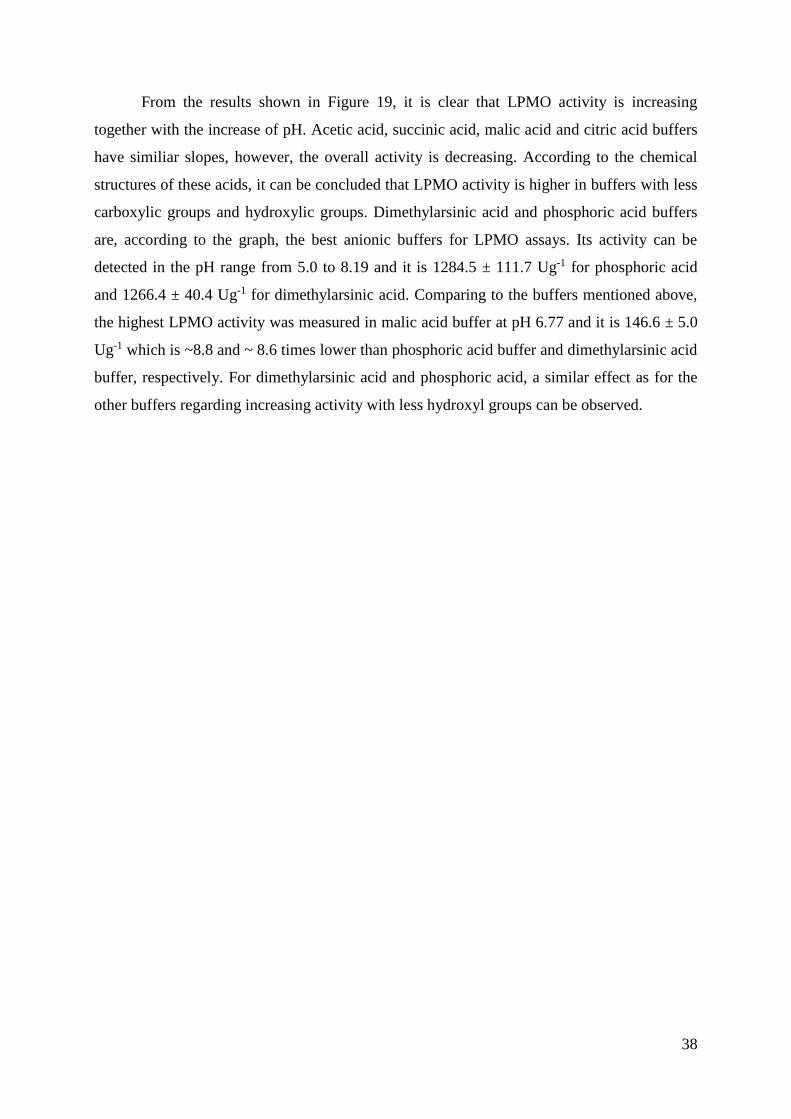
Figure 20. Specific activity of LPMO depending on the different kationic buffers (and their
chemical structures) at different pH values.
As it is visible from the results in Figure 20, histidine is bad buffer for LPMO activity
assays, because the activity drops to more or less zero with neutral pH. When using 2,4-
dimethylimidazol buffer, activity is decreasing with the higher pH values (from ~7-8), then it
becomes constant (at pH 7.92 LPMO activity is 468.6 ± 35.0 Ug-1, at pH 8.31 it is 473.5 ±
29.8 Ug-1, at pH 8.71 it is 479.8 ± 40.3 Ug-1 and at pH 9.05 it amounts 484.4 ± 98.4 Ug-1) and
after pH ~9.0 it starts decreasing again. No further experiments were done in order to explain
these results. In the case of histidine, presumption is that these results can be somehow related
0.10
1.00
10.00
100.00
1000.00
4 4.5 5 5.5 6 6.5 7 7.5 8 8.5 9 9.5 10
(Ug
-1)l
og
10
pH
pH-profile (100 mM); 25 mM 2,6-DMP
pyridine imidazol 2,4-dimethylimidazol histidine
40
to „histidine brace“ in the active site of LPMO and that the buffer species is strongly binding
in the more deprotonated state.
Pyridine and imidazol buffers are convenient for doing LPMO assays, each of them in
different pH range, which is shown through increase of activity by increasing the pH values.
LPMO shows linear increasing in activity in Pyridine buffer from pH 4.06 to 6.39 at which it
is the highest and amounts 353.1 ± 23.1 Ug-1. Since imidazol has higher pKa value (7.05) than
pyridine (5.24), it was possible to conduct the experiments at higher pH values. In Imidazol
buffer, activity is also rising from pH 5.91 to 8.31 but it becomes linear around pH 7. The
highest activity is at the highest pH and it amounts 1956.5 ± 84.9 Ug-1.
4.3.3. Buffer combinations
From the results presented and explained in Figure 19 and Figure 20, the best
combination of buffer species can be created using succinic acid and phosphoric acid, because
it is clearly shown in Figure 19 that enzyme activity in phosphoric acid buffer actually
continues to activity in succinic acid buffer which was measured at lower pH values because
of the lower pKa value (7.21 compared to 5.24). The same situation can be observed in the
case of kationic buffers with pyridine and imidazol shown in Figure 20. LPMO activity in
imidazol buffer continues to pyridine buffer where it was measured at lower pH because of
the same reason already mentioned above (pKa values). Because of these results, succinic-
phosphoric buffer and pyridine-imidazol buffer were made and specific activity was
measured. Results are shown in the graph below.
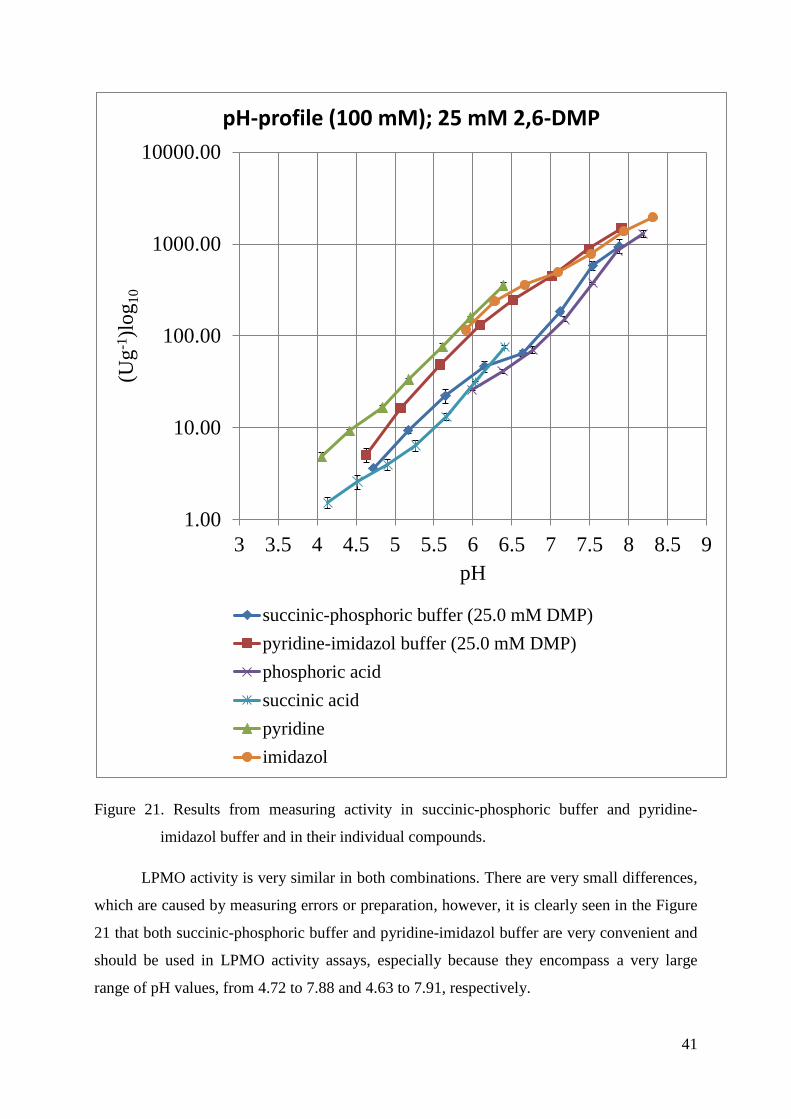
41
Figure 21. Results from measuring activity in succinic-phosphoric buffer and pyridine-
imidazol buffer and in their individual compounds.
LPMO activity is very similar in both combinations. There are very small differences,
which are caused by measuring errors or preparation, however, it is clearly seen in the Figure
21 that both succinic-phosphoric buffer and pyridine-imidazol buffer are very convenient and
should be used in LPMO activity assays, especially because they encompass a very large
range of pH values, from 4.72 to 7.88 and 4.63 to 7.91, respectively.
1.00
10.00
100.00
1000.00
10000.00
3 3.5 4 4.5 5 5.5 6 6.5 7 7.5 8 8.5 9
(Ug
-1)l
og
10
pH
pH-profile (100 mM); 25 mM 2,6-DMP
succinic-phosphoric buffer (25.0 mM DMP)
pyridine-imidazol buffer (25.0 mM DMP)
phosphoric acid
succinic acid
pyridine
imidazol
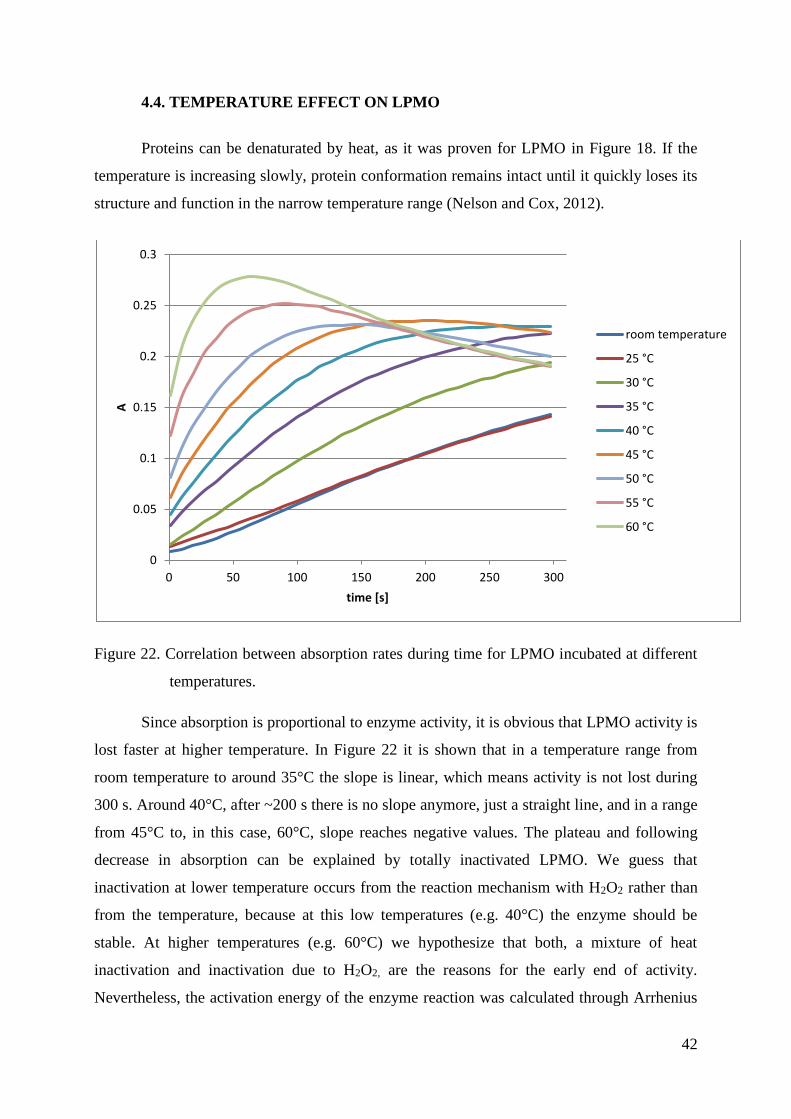
42
4.4. TEMPERATURE EFFECT ON LPMO
Proteins can be denaturated by heat, as it was proven for LPMO in Figure 18. If the
temperature is increasing slowly, protein conformation remains intact until it quickly loses its
structure and function in the narrow temperature range (Nelson and Cox, 2012).
Figure 22. Correlation between absorption rates during time for LPMO incubated at different
temperatures.
Since absorption is proportional to enzyme activity, it is obvious that LPMO activity is
lost faster at higher temperature. In Figure 22 it is shown that in a temperature range from
room temperature to around 35°C the slope is linear, which means activity is not lost during
300 s. Around 40°C, after ~200 s there is no slope anymore, just a straight line, and in a range
from 45°C to, in this case, 60°C, slope reaches negative values. The plateau and following
decrease in absorption can be explained by totally inactivated LPMO. We guess that
inactivation at lower temperature occurs from the reaction mechanism with H2O2 rather than
from the temperature, because at this low temperatures (e.g. 40°C) the enzyme should be
stable. At higher temperatures (e.g. 60°C) we hypothesize that both, a mixture of heat
inactivation and inactivation due to H2O2, are the reasons for the early end of activity.
Nevertheless, the activation energy of the enzyme reaction was calculated through Arrhenius
0
0.05
0.1
0.15
0.2
0.25
0.3
0 50 100 150 200 250 300
A
time [s]
room temperature
25 °C
30 °C
35 °C
40 °C
45 °C
50 °C
55 °C
60 °C
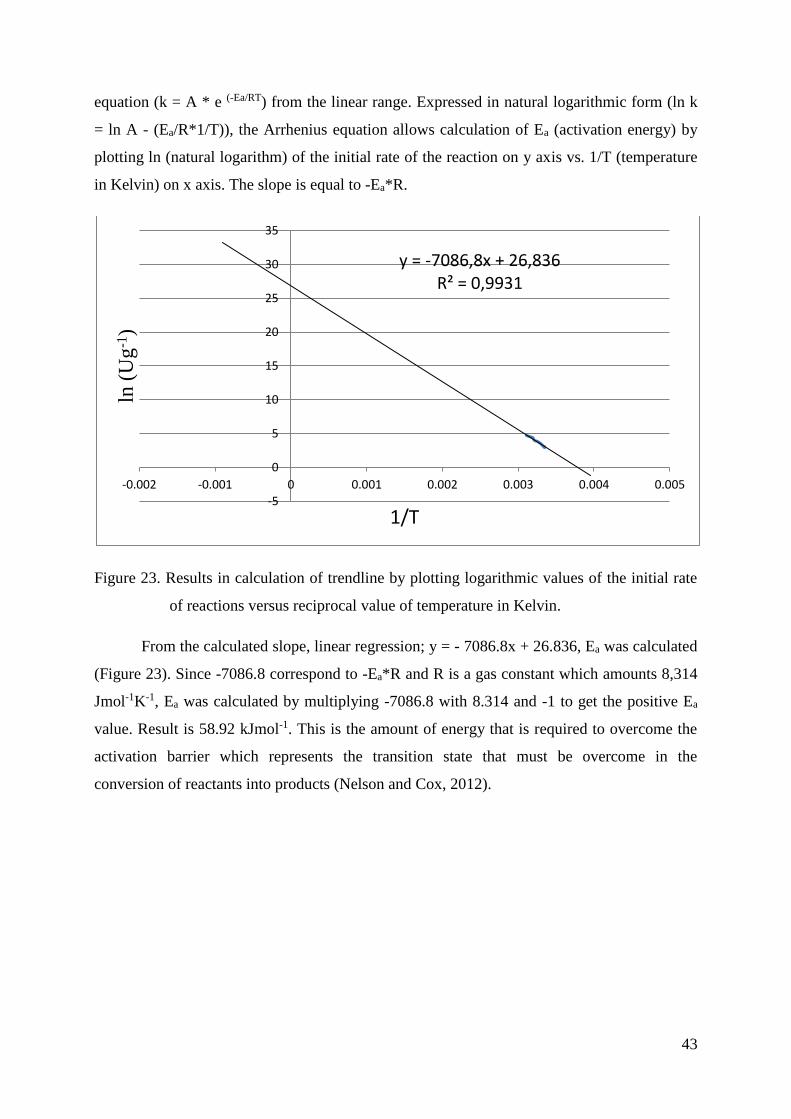
43
equation (k = A * e (-Ea/RT) from the linear range. Expressed in natural logarithmic form (ln k
= ln A - (Ea/R*1/T)), the Arrhenius equation allows calculation of Ea (activation energy) by
plotting ln (natural logarithm) of the initial rate of the reaction on y axis vs. 1/T (temperature
in Kelvin) on x axis. The slope is equal to -Ea*R.
Figure 23. Results in calculation of trendline by plotting logarithmic values of the initial rate
of reactions versus reciprocal value of temperature in Kelvin.
From the calculated slope, linear regression; y = - 7086.8x + 26.836, Ea was calculated
(Figure 23). Since -7086.8 correspond to -Ea*R and R is a gas constant which amounts 8,314
Jmol-1K-1, Ea was calculated by multiplying -7086.8 with 8.314 and -1 to get the positive Ea
value. Result is 58.92 kJmol-1. This is the amount of energy that is required to overcome the
activation barrier which represents the transition state that must be overcome in the
conversion of reactants into products (Nelson and Cox, 2012).
y = -7086,8x + 26,836R² = 0,9931
-5
0
5
10
15
20
25
30
35
-0.002 -0.001 0 0.001 0.002 0.003 0.004 0.005
ln (
Ug
-1)
1/T
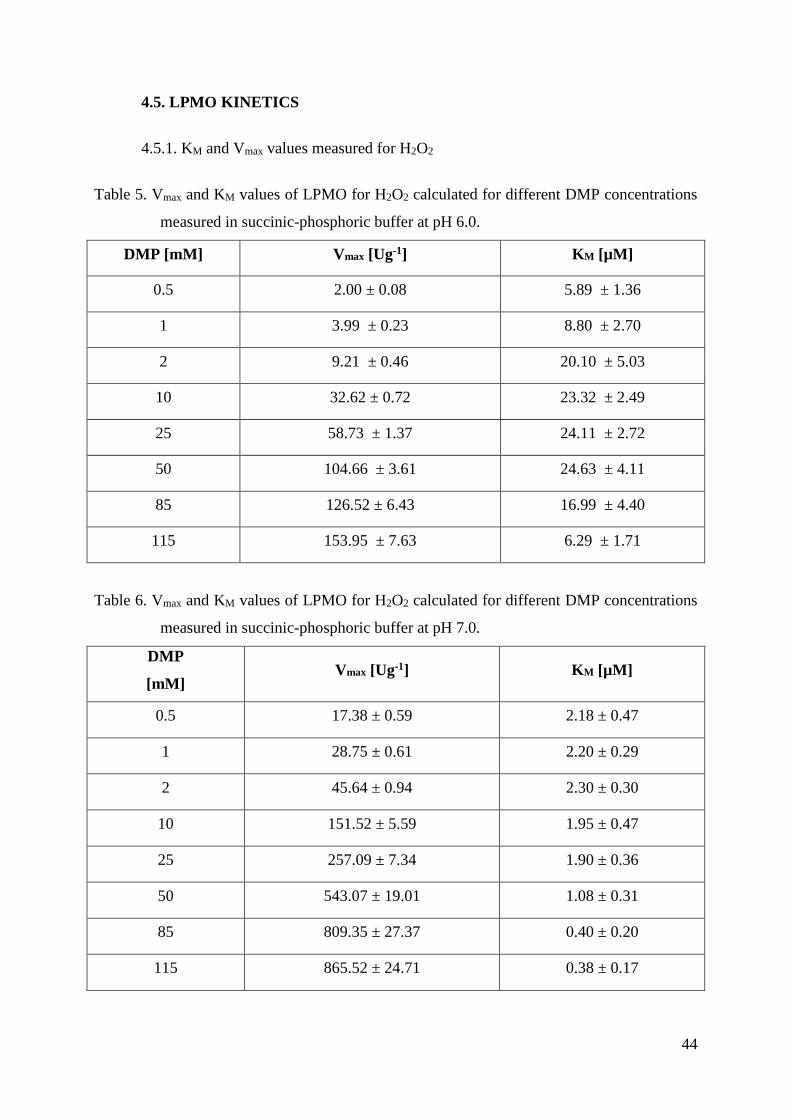
44
4.5. LPMO KINETICS
4.5.1. KM and Vmax values measured for H2O2
Table 5. Vmax and KM values of LPMO for H2O2 calculated for different DMP concentrations
measured in succinic-phosphoric buffer at pH 6.0.
DMP [mM] Vmax [Ug-1] KM [µM]
0.5 2.00 ± 0.08 5.89 ± 1.36
1 3.99 ± 0.23 8.80 ± 2.70
2 9.21 ± 0.46 20.10 ± 5.03
10 32.62 ± 0.72 23.32 ± 2.49
25 58.73 ± 1.37 24.11 ± 2.72
50 104.66 ± 3.61 24.63 ± 4.11
85 126.52 ± 6.43 16.99 ± 4.40
115 153.95 ± 7.63 6.29 ± 1.71
Table 6. Vmax and KM values of LPMO for H2O2 calculated for different DMP concentrations
measured in succinic-phosphoric buffer at pH 7.0.
DMP
[mM] Vmax [Ug-1] KM [µM]
0.5 17.38 ± 0.59 2.18 ± 0.47
1 28.75 ± 0.61 2.20 ± 0.29
2 45.64 ± 0.94 2.30 ± 0.30
10 151.52 ± 5.59 1.95 ± 0.47
25 257.09 ± 7.34 1.90 ± 0.36
50 543.07 ± 19.01 1.08 ± 0.31
85 809.35 ± 27.37 0.40 ± 0.20
115 865.52 ± 24.71 0.38 ± 0.17
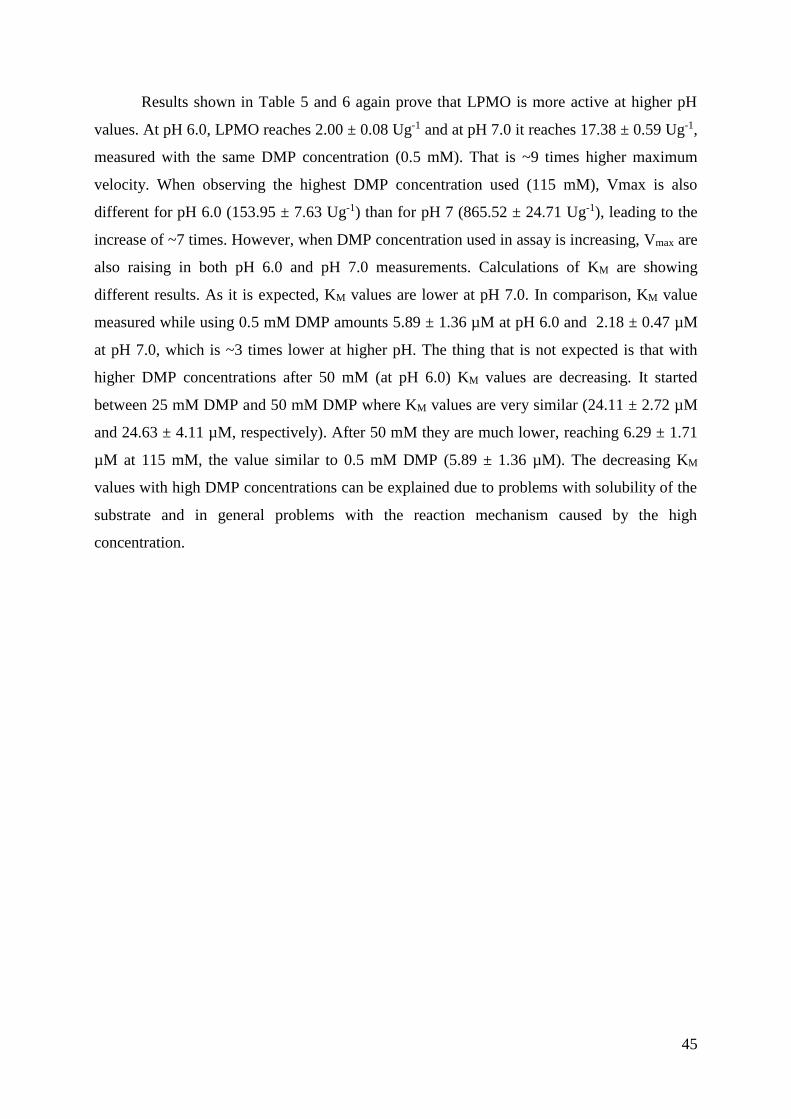
45
Results shown in Table 5 and 6 again prove that LPMO is more active at higher pH
values. At pH 6.0, LPMO reaches 2.00 ± 0.08 Ug-1 and at pH 7.0 it reaches 17.38 ± 0.59 Ug-1,
measured with the same DMP concentration (0.5 mM). That is ~9 times higher maximum
velocity. When observing the highest DMP concentration used (115 mM), Vmax is also
different for pH 6.0 (153.95 ± 7.63 Ug-1) than for pH 7 (865.52 ± 24.71 Ug-1), leading to the
increase of ~7 times. However, when DMP concentration used in assay is increasing, Vmax are
also raising in both pH 6.0 and pH 7.0 measurements. Calculations of KM are showing
different results. As it is expected, KM values are lower at pH 7.0. In comparison, KM value
measured while using 0.5 mM DMP amounts 5.89 ± 1.36 µM at pH 6.0 and 2.18 ± 0.47 µM
at pH 7.0, which is ~3 times lower at higher pH. The thing that is not expected is that with
higher DMP concentrations after 50 mM (at pH 6.0) KM values are decreasing. It started
between 25 mM DMP and 50 mM DMP where KM values are very similar (24.11 ± 2.72 µM
and 24.63 ± 4.11 µM, respectively). After 50 mM they are much lower, reaching 6.29 ± 1.71
µM at 115 mM, the value similar to 0.5 mM DMP (5.89 ± 1.36 µM). The decreasing KM
values with high DMP concentrations can be explained due to problems with solubility of the
substrate and in general problems with the reaction mechanism caused by the high
concentration.
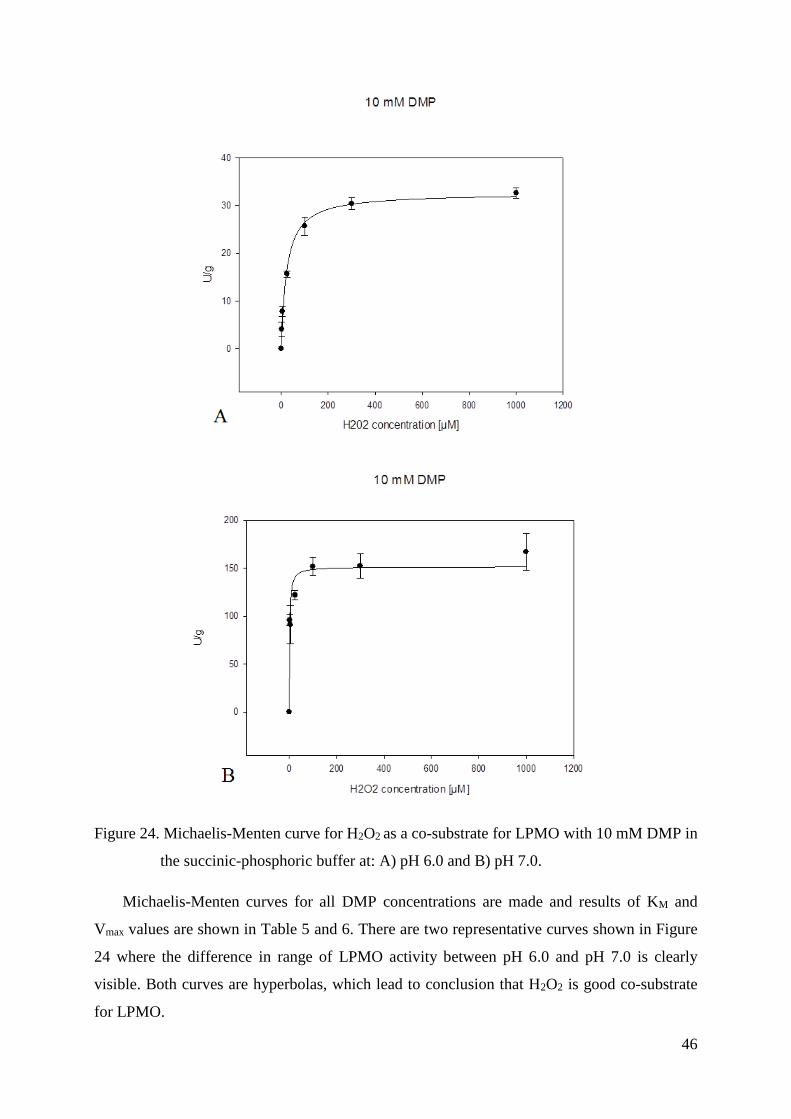
46
Figure 24. Michaelis-Menten curve for H2O2 as a co-substrate for LPMO with 10 mM DMP in
the succinic-phosphoric buffer at: A) pH 6.0 and B) pH 7.0.
Michaelis-Menten curves for all DMP concentrations are made and results of KM and
Vmax values are shown in Table 5 and 6. There are two representative curves shown in Figure
24 where the difference in range of LPMO activity between pH 6.0 and pH 7.0 is clearly
visible. Both curves are hyperbolas, which lead to conclusion that H2O2 is good co-substrate
for LPMO.
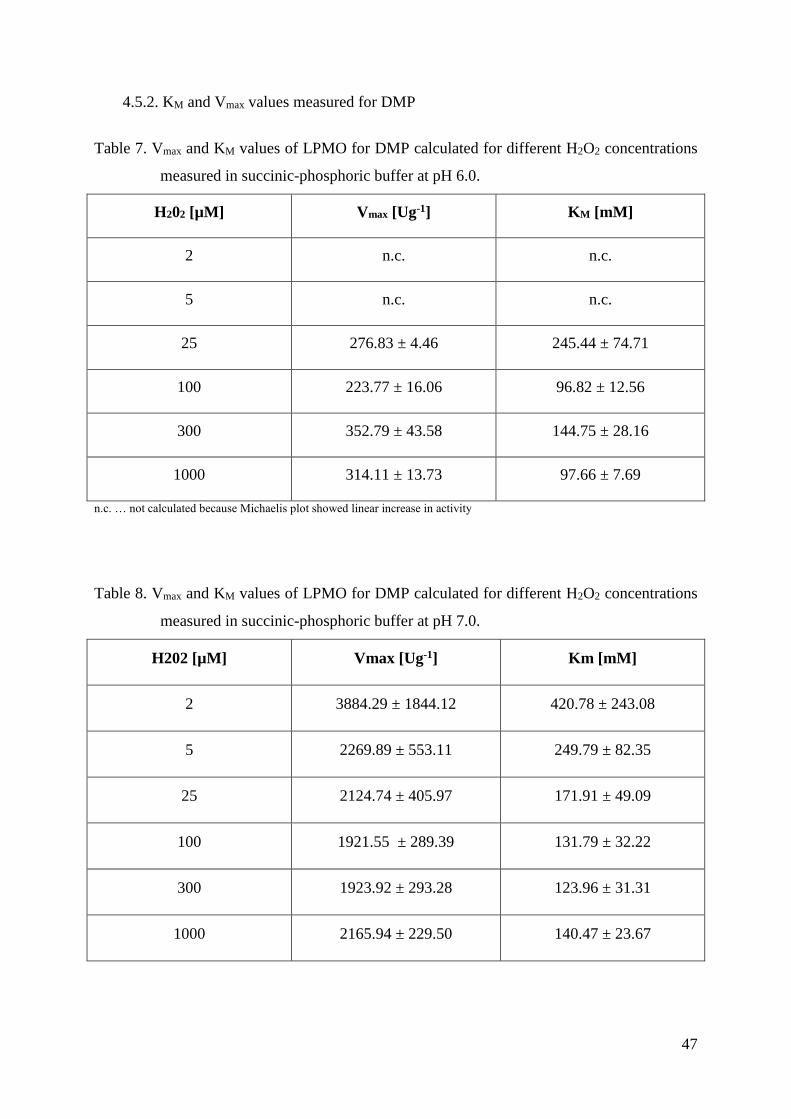
47
4.5.2. KM and Vmax values measured for DMP
Table 7. Vmax and KM values of LPMO for DMP calculated for different H2O2 concentrations
measured in succinic-phosphoric buffer at pH 6.0.
H202 [µM] Vmax [Ug-1] KM [mM]
2 n.c. n.c.
5 n.c. n.c.
25 276.83 ± 4.46 245.44 ± 74.71
100 223.77 ± 16.06 96.82 ± 12.56
300 352.79 ± 43.58 144.75 ± 28.16
1000 314.11 ± 13.73 97.66 ± 7.69
n.c. … not calculated because Michaelis plot showed linear increase in activity
Table 8. Vmax and KM values of LPMO for DMP calculated for different H2O2 concentrations
measured in succinic-phosphoric buffer at pH 7.0.
H202 [µM] Vmax [Ug-1] Km [mM]
2 3884.29 ± 1844.12 420.78 ± 243.08
5 2269.89 ± 553.11 249.79 ± 82.35
25 2124.74 ± 405.97 171.91 ± 49.09
100 1921.55 ± 289.39 131.79 ± 32.22
300 1923.92 ± 293.28 123.96 ± 31.31
1000 2165.94 ± 229.50 140.47 ± 23.67
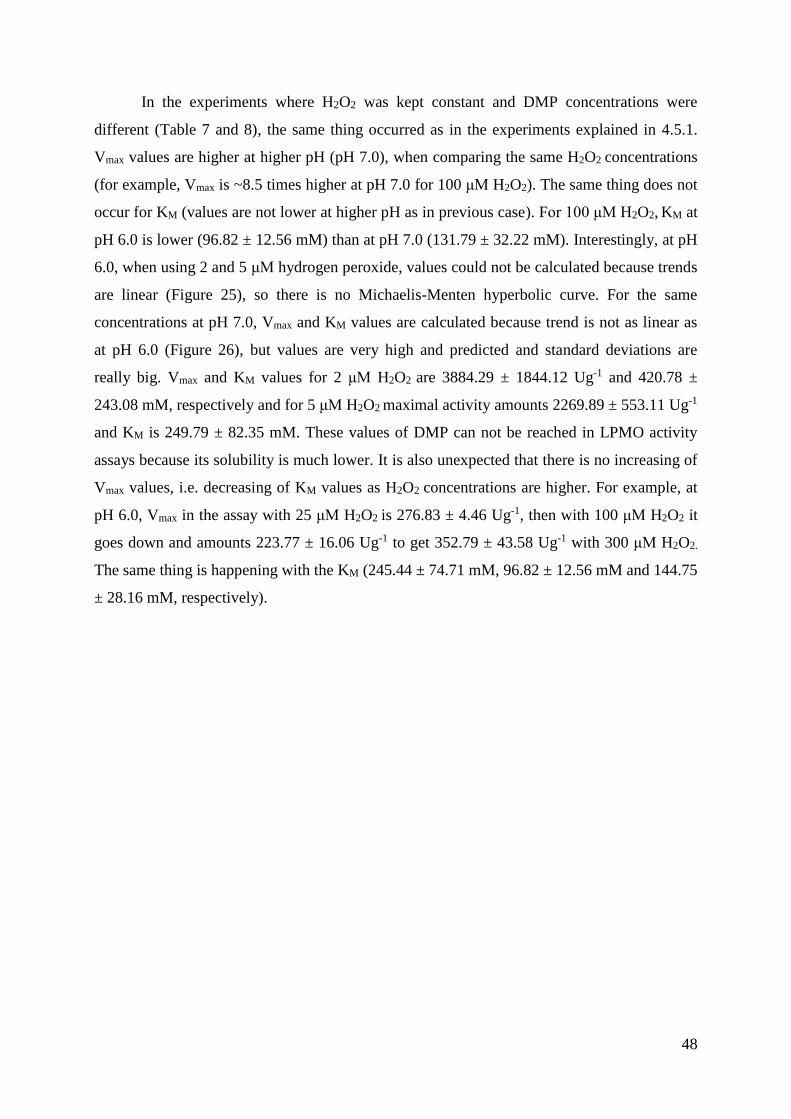
48
In the experiments where H2O2 was kept constant and DMP concentrations were
different (Table 7 and 8), the same thing occurred as in the experiments explained in 4.5.1.
Vmax values are higher at higher pH (pH 7.0), when comparing the same H2O2 concentrations
(for example, Vmax is ~8.5 times higher at pH 7.0 for 100 μM H2O2). The same thing does not
occur for KM (values are not lower at higher pH as in previous case). For 100 μM H2O2, KM at
pH 6.0 is lower (96.82 ± 12.56 mM) than at pH 7.0 (131.79 ± 32.22 mM). Interestingly, at pH
6.0, when using 2 and 5 μM hydrogen peroxide, values could not be calculated because trends
are linear (Figure 25), so there is no Michaelis-Menten hyperbolic curve. For the same
concentrations at pH 7.0, Vmax and KM values are calculated because trend is not as linear as
at pH 6.0 (Figure 26), but values are very high and predicted and standard deviations are
really big. Vmax and KM values for 2 μM H2O2 are 3884.29 ± 1844.12 Ug-1 and 420.78 ±
243.08 mM, respectively and for 5 μM H2O2 maximal activity amounts 2269.89 ± 553.11 Ug-1
and KM is 249.79 ± 82.35 mM. These values of DMP can not be reached in LPMO activity
assays because its solubility is much lower. It is also unexpected that there is no increasing of
Vmax values, i.e. decreasing of KM values as H2O2 concentrations are higher. For example, at
pH 6.0, Vmax in the assay with 25 μM H2O2 is 276.83 ± 4.46 Ug-1, then with 100 μM H2O2 it
goes down and amounts 223.77 ± 16.06 Ug-1 to get 352.79 ± 43.58 Ug-1 with 300 μM H2O2.
The same thing is happening with the KM (245.44 ± 74.71 mM, 96.82 ± 12.56 mM and 144.75
± 28.16 mM, respectively).
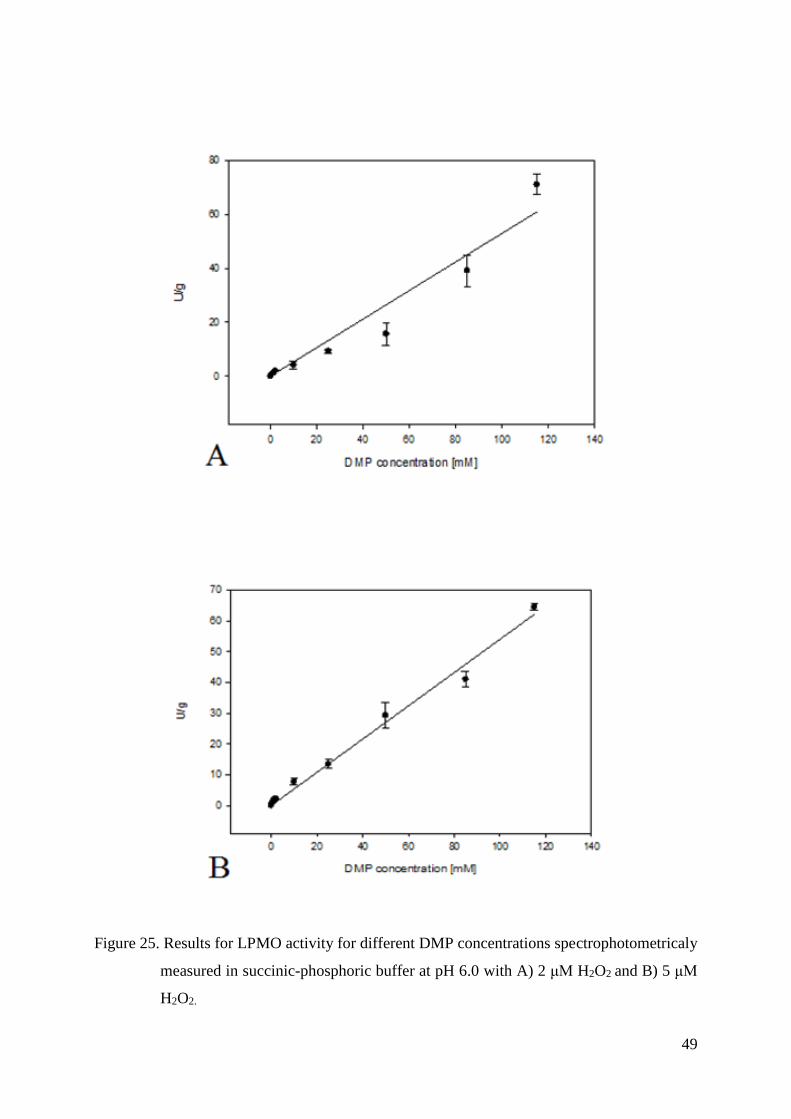
49
Figure 25. Results for LPMO activity for different DMP concentrations spectrophotometricaly
measured in succinic-phosphoric buffer at pH 6.0 with A) 2 μM H2O2 and B) 5 μM
H2O2.
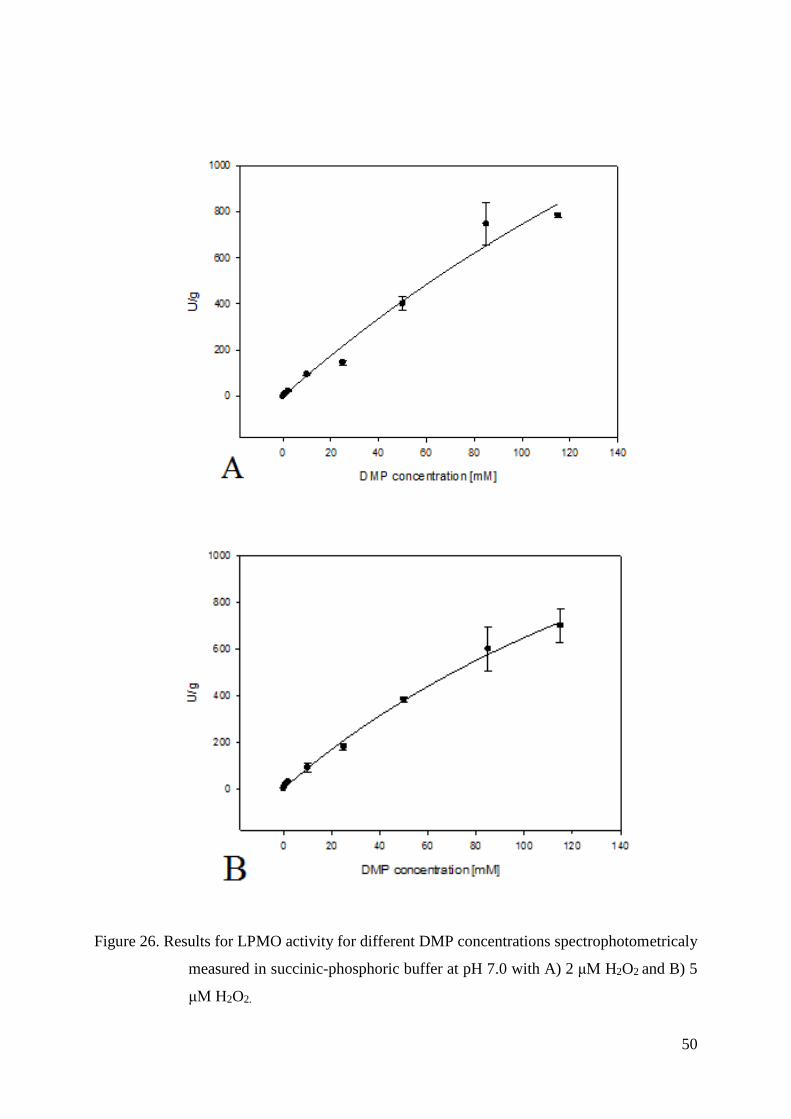
50
Figure 26. Results for LPMO activity for different DMP concentrations spectrophotometricaly
measured in succinic-phosphoric buffer at pH 7.0 with A) 2 μM H2O2 and B) 5
μM H2O2.
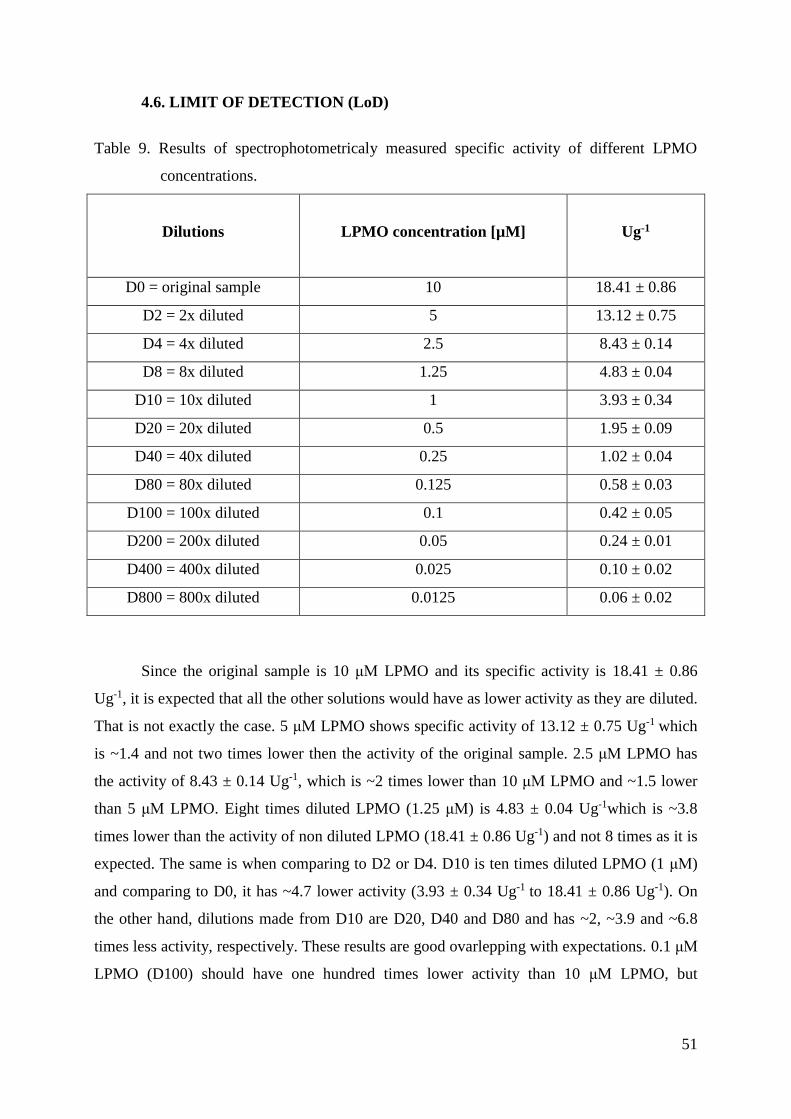
51
4.6. LIMIT OF DETECTION (LoD)
Table 9. Results of spectrophotometricaly measured specific activity of different LPMO
concentrations.
Dilutions
LPMO concentration [µM]
Ug-1
D0 = original sample 10 18.41 ± 0.86
D2 = 2x diluted 5 13.12 ± 0.75
D4 = 4x diluted 2.5 8.43 ± 0.14
D8 = 8x diluted 1.25 4.83 ± 0.04
D10 = 10x diluted 1 3.93 ± 0.34
D20 = 20x diluted 0.5 1.95 ± 0.09
D40 = 40x diluted 0.25 1.02 ± 0.04
D80 = 80x diluted 0.125 0.58 ± 0.03
D100 = 100x diluted 0.1 0.42 ± 0.05
D200 = 200x diluted 0.05 0.24 ± 0.01
D400 = 400x diluted 0.025 0.10 ± 0.02
D800 = 800x diluted 0.0125 0.06 ± 0.02
Since the original sample is 10 μM LPMO and its specific activity is 18.41 ± 0.86
Ug-1, it is expected that all the other solutions would have as lower activity as they are diluted.
That is not exactly the case. 5 μM LPMO shows specific activity of 13.12 ± 0.75 Ug-1 which
is ~1.4 and not two times lower then the activity of the original sample. 2.5 μM LPMO has
the activity of 8.43 ± 0.14 Ug-1, which is ~2 times lower than 10 μM LPMO and ~1.5 lower
than 5 μM LPMO. Eight times diluted LPMO (1.25 μM) is 4.83 ± 0.04 Ug-1which is ~3.8
times lower than the activity of non diluted LPMO (18.41 ± 0.86 Ug-1) and not 8 times as it is
expected. The same is when comparing to D2 or D4. D10 is ten times diluted LPMO (1 μM)
and comparing to D0, it has ~4.7 lower activity (3.93 ± 0.34 Ug-1 to 18.41 ± 0.86 Ug-1). On
the other hand, dilutions made from D10 are D20, D40 and D80 and has ~2, ~3.9 and ~6.8
times less activity, respectively. These results are good ovarlepping with expectations. 0.1 μM
LPMO (D100) should have one hundred times lower activity than 10 μM LPMO, but
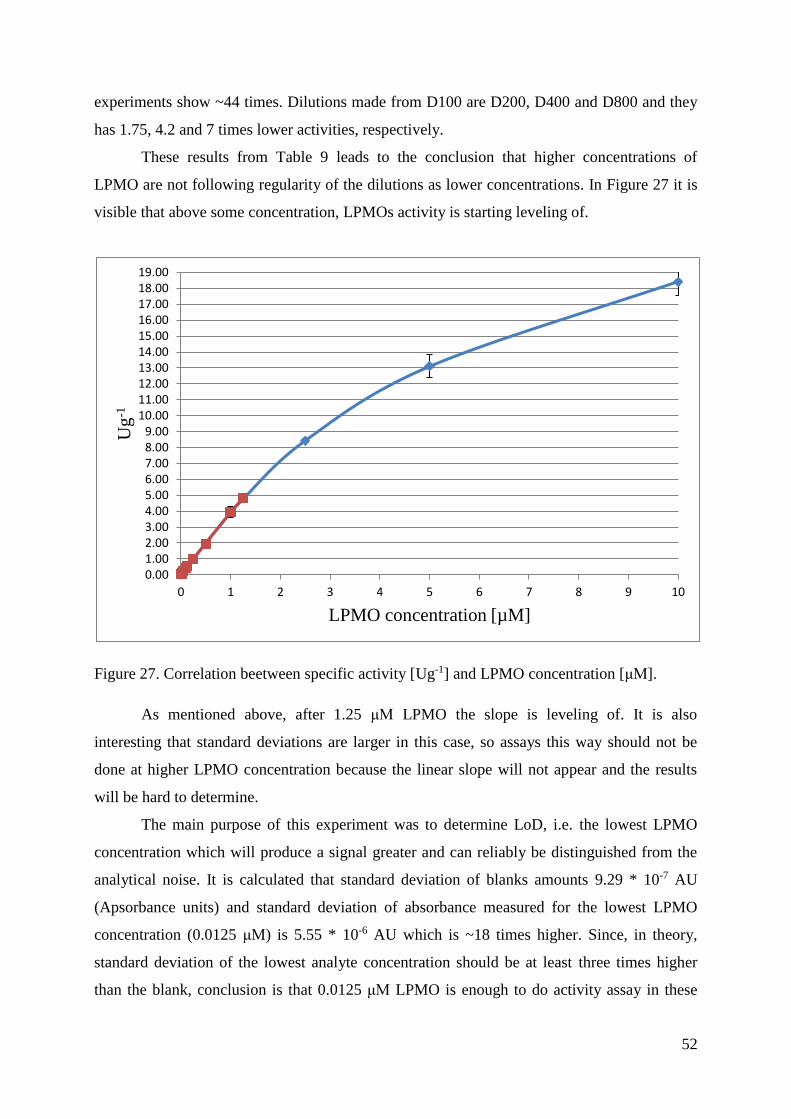
52
experiments show ~44 times. Dilutions made from D100 are D200, D400 and D800 and they
has 1.75, 4.2 and 7 times lower activities, respectively.
These results from Table 9 leads to the conclusion that higher concentrations of
LPMO are not following regularity of the dilutions as lower concentrations. In Figure 27 it is
visible that above some concentration, LPMOs activity is starting leveling of.
Figure 27. Correlation beetween specific activity [Ug-1] and LPMO concentration [μM].
As mentioned above, after 1.25 μM LPMO the slope is leveling of. It is also
interesting that standard deviations are larger in this case, so assays this way should not be
done at higher LPMO concentration because the linear slope will not appear and the results
will be hard to determine.
The main purpose of this experiment was to determine LoD, i.e. the lowest LPMO
concentration which will produce a signal greater and can reliably be distinguished from the
analytical noise. It is calculated that standard deviation of blanks amounts 9.29 * 10-7 AU
(Apsorbance units) and standard deviation of absorbance measured for the lowest LPMO
concentration (0.0125 μM) is 5.55 * 10-6 AU which is ~18 times higher. Since, in theory,
standard deviation of the lowest analyte concentration should be at least three times higher
than the blank, conclusion is that 0.0125 μM LPMO is enough to do activity assay in these
0.001.002.003.004.005.006.007.008.009.00
10.0011.0012.0013.0014.0015.0016.0017.0018.0019.00
0 1 2 3 4 5 6 7 8 9 10
Ug
-1
LPMO concentration [µM]
53
conditions. This concentration is the lowest to definitely detect LPMO activity, however, the
signal is very low and should only show in which range activity can be detected. For
measurements,the concentration of LPMO around 0.5 µM should be used.
54
5. CONCLUSIONS
1. In order to establish an activity assay for LPMO without using its natural
substrate, DMP manifested as the one compound that shows the best properties
(spectra is not affected by any other components of the assay) for detecting
LPMO activity. In the absence of H2O2 activity is much lower, which means
that hydrogen peroxide plays an important role as the LPMO co-substrate. On
the other hand, it must be added responsibly due to the inhibition effect at too
high concentrations. The best buffers for the assay are combinations of
succinic and phosphoric acid buffer and pyridine and imidazol buffer. Activity
can be determined in a very wide range of pH values ( from ~4.5 to ~8.0).
2. Because of the copper ion in its active site, LPMO can not withstand high
concentrations of EDTA. The same effect is with heat. After 30 minutes at
~100°C LPMO activity is lower about five times. What has to be considered
when working with LPMO is concentration of compounds with copper in the
solution because it is proven that their activity is increasing with concentration
and LPMO activity can be interpreted wrong if this is a case.
3. The activation energy for LPMO is 58.92 kJmol-1. This is the amount of energy
that is required to overcome the activation barrier in the conversion of reactants
into products.
4. According to results in calculations of KM and Vmax values, it is one more time
proven that hydrogen peroxide is a good co-substrate for LPMO. On the other
hand, DMP is not showing Michaelis-Menten curve, but it is linear as in non-
catalyzed reactions, which leads to conclusion it is not a natural substrate for
LPMO.
5. The highest LPMO concentration that should be used in activity assay is ~1.25
μM because all the tested concentrations above show deviation from linearity.
Contrary, the lowest LPMO concentration that can be used in assay is ~0.0125
μM.
55
6. REFERENCES
Aachmann, F. L., Sørlie, M., Skjåk-Bræk, G., Eijsink, V. G. H., Vaaje - Kolstad, G. (2012)
NMR structure of a lytic polysaccharide monooxygenase provides insight into copper
binding, protein dynamics, and substrate interactions. PNAS 109 (46), 18779 - 18784.
Adelakun, O. E., Kudanga, T., Green, I. R., Roes - Hill, M., Burton, S. G. (2012) Enzymatic
modification of 2,6 - Dimethoxyphenol for the synthesis of dimers with high antioxidant
capacity. Process Biochem. 47, 1923 - 1932.
Agger, J. W., Isaksen, T., Várnai, A., Vidal - Melgosa, S., Willats, W. G. T., Ludwig, R.,
Armbruster, D. A., Pry, T. (2008) Limit of Blank, Limit of Detection and Limit of
Quantitation. Clin. Biochem. 29, 49-52.
Beeson, W. T., Philips, C. M., Cate, J. H. D., Marletta, M. A. (2011) Oxidative Cleavage of
Cellulose by Fungal Copper-Dependent Polysaccharide Monooxygenases. J. Am. Chem. Soc.
134, 890-892.
Bissaro, B., Røhr, Å., Müller, G., Chylenski, P., Skaugen, M., Forsberg, Z., Horn, S. J., Vaaje
- Kolstad, G., Eijsink, V. G. H. (2017) Oxidative cleavage of polysaccharides by
monocopper enzymes depends on H2O2. Nat. Chem. Biol. 13, 1123 - 1128.
Bissaro, B., Røhr, Å., Skaugen, M., Forsberg, Z., Horn, S. J., Vaaje - Kolstad, G., Eijsink, V.
G. H. (2016) Fenton-type chemistry by a copper enzyme: molecular mechanism of
polysaccharide oxidative cleavage. bioRxiv beta: The preprint server for biology. doi:
https://doi.org/10.1101/097022
Borisova, A. S., Isaksen, T., Dimarogona, M., Kognole, A. A., Mathiesen, G., Várnai, A.,
Røhr, Å. K., Payne, C. M., Sørlie, M., Sandgren, M., Eijsink, V. G. H. (2015) Structural and
Functional Characterization of a Lytic Polysaccharide Monooxygenase with Broad Substrate
Specificity. J. Biol. Chem. 290 (38), 22955 - 22969.
Burns, R. G., Dick, R. P. (2002) Enzymes in the Environment: Activity, Ecology and
Application, Marcel Dekker, Inc., New York.
CAZy (2017) CAZy - Carbohydrate Active Enzyme, < http://www.cazy.org/> . Accesed 5
October 2017
56
Chen, H. (2014) Biotechnology of lignocelluloses: Theory and practice, Springer Science +
Bussines Media B.V., Dordrecht. doi: 10.1007/978-94-007-6898-7
Dimarogona, M., Topakas, E., Christakopoulos, P. (2012) Cellulose degradation by oxidative
enzymes. Computat. Struct. Biotechnol. J.l 2 (3), e201209015.
Dimarogona, M., Topakas, E., Christakopoulos, P. (2013) Recalcitrant polysaccharide
degradation by novel oxydative biocatalysts. Appl. Microbiol. Biotechnol. 97, 8455 - 8465.
doi: 10.1007/s00253-013-5197-y
Forsberg, Z., Vaje - Kolstad, G., Westereng, B., Zarah Forsberg, Gustav Vaaje-Kolstad,
Bjørge Westereng, Bunæs, A.,C., Stenstrøm, Y., MacKenzie, A., Sørlie, M., Horn, S. J.,
Eijsink, V. G., H. (2011) Cleavage of cellulose by a CBM33 protein. Protein Sci. 20, 1479 -
1483. doi: 10.1002/pro.689
Frandsen, K. E. H., Simmons, T. J., Dupree, P., Poulsen, J. - C. N., Hemsworth, G. R., Ciano,
L., Johnston, E. M., Tovborg, M., Johansen, K. S., von Freiesleben, P., Marmuse, L., Fort, S.,
Cottaz, S., Hugues, D., Henrissat, B., Lenfant, N., Tuna, F., Baldansuren, A., Davies, G. J.,
Leggio, L. L., Walton, P. H. (2016) the molecular basis of polysaccharide cleavage by lytic
polysaccharide monooxygenases. N. Chem. Bio. 12, 298 - 303. doi: 10.1038/nchembio.2029
Hemsworth, G. R., Davies, G. J., Walton, P. H. (2013) Recent insights into copper-containing
lytic polysaccharide monooxygenases. Curr. Opin. Struc. Biol. 23 (5), 660 - 668.
Hemsworth, G. R., Johnston, E. M., Davies, G. J., Walton, P. H. (2015) Lytic Pollysaccharide
Monooxygenases in Biomass Conversion. Trends. Biotechnol. 33 (12), 747 - 761.
Horn, S. J., Eijsink, V. G. H., Westereng, B. (2014) Discovery of LPMO activity on
hemicelluloses shows the importance of oxidative processes in plant cell wall degradation.
PNAS 111 (7), 6287 - 6292.
Horn, S. J., Vaaje - Kolstad, G., Westereng, B., Eijsink, V. G., H. (2012) Novel enzymes for
degradation of cellulose. Biotechnol. Biofuels, 5:45.
Ioelovich, M., Morag, E. (2012) Study of enzymatic hydrolysis of mild pretreated
lignocellulosic biomasses. BioResources 7 (1), 1040-1052.
Isaksen, T., Westereng, B., Aachman, F. L., Agger, J. W., Kracher, D., Kittl, R., Ludwig, R.,
Haltrich, D., Eijsink, V. G., H., Horn, S. J. (2014.) A C4 - oxidizing Lytic Polysaccharide
57
Monooxygenase Cleaving Both Cellulose and Cello - oligosaccharides. J. Biol. Chem. 289,
2632 - 2642.
Johansen, K. S. (2016) Lytic Polysaccharide Monooxygenases: The Microbial Power Tool for
Lignocellulose Degradation. Trends. Plant. Sci. 21 (11), 926 - 936.
Kittl, R., Kracher, D., Burgstaller, D., Haltrich, D., Ludwig, R. (2012) Production of four
Neurospora crassa lytic polysaccharide monooxygenases in Pichia pastoris monitored by a
fluorimetric assay. Biotechnol. Biofuels, 5:79.
Kobayashi, H., Fukuoka, A. (2013) Synthesis and utilisation of sugar compounds derived
from lignocellulosic biomass. Green Chem. 15, 1740 - 1763. doi: 10.1039/C3GC00060E
Loose, J. S. M., Forsberg, Z., Fraaije, M. W., Eijsink, V. G. H., Vaaje - Kolstad, G. (2014) A
rapid quantitative activity assay shows that the Vibrio cholera colonization factor GbpA is an
active lytic polysaccharide monooxygenase. FEBS Lett. 588, 3435-3440. doi:
10.1016/j.febslet.2014.07.036
Nelson, D. L., Cox, M. M. (2012) Lehninger Principles of Biochemistry, 6th ed., W. H.
Freeman, & Company, New York.
PDB (2017) An Information Portal to 134091 Biological Macromolecula Structure, PDB -
Protein Data Bank, < http://www.rcsb.org>. Accesed 9 October 2017.
Philips, C. M., Beeson, W. T., Cate, J. H., Marletta, M. A. (2011) Cellobiose Dehydrogenase
and a Copper-Dependent Polysaccharide Monooxygenase Potentiate Cellulose Degradation
by Neurospora crassa. ACS Chem. Biol. 6, 1399 - 1406.
Rinaudo, M. (2006) Chitin and chitosan: Properties and applications. Prog. Polym. Sci. 31 (7),
603 - 632.
Sluiter, J. B., Ruiz, R. O., Scarlata, C. J., Sluiter, A. D., Templeton, D. W. (2010)
Compositional analysis of lignocellulosic feedstocks, 1. Review and description of methods,
J. Agric. Food Chem. 58, 9043–9053.
Span, E. A., Marletta, M. A. (2015) The framework of polysaccharide monooxygenase
structure and chemistry. Curr. Opin. Struc. Biol. 35, 93-99.
58
Vaaje - Kolstad, G., Forsberg., Z., Loose, Jenifer, S. M., Bissaro, B., Eijsink, V. G. H. (2017)
Structural diversity of lytic polysaccharide monooxygenases. Curr. Opin. Struc. Biol. 44, 67 -
76.
Wariishi, H., Valli, K., Gold, M. H. (1992) Manganese(I1) Oxidation by Manganese
Peroxidase from the Basidiomycete Phanerochaete chrysosporium. J. Biol. Chem. 267 (33),
23689-23695.
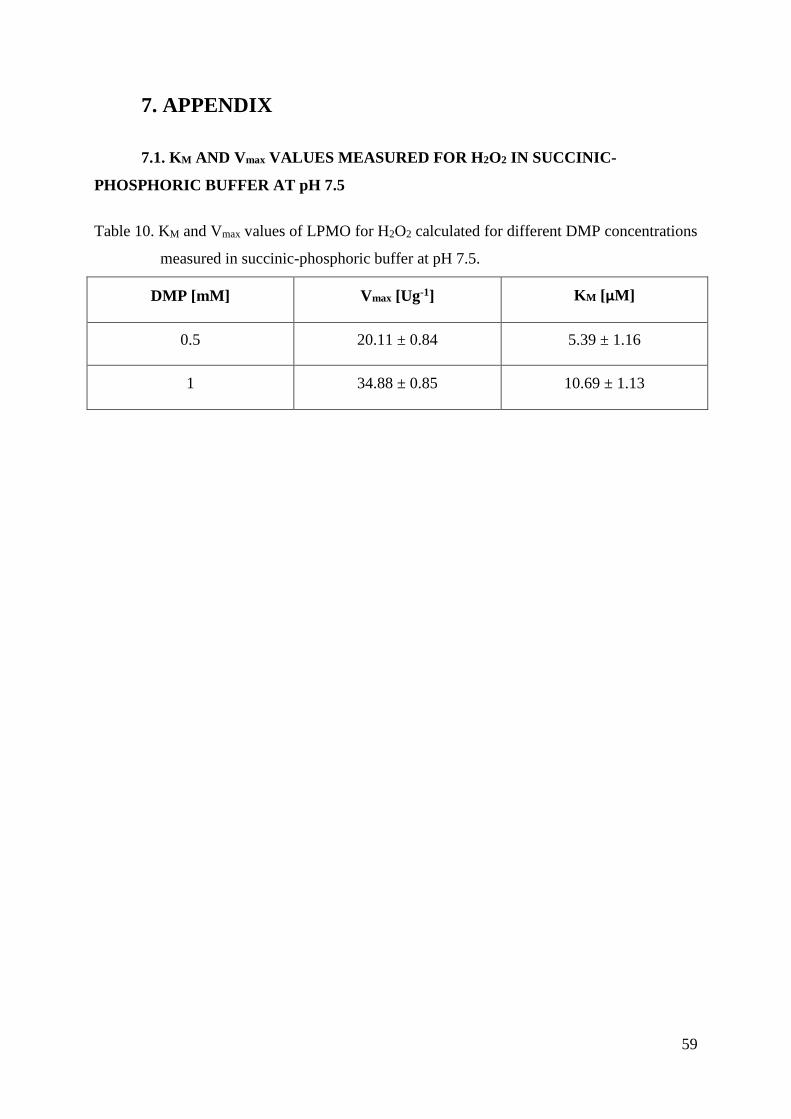
59
7. APPENDIX
7.1. KM AND Vmax VALUES MEASURED FOR H2O2 IN SUCCINIC-
PHOSPHORIC BUFFER AT pH 7.5
Table 10. KM and Vmax values of LPMO for H2O2 calculated for different DMP concentrations
measured in succinic-phosphoric buffer at pH 7.5.
DMP [mM] Vmax [Ug-1] KM [μM]
0.5 20.11 ± 0.84 5.39 ± 1.16
1 34.88 ± 0.85 10.69 ± 1.13
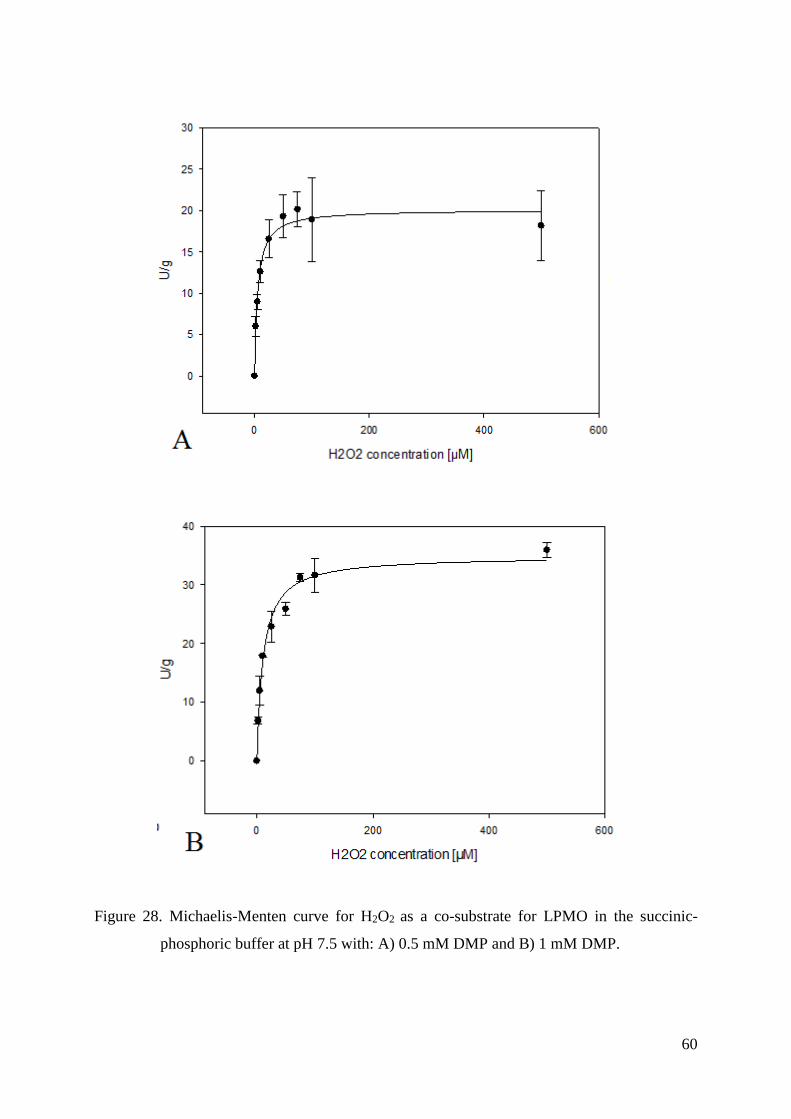
60
Figure 28. Michaelis-Menten curve for H2O2 as a co-substrate for LPMO in the succinic-
phosphoric buffer at pH 7.5 with: A) 0.5 mM DMP and B) 1 mM DMP.
61
7.2. LIST OF ABBREVIATIONS
AA Auxiliary activities
AU Apsorbance units
CBM Carbohydrate-binding module
CDH Cellobiose dehydrogenase
DMP 2,6-dimethoxyphenol
EDTA Ethylenediaminetetraacetic acid
GH Glycoside hydrolase
HPLC High performance liquid chromatography
LPMO(s) Lytic polysaccharide monooxygenase (s)


![Bioeconomy: Pectinases Purification and Application of ... · pollution control [1]. Pectinases are a group of enzymes involved in degradation of pectin, which includes various enzymes](https://img.pdfslide.us/doc/110x75/5f1a1ca86d1dc454fb018bbf/bioeconomy-pectinases-purification-and-application-of-pollution-control-1.jpg)