Embed Size (px)
Citation preview
LCI METHODOLOGYAND DATABASES
New and updated life cycle inventories for surfactantsused in European detergents: summary of the ERASM surfactantlife cycle and ecofootprinting project
Diederik Schowanek1& Tilly Borsboom-Patel2 & Alain Bouvy3 & John Colling4 &
Juan Antonio de Ferrer5 & Diana Eggers6 & Karsten Groenke7 & Thomas Gruenenwald8&
Johanna Martinsson9& Philip Mckeown10
& Bjoern Miller11 & Simon Moons12 &
Kate Niedermann13& Miguel Pérez14 & Christine Schneider15 & Jean-Francois Viot16
Received: 9 July 2015 /Accepted: 27 July 2017# The Author(s) 2017. This article is an open access publication
AbstractPurpose Cradle-to-gate life cycle inventories (LCIs) for theproduction of a series of common surfactants used inEuropean detergents and personal care products have beenvoluntarily compiled by 14 major companies collaboratingwithin ERASM (www.erasm.org). The study builds on asimilar project executed by CEFIC-Franklin (1994) andsummarised by Stalmans et al. (Tenside Surf Det 32:84–109, 1995). The data are targeted as an industry-agreed andrepresentative market average for surfactants in Europe forthe reference year 2011. The purpose of this paper is to
describe how these dataset were generated, to provide somesummary results and interpretation, and to indicate where thefull datasets and additional technical documentation can befound.Methods The methodology followed was an attributional lifecycle assessment (LCA) approach, compliant with LCA stan-dards ISO 14040 (2006), ISO 14044 (2006), and ILCD entrylevel (2010). For each major unit process in the production ofsurfactants and precursors, a minimum of three companies (a‘trio’) was identified. When no industry-specific data wereavailable, either literature or recent and reliable process data
Responsible editor: Chris Yuan
Electronic supplementary material The online version of this article(doi:10.1007/s11367-017-1384-x) contains supplementary material,which is available to authorized users.
* Diederik [email protected]
1 Procter & Gamble, Brussels Innvovation Centre, Temselaan 100,1853 Strombeek-Bever, Belgium
2 Shell Chemicals Europe BV, Weena 70, 3012CM Rotterdam, The Netherlands
3 CEFIC, The European Chemical Industry Council, Avenue E. VanNieuwenhuyse 4, 1160 Brussels, Belgium
4 Stepan Europe SAS, Chemin Jongkind, CS 20127, 38341 VoreppeCedex, France
5 CEPSAQUIMICA S.A., Fabrica de PuenteMayorga, Apdo. Correos40, 11360 San Roque, Cádiz, Spain
6 PE International AG (now thinkstep AG), Hauptstraße 111-113,70771 Leinfelden-Echterdingen, Germany
7 Evonik Industries AG, Bäkerpfad 25, 47805 Krefeld, Germany
8 BASF, SE, Carl-Bosch-Str. 38, 67056 Ludwigshafen, Germany9 Akzo Nobel Surface Chemistry, AB Stenunge Allé 3, 444
85 Stenungsund, Sweden10 Unilever Safety & Environmental Assurance Centre, Colworth
Science Park Sharnbrook, Bedford MK44 1LQ, UK11 Sasol Germany GmbH, Anckelmannsplatz 1,
20537 Hamburg, Germany12 Huntsman Performance Products, Everslaan 45,
3078 Everberg, Belgium13 Dow Chemical Company, Zurich, Switzerland14 Kao Chemicals Europe, Puig dels Tudons no. 10, 08210 Barberà del
Vallès, Barcelona, Spain15 Henkel AG & Co. KgaA, Henkelstrasse 67,
40589 Duesseldorf, Germany16 Solvay Research & Innovation, Centre Paris, 52 rue de la Haie Coq,
93308 Aubervilliers, Cedex, France
Int J Life Cycle AssessDOI 10.1007/s11367-017-1384-x
were used. For worldwide traded precursor materials like palmoil, palm kernel oil, and coconut oil, an extensive literature-based LCI study was performed. Two independent externalreviewers supported the project from the beginning throughcompletion. In addition, the oil palm and coconut- and tallow-based renewable precursors were reviewed by a third indepen-dent expert.Results and discussion In the study, a good level of represen-tativeness was achieved with 70 primary data collections in 12companies. To illustrate the outcome of the work, twoindicators/impacts were calculated and reported, i.e. primaryenergy demand (PED) and global warming potential (GWP).The LCIs allow the calculation of additional impact catego-ries, but these were not analysed within the scope of thisproject.
The PED for most of the surfactants and their precursors isin the range of 52 to 77 GJ/tonne. Exceptions are the produc-tion of cocamide diethanolamine (CDEA) and C16–C18triethanolamine esterquat (TEA-quat) with a PED of around40 GJ/tonne, and 3-dimethylaminopropylamine (DMAPA)around 108 GJ/tonne. Petrochemical precursors show an in-tensive but established and optimised supply chain. Wherecomparison is possible, their PED does not differ much fromthe earlier CEFIC-Franklin (1994) data. There are indicationsthat PED for surfactant production has decreased slightly overthe last 20 years due to energy efficiency measures.
The GWP for the reportable precursors ranges from− 1989 kg CO2e/tonne for Coconut Oil Methyl Ester to4894 kg CO2e/tonne for DMAPA. For the final surfactants,the range is from − 887 kg CO2e/tonne for CDEA to 2674 kgCO2e/tonne for C12–C15 AE3. There is a significant differ-ence between the cradle-to-gate GWP of the renewable pre-cursors palm oil/palm kernel oil (PO/PKO) and coconut oil(CNO). The CNO products have a calculated net negativecradle-to-gate GWP, while the PO/PKO products have a netpositive GWP. The latter is mainly attributable to the land usechange (LUC) factor and plantings on peat soils. Beef tallowalso has a net negative GWP of − 1529 kg CO2e/tonne. Thisvalue is very sensitive to the allocation choice.Conclusions The industry average LCI data and linked meta-data are made publically available as aggregated datasets inthree different formats (EcoSpold v.2, ILCD, and GaBi 62013). They benefit from increased methodologicalstandardisation and a more complete background process dataversus the CEFIC-Franklin (1994) study, but are thereforeonly partially comparable. It is recommended that the surfac-tant LCI data are used and interpreted in a finished productcradle-to-grave context.
Keywords ERASM . Global warming potential . Life cycleinventory . Oleochemicals . Petrochemicals . Primary energydemand . Renewables . Surfactants
1 Introduction
1.1 Study objectives and motivation
The Surfactant Life Cycle & Ecofootprinting (SLE) projectwas commissioned by ERASM1 with the objective to updateor establish cradle-to-gate life cycle inventories (LCIs) for aseries of commercially important surfactants and their precur-sors/intermediates, based on current surfactant productiontechnology (reference year 2011) and consistent high-qualitybackground data. The new LCI data are intended to supportthe increasing use of life cycle assessment (LCA) in industryas well as in various policy initiatives.
The SLE project builds upon an earlier, pioneering LCIproject which will be referenced further as the CEFIC-Franklin (1994) study. The full results and analysis of thisstudy were published in two special issues of the journalTenside Surfactants Detergents (2/95 and 5/95) under theheading of ‘European Life-Cycle Inventory for DetergentSurfactants Production’. The technical data reported thereinrefer to reference year 1992. A summary of the work wasprovided by Stalmans et al. (1995). Data from the CEFIC-Franklin (1994) study have been used extensively in industryLCA projects on cleaning products since 1995 and have alsobeen adopted by several public Life Cycle Inventory data-bases (e.g. ecoinvent, GaBi 2013).
Societal, regulatory, and commercial interests in the issueof climate change and carbon footprinting have significantlyincreased in recent years. In addition, multi-indicator ‘ProductEnvironmental Footprinting’ (PEF) calculation and commu-nication initiatives for fast-moving consumer goods (FMCG)are being developed. The European detergent and surfactantindustries are engaged in testing schemes such as the pilotproject on Product Environmental Footprinting CategoryRules (PEFCR), launched by the European Commission(PEF Guidance 2014; http://ec.europa.eu/environment/eussd/smgp/product_footprint.htm). Recognizing that the LCI datafor the production of surfactants were getting outdated andwere unlikely to meet existing stringent data quality andrepresentativeness requirements, ERASM initiated the SLEproject to ensure data continuity for the sector, as well as tocover some additional types of surfactants for which no LCIdata were previously available. Fourteen major industrialcompanies active as surfactant producers and/or formulatorshave collaborated to collect unit process data from their plants,in order to produce representative LCIs for surfactant produc-tion. The project was technically led by the LCA consultantPE International (now thinkstep), who also acted as a neutral
1 ERASM: Environmental & Health Risk Assessment and Management ofSurfactants, a research partnership of the European Detergents andSurfactants Industries: A.I.S.E., the international Association for Soaps,Detergents and Maintenance Products, and CESIO, the European Committeeof Organic Surfactants and their Intermediates (www.erasm.org).
Int J Life Cycle Assess
interface between the companies and ensured data handlingconfidentiality. Administrative and financial support was pro-vided by ERASM, operating under CEFIC.2 The practicalfeasibility and exact project scope were developed during apilot project (ERASM SLE 2011).
1.2 Intended application and use of the data
The purpose of this paper is to present the context, approach,key results, and conclusions from the ERASM SLE project. Itis not the intention to deliver with this paper full technical(process) details or the final datasets. These are made publi-cally available via other channels (see Section 5).
The LCI datasets are released in a series of state-of-the-artdata formats (i.e. ILCD, EcoSpold v2, GaBi) which can beimported into LCA software systems. The LCIs generated inthis project are positioned as market-average benchmark LCIdata for surfactants used on the European market for refer-ence year 2011. The LCI calculations are compliant with theinternational LCA standards ISO 14040 (2006a) and ISO14044 (2006b). In addition, the study follows the ILCD(2010) handbook and the decision context C2. The latter isused for the development of specific, average, or generic unitprocess or LCI datasets for use in different applications, andfollows an accounting approach with no reference to any po-tential benefits outside the analysed system. The datasets areintended to provide a perspective on the environmental qualityand impact of the production of the different surfactants.Appropriate caution and nuance is needed when comparingsurfactants amongst each other, or when comparing to similarsources of data. In this study, results refer to a functional (ordeclared) unit of 1000 kg active substance (1 metric tonne).However, this does not imply that the different surfactants areactually used in real product systems in identical amounts, orcan be freely substituted. Also, the SLE data were collectedaccording to certain methodological principles or choices (seefurther), which may not be identical to other studies. This alsoapplies to any comparison effort of the current data versus theCEFIC-Franklin (1994) work, especially since LCI and lifecycle impact assessment (LCIA) methodologies have under-gone a significant evolution and further standardisation.
1.3 Presentation of the results
The objective of the ERASM SLE project was to preparesurfactant LCI datasets of the best quality practically achiev-able. No emissions were actively excluded from the inventory,and to the knowledge of the authors, all emission flows wereincluded. LCIA was not conducted for two main reasons:firstly, the science of the impact assessment methodology fora number of impact categories is still highly dynamic, which
may cause the results to be quickly outdated; secondly, thesurfactant data should preferably be used in the context of afull, cradle-to-grave, product system. For information and il-lustration purposes, only the total primary energy demand(PED) and global warming potential (GWP) indicators arepresented in the paper. PED is shown as this was an indicatorused in the original CEFIC-Franklin (1994) study. The GWPresults are of interest to many stakeholders and are calculatedusing current methodologies. The SLE LCI datasets also con-tain the necessary information to calculate several other im-pact categories according to the user’s preferred impact meth-od. Especially, the following impacts methods published inthe handbook of LCA (Guinée et al. 2002) and known as theCML method were tested to be functional: depletion of non-renewable resources, global warming potential (climatechange), eutrophication, acidification, and photochemicalsmog. Additionally, the LCI datasets enable an evaluation ofhuman and ecotoxicity employing the USEtox (Rosenbaumet al. 2008) characterisation model. Other environmental indi-cators can be assessed with these LCIs, but results have to betreated more carefully than the above ones for the intendedapplication. Social, economic, and other themes like noise,odour, and biodiversity impacts were not considered.
1.4 Peer review
ERASM, as an organisation, aims to release high-quality sci-entific information about surfactants and has no direct com-mercial interest in the results. The ERASM SLE study meetsthe ISO requirements for critical review. It was opted to workwith an accompanying critical review process allowing thereviewers to influence the choices and methodologies alongthe project, thereby minimizing the need for rework or con-cerns at the final stages. The independent experts performingthe review process were Prof. Dr. Walter Kloepffer (LCAConsultant & Review); Dr. Yannick Leguern and Dr.Charlotte Petiot (Bio-IS by Deloitte). They accompanied theproject from start to finish. In addition, Dr. Jannick Schmidt(Aarhus University and 2.-0 Consultants) was engaged as ex-pert to specifically review the work on the renewable precur-sors palm oil, palm kernel oil, and coconut oil, in addition tothe land use change (LUC) methodologies.
2 Methodology
2.1 Goal and scope
The main goals of the study were to update the existing LCIdatasets (CEFIC-Franklin 1994) for the production of majorsurfactants and their main precursors/intermediates, as well asto generate new inventories for a selection of market-relevantsurfactants not yet covered. A total of 32 LCIs (15 surfactants2 CEFIC: the European Chemical Industry Council (www.cefic.org).
Int J Life Cycle Assess
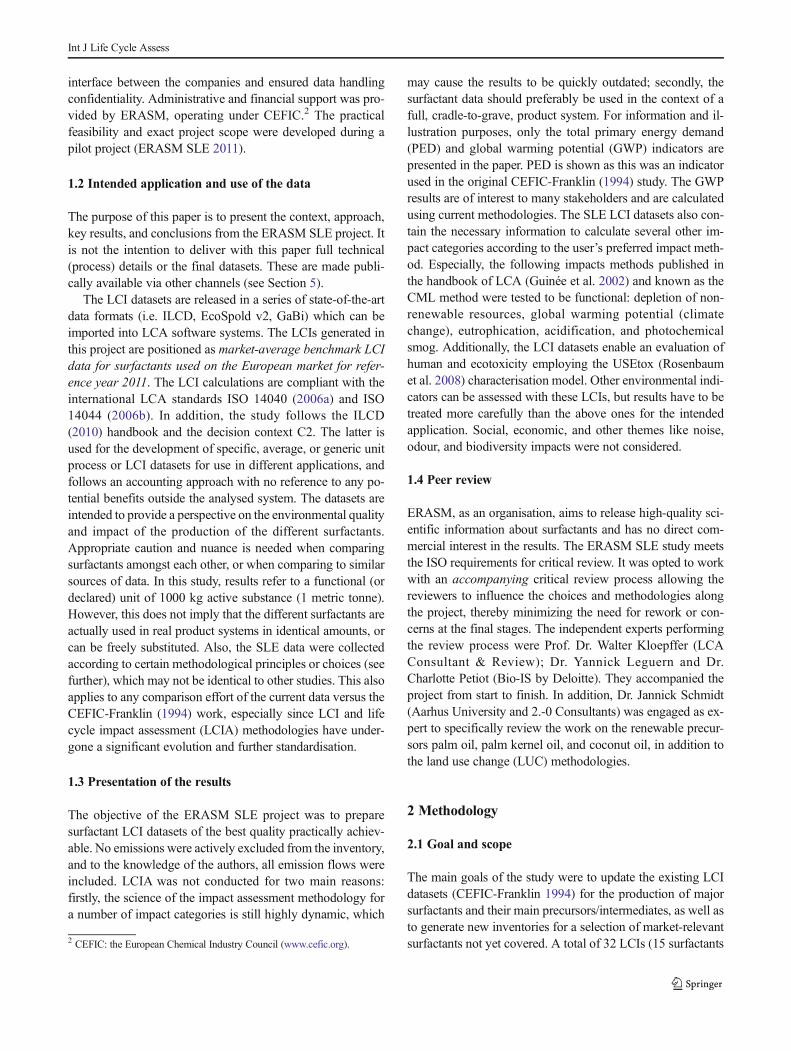
and 17 precursors) were generated as depicted in (Fig. 1).Where possible, a time-trend analysis was performed in orderto assess process efficiency progress in industry. In addition,individual companies generated LCI datasets for their ownproduction sites based on their data submitted to theconsultant.
Although for each LCI the typical final step of a full envi-ronmental impact assessment is not performed, the require-ments of the usual LCIA methodologies were taken into ac-count during data collection and in the LCI preparation. Indoing so, each user has the flexibility to choose an appropriateimpact assessment methodology to evaluate their results whenmaking use of the LCIs generated in this project.
2.2 Functional unit and substances covered
The functional unit is a ‘quantified performance of a productsystem for use as a reference unit’ in a life cycle assessmentstudy (ISO 14040, 2006a; ISO 14044, 2006b). Forapplication-unspecific materials as well as for multiple usemachines, the number of possible applications and functionalunits are often extremely large to virtually indefinite. This isthe case for the current study. In agreement with the projectconsortium and following the reference unit used in theCEFIC-Franklin 1994 study, the term ‘declared unit’ is used,and the reference flow fitting the purposes of this study wasfixed as one thousand kilogramme (1000 kg) of surfactantactive ingredient, or chosen precursors and intermediates.Within the study, the declared unit of each product includes
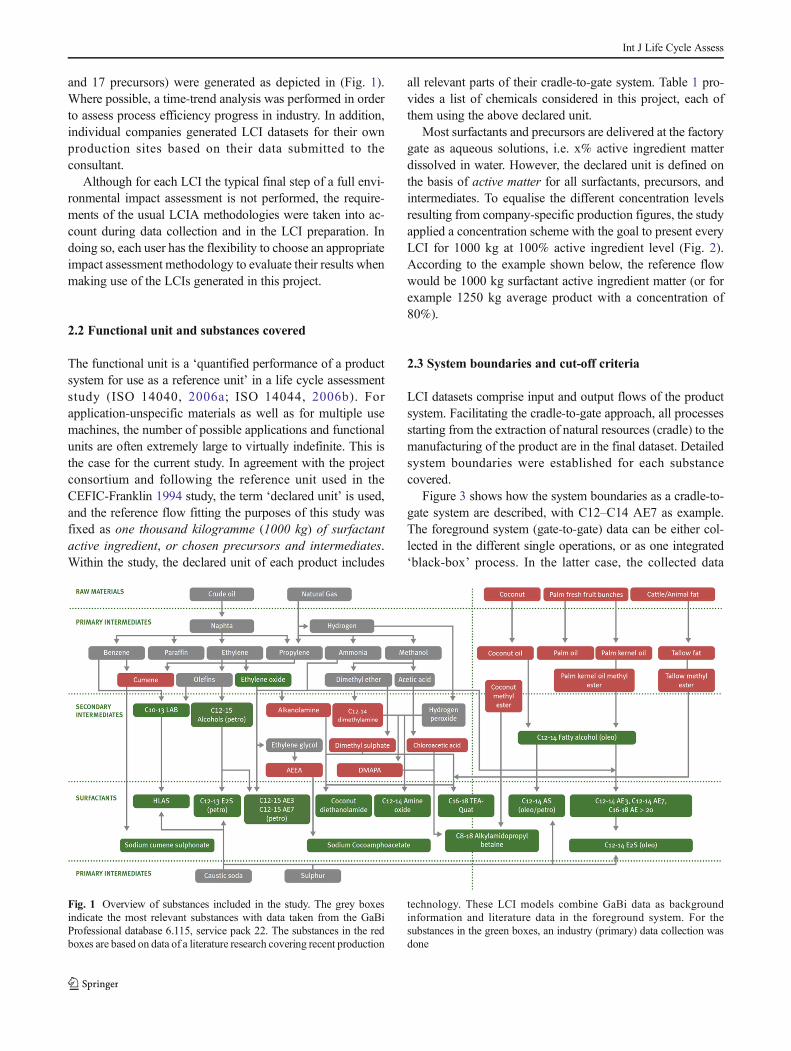
all relevant parts of their cradle-to-gate system. Table 1 pro-vides a list of chemicals considered in this project, each ofthem using the above declared unit.
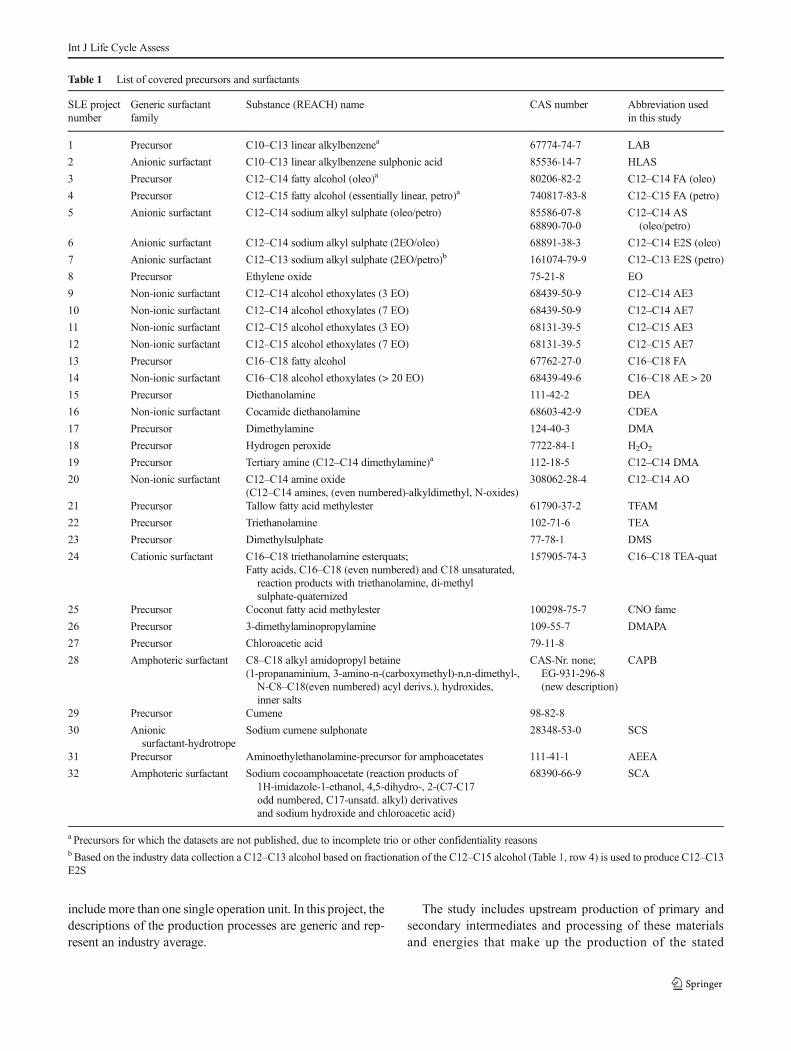
Most surfactants and precursors are delivered at the factorygate as aqueous solutions, i.e. x% active ingredient matterdissolved in water. However, the declared unit is defined onthe basis of active matter for all surfactants, precursors, andintermediates. To equalise the different concentration levelsresulting from company-specific production figures, the studyapplied a concentration scheme with the goal to present everyLCI for 1000 kg at 100% active ingredient level (Fig. 2).According to the example shown below, the reference flowwould be 1000 kg surfactant active ingredient matter (or forexample 1250 kg average product with a concentration of80%).
2.3 System boundaries and cut-off criteria
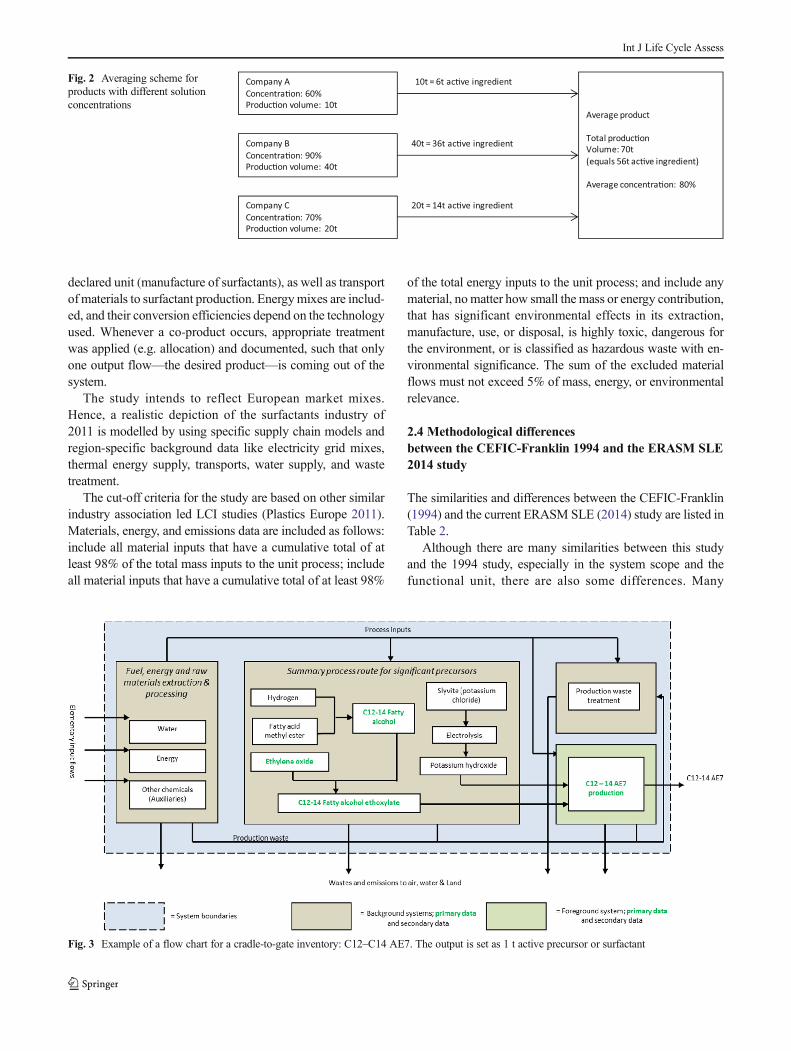
LCI datasets comprise input and output flows of the productsystem. Facilitating the cradle-to-gate approach, all processesstarting from the extraction of natural resources (cradle) to themanufacturing of the product are in the final dataset. Detailedsystem boundaries were established for each substancecovered.
Figure 3 shows how the system boundaries as a cradle-to-gate system are described, with C12–C14 AE7 as example.The foreground system (gate-to-gate) data can be either col-lected in the different single operations, or as one integrated‘black-box’ process. In the latter case, the collected data
Fig. 1 Overview of substances included in the study. The grey boxesindicate the most relevant substances with data taken from the GaBiProfessional database 6.115, service pack 22. The substances in the redboxes are based on data of a literature research covering recent production
technology. These LCI models combine GaBi data as backgroundinformation and literature data in the foreground system. For thesubstances in the green boxes, an industry (primary) data collection wasdone
Int J Life Cycle Assess
include more than one single operation unit. In this project, thedescriptions of the production processes are generic and rep-resent an industry average.
The study includes upstream production of primary andsecondary intermediates and processing of these materialsand energies that make up the production of the stated
Table 1 List of covered precursors and surfactants
SLE projectnumber
Generic surfactantfamily
Substance (REACH) name CAS number Abbreviation usedin this study
1 Precursor C10–C13 linear alkylbenzenea 67774-74-7 LAB
2 Anionic surfactant C10–C13 linear alkylbenzene sulphonic acid 85536-14-7 HLAS
3 Precursor C12–C14 fatty alcohol (oleo)a 80206-82-2 C12–C14 FA (oleo)
4 Precursor C12–C15 fatty alcohol (essentially linear, petro)a 740817-83-8 C12–C15 FA (petro)
5 Anionic surfactant C12–C14 sodium alkyl sulphate (oleo/petro) 85586-07-868890-70-0
C12–C14 AS(oleo/petro)
6 Anionic surfactant C12–C14 sodium alkyl sulphate (2EO/oleo) 68891-38-3 C12–C14 E2S (oleo)
7 Anionic surfactant C12–C13 sodium alkyl sulphate (2EO/petro)b 161074-79-9 C12–C13 E2S (petro)
8 Precursor Ethylene oxide 75-21-8 EO
9 Non-ionic surfactant C12–C14 alcohol ethoxylates (3 EO) 68439-50-9 C12–C14 AE3
10 Non-ionic surfactant C12–C14 alcohol ethoxylates (7 EO) 68439-50-9 C12–C14 AE7
11 Non-ionic surfactant C12–C15 alcohol ethoxylates (3 EO) 68131-39-5 C12–C15 AE3
12 Non-ionic surfactant C12–C15 alcohol ethoxylates (7 EO) 68131-39-5 C12–C15 AE7
13 Precursor C16–C18 fatty alcohol 67762-27-0 C16–C18 FA
14 Non-ionic surfactant C16–C18 alcohol ethoxylates (> 20 EO) 68439-49-6 C16–C18 AE > 20
15 Precursor Diethanolamine 111-42-2 DEA
16 Non-ionic surfactant Cocamide diethanolamine 68603-42-9 CDEA
17 Precursor Dimethylamine 124-40-3 DMA
18 Precursor Hydrogen peroxide 7722-84-1 H2O2
19 Precursor Tertiary amine (C12–C14 dimethylamine)a 112-18-5 C12–C14 DMA
20 Non-ionic surfactant C12–C14 amine oxide(C12–C14 amines, (even numbered)-alkyldimethyl, N-oxides)
308062-28-4 C12–C14 AO
21 Precursor Tallow fatty acid methylester 61790-37-2 TFAM
22 Precursor Triethanolamine 102-71-6 TEA
23 Precursor Dimethylsulphate 77-78-1 DMS
24 Cationic surfactant C16–C18 triethanolamine esterquats;Fatty acids, C16–C18 (even numbered) and C18 unsaturated,
reaction products with triethanolamine, di-methylsulphate-quaternized
157905-74-3 C16–C18 TEA-quat
25 Precursor Coconut fatty acid methylester 100298-75-7 CNO fame
26 Precursor 3-dimethylaminopropylamine 109-55-7 DMAPA
27 Precursor Chloroacetic acid 79-11-8
28 Amphoteric surfactant C8–C18 alkyl amidopropyl betaine(1-propanaminium, 3-amino-n-(carboxymethyl)-n,n-dimethyl-,
N-C8–C18(even numbered) acyl derivs.), hydroxides,inner salts
CAS-Nr. none;EG-931-296-8(new description)
CAPB
29 Precursor Cumene 98-82-8
30 Anionicsurfactant-hydrotrope
Sodium cumene sulphonate 28348-53-0 SCS
31 Precursor Aminoethylethanolamine-precursor for amphoacetates 111-41-1 AEEA
32 Amphoteric surfactant Sodium cocoamphoacetate (reaction products of1H-imidazole-1-ethanol, 4,5-dihydro-, 2-(C7-C17odd numbered, C17-unsatd. alkyl) derivativesand sodium hydroxide and chloroacetic acid)
68390-66-9 SCA
a Precursors for which the datasets are not published, due to incomplete trio or other confidentiality reasonsb Based on the industry data collection a C12–C13 alcohol based on fractionation of the C12–C15 alcohol (Table 1, row 4) is used to produce C12–C13E2S
Int J Life Cycle Assess
declared unit (manufacture of surfactants), as well as transportof materials to surfactant production. Energymixes are includ-ed, and their conversion efficiencies depend on the technologyused. Whenever a co-product occurs, appropriate treatmentwas applied (e.g. allocation) and documented, such that onlyone output flow—the desired product—is coming out of thesystem.
The study intends to reflect European market mixes.Hence, a realistic depiction of the surfactants industry of2011 is modelled by using specific supply chain models andregion-specific background data like electricity grid mixes,thermal energy supply, transports, water supply, and wastetreatment.
The cut-off criteria for the study are based on other similarindustry association led LCI studies (Plastics Europe 2011).Materials, energy, and emissions data are included as follows:include all material inputs that have a cumulative total of atleast 98% of the total mass inputs to the unit process; includeall material inputs that have a cumulative total of at least 98%
of the total energy inputs to the unit process; and include anymaterial, nomatter how small the mass or energy contribution,that has significant environmental effects in its extraction,manufacture, use, or disposal, is highly toxic, dangerous forthe environment, or is classified as hazardous waste with en-vironmental significance. The sum of the excluded materialflows must not exceed 5% of mass, energy, or environmentalrelevance.
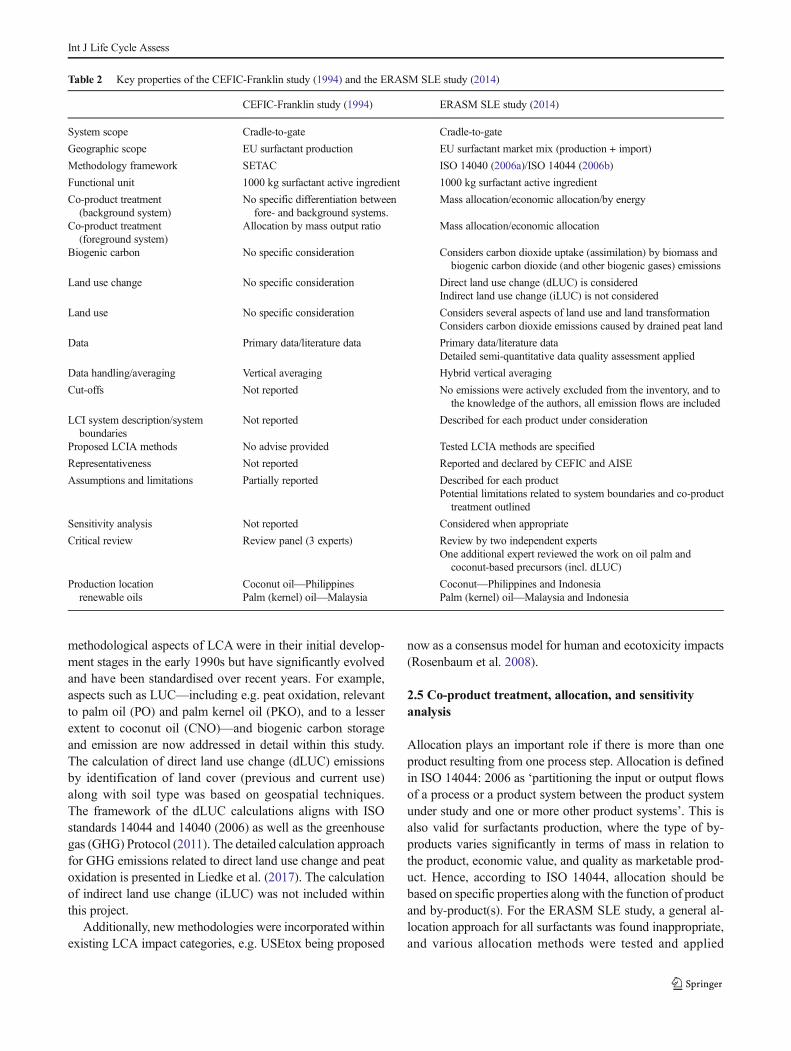
2.4 Methodological differencesbetween the CEFIC-Franklin 1994 and the ERASM SLE2014 study
The similarities and differences between the CEFIC-Franklin(1994) and the current ERASM SLE (2014) study are listed inTable 2.
Although there are many similarities between this studyand the 1994 study, especially in the system scope and thefunctional unit, there are also some differences. Many
Fig. 3 Example of a flow chart for a cradle-to-gate inventory: C12–C14 AE7. The output is set as 1 t active precursor or surfactant
Company AConcentra�on: 60%Produc�on volume: 10t
Company BConcentra�on: 90%Produc�on volume: 40t
Company CConcentra�on: 70%Produc�on volume: 20t
Average product
Total produc�onVolume: 70t(equals 56t ac�ve ingredient)
Average concentra�on: 80%
10t = 6t ac�ve ingredient
40t = 36t ac�ve ingredient
20t = 14t ac�ve ingredient
Fig. 2 Averaging scheme forproducts with different solutionconcentrations
Int J Life Cycle Assess
methodological aspects of LCAwere in their initial develop-ment stages in the early 1990s but have significantly evolvedand have been standardised over recent years. For example,aspects such as LUC—including e.g. peat oxidation, relevantto palm oil (PO) and palm kernel oil (PKO), and to a lesserextent to coconut oil (CNO)—and biogenic carbon storageand emission are now addressed in detail within this study.The calculation of direct land use change (dLUC) emissionsby identification of land cover (previous and current use)along with soil type was based on geospatial techniques.The framework of the dLUC calculations aligns with ISOstandards 14044 and 14040 (2006) as well as the greenhousegas (GHG) Protocol (2011). The detailed calculation approachfor GHG emissions related to direct land use change and peatoxidation is presented in Liedke et al. (2017). The calculationof indirect land use change (iLUC) was not included withinthis project.
Additionally, new methodologies were incorporated withinexisting LCA impact categories, e.g. USEtox being proposed
now as a consensus model for human and ecotoxicity impacts(Rosenbaum et al. 2008).
2.5 Co-product treatment, allocation, and sensitivityanalysis
Allocation plays an important role if there is more than oneproduct resulting from one process step. Allocation is definedin ISO 14044: 2006 as ‘partitioning the input or output flowsof a process or a product system between the product systemunder study and one or more other product systems’. This isalso valid for surfactants production, where the type of by-products varies significantly in terms of mass in relation tothe product, economic value, and quality as marketable prod-uct. Hence, according to ISO 14044, allocation should bebased on specific properties along with the function of productand by-product(s). For the ERASM SLE study, a general al-location approach for all surfactants was found inappropriate,and various allocation methods were tested and applied
Table 2 Key properties of the CEFIC-Franklin study (1994) and the ERASM SLE study (2014)
CEFIC-Franklin study (1994) ERASM SLE study (2014)
System scope Cradle-to-gate Cradle-to-gate
Geographic scope EU surfactant production EU surfactant market mix (production + import)
Methodology framework SETAC ISO 14040 (2006a)/ISO 14044 (2006b)
Functional unit 1000 kg surfactant active ingredient 1000 kg surfactant active ingredient
Co-product treatment(background system)
No specific differentiation betweenfore- and background systems.
Allocation by mass output ratio
Mass allocation/economic allocation/by energy
Co-product treatment(foreground system)
Mass allocation/economic allocation
Biogenic carbon No specific consideration Considers carbon dioxide uptake (assimilation) by biomass andbiogenic carbon dioxide (and other biogenic gases) emissions
Land use change No specific consideration Direct land use change (dLUC) is consideredIndirect land use change (iLUC) is not considered
Land use No specific consideration Considers several aspects of land use and land transformationConsiders carbon dioxide emissions caused by drained peat land
Data Primary data/literature data Primary data/literature dataDetailed semi-quantitative data quality assessment applied
Data handling/averaging Vertical averaging Hybrid vertical averaging
Cut-offs Not reported No emissions were actively excluded from the inventory, and tothe knowledge of the authors, all emission flows are included
LCI system description/systemboundaries
Not reported Described for each product under consideration
Proposed LCIA methods No advise provided Tested LCIA methods are specified
Representativeness Not reported Reported and declared by CEFIC and AISE
Assumptions and limitations Partially reported Described for each productPotential limitations related to system boundaries and co-product
treatment outlined
Sensitivity analysis Not reported Considered when appropriate
Critical review Review panel (3 experts) Review by two independent expertsOne additional expert reviewed the work on oil palm and
coconut-based precursors (incl. dLUC)
Production locationrenewable oils
Coconut oil—PhilippinesPalm (kernel) oil—Malaysia
Coconut—Philippines and IndonesiaPalm (kernel) oil—Malaysia and Indonesia
Int J Life Cycle Assess
individually for each production system to reflect as much aspossible industry reality. Rebitzer et al. (2004), Russel et al.(2005), and Curran (2007) provide a more detailed analysis onthe issue of allocation in LCA.
Allocation was applied to fore- and background systemswithin the study. Three allocation approaches were used inthe context of background systems, i.e. mass allocation, eco-nomic allocation, or allocation by energy. Additionally, massallocation and economic allocation were used for foregroundsystems. Where possible and reasonable, mass allocation waspreferred (see further).
Changes to the results which would occur if anotherallocation type was applied in the foreground system werecovered via a sensitivity analysis. This was done by com-paring alternative scenarios (see Section 3.5). Mass allo-cation was applied if a mass ratio is fixed by processingor stoichiometry, and the price relation of product and co-product reflects the mass ratio up to ± 3%. In some cases,the price structure of product and co-products shows avery different picture from the mass structure, e.g. forethanolamines and beef tallow. For these products, eco-nomic (price) allocation was applied, which assumes thatthe demand of the described substances is sufficientlystable, and no major change in demand is expected inthe near future.
2.6 Data handling, confidentiality, and quality
The primary data collection phase included more than 60 pro-duction lines. Aweb-based tool provided by PE Internationalsupported the data collection process. A technical flow chartwas set up for each production technology to ensure a suffi-cient process understanding for the data collection. In thisstep, particular focus was given to ensuring a similar level ofdetail, e.g. number of unit processes for a precursor or surfac-tant. Based on the flow charts, data questionnaires were set upin a SoFi-based tool (SoFi Software 2007-2016). This is aweb-based software platform that allows users to enter databy using their standard web browser and to review or validatetheir data. All participating users followed the same standardsand guidance, to achieve the most consistent data. Followingthe data entry, the LCA practitioner inspected the entered in-formation regarding mass and energy balance, emissions stoi-chiometry, yields, energy efficiency, co-products, recoveredsubstances or energy, and wastes.
Special attention was required to meet the confidentialityrequirements of all participating companies as well as industrycompetition rules. So-called ‘trios’were created for every pre-cursor and product, i.e. at least three companies were requiredto share relevant process data. In some cases, primary data forcertain precursors were available from less than three compa-nies. In these cases, the LCI data were used within the surfac-tants LCI but were not published. The data collection aimed to
set up company-specific production pathways taking into ac-count relevant technologies, individual supply chain paths,and region-specific energy supply (e.g. grid mixes) and ther-mal energy supply. Each production pathway, composed ofprecursor and surfactant unit processes, was aggregated verti-cally to reflect the individual company-specific reality. Thevertical aggregation of production pathways formscompany-specific LCIs. These LCIs were averaged by usingname-plate production capacities provided confidentially byeach study participant. This aggregation and averaging meth-od is in line with the UNEP ‘Shonan guidance principles’(UNEP 2011).
It is recognised that the delivery of aggregated LCIs, like inthis study, has positive and negative aspects. The SLE projectwas commissioned by Industry aiming to present agreed re-sults, allowing a common understanding of the environmentalperformance of surfactants and their precursors. In this con-text, a deeper analysis of various production technologies andthe possibility to vary regional boundaries, i.e. exchangingcountry-specific electricity grid mixes or steam supply, wasnot provided.
When no industry-specific data were available, either liter-ature or recent and reliable process data were used. The latterwere mainly derived from GaBi database. More detailed ref-erences to these process LCIs are presented in the ElectronicSupplementary Material.
The above procedure describes the study approach todevelop industry-based, averaged LCI data. Hence, the datais to be understood as the best estimate of the EU-marketedsurfactants in 2011. The authors recommend applying theERASM LCIs whenever no specific surfactant or precursorsourcing information is available, or in case the LCA studyis best served by generic/average data. The SLE life cycleinventories based on cradle-to-gate studies can be used in aLCA covering the entire product life cycle by providinginformation for the production stage. However, if theLCIs were to be used in a comparative assertion betweensurfactants, a critical review according to the panel method(minimum three critical reviewers including the chair) isrecommended by ISO.
After completion of the data collection phase, the overalldata quality was assessed using semi-quantitative data qualityindicators according to the PEF Guide (2014). The PEF Guidedefines the following data quality indicators (DQIs): techno-logical representativeness, geographical representativeness,temporal representativeness, completeness, precision (param-eter for uncertainty), and methodological appropriateness andconsistency. More information on data quality in this study isprovided in the Electronic Supplementary Material. The re-sults indicated that the data were the best available and wereregarded by PE International as well as by the reviewers assufficient for the intended use (see Electronic SupplementaryMaterial to this paper).
Int J Life Cycle Assess
2.7 Technological, temporal, and geographicrepresentativeness
Production data were collected as 12-month averagesrepresenting the reference year 2011. This approach intendsto compensate for seasonal influences on the production data.Background data have reference years from 2011 and 2009 forelectricity and thermal energy generation. These datasets areconsidered to be representative until substantial technologicalchanges (e.g. new and innovative processes) occur in the pro-duction chain, or in the background systems. Sector organisa-tions AISE and CESIO confirm a technological and marketrepresentativeness of at least 60% for the considered surfac-tants and precursors, except for C12–C14 alkyl sulphate, so-dium salt (oleo) with > 50% technological representativenessfor surfactants marketed in EU-28. A representativeness state-ment is provided in the metadata of each electronic LCIdataset. The results of the study are intended to be applicablewithin the European Union (i.e. for surfactant-containingproducts marketed in Europe). More details on the represen-tativeness are presented in the Electronic SupplementaryMaterial.
3 Results and discussion
3.1 Short overview of processes and inventories for fourclasses of surfactants
For each surfactant, a short description of the production pro-cess and data sources is provided. More detailed informationabout the processes and inventories is made available byERASM in Environmental Fact Sheets for each individualsurfactant (see Section 5 ‘Access to the data’).
3.1.1 Anionic surfactants
& Linear alkylbenzene sulphonic acid (HLAS): HLAS isusually consumed in the form of the sodium salt as ananionic surfactant; minor quantities of other derivatives(e.g. ammonium salt) are also used. The neutralisation stepwas not considered in this study as the acid form is mainlysold, and the neutralisation step is generally performed atthe customer’s plant. HLAS used in Europe is a mixture ofdifferent homologues (C10–C13 alkyl chains) and is pro-duced by catalytic alkylation of benzene and subsequentsulphonation of the formed linear alkyl benzene (LAB)(Berna et al. 1995; Kocal et al. 2001). Two different pro-cesses are used to produce LAB: the hydrogen fluoride(HF) and the solid catalyst process, commercially knownas the DETAL™ process.
& In this study, primary production data for HLAS fromfive different suppliers across Europe were used, and
for the precursor LAB from two different Europeansuppliers.
& Sodium salts of alkyl sulphate (AS): Sodium alkyl sul-phates are amongst the oldest oleochemical surfactantsproduced (since 1930) and are widely used. The chainlength of the alcohol determines the application area.Two main types of AS were considered in this study:one with a chain length of C16–18 derived from tallowand/or palm oil, and another type represented here with achain length of C12–C14. For the production of C12–C14alcohols, lauric oil feedstocks such as CNO and PKO areused. The use of these oils varies between manufacturingsites and also fluctuates in time based on market availabil-ity and price. The refined triglycerides are hydrolysed toyield fatty acids or are further transesterified with loweralcohols to yield fatty acid esters. Refined fatty acid meth-yl esters are used to generate fatty alcohol by hydrogena-tion (Ullmann 2010). The C12–C14 fatty alcohol is thenesterified with sulphur trioxide gas to yield a sulphate.
& Primary production data are from three different suppliers(in EU and Asia) representing the imported and producedC12–C14 AS in Europe.
& Sodium salts of alcohol ethoxy sulphates (AES): Alcoholethoxy sulphates, also known as alcohol ether sulphates,are derived from petro- or oleochemical alcohols. Foursteps are involved in the manufacture of AES: alcoholproduction, ethoxylation, sulphation, and neutralisation.They generally contain 1–4 ethylene oxide units(Hirsinger and Schick 1995). Sodium salts of AES areby far the most commonly used grades. The fatty alcoholrepresented here is either produced from petrochemicalfeedstock via the oxo process (C12–C13), or based onvegetable lauric oils (C12–C14). Here the, production ofthe most common product, the sodium salt (Thomas1995), is considered.
Primary production data for C12–C13 fatty alcohol pro-duction is from three different suppliers in three Europeancountries, and for ethylene oxide production also from threedifferent suppliers in three European countries. Primary pro-duction data for AES production is from five different sup-pliers based in Asia and Europe, representing the importedand locally produced AES.
& Sodium cumene sulphonate: Sodium cumene sulphonatesact as hydrotropes to modify solubilities, viscosities, andother properties of surfactants and surfactant formulations.It is produced by the sulphonation of cumene followed byneutralisation with sodium hydroxide. The sulphonationstep involves the use of oleum, a solution of SO3 insulphuric acid. The generated aromatic sulphonic acidcan be converted to its respective salt by neutralisationwith sodium hydroxide (Arpe 2010).
Int J Life Cycle Assess
Primary production data for sodium cumene sulphonateproduction is from three different suppliers in Europe. TheLCI data for cumene come from GaBi databases.
3.1.2 Non-ionic surfactants
& Alcohol ethoxylates (C12–C15 AE3;C12–C15 AE7;C12–C14 AE3; C12–C14 AE7): The alcohol ethoxylates withthree to seven ethylene oxide units are produced by thereaction of C12–C14 fatty alcohols (oleo) or C12–C15fatty alcohols (petro) with ethylene oxide. The additionof ethylene oxide to the fatty alcohols leads to a distribu-tion of homologue polyethylene glycol ether groups. Theethoxylation reaction for detergent range alcoholethoxylates is usually catalysed by alkaline catalysts suchas potassium hydroxide. The intermediate ethylene oxideis industrially produced by direct oxidation of ethylene inthe presence of a silver catalyst (Franke et al. 1995; Schulet al. 1995).
Primary production data for alcohol ethoxylates productionis from three different suppliers in Europe
& Alcohol ethoxylates (C16–C18 AE ≥ 20): The C16–C18alcohol ethoxylate with more than 20 ethylene oxide unitsis produced by the reaction of C16–C18 fatty alcoholsfrom natural sources, preferably PO and tallow (TA), withethylene oxide. The addition of ethylene oxide to the fattyalcohol leads to a distribution of homologue polyethyleneglycol ether groups. The ethoxylation reaction for deter-gent range alcohol ethoxylates is usually catalysed by al-kaline catalysts, e.g. potassium hydroxide (Ullmann2010).
Primary production data for C16–C18 AE ≥ 20 productionis from four different suppliers in Europe. The modelled datafor C16–C18 alcohol production in Europe is based on sec-ondary data from literature and process calculations, as anindustry data collection was not possible in Europe. C16–C18 alcohol is based on the C16–C18 fractions of palm oiland tallow. The processing of the renewable oils to C16–C18alcohol was modelled according to technology descriptionsavailable from patents (EP0370273 A1 1990) and literature(Ullmann 2010) combined with chemical processing calcula-tions made by PE International experts.
& Cocamide diethanolamine (CDEA) : Cocamidediethanolamine is an additive used as a refatting agent orto stabilise and enhance foaming properties. This sub-stance is manufactured by the condensation reaction oflauric oils (CNO of PKO) with diethanolamine (DEA).An allocation by price for 1 kg of the desired producthas been implemented in the model.
Primary production data for cocamide diethanolamine pro-duction is from three different suppliers in Europe. The LCIdata for the production of the precursor diethanolamine isbased on a literature research covering recent production tech-nology. Applied background LCI data have reference yearsbetween 2008 and 2010 for electricity and thermal energyprocesses, respectively.
& C 1 2 –C 1 4 Am i n e O x i d e (C 1 2 –C 1 4 AO ) :Lauryldimethylamine oxide in a neutral aqueous solutionis regarded as a non-ionic surfactant which is widely usedas a constituent of manual dishwashing detergents, sham-poos, and soaps. Amine oxides are produced by the reac-tion of tertiary amines such as alkyldimethylamine withhydrogen peroxide in a two-phase system containing alarge volume of water yielding dilute products typicallycontaining 35% active (Zoller 2008). For the productionof the precursor hydrogen peroxide (H2O2), the anthraqui-none process is used for more than 95% of the worldwideproduction.
Primary production data for amine oxide production isfrom four different suppliers in Europe in three different coun-tries. The LCI for hydrogen peroxide is derived from GaBiDatabases and covers European conditions. The data for H2O2
production refer to primary data from industry covering recentproduction technology.
3.1.3 Cationic surfactants
& C16–C18 Triethanolamine esterquats (C16–C18 TEA-quat): C16–C18 Triethanolamine esterquat is a cationicsurfactant that belongs to the class of surface active qua-ternary ammonium compounds used for the formulationof fabric softeners. Quaternized triethanolamine fatty acidesters are obtained by reacting triethanolamine with fattyalcohols, fatty alcohol esters or oils, and subsequentquaternization of the resulting triethanolamine fatty acidesters. The fatty acid used here is obtained from tallow.Dimethyl sulphate (DMS) is the quaternizing agent(Zoller 2008). The product is a mixture of quaternizedmono-, di-, and tri-esters of triethanolamine and uncon-verted triethanolamine, which corresponds to the so-calledquaternized triethanolamine di(tallow)fatty acid ester. Theintermediate dimethyl sulphate is industrially produced bythe reaction of gaseous dimethyl ether and liquid sulphurtrioxide in stoichiometric quantities (Ullmann 2010).
Primary production data for triethanolamine esterquat(TEA-quat) production is from four different suppliers inEurope in three different countries. The LCI for hydrogenperoxide is derived from GaBi Databases which refer to pri-mary data from industry covering recent production
Int J Life Cycle Assess
technology for European conditions. The precursor dimethylether was modelled by literature information out of a patent(US 6740783 B1 2004).
3.1.4 Amphoteric surfactants
& C8–C18 alkyl amidopropyl betaine (CAPB): alkylamidopropyl betaine is an amphoteric surfactant and themost common of the betaine types. In the production of alkylamidopropyl betaine, twomain steps are involved: formationof the fatty acid amide and carboxymethylation of the amide.For CAPB, which is represented here, the first step is thereaction of 3-dimethylaminopropylamine (DMAPA) with ei-ther fatty acids, fatty acid methyl esters, or directly withnatural fats (fatty acid glycerin esters) (Zoller 2008).
The intermediate DMAPA is commercially produced viathe reaction between dimethylamine and acrylonitrile to pro-duce dimethylaminopropionitrile (DMAPN). Subsequent hy-drogenation of DMAPN yields a crude reaction mixture thatcontains the desired DMAPA (Ernst 2012).
Chloroacetic acid is produced by the catalysed chlorinationof acetic acid with chlorine (Ullmann 2010). An allocation bymass for 1 kg of the desired product chloroacetic acid has beenimplemented in the model.
Primary production data for alkyl amidopropyl betaine pro-duction is from three different suppliers in three countries inEurope. As primary data from industry for the intermediatesDMAPA and chloroacetic acid were unavailable, the process-es were modelled by secondary data. The LCIs for the inter-mediates are part of GaBi databases and cover Europeanconditions.
& Sodium cocoamphoacetate (SCA): The synthesis ofamphoacetates and amphodiacetates consists of two dis-tinct steps: synthesis of the hydroxyethylimidazoline andcarboxymethylation of the imidazoline with sodiummonochloroacetate (SMCA). In the first step, the fatty acidester (based on CNO and/or PKO) is condensed withaminoethylethanolamine (AEEA) at an elevated tempera-ture and reduced pressure. The second stage of the processis the reaction of the imidazoline with caustic soda andmonochloroacetic acid (Zoller 2008).
The intermediate product AEEA is industrially producedby the process of the continuously hydrogenative amination ofmonoethylene glycol (Van Cauwenberge et al. 2009). An al-location by mass for 1 kg of the desired product AEEA hasbeen implemented in the model.
Primary production data for sodium cocoamphoacetateproduction is from three different suppliers in three countriesin Europe. The LCI data for production of AEEA refer toliterature research covering recent production technology.
3.1.5 Primary energy demand and global warming potentialresults
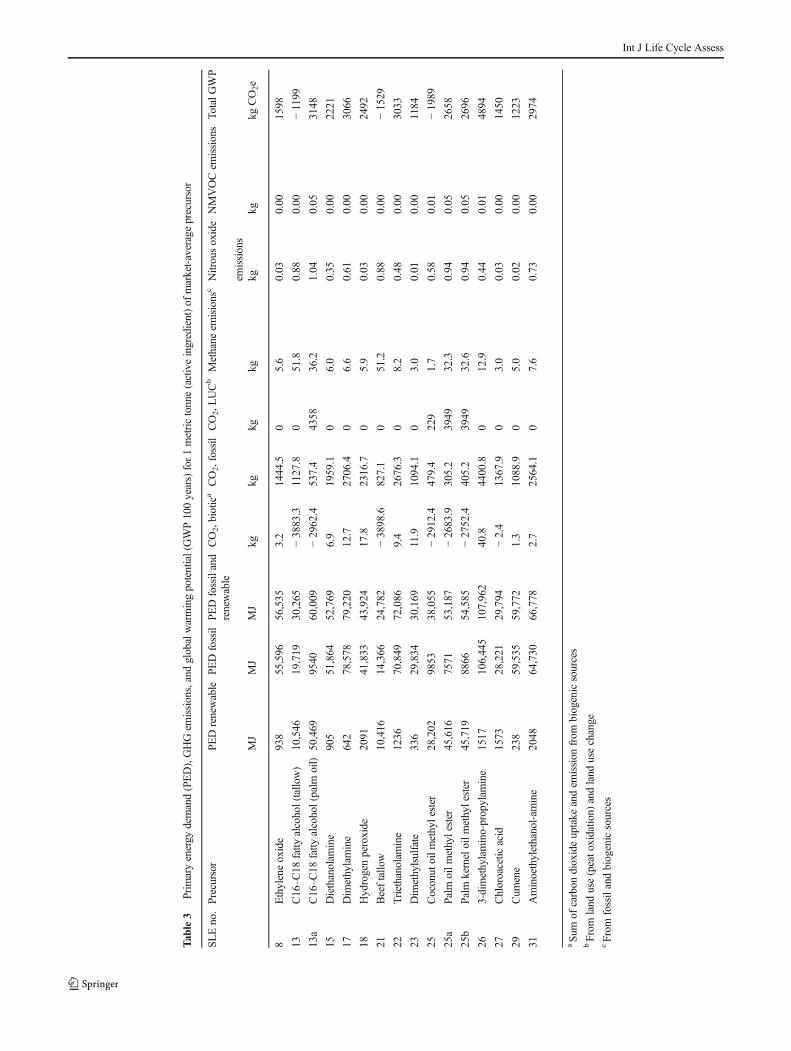
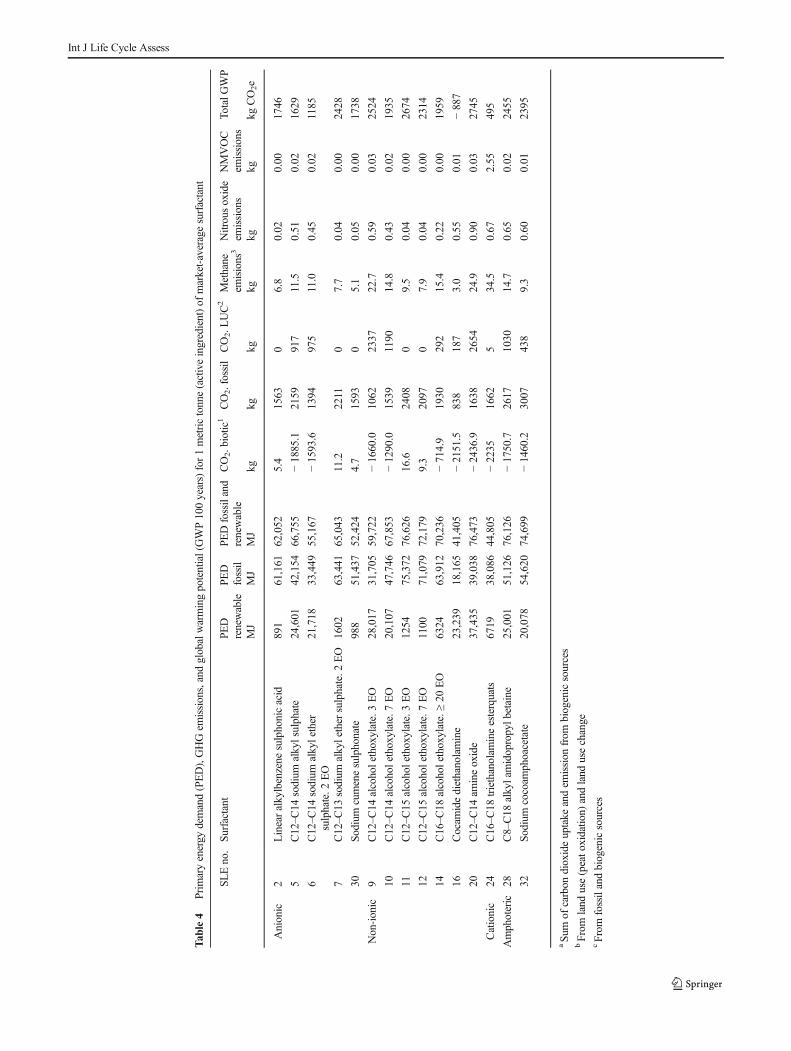
The study represents the cradle-to-gate LCIs for 15 sur-factants and 17 precursors. In this paper, only the findingsfor the total PED and the GWP are presented (Tables 3and 4). Other impact categories were not calculated andanalysed.
Cumulative or primary energy demand per functional unitis considered the most meaningful parameter in judging theenergy efficiency/intensity of systems, since losses due totransformation and transport are fully taken into account. Itaggregates all forms of energy use over the life cycle and alsocontains the feedstock energy (Kloepffer 1997).
The indicator GWP summarises and characterises GHGemissions and their potential effect on global warming.This indicator is calculated according to IPCC 2007 andGuinée et al. (2002). Following these methods, Eq. 1 isapplied.
Calculation of global warming potential (GWP 100 years)
Total GWP ¼ Carbon uptake kg CO2equiv:½ �* 1 kg CO2equiv:; negative value½ �þCarbon dioxide; fossil kg½ �* 1 kg CO2equiv:½ �þCarbon dioxide; biotic kg½ �* 1 kg CO2equiv:½ �þCarbon dioxide; from land use change and peat oxidation kg½ �*
1 kg CO2equiv:½ �þMethane kg½ �* 25 kg CO2equiv:½ �þNitrous oxide laughing gasð Þ kg½ �* 298 kg CO2equiv:½ �þNMVOC emissions Halogenated organic emissions to airð Þ kg½ �*
13 kg CO2equiv:½ � ð1Þ
The biotic carbon uptake is displayed as a negative value.The small amount of biogenic CO2 emissions in the LCIs offossil-based surfactants results from renewable energy carriersused for electricity generation and transport.
From Tables 3 and 4, it can be seen that the PED for thereportable precursors ranges from 24,782 MJ/tonne for beeftallow to 107,962 MJ/tonne for DMAPA. For the final surfac-tants, the range is from 41,404 MJ/tonne for CDEA to76,626 MJ/tonne for C12–C15 AE3.
The GPW for the reportable precursors ranges from− 1989 kg CO2e (coconut oil methyl ester) to 4894 kg CO2e(DMAPA). For the final surfactants, the range is from− 887 kg CO2e (CDEA) to 2674 (C12–C15 AE3). The arith-metic mean of the GWP for the surfactants considered in thisstudy is 1814 kg CO2e.
3.2 Inventories and summary results for the renewableprecursors
In the course of this project, LCIs for renewable precursorswere developed by PE International based on literature data
Int J Life Cycle Assess
Tab
le3
Prim
aryenergy
demand(PED),GHGem
issions,andglobalwarmingpotential(GWP100years)for1metrictonne(activeingredient)of
market-averageprecursor
SLEno.Precursor
PEDrenewable
PEDfossil
PEDfossiland
renewable
CO2,biotic
aCO2,fossilCO2,L
UCb
Methane
emisions
cNitrousoxide
emissions
NMVOCem
issions
TotalG
WP
MJ
MJ
MJ
kgkg
kgkg
kgkg
kgCO2e
8Ethyleneoxide
938
55,596
56,535
3.2
1444.5
05.6
0.03
0.00
1598
13C16–C
18fatty
alcohol(tallo
w)
10,546
19,719
30,265
−3883.3
1127.8
051.8
0.88
0.00
−1199
13a
C16–C
18fatty
alcohol(palm
oil)
50,469
9540
60,009
−2962.4
537.4
4358
36.2
1.04
0.05
3148
15Diethanolam
ine
905
51,864
52,769
6.9
1959.1
06.0
0.35
0.00
2221
17Dim
ethylamine
642
78,578
79,220
12.7
2706.4
06.6
0.61
0.00
3066
18Hydrogenperoxide
2091
41,833
43,924
17.8
2316.7
05.9
0.03
0.00
2492
21Beeftallo
w10,416
14,366
24,782
−3898.6
827.1
051.2
0.88
0.00
−1529
22Triethanolamine
1236
70,849
72,086
9.4
2676.3
08.2
0.48
0.00
3033
23Dim
ethylsulfate
336
29,834
30,169
11.9
1094.1
03.0
0.01
0.00
1184
25Coconut
oilm
ethylester
28,202
9853
38,055
−2912.4
479.4
229
1.7
0.58
0.01
−1989
25a
Palm
oilm
ethylester
45,616
7571
53,187
−2683.9
305.2
3949
32.3
0.94
0.05
2658
25b
Palm
kerneloilm
ethylester
45,719
8866
54,585
−2752.4
405.2
3949
32.6
0.94
0.05
2696
263-dimethylamino-propylam
ine
1517
106,445
107,962
40.8
4400.8
012.9
0.44
0.01
4894
27Chloroacetic
acid
1573
28,221
29,794
−2.4
1367.9
03.0
0.03
0.00
1450
29Cum
ene
238
59,535
59,772
1.3
1088.9
05.0
0.02
0.00
1223
31Aminoethylethanol-am
ine
2048
64,730
66,778
2.7
2564.1
07.6
0.73
0.00
2974
aSu
mof
carbon
dioxideuptake
andem
ission
from
biogenicsources
bFrom
land
use(peato
xidatio
n)andland
usechange
cFrom
fossilandbiogenicsources
Int J Life Cycle Assess
Tab
le4
Prim
aryenergy
demand(PED),GHGem
issions,andglobalwarmingpotential(GWP100years)for1metrictonne(activeingredient)of
market-averagesurfactant
SLEno.
Surfactant
PED
renewable
PED
fossil
PEDfossiland
renewable
CO2.biotic
1CO2.fossil
CO2.L
UC2
Methane
emisions
3Nitrousoxide
emissions
NMVOC
emissions
TotalG
WP
MJ
MJ
MJ
kgkg
kgkg
kgkg
kgCO2e
Anionic
2Linearalkylbenzene
sulphonicacid
891
61,161
62,052
5.4
1563
06.8
0.02
0.00
1746
5C12–C
14sodium
alkylsulphate
24,601
42,154
66,755
−1885.1
2159
917
11.5
0.51
0.02
1629
6C12–C
14sodium
alkylether
sulphate.2
EO
21,718
33,449
55,167
−1593.6
1394
975
11.0
0.45
0.02
1185
7C12–C
13sodium
alkylether
sulphate.2
EO
1602
63,441
65,043
11.2
2211
07.7
0.04
0.00
2428
30So
dium
cumenesulphonate
988
51,437
52,424
4.7
1593
05.1
0.05
0.00
1738
Non-ionic
9C12–C
14alcoholethoxylate.3EO
28,017
31,705
59,722
−1660.0
1062
2337
22.7
0.59
0.03
2524
10C12–C
14alcoholethoxylate.7EO
20,107
47,746
67,853
−1290.0
1539
1190
14.8
0.43
0.02
1935
11C12–C
15alcoholethoxylate.3EO
1254
75,372
76,626
16.6
2408
09.5
0.04
0.00
2674
12C12–C
15alcoholethoxylate.7EO
1100
71,079
72,179
9.3
2097
07.9
0.04
0.00
2314
14C16–C
18alcoholethoxylate.≥20
EO
6324
63,912
70,236
−714.9
1930
292
15.4
0.22
0.00
1959
16Cocam
idediethanolamine
23,239
18,165
41,405
−2151.5
838
187
3.0
0.55
0.01
−887
20C12–C
14am
ineoxide
37,435
39,038
76,473
−2436.9
1638
2654
24.9
0.90
0.03
2745
Cationic
24C16–C
18triethanolam
ineesterquats
6719
38,086
44,805
−2235
1662
534.5
0.67
2.55
495
Amphoteric
28C8–C18
alkylamidopropylb
etaine
25,001
51,126
76,126
−1750.7
2617
1030
14.7
0.65
0.02
2455
32So
dium
cocoam
phoacetate
20,078
54,620
74,699
−1460.2
3007
438
9.3
0.60
0.01
2395
aSu
mof
carbon
dioxideuptake
andem
ission
from
biogenicsources
bFrom
land
use(peato
xidatio
n)andland
usechange
cFrom
fossilandbiogenicsources
Int J Life Cycle Assess
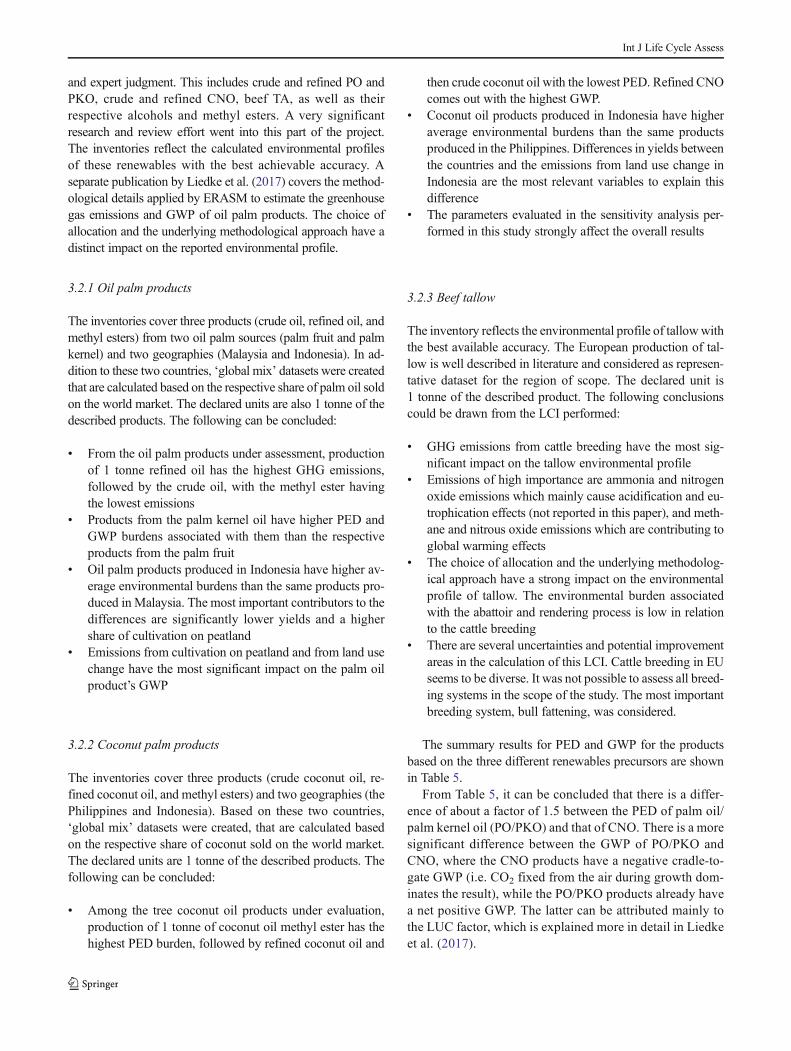
and expert judgment. This includes crude and refined PO andPKO, crude and refined CNO, beef TA, as well as theirrespective alcohols and methyl esters. A very significantresearch and review effort went into this part of the project.The inventories reflect the calculated environmental profilesof these renewables with the best achievable accuracy. Aseparate publication by Liedke et al. (2017) covers the method-ological details applied by ERASM to estimate the greenhousegas emissions and GWP of oil palm products. The choice ofallocation and the underlying methodological approach have adistinct impact on the reported environmental profile.
3.2.1 Oil palm products
The inventories cover three products (crude oil, refined oil, andmethyl esters) from two oil palm sources (palm fruit and palmkernel) and two geographies (Malaysia and Indonesia). In ad-dition to these two countries, ‘global mix’ datasets were createdthat are calculated based on the respective share of palm oil soldon the world market. The declared units are also 1 tonne of thedescribed products. The following can be concluded:
& From the oil palm products under assessment, productionof 1 tonne refined oil has the highest GHG emissions,followed by the crude oil, with the methyl ester havingthe lowest emissions
& Products from the palm kernel oil have higher PED andGWP burdens associated with them than the respectiveproducts from the palm fruit
& Oil palm products produced in Indonesia have higher av-erage environmental burdens than the same products pro-duced in Malaysia. The most important contributors to thedifferences are significantly lower yields and a highershare of cultivation on peatland
& Emissions from cultivation on peatland and from land usechange have the most significant impact on the palm oilproduct’s GWP
3.2.2 Coconut palm products
The inventories cover three products (crude coconut oil, re-fined coconut oil, and methyl esters) and two geographies (thePhilippines and Indonesia). Based on these two countries,‘global mix’ datasets were created, that are calculated basedon the respective share of coconut sold on the world market.The declared units are 1 tonne of the described products. Thefollowing can be concluded:
& Among the tree coconut oil products under evaluation,production of 1 tonne of coconut oil methyl ester has thehighest PED burden, followed by refined coconut oil and
then crude coconut oil with the lowest PED. Refined CNOcomes out with the highest GWP.
& Coconut oil products produced in Indonesia have higheraverage environmental burdens than the same productsproduced in the Philippines. Differences in yields betweenthe countries and the emissions from land use change inIndonesia are the most relevant variables to explain thisdifference
& The parameters evaluated in the sensitivity analysis per-formed in this study strongly affect the overall results
3.2.3 Beef tallow
The inventory reflects the environmental profile of tallowwiththe best available accuracy. The European production of tal-low is well described in literature and considered as represen-tative dataset for the region of scope. The declared unit is1 tonne of the described product. The following conclusionscould be drawn from the LCI performed:
& GHG emissions from cattle breeding have the most sig-nificant impact on the tallow environmental profile
& Emissions of high importance are ammonia and nitrogenoxide emissions which mainly cause acidification and eu-trophication effects (not reported in this paper), and meth-ane and nitrous oxide emissions which are contributing toglobal warming effects
& The choice of allocation and the underlying methodolog-ical approach have a strong impact on the environmentalprofile of tallow. The environmental burden associatedwith the abattoir and rendering process is low in relationto the cattle breeding
& There are several uncertainties and potential improvementareas in the calculation of this LCI. Cattle breeding in EUseems to be diverse. It was not possible to assess all breed-ing systems in the scope of the study. The most importantbreeding system, bull fattening, was considered.
The summary results for PED and GWP for the productsbased on the three different renewables precursors are shownin Table 5.
From Table 5, it can be concluded that there is a differ-ence of about a factor of 1.5 between the PED of palm oil/palm kernel oil (PO/PKO) and that of CNO. There is a moresignificant difference between the GWP of PO/PKO andCNO, where the CNO products have a negative cradle-to-gate GWP (i.e. CO2 fixed from the air during growth dom-inates the result), while the PO/PKO products already havea net positive GWP. The latter can be attributed mainly tothe LUC factor, which is explained more in detail in Liedkeet al. (2017).
Int J Life Cycle Assess
3.3 General discussion of results and comparisonwith the CEFIC-Franklin (1994) study
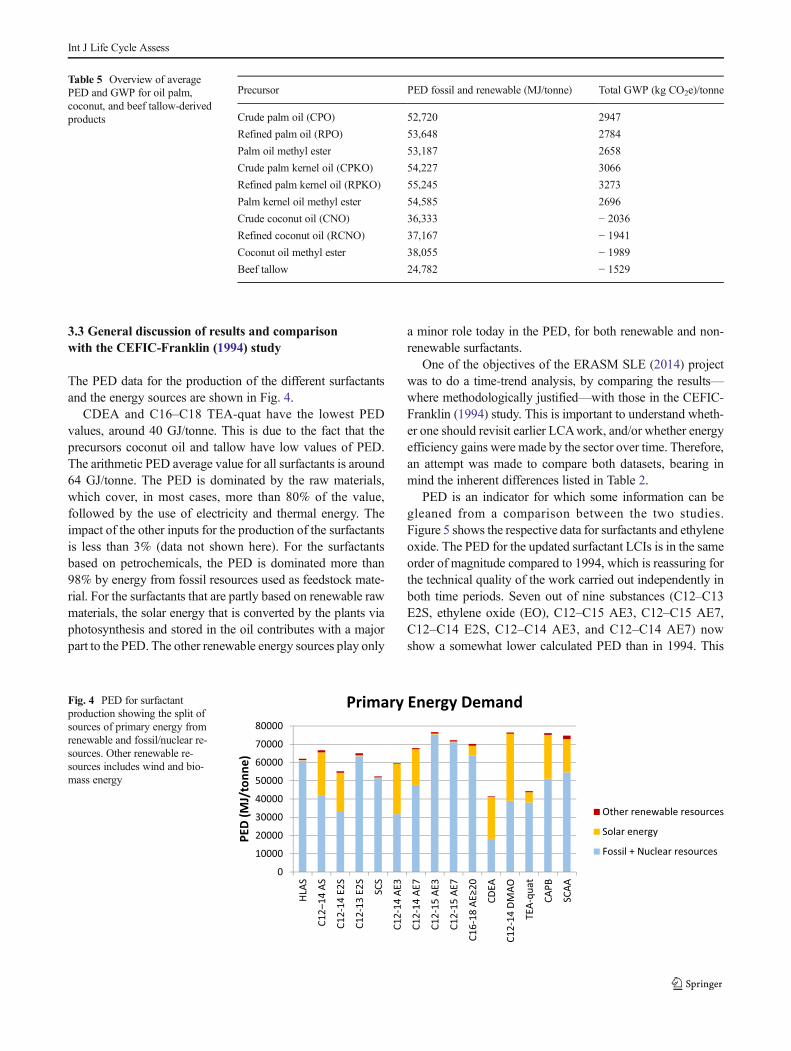
The PED data for the production of the different surfactantsand the energy sources are shown in Fig. 4.
CDEA and C16–C18 TEA-quat have the lowest PEDvalues, around 40 GJ/tonne. This is due to the fact that theprecursors coconut oil and tallow have low values of PED.The arithmetic PED average value for all surfactants is around64 GJ/tonne. The PED is dominated by the raw materials,which cover, in most cases, more than 80% of the value,followed by the use of electricity and thermal energy. Theimpact of the other inputs for the production of the surfactantsis less than 3% (data not shown here). For the surfactantsbased on petrochemicals, the PED is dominated more than98% by energy from fossil resources used as feedstock mate-rial. For the surfactants that are partly based on renewable rawmaterials, the solar energy that is converted by the plants viaphotosynthesis and stored in the oil contributes with a majorpart to the PED. The other renewable energy sources play only
a minor role today in the PED, for both renewable and non-renewable surfactants.
One of the objectives of the ERASM SLE (2014) projectwas to do a time-trend analysis, by comparing the results—where methodologically justified—with those in the CEFIC-Franklin (1994) study. This is important to understand wheth-er one should revisit earlier LCAwork, and/or whether energyefficiency gains were made by the sector over time. Therefore,an attempt was made to compare both datasets, bearing inmind the inherent differences listed in Table 2.
PED is an indicator for which some information can begleaned from a comparison between the two studies.Figure 5 shows the respective data for surfactants and ethyleneoxide. The PED for the updated surfactant LCIs is in the sameorder of magnitude compared to 1994, which is reassuring forthe technical quality of the work carried out independently inboth time periods. Seven out of nine substances (C12–C13E2S, ethylene oxide (EO), C12–C15 AE3, C12–C15 AE7,C12–C14 E2S, C12–C14 AE3, and C12–C14 AE7) nowshow a somewhat lower calculated PED than in 1994. This
0
10000
20000
30000
40000
50000
60000
70000
80000
HLAS
C12–14
AS
C12-14
E2S
C12-13
E2S
SCS
C12-14
AE3
C12-14
AE7
C12-15
AE3
C12-15
AE7
C16-18
AE≥20
CDEA
C12-14
DMAO
TEA-qu
at
CAPB
SCAA
PED(M
J/tonn
e)
Primary Energy Demand
Other renewable resources
Solar energy
Fossil + Nuclear resources
Fig. 4 PED for surfactantproduction showing the split ofsources of primary energy fromrenewable and fossil/nuclear re-sources. Other renewable re-sources includes wind and bio-mass energy
Table 5 Overview of averagePED and GWP for oil palm,coconut, and beef tallow-derivedproducts
Precursor PED fossil and renewable (MJ/tonne) Total GWP (kg CO2e)/tonne
Crude palm oil (CPO) 52,720 2947
Refined palm oil (RPO) 53,648 2784
Palm oil methyl ester 53,187 2658
Crude palm kernel oil (CPKO) 54,227 3066
Refined palm kernel oil (RPKO) 55,245 3273
Palm kernel oil methyl ester 54,585 2696
Crude coconut oil (CNO) 36,333 − 2036
Refined coconut oil (RCNO) 37,167 − 1941
Coconut oil methyl ester 38,055 − 1989
Beef tallow 24,782 − 1529
Int J Life Cycle Assess
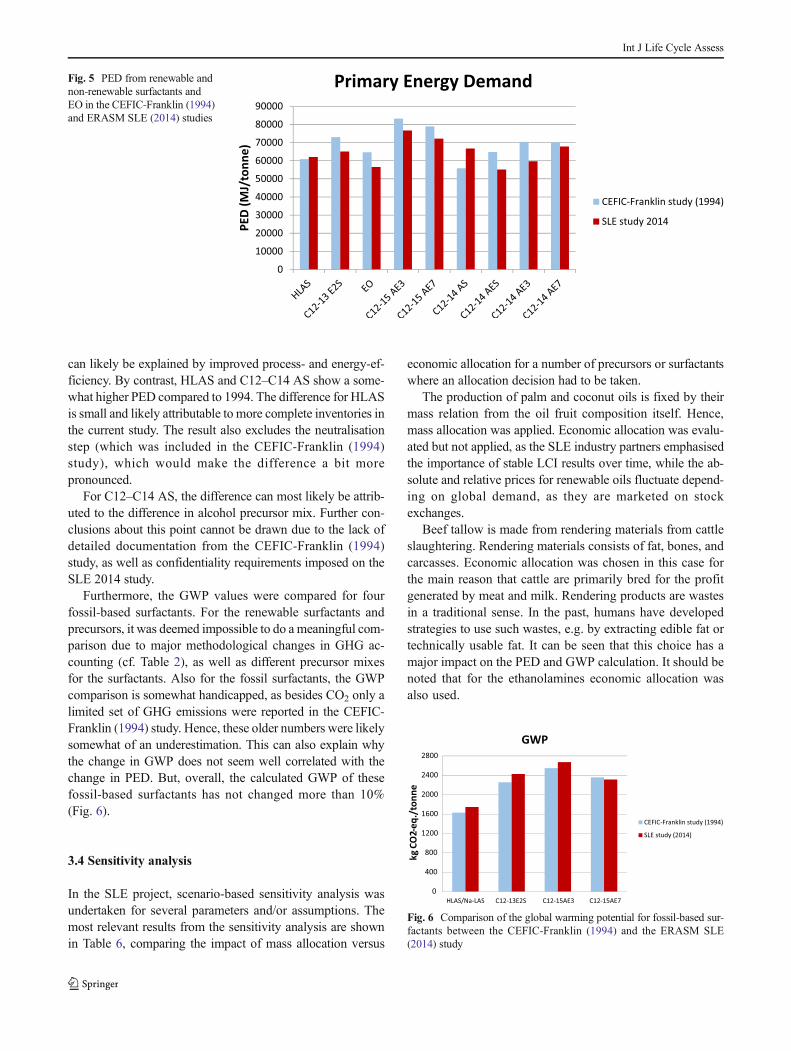
can likely be explained by improved process- and energy-ef-ficiency. By contrast, HLAS and C12–C14 AS show a some-what higher PED compared to 1994. The difference for HLASis small and likely attributable to more complete inventories inthe current study. The result also excludes the neutralisationstep (which was included in the CEFIC-Franklin (1994)study), which would make the difference a bit morepronounced.
For C12–C14 AS, the difference can most likely be attrib-uted to the difference in alcohol precursor mix. Further con-clusions about this point cannot be drawn due to the lack ofdetailed documentation from the CEFIC-Franklin (1994)study, as well as confidentiality requirements imposed on theSLE 2014 study.
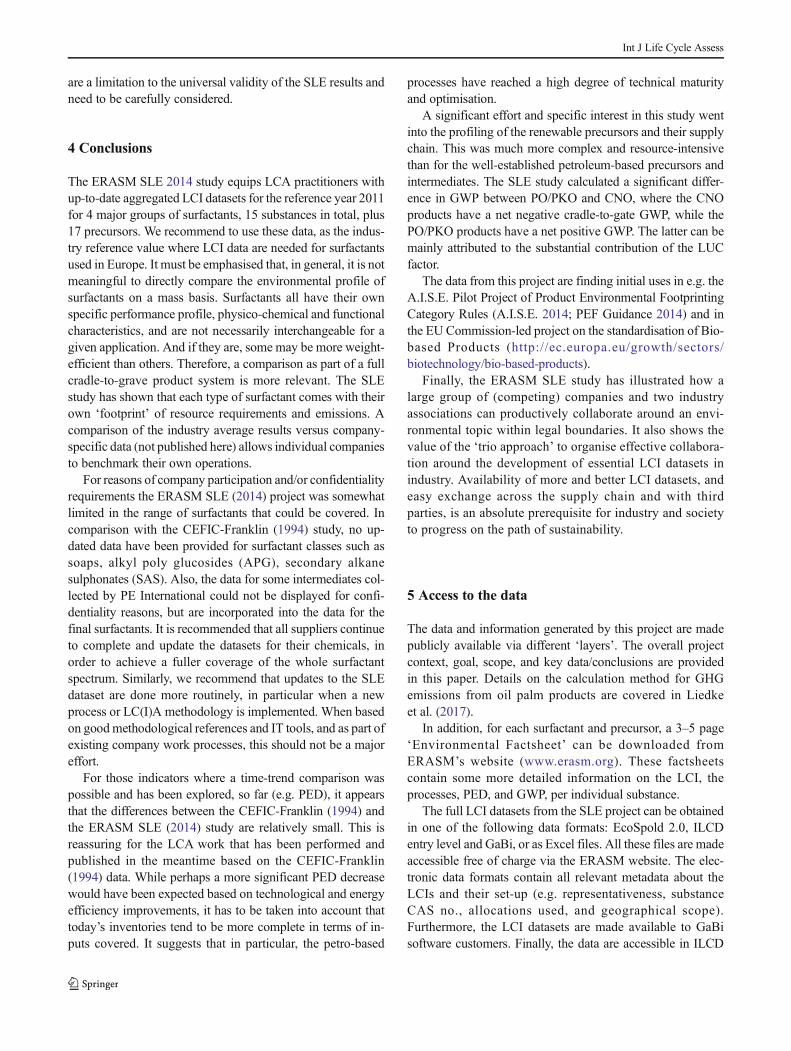
Furthermore, the GWP values were compared for fourfossil-based surfactants. For the renewable surfactants andprecursors, it was deemed impossible to do a meaningful com-parison due to major methodological changes in GHG ac-counting (cf. Table 2), as well as different precursor mixesfor the surfactants. Also for the fossil surfactants, the GWPcomparison is somewhat handicapped, as besides CO2 only alimited set of GHG emissions were reported in the CEFIC-Franklin (1994) study. Hence, these older numbers were likelysomewhat of an underestimation. This can also explain whythe change in GWP does not seem well correlated with thechange in PED. But, overall, the calculated GWP of thesefossil-based surfactants has not changed more than 10%(Fig. 6).
3.4 Sensitivity analysis
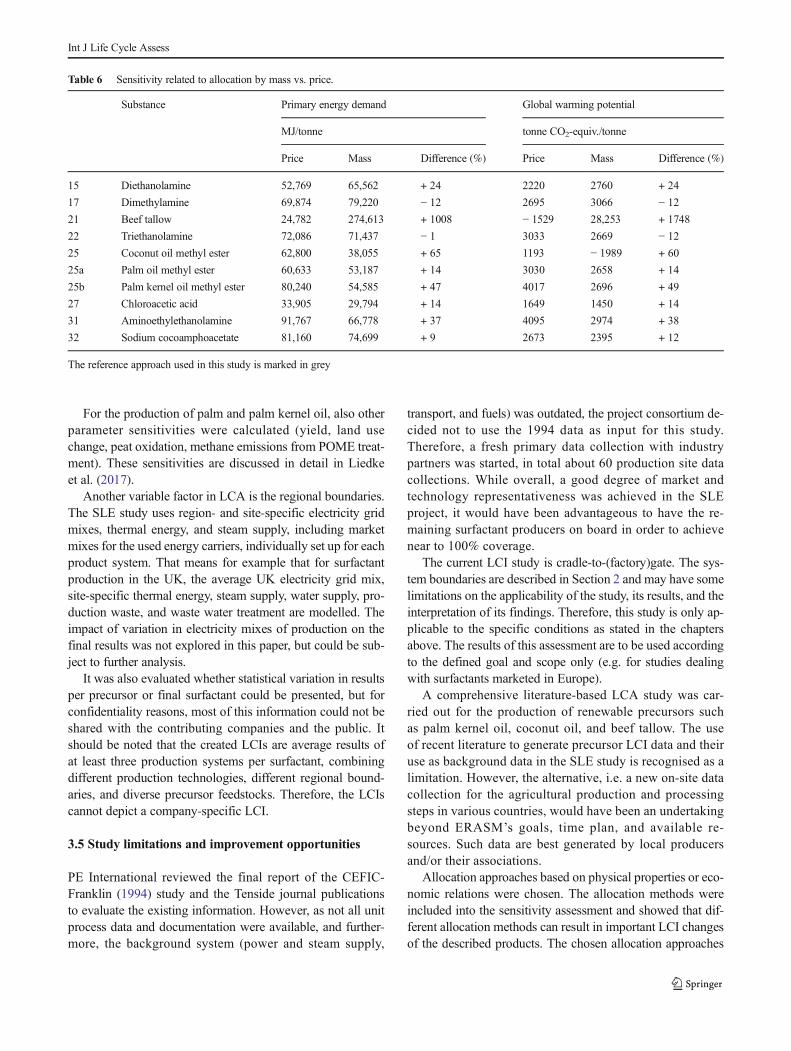
In the SLE project, scenario-based sensitivity analysis wasundertaken for several parameters and/or assumptions. Themost relevant results from the sensitivity analysis are shownin Table 6, comparing the impact of mass allocation versus
economic allocation for a number of precursors or surfactantswhere an allocation decision had to be taken.
The production of palm and coconut oils is fixed by theirmass relation from the oil fruit composition itself. Hence,mass allocation was applied. Economic allocation was evalu-ated but not applied, as the SLE industry partners emphasisedthe importance of stable LCI results over time, while the ab-solute and relative prices for renewable oils fluctuate depend-ing on global demand, as they are marketed on stockexchanges.
Beef tallow is made from rendering materials from cattleslaughtering. Rendering materials consists of fat, bones, andcarcasses. Economic allocation was chosen in this case forthe main reason that cattle are primarily bred for the profitgenerated by meat and milk. Rendering products are wastesin a traditional sense. In the past, humans have developedstrategies to use such wastes, e.g. by extracting edible fat ortechnically usable fat. It can be seen that this choice has amajor impact on the PED and GWP calculation. It should benoted that for the ethanolamines economic allocation wasalso used.
0
10000
20000
30000
40000
50000
60000
70000
80000
90000
PED(M
J/tonn
e)
Primary Energy Demand
CEFIC-Franklin study (1994)
SLE study 2014
Fig. 5 PED from renewable andnon-renewable surfactants andEO in the CEFIC-Franklin (1994)and ERASM SLE (2014) studies
0
400
800
1200
1600
2000
2400
2800
HLAS/Na-LAS C12-13E2S C12-15AE3 C12-15AE7
kgCO
2-eq
./tonn
e
GWP
CEFIC-Franklin study (1994)
SLE study (2014)
Fig. 6 Comparison of the global warming potential for fossil-based sur-factants between the CEFIC-Franklin (1994) and the ERASM SLE(2014) study
Int J Life Cycle Assess
For the production of palm and palm kernel oil, also otherparameter sensitivities were calculated (yield, land usechange, peat oxidation, methane emissions from POME treat-ment). These sensitivities are discussed in detail in Liedkeet al. (2017).
Another variable factor in LCA is the regional boundaries.The SLE study uses region- and site-specific electricity gridmixes, thermal energy, and steam supply, including marketmixes for the used energy carriers, individually set up for eachproduct system. That means for example that for surfactantproduction in the UK, the average UK electricity grid mix,site-specific thermal energy, steam supply, water supply, pro-duction waste, and waste water treatment are modelled. Theimpact of variation in electricity mixes of production on thefinal results was not explored in this paper, but could be sub-ject to further analysis.
It was also evaluated whether statistical variation in resultsper precursor or final surfactant could be presented, but forconfidentiality reasons, most of this information could not beshared with the contributing companies and the public. Itshould be noted that the created LCIs are average results ofat least three production systems per surfactant, combiningdifferent production technologies, different regional bound-aries, and diverse precursor feedstocks. Therefore, the LCIscannot depict a company-specific LCI.
3.5 Study limitations and improvement opportunities
PE International reviewed the final report of the CEFIC-Franklin (1994) study and the Tenside journal publicationsto evaluate the existing information. However, as not all unitprocess data and documentation were available, and further-more, the background system (power and steam supply,
transport, and fuels) was outdated, the project consortium de-cided not to use the 1994 data as input for this study.Therefore, a fresh primary data collection with industrypartners was started, in total about 60 production site datacollections. While overall, a good degree of market andtechnology representativeness was achieved in the SLEproject, it would have been advantageous to have the re-maining surfactant producers on board in order to achievenear to 100% coverage.
The current LCI study is cradle-to-(factory)gate. The sys-tem boundaries are described in Section 2 and may have somelimitations on the applicability of the study, its results, and theinterpretation of its findings. Therefore, this study is only ap-plicable to the specific conditions as stated in the chaptersabove. The results of this assessment are to be used accordingto the defined goal and scope only (e.g. for studies dealingwith surfactants marketed in Europe).
A comprehensive literature-based LCA study was car-ried out for the production of renewable precursors suchas palm kernel oil, coconut oil, and beef tallow. The useof recent literature to generate precursor LCI data and theiruse as background data in the SLE study is recognised as alimitation. However, the alternative, i.e. a new on-site datacollection for the agricultural production and processingsteps in various countries, would have been an undertakingbeyond ERASM’s goals, time plan, and available re-sources. Such data are best generated by local producersand/or their associations.
Allocation approaches based on physical properties or eco-nomic relations were chosen. The allocation methods wereincluded into the sensitivity assessment and showed that dif-ferent allocation methods can result in important LCI changesof the described products. The chosen allocation approaches
Table 6 Sensitivity related to allocation by mass vs. price.
Substance Primary energy demand Global warming potential
MJ/tonne tonne CO2-equiv./tonne
Price Mass Difference (%) Price Mass Difference (%)
15 Diethanolamine 52,769 65,562 + 24 2220 2760 + 24
17 Dimethylamine 69,874 79,220 − 12 2695 3066 − 12
21 Beef tallow 24,782 274,613 + 1008 − 1529 28,253 + 1748
22 Triethanolamine 72,086 71,437 − 1 3033 2669 − 12
25 Coconut oil methyl ester 62,800 38,055 + 65 1193 − 1989 + 60
25a Palm oil methyl ester 60,633 53,187 + 14 3030 2658 + 14
25b Palm kernel oil methyl ester 80,240 54,585 + 47 4017 2696 + 49
27 Chloroacetic acid 33,905 29,794 + 14 1649 1450 + 14
31 Aminoethylethanolamine 91,767 66,778 + 37 4095 2974 + 38
32 Sodium cocoamphoacetate 81,160 74,699 + 9 2673 2395 + 12
The reference approach used in this study is marked in grey
Int J Life Cycle Assess
are a limitation to the universal validity of the SLE results andneed to be carefully considered.
4 Conclusions
The ERASM SLE 2014 study equips LCA practitioners withup-to-date aggregated LCI datasets for the reference year 2011for 4 major groups of surfactants, 15 substances in total, plus17 precursors. We recommend to use these data, as the indus-try reference value where LCI data are needed for surfactantsused in Europe. It must be emphasised that, in general, it is notmeaningful to directly compare the environmental profile ofsurfactants on a mass basis. Surfactants all have their ownspecific performance profile, physico-chemical and functionalcharacteristics, and are not necessarily interchangeable for agiven application. And if they are, some may be more weight-efficient than others. Therefore, a comparison as part of a fullcradle-to-grave product system is more relevant. The SLEstudy has shown that each type of surfactant comes with theirown ‘footprint’ of resource requirements and emissions. Acomparison of the industry average results versus company-specific data (not published here) allows individual companiesto benchmark their own operations.
For reasons of company participation and/or confidentialityrequirements the ERASM SLE (2014) project was somewhatlimited in the range of surfactants that could be covered. Incomparison with the CEFIC-Franklin (1994) study, no up-dated data have been provided for surfactant classes such assoaps, alkyl poly glucosides (APG), secondary alkanesulphonates (SAS). Also, the data for some intermediates col-lected by PE International could not be displayed for confi-dentiality reasons, but are incorporated into the data for thefinal surfactants. It is recommended that all suppliers continueto complete and update the datasets for their chemicals, inorder to achieve a fuller coverage of the whole surfactantspectrum. Similarly, we recommend that updates to the SLEdataset are done more routinely, in particular when a newprocess or LC(I)A methodology is implemented. When basedon goodmethodological references and IT tools, and as part ofexisting company work processes, this should not be a majoreffort.
For those indicators where a time-trend comparison waspossible and has been explored, so far (e.g. PED), it appearsthat the differences between the CEFIC-Franklin (1994) andthe ERASM SLE (2014) study are relatively small. This isreassuring for the LCA work that has been performed andpublished in the meantime based on the CEFIC-Franklin(1994) data. While perhaps a more significant PED decreasewould have been expected based on technological and energyefficiency improvements, it has to be taken into account thattoday’s inventories tend to be more complete in terms of in-puts covered. It suggests that in particular, the petro-based
processes have reached a high degree of technical maturityand optimisation.
A significant effort and specific interest in this study wentinto the profiling of the renewable precursors and their supplychain. This was much more complex and resource-intensivethan for the well-established petroleum-based precursors andintermediates. The SLE study calculated a significant differ-ence in GWP between PO/PKO and CNO, where the CNOproducts have a net negative cradle-to-gate GWP, while thePO/PKO products have a net positive GWP. The latter can bemainly attributed to the substantial contribution of the LUCfactor.
The data from this project are finding initial uses in e.g. theA.I.S.E. Pilot Project of Product Environmental FootprintingCategory Rules (A.I.S.E. 2014; PEF Guidance 2014) and inthe EU Commission-led project on the standardisation of Bio-based Products (http://ec.europa.eu/growth/sectors/biotechnology/bio-based-products).
Finally, the ERASM SLE study has illustrated how alarge group of (competing) companies and two industryassociations can productively collaborate around an envi-ronmental topic within legal boundaries. It also shows thevalue of the ‘trio approach’ to organise effective collabora-tion around the development of essential LCI datasets inindustry. Availability of more and better LCI datasets, andeasy exchange across the supply chain and with thirdparties, is an absolute prerequisite for industry and societyto progress on the path of sustainability.
5 Access to the data
The data and information generated by this project are madepublicly available via different ‘layers’. The overall projectcontext, goal, scope, and key data/conclusions are providedin this paper. Details on the calculation method for GHGemissions from oil palm products are covered in Liedkeet al. (2017).
In addition, for each surfactant and precursor, a 3–5 page‘Environmental Factsheet’ can be downloaded fromERASM’s website (www.erasm.org). These factsheetscontain some more detailed information on the LCI, theprocesses, PED, and GWP, per individual substance.
The full LCI datasets from the SLE project can be obtainedin one of the following data formats: EcoSpold 2.0, ILCDentry level and GaBi, or as Excel files. All these files are madeaccessible free of charge via the ERASM website. The elec-tronic data formats contain all relevant metadata about theLCIs and their set-up (e.g. representativeness, substanceCAS no., allocations used, and geographical scope).Furthermore, the LCI datasets are made available to GaBisoftware customers. Finally, the data are accessible in ILCD
Int J Life Cycle Assess
format from the ELCD database (http://eplca.jrc.ec.europa.eu/ELCD3).
Any enquiries about the data should be directed toERASM.
Acknowledgments The authors want to acknowledge ERASM(www.erasm.org) for funding this project. ERASM was created in1991 and is a joint platform of the European detergent and surfactantsproducers represented by their associations A.I.S.E (AssociationInternationale de la Savonnerie, de la Détergence et des Produitsd’Entretien) and CESIO (Comité Européen des Agents Surface et deleurs Intermédiaires Organiques). ERASM initiates and coordinatesjoint industry activities for improving and enlarging the basis for andthe knowledge about the risk assessment and sustainability of detergent-based surfactants in environmental compartments.
Additional members of the SLE task force and/or participating com-panies that have contributed expertise to the project are Xavier González(Kao), Florent Schuschitz (Stepan), Anne Thomasson (Solvay Novecare),Mark Stalmans (P&G), Gert Vanhoof (P&G), Tom Inslegers (P&G),Wolfgang Leonhardt (Evonik), and Luis Gamez Lopez (CEPSA).
The authors also wish to acknowledge the team of PE International/thinkstep who have actively contributed to the study: Cecilia MakishiColodel, Anja Lehmann, Alexander Liedke, Sabine Deimling, MariaFernanda Gonzalez, Garance Wilbert, Sebastian Gollnow, and ThiloKupfer. Diana Eggers is currently with Quantis.
Tim Killeen (formerly with WWF) and the RSPO (Roundtable onSustainable Palm Oil) are thanked for providing early access to scientificpapers with recent information on land use in countries of interest.
Finally, we wish to thank the peer reviewers, Walter Kloepffer,Yannick Leguern, Charlotte Petiot, and Jannick Schmidt, for their guid-ance and input to the project.
Open Access This article is distributed under the terms of the CreativeCommons At t r ibut ion 4 .0 In te rna t ional License (h t tp : / /creativecommons.org/licenses/by/4.0/), which permits unrestricted use,distribution, and reproduction in any medium, provided you giveappropriate credit to the original author(s) and the source, provide a linkto the Creative Commons license, and indicate if changes were made.
References
A.I.S.E (2014) A.I.S.E. PEF Pilot on household liquid laundry detergents.Presentation at PEF World Forum, October 2014, Berlin
Arpe H-J (2010) Industrial organic chemistry, 5th edn. Wiley-VCHVerlag, Weinheim
Berna JL, Cavalli L, Renta C (1995) A life cycle inventory for the pro-duction of linear alkylbenzene sulphonates in Europe. Tenside SurfDet 32:122–127
CEFIC-Franklin (1994) Resource and environmental profile analysis ofpetrochemical and oleochemical surfactants produced in Europe.Phase II Final Report (and related reports), Franklin Associates,LTD
Curran MA (2007) Co-product and input allocation approaches forcreating life cycle inventory data: a literature review. Int J LifeCycle Assess 1:65–78 Special Issue Ecoinvent database. www.ecoinvent.ch
EP0370273 A1 (1990) Fatty alcohol mixtures and their ethoxylates hav-ing low temperature characteristics, May 30, 1990; Karl-Heinz Dr.Schmid, Hans Peter Dr. Kubersky, Günter Dr. Demmering, AlfredDr. Meffert, Weniger, Henkel KGaA
ERASM SLE (2011) Feasibility study for updating the life cycle in-ventory data of commercial surfactants production. Final Report
of the Pilot Phase, prepared by PE International and ERASM(www.erasm.org), 44 p
ERASM SLE (2014) Surfactant life cycle and ecofootprinting project:updating the life cycle inventories for commercial surfactant produc-tion. Final Report by PE International for ERASM (www.erasm.org),186 p
Ernst M (2012) BASF SE-Verfahren zur Synthese von N, N-Dimethyl-1,3-Diaminopropan (DMAPA), EU-patent EP 1 945 603 B1 (inGerman)
Franke M et al (1995) A life cycle inventory for the production of petro-chemical intermediates in Europe. Tenside Surf Det 32:384–396
GaBi 6 (2013) Dataset documentation for the software-system and data-bases. LBP, University of Stuttgart and PE international AG,Leinfelden-Echterdingen 2013 (http://documentation.gabi-software.com)
GHG Protocol, WRI and WBCSD (2011) The greenhouse gas protocol:product life cycle accounting and reporting standard. WorldResources Institute and World Business Council for SustainableDevelopment, www.ghgprotocol.org, Accessed 2014
Guinée JB, Gorrée M, Heijungs R, Huppes G, Kleijn R, de Koning, A,van Oers L, Wegener Sleeswijk A, Suh S, Udo de Haes HA, deBruijn H, van Duin R, MAJ Huijbregts (2002) Handbook on lifecycle assessment. Operational guide to the ISO standards. I:LCA in perspective. IIa: Guide. IIb: Operational annex. III:Scientif ic background. Kluwer Academic Publishers,Dordrecht, ISBN 1-4020-0228-9, 2002, 692 p
Hirsinger F, Schick K-P (1995) A life-cycle inventory for the productionof alcohol sulfates in Europe. Tenside Surf Det 32:128–139
ILCD (2010) European Commission, ILCD Handbook – General guidefor Life Cycle Assessment (LCA) - Detailed guidance (http://eplca.jrc.ec.europa.eu)
Intergovernmental Panel on Climate Change (IPCC) (2007) In: PachauriRK, Reisinger A (eds) IPCC fourth assessment report (AR4), CoreWriting Team. IPCC, Geneva
International Standard Organisation (ISO) (2006a) Environmental man-agement—life cycle assessment: principles and framework. ISO14040, Geneva
International Standard Organisation (ISO) (2006b) Environmental man-agement—life cycle assessment: requirements and guidelines. ISO14044, Geneva
Kloepffer W (1997) In defense of the cumulative energy demand.Editorial Int J Life Cycle Assess 2(2):61
Kocal JA et al (2001) Production of linear alkylbenzene. Appl Catal AGen 221:295–301
Liedke A, Eggers D, Gruenenwald T, Mckeown P, Schneider C,Schowanek D, Gonzalez M, Lehmann A (2017) Calculation ofgreenhouse gas (GHG) emissions caused by direct land use changeand cultivation on peat soil for palm kernel oil-based precursors ofsurfactants. Report for the ERASM Surfactant Life Cycle andEcofootprinting (SLE) Project, July 2017. http://www.erasm.org
PEF Guidance (2014) Guidance for the implementation of the EU PEFduring the EF pilot phase—Version 4.0 (http://ec.europa.eu/environment/eussd/smgp/pef_pilots.htm)
Plastics Europe (2011) Eco-profiles and environmental declarations,PlasticsEurope, Version 2.0 (April 2011)
Rebitzer G, Ekvall T, Frischknecht R, Hunkeler D, Norris G, Rydberg T,Schmidt W-P, Suh S, Weidema BP, Pennington DW (2004) Lifecycle assessment: part 1: framework, goal and scope definition,inventory analysis, and applications. Environ Int 30:701–720
Russel A, Ekvall T, Baumann H (2005) Life cycle assessment—introduction and overview. J Clean Prod 13:1207–1210
Rosenbaum R et al (2008) USEtox—the UNEP-SETAC toxicity model:recommended characterization factors for human toxicity and fresh-water ecotoxicity in life cycle impact assessment. Int J Life CycleAssess 13:532–546
Int J Life Cycle Assess
Schul W, Hirsinger F, Schick K-P (1995) A life-cycle inventory for theproduction of detergent range alcohol ethoxylates in Europe.Tenside Surf Det 32:171–192
SoFi Software (2007-2016) Enterprise sustainability software, thinkstepAG, copyright, TM, Stuttgart, Echterdingen. (http://www.sofi-software.com)
Stalmans M, Berenbold H, Berna JL, Cavalli L, Dillarstone A, FrankeM, Hirsinger F, Janzen D, Kosswig K, Postlethwaite D, RappertT, Renta C, Scharer D, Schick K-P, Schul W, Thomas H, VanSloten R (1995) European life-cycle inventory for detergent sur-factants production. Tenside Surf Det 32:84–109
Thomas H (1995) A life-cycle inventory for the production of alcoholethoxy sulphates in Europe. Tenside Surf Det 32:140–151
Van Cauwenberge G (2009) BASF SE, Method for producing ethyleneamines and ethanol amines from monoethylene glycol (MEG).Patent WO 2007093514 A1
Ullmann (2010) Ullmann’s encyclopedia of industrial chemistry. JohnWiley & Sons, Inc., Hoboken
UNEP (2011) UNEP/SETAC, Global guidance principles for Life CycleAssessment databases—a basis for greener processes and products,2011
US 6740783 B1 (2004) Process for preparing dimethyl ether from crudemethanol, May 25, 2004, Ki-Won Jun, Hyun-Seog Roh, Kew HoLee
Zoller U, Sosis, P (2008) Handbook of detergents: part F: production, vol142. CRC Press, Boca Raton
Int J Life Cycle Assess