Embed Size (px)
Citation preview
SPE 38312
New Analytic Techniques for Petroleum Fluid Characterization Using Molar RefractionHassan Touba, SPE, G.Ali Mansoori, SPE, U. of Illinois at Chicago, and Amir M. Sam Sarem, SPE, Improved Petroleum Recovery Consultants
Abstract Molar refraction of pure hydrocarbons, petroleum fractions, and other compounds present in petroleum are shown to represent well the asymmetry of such fluids. Molar refraction is used to correlate density, parachor, and other properties of hydrocarbons with an accuracy that was not achieved before. Various calculations are made to demonstrate the accuracy of the proposed new analytic techniques for various reservoir fluids characterizing properties. Molar refraction characterizes the pure as well as the complex hydrocarbon mixtures and can be measured directly and accurately. It is shown that molar refraction is a more appropriate property to correlate the asymmetry of hydrocarbon fractions than the other existing methods. Plenty of the molar refraction data have been reported in the API Data Book for all the hydrocarbons and non-hydrocarbon compounds making it possible to extend the applicability of the proposed technique to high molecular weight ranges.
Introduction
The molar refraction which can be measured in the laboratory is a direct measure of the London dispersion forces which affect the PVT behavior of pure fluids and mixtures. The molar refraction, R. is defined by the following equation: 2 2 R=[(n -1)/(n +2)]v ........................................ (1)
507
where n is the index of refraction and v is the molar volume. The molar refraction of a substance can also be expressed in
terms of the polarizability by using Clausius-Masotti . 1
equation
R=(4/3)N0 a ............................................. (2)
where N0
is the Avogadro number and a is the polarizability.
If a substance has a permanent dipole moment. then the polarizability a is the sum of two tenns:
o. = O.o+O.µ- ................................................. ( 3 )
where a0
is the distortion polarizability related to the
displacement of the electronic cloud of a molecule with no permanent dipole moment in an electrical field and o. µ is theorientation polarizability which arises from the tendency of the permanent dipole moment µ to be oriented in the direction of
the applied field. The orientation polarizability, °'w is relatedto the dipole moment and is inversely proportional to the absolute temperaturel .
2 aµ=µ /(3kT) .............................................. (4)
In this equation, k is Boltzmann constant and T is the absolute temperature.
Substituting Eqns. (3) and (4) into Eq. (2), we get the following equation for the molar refraction.
2 R = (4/3) N
0 [o.
0 + µ /(3kT)] .............................. (5)
We may assume methane as a reference substance for which
the dipole moment is zero (µCHI = 0), and obtain the molar
refraction of other substances with respect to methane.
2
R* = R/Rc84 = [a0 + µ 2/(3k1)] /«o,CH4 ................ ( 6)
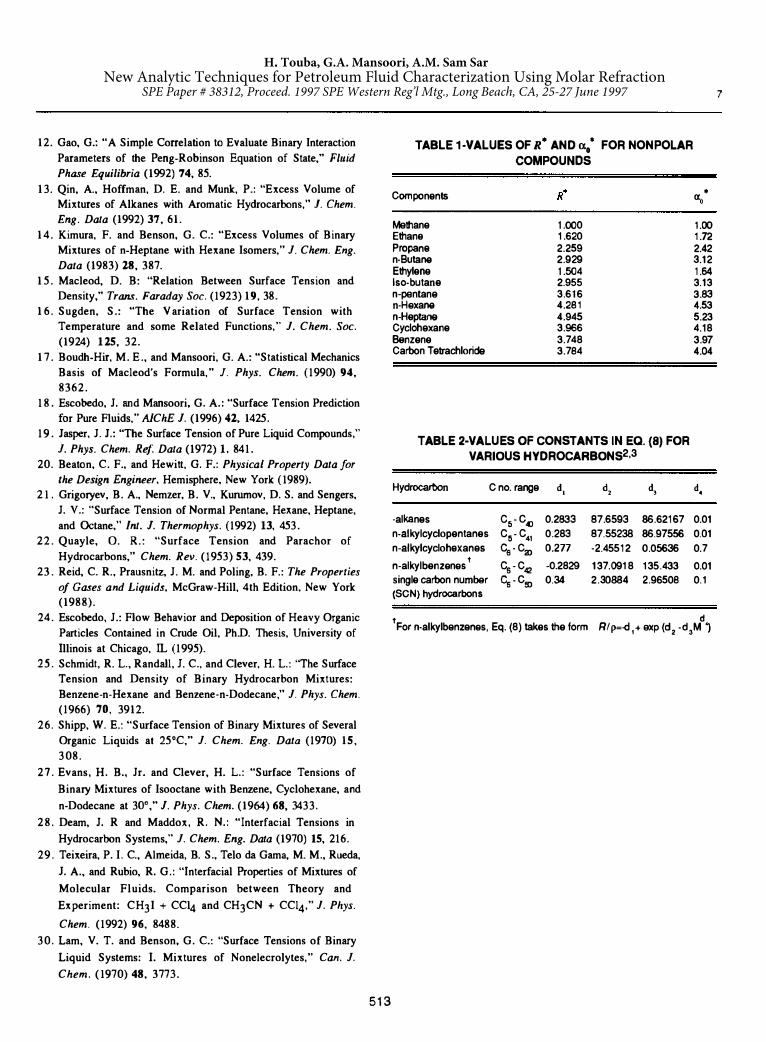
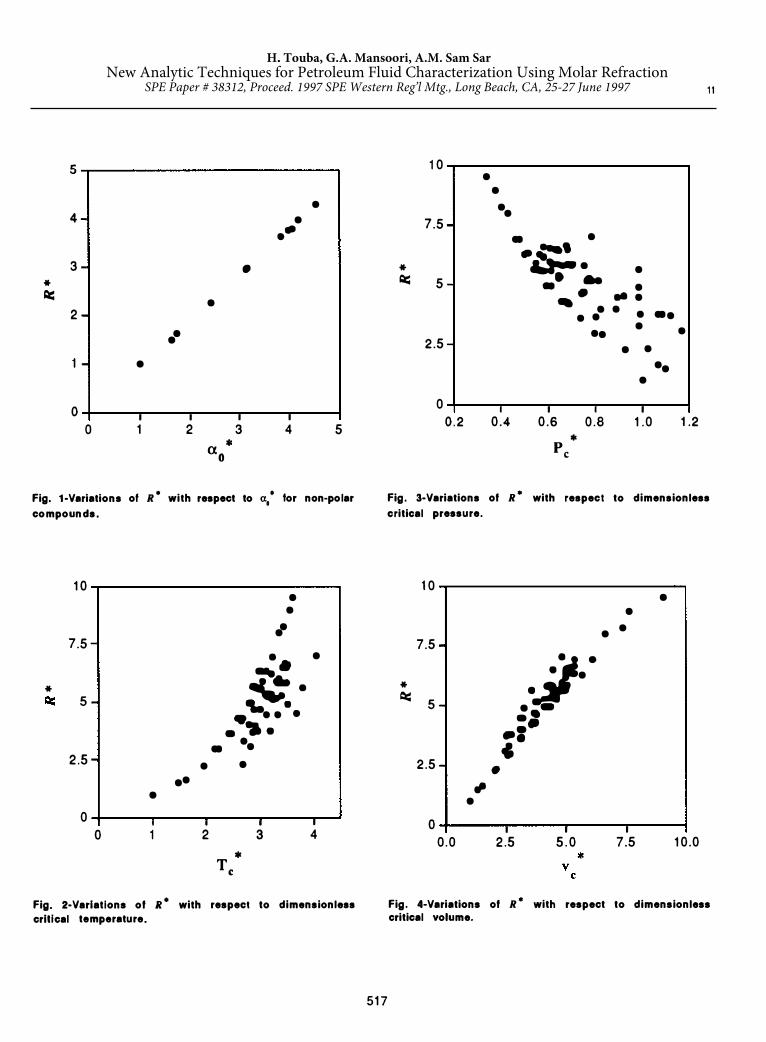
Fig. 1 represents the variations of R "' with respect to
o./=a.0 /o.0,CH4 for the nonpolar pure liquids listed in Table 1. According to Fig. 1, it can be seen that R "' is linearly proportional to a./.
It can be shown that the interaction between molecules are intimately related to light dispersion. As light travels through a substance, the valance electrons of the molecules are disturbed so that the light is refracted. The degree of absorption and transmission of light depends on the instantaneous charge distribution of these electrons. The same charge distribution is responsible for the induced dipole moment expressed in London dispersion potential energy, <I> d• which is approximated by the following equation 1.
clld = -(2/3) hv0 2tr6 ......................................... (7)
where r is the intermolecular distance, h is Plank's constant and v0 is the characteristic frequency of the molecule which is the same as the one used for dispersion of light by a molecule. Therefore, molar refraction is a direct measure of London dispersion forces which influence the volumetric behavior of fluids.
Riazi and Al-Sahhaf2,3 proposed the following correlation for the estimation of molar refraction in terms of molecular weight for n-alkanes, n-alkylcyclopentanes, n-alkylcyclohexanes, nalkylbenzenes and single carbon number hydrocarbons existing in crude oils and hydrocarbon-plus fractions.
Rip =d1 - exp(di -d3Md4 ) ................................. (8)
In this equation, Rand p are the molar refraction and density, respectively, M is the molecular weight, and constants d1 , dz , d3
and d4 are given for various hydrocarbons in Table 2. The above correlation can also be applied to petroleum mixtures using a pseudocompound approach. The authors assumed that the pseudocompounds in a petroleum mixture are n-alkanes (paraffins), n-alkylcyclopentanes (naphthenes), and nalkylbenzenes (aromatics), each having a molecular weight the same as that of the fraction in the petroleum mixture.
Variations of the dimensionless molar refractions R* for the compounds listed in Table 3 have been plotted versus their dimensionless critical properties <T/ =T/Ic,CH4• pc* =P/Pc,CH4• v / =v/v c, rn4) in Figs. 2-4. According to these figures, there is not a direct relationship between the molar refraction and critical temperature and pressure. However, Fig. 4 depicts an approximate linear relationship between the dimensionless molar refraction and critical volume, which arises from the fact
508
that the molar refraction is linearly related to molar volume as shown by Eq. (1). Therefore, the molar refraction which can be measured easier and more accurately than the critical volume may be utilized as the third parameter in equations of state.
There has been an extensive study on the development of mixing rules for the molar refraction of liquid mixtures. These mixing rules have been tested for binary systems at specified conditions4· 7. Some of these mixing rules such as LorentzLorentz and Galdstone-Dale relations are based on the electromagnetic theory of light assuming molecules to be dipoles or assemblies of dipoles induced by an external field.
In the literature, there have been different approaches to deal with molar refraction to predict various macroscopic properties. A summery of some of the applications of molar refraction in PVT and surface tension calculations is given in the following sections.
Prediction of the Density of Two-Phase Hydro
carbon Mixtures Using Molar Refraction
One of the earliest approaches to predict the density of hydrocarbon mixtures using molar refraction was proposed by Sarem and Campbell8. They introduced the molar refraction as the third parameter in the corresponding states treatment of petroleum fluids to predict the PVT behavior of hydrocarbons. Then using an appropriate mixing rule, they were also able to predict the liquid density of hydrocarbon mixtures fairly well particularly in the two phase region near the critical point Sarem and Campbell8 showed that the molar refraction has a linear relationship with the critical compressibility factor, Zc, for a number of pure normal hydrocarbons which are found in heptane-plus portion of gas condensate and volatile oil. They used an average molar refraction with the following pseudocritical mixing rules to predict the molar volume of liquid and vapor of several binary and ternary systems in the two phase and single phase region near the critical point.
and
P pc = T pc 2, x iZcJ I, I, X; Xi n ij ••••..•••••....•••••.•••••• ( 1 0) I I J
where T and P are pseudocritical temperature and pressure, pc pc
respectively, X;, xi are the mole fraction of components i and j, and zc. is its critical compressibility factor of component i.
I
The authors proposed two mixing rules for�- and nii in Eqs. IJ (9) and ( 10). In the first case, they used the geometric mean:
H. Touba, G.A. Mansoori, A.M. Sam SaremNew Analytic Techniques for Petroleum Fluid Characterization Using Molar Refraction
SPE Paper # 38312, Proceed. 1997 SPE Western Reg’l Mtg., Long Beach, CA, 25-27 June 1997
3
j)+l 1/2 �+l 1/2 � .. =(Zc.Tc. /Pc.) (Zc.Tc. /Pc) ................... (11)
lJ I I l J J J
1/2 1/2 niJ. = (Zc.Tc./Pc.) (Zc.TJPc.) .......................... ( 12)
I I l J J J
and in the second case they used the harmonic mean:
The exponent p in the above equations has the following values:
� = 2.2 for F � 0.4 � = -0.15 F + 2.44 � = 1.0
for 0.4 < F < 2.0 .............. (15) for F � 2.0
where the parameter "F' is defined by
F =(PI, xlc) / (TI, xl c.) .............................. ( 1 6) i I i 1
To calculate densities, the following steps were proposect8: First the parameter "F' has to be calculated in order to determine p. Using Eqs. (9) and (10), pseudocritical pressure andtemperature (P pc and T
pc), and reduced pressure and temperature(P
pr and T
pr) are obtained. The next steps are the computationof the average molar refraction and the selection of a referencepure nonnal hydrocarbon which has the same molar refraction asthe mixture. Based on the critical properties of the referencehydrocarbon and pseudocritical properties of the mixture,equivalent pressure and temperature can be obtained (P0
= P0 P
pr'T' = Tc T
pr>· The compressibility factor of the reference substance at P' and T' will be equivalent to the compressibility factor of the mixture at P and T.
Sarem and Campbell applied their method to predict the densities of three binary and ternary hydrocarbon mixtures and seven gas condensates having properties of the heptane-plus fractions. They reported an overall absolute average deviation in density of 3.70% for the mixing rules where the geometric mean was used, and an overall average deviation of 2.86% where the harmonic mean was used.
Appllcatlon of Molar Refraction In Prediction of Hydrocarbon Densities
Riazi and Mansoori9 presented a simple cubic equation of state
509
which predicts densities of hydrocarbon systems very accurately. In their equation, the repulsion term of Redlich-Kwong equation has been modified using molar refraction data.
P = RT/ (v-b) - a/ [T0·5 v(v+ b) J ........................... (1 7)
In this equation, the parameter "a" is
a=0.42748R2 T}.5/ Pc ..........................•........ (1 8)
The authors have considered the fact that for liquid systems in which the free space between molecules decreases, the role of parameter "b" becomes more important than that of parameter "a". Since the parameter "b" and molar refraction have the same physical meaning, "b" can be expressed in terms of molar refraction.
b=[ 0.08664RTC /Pc]o(R*,T, ) .......................... (19)
where R* is the ratio RIRcH4 as defined by Eq. (6), and o has
the following form.
o ·1 = 1 + (R* -1) { 0.02 (1- 0.92 exp(-1000 I T,11 )]- 0.035 (T,-1) } ...• (2 0)
In this derivation, the authors have considered that R* is almost insensitive to temperature.
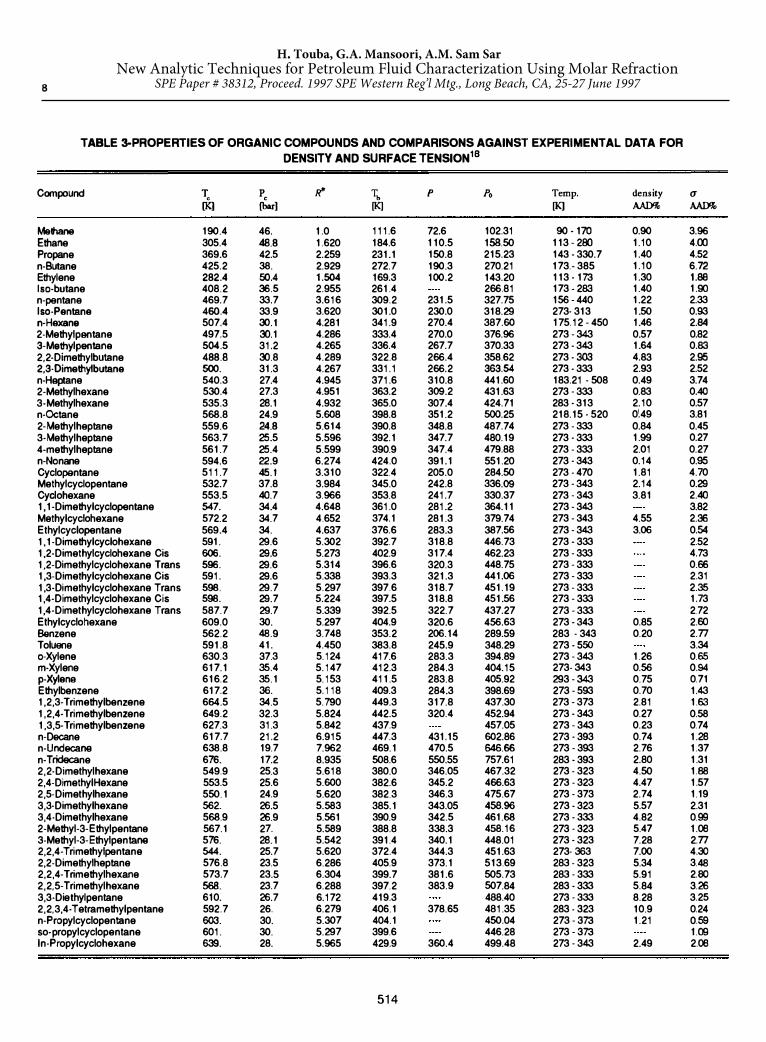
According to Table 3, the proposed equation was reported to have an overall absolute average deviation of 2.80% for the liquid density prediction of 94 compounds. In Table 3, molar refraction data were taken from TRC Thermodynamic Table10
or calculated using Eq. (1), RCH4 = 6.987 for the reference fluid
(methane). Riazi and Mansoori9 have reported an average error of 1.3% for the density prediction of pure C1 -C40 hydrocarbons and 1.7% for hydrocarbon mixtures (C1 -C40 ) at pressures as high as 700 bars and temperatures of 1000 K.
For mixtures, the authors have recommended the van der Waals one-fluid mixing rules for critical temperature and pressure 11.
* * Rm = I, I, xixi R.. . .................................... (23)
i j lJ
Although Riazi-Mansoori equation has a very good accuracy for the mixture density calculations, it can not predict the excess
H.. Touba, G.A. Mansoori, A.M. Sam SarNew Analytic Techniques for Petroleum Fluid Characterization Using Molar Refraction
SPE Paper # 38312, Proceed. 1997 SPE Western Reg’l Mtg., Long Beach, CA, 25-27 June 1997
4
volume with the same ac.curacy. Therefore , we will present a method to derive an interaction parameter for this equation in the following section using corresponding states theories.
Development of a Correlation for Molecular Interaction Parameter of Rlazl-Mansoorl EOS
Interaction parameter �i has been used in equations of state for mixtures in order to take into account the interaction between unlike molecules of a mixture. The interaction term is proposed according to the following combining rules.
RM 1/2 Tc .. =(1-�J. )(Tc,Tc.) .................................. (2 4)
lJ l J
1/3 1/3 3 Pc .. =8Tc.,/ [(TJPc.) +(TJPc.) ] ................... (2 5)
lj lj I I J J
* * 1/3 * 1/3 3 R .. = (R. +R. ) / 8 ............................. (26)
IJ I J
In this work we will derive a correlation to predict the interaction parameter kii RM. According to the theories of corresponding states, macroscopic critical properties (vc , Tc, Pc) are related to the molecular properties£ (energy parameter) and o (distance parameter) by:
T c ex £ •••••••••••••••••••.••••••••••••••••••••••••••••••••• (27)
vcex CJ3 ••••.••.•.....••••••......•••.••.....•..••.•..•....• (2 8)
pc ex £/CJ3 ••••••...•.••••.••••••..••••••••••••••••••••••••.• (29)
Applying molecular parameters to Eq. (24 ), the following relationship will be obtained.
RM 1/2 Eij
= (1-�j
) (E;E) .••••••••••••.••••••.•••••.••.••.••.•. ( 3 0)
Multiplying both sides of the above equation by CJ ii 3
At this stage, we will apply the same theory to PengRobinson equation of state to derive a relation between interaction parameter and molecular properties. Peng-Robinson equation of state is widely used for thermodynamic property calculations:
P =RT / (v-b) - aa / [v(v+b)+b(v-b)J ..................... (32)
510
2 2a =0.45724R Tc / Pc ..................................... (33)
The van der Waals mixing rule may be used for mixtures:
aa =I. L x;xi (aa) .. .................................... (34) i j IJ
with the following interaction term
PR 1/2 (aa). = (1-�i· )[(aa). (aa)J ......•................. (35)
IJ I J
The Peng-Robinson parameter "a", is related to T/ !Pc and the corresponding molecular parameters.
aexT/fPcextCJ3 ••••••••••••••••••••.•.•••••••••••••••••• (36)
Using the equivalent of "a" from the above proportionality in Eq. (35), we can derive the following equation:
Comparing Eqs. (31) and (37), we will find a relationship between kii
PR, kii RM and molecular properties.
Rearranging the above equation and considering that O;=(o;+cri)/2, we obtain
RM PR 3 3 1/]. 3 (1-k;i )=(1-�i )(CJ; CJi ) /[(CJ;+cr}/2] ................ (39)
This relationship will be further simplified to contain only measurable quantities by considering that CJ3 0< TPc·
RM PR 1/2(1-k;i ) = 8 (1-�i ) [(TJP0.) (T0 /P0)] / I I J J
1/3 1/3 3 [(T0 . /P0.) +(TJPc .) ] ..... (40)
I I J J
Gao 12 developed a simple correlation to evaluate binary interaction parameters of the Peng-Robinson equation of state for light hydrocarbon mixtures (C1 -C10). In that correlation binary interaction, k;i PR, is a function of critical temperaturesand compressibility factors of the components.
z PR 1/2 °ij {1-kij
)=[2{TcTc.) /{Tc +Tc)] ...................... (41)l J l J
where Zc .. = (Zc_+ZJ / 2. lj l J
H.. Touba, G.A. Mansoori, A.M. Sam SarNew Analytic Techniques for Petroleum Fluid Characterization Using Molar Refraction
SPE Paper # 38312, Proceed. 1997 SPE Western Reg’l Mtg., Long Beach, CA, 25-27 June 1997
Replacing Eq. (41) into Eq. (40), we get
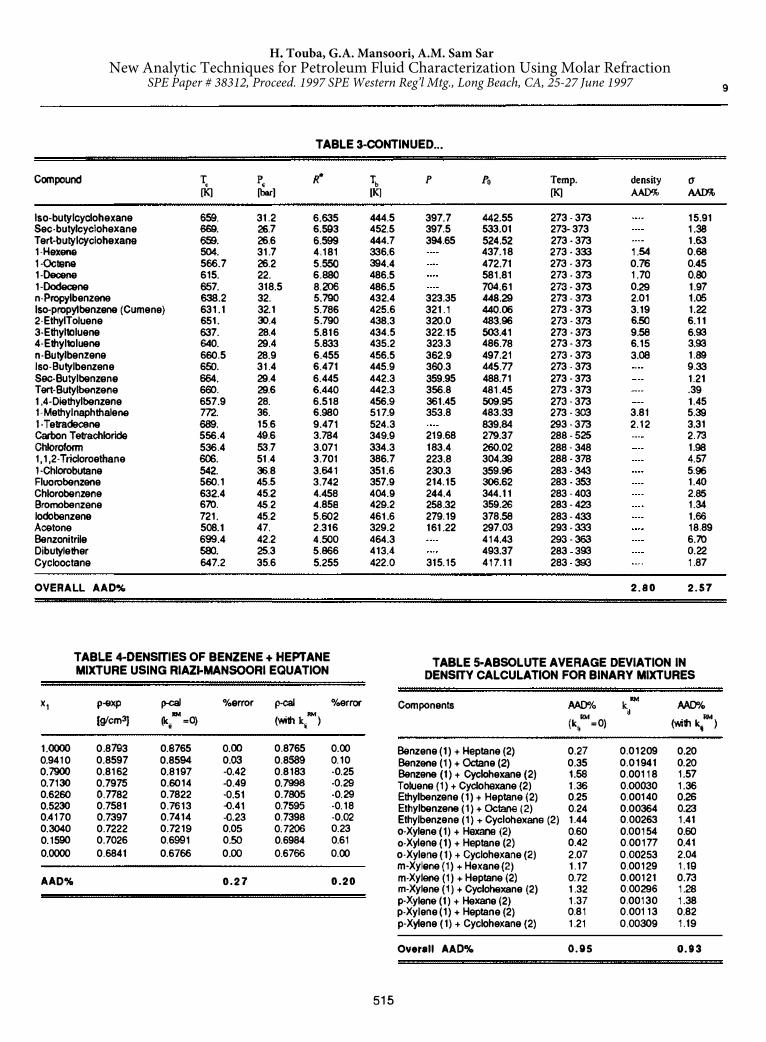
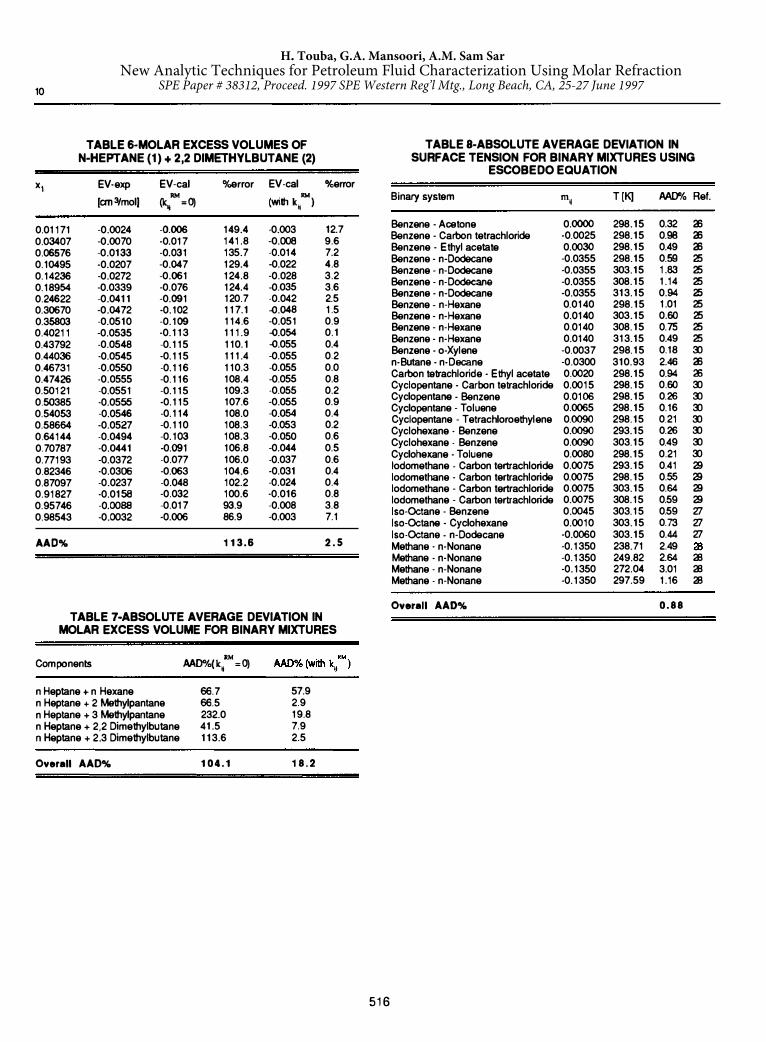
Applying the above equation for the interaction parameter, the densities of the binary system benzene-heptane are calculated at 20·c for various compositions. The results are compared with the experimental data 13 in Table 4. The absolute average deviation in density for this binary system has decreased from 0.27% for the original equation to 0.20% by utilizing the proposed interaction parameter equation. Similar comparisons with experimental data 13 are made for other binary systems at 20°C in Table 5. It can be seen from this table that the overall absolute average deviation in density is reduced from 0.95% to 0.93%. The improvement in the excess volume calculations is by far more appreciable. Table 6 presents the experimental molar excess volumes of the system n-heptane and 2,2-dimethylbutane14 at 2 5'C, the calculated excess volumes using the original Riazi-Mansoori equation and the equation with the interaction parameter. Similar calculations have been performed for other binary systems 14 at 2 5 'C in Table 7. The results show that by using Eq. (42) for the interaction parameter, the absolute average deviation decreases considerably for most of the binary systems.
Prediction of Surface Tensions Using Molar Refraction One of the important properties of liquids is the surface tension which is the force exerted in the plane of the surface per unit length. Hirschfedler et al.1 reviewed several methods to estimate the surface tension of pure liquids and liquid mixtures. Macleod15 proposed a simple empirical formula which was modified later by Sugden16 as follows.
4 <1=[P(p1- pv)] ........................................ ( 4 3 )
In this equation p 1 and p v are the molar densities of liquid and vapor, respectively, and Pis the parachor constant. Boudh-Hir and Mansoori 17 derived a statistical mechanical expression for surface tension which has the same density dependency as in Eq. (43). However the parameter P depends on the molecular structure and has a temperature functionality. Recently, Escobedo and Mansoori 18 proposed the following expression for the parameter P which is molar refraction dependent.
0.37 9 P = P
0 (1-T,) T, Exp (0.30066 /Tr+ 0.86442 T, ) .... (44)
511
Tr = T I Tc. and PO
is a temperature-independent, compounddependent constant which is related to molar refraction.
P0
= 39.64 31 (T/3112;P/16) [0.2 2 217 - 2.91042
3 * 2 x 10· ( R /Tb,
)] ...... (45)
where R* is the ratio of molar refractions, R/R c84 defined by
Eq. (6) and Thr
is the reduced normal boiling point. Since the parachor and the molar refraction both depends on the molecular structure, the above relationship can exist between these two properties.
In order to obtain the liquid and vapor molar densities in Eq. (43), the molar refraction-dependent equation of state by Riazi and Mansoori9 has been used.
Using Eqs. (43)-(45), Escobedo and Mansooril8 were able to predict the values of surface tension for 94 compounds. The results are reported in Table 3 from which it can be seen that the predictions obtained from these equations are quite in agreement with experimental data 10, I9-2 1. Experimental parachors were taken from the values reported by Quayle22 and the physical properties from Reid et al. 23. According to Table 3, the overall absolute average deviation for surface tension calculations is 2.57% for all temperatures considered.
Eqs. (43) and (44) have been extended to mixtures by Escobedo24. The following expression is proposed for the calculation of the surface tension of mixtures.
0.37 9 <Jm = [( l-T) T, exp (0.30066 /Tr+ 0.86442Tr ).
I v 4
(P o.m P 1.m -P o,,. Pv .m)] ....... (46)
where om is the surface tension of the mixture; T =T / T0 ; Tc r m m
is defined by Eq. ( 21); p 1 and p are the equilibrium ,Jll v,m
densities of the liquid and vapor phase, respectively, which can be calculated using Riazi-Mansoori equation along with the interaction parameter equation developed in the preceding section. To determine the temperature-independent parameters P o.m and P\,m for the liquid and vapor phase, the followingmixing rule is proposed.
The cross-parameter P0 .. is based on the following combining JJ
rule.
5
H.. Touba, G.A. Mansoori, A.M. Sam SarNew Analytic Techniques for Petroleum Fluid Characterization Using Molar Refraction
SPE Paper # 38312, Proceed. 1997 SPE Western Reg’l Mtg., Long Beach, CA, 25-27 June 1997
6
P .. =(l-m .. )(P0.P
0 .}112
•••••••••••••••••••••••••••••••• (48) 0>J IJ � J
where m;j is a binary interaction parameter. The crossparameters for temperature and pressure are calculated using Eqs. (24) and (25). respectively.
Escobedo24 predicted the surface tensions for 32 sets of dataof binary mixtures and compared the results against the experimental surface tension data25•30• In general, a goodagreement between the predicted and the experimental values has been reported for surface tensions as shown in Table 8.
Conclusion The results shown herein indicate that the use of molar refraction as the measure of asymmetry of reservoir fluid fractions is inherently simple and yields more precise results than other available methods. It can be applied for various reservoir engineering calculations in which reservoir fluid characterization are needed. The applications of molar refraction have been studied in predicting various properties including PVT behavior of hydrocarbons and surface tension.
Nomenclature
a= equation of state parameter b = equation of state parameter
-27 h = Plank's constant, 6.625 x 10 erg-sec
k= Boltzmann constant, 1.3804 x 10· 16 erg/K
k;J = interaction parameterM = molecular weight, g/mol n = index of refraction
23 � = Avogadro number, 6.023 x 10 molecules/mo! P = pressure, barP = parachor constant
P0 = parameter defmed by Eq. (46)r = intennolecular distance, A
R = molar refraction. cm3 /mo!T = absolute temperature. K v = molar volume, cm3 /mol:x = mole fraction Z = compressibility factor
Greek letters
a= polarizability, cm3
o = molar refraction-dependent parameter in Eq. ( 19)e = energy parameter in potential energy function, erg
<t> d = dispersion potential energy. erg
µ = pennanent dipole moment, Debye v O = characteristic frequency
p = molar density, moVcm3
512
a = distance parameter in potential energy function, A O'= surface tension, dyne/cm
Subscripts c = critical property
i & j = component i & jI= liquid
m = mixture property pc = pseudocritical property
r = redoced property v = vapor
Acknowledgments The authors are indebted to Dr. Joel Escobedo for helpful discussions. This research is supported in part by The National Science Foundation grant No. CTS-9108395.
References l . Hirschfelder, J. 0., Curtiss, C. F. and Bird, R. B.: Molecular
Theory of Gases and Liquids, John Wiley & sons, New York,
NY (1964). 2. Riazi, M. R. and Al-Sahhaf, T. A.: "Physical Properties of n
Alkanes and n-Alkylhydrocarbons: Application to Petroleum
Mixtures," Ind. Eng. Chem. Res. (1995) 34, 41 45 .3. Riazi, M. R. and Al-Sahhaf, T. A.: "Physical Properties of
Heavy Pelroleum Fractions and Crude Oils," Fluid Phase
Equilibria (1996) 117, 217.4. Heller, W. J.: "Remarks on Refractive Index Mixture Rules,"
J. Phys. Chem (1965). 69, 1123.5. Shindo, Y. and Kusano, K. J.: "Densities and Refractive Indices
of Aqueous Mixtures of Alkoxy Alcohols," Chem. Eng. Data
(1979) 24, 106.6. Aminabhavi, T. M. J.: "Use of Mixing Rules in the Analysis of
Data for Binary Liquid Mixtures," J. Chem. Eng. Data (1984)29, 54.
7. Taslc, A. Z., Djordjevic, B. D., Grozdanic, D. K. and
Radojkovic, N.: "Use of Mixing Rules in Predicting Refractive
Indices and Specific Refractivities for Some Binary Liquid
Mixtures," J. Chem. Eng. Data (1992) 37, 310.8. Sarem, A. M. and Campbell, J. M.: "Prediction of the Density
of Two-phase Hydrocarbon Systems Particularly Near the
Critical Region," SPE J. (1965) 234, 78.9. Riazi, M. R. and Mansoori, G. A.: "Simple Equation of State
Accurately Predicts Hydrocarbon Densities," Oil and Gas J.
(1993) 91, 108.10. Hall, K. R., (ed.): TRC Thermodynamic Table-Hydrocarbons,
Thermodynamic Research Center, Texas A&M Univ. System, College Station (1986).
11. Mansoori, G. A.: "Mixing Rules for Cubic Equation of State,"
American Chemical Society Symposium Series 300, Part 1 5,Washington, D. C.(1993 ), 314.
H.. Touba, G.A. Mansoori, A.M. Sam SarNew Analytic Techniques for Petroleum Fluid Characterization Using Molar Refraction
SPE Paper # 38312, Proceed. 1997 SPE Western Reg’l Mtg., Long Beach, CA, 25-27 June 1997
12. Gao, G.: "A Simple Correlation to Evaluate Binary Interaction Parameters of the Peng-Robinson Equation of State," Fluid
Phase Equilibria (1992) 74, 85.13. Qin, A., Hoffman, D. E. and Munk, P.: "Excess Volume of
Mixtures of Alkanes with Aromatic Hydrocarbons," J. Chem.
Eng. Data (1992) 37, 61.1 4. Kimura, F. and Benson, G. C.: "Excess Volumes of Binary
Mixtures of n-Heptane with Hexane Isomers," J. Chem. Eng.
Data (1983) 28, 387. 15. Macleod, D. B: "Relation Between Surface Tension and
Density," Trans. Faraday Soc. (1923) 19, 38. 16. Sugden, S.: "The Variation of Surface Tension with
Temperature and some Related Functions," J. Chem. Soc.
(1924) 12S, 32. 1 7. Boudh-Hir, M. E., and Mansoori, G. A.: "Statistical Mechanics
Basis of Macleod's Formula," J. Phys. Chem. (1990) 94, 8362.
18. Escobedo, J. and Mansoori, G. A.: "Surface Tension Predictionfor Pure Fluids," AJChE J. (1996) 42, 1425.
19. Jasper, J. J.: "The Surface Tension of Pure Liquid Compounds,"J. Phys. Chem. Ref. Data (1972) 1, 841.
20. Beaton, C. F., and Hewitt, G. F.: Physical Property Data for
the Design Engineer, Hemisphere, New York (1989). 21. Grigoryev, B. A., Nemzer, B. V., Kurumov, D. S. and Sengers,
J. V.: "Surface Tension of Normal Pentane, Hexane, Heptane,and Octane," Int. J. Thermophys. (1992) 13, 453.
22 . Quayle, 0. R.: "Surface Tension and Parachor ofHydrocarbons," Chem. Rev. (1953) S3, 439.
23. Reid, C.R., Prausnitz, J. M. and Poling, B. F.: The Properties
of Gases and Liquids, McGraw-Hill, 4th Edition, New York (1988).
24. Escobedo, J.: Flow Behavior and Deposition of Heavy Organic Particles Contained in Crude Oil, Ph.D. Thesis, University of Illinois at Chicago, IL ( 1995).
25. Schmidt, R. L., Randall, J. C., and Clever, H. L.: "The SurfaceTension and Density of Binary Hydrocarbon Mixtures:Benzene-n-Hexane and Benzene-n-Dodecane," J. Phys. Chem.
(1966) 70, 3912.26. Shipp, W. E.: "Surface Tension of Binary Mixtures of Several
Organic Liquids al 25°C," J. Chem. Eng. Data (1970) 1S,308.
2 7. Evans, H. B., Jr. and Clever, H. L.: "Surface Tensions of Binary Mixtures of Isooctane with Benzene, Cyclohexane, and n-Dodecane at 30°," J. Phys. Chem. (1964) 68, 3433.
28. Deam, J. R and Maddox, R. N.: "Interfacial Tensions in Hydrocarbon Systems," J. Chem. Eng. Data (1970) IS, 216.
29. Teixeira, P. I. C., Almeida, B. S., Telo da Gama, M. M., Rueda, 1. A., and Rubio, R. G.: "lnterfacial Properties of Mixtures of Molecular Fluids. Comparison between Theory andExperiment: CH3I + CCl4 and CH3CN + CCl4," J. Phys.
Chem. (1992) 96, 8488. 30. Lam, V. T. and Benson, G. C.: "Surface Tensions of Binary
Liquid Systems: I. Mixtures of Nonelecrolytes," Can. J.
Chem. (1970) 48, 3773.
513
TABLE 1-VALUES OF R• AND a; FOR NONPOLAR COMPOUNDS
Components
Methane Ethane Propane n-ButaneEthyleneI so-butanen-pentanen-Hexanen-HeptaneCyclohexaneBenzeneCarbon Tetrachloride
1.000 1.620 2.259 2.929 1.504 2.955 3.616 4.281 4.945 3.966 3.748 3.784
TABLE 2-VALUES OF CONSTANTS IN EQ. (8) FOR VARIOUS HVDROCARBONS2,3
Hydrocarbon C no. range d, d, d,
-alkanes C5-C'°
0.2833 87.6593 86.62167 n-alkylcyclopentanes C5-C
41 0.283 87.55238 86.97556n-alkylcyclohexanes C6 -C:;n 0 .277 -2.45512 0.05636n-alkylbenzenes t Ca-C
,12 -0.2829 137.0918 135.433single carbon number Cs-C
5l 0.34 2.30884 2.96508
(SCN) hydrocarbons
•
«.
1.00 1.72
2.42 3.12 1.64 3.13 3.83 4.53 5.23 4.18 3.97 4.04
d•
0.01 0.01 0.7 0.01 0.1
d tFor n-alkylbenzenes, Eq. (8) takes the form RI p=-d
1+ exp (d
2 -d
3M ')
7
H.. Touba, G.A. Mansoori, A.M. Sam SarNew Analytic Techniques for Petroleum Fluid Characterization Using Molar Refraction
SPE Paper # 38312, Proceed. 1997 SPE Western Reg’l Mtg., Long Beach, CA, 25-27 June 1997
8
TABLE 3-PROPERTIES OF ORGANIC COMPOUNDS AND COMPARISONS AGAINST EXPERIMENTAL DATA FOR
DENSITY AND SURFACE TENSION18
Compound T. pc Ft Tb p Po Temp. density u
[K] [bar] [K] [K] AAD% AAfY'!o
Methane 190.4 46. 1.0 111.6 72.6 102.31 90-170 0.90 3.96 Ethane 305.4 48.8 1.620 184.6 110.5 158.50 113-280 1.10 4.00 Propane 369.6 42.5 2.259 231.1 150.8 215.23 143-330.7 1.40 4.52
n-Butane 425.2 38. 2.929 272.7 190.3 270.21 173.- 385 1.10 6.72 Ethylene 282.4 50.4 1.504 169.3 100.2 143.20 113-173 1.30 1.88 Isa-butane 408.2 36.5 2.955 261.4 266.81 173-283 1.40 1.90
n-pentane 469.7 33.7 3.616 309.2 231.5 327.75 156-440 1.22 2.33 lsa-Pentane 460.4 33.9 3.620 301.0 230.0 318.29 273-313 1.50 0.93 n-Hexane 507.4 30.1 4.281 341.9 270.4 387.60 175.12-450 1.46 2.84 2-Methylpentane 497.5 30.1 4.286 333.4 270.0 376.96 273-343 0.57 0.82 3-Methylpentane 504.5 31.2 4.265 336.4 267.7 370.33 273-343 1.64 0.83 2,2-Dimethylbutane 488.8 30.8 4.289 322.8 266.4 358.62 273-303 4.83 2.95 2,3-Dimethylbutane 500. 31.3 4.267 331.1 266.2 363.54 273-333 2.93 2.52 n-Heptane 540.3 27.4 4.945 371.6 310.8 441.60 183.21 · 508 0.49 3.74 2-Methylhexane 530.4 27.3 4.951 363.2 309.2 431.63 273 .333 0.83 0.40 3-Methylhexane 535.3 28.1 4.932 365.0 307.4 424.71 283 · 313 2.10 0.57
n-Octane 568.8 24.9 5.608 398.8 351.2 500.25 218.15 -520 0(49 3.81 2-Methylheptane 559.6 24.8 5.614 390.8 348.8 487.74 273 -333 0.84 0.45 3-Methylheptane 563.7 25.5 5.596 392.1 347.7 480.19 273 .333 1.99 0.27 4-methylheptane 561.7 25.4 5.599 390.9 347.4 479.88 273 -333 2.01 0.27
n-Nanane 594.6 22.9 6.274 424.0 391.1 551.20 273 .343 0.14 0.95 Cyclopentane 511.7 45.1 3.310 322.4 205.0 284.50 273 -470 1.81 4.70 Methylcyclopentane 532.7 37.8 3.984 345.0 242.8 336.09 273-343 2.14 0.29
Cyclohexane 553.5 40.7 3.966 353.8 241.7 330.37 273 .343 3.81 2.40 1, 1-Dimethylcyclopentane 547. 34.4 4.648 361.0 281.2 364.11 273-343 3.82 Methylcyclohexane 572.2 34.7 4.652 374.1 281.3 379.74 273-343 4.55 2.36 Ethylcyclopentane 569.4 34. 4.637 376.6 283.3 387.56 273-343 3.06 0.54 1, 1-Dimethylcyclohexane 591. 29.6 5.302 392.7 318.8 446.73 273-333 2.52 1,2-Dimethylcyclohexane Cis 606. 29.6 5.273 402.9 317.4 462.23 273-333 4.73 1,2-Dimethylcyclohexane Trans 596. 29.6 5.314 396.6 320.3 448.75 273-333 0.66 1,3-Dimethylcyclohexane Cis 591. 29.6 5.338 393.3 321.3 441.06 273-333 2.31 1,3-Dimethylcyclohexane Trans 598. 29.7 5.297 397.6 318.7 451.19 273-333 2.35 1,4-Dimethylcyclohexane Cis 598. 29.7 5.224 397.5 318.8 451.56 273-333 1.73 1,4-Dimethylcyclohexane Trans 587.7 29.7 5.339 392.5 322.7 437.27 273-333 2.72 Ethylcyclohexane 609.0 30. 5.297 404.9 320.6 456.63 273-343 0.85 2.60 Benzene 562.2 48.9 3.748 353.2 206.14 289.59 283 · 343 0.20 2.nToluene 591.8 41. 4.450 383.8 245.9 348.29 273-550 3.34a-Xylene 630.3 37.3 5.124 417.6 283.3 394.89 273-343 1.26 0.65m-Xylene 617.1 35.4 5.147 412.3 284.3 404.15 273-343 0.56 0.94 p-Xylene 616.2 35.1 5.153 411.5 283.8 405.92 293-343 0.75 0.71 Ethylbenzene 617.2 36. 5.118 409.3 284.3 398.69 273-593 0.70 1.43 1,2,3-Trimethylbenzene 664.5 34.5 5.790 449.3 317.8 437.30 273-373 2.81 1.63 1,2,4-Trimethylbenzene 649.2 32.3 5.824 442.5 320.4 452.94 273-343 0.27 0.58 1,3,5-T rimethylbenzene 627.3 31.3 5.842 437.9 457.05 273-343 0.23 0.74
n-Decane 617.7 21.2 6.915 447.3 431.15 602.86 273 .393 0.74 1.28n-Undecane 638.8 19.7 7.962 469.1 470.5 646.66 273 -393 2.76 1.37n-Tridecane 676. 17.2 8.935 508.6 550.55 757.61 283 -393 2.80 1.31 2,2-Dimethylhexane 549.9 25.3 5.618 380.0 346.05 467.32 273 -323 4.50 1.882,4-Dimethyl Hexane 553.5 25.6 5.600 382.6 345.2 466.63 273 -323 4.47 1.57 2,5-Dimethylhexane 550.1 24.9 5.620 382.3 346.3 475.67 273 -373 2.74 1.19 3,3-Dimethylhexane 562. 26.5 5.583 385.1 343.05 458.96 273-323 5.57 2.31 3,4-Dimethylhexane 568.9 26.9 5.561 390.9 342.5 461.68 273 -333 4.82 0.99 2-Methyl-3-Ethylpentane 567.1 27. 5.589 388.8 338.3 458.16 273 .323 5.47 1.08 3-Methyl-3-Ethylpentane 576. 28.1 5.542 391.4 340.1 448.01 273 .323 7.28 2.n2,2,4-Trimethyl pentane 544. 25.7 5.620 372.4 344.3 451.63 273-363 7.00 4.30 2,2-Dimethylheptane 576.8 23.5 6.286 405.9 373.1 513.69 283 -323 5.34 3.48 2,2,4-Trimethylhexane 573.7 23.5 6.304 399.7 381.6 505.73 283 .333 5.91 2.802,2,5-Trimethylhexane 568. 23.7 6.288 397.2 383.9 507.84 283 -333 5.84 3.263,3-Diethylpentane 610. 26.7 6.172 419.3 488.40 273 .333 8.28 3.252,2,3,4-Tetramethylpentane 592.7 26. 6.279 406.1 378.65 481.35 283 .323 10.9 0.24
n-Propylcyclopentane 603. 30. 5.307 404.1 450.04 273-373 1.21 0.59so-propylcyclopentane 601. 30. 5.297 399.6 446.28 273 -373 1.09 ln -Propylcyclohexane 639. 28. 5.965 429.9 360.4 499.48 273 .343 2.49 2.08
514
H.. Touba, G.A. Mansoori, A.M. Sam SarNew Analytic Techniques for Petroleum Fluid Characterization Using Molar Refraction
SPE Paper # 38312, Proceed. 1997 SPE Western Reg’l Mtg., Long Beach, CA, 25-27 June 1997
9
TABLE 3-CONTINUED ...
Compound T, P. ,t Tb p Po Temp. density er
[K] [bar] [K] [K] AAD% AAD%
lso-butylcyclohexane 659. 31.2 6.635 444.5 397.7 442.55 273 .373 15.91 Sec-butylcyclohexane 669. 26.7 6.583 452.5 397.5 533.01 273- 373 1.38 Tert-butylcyclohexane 659. 26.6 6.599 444.7 394.65 524.52 273-373 1.63 1-Hexene 504. 31.7 4,181 336.6 437.18 273-333 1.54 0.68 1·0clen8 566.7 26.2 5.550 394.4 472.71 273-373 0.76 0.45 1-Decene 615. 22. 6.880 486.5 581.81 273 .373 1.70 O.&:I
1-Dodecene 657. 318.5 8.206 486.5 704.61 273-373 0.29 1.97 n-Propylbenzene 638.2 32. 5.790 432.4 323.35 448,29 273 .373 2.01 1.05 lso -propytbenzene (Cumene} 631.1 32.1 5.786 425.6 321.1 440.06 273- 373 3.19 1.22 2-EthylToluene 651. 30.4 5.790 438.3 320.0 483.96 273-373 6.50 6.11 3-Elhyltoluene 637. 28.4 5.816 434.5 322.15 503.41 273 .373 9.58 6.93 4-Elhyltoluene 640. 29.4 5.833 435.2 323.3 486.78 273 -373 6.15 3.93 n-Butylbenzene 660.5 28.9 6.455 456.5 362.9 497.21 273 .373 3.08 1.89 lso-Butylbenzene 650. 31.4 6.471 445.9 360.3 445.n 273 · 373 9.33 Sec-Butyl benzene 654. 29.4 6.445 442.3 359.95 488.71 273 · 373 1.21 Tert -Butylbenzene 660. 29.6 6.440 442.3 356.8 481.45 273 .373 .39 1,4-Diethylbenzene 657.9 28. 6.518 456.9 361.45 509.95 273 .373 1.45 1-Methylnaphlhalene 772. 36. 6.980 517.9 353.8 483.33 273 -30:3 3.81 5.39 I· Tetradecene 689. 15.6 9.471 524.3 839.84 293 .373 2.12 3.31 Carbon Tetrachloride 556.4 49.6 3.784 349.9 219.68 279.37 288 .525 2.73 Chloroform 536.4 53.7 3.071 334.3 183.4 260.02 288 ·348 1.98 1, 1,2 • T ricloroethane 606. 51.4 3.701 386.7 223.8 304.39 288 - 378 4.57 l ·Chlorobutane 542. 36.8 3.641 351.6 230.3 359.96 283 343 5.96 Fluorobenzene 560,1 45.5 3.742 357.9 214.15 306.62 283 - 353 1.40 Chlorobenzene 632.4 45.2 4.458 404.9 244.4 344.11 283 · 403 2.85 Bromobenzene 670. 45.2 4.858 429.2 258.32 359.26 283 - 423 1.34
lodobenzene 721. 45.2 5.602 461.6 279.19 378.58 283 .433 1.66 Acetone 508.1 47. 2.316 329.2 161.22 297.03 293 .333 18.89 Benzonitrile 699.4 42.2 4.500 464.3 414.43 293 ·363 6.70 Dibutylether 580. 25.3 5.866 413.4 493.37 283 393 0.22 Cyclooctane 647.2 35.6 5.255 422.0 315.15 417.11 283 393 1.87
OVERALL AAD'% 2.80 2.57
TABLE 4-OENSITIES OF BENZENE+ HEPTANE TABLE 5-ABSOLUTE AVERAGE DEVIATION IN
MIXTURE USING RIAZI-MANSOORI EQUATION DENSITY CALCULATION FOR BINARY MIXTURES
x, p-exp p-cal %error p-cal %error Components MfY% k RM AAO'/o ltM
(wi1h k_""') {glcm3) (k. =O) (kt =0) (witl kt)
1.0000 0.8793 0.8765 0.00 0.8765 0.00 Benzene (1) + Heptane (2) 0.27 0.01209 0.20 0.9410 0.8597 0.8594 0.03 0.8589 0.10 Benzene (1) + Octane (2) 0.35 0.01941 0.20 0.7900 0.8162 0.8197 -0.42 0.8183 -0.25 Benzene (1) + Cyclohexane (2) 1.58 0.00118 1.57 0.7130 0.7975 0.6014 -0.49 0.7998 -0.29 Toluene (1) + Cyclohexane (2) 1.36 0.00030 1.36 0.6260 o.n82 0.7822 -0.51 0.7805 -0.29 Ethylbenzene (1) + Heptane (2) 0.25 0.00140 0.26 0.5230 0.7581 0.7613 -0.41 0.7595 -0.18 Ethylbenzene (1) + Octane (2) 0.24 0.00364 0.23 0.4170 0.7397 0.7414 -0.23 0.7398 -0.02 Ethylbenzene (1)-+- Cyclohexane (2) 1.44 0.00263 1.41 0.3040 0.7222 0.7219 0.05 0.7206 0.23 a-Xylene (1) + Hexane (2) 0.60 0.00154 0.60 0.1590 0.7026 0.6991 0.50 0.6984 0.61 a-Xylene (1) + Heptane (2) 0.42 0.00177 0.41 0.0000 0.6841 0.6766 0.00 0.6766 0.00 a-Xylene (1) + Cyclohexane (2) 2.07 0.00253 2.04
m-Xylene (1)-+- Hexane (2) 1.17 0.00129 1.19 AAD% 0.27 0.20 m- Xylene (1) + He ptane (2) 0.72 0.00121 0.73
m-Xylene ( 1) + Cyclohexane (2) 1.32 0.00 296 1.28 p-Xylene (1) + Hexane (2) 1.37 0.00130 1.38 p-Xylene (1) + Heptane (2) 0.81 0.00113 0.82 p-Xylene (1) + Cyclohexane (2) 1.21 0.00309 1.19
Overall AAD% 0.95 0.93
515
H.. Touba, G.A. Mansoori, A.M. Sam SarNew Analytic Techniques for Petroleum Fluid Characterization Using Molar Refraction
SPE Paper # 38312, Proceed. 1997 SPE Western Reg’l Mtg., Long Beach, CA, 25-27 June 1997
10
TABLE 6-MOLAR EXCESS VOLUMES OF N-HEPTANE (1) + 2,2 DIMETHYLBUTANE (2)
x, EV-exp EV-cal %error EV-cal %error
[an 3/moll RM
� =O) (with k.RM)
0.01171 -0.0024 -0.006 149.4 -0.003 12.7 0.03407 -0.0070 -0.017 141.8 -0.008 9.6 0.06576 -0.0133 -0.031 135.7 -0.014 7.2 0.10495 -0.0207 -0.047 129.4 -0.022 4.8 0.14236 -0.0272 -0.061 124.8 -0.028 3.2 0.18954 -0.0339 -0.076 124.4 -0.035 3.6 0.24622 -0.0411 -0.091 120.7 -0.042 2.5 0.30670 -0.0472 -0.102 117.1 -0.048 1.5 0.35803 -0.0510 -0.109 114.6 -0.051 0.9 0.40211 -0.0535 -0.113 111.9 -0.054 0.1 0.43792 -0.0548 -0.115 110.1 -0.055 0.4 0.44036 -0.0545 -0.115 111.4 -0.055 0.2 0.46731 -0.0550 -0.116 110.3 -0.055 0.0 0.47426 -0.0555 -0.116 108.4 -0.055 0.8 0.50121 -0.0551 -0.115 109.3 -0.055 0.2 0.50385 -0.0555 -0.115 107.6 -0.055 0.9 0.54053 -0.0546 -0.114 108.0 -0.054 0.4 0.58664 -0.0527 -0.110 108.3 -0.053 0.2 0.64144 -0.0494 -0.103 108.3 -0.050 0.6 0.70787 ·0.0441 -0.091 106.8 -0.044 0.5 0.77193 -0.0372 -0.077 106.0 -0.037 0.6 0.82346 ·0.0306 -0.063 104.6 -0.031 0.4 0.87097 -0.0237 -0.048 102.2 -0.024 0.4 0.91827 ·0.0158 -0.032 100.6 -0.016 0.8 0.95746 ·0.0088 -0.017 93.9 -0.008 3.8 0.98543 -0.0032 -0.006 86.9 -0.003 7.1
AAD% 113.6 2.5
TABLE 7-ABSOLUTE AVERAGE DEVIATION IN MOLAR EXCESS VOLUME FOR BINARY MIXTURES
Components
n Heptane + n Hexane n Heptane + 2 Methylpantane n Heptane + 3 Methylpantane n Heptane+ 2,2 Dimethylbutane n Heptane+ 2,3 Dimethylbutane
Overall AAD%
RM
AAD%(k, =O)
66.7 66.5 232.0 41.5 113.6
104.1
57.9 2.9 19.8 7.9 2.5
18.2
TABLE 8-ABSOLUTE AVERAGE DEVIATION IN SURFACE TENSION FOR BINARY MIXTURES USING
ESCOBEDO EQUATION
Binary system mij
T[KJ AAJY¾ Ref.
Benzene - Acetone 0.0000 298.15 0.32 a3 Benzene - Carbon tetrachloride -0.0025 298.15 0.98 a3 Benzene - Ethyl acetate 0.0030 298.15 0.49 a3 Benzene - n-Dodecane -0.0355 298.15 0.59 25
Benzene - n-Dodecane -0.0355 303.15 1.83 25
Benzene - n-Dodecane -0.0355 308.15 1.14 25
Benzene - n-Dodecane -0.0355 313.15 0.94 25
Benzene - n-Hexane 0.0140 298.15 1.01 25
Benzene - n-Hexane 0.0140 303.15 0.00 25
Benzene - n-Hexane 0.0140 308.15 0.75 25
Benzene - n-Hexane 0.0140 313.15 0.49 25
Benzene - o-Xylene -0.0037 298.15 0.18 3)
n-Butane - n-Decane -0.0300 310.93 2.46 a3 Carbon tetrachloride - Ethyl acetate 0.0020 298.15 0.94 a3 Cyclopentane - Carbon tetrachloride 0.0015 298.15 0.00 3)
Cyclopentane - Benzene 0.0106 298.15 0.26 3)
Cyclopentane - Toluene 0.0065 298.15 0.16 3)
Cyclopentane - Tetrachloroethylene 0.0090 298.15 0.21 3)
Cyclohexane • Benzene 0.0090 293.15 0.26 3)
Cyclohexane . Benzene 0.0090 303.15 0.49 3)
Cyclohexane • Toluene 0.0080 298.15 0.21 3)
lodomethane - Carbon tertrachloride 0.0075 293.15 0.41 29 lodomethane · Carbon tertrachloride 0.0075 298.15 0.55 29 lodomethane - Carbon tertrachloride 0.0075 303.15 0.64 29 lodomethane - Carbon tertrachloride 0.0075 308.15 0.59 29 Isa-Octane - Benzene 0.0045 303.15 0.59 'Zl
Isa-Octane - Cyclohexane 0.0010 303.15 0.73 'Zl
Isa-Octane - n-Dodecane -0.0060 303.15 0.44 'Zl
Methane · n-Nonane -0.1350 238.71 2.49 Methane • n-Nonane -0.1350 249.82 2.64 28
Methane· n-Nonane -0.1350 272.04 3.01 28
Methane• n-Nonane -0.1350 297.59 1.16 a3
Overall AAD% 0.88
516
H.. Touba, G.A. Mansoori, A.M. Sam SarNew Analytic Techniques for Petroleum Fluid Characterization Using Molar Refraction
SPE Paper # 38312, Proceed. 1997 SPE Western Reg’l Mtg., Long Beach, CA, 25-27 June 1997
11
5 10 •
•
• ••
4- • 7.5-
.- • •
-�' 3- • * �- •
* i:t: 5- . .. - . •
i:ic: .. •• ..
• • 2- • • • ••
••
•• ••
2.5-• •
1 - • • •
•
0 0 I I I I
I I I I 0.2 0.4 0.6 0.8 1.0 1.2
0 1 2 3 4 5 * *
CXO
Pc
Fig. 1-Variations of R • with respect to • for non-polar Fig. 3-Variations of R* with respect to dimensionless a
o
compounds. critical pressure.
10 10 • •
• •
••
• •
7.5- 7.5-
•• •
;· ... •
* �- * •
5- i:t: 5-.... ·. ··-• ••
. ... �: •
••
' 2.5-
• • 2.5- • •• ,,,
• •
0 I I I I 0
0 1 2 3 4 I I I
0.0 2.5 5.0 7.5 10.0 *
Tc
Fig. 2-Varlatlons of R* with respect to dimensionless Fig. 4-Variations of R0 with respect to dimensionless crlllcal temperature. critical volume.
517
H.. Touba, G.A. Mansoori, A.M. Sam SarNew Analytic Techniques for Petroleum Fluid Characterization Using Molar Refraction
SPE Paper # 38312, Proceed. 1997 SPE Western Reg’l Mtg., Long Beach, CA, 25-27 June 1997