Embed Size (px)
Citation preview

1
New Alternatives for Calculating Parks & Recreation Level of Service (LOS)
David Barth, AICP, ASLA, [email protected]
www.aecom.com
how would you classify the following spaces?
• Park, open space, public space, recreation area, natural area, greenway? other?
• Passive or active?U bl bl ?• Useable or unusable?
• Public or private?• Accessible or inaccessible?• “Countable” towards Level of Service?
how would you classify the following spaces?

2
how would you classify the following spaces? how would you classify the following spaces? how would you classify the following spaces?

3
how would you classify the following spaces? how would you classify the following spaces? how would you classify the following spaces?
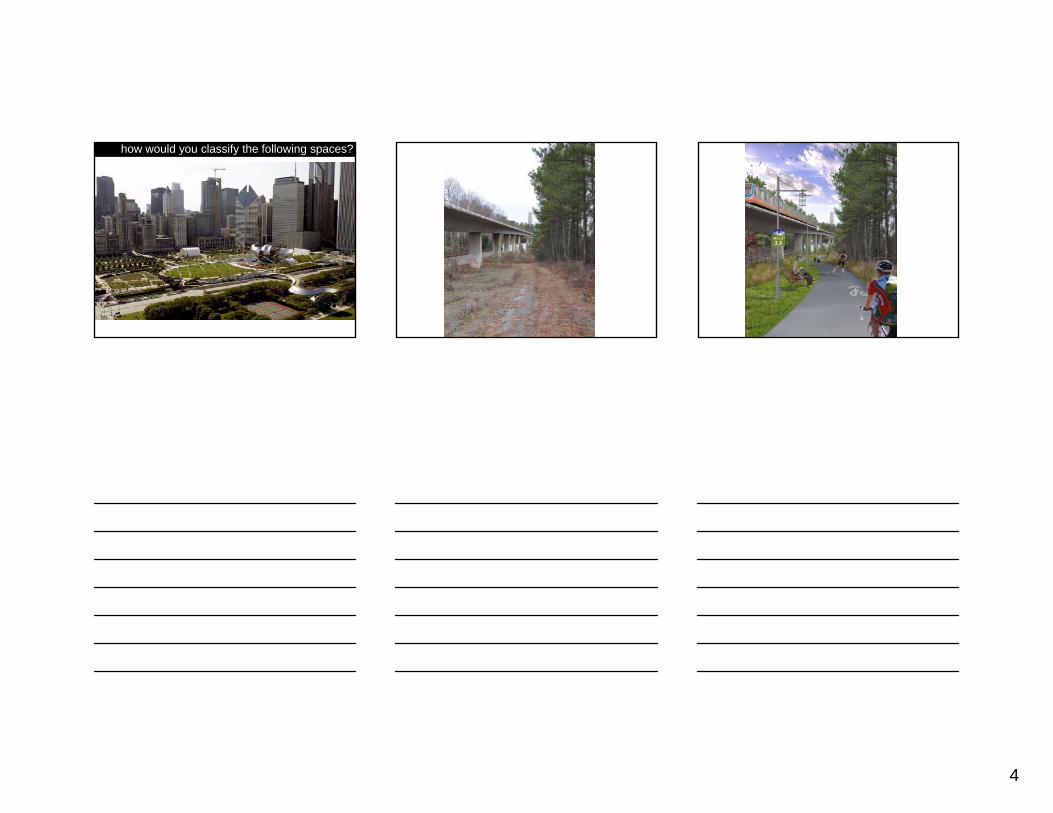
4
how would you classify the following spaces?

5
how would you classify the following spaces? how would you classify the following spaces?

6
how would you classify the following spaces? how would you classify the following spaces? how would you classify the following spaces?

7
how would you classify the following spaces? how would you classify the following spaces? how would you classify the following spaces?

8
“A major problem for [park] advocates and managers is that parks seem relatively simple and straight forward. People frequently say , “It’s not rocket science, it’s just a park” No! For j prockets… you need to be good at math. Parks require math plus horticulture, hydrology, psychology, sociology and communication”. They are immensely complicated.”
Historic models of parks and recreation systems in the US, 1850 – present…
Cranz, Politics of Park Design, 1982Pleasure Ground, 1850 – 1900
• Relief from evils of industrial city; escape to the “country”
• Fresh air, meadows, lakes and sunshine within the city
• Unstructured enjoyment a day• Unstructured enjoyment, a day in the park: sports, music, strolling, riding, cultural events
• Mowed lawns, naturalistic plantings

9
Cranz, Politics of Park Design, 1982Reform Park, 1900 – 1930
• Response to increased free time, dull office and factory work
• Moral defense against potential for “chaos” – saloons, dance halls, picture shows, etc
• 1st use of term “leisure time”• 1st use of term leisure time
• Masses incapable of undertaking their own recreation, esp. men and children
• Focus on organized activities, efficiency, park organizers, park leaders, play directors
Cranz, Politics of Park Design, 1982: Recreation Facility, 1930 – 1965
• Abandoned idealistic efforts to use parks as mechanisms of social change; no longer “my brother’s keeper”
• Park facilities an expected feature of urban life; no longer needed justificationj
• Recreation accepted as an essential of life, like health, education, work and religion
• “Basic”, “universal”, “essential”, “fundamental”, “important”
• Increase in demand for recreation
• Epitomized by the park bench and the cyclone fence

10
Cranz, Politics of Park Design, 1982Open Space System, 1965 – 1990
• Response to urban crisis: middle class flight from the urban city, avoidance of “unsafe” city parks
• Role of parks changed from relief and recreation to “stimulation” -“adventurous, colorful, seductive, chic, hip, hot and cool”
• “Anything goes” mentality: wine, rock music, bluegrass dancing on the snow, “Check-a-Child” child care, games, kite flying, bands, beer, feasts, movies
• Streets rather than parks viewed as most exciting spaces in the city
• Flexible parks with minimum development
Cranz, Defining the Sustainable Park: A Fifth Model, 2004: The Sustainable Park, 1990 - Present
• Will be adopted by municipal park departments between 1995 and 2015
• Focus on making cities more ecologically and socially balanced and
• Self -sufficient with regards to material resources
• New aesthetic forms emerge for parks and other urban landscapes
socially balanced and sustainable
• Increased ecological performance: native plants, restoration of natural systems, wildlife habitat, integration of technologies, sustainable construction and maintenance
• Play a role in solving larger urban problems outside their boundaries when they are integrated with the surrounding urban fabric
“justification for tax support for parks and recreation is proportionate to the number of people in a community who perceive they receive benefits from parks and
Crompton, 2007
benefits from parks and recreation agencies…”

11
Perception of Parks and Recreation (Crompton)
“…relatively discretionary, non-essential services. They are nice to have if they can be afforded after the important essential services have been funded.”
Perception of Parks and Recreation (Crompton)
“… perceived to contribute to alleviating problems that constitute the prevailing political concerns of policymakers
“…relatively discretionary, non-essential services. They are nice to have if they can be afforded after the important concerns of policymakers
who are responsible for allocating tax funds”
essential services have been funded.”
Gallup Poll: June 2011
What are the top issues facing the country today?
Economy 29%Unemployment, Lack of Jobs 26%Federal Budget Deficit 13%Lack of Government Leadership 11%Poor Healthcare or Hospitals 10%Education 5%Fuel Prices 4%Immigration 4%

12
Other Trends, Issues
• Growing
• Getting Older
• Becoming More Diverse
• Becoming More UrbanBecoming More Urban
• Demanding Smaller Government
What we know about planning today’s parks and recreation systems…
Parks and recreation systems are complex, integrated and comprehensive…

13
they create the framework for livable, sustainable communities…
Parks & Open Spaces
Parks & Open Spaces
Conservation Areas
Streets
Civic Buildings and Sites
Civic Buildings and Sites
SpacesSpaces
Trails and BikewaysTrails and Bikeways
they account for 30 – 40% of a community’s land mass…
Norfolk, VA• Parks• Community/Recreation
Centers• Libraries, Schools• Streets, Bikeways and Trails• Therapeutic Recreation
they are comprised of “layers” or “sub-systems”…
• Natural Areas, Water Access• Athletic Facilities• Urban Agriculture• Stormwater Drainage• Community Character• Programs• Operations & Maintenance

14
Miami-Dade CountyPrinciples:
• Equity• Access• Beauty• Multiple Benefits• Seamlessness• Sustainability
“sub-systems”
y
Creating a 50 Year, Unifying Vision for a Livable, Sustainable Miami-Dade County
• Great Parks• Great Public Spaces• Great Natural and Cultural Areas • Great Trails and Greenways• Great Streets
Downtown San Diego• Parks
• Plazas
• Open Spaces
• Special Use Facilities
“sub-systems”
• Water Access
• Streets and Sidewalks
• Trails
• Transit
Pinellas County, FL• Streets• Parks• Community Centers• Preserves• Sports Complexes• Boat Ramps
C lt l F iliti
“sub-systems”
• Cultural Facilities• Beaches• Greenways, Blueways
and Trails• Bike Lanes and Transit• Schools, Libraries• Public Art and Design

15
Buckhead, Atlanta• Central Gathering Spaces• Plazas• Neighborhood Parks• Beltline Parks• Community Park
Components
“sub-systems”
• Community Greens• Dog Runs• Destination Dog Parks• Natural Areas • Trails + Greenways• Street + Sidewalk
Improvements
each subsystem can generate significant benefits…
Economic Sustainability• Attracting Tourists• Attracting Businesses• Attracting Retirees• Enhancing Real Estate Values• Reducing Taxes• Stimulation of Equipment SalesEnvironmental Sustainability• Protecting Drinking Water• Controlling Flooding• Cleaning AirCleaning Air• Reducing Traffic Congestion• Reducing Energy Costs• Preserving Biological DiversitySocial Sustainability• Reducing Environmental Stress• Community Regeneration• Cultural and Historic Preservation• Facilitating Healthy Lifestyles• Alleviating Deviant Youth Behavior• Raising Levels of Education Attainment• Alleviating Unemployment Distress
(Community Benefits and Repositioning, John Crompton)
• Parks • Trails• Natural areas• Civic spaces
a well-planned and designed system can make a community a great place to live…
• Historic/ cultural venues
• Programs, concerts, festivals
• Low/ no cost

16
REFRESHParksAthletic Fields
Community Character
RECONNECTBikeways + Trails
Norfolk, VA
Bikeways + Trails
Water Access
REFOCUSCommunity + Recreation CentersPrograms
Operations + Maintenance
PARKS * Upgrade refresh

17

18

19
the system must respond to the needs and priorities of neighborhoods, residents, visitors and workers…
Quantitative
QualitativeAnecdotal
NEEDS

20
it must also respond to different contexts and lifestyles…
DPZ & Co.
systems must be measurable in order to plan, grow and prosper…
Equity (Delivery of Services)
Regulatory(Policies, Codes)
PARKS & OPEN
PARKS & OPEN
Concurrency
(Fair Share)
OPEN SPACE LOS
OPEN SPACE LOS
1. Acreage:• Population Standards• Benchmarking• Visioning/ Modeling
2. Facilities, Activities:• Population Standards
4. Quality:• Evaluation and “Grading”• Mapping/ Distribution
5. Programs:• Relevancy, Quality,
…but there’s no single authoritative standard or “right way to measure, and each community must decide for itself.
Population Standards• Demographic, Neighborhood Analysis
• Supply/ Demand
3. Access:• Walking, Bicycling, Driving, Transit• Parks• Facilities
Variety, Schedule• Mapping/ Distribution

21
61
1. Acreage

22
Columbia Pike – Existing Acreage LOS
Acreage Level of Service 2010 Population
Publicly Accessible Parks,
Open Space
2010 Acreage Level of Service
Population Source: Round 8.0 Cooperative Forecast - CPHD, Planning Division, Planning Research and Analysis Team (PRAT)Open Space Acreage Source: Arlington County Parks, Recreation & Cultural Resources
p pArlington County 212,300 1,094.35 5.15
Columbia Pike Corridor 39,900 259.30 6.50Columbia Pike Corridor- Mini Parks- Neighborhood Parks- Community Parks
39,900 156.27 3.92
Brookline, MA
Comparables
Population: 54,408Density: 8,060
Open Space: 612 Acres11.2 Acres per 1,000
ACREAGE: Quadrant acres/1,000Every resident, Every resident, neighborhood neighborhood
and community and community should have an should have an equal or similar equal or similar
allocation of allocation of park landpark land

23
Vision - City of Palm Coast Recreation and Parks Facilities Master Plan
Urban Neighborhood Park – 4 acres, ½ mile service Urban Community Park

24
Sports Complex City of Palm CoastExisting Park System
Existing Parkland: Activity Based Resource Based
Neighborhood Parks: 52.51 2.39Community Parks: 197.63 43.87Open Space Parks: 7.56 340.23Special Use Facilities: 145.22 113.74
Total Parkland: 346.92 500.23
Combined Total: 847.15 Acres
2007 Developed Parkland: 361.01 Ac
2007 Population: 70,376
2007 LOS: 5.1 Ac/ 1,000
Proposed Parkland: Activity Based Resource Based
Neighborhood Parks: 197.76 2.39Community Parks: 281.25 53.87Open Space Parks: 517.61 340.23Special Use Facilities: 270.22 113.74
Total Parkland: 1,266.84 510.23
C bi d T t l 1 777 07 A
City of Palm CoastParks System Vision
Combined Total: 1,777.07 Acres
2035 Projected Population: 166,869
2035 Level of Service: 10.6 Acres 1,000 People

25
2. Facilities, Activities Facilities by Quadrant Demographics

26
Walk Ride a bike, skate Sit outside, read Play on a
playground
Facility Access: Neighborhood (¼ - ½ mile)
playground Play catch, frisbee Picnic, sun bathe Play pick-up sports Fish without a boat Attend local
festival, concert, special event
Play organized indoor, outdoor competition sports
Exercise, attend classes/ lectures/
Facility Access: Community (3-5 miles)
social functions Swim recreationally or
competitively in a pool Paddle a canoe or
kayak Go boating Go to the beach
Facility LOS – Community Outreach

27
Community-Based City of Palm Coast - Population: 70,376 Community-Based Active Facility LOS – Suburban
Facility Existing SCORP LOS
Existing LOS
Adequate? Deficiency Revised LOS Based on Needs
Playground 5 1/10,000 1/14,000 No -4 1/8,000
Skate Park 1 NA 1/70,000 Yes 0 1/70,000
Basketball Court 4 1/5,000 1/17,5000 No -8 1/6,000
Football / Soccer Field
8 1/6,000 1/9,000 No -20 1/2,500
Baseball / Softball Field
4 1/5,000 1/17,500 No -10 1/5,000
Public Golf Course 0 1/50,000 N/A No -1 1/70,000
Racquetball Court 6 1/10,000 1/12,000 No -1 1/10,000
Swimming Pool 1 1/25,000 1/70,000 No -1 1/35,000
Tennis Court 17 1/2,000 1/4,000 No -10 1/2,500
Dog Park 1 NA 1/70,000 No -2 1/23,000
Community Center / Rec. Center
1 NA 1/70,000 No -1 1/35,000
Minimum Population Service Requirement Model (Miami-Dade County)Minimum Population Service Requirement = Recreation Supply
Recreation Demand
R ti S l [(t i l /d t i l%) ( k /d k %)] d il bl /
Facilities LOS – Demand/ Supply Formulas
Recreation Supply = [(typical use/day x typical%) + (peak use/day x peak %)] x days available/year
Recreation Demand = Expressed Use + Latent UseTotal Sample Total Sample
Capacity Demand Standards Model (City of Virginia Beach)
Capacity (maximum number of events based on conditions, usage guidelines)
Facility LOSDemand (actual and probable participation)
=
3. Access
• Develop criteria for both parks and facilities
• Map walking, bicycling, transit and driving distances, incl.driving distances, incl. barriers
• Map existing transit routes
• Identify voids in service areas
• Identify need for network improvements

28
Access
The Excellent City Park System – Peter Harnik
¼ Mile:‐ Multi‐Purpose Open
Space
½ Mile‐ Picnic Areas‐ Paved Trails
3 Miles:‐ Gymnasiums‐ Skate Parks
5 Miles:‐ Dog Parks
Fishing
Facility Access: City of Orlando
Paved Trails1 Mile‐ Playgrounds‐ Basketball Courts2 Miles‐ Swimming Pools‐ Senior Programs‐ Special Event Areas‐ Practice Fields
‐ Fishing‐ Boat Ramps‐ Canoe/Kayak Launches‐ Nature Walks‐ Lighted Baseball Fields‐ Lighted Softball Fields‐ Lighted Soccer Fields

29

30
Additional Park Land and Facilities Additional Park Land and Facilities Facilities - Context (the Transect)
DPZ & Co.

31
4. Quality Experience
• Develop Criteria (e.g. Access, Comfort, Image, Uses, Sociability)
• Determine “Graders” : Staff, Consultants, Advisory Committee, Peer Group, Users, etc
City of Sunrise• Proximity/Access/Linkages –
How connected is it?• Comfort and Image –
How does it look and feel?• Uses and Sociability –
Who’s using it, and when?
4. Quality Experience4. Quality Experience4. Quality ExperienceCity of Sunrise Evaluation Criteria
• Opportunities –How flexible is it?
• Sustainability –How does it contribute economically, socially and environmentally?
Existing Facilities Evaluation, Scoring
Exceeds Expectations:
• Exceptionally well maintained• Aesthetically pleasing• Genuinely safe• Wide variety of uses• Consistently high level of activity• Good design standards• Embraced heritage resources• Good access, sidewalk/mass transit• Score of 60-80

32
Existing Facilities Evaluation, Scoring
Meets Expectations:
• Generally well maintained• Aesthetically pleasing• Genuinely safe• Several different uses accommodated• Moderate level of activity• Good design standards• Reasonable connectivity• Generally compatible with surroundings• Score of 40-60
Existing Facilities Evaluation, Scoring
Does Not Meet Expectations:
• May still be well maintained and aesthetically pleasing• May not be perceived as safe by users• Few accommodated uses• Consistently low level of activity• May not be compatible with surrounding uses• Difficult, challenging to access• Score of 20-40

33
5. Programs
• Variety• Variety• Relevancy• Distance• Quality• Schedule

34
1. Acreage:• Population Standards• Benchmarking• Visioning/ Modeling
2. Facilities, Activities:• Population Standards
4. Quality:• Evaluation and “Grading”• Mapping/ Distribution
5. Programs:• Relevancy, Quality,
Alternatives for Calculating Parks and Recreation Level of Service (LOS)
Population Standards• Demographic, Neighborhood Analysis
• Supply/ Demand
3. Access:• Walking, Bicycling, Driving, Transit• Parks• Facilities
Variety, Schedule• Mapping/ Distribution

35
New Alternatives for Calculating Parks & Recreation Level of Service (LOS)
David Barth, AICP, ASLA, [email protected]
www.aecom.com