Embed Size (px)
Citation preview
New Advances in CT: Functional Imaging & Dose Reduction
Ting-Yim Lee PhD, FCCPM; Xiaogang Chen PhD; Eugene Wong PhD; Nikolaj Jensen BSc; Glenn Bauman MD;
Michael Lock MD; Barbara Fisher MD
Lawson Health Research Institute; Robarts Research Institute; Medical Imaging, Physics & Astronomy and Oncology,
The University of Western Ontario; London Regional Cancer ProgramLondon, Ontario, CANADA
Functional Imaging in Radiation Oncology• Target definition
– Areas of increased invasiveness and resistance• Enhanced angiogenesis• Hypoxia
– GTV, CTV• Monitoring of tumor response to treatment
– Tumor mass– Reoxygenation– Shut down of vasculature– Adjuvant chemo and anti-angiogenesis therapy
• Vascular normalization**
**Jain. Science 307:58, 2005
Functional Imaging Modalities• Positron Emission Tomography (PET)• Single Photon Emission Tomography (SPECT)• Magnetic Resonance Imaging (MRI)• Computed Tomography ?
– Anatomical/Morphological• Introduce CT Functional Imaging
– Brain and liver tumor• Radiation dose from CT
– Methods to reduce dose– In particular for CT functional imaging
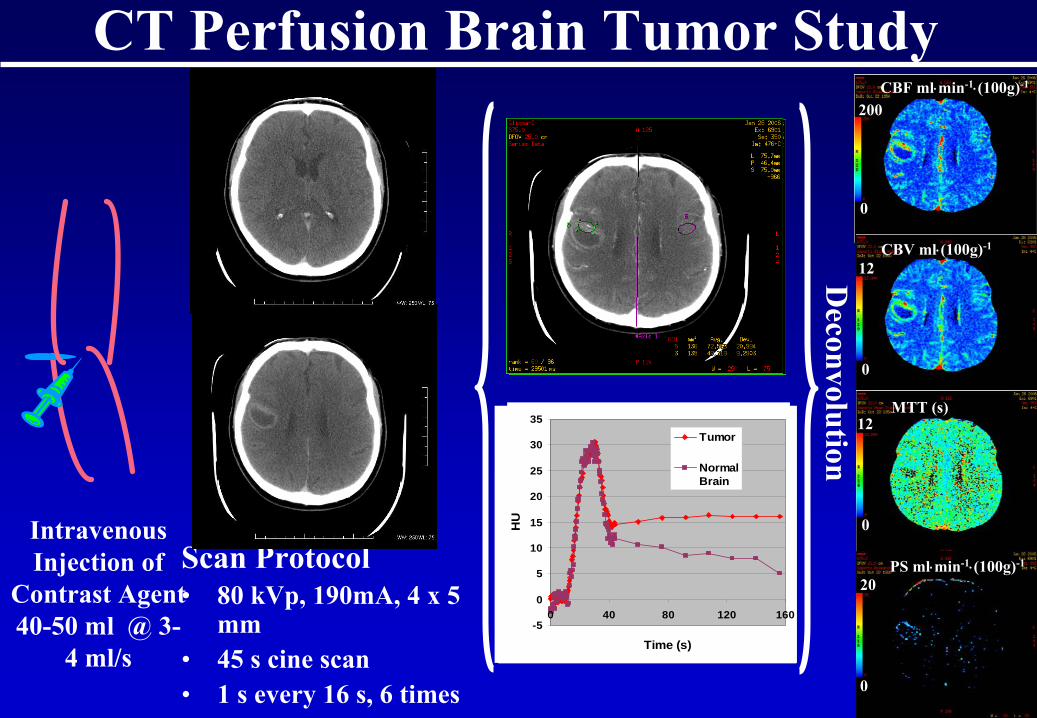
CT Perfusion Brain Tumor Study
Intravenous Injection of
Contrast Agent40-50 ml @ 3-
4 ml/s
CBF ml⋅min-1⋅(100g)-1
Scan Protocol• 80 kVp, 190mA, 4 x 5
mm• 45 s cine scan• 1 s every 16 s, 6 times
Deconvolution
MTT (s)
CBV ml⋅(100g)-1
PS ml⋅min-1⋅(100g)-1
0
0
0
0
200
20
12
12
-50
0
50
100
150
200
250
300
350
400
0 40 80 120 160
Time (s)
HU
ArteryVein
-5
0
5
10
15
20
25
30
35
0 40 80 120 160
Time (s)
HU
Tumor
NormalBrain
-5
0
5
10
15
20
25
30
35
0 40 80 120 160
Time (s)
HU
Tumor
NormalBrain
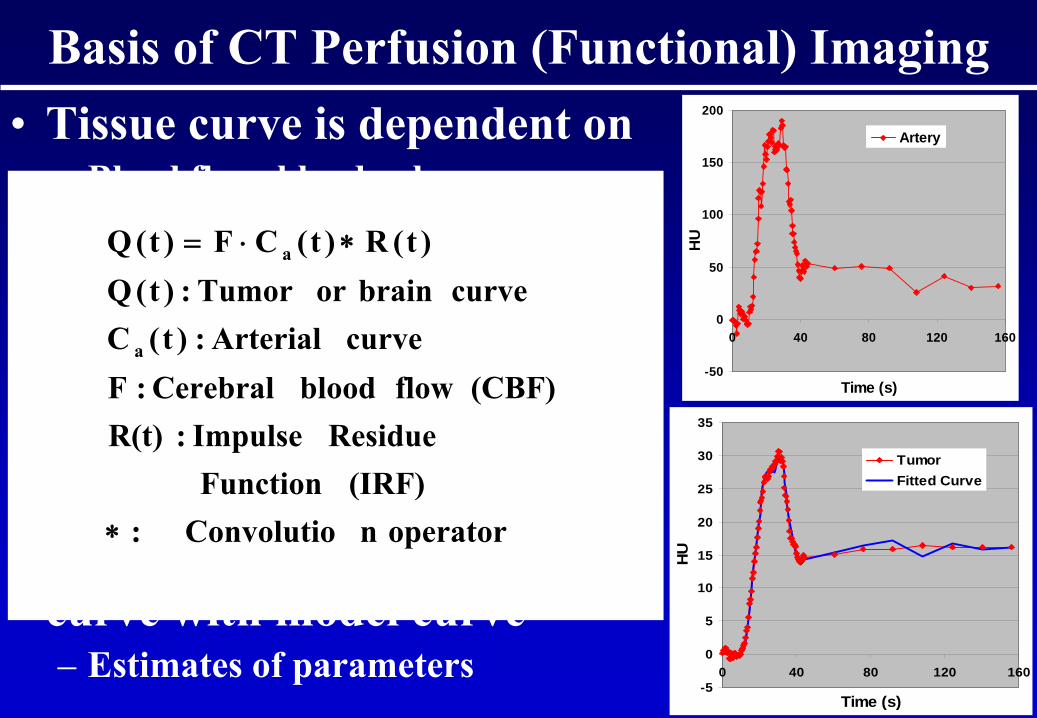
Basis of CT Perfusion (Functional) Imaging• Tissue curve is dependent on
– Blood flow, blood volume, mean transit time, capillary permeability surface area product (PS)
– Arterial input concentration• Tracer kinetics modeling
– Models tissue curve with above parameters and arterial concentration
• Fitting of measured tissue curve with model curve – Estimates of parameters
-50
0
50
100
150
200
0 40 80 120 160
Time (s)
HU
Artery
-5
0
5
10
15
20
25
30
35
0 40 80 120 160
Time (s)H
U
TumorFitted Curve
operatornConvolutio:(IRF) Function
Residue Impulse : R(t)(CBF) flow blood Cerebral : F
curve Arterial:)t(Ccurve brainor Tumor : )t(Q
)t(R)t(CF)t(Q
a
a
∗
∗⋅=
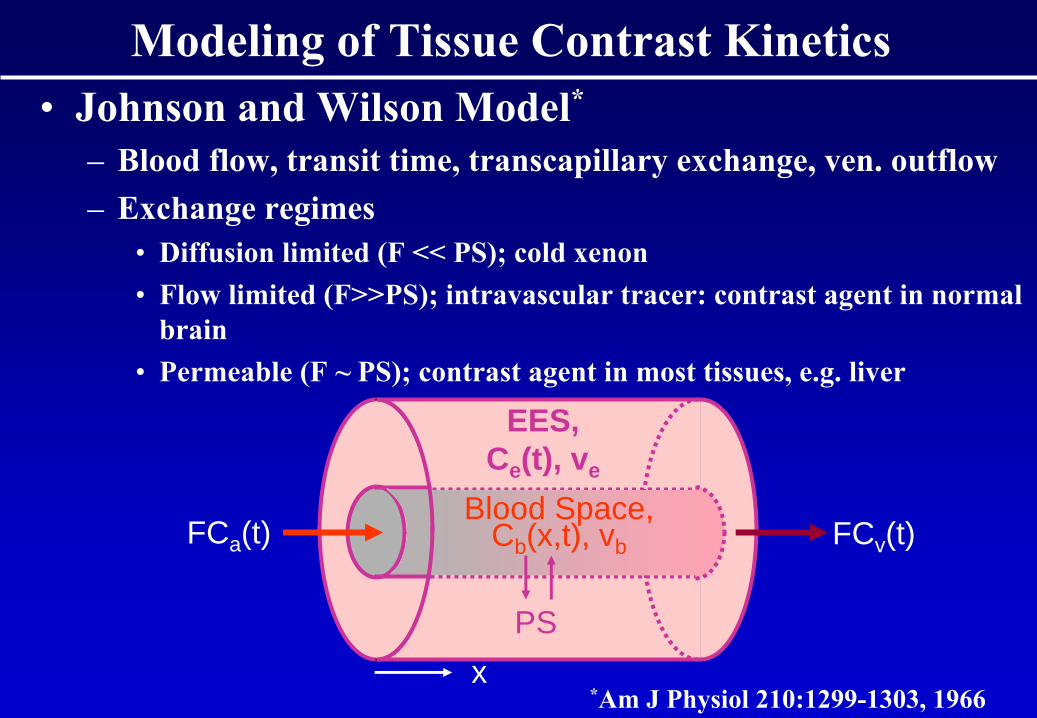
Modeling of Tissue Contrast Kinetics• Johnson and Wilson Model*
– Blood flow, transit time, transcapillary
exchange, ven. outflow– Exchange regimes
• Diffusion limited (F << PS); cold xenon• Flow limited (F>>PS); intravascular tracer: contrast agent in normal
brain• Permeable (F ~ PS); contrast agent in most tissues, e.g. liver
FCa (t) FCv (t)
PS
EES,Ce (t), ve
x
Blood Space,Cb (x,t), vb
*Am J Physiol
210:1299-1303, 1966
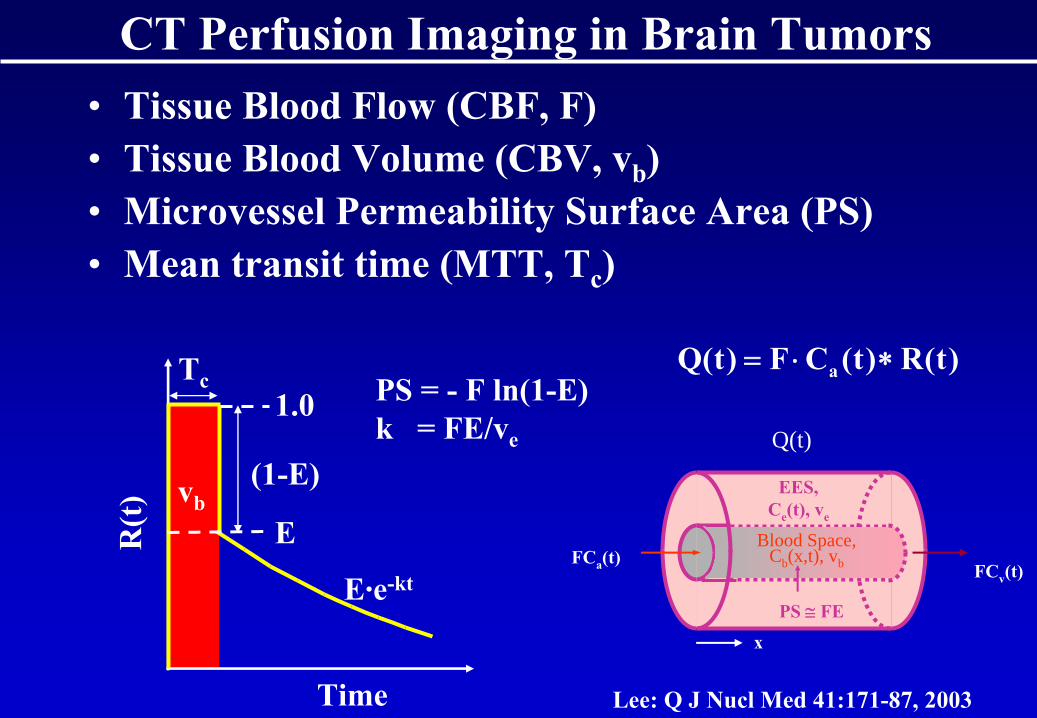
• Tissue Blood Flow (CBF, F) • Tissue Blood Volume (CBV, vb
)• Microvessel
Permeability Surface Area (PS)
• Mean transit time (MTT, Tc
)
FCv
(t)
PS ≅
FE
EES,Ce
(t), ve
x
Blood Space,Cb (x,t), vb
Q(t)
FCa
(t)
Tc
R(t
)
Time
(1-E)vb
PS = -
F ln(1-E)k = FE/ve
E·e-kt
E
1.0
CT Perfusion Imaging in Brain Tumors
)t(R)t(CF)t(Q a ∗⋅=
Lee: Q J Nucl
Med 41:171-87, 2003
Microspheres CBF (ml/min/100g)0 50 100 150 200 250
CT
CB
F (m
l/min
/100
g)
0
50
100
150
200
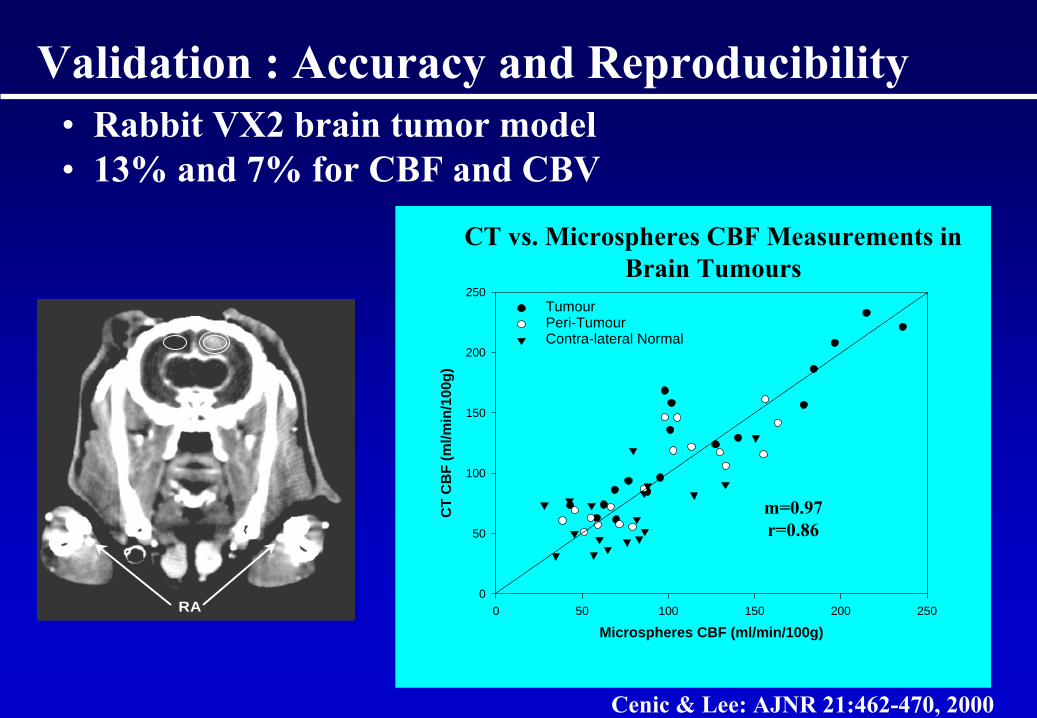
250TumourPeri-TumourContra-lateral Normal
CT vs. Microspheres
CBF Measurements in Brain Tumours
RA
Validation : Accuracy and Reproducibility • Rabbit VX2 brain tumor model• 13% and 7% for CBF and CBV
m=0.97r=0.86
Cenic & Lee: AJNR 21:462-470, 2000
Brain Tumor Studies
• Primary brain tumor – glioma• Before and 1-2 weeks post radiation therapy• Changes in CT Perfusion functional parameters
and response to treatment
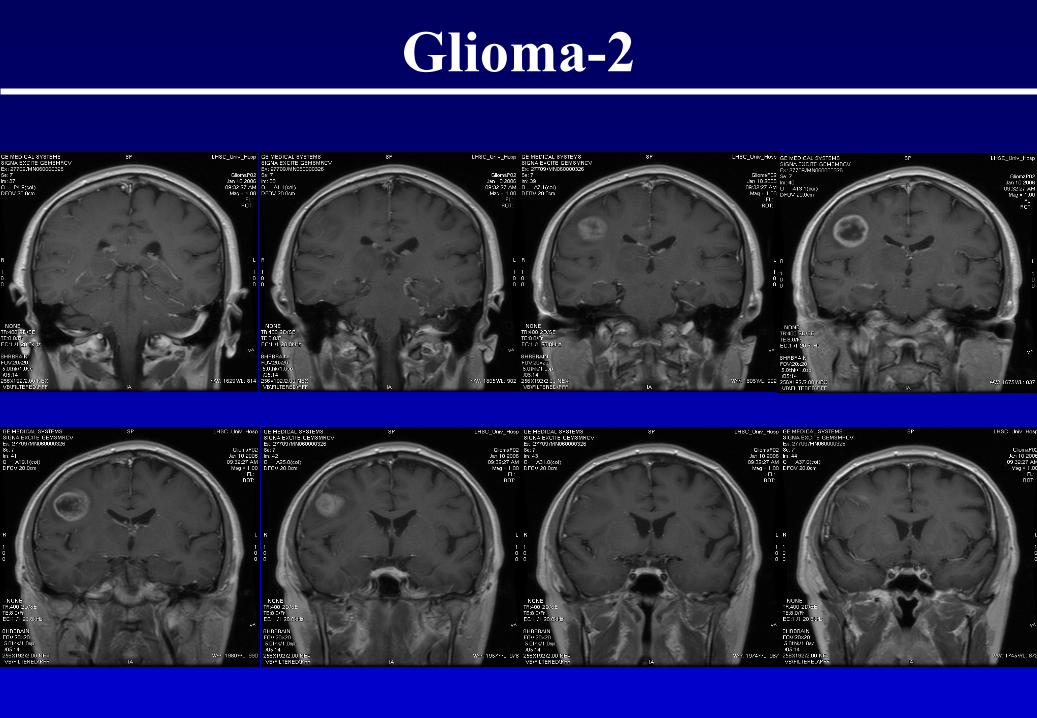
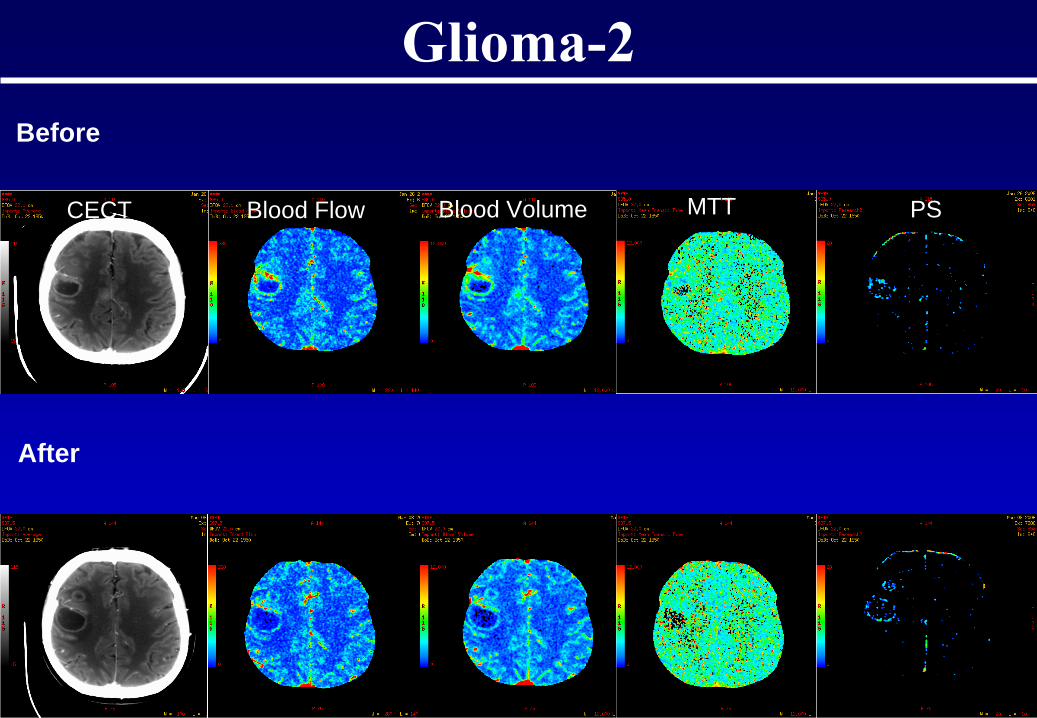
Glioma-2
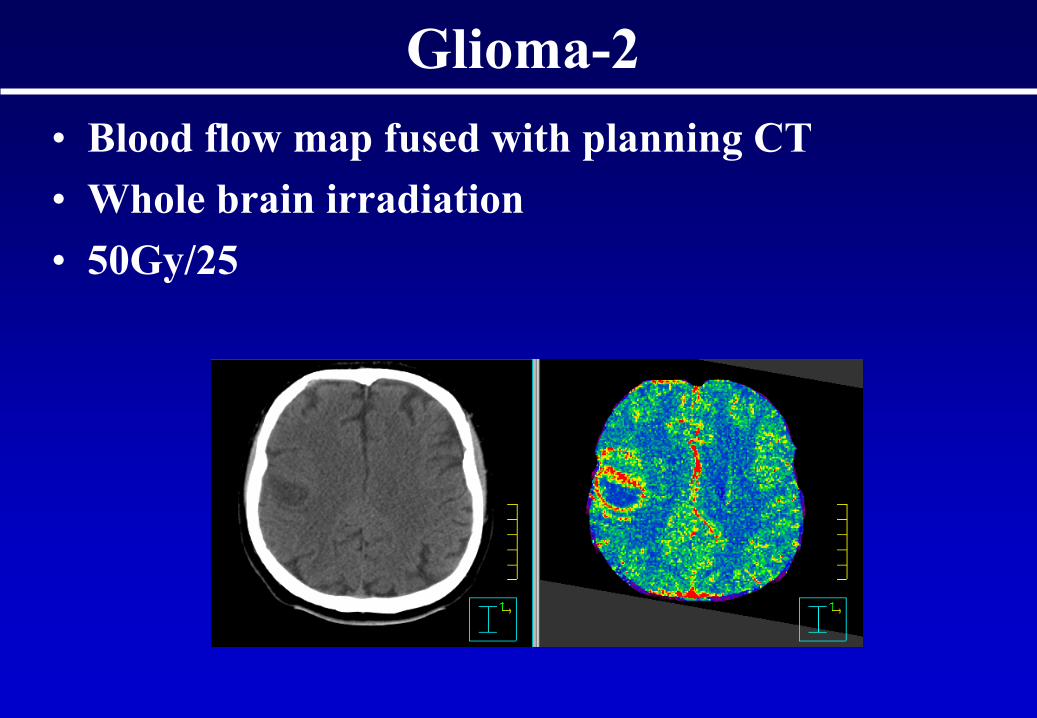
• Blood flow map fused with planning CT• Whole brain irradiation• 50Gy/25
Glioma-2
Glioma-2Before
After
CECT Blood Flow Blood Volume MTT PS
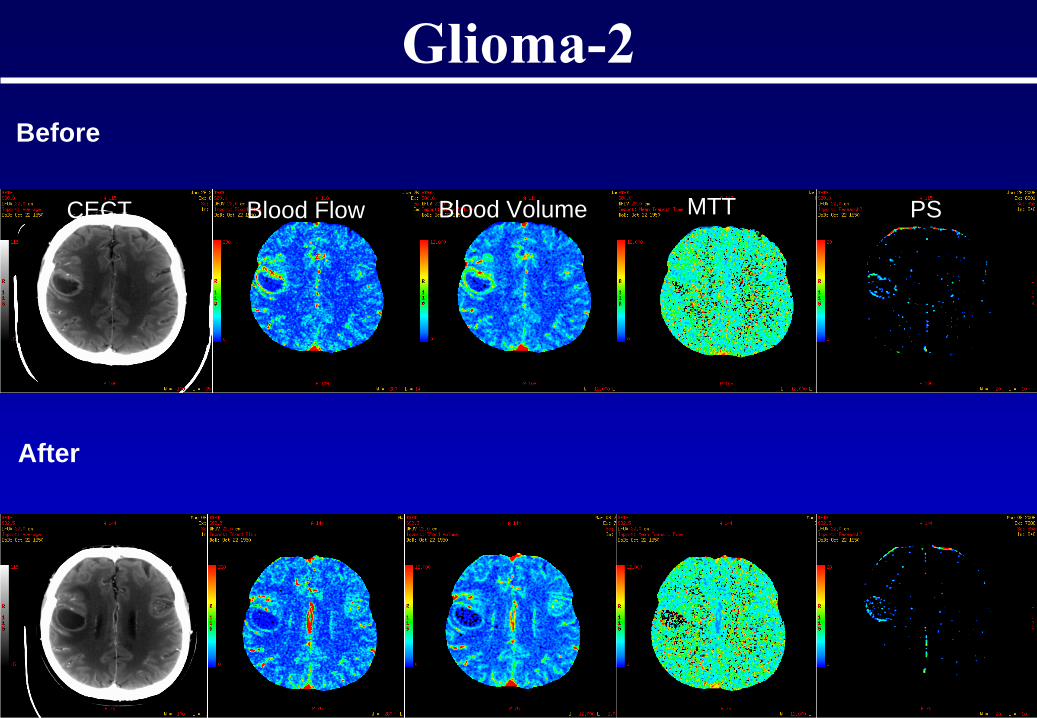
Glioma-2Before
After
CECT Blood Flow Blood Volume MTT PS
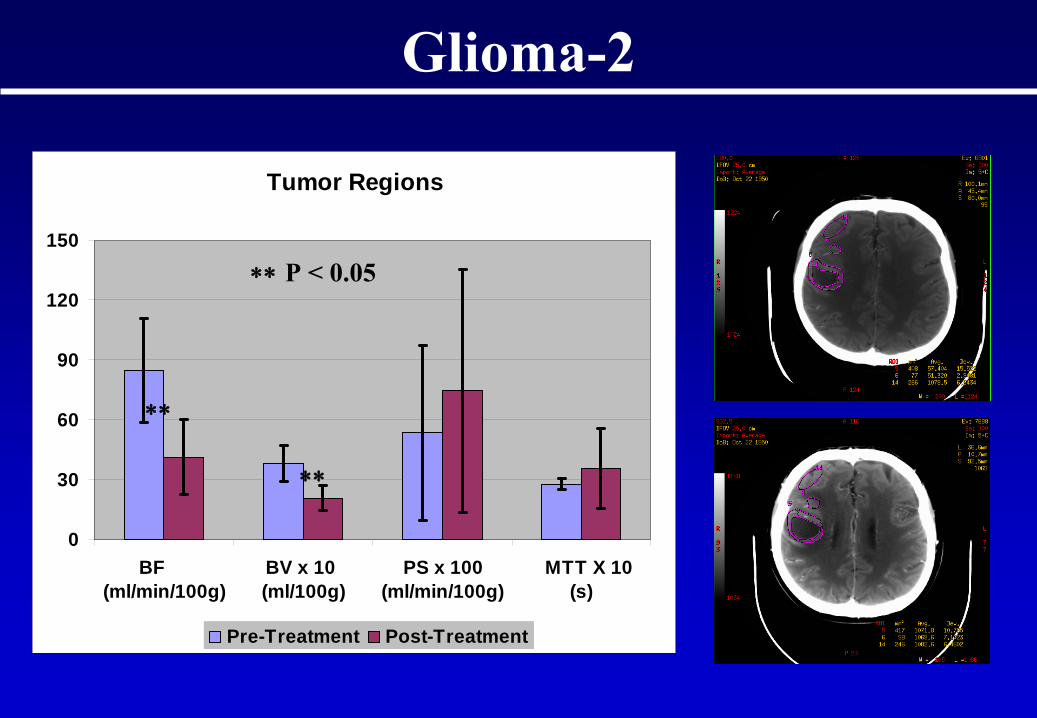
Tumor Regions
0
30
60
90
120
150
BF (ml/min/100g)
BV x 10 (ml/100g)
PS x 100(ml/min/100g)
MTT X 10 (s)
Pre-Treatment Post-Treatment
∗∗
P < 0.05
∗∗
∗∗
Glioma-2
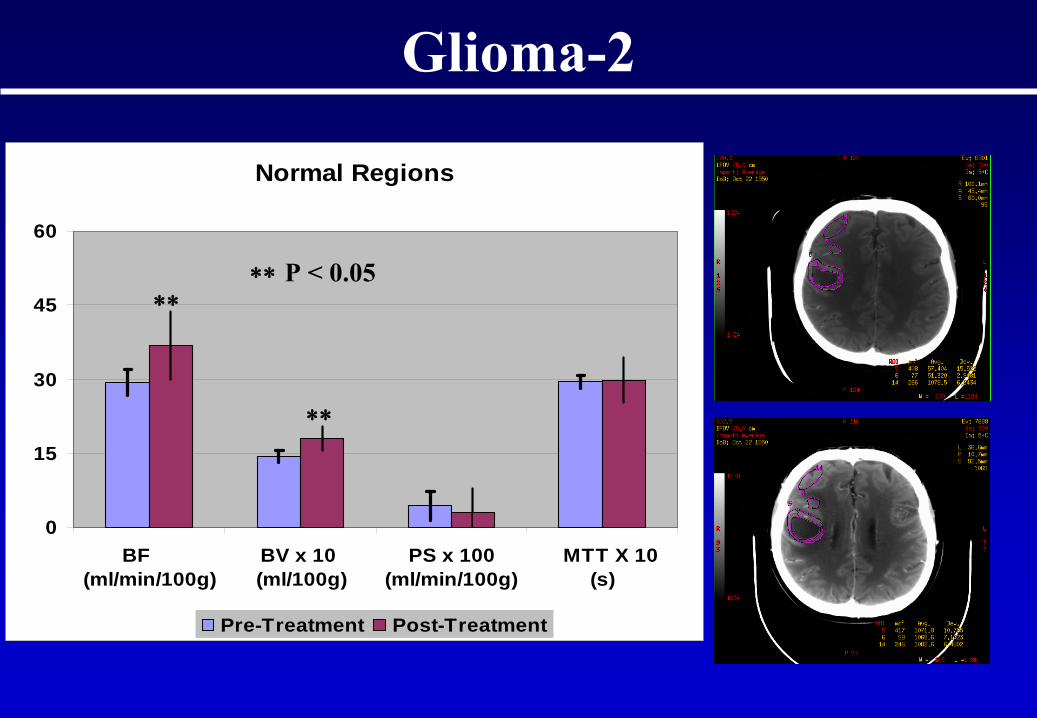
Normal Regions
0
15
30
45
60
BF (ml/min/100g)
BV x 10 (ml/100g)
PS x 100(ml/min/100g)
MTT X 10 (s)
Pre-Treatment Post-Treatment
∗∗
P < 0.05∗∗
∗∗
Glioma-2
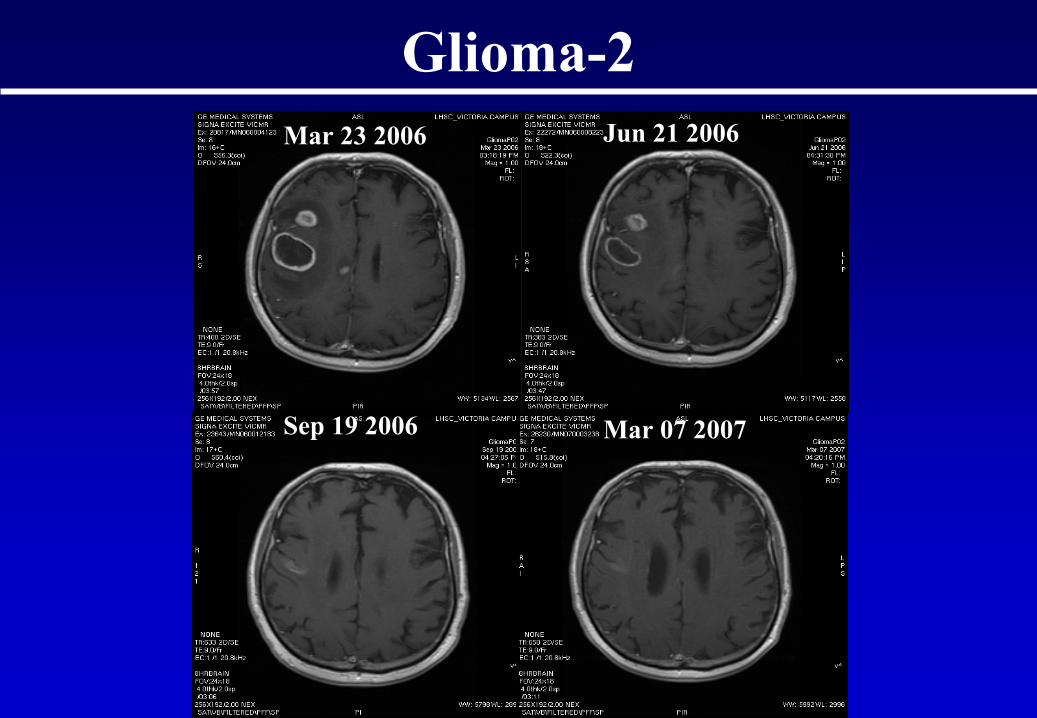
Mar 23 2006 Jun 21 2006
Sep 19 2006 Mar 07 2007
Glioma-2
-50
0
50
100
150
200
250
0 20 40 60 80 100 120
Time (s)
HU
AortaPortal Vein
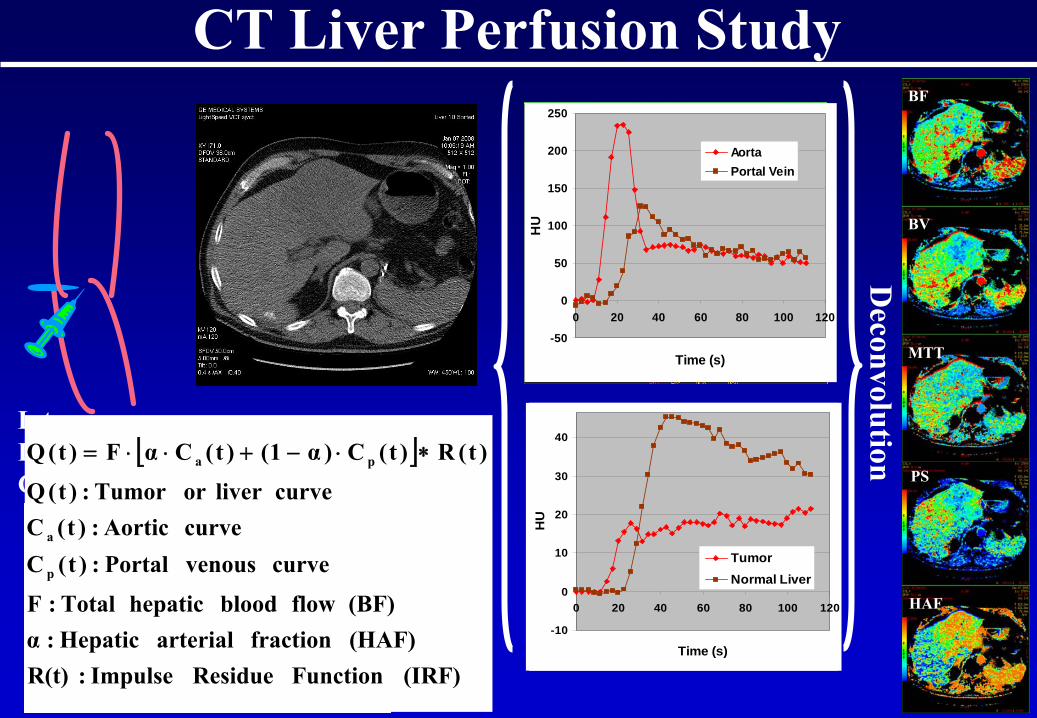
CT Liver Perfusion Study
Intravenous Injection of Contrast Agent
BF
BV
MTT
PS
HAF
Axial Shuttle
HepaticArtery
PortaVein
Hepatic Vein
Deconvolution
-10
0
10
20
30
40
0 20 40 60 80 100 120
Time (s)
HU
TumorNormal Liver
-50
0
50
100
150
200
250
0 20 40 60 80 100 120
Time (s)
HU
AortaPortal Vein
[ ]
(IRF) Function Residue Impulse : R(t)(HAF) fraction arterial Hepatic : α(BF) flow blood hepatic Total : F
curve venous Portal : )t(Ccurve Aortic:)t(C
curveliver or Tumor : )t(Q
)t(R)t(C)α1()t(CαF)t(Q
p
a
pa ∗⋅−+⋅⋅=
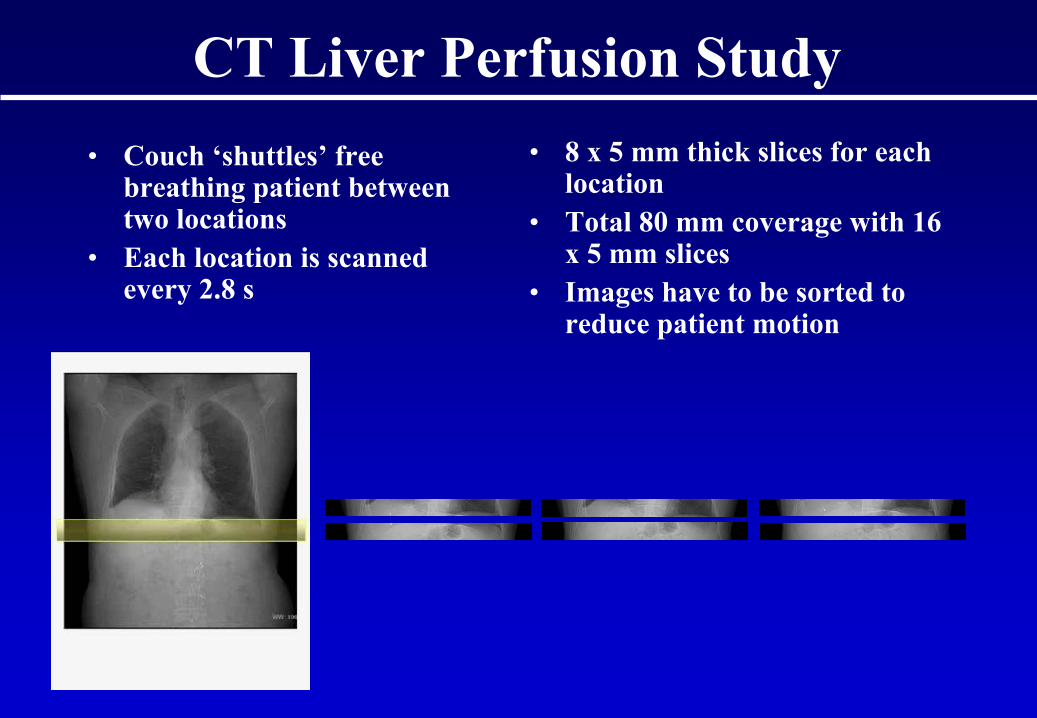
CT Liver Perfusion Study• Couch ‘shuttles’
free
breathing patient between two locations
• Each location is scanned every 2.8 s
• 8 x 5 mm thick slices for each location
• Total 80 mm coverage with 16 x 5 mm slices
• Images have to be sorted to reduce patient motion
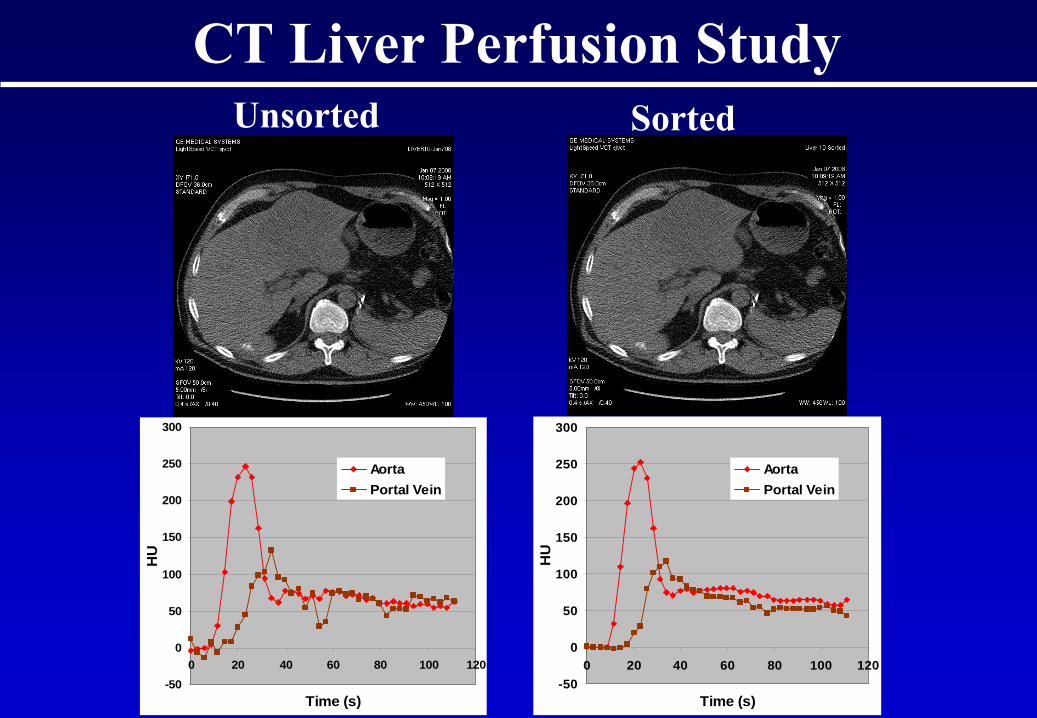
Unsorted Sorted
-50
0
50
100
150
200
250
300
0 20 40 60 80 100 120
Time (s)
HU
AortaPortal Vein
-50
0
50
100
150
200
250
300
0 20 40 60 80 100 120
Time (s)
HU
AortaPortal Vein
CT Liver Perfusion Study
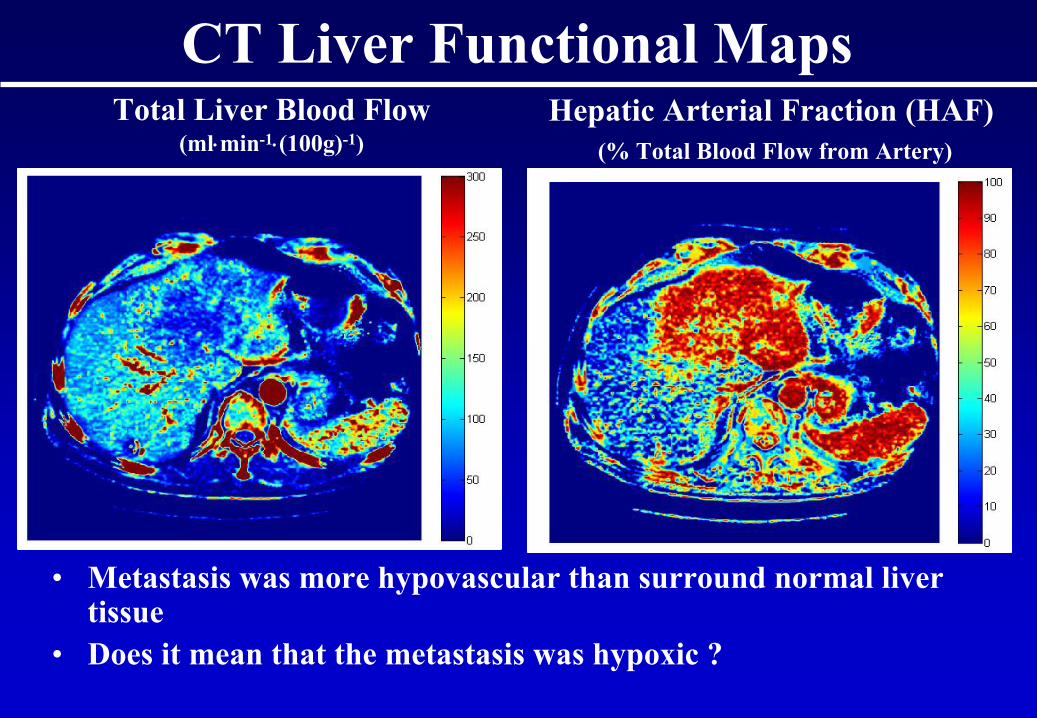
Total Liver Blood Flow (ml⋅min-1⋅(100g)-1)
CT Liver Functional MapsHepatic Arterial Fraction (HAF)
(% Total Blood Flow from Artery)
• Metastasis was more hypovascular
than surround normal liver tissue
• Does it mean that the metastasis was hypoxic ?
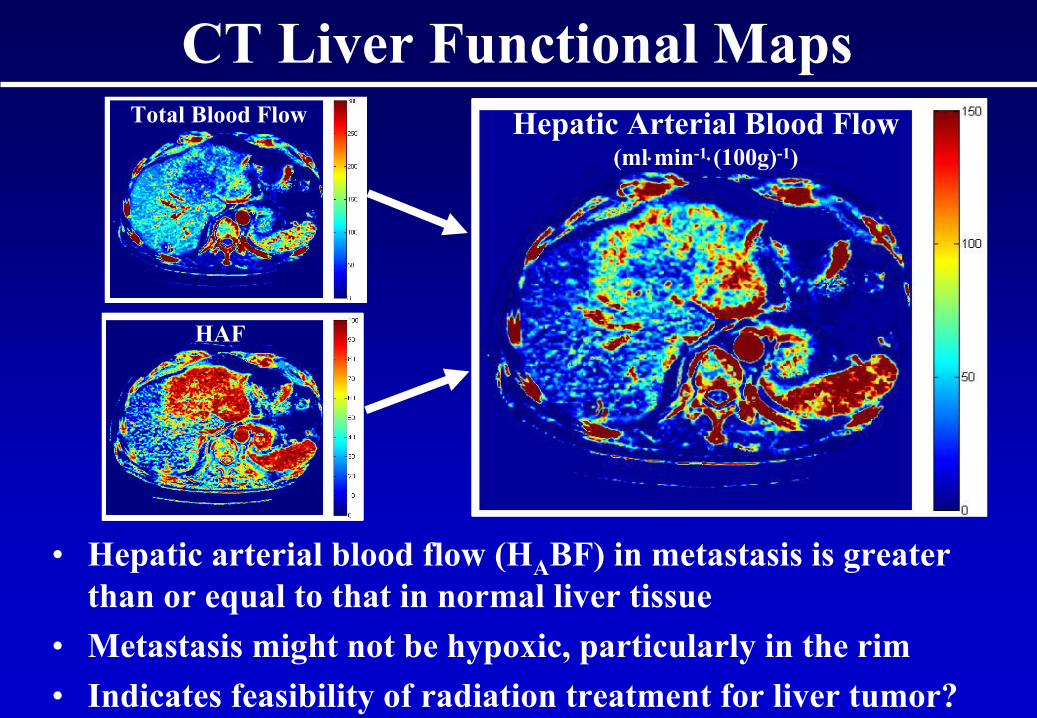
Hepatic Arterial Blood Flow (ml⋅min-1⋅(100g)-1)
Total Blood Flow
HAF
CT Liver Functional Maps
• Hepatic arterial blood flow (HA
BF) in metastasis is greater than or equal to that in normal liver tissue
• Metastasis might not be hypoxic, particularly in the rim• Indicates feasibility of radiation treatment for liver tumor?
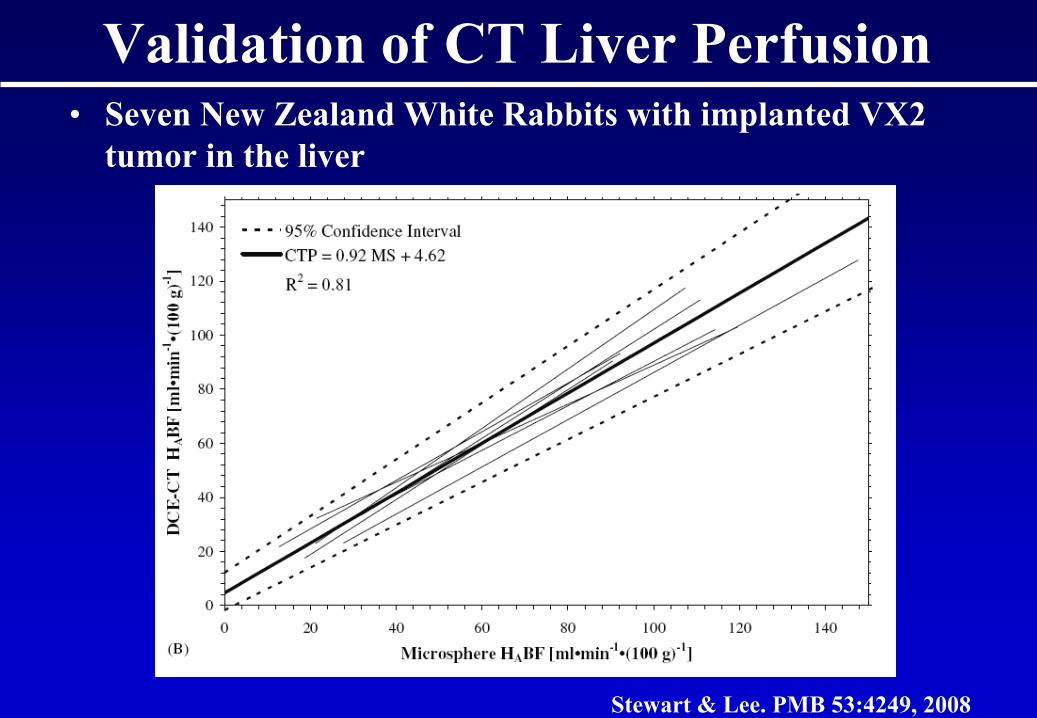
Validation of CT Liver Perfusion • Seven New Zealand White Rabbits with implanted VX2
tumor in the liver
Stewart & Lee. PMB 53:4249, 2008
CT Liver Perfusion Study
• Objective– CT Perfusion functional parameters to distinguish
tumor from normal tissue
• 7 Hepatocellular
Carcinoma (HCC), 5 metastases and 1 cholangioma
• Each subject had a CT Perfusion Liver study with the free breathing axial shuttle technique
• 120 kVp, 60 mAs, 0.4 s rotation period, 42 passes of the axial shuttle with the first 4 as baseline
• 60 –
70 ml of Omnipaque
300 injected at 3 ml⋅s-1
at the 5th
pass of the axial shuttle
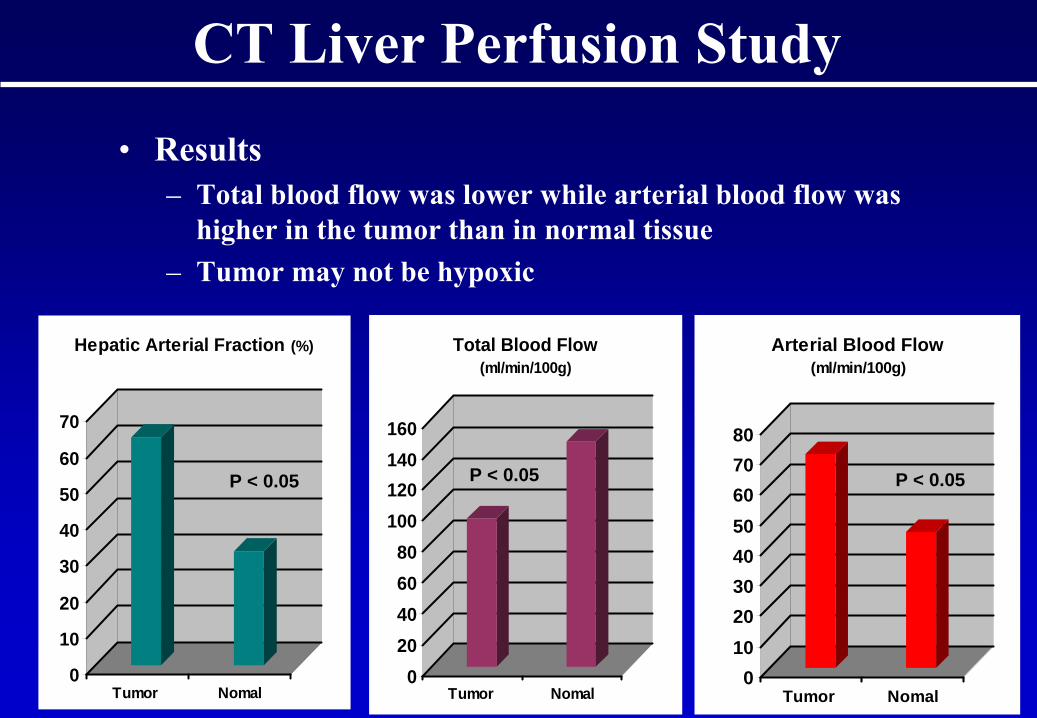
0
10
20
30
40
50
60
70
Tumor Nomal
Hepatic Arterial Fraction (%)
020406080
100120140160
Tumor Nomal
Total Blood Flow(ml/min/100g)
01020304050607080
Tumor Nomal
Arterial Blood Flow(ml/min/100g)
CT Liver Perfusion Study
• Results– Total blood flow was lower while arterial blood flow was
higher in the tumor than in normal tissue– Tumor may not be hypoxic
P < 0.05 P < 0.05 P < 0.05
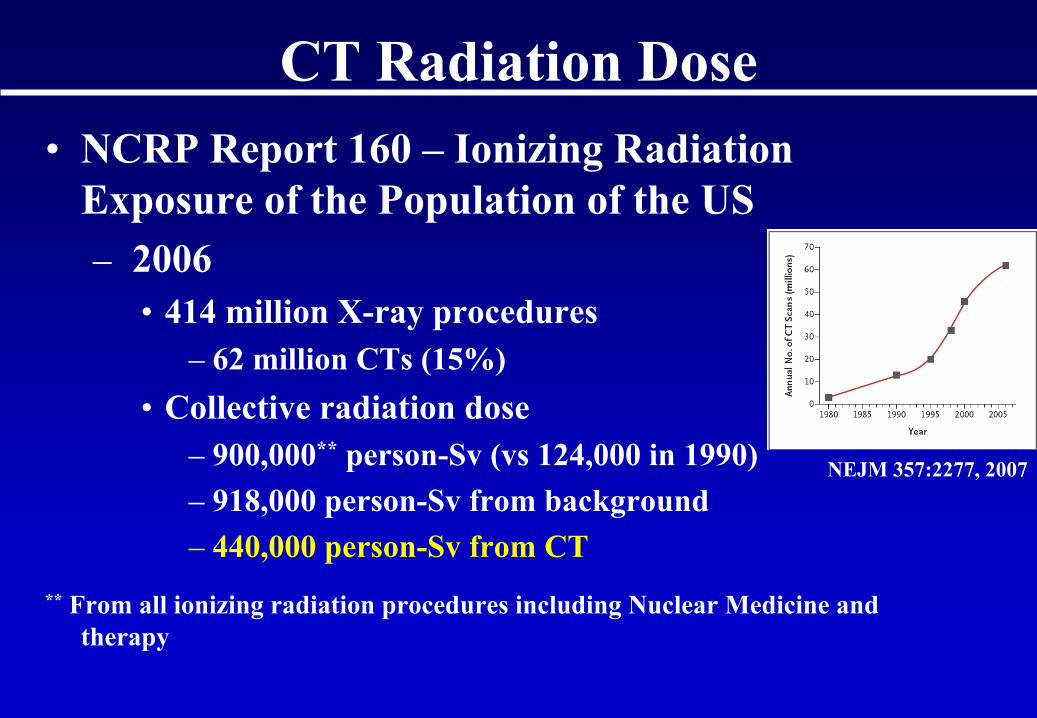
CT Radiation Dose• NCRP Report 160 –
Ionizing Radiation
Exposure of the Population of the US– 2006
• 414 million X-ray procedures– 62 million CTs
(15%)
• Collective radiation dose– 900,000**
person-Sv
(vs
124,000 in 1990)
– 918,000 person-Sv
from background– 440,000 person-Sv
from CT
**
From all ionizing radiation procedures including Nuclear Medicine and therapy
NEJM 357:2277, 2007
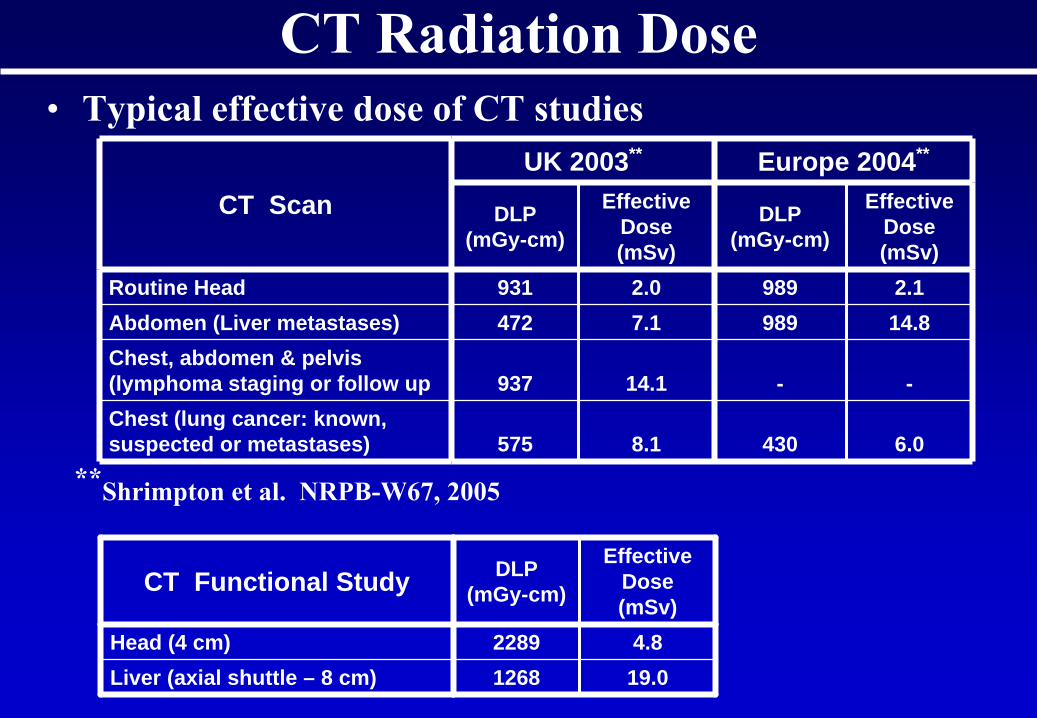
CT Radiation Dose• Typical effective dose of CT studies
**Shrimpton
et al. NRPB-W67, 2005
CT ScanUK 2003** Europe 2004**
DLP (mGy-cm)
Effective Dose (mSv)
DLP (mGy-cm)
Effective Dose (mSv)
Routine Head 931 2.0 989 2.1Abdomen (Liver metastases) 472 7.1 989 14.8Chest, abdomen & pelvis (lymphoma staging or follow up 937 14.1 - -Chest (lung cancer: known, suspected or metastases) 575 8.1 430 6.0
CT Functional Study DLP (mGy-cm)
Effective Dose (mSv)
Head (4 cm) 2289 4.8Liver (axial shuttle – 8 cm) 1268 19.0
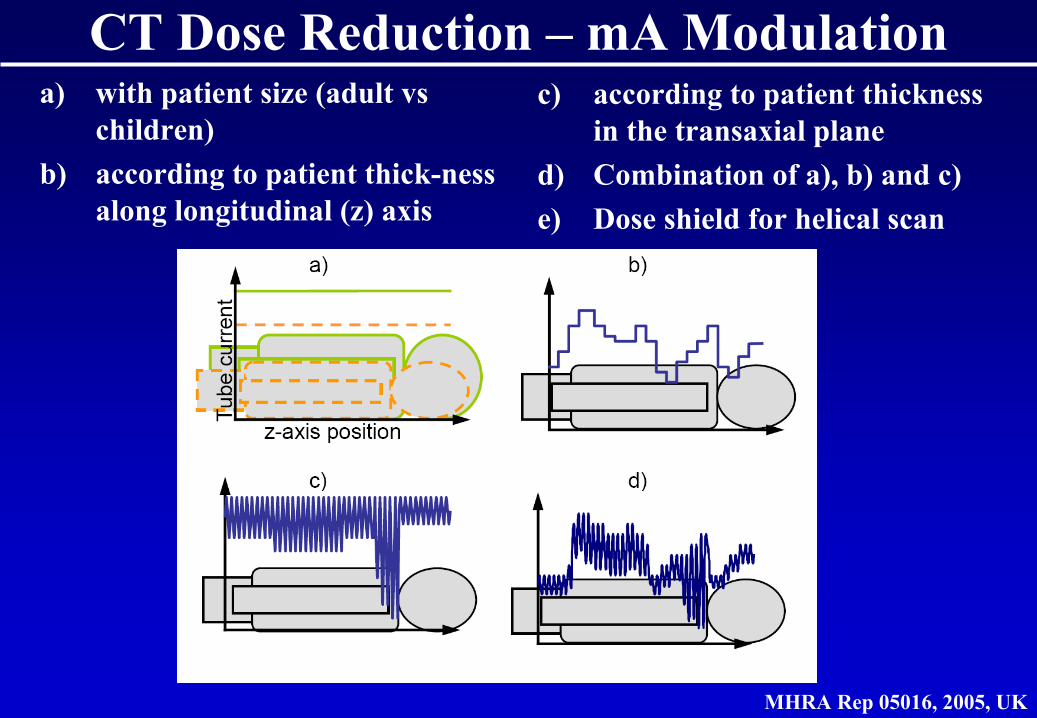
CT Dose Reduction –
mA
Modulation
MHRA Rep 05016, 2005, UK
a)
with patient size (adult vs children)
b)
according to patient thick-ness along longitudinal (z) axis
c)
according to patient thickness in the transaxial
plane
d)
Combination of a), b) and c)e)
Dose shield for helical scan
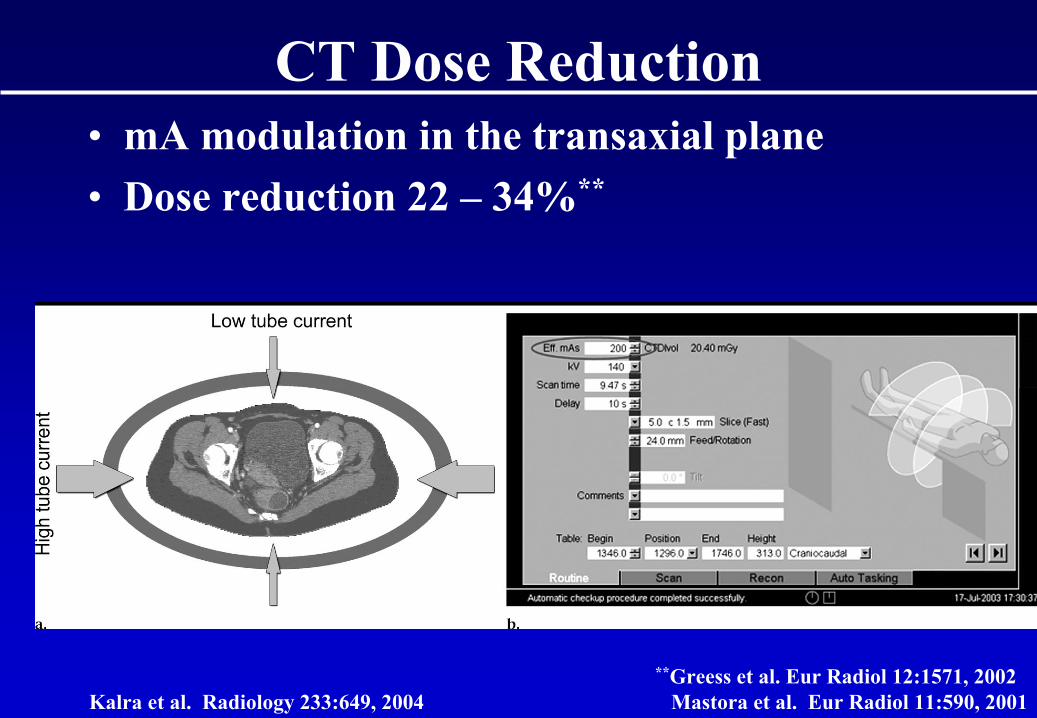
CT Dose Reduction
Kalra
et al. Radiology 233:649, 2004
• mA
modulation in the transaxial
plane• Dose reduction 22 –
34%**
**Greess
et al. Eur
Radiol
12:1571, 2002Mastora
et al. Eur
Radiol
11:590, 2001
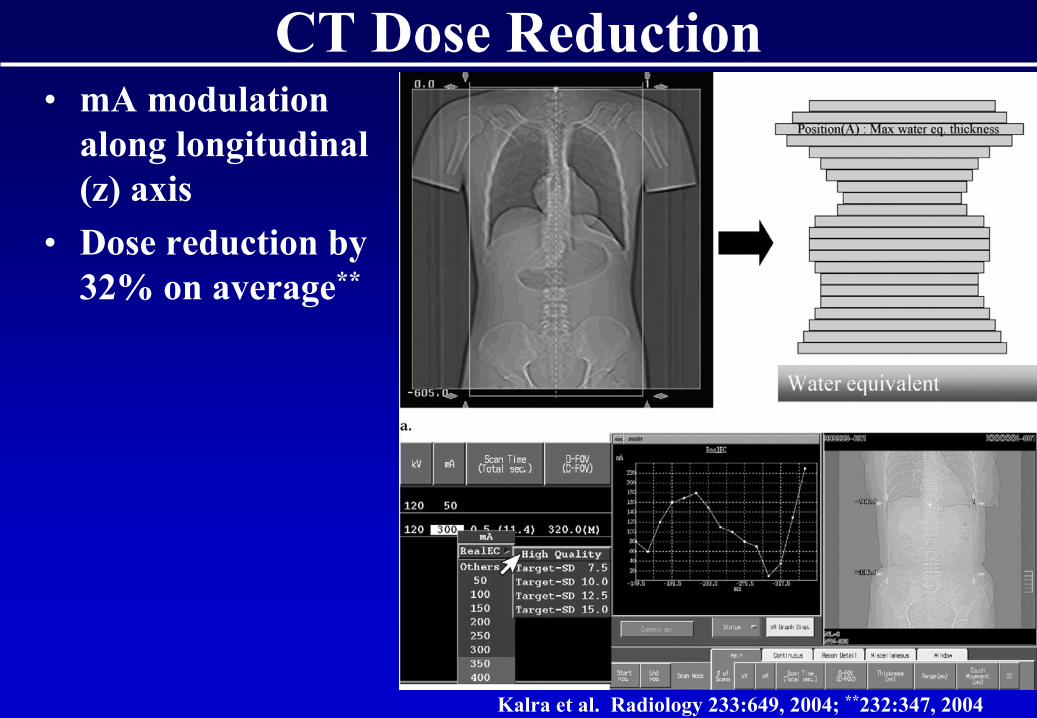
CT Dose Reduction
Kalra
et al. Radiology 233:649, 2004; **232:347, 2004
• mA
modulation along longitudinal (z) axis
• Dose reduction by 32% on average**
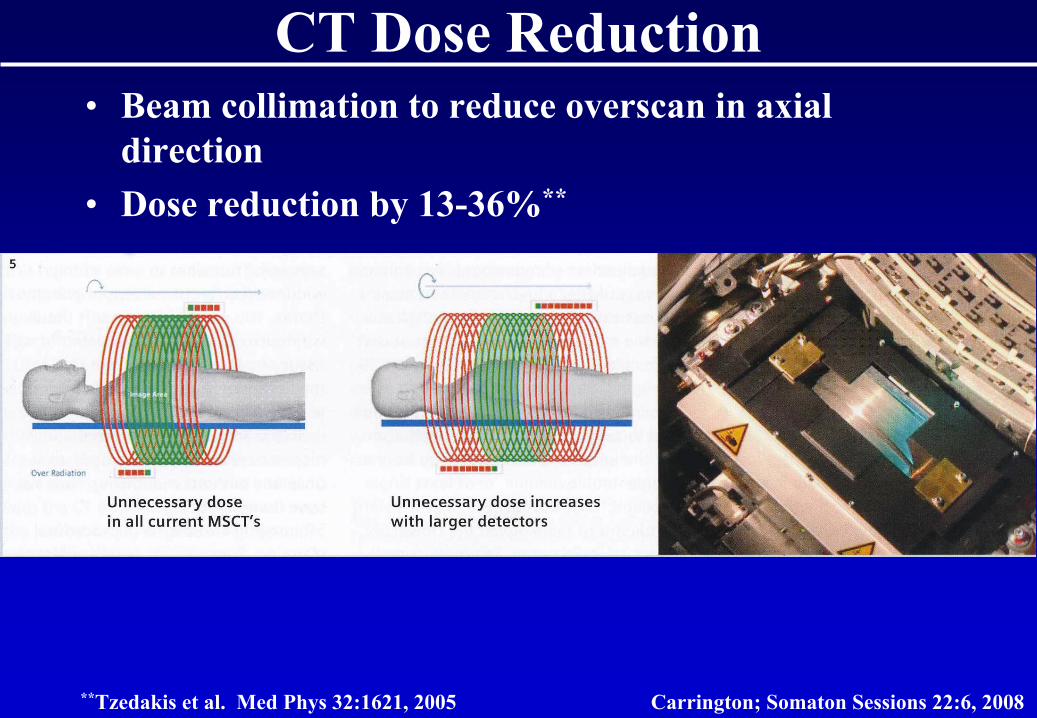
CT Dose Reduction
Carrington; Somaton
Sessions 22:6, 2008
• Beam collimation to reduce overscan
in axial direction
• Dose reduction by 13-36%**
**Tzedakis
et al. Med Phys 32:1621, 2005
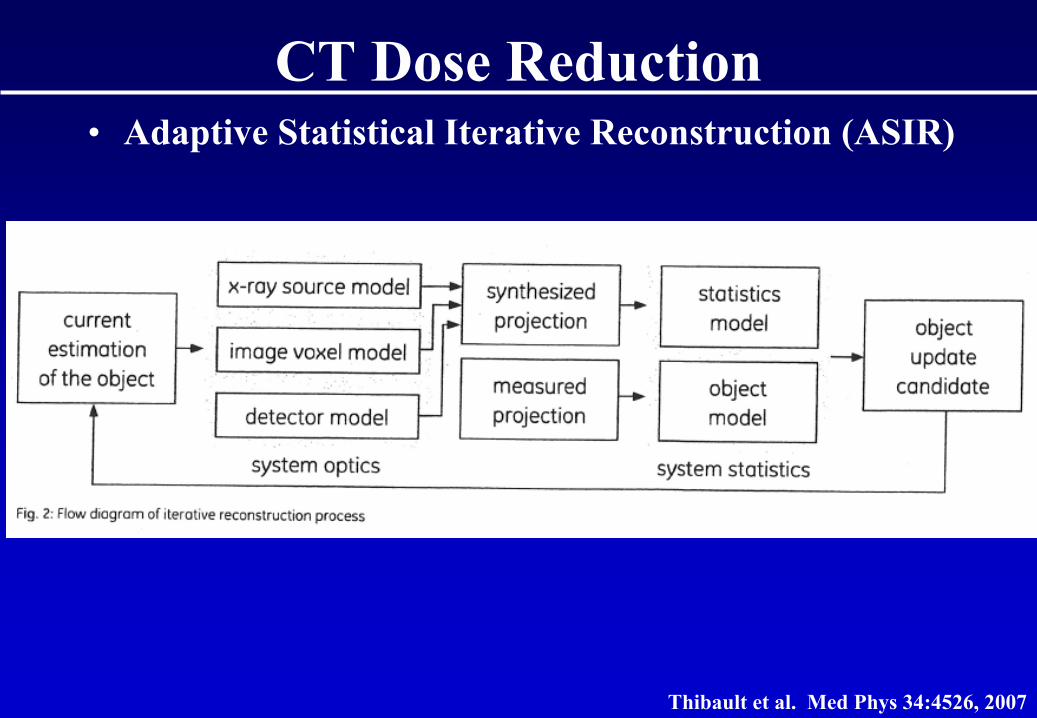
CT Dose Reduction
Thibault et al. Med Phys 34:4526, 2007
• Adaptive Statistical Iterative Reconstruction (ASIR)
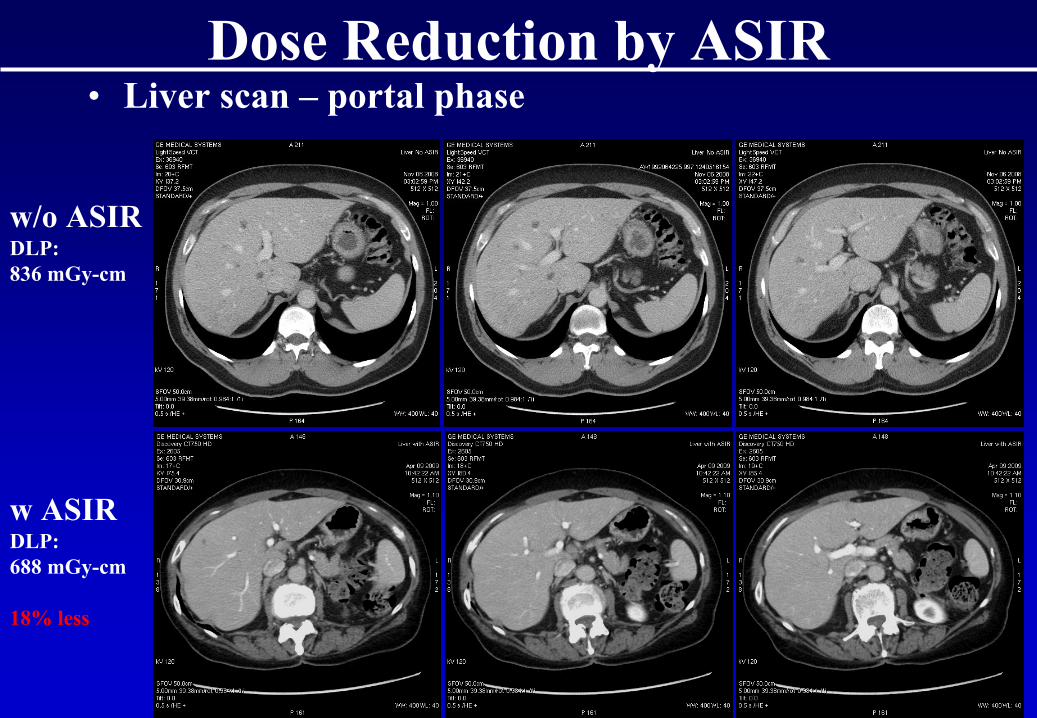
Dose Reduction by ASIR• Liver scan –
portal phase
w/o ASIRDLP:836 mGy-cm
w ASIRDLP:688 mGy-cm
18% less
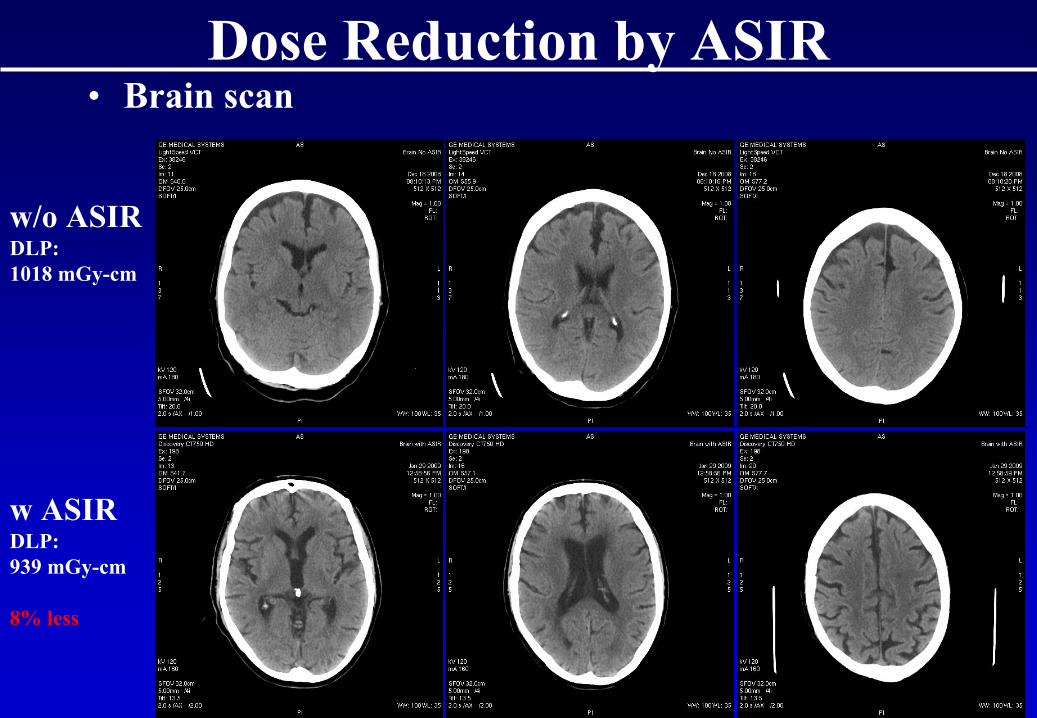
Dose Reduction by ASIR• Brain scan
w/o ASIRDLP:1018 mGy-cm
w ASIRDLP:939 mGy-cm
8% less
Dose Reduction by ASIR
80 kVp
200 mAs 80 kVp
50 mAs 80 kVp
50 mAs
+ ASIR
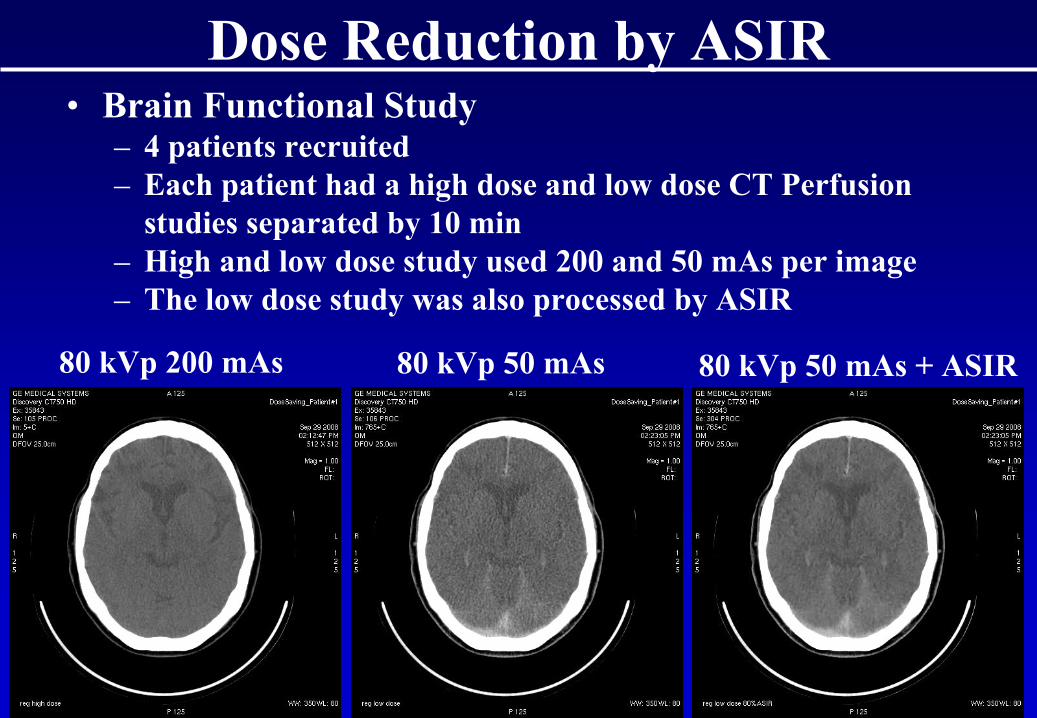
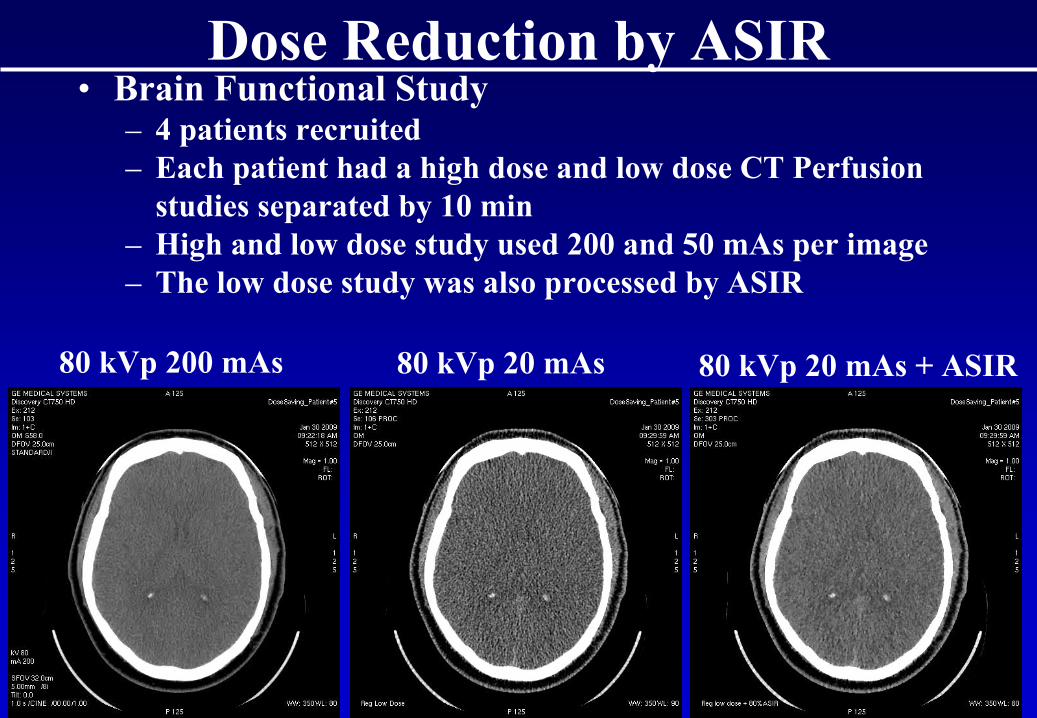
• Brain Functional Study– 4 patients recruited– Each patient had a high dose and low dose CT Perfusion
studies separated by 10 min– High and low dose study used 200 and 50 mAs
per image
– The low dose study was also processed by ASIR
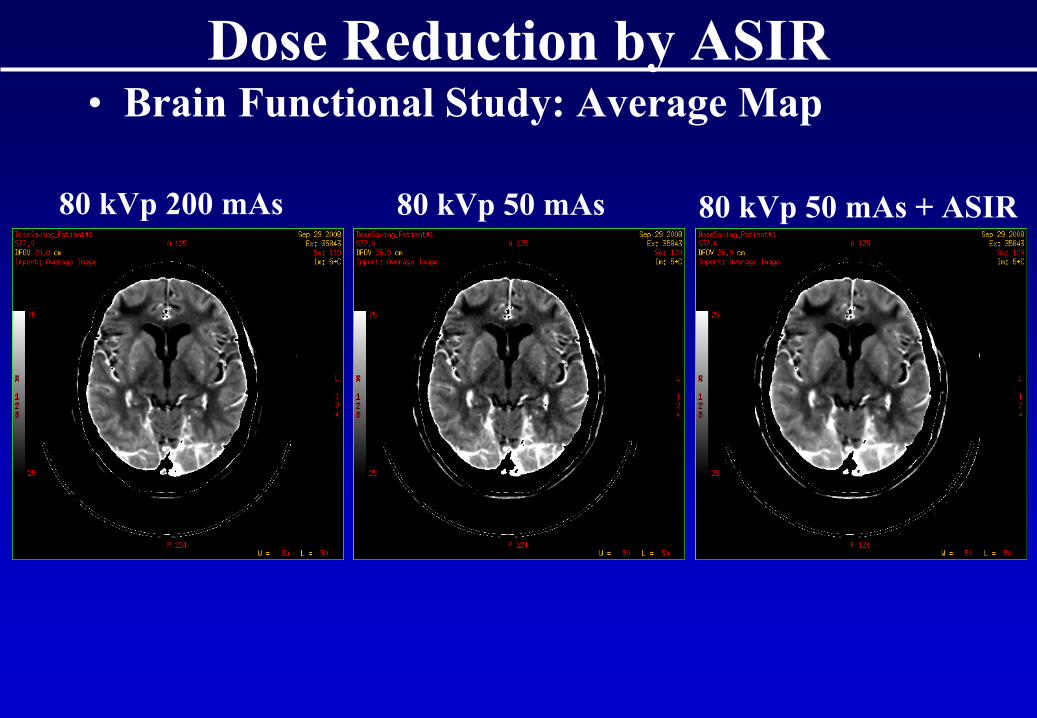
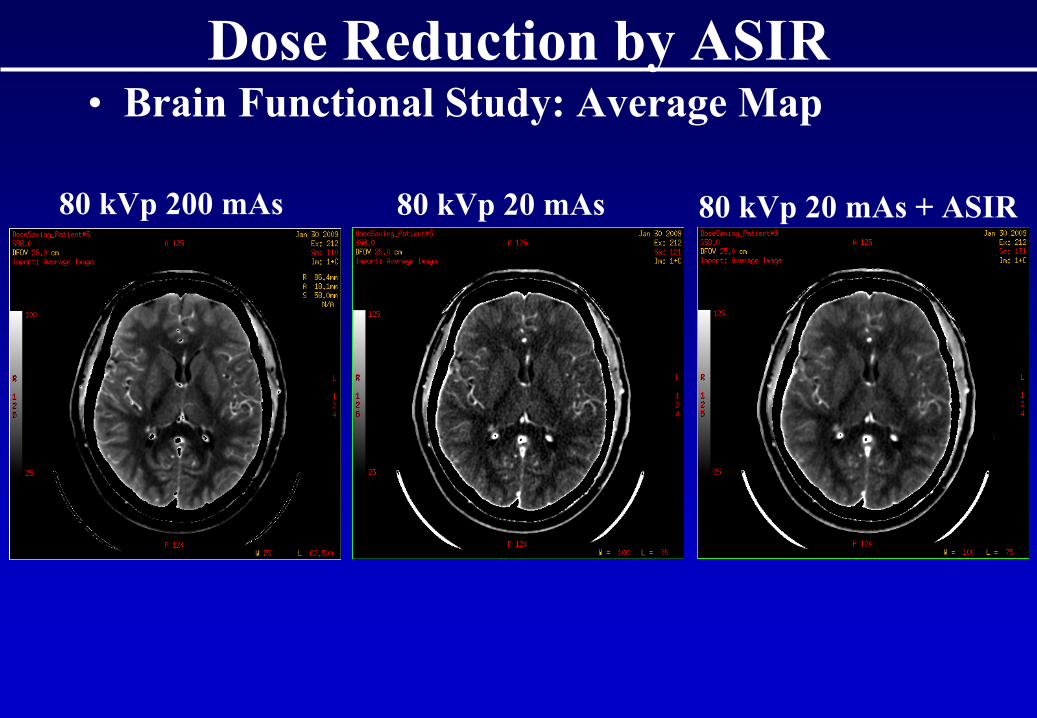
Dose Reduction by ASIR• Brain Functional Study: Average Map
80 kVp
200 mAs 80 kVp
50 mAs 80 kVp
50 mAs
+ ASIR
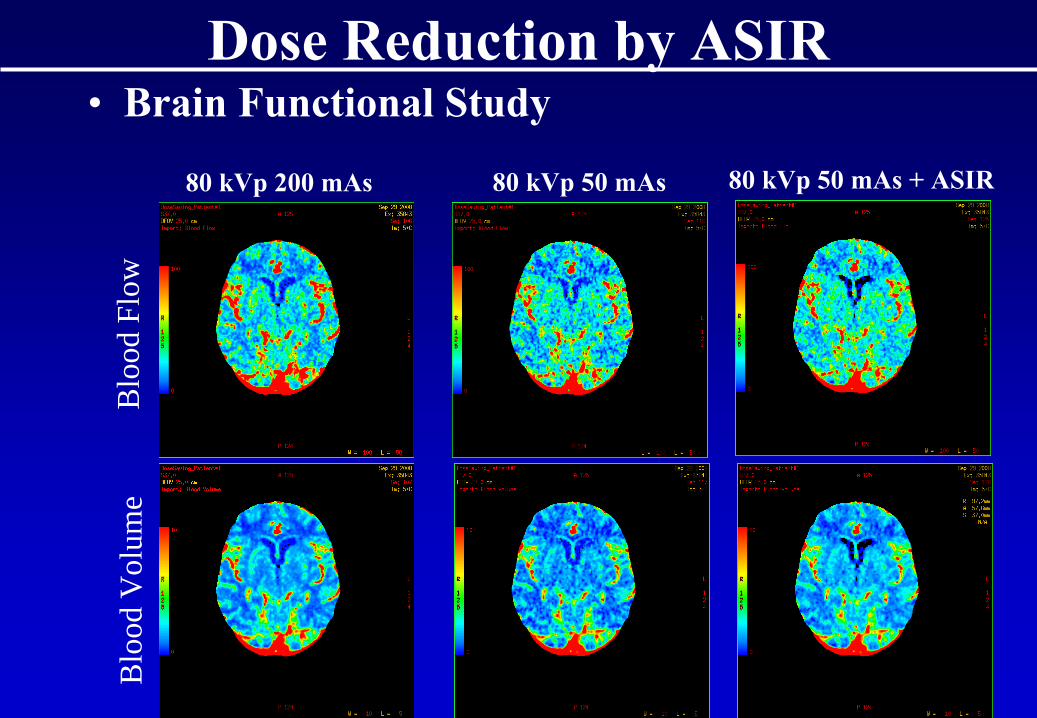
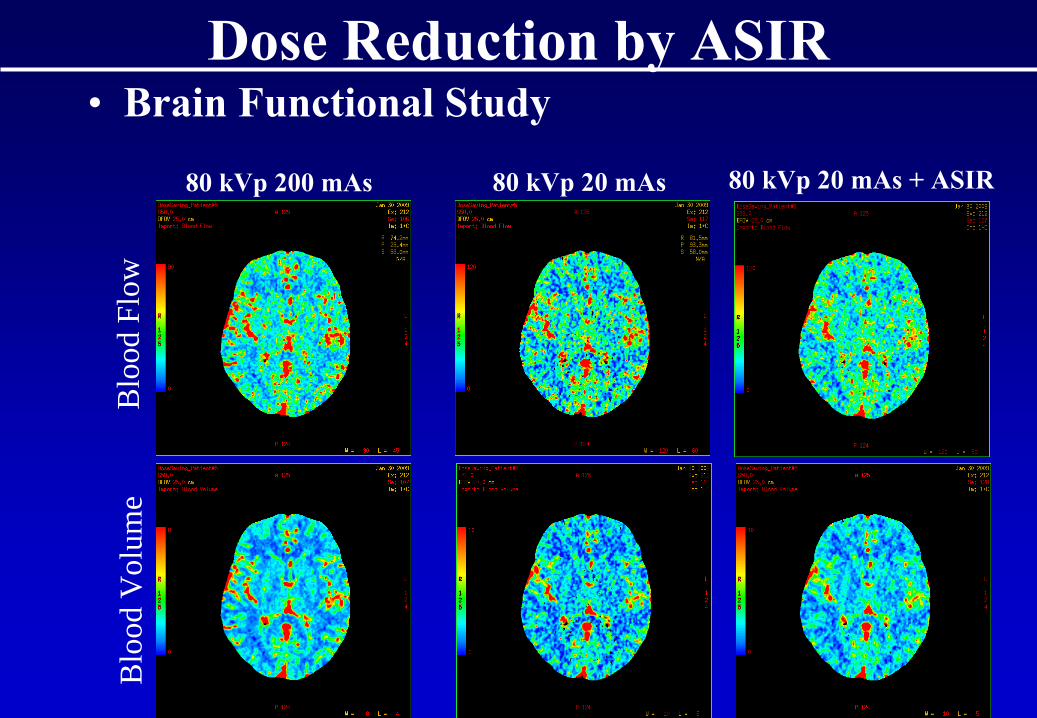
Dose Reduction by ASIR• Brain Functional Study
80 kVp
200 mAs 80 kVp
50 mAs 80 kVp
50 mAs
+ ASIR
Blo
od F
low
Blo
od V
olum
e
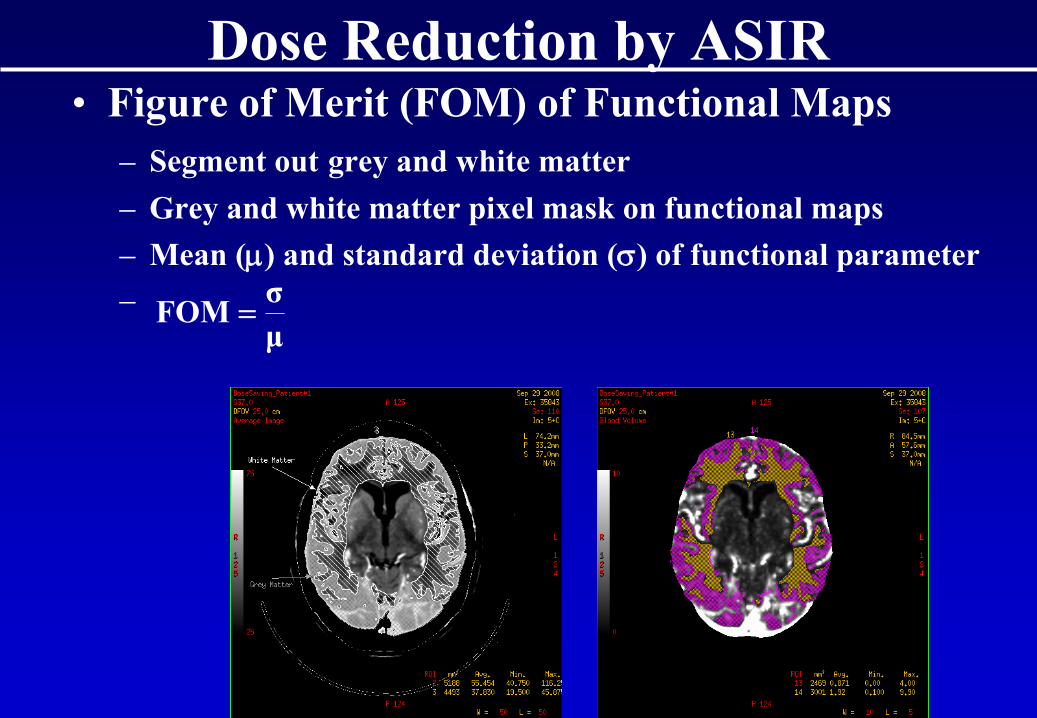
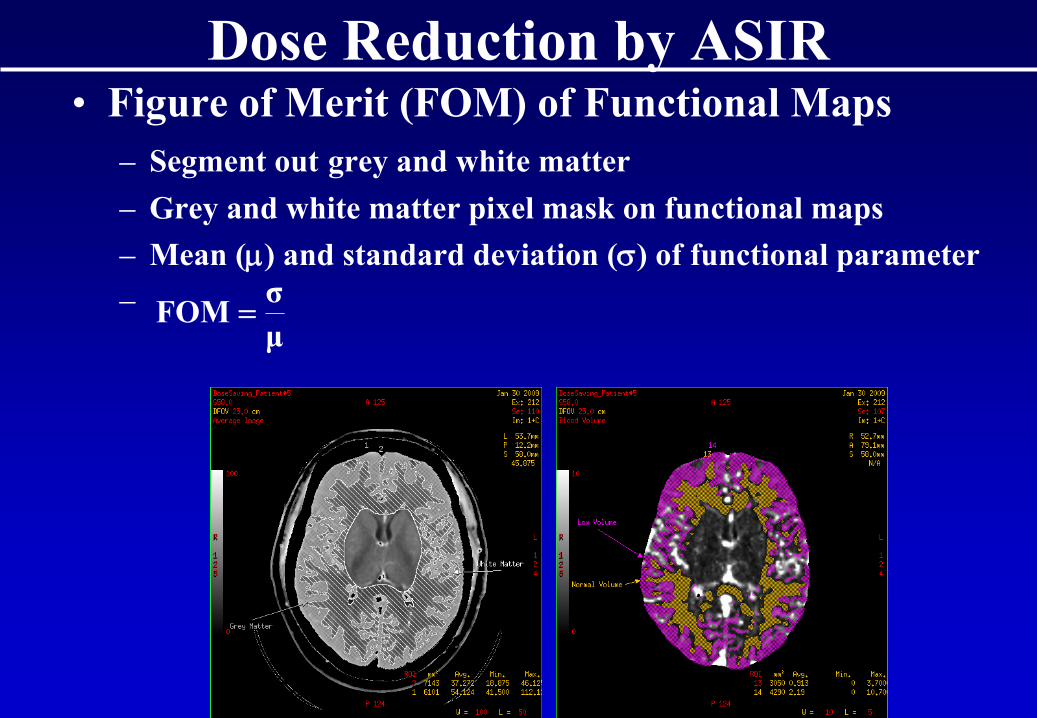
Dose Reduction by ASIR• Figure of Merit (FOM) of Functional Maps
– Segment out
grey and white matter– Grey and white matter pixel mask on functional maps– Mean (μ)
and standard deviation (σ)
of functional parameter
–μσFOM =
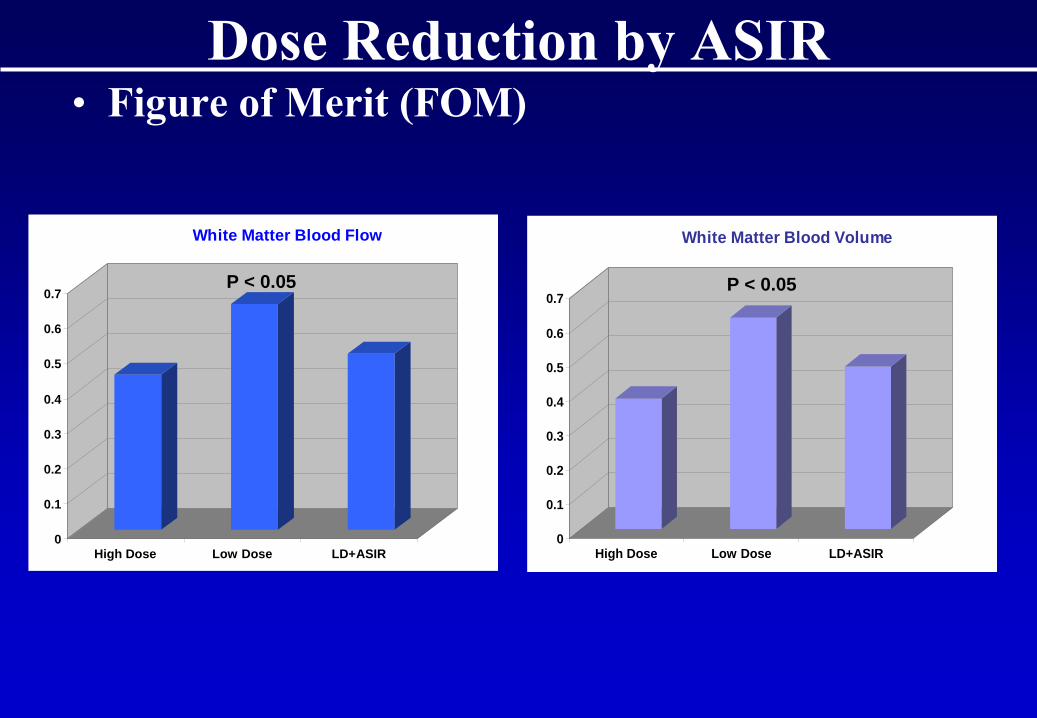
Dose Reduction by ASIR• Figure of Merit (FOM)
0
0.1
0.2
0.3
0.4
0.5
0.6
0.7
High Dose Low Dose LD+ASIR
White Matter Blood Flow
0
0.1
0.2
0.3
0.4
0.5
0.6
0.7
High Dose Low Dose LD+ASIR
White Matter Blood Volume
P < 0.05 P < 0.05
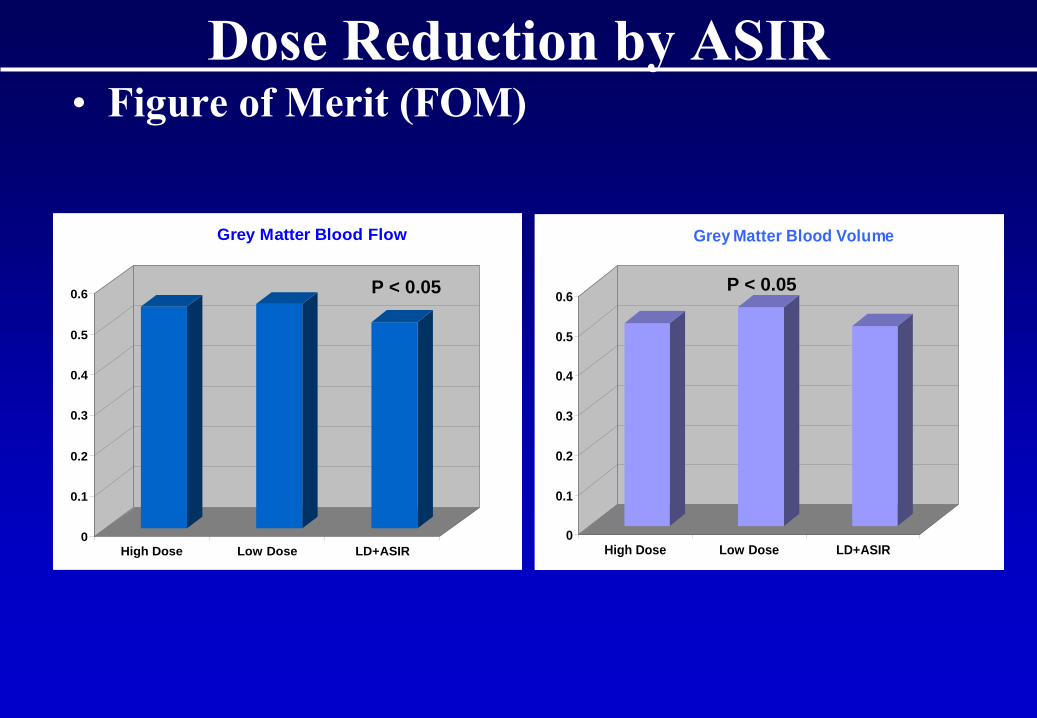
Dose Reduction by ASIR• Figure of Merit (FOM)
0
0.1
0.2
0.3
0.4
0.5
0.6
High Dose Low Dose LD+ASIR
Grey Matter Blood Flow
0
0.1
0.2
0.3
0.4
0.5
0.6
High Dose Low Dose LD+ASIR
Grey Matter Blood Volume
P < 0.05P < 0.05
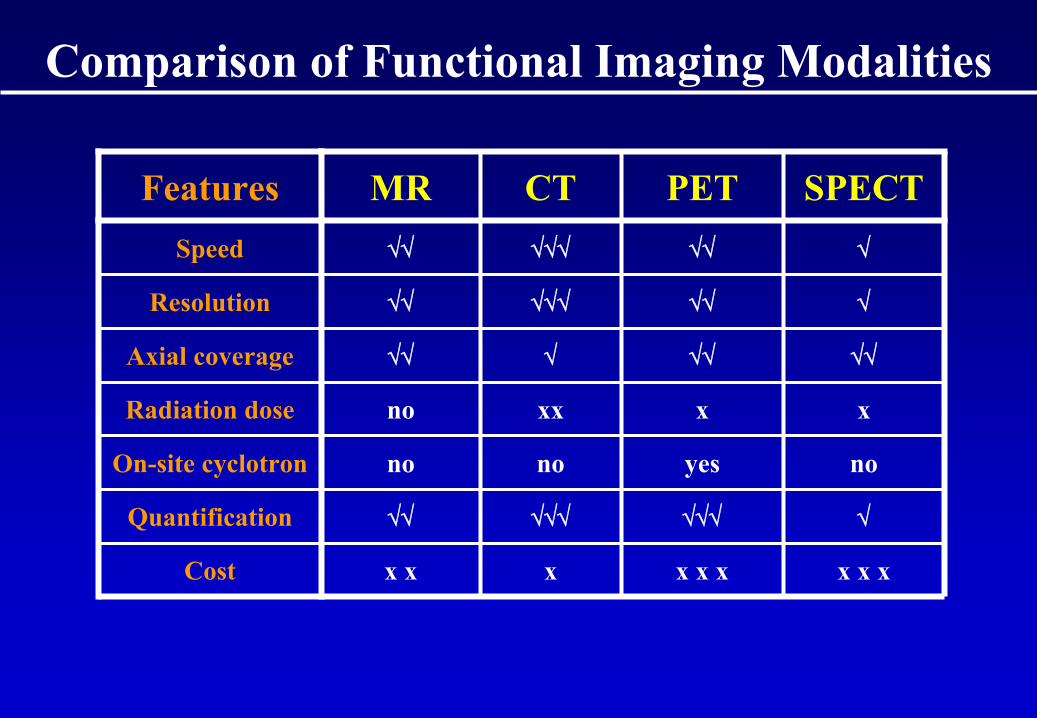
Comparison of Functional Imaging Modalities
Features MR CT PET SPECTSpeed √√ √√√ √√ √
Resolution √√ √√√ √√ √
Axial coverage √√ √ √√ √√
Radiation dose no xx x x
On-site cyclotron no no yes no
Quantification √√ √√√ √√√ √
Cost x x x x x x x x x
Conclusion• CT Perfusion (Functional) imaging is an easy
extension of routine contrast enhanced CT scanning
• Based on ‘realistic’
modeling of transport kinetics of blood-borne contrast agents
• Blood flow is validated against microspheres• Define targets for radiation treatment• Monitor progress and treatment response of
tumors• With new radiation dose reduction
techniques, viable alternative to PET and MR
Dose Reduction by ASIR
80 kVp
200 mAs 80 kVp
20 mAs 80 kVp
20 mAs
+ ASIR
• Brain Functional Study– 4 patients recruited– Each patient had a high dose and low dose CT Perfusion
studies separated by 10 min– High and low dose study used 200 and 50 mAs
per image
– The low dose study was also processed by ASIR
Dose Reduction by ASIR• Brain Functional Study: Average Map
80 kVp
200 mAs 80 kVp
20 mAs 80 kVp
20 mAs
+ ASIR
Dose Reduction by ASIR• Brain Functional Study
80 kVp
200 mAs 80 kVp
20 mAs 80 kVp
20 mAs
+ ASIR
Blo
od F
low
Blo
od V
olum
e
Dose Reduction by ASIR• Figure of Merit (FOM) of Functional Maps
– Segment out
grey and white matter– Grey and white matter pixel mask on functional maps– Mean (μ)
and standard deviation (σ)
of functional parameter
–μσFOM =
AcknowledgementMy Lab:
A Cenic A SoDG Nabavi E StewartE Henderson G CarnesT Purdie C d’EsterreS Gaede M DekabanA Laslo P GabraB Murphy X ChenJF Adam J HadwayD Ouimet L DesjardinsM Murphy F Su
J Bonasia
Collaborators:R KozakJ AmannCT Staff at SJHC