Embed Size (px)
Citation preview

DOING WHAT WE DO BEST
0620
2006 annual report
1919 Flowers Circle • Thomasville, Georgia 31757 • www.flowersfoods.com
FL
OW
ER
S F
OO
DS
20
06
AN
NU
AL
RE
PO
RT

Flowers Foods At a Glance
White breads, buns, rolls Snack cakes, pastries
Flowers Foods, Inc. (NYSE: FLO), headquartered in Thomasville, Ga., is one of the nation’s leading producers and marketers ofpackaged bakery foods for retail and foodservice customers.The company’s 36 highly efficient bakeries produce breads, buns, rolls,snack cakes, and pastries that are distributed fresh throughout the Southeast, Southwest, and Mid-Atlantic region and frozen tocustomers nationwide. Flowers’ brands include Nature’s Own, Whitewheat, Cobblestone Mill, ButterKrust, Evangeline Maid, Dandee,Mary Jane,Captain John Derst,European Bakers, Mrs.Freshley’s, Blue Bird, Mi Casa, as well as regional franchised brands, such as Sunbeam and Bunny.
Soft variety and premiumspecialty breads, buns, rolls
O U R R E A C H
Flowers’ fresh bakery foods are available to approximately38 percent of the U.S.population in 19 states in the Southeast, Southwest,and Mid-Atlantic region andin the District of Columbia.Our frozen products and ourMrs.Freshley’s brand of snackcakes are available nationally.
National Frozen products/snack cake distributionthrough customerwarehouses
Regional Fresh bakeryfood distributionthrough direct-store-delivery
D I S T R I B U T I O N S A L E S C H A N N E L S
80% Direct-store-delivery(DSD)
37% Supermarket/drug
23%Mass merchandiser/discount
7% Conveniencestore
3% Vending2% Thrift store
28%Foodservice
P R O D U C T M I X
20% Direct to customers’warehouses
75% Fresh breads, buns, rolls
9% Frozen bread,rolls
16% Freshsnackcakes, pastries
INVESTOR INFORMATIONSTOCK LISTINGFlowers Foods’ common stock is listed on the NewYork Stock Exchange under the ticker symbol FLO.
WEB SITEInformation on Flowers Foods is posted on theInternet at www.flowersfoods.com.
FINANCIAL INFORMATIONFlowers Foods’ annual report, Form 10-K, pressreleases, and other financial documents are availablethrough the Investor Center on the company’s Website. Individuals may request investor packetsthrough the Web site.
CORPORATE GOVERNANCEThe following corporate governance documents are available on the company’s Web site: CorporateGovernance Guidelines, Audit Committee Charter, Compensation Committee Charter,Nominating/Corporate Governance CommitteeCharter, Finance Committee Charter, StockOwnership Guidelines, Disclosure Policy, EmployeeCode of Conduct, and Code of Business Conductand Ethics for Executive Officers and Directors.These documents are also available by writing to ourinvestor relations department at the corporateaddress noted on this page.
MANAGEMENT CERTIFICATIONSFlowers Foods’ Chief Executive Officer provides theNew York Stock Exchange (NYSE) with certificationin a timely manner as required by NYSE Rule303A.12.The company’s Chief Executive Officer and Chief Financial Officer have each filed therequired certifications regarding the quality of thecompany’s public disclosure with the Securities andExchange Commission as exhibits to our AnnualReport on Form 10-K.
ANNUAL MEETINGFlowers Foods will hold its annual meeting of share-holders at 11:00 a.m. on Friday, June 1, 2007 at theThomasville Cultural Center in Thomasville, Ga.
WEBCASTSFlowers Foods broadcasts quarterly earningsconference calls and other live presentations overthe Internet.The company posts notices of thesewebcasts and archived webcasts on the FlowersWeb site and individuals can sign up to receive e-mail notification of webcasts. Upcoming 2007webcasts are scheduled for May 24, June 1,August 16, and November 8.These dates aresubject to change. For the most currentinformation on these events, please visit theInvestor Center at www.flowersfoods.com.
SHAREHOLDER SERVICESAs Flowers Foods’ transfer and dividend reinvest-ment agent, Computershare offers shareholders avariety of services, including change of address,replacement of lost stock certificates, and assistancewith stock transfers. Shareholders may callComputershare toll free at 800.568.3476 or write to Computershare, Mail Room, P.O. Box 43078,Providence, RI 02940-3078.
INVESTOR RELATIONS CONTACTMarta Jones TurnerSenior Vice President of Corporate Relations229.227.2348 or [email protected]
SHAREHOLDER RELATIONS CONTACTLisa R. HayShareholder Relations Specialist229.227.2216 or [email protected]
GENERAL INFORMATION/MEDIA CONTACTMary A. KrierVice President of Communications229.227.2333 or [email protected]
CORPORATE OFFICE1919 Flowers CircleThomasville, GA 31757Phone: 229.226.9110
Des
ign:
ww
w.cr
ittgr
aham
.com

01
2006
F I N A N C I A L H I G H L I G H T S
000s omitted except per share data; for the fiscal year ended Dec. 30, 2006 Dec. 31, 2005 % change
Sales $1,888,654 $1,715,869 10.1%Income from continuing operations before cumulative
effect of a change in accounting principle $ 74,880 $ 62,858 19.1%Net income $ 81,043 $ 61,231 32.4%Diluted income per share from continuing operations
before cumulative effect of a change inaccounting principle $ 1.21 $ 0.99 22.2%
Diluted net income per share $ 1.31 $ 0.96 36.5%Cash dividends per common share $ 0.475 $ 0.38 25.0%
* * R E C O N C I L I AT I O N O F N E T I N C O M E T O E B I T D A F R O M C O N T I N U I N G O P E R AT I O N S
000s omitted; for the fiscal year ended Dec. 30, 2006 Dec. 31, 2005 Jan. 1, 2005 Jan. 3, 2004
Net Income $ 81,043 $ 61,231 $ 50,774 $ 14,658(Income)/loss from discontinued operations, net of tax (6,731) 1,627 3,486 38,146Cumulative effect of a change in accounting principle 568 – – – Minority interest in variable interest entity 3,255 2,904 1,769 –Income tax expense 45,304 39,861 35,071 33,063Interest income, net (4,946) (6,337) (8,826) (7,982)Depreciation and amortization 64,250 59,344 56,702 53,935
EBITDA from Continuing Operations $182,743 $158,630 $138,976 $131,820
SALES in billions
06
05
04
03*
*53-week year
$1.889+10.1%
$1.716+10.6%
$1.551+6.8%
$1.452+9.4%
INCOME FROM CONTINUING OPERATIONS in millions
06
05
04
03*
*53-week year
$74.94.0% of sales
$62.93.7% of sales
$54.33.5% of sales
$52.83.6% of sales
EBITDA FROM CONTINUING OPERATIONS** in millions
06
05
04
03*
*53-week year
** Below, see reconciliation of net income, the mostdirectly comparable GAAP financial measure toEBITDA from continuing operations.
$182.79.7% of sales
$158.69.2% of sales
$139.09.0% of sales
$131.89.1% of sales
MARKET CAPITALIZATION – FLOin billions
06
05
04
03*
*53-week year
$1.632(1.8)%
$1.662+22.0%
$1.362+19.1%
$1.144+107.6%

02
2006 was another great year for Flowers Foods. Ourteam put in an outstanding performance and achieved:• 10% increase in sales,• 19% increase in earnings from continuing
operations, and• 22% increase in earnings per share from
continuing operations.
Among the year’s highlights:• We added production capacity to support our multiple
years of strong sales growth.This included the openingof a new bakery in Newton, N.C., the start-up of abread line in our Villa Rica, Ga., bakery, and thereopening of a bakery in Houston.
• We extended our direct-store-delivery (DSD) territoryinto areas that adjoin our current territory, includingCincinnati, Ohio, and southern Indiana.
• We acquired Derst Baking Company in Savannah,Ga., which strengthened our position in the SouthCarolina market.
• We introduced new products aimed at health andwellness trends, including six all natural, premiumspecialty breads under Nature’s Own; buns under ourWhitewheat brand; and new “better-for-you” snacksunder the Mrs. Freshley’s SnackAway brand.
• We renewed our efforts to manage our resourceswisely by launching a formal sustainability program.
• Following an extensive study of the performance of 8,000 consumer brands over eight years, Bain &Company, a global management consulting firm,selected Nature’s Own as one of 17 “All Star” brands.
• Forbes magazine named Flowers Foods one of the best-managed companies in the U.S.
We were able to accomplish all this while facing themost dramatic cost increases I have seen in my 40 yearsin this business.This is proof that Flowers Foods is“doing what we do best.” To achieve our goals inthe face of such increases, we sharpened efficienciesthroughout our operation, eliminated unnecessaryexpenses, and cut costs wherever possible. Only thendid we increase prices to our customers.
We have invested in our bakeries for decades and theyare the most efficient in the country.We have listenedto our customers and to consumers and respondedwith new products to fit their needs.We continue togrow our core business, enter new geographic markets,and make acquisitions that fit our growth strategy.Weare using technology in all areas of our business towork smarter. And, we have the most experiencedteam in the baking industry.
Taken together, all of these allow us to ultimately dowhat we do best – deliver consistent sales and earningsgrowth within the bakery category and to deliver valuefor shareholders.
George E. Deese
Chairman of the Board, Chief Executive Officer, and President
LETTER TO SHAREHOLDERS

03
Over several decades, we have created and honed a businessmodel that provides us with a good foundation for growth.Financially, our company is on sound footing and our bakeryoperations are poised to support further sales growth.Thestrength of our brands, the quality of our products, thepower of our bakeries, the dedication of our independentdistributors, and the talent and energy of the entire Flowersteam are enviable advantages.We are in a great position tocontinue growing Flowers Foods.
To the entire team of Flowers employees, distributors, andassociates, I extend my heartfelt thanks for a job well done.Never doubt the value you bring to our company.We couldnot bake or distribute our products without you.
Our company also benefits from an outstanding board ofdirectors. Our directors are attuned to the importance of corporate governance and believe in a culture ofaccountability, responsibility, and ethical behavior.We are fortunate to have their oversight and guidance.
To our shareholders, we pledge to continue to build valuefor you by operating our business wisely and by focusingon growth opportunities within the bakery category.Thank you for the confidence you have in our team andfor your investment in Flowers Foods.
We will continue to do what we do best.
George E. DeeseChairman of the Board, Chief Executive Officer, and President
OUR STRATEGIES
• Grow branded retail and foodservice sales
• Grow organically and through acquisitions
• Develop bakery products to meet customer and consumer needs
• Provide extraordinary customer service
• Operate the country’s most efficient bakeries
• Innovate to improve business
• Manage resources wisely
• Encourage team spirit, diversity,and professional growth

04
PUTTING BAKERIES WHERE THE PEOPLE ARE
Hamburger buns on their way to packaging circle past Jen Brown,
production superintendent, at Flowers’ newest bakery in Newton, N.C.
Opened in 2006, the Newton bakery’s high-speed bun line can
produce 60,000 buns an hour.
Flowers Foods builds oracquires bakeries or addscapacity to existing bakeriesnear market growth areas. In2006, we took the followingactions to keep transporta-tion costs down and getproduct to market in themost cost-effective way.
2/06Savannah, GADerst acquisitionBreads, buns for SC, GA
4/06Houston, TXOpened closedbakeryBuns for TX
6/06Newton, NCNew bakeryBuns for NC,SC, VA, WV,TN, OH
6/06Villa Rica, GANew capacityBread for South,Southeast

05We work hard to bake smart.We pay close attention to every aspect of our business – fromproduction through distribution – and look forways to do things better.
Demand for our products in our existing markets,along with our growth into new geographicmarkets, has challenged our production capacityover the past few years.We continued to addressthis in 2006, adding new capacity to support ourstrong sales growth.We also fine-tuned ourproduction strategy to ensure our bakeries wereproducing the right products for the right market.In other words – we strived to maximize capacitywhile minimizing transportation costs.
In 2006, we opened a bakery in Newton, N.C.The bakery’s high-speed bun line is providingfresh hamburger and hot dog buns for the north-ern part of our market territory, includingVirginia,West Virginia, Maryland,Tennessee,and Ohio.
We added more capacity during the year byinstalling a new bread line in our Villa Rica, Ga.,bakery, opening a closed bakery in Houston toproduce buns for the Texas market, and acquiringDerst Baking Company in Savannah, Ga., whichproduces breads and buns for South Carolina andGeorgia markets. Derst Baking is a fine operationand a welcome addition to our team.
BAKING SMART
James Dobbs, sanitation superintendent at
Flowers’ Villa Rica, Ga., bakery, checks production
of Nature’s Own All Natural 9 Grain loaves on the
bakery’s new bread line. Installed in 2006, the line
can produce 10,000 loaves of bread an hour.
Flowers Foods is constantly improving its business to achieve better results, maximizingcapacity and strategically locating production to serve new markets.

06
Natural.Whole grain. Healthier for you.Thesemay be the latest buzzwords in the baking industry,but we’ve offered breads with these qualities foryears. Nature’s Own has had no artificial colors,flavors, or preservatives since it made its debut inthe 1970s and whole grain 100% whole wheatbread has been a part of Nature’s Own from thebeginning. Healthier white bread? We introducedWhitewheat, our “healthy family white bread” withthe fiber and nutritional content of wheat breadback in 1991.We also were the first commercialbaker on the market with other healthier breads,including sugar-free and reduced carbohydratevarieties.
We continued responding to the market with delicious, new products in 2006. In September,we introduced all natural, premium breads underNature’s Own, with two varieties made with organicflour.We helped promote whole grains by notingthe whole grain gram content right on the front ofthe bread bag – a first in the industry.
With renewed interest in healthier bakery prod-ucts, we expanded our popular Whitewheat brandby adding hamburger and hot dog buns to thelineup and introduced Cobblestone Mill Multi-Grain bagels.We also expanded our Mrs. Freshley’sSnackAway line of better-for-you snacks withchocolate cupcakes and peanut butter wafers.Like all SnackAway items, these new varieties have 150 calories or less, no trans fat, and havemore fiber and less sugar.The wafers also containprobiotics, the same kind of healthy organismsfound in yogurt, which promote good digestion.
In 2006, we gave our Nature’s Own, Cobblestone Mill,Whitewheat, and Blue Bird brands a facelift, unveilingeye-catching new logos and package designs.Wealso created four new Nature’s Own TV commer-cials, which aired on national cable stations.
LISTENING CLOSELY
Our white bread brands, including Whitewheat and
Sunbeam, enjoyed strong sales in 2006. We capitalized
on the popularity of our Whitewheat bread by rolling
out Whitewheat hamburger and hot dog buns.
Flowers Foods listens to customers and consumers. We watch the trends. That’s whywe’ve been ahead of the competition when it comes to product innovation.

07
Clockwise from top: Our regional cake brand, Blue Bird, received a new look this year,
while Mrs. Freshley’s, our national cake brand, introduced a variety of new items,
including SnackAway chocolate cupcakes and peanut butter wafers. All natural 100%
whole wheat bread made with organic flour was one of six new Nature’s Own all natural,
premium specialty breads that hit store shelves in 2006. This delicious and simple
Asian chicken sandwich is made with Nature’s Own Honey Wheat bread. Find the
recipe at www.naturesownbread.com.

Flowers continued its push into newgeographic markets in 2006, addingCincinnati, Ohio, northern Kentucky,and southern Indiana to its direct-store-delivery (DSD) territory. Everyyear, Flowers grows its DSD salesbetween 1% and 1.5% by expandinginto new markets.
Core DSD territory
Territories added since 2003
Frozen bakery foods and snack cakes aredistributed nationally.
DSD TERRITORY GROWTH 2003-2006
08
Chris Dodson (left), Flowers’ product development manager, and two employees of
Flowers’ Suwanee, Ga., bakery – Michael Pledger, production supervisor, and Gay Wilson,
break person – conduct a quality check on ciabatta rolls baked in Suwanee. Dodson,
Pledger, Wilson, and others on the Flowers team worked to develop the roll for a
national fast-food chain that used it in a line of sandwiches introduced in 2006.

09
Flowers has three strategies when it comes togrowing its business. One is to grow organicallyby further developing sales in existing marketsand by expanding its geographic territory intonew markets.Another strategy involves acquisi-tions. Since listing publicly in 1968, Flowers hascompleted more than 100 acquisitions – six since2001.The third growth strategy involves partner-ing with foodservice and retail customers todevelop products that meet their specific needs.
We continued our successful execution of all three growth strategies in 2006. During theyear, we furthered our push into new geographicmarkets, adding Cincinnati, Ohio, northern
Kentucky, and southern Indiana to our DSD territory. In February, we acquired Derst Bakingin Savannah, Ga., a company with 140 years of baking tradition and a strong regional white bread brand, Captain John Derst.
Among our customer projects, we developed aciabatta roll for a national fast-food chain.With adistinctive open texture and the flavor and aromaof olive oil, the rolls are produced at our hearthbakery in Suwanee, Ga. Partnerships with retailand foodservice customers help assure key distri-bution for our products in new markets.They alsostrengthen customer relationships and fuel newproduct development.
GROWING STRONG
Keith White, an independent
distributor for Derst Baking Co.,
checks orders on his hand-held
computer before leaving the
warehouse in Charleston, S.C.
Flowers acquired Derst Baking,
and its popularCaptain John
Derst brand, in February 2006.
Flowers expands its business through organic growth, acquisitions, and by partneringwith customers. Since 2003, 15 million more Americans can purchase our products;since 2001, we have made six strategic acquisitions.

10
We attribute our success, in great part, to the depth of talent wehave among our employees.We work to nurture that talent and to build an atmosphere where employees who perform well areencouraged to move up through the company.
For many years, Flowers had an informal program in place todevelop talent from within. In 2003, we formalized this effort into our Leadership Development and Management SuccessionProgram.Today, employees at all levels within the company have the opportunity every year to share their career goals and todiscuss their aspirations and development needs with their super-visor. A plan is developed for each employee, identifying thetraining and experience needed to help reach his or her goal.
Among Flowers’ top 109 managers, the average length of service is 26 years. Upward of 70% of all our front-line supervisors hadtheir start as hourly employees.That speaks to our success inemployee retention and development. It also helps explain why we have the best team in the business.
The people sitting around this table exemplify Flowers’ long tradition of developing
talent from within. Larry Ruth (left), today president of Leeland Baking Company
in Houston, joined Flowers in 1981 as a production helper. Wayne Parmer (center),
director of distributor relations, began his career in 1988 working in a Flowers’
resale store in Miami. Natalie Harrison (far right), started as an accounts receivable
clerk in Thomasville in 1999 and is now assistant controller for the Thomasville
bakery. Overseeing Flowers’ leadership development program is Tonja Taylor
(standing), managing director of human resources.
Flowers’ team is seasoned, dedicated, and has a depth of experience unmatched in the baked foods industry.Recognizing and developing talent is key to building ateam of this caliber.
DEVELOPINGTALENT

11

12
LEVERAGINGTECHNOLOGYImprovements in efficiency translate tocompetitive advantages in the market.Flowers Foods has invested $310 millionsince 2002 to keep our bakeries and ourdistribution and information systems fastand efficient.
Below: A robotic arm, one of four installed on the Autobake line at our Crossville, Tenn., cake bakery in
2006, swiftly — but gently — picks up individually wrapped creme cakes and places them in cartons.
Right: The new bread line in our Villa Rica, Ga., bakery features a tray loader that automatically puts
loaves into the correct configuration to fill product trays.
Flowers Foods does not embrace new technology or innovations just because they’re new. Instead, welook to technology to help us continue to improvethe way we produce our bakery foods and bringthem to market.
The most recent innovations in baking technologyare in place at our new bakery in Newton, N.C.,which features Flowers’ first automated storageand retrieval system for bun pans.We installed anautomatic tray loader on the new bread line in our

13
Villa Rica, Ga., bakery, and in our largest cakebakery in Crossville,Tenn., we have invested inrobotics that automatically place wrapped cakesinto cartons, cases, and pallets.When in fulloperation, we expect this new equipment inCrossville to reduce production costs by morethan $1 million annually.
We also launched a project that, when completedin 2007, will revolutionize the way we distributesnack cakes to customers nationwide. OurCrossville cake distribution center will use ourinformation technology platform along with radiofrequency technology and barcode scanning toincrease efficiency and accuracy and reduce inventory and transportation costs.

14
There are five principles that guide the actions and decisions of everyone who works at Flowers Foods. Leading the list is integrity.*
Flowers Foods is committed to good corporate governance. Everyyear, our directors, officers, and employees review our code of busi-ness conduct and ethics.We also have an ethics officer, who works tobroaden employee understanding of our conduct code.
Flowers Foods recognizes that without a healthy environment ourcompany cannot succeed.While we have always taken appropriate steps to conserve resources and operate as efficiently as possible,in 2006, we renewed our efforts in this area by launching a formalsustainability program.With our employees, business partners,suppliers, and customers, we are working to prevent waste of water,energy, and other resources and to recycle renewable resources. Oursustainability efforts in 2006 focused on determining current energyuse and developing systems to measure future use.
Our commitment to sustainability makes us a stronger corporate citi-zen as we do what is right for all our stakeholders and the environment.Read our 2006 Sustainability Report at www.flowersfoods.com.
*The five guiding principles of Flowers Foods are integrity, quality, service,commitment, and innovation.
DOING WHAT’S RIGHTFlowers fosters a culture of accountability, responsibility,and ethical conduct. We take our role as a corporate citizen seriously.

15
Wearing protective gear, Jerry Hancock (left), vice president of environmental
and regulatory affairs for Flowers Foods, and Michael Clanton, engineer at
Flowers’ bakery in Thomasville, Ga., check the output from an electrical panel
that sends power to one of the bakery’s dough mixers. Measuring energy
usage is part of Flowers’ sustainability initiative.

16
BOARD OF DIRECTORS
OFFICERS
GE O R G E E. DE E S E
Flowers FoodsChairman of the Board, ChiefExecutive Officer, and PresidentDirector since 2004
JO E E. BE V E R LY 1, 3
Commercial BankChairman of the BoardDirector since 1996*
FR A N K L I N L. BU R K E 1, 3
Bank South, N.A.Former Chairman and Chief Executive OfficerDirector since 1994*
MA N U E L A. FE R N A N D E Z 2, 4
SI VenturesManaging DirectorDirector since 2005
BE N J A M I N H. GR I S WO L D IV 1, 3
Brown AdvisoryPartner and ChairmanDirector since 2005
JO S E P H L. LA N I E R, JR. 2, 4
Dan River, Inc.Retired Chairman Director since 1977*
AM O S R. MCMU L L I A N
Flowers FoodsChairman Emeritus and retired Chief Executive OfficerDirector since 1975*
J. V. SH I E L D S, JR. 3, 4
Shields & CompanyChairman and Chief Executive OfficerDirector since 1989*
ME LV I N T. ST I T H, PH.D. 2, 3
Syracuse UniversityDean of Whitman School of ManagementDirector since 2004
JAC K I E M. WA R D 2, 4
Computer Generation,IncorporatedRetired Chairman and Chief Executive OfficerDirector since 1999*
C. MA RT I N WO O D III 1, 3
Flowers IndustriesRetired Senior Vice Presidentand Chief Financial OfficerDirector since 1975*
COMMITTEES OF THE BOARD1 Audit Committee2 Compensation Committee3 Finance Committee4 Nominating/Corporate
Governance Committee
GE O R G E E. DE E S E
Chairman of the Board, ChiefExecutive Officer, and President43 years
JI M M Y M. WO O DWA R D
Senior Vice President and ChiefFinancial Officer22 years
ST E P H E N R. AV E R A
Senior Vice President,Secretary and General Counsel21 years
MI C H A E L A. BE AT Y
Senior Vice President of Supply Chain36 years
GE N E D. LO R D
President and Chief OperatingOfficer, Bakeries Group41 years
AL L E N L. SH I V E R
President and Chief OperatingOfficer, Specialty Group29 years
MA RTA JO N E S TU R N E R
Senior Vice President ofCorporate Relations29 years
The years stated for all officersrepresent the years employed withFlowers Foods and its predecessorcompany, Flowers Industries.
* Includes service to Flowers Foods and its predecessor, Flowers Industries

SECURITIES AND EXCHANGE COMMISSIONWashington, D.C. 20549
FORM 10-K(Mark One)
¥ ANNUAL REPORT PURSUANT TO SECTION 13 OR 15(d)OF THE SECURITIES EXCHANGE ACT OF 1934For the fiscal year ended December 30, 2006
ORn TRANSITION REPORT PURSUANT TO SECTION 13 OR 15(d)
OF THE SECURITIES EXCHANGE ACT OF 1934For the transition period from to
Commission file number 1-16247
FLOWERS FOODS, INC.(Exact name of registrant as specified in its charter)
Georgia(State or other jurisdiction ofincorporation or organization)
58-2582379(I.R.S. Employer
Identification No.)
1919 Flowers CircleThomasville, Georgia
(Address of principal executive offices)
31757(Zip Code)
Registrant’s telephone number, including area code:(229) 226-9110
Securities registered pursuant to Section 12(b) of the Act:
Title of Each ClassName of Each Exchange
on Which Registered
Common Stock, $0.01 per share, togetherwith Preferred Share Purchase Rights
New York Stock Exchange
Securities registered pursuant to Section 12(g) of the Act:None
Indicate by check mark if the registrant is a well-known seasoned issuer, as defined in Rule 405 of the SecuritiesAct. Yes ¥ No n
If this report is an annual or transition report, indicate by check mark if the registrant is not required to file reports pursuant toSection 13 or 15(d) of the Securities Exchange Act of 1934. Yes n No ¥
Indicate by check mark whether the registrant (1) has filed all reports required to be filed by Section 13 or 15(d) of the SecuritiesExchange Act of 1934 during the preceding 12 months (or for such shorter period that the registrant was required to file such reports), and(2) has been subject to such filing requirements for the past 90 days: Yes ¥ No n
Indicate by check mark if disclosure of delinquent filers pursuant to Item 405 of Regulation S-K is not contained herein, and will notbe contained, to the best of registrant’s knowledge, in definitive proxy or information statements incorporated herein by reference inPart III of this Form 10-K or any amendment to this Form 10-K. n
Indicate by check mark whether the registrant is a large accelerated filer, an accelerated filer or a non-accelerated filer (as defined inRule 12b-2 of the Exchange Act).
Large accelerated filer ¥ Accelerated filer n Non-accelerated filer n
Indicate by check mark whether the registrant is a shell company (as defined in Rule 12b-2 of the ExchangeAct). Yes n No ¥
Based on the closing sales price on the New York Stock Exchange on July 14, 2006 the aggregate market value of the voting andnon-voting common stock held by non-affiliates of the registrant was $1,625,449,757.
On February 23, 2007, the number of shares outstanding of the registrant’s Common Stock, $0.01 par value, was 60,841,506.
DOCUMENTS INCORPORATED BY REFERENCE:Portions of the registrant’s Proxy Statement for the 2007 Annual Meeting of Shareholders to be held June 1, 2007, which will be
filed with the Securities and Exchange Commission on or prior to April 27, 2007, have been incorporated by reference into Part III,Items 10, 11, 12, 13 and 14 of this Annual Report on Form 10-K.

FORM 10-K REPORT
TABLE OF CONTENTS
Page
PART I
Item 1. Business . . . . . . . . . . . . . . . . . . . . . . . . . . . . . . . . . . . . . . . . . . . . . . . . . . . . . . . . . . . . . . . 1
Item 1A. Risk Factors . . . . . . . . . . . . . . . . . . . . . . . . . . . . . . . . . . . . . . . . . . . . . . . . . . . . . . . . . . . . 9
Item 1B. Unresolved Staff Comments . . . . . . . . . . . . . . . . . . . . . . . . . . . . . . . . . . . . . . . . . . . . . . . . . 13
Item 2. Properties . . . . . . . . . . . . . . . . . . . . . . . . . . . . . . . . . . . . . . . . . . . . . . . . . . . . . . . . . . . . . . 14
Item 3. Legal Proceedings . . . . . . . . . . . . . . . . . . . . . . . . . . . . . . . . . . . . . . . . . . . . . . . . . . . . . . . . 15
Item 4. Submission of Matters to a Vote of Security Holders . . . . . . . . . . . . . . . . . . . . . . . . . . . . . . 15
PART II
Item 5. Market for the Registrant’s Common Equity, Related Stockholder Matters and IssuerRepurchases of Equity Securities . . . . . . . . . . . . . . . . . . . . . . . . . . . . . . . . . . . . . . . . . . . . . 15
Item 6. Selected Financial Data . . . . . . . . . . . . . . . . . . . . . . . . . . . . . . . . . . . . . . . . . . . . . . . . . . . . 18
Item 7. Management’s Discussion and Analysis of Results of Operations and Financial Condition . . . 18
Item 7A. Quantitative and Qualitative Disclosures About Market Risk . . . . . . . . . . . . . . . . . . . . . . . . . 36
Item 8. Financial Statements and Supplementary Data . . . . . . . . . . . . . . . . . . . . . . . . . . . . . . . . . . . 37
Item 9. Changes in and Disagreements with Accountants on Accounting and Financial Disclosure . . . 37
Item 9A. Controls and Procedures . . . . . . . . . . . . . . . . . . . . . . . . . . . . . . . . . . . . . . . . . . . . . . . . . . . 37
Item 9B. Other Information . . . . . . . . . . . . . . . . . . . . . . . . . . . . . . . . . . . . . . . . . . . . . . . . . . . . . . . . 38
PART III
Item 10. Directors and Executive Officers of the Registrant . . . . . . . . . . . . . . . . . . . . . . . . . . . . . . . . 38
Item 11. Executive Compensation . . . . . . . . . . . . . . . . . . . . . . . . . . . . . . . . . . . . . . . . . . . . . . . . . . . 38
Item 12. Security Ownership of Certain Beneficial Owners and Management and Related StockholderMatters . . . . . . . . . . . . . . . . . . . . . . . . . . . . . . . . . . . . . . . . . . . . . . . . . . . . . . . . . . . . . . . . 38
Item 13. Certain Relationships and Related Transactions. . . . . . . . . . . . . . . . . . . . . . . . . . . . . . . . . . . 38
Item 14. Principal Accountant Fees and Services . . . . . . . . . . . . . . . . . . . . . . . . . . . . . . . . . . . . . . . . 38
PART IV
Item 15. Exhibits and Financial Statement Schedule . . . . . . . . . . . . . . . . . . . . . . . . . . . . . . . . . . . . . . 39
Signatures . . . . . . . . . . . . . . . . . . . . . . . . . . . . . . . . . . . . . . . . . . . . . . . . . . . . . . . . . . . . . . 42
i

Forward Looking Statements
Statements contained in this filing and certain other written or oral statements made from time to time by thecompany and its representatives that are not historical facts are forward-looking statements as defined in the PrivateSecurities Litigation Reform Act of 1995. Forward-looking statements relate to current expectations regarding ourfuture financial condition and results of operations and are often identified by the use of words and phrases such as“anticipate,” “believe,” “continue,” “could,” “estimate,” “expect,” “intend,” “may,” “plan,” “predict,” “project,”“should,” “will,” “would,” “is likely to,” “is expected to” or “will continue,” or the negative of these terms or othercomparable terminology. These forward looking statements are based upon assumptions we believe are reasonable.
Forward-looking statements are based on current information and are subject to risks and uncertainties thatcould cause our actual results to differ materially from those projected. Certain factors that may cause actual results,performance, and achievements to differ materially from those projected are discussed in this report and mayinclude, but are not limited to:
• unexpected changes in any of the following: (i) general economic and business conditions; (ii) thecompetitive setting in which we operate, including changes in pricing, advertising or promotional strategiesby us or our competitors, as well as changes in consumer demand; (iii) interest rates and other termsavailable to us on our borrowings; (iv) energy and raw materials costs and availability and hedging counter-party risks; (v) relationships with our employees, independent distributors and third party service providers;and (vi) laws and regulations (including health-related issues), accounting standards or tax rates in themarkets in which we operate;
• the loss or financial instability of any significant customer(s);
• our ability to execute our business strategy, which may involve integration of recent acquisitions or theacquisition or disposition of assets at presently targeted values;
• our ability to operate existing, and any new, manufacturing lines according to schedule;
• the level of success we achieve in developing and introducing new products and entering new markets;
• changes in consumer behavior, trends and preferences, including health and whole grain trends;
• our ability to implement new technology as required;
• the credit and business risks associated with our independent distributors and customers which operate in thehighly competitive retail food and foodservice industries, including the amount of consolidation in theseindustries;
• customer and consumer reaction to pricing actions;
• any business disruptions due to political instability, armed hostilities, incidents of terrorism, natural disastersor the responses to or repercussions from any of these or similar events or conditions and our ability to insuresuch events.
The foregoing list of important factors does not include all such factors nor necessarily present them in order ofimportance. In addition, you should consult other disclosures made by the company (such as in our other filings withthe Securities and Exchange Commission (“SEC”) or in company press releases) for other factors that may causeactual results to differ materially from those projected by the company. Please refer to Part I, Item 1A., Risk Factors,of this Form 10-K for additional information regarding factors that could affect the company’s results of operations,financial condition and liquidity.
We caution you not to place undue reliance on forward-looking statements, as they speak only as of the datemade and are inherently uncertain. The company undertakes no obligation to publicly revise or update suchstatements, except as required by law. You are advised, however, to consult any further public disclosures by thecompany (such as in our filings with the SEC or in company press releases) on related subjects.
ii

PART I
Item 1. Business
Corporate Information
The company’s predecessor was founded in 1919 when two brothers, William Howard and Joseph HamptonFlowers, opened Flowers Baking Company in Thomasville, Ga. In 1968, Flowers Baking Company went public,became Flowers Industries, and began trading over-the-counter stock. Less than a year later, Flowers listed on theAmerican Stock Exchange. In 1982, the company listed on the New York Stock Exchange under the symbol FLO. Inthe mid-1990s, Flowers Industries transformed itself from a strong regional baker into a national baked foodscompany with the acquisition of Keebler Foods Company, one of the largest cookie and cracker companies in theUnited States, and Mrs. Smith’s, one of the country’s top-selling frozen pie brand. By 1999, Flowers Industries hadbecome a $4.2 billion national baked foods company with three business units — Flowers Bakeries, a super-regional fresh baked foods company; Mrs. Smith’s Bakeries, a national frozen baked foods company; and Keebler.In March 2001, Flowers sold its investment in Keebler to the Kellogg Company, and the remaining business units —Flowers Bakeries and Mrs. Smith’s — were spun off into a new company called Flowers Foods, which wasincorporated in Georgia in 2000. In April 2003, Flowers sold the Mrs. Smith’s frozen dessert business to TheSchwan Food Company.
As used herein, references to “we,” “our,” “us,” the “company” or “Flowers Foods” include the historicaloperating results and activities of the business operations that comprised Flowers Foods as of December 30, 2006.
The Company
Flowers Foods is one of the largest producers and marketers of bakery products in the United States. FlowersFoods consists of two business segments: Flowers Foods Bakeries Group (“Flowers Bakeries”) and Flowers FoodsSpecialty Group (“Flowers Specialty”).
We have a major presence in each of the product categories in which we compete. Flowers Bakeries’ brandshave a leading share of fresh packaged branded sales measured in both dollars and units in the major southernmetropolitan markets we serve. Our major branded products include, among others, the following:
Flowers Bakeries Flowers Bakeries Flowers SpecialtyFlowers Regional Franchised Brands Mrs. Freshley’s
Nature’s Own Sunbeam Snack AwayWhitewheat Roman Meal European Bakers
Cobblestone Mill BunnyBlueBird Holsum
ButterKrustMary Jane
DandeeEvangeline Maid
IdealCaptain John Derst
Mi Casa
Our strategy is to be one of the nation’s leading producers and marketers of bakery products, available todistributors and customers through multiple channels of distribution within the industry, including traditionalsupermarkets and their in-store deli/bakeries, foodservice distributors, convenience stores, mass merchandisers,club stores, wholesalers, restaurants, fast food outlets, schools, hospitals and vending machines. Our strategyfocuses on developing products responsive to ever changing consumer needs and preferences through productinnovation and leveraging our well established brands, listed above. To assist in accomplishing our strategy, wehave invested capital to automate and expand our production and distribution capabilities as well as increase ourefficiency. We believe these investments allow us to produce and distribute high quality products at the lowest cost.
1

Flowers Bakeries focuses on the production and marketing of bakery products in the southeastern, south-western and mid-Atlantic regions of the United States. Flowers Bakeries markets a variety of breads and rolls underthe brands outlined in the table above. Over time, through product innovation and product diversity, FlowersBakeries has been able to strengthen and establish its brands in the markets it serves. We have devoted significantresources to automate our production facilities, improve our distribution capabilities and enhance our informationtechnology. Historically, we have grown through acquisitions of bakery operations that are generally within orcontiguous to our existing region and which can be served with our extensive direct-store-delivery (“DSD”) system.However, we also have grown by expanding our DSD service 100 to 150 miles into states that adjoin the currentterritories supplied by the company, and we intend to continue this growth initiative in the near future. The DSDsystem utilizes approximately 3,000 independent distributors who own the rights to sell certain brands of our bakeryproducts within their respective territories. Our strategy is to continue enabling these independent distributors tobetter serve their customers, principally by using technology to enhance the productivity and efficiency of ourproduction facilities and our DSD system.
Flowers Specialty produces snack cakes for sale to retail, vending, and co-pack customers as well as frozenbread, rolls and buns for sale to retail and foodservice customers. Flowers Specialty products are distributednationally through mass merchandisers, brokers, as well as warehouse and vending distribution. Additionally,Flowers Specialty distributes to retail outlets in the southeastern, southwestern and mid-Atlantic regions of theUnited States through Flowers Bakeries’ DSD system. Flowers Specialty’s facilities have automated high-speedequipment that allows us to be very competitive in the marketplace.
Industry Overview
The United States food industry is comprised of a number of distinct product lines and distribution channels forbakery products. Although supermarket bakery aisle purchases remain the largest channel for consumers’ bakeryfoods purchases, non-supermarket channels, such as mass merchandisers, convenience stores, club stores, res-taurants and other convenience channels also are outlets where consumers purchase bakery items. Non-supermarketchannels of distribution are growing in importance throughout the food industry.
Fresh Bakery Products
Retail sales of bakery products continue to move to a variety of premium and specialty breads. Sales of bakeryproducts to mass merchandisers continue to grow at a faster rate than traditional retail supermarket sales. In additionto Flowers Foods, several large baking and diversified food companies market bakery products in the United States.Competitors in this category include Interstate Bakeries Corporation, Sara Lee Corporation, George WestonLimited, Grupo Bimbo S.A. de C.V., McKee Foods Corporation (Little Debbie) and Campbell Soup Company(Pepperidge Farm). There are also a number of smaller regional companies. Historically, the larger companies haveenjoyed several competitive advantages over smaller operations due principally to greater brand awareness andeconomies of scale in areas such as purchasing, distribution, production, information technology, advertising andmarketing. However, given that one of the company’s largest competitors filed for bankruptcy during 2004, sizealone is not sufficient to ensure success in our industry.
Consolidation has been a significant trend in the baking industry over the last several years. It continues to bedriven by factors such as capital constraints on smaller companies that limit their ability to avoid technologicalobsolescence and to increase productivity or to develop new products, generational changes at family-ownedbusinesses and the need to serve the consolidated retail customers and the foodservice channel. We believe that theconsolidation trend in the baking, food retailing and foodservice industries will continue to present opportunities forstrategic acquisitions that complement our existing businesses and extend our super-regional presence.
Frozen Bakery Products
Sales of frozen breads and rolls to foodservice institutions and other distribution channels, includingrestaurants and in-store bakeries, continue to grow at a faster rate than sales to retail channels. Primary competitorsin the frozen breads and rolls market include Alpha Baking Co., Inc., Rotella’s Italian Bakery, Ottenberg’s Bakers,Inc. and All Round Foods, Inc. in the foodservice market.
2

According to the National Restaurant Association (“NRA”), restaurant industry sales are expected to reach$537 billion in 2007, reflecting a growth rate of 5% over 2006. 2007 will mark the 16th consecutive year of salesgrowth in the restaurant industry. Full service restaurants sales are expected to grow 5.1% due to a rise in disposableincome, an expanding economy and increased tourism. According to NRA data, sales at quick service restaurants,including fast-casual or quick casual, are projected to grow 5.0% due to consumers’ continued demand forconvenience and value and new menu offerings. The NRA predicts the number of restaurants in the United Stateswill top approximately 1,000,000 by 2010. Restaurants’ share of the food dollar is 47.9%, but it is expected to be53% by 2010. In 1955, the share was 25%.
Strategy
Our mission is to build value for our shareholders. We accomplish this by developing and implementing long-term strategies that help us maintain competitive advantages. Our strategies are based on the production,distribution and marketing requirements of the distribution channels we serve as one of the nation’s leadingproducers and marketers of bakery products. Our operating strategies are:
• Grow sales — both organically and through acquisition. We have consistently pursued growth in sales,geographic markets and products through strategic acquisitions, having completed over 100 acquisitionssince 1968. We intend to continue pursuing growth through strategic acquisitions that will complement andexpand our existing markets, product lines, and product categories and that fit our organization bothoperationally and financially. We also have extended and intend to continue to extend our DSD service 100to 150 miles into states that adjoin the current territories supplied by the company. A combination oftraditional acquisitions and greenfield plant construction will allow the company to accomplish this goal.
• Develop bakery products to meet our customers’ and our consumers’ needs. We maintain a broad line offresh and frozen bakery products. We will continue to expand our product lines to address changingconsumer needs and preferences, particularly health-conscious consumer preferences.
• Strong brand recognition. We capitalize on the success of our well-recognized brand names, whichcommunicate product consistency and quality, by extending those brand names to new products that meetour consumers’ dietary needs. We also extend these brands to additional distribution channels. Our Nature’sOwn brand is the top-selling brand in the soft variety bread category. Many of our white bread brands arecategory leaders in the geographical areas where they are sold.
• Provide extraordinary service for our customers. We continue to expand and refine our distribution andinformation systems to help us respond quickly and efficiently to changing customer service needs,consumer preferences, and seasonal demands in the channels we serve. We have distribution systemstailored to the nature of each of our food product categories and designed to provide the highest levels ofservice to our retail and foodservice customers.
• Operate the country’s most efficient bakeries. We maintain a level of capital improvements that will permitus to fulfill our commitment to remaining among the most efficient bakery producers in the United States.
• Innovate to improve our business. We constantly work to improve our business processes to driveincreased efficiencies and cost improvements.
• Offer a work environment that embraces diversity, fosters team spirit and encourages professional growth.We build teams of individuals who understand the importance of working together to implement ourstrategies, thereby increasing shareholder value over the long term. Our work environment encouragesrecognition and respect for team as well as for individual achievements.
• Conserve our natural resources and promote a clean healthy environment. We recognize that without ahealthy environment our company cannot be successful. We are committed to applying the principles ofsustainability in all aspects of our business. The company encourages every employee and associate toaccept responsibility for conserving our natural resources and for seeking ways to improve the company’suse of those resources. Working together with our employees, business partners, suppliers and customers, weare striving to prevent waste of water, packaging, energy and other resources. Our commitment to
3

sustainability makes us an even better corporate citizen, and we believe these efforts will increaseprofitability and enhance shareholder value over the long term.
Products
We produce fresh packaged and frozen bakery products.
Flowers Bakeries
We market our fresh packaged bakery products in the southeastern, southwestern and mid-Atlantic regions ofthe United States. Our soft variety and premium specialty breads are marketed throughout these regions under ourNature’s Own and Cobblestone Mill brands. We have developed and introduced many new products over the lastseveral years that appeal to health-conscious consumers. Examples of new products under our Nature’s Own brandinclude:
• All Natural 100% Whole Wheat with Organic Flour
• All Natural Honey Wheat with Organic Flour
• All Natural 12 Grain
• All Natural 9 Grain
• Double Fiber and Sugar Free and High Calcium breads
Additionally, in 2006 we introduced several new varieties under our Cobblestone Mill brand, including Multi-Grain Bagels, 12 Grain Sub Rolls and Cinnamon Swirl Bread.
We also market regional franchised brands such as Sunbeam, Bunny and Holsum, and regional brands we ownsuch as ButterKrust, Dandee, Mary Jane, Evangeline Maid, Ideal and Captain John Derst. Nature’s Own is the bestselling brand by volume of soft variety bread in the United States, despite only being available to approximately37% of the population. Flowers Bakeries’ branded products account for approximately 59% of its sales.
In addition to our branded products, we also produce and distribute fresh packaged bakery products underprivate labels for retailers. While private label products carry lower margins than our branded products, we use ourprivate label offerings to effectively utilize production and distribution capacity and to help the independentdistributors in the DSD system expand total retail shelf space.
We also utilize our DSD system to supply bakery products to quick serve restaurants and other outlets, whichaccount for 25% of Flowers Bakeries sales.
Flowers Specialty
Flowers Specialty produces and sells pastries, doughnuts and bakery snack products primarily under theMrs. Freshley’s brand to customers for re-sale through multiple channels of distribution, including mass mer-chandisers, vending and convenience stores. Mrs. Freshley’s is a full line of bakery snacks positioned as awarehouse delivered alternative to DSD brands such as Hostess, Dolly Madison and Little Debbie. Mrs. Freshley’sproducts are manufactured on a “bake to order” basis and are delivered throughout the United States. FlowersSpecialty also produces pastries, doughnuts and bakery snack products for distribution by Flowers Bakeries’ DSDsystem under the BlueBird brand and for sale to other food companies for re-sale under their brand names. We alsocontract manufacture snack products under various private and branded labels for sale through the retail channel.Some of our contract manufacture customers are also our competitors. During the last half of fiscal 2005 andcontinuing in fiscal 2006, Flowers Specialty experienced a reduction in contract manufacturing volume. Over time,we expect to replace lower margin contract snack cake production with sales of higher margin branded products.
In fiscal 2006, Flowers Specialty introduced a variety of new products under the Snack Away brand, includingYogurt Filled Oatmeal Creme Pies, Creme Cakes, Chocolate Cupcakes and Peanut Butter Wafers. This line ismarketed as a “better-for-you” snack alternative with a good source of fiber, no added sugar, and under 150 calories
4

per serving. Also, during fiscal 2006, Flowers Specialty introduced Jumbo Cake Donuts under its Mrs. Freshley’sbrand.
Flowers Specialty also produces and distributes a variety of frozen bread, rolls and buns for sale to foodservicecustomers. In addition, our frozen bread and roll products under the European Bakers brand are distributed for retailsale in supermarket deli-bakeries. In fiscal 2006, Flowers Specialty introduced several new items in the foodservicesegment, including a ciabatta bun for Wendy’s, kaiser buns for Jack-In-The-Box, a corn-dusted bun for Applebee’sand a variety of specialty breads for our foodservice distributor customers such as U.S. Foodservice and Sysco.Flowers Specialty has the ability to provide its customers with a variety of products using both conventional andhearth baking technologies.
Production and Distribution
We design our production facilities and distribution systems to meet the marketing and production demands ofour major product lines. Through a significant program of capital improvements and careful planning of plantlocations, which, among other things, allows us to establish reciprocal baking or product transfer arrangementsamong our bakeries, we seek to remain a low cost producer and marketer of a full line of bakery products on anational and super-regional basis. In addition to the DSD system for our fresh baked products, we also use bothowned and public warehouses and distribution centers in central locations for the distribution of certain of ourFlowers Specialty products.
Extended Shelf Life
Certain of our products provide for an extended shelf life (“ESL”). ESL products are formulated to enhancetaste, quality and freshness while extending the length of time certain products remain on the retail customers’ shelfand the “sell by” date. We continue to use ESL and expect to continue to do so in the foreseeable future. Weexperience financial benefits of ESL through reduced stale costs and reduced out-of-stock conditions. We have not,and do not intend to, reduce service days or the number of route territories used to service our customers as a resultof ESL.
Flowers Bakeries
We operate 27 fresh packaged bakery production facilities in ten states and one production facility thatproduces frozen bakery products. Throughout our history, we have devoted significant resources to automate ourproduction facilities and improve our distribution capabilities. We believe that these investments have made us themost efficient major producer of packaged bakery products in the United States. We believe that our capitalinvestment yields long-term benefits in the form of more consistent product quality, highly sanitary processes, andgreater production volume at a lower cost per unit. We intend to continue investing in our production facilities andequipment to maintain high levels of efficiency.
In February 2006, the company acquired Derst Baking Company (“Derst”), a Savannah, Georgia-basedbakery. Derst, with annual sales of approximately $50 million, produces breads and rolls distributed to customersand consumers in South Carolina, eastern Georgia and north Florida.
In October 2005, the company purchased land and a building in Newton, North Carolina. This facilityproduces fresh breads and buns for distribution in the Piedmont and mid-Atlantic markets. Bun production in thisfacility began in May 2006, and bread production is expected to begin in the spring of 2007.
In September 2004, the company acquired the assets of a bread and bun bakery in Houston, Texas from SaraLee Bakery Group. The transaction included a list of associated private label and foodservice customers that SaraLee Bakery Group previously served in selected Texas markets.
In October 2003, the company purchased land and a building in Denton, Texas and converted the building intoa bakery facility that produces fresh baked foods primarily for the Dallas-Ft. Worth market. We began producingbuns in this facility in the summer of 2004 and bread in the summer of 2005.
5

Distribution of fresh packaged bakery products through the company’s DSD system, involves determiningappropriate order levels, delivery of the product from the production facility to the independent distributor for directstore delivery to the customer, stocking the product on the shelves, visiting the customer daily to ensure thatinventory levels remain adequate and removing stale goods. The company also uses scan-based trading, whichallows us to track and monitor sales and inventories more effectively. Food retailers, including supermarkets andmass merchandisers use scan-based trading to provide information that allows the company to produce anddistribute products efficiently.
We utilize a network of approximately 3,000 independent distributors who own the rights to distribute certainbrands of our fresh packaged bakery products in their geographic territories. The company has sold the majority ofits territories to independent distributors under long-term financing arrangements, which are managed and servicedby the company. The system is designed to provide retail and foodservice customers with superior service becauseindependent distributors, highly motivated by financial incentives from their route ownership, strive to increasesales by maximizing service. In turn, independent distributors have the opportunity to benefit directly from theenhanced value of their routes resulting from higher branded sales volume.
The company leases hand-held computer hardware, which contains our proprietary software, and chargesindependent distributors an administrative fee for its use. This fee reduces the company’s selling, marketing andadministrative expenses and amounted to $2.4 million, $1.6 million and $1.3 million for fiscal 2006, fiscal 2005 andfiscal 2004, respectively. Our proprietary software permits distributors to track and communicate inventory data tothe production facilities and to calculate recommended order levels based on historical sales data and recent trends.These orders are electronically transmitted to the appropriate production facility on a nightly basis. This system isdesigned to ensure that the distributor has an adequate supply of product and the right mix of products available tomeet the retail and foodservice customers’ immediate needs. We believe our system minimizes returns of unsoldgoods. In addition to the hand-held computers, we use a software system that allows us to accurately track sales,product returns and profitability by selling location, plant, day and other bases. The system provides real-time, on-line access to sales and gross margin reports on a daily basis, allowing us to make prompt operational adjustmentswhen appropriate. During fiscal 2004, the company began upgrading the hand-held computer system in order to stayabreast of the latest technological advances in this area. This upgrade improved our ability to forecast sales andmore fully leverage our sales data warehouse to improve our in-store product ordering by customer. This upgradewas completed in early 2006. The cost of this upgrade did not have a material effect on our results of operations,financial condition or cash flows.
Flowers Specialty
We operate five production facilities that produce packaged bakery snack products, two production facilitiesthat produce frozen bread and rolls and one facility that produces fresh packaged bread and rolls. We distribute amajority of our packaged bakery snack products from a centralized distribution facility located near our Crossville,Tennessee production facility, which allows us to achieve both production and distribution efficiencies. Theproduction facilities are able to operate longer, more efficient production runs of a single product, a majority ofwhich are then shipped to the centralized distribution facility. Products coming from different production facilitiesare then cross-docked and shipped directly to customer warehouses. Our frozen bread and rolls products are shippedto various outside freezer facilities for distribution to our customers.
On September 1, 2005, the company acquired substantially all the assets of Royal Cake Company, Inc.(“Royal”), a Winston-Salem, North Carolina based bakery. Royal produces cookies, cereal bars and creme-filledcakes.
Customers
Our top 10 customers in fiscal 2006 accounted for 42.0% of sales. During fiscal 2006, our largest customer,Wal-Mart/Sam’s Club, represented 18.9% of the company’s sales. Retail consolidation has increased the impor-tance of our significant customers. The loss of Wal-Mart/Sam’s Club as a customer or a material negative change inour relationship with this customer could have a material adverse effect on our business. No other customer
6

accounted for 10% of our sales. The loss or financial instability of a major customer could have a material adverseeffect on our business.
Flowers Bakeries
Our fresh baked foods customer base includes mass merchandisers, supermarkets and other grocery retailers,restaurants, fast-food chains, food wholesalers, institutions and vending companies. We also sell returned andsurplus product through a system of thrift outlets. We supply numerous restaurants, institutions and foodservicecompanies with bakery products, including buns for restaurants such as Burger King, Wendy’s, Krystal, Hardees,Whataburger and Outback Steakhouse. We also sell packaged bakery products to wholesale distributors for ultimatesale to a wide variety of food outlets.
Flowers Specialty
Our packaged bakery snack products under the Mrs. Freshley’s brand is sold primarily to customers whodistribute the product nationwide through multiple channels of distribution, including mass merchandisers,supermarkets, vending outlets and convenience stores. We also produce packaged bakery snack products forFlowers Bakeries’ DSD system under our BlueBird brand. In certain circumstances, we enter into co-packingarrangements with other food companies, some of which are competitors. Our frozen bakery products are sold tofoodservice distributors, institutions, retail in-store bakeries and restaurants under our European Bakers brand andunder private labels.
Marketing
Our marketing and advertising campaigns are conducted through targeted television and radio advertising andprinted media coupons. We also incorporate promotional tie-ins with other sponsors, on-package promotional offersand sweepstakes into our marketing efforts. Additionally, we focus our marketing and advertising campaigns onspecific products throughout the year, such as hamburger and hotdog buns for Memorial Day, Independence Dayand Labor Day.
Competition
Flowers Bakeries
The United States packaged bakery category is intensely competitive and is comprised of large foodcompanies, large independent bakeries with national distribution and smaller regional and local bakeries. Primarynational competitors include Interstate Bakeries Corporation, Sara Lee Corporation, George Weston Limited,Grupo Bimbo S.A. de C.V., McKee Foods Corporation (Little Debbie) and Campbell Soup Company (PepperidgeFarm). We also face competition from private label brands produced by us and our competitors. Competition isbased on product availability, product quality, brand loyalty, price, effective promotions and the ability to targetchanging consumer preferences. Customer service, including frequent delivery and well-stocked shelves throughthe efforts of the independent distributors, is an increasingly important competitive factor. While we experienceprice pressure from time to time, primarily as a result of competitors’ promotional efforts, we believe that ourdistributor and customer relationships, which are enhanced by our information technology and the consumers’brand loyalty, as well as our diversity within our region in terms of geographic markets, products and sales channels,limit the effects of such competition. We believe we have significant competitive advantages over smaller regionalbakeries due to greater brand awareness and economies of scale in areas such as purchasing, distribution,production, information technology, advertising and marketing.
Flowers Specialty
Competitors for fresh packaged bakery snack products produced by Flowers Specialty include InterstateBakeries Corporation (Hostess and Dolly Madison), McKee Foods Corporation (Little Debbie) and many regionalcompanies who produce both branded and private label product. For the fresh bakery snack products produced byFlowers Specialty, competition is based upon the ability to meet production and distribution demands of retail andvending customers at a competitive price.
7

Competitors of Flowers Specialty for frozen bakery products include Alpha Baking Co., Inc., Rotella’s ItalianBakery, Ottenberg’s Bakers, Inc. and All Round Foods, Inc. in the foodservice market. Competition for frozenbakery products is based primarily on product quality and consistency, product variety and the ability to consistentlymeet production and distribution demands at a competitive price.
Intellectual Property
We own a number of trademarks and trade names, as well as certain licenses. The company also sells itsproducts under a number of regional franchised and licensed trademarks and trade names that it does not own. Thesetrademarks and trade names are considered to be important to our business since they have the effect of developingbrand awareness and maintaining consumer loyalty. We are not aware of any fact that would negatively impact thecontinued use of any of our trademarks, trade names or licenses to any material extent.
Raw Materials
Our primary baking ingredients are flour, sweeteners and shortening. We also use paper products, such ascorrugated cardboard and films and plastics to package our baked foods. In addition, we are dependent upon naturalgas and propane as fuel for firing ovens. The independent distributors and third party shipping companies aredependent upon gasoline and diesel as fuel for distribution vehicles. In general, we maintain diversified sources forall of our baking ingredients and packaging products.
Commodities, such as our baking ingredients, periodically experience price fluctuations, and, for that reason,we continually monitor the market for these commodities. Recently, the commodities market has become extremelyvolatile due to concerns over grain-based fuel sources. We enter into forward purchase agreements and derivativefinancial instruments to reduce the impact of such volatility in raw materials prices. Any decrease in the availabilityof these agreements and instruments could increase the price of these raw materials and significantly affect ourearnings.
Research and Development
We engage in research and development activities that principally involve developing new products,improving the quality of existing products and improving and automating production processes. We also developand evaluate new processing techniques for both current and proposed product lines.
Regulation
As a producer and marketer of food items, our operations are subject to regulation by various federalgovernmental agencies, including the Food and Drug Administration, the Department of Agriculture, the FederalTrade Commission, the Environmental Protection Agency and the Department of Commerce, as well as variousstate agencies, with respect to production processes, product quality, packaging, labeling, storage and distribution.Under various statutes and regulations, these agencies prescribe requirements and establish standards for quality,purity and labeling. Failure to comply with one or more regulatory requirements can result in a variety of sanctions,including monetary fines or compulsory withdrawal of products from store shelves.
In addition, advertising of our businesses is subject to regulation by the Federal Trade Commission, and we aresubject to certain health and safety regulations, including those issued under the Occupational Safety and Health Act.
Our operations, like those of similar businesses, are subject to various federal, state and local laws andregulations with respect to environmental matters, including air and water quality and underground fuel storagetanks, as well as other regulations intended to protect public health and the environment. The company is not a partyto any material proceedings arising under these regulations. The company believes that compliance with existingenvironmental laws and regulations will not materially affect the consolidated financial condition or the competitiveposition of the company. The company is currently in substantial compliance with all material environmentalregulations affecting the company and its properties. The events of September 11, 2001 reinforced the need toenhance the security of the United States. Congress responded by passing the Public Health Security andBioterrorism Preparedness and Protection Act of 2002 (the “Act”), which President Bush signed into law on
8

June 12, 2002. The Act includes a large number of provisions to help ensure the safety of the United States frombioterrorism, including new authority for the Secretary of Health and Human Services (“HHS”) to take action toprotect the nation’s food supply against the threat of intentional contamination. The Food and Drug Administration,as the food regulatory arm of HHS, is responsible for developing and implementing these food safety measures andfor carrying out certain provisions of the Act, particularly Title III, Subtitle A (Protection and Food Supply) andSubtitle B (Protection of Drug Supply). The applicable provisions of the Act under Subtitle A which affect thecompany include Section 303: Administrative Detention; Section 305: Registration of Food and Animal FeedFacilities; Section 306: Establishment and Maintenance of Records; and Section 307: Prior Notice of ImportedFood Shipments.
The company is aware of the requirements under Title III, Subtitle A of the Act and has taken the necessarysteps to comply with these regulations. The Company has internally reviewed and updated its policies andprocedures regarding food safety and has increased security procedures as appropriate. Our suppliers and vendorshave been contacted to make sure they are aware of and compliant with these regulations as well. The companycontinues to monitor risks in this area and is evaluating the impact of these regulations on an ongoing basis.
The cost of compliance with such laws and regulations has not had a material adverse effect on the company’sbusiness. Our operations and products also are subject to state and local regulation through such measures aslicensing of plants, enforcement by state health agencies of various state standards and inspection of facilities. Webelieve that we are currently in material compliance with applicable federal, state and local laws and regulations.
Employees
We employ approximately 7,800 persons, approximately 570 of whom are covered by collective bargainingagreements. We believe that we have good relations with our employees.
Other Available Information
The company makes available free of charge through its Internet website (http://www.flowersfoods.com) underthe heading “Investor Center” the company’s Annual Report on Form 10-K, Quarterly Reports on Form 10-Q,Current Reports on Form 8-K, and, if applicable, amendments to those reports filed or furnished pursuant to theSecurities Exchange Act of 1934 as soon as reasonably practicable after the company electronically files suchmaterial with, or furnishes it to, the SEC.
The following corporate governance documents may be obtained free of charge through our website in the“Corporate Governance” section of the “Investor Center” tab or by sending a written request to Flowers Foods, Inc.,1919 Flowers Circle, Thomasville, GA 31757, Attention: Investor Relations.
• Audit Committee Charter
• Nominating/Corporate Governance Committee Charter
• Compensation Committee Charter
• Finance Committee Charter
• Corporate Governance Guidelines
• Code of Business Conduct and Ethics for Officers and Members of the Board of Directors
• Flowers Foods Employee Code of Conduct
• Disclosure Policy
Item 1A. Risk Factors
You should carefully consider the risks described below, together with all of the other information included inthis report, in considering our business and prospects. The risks and uncertainties described below are not the onlyones facing us. Additional risks and uncertainties not presently known to us or that we currently deem insignificant
9

may also impair our business operations. The occurrence of any of the following risks could harm our business,financial condition or results of operations.
Competition could adversely impact revenues and profitability.
The United States bakery industry is highly competitive. Competition is based on product availability, productquality, price, effective promotions and the ability to target changing consumer preferences. We experience pricepressure from time to time as a result of our competitors’ promotional efforts. Increased competition could result inreduced sales, margins, profits and market share.
Our ability to execute our business strategy could affect our business.
We employ various operating strategies to be one of the nation’s leading producers and marketers of bakeryproducts available to customers through multiple channels of distribution. If we are unsuccessful in implementingor executing one or more of these strategies, our business could be adversely affected.
We rely on a few large customers for a significant portion of our sales and the loss of one of our largecustomers could adversely affect our financial condition and results of operations.
We have several large customers that account for a significant portion of our sales. Our top ten customersaccounted for 42.0% of our sales during fiscal 2006. Our largest customer, Wal-Mart/Sam’s Club, accounted for18.9% of our sales during this period. The loss of one of our large customers could adversely affect our results ofoperations. These customers do not typically enter into long-term contracts and make purchase decisions based on acombination of price, product quality, consumer demand and customer service performance. They may in the futureuse more of their shelf space, including space currently used for our products, for private label products. If our salesto one or more of these customers are reduced, this reduction may adversely affect our business.
Consolidation in the retail and foodservice industries could affect our sales and profitability.
As the consolidation trend among our customers continues and our customers, including mass merchandisers,grow larger and become more sophisticated, they may demand lower pricing, increased promotional programs orspecial packaging from product suppliers. Meeting these demands may adversely affect our margins. If we are notselected by our customers for most of our products or if we fail to effectively respond to their demands, our sales andprofitability could be adversely affected.
Our large customers may impose requirements on us that may adversely affect our results of operations.
From time to time, our large customers, including Wal-Mart/Sam’s Club, may re-evaluate or refine theirbusiness practices and impose new or revised requirements upon their suppliers, including us. These businessdemands may relate to inventory practices, logistics or other aspects of the customer-supplier relationship.Compliance with requirements imposed by significant customers may be costly and may have an adverse effecton our results of operations. However, if we fail to meet a significant customer’s demands, we could lose thatcustomer’s business, which could adversely affect our results of operations.
Increases in costs and/or shortages of raw materials, fuels and utilities could cause costs to increase.
Commodities, such as flour, sweeteners, cocoa and eggs, which are used in our bakery products, are subject toprice fluctuations. Any substantial increase in the prices of raw materials may have an adverse impact on ourprofitability. Recent concerns over grain-based fuel sources have caused the commodity markets to becomeextremely volatile. In addition, we are dependent upon natural gas and propane for firing ovens. The independentdistributors and third party shipping companies we use are dependent upon gasoline and diesel as fuel fordistribution vehicles. Substantial future increases in prices for, or shortages of, these fuels could have a materialadverse effect on our operations and financial results. The company cannot guarantee that it can cover these costincreases through future pricing actions. Additionally, as a result of these pricing actions consumers could movefrom the purchase of high margin branded products to lower margin store brands.
10

Increases in employee and employee-related costs could have adverse effects on our profitability.
Pension, health care and workers’ compensation costs have been increasing and will likely continue toincrease. Any substantial increase in pension, health care or workers’ compensation costs may have an adverseimpact on our profitability. The company records pension costs and the liabilities related to its benefit plans basedon actuarial valuations, which include key assumptions determined by management. Material changes in pensioncosts may occur in the future due to changes in these assumptions. Future annual amounts could be impacted byvarious factors, such as changes in the number of plan participants, changes in the discount rate, changes in theexpected long-term rate of return, changes in the level of contributions to the plan and other factors. There have beenno new participants in the company’s defined benefit plan since December 31, 1998. Effective December 31, 2005,the company froze benefits in its primary defined benefit pension plan.
We have risks related to our pension plans, which could impact the company’s liquidity.
The company has trusteed, noncontributory defined pension plans covering certain employees maintainedunder the U.S. Employee Retirement Income Security Act of 1974 (“ERISA”). The funding obligations for ourpension plans are impacted by the performance of the financial markets, including the performance of our commonstock, which comprises approximately 11.7% of the assets (as of December 31, 2006) of our pension plans.
If the financial markets do not provide the long-term returns that are expected, the likelihood of our beingrequired to make contributions will increase. The equity markets can be, and recently have been, very volatile, andtherefore our estimate of future contribution requirements can change dramatically in relatively short periods oftime. Similarly, changes in interest rates can impact our contribution requirements. In a low-interest-rate envi-ronment, the likelihood of required contributions in the future increases.
A disruption in the operation of our direct store distribution system could negatively affect our results ofoperations and financial condition.
We believe that our DSD distribution system is a significant competitive advantage for us. A material negativechange in our relations with the independent distributors, an adverse ruling by regulatory or governmental bodiesregarding our independent distributorship program or an adverse judgment against the company for actions taken bythe independent distributors could materially affect our results of operation and financial condition.
Compensation costs associated with our stock appreciation rights plan could have adverse effects on ourresults of operations.
The company has previously awarded stock appreciation rights to key employees and non-employee directorsthroughout the company. Generally accepted accounting principles require the company to record compensationexpense for these rights based on changes in the company’s stock price between the grant date and an estimated fairvalue of the rights at the balance sheet date that is presented using an option pricing model. The company uses theBlack-Scholes option pricing model. If the price of our common stock increases more than we project during themeasurement period, the company may have to recognize greater than expected compensation expense, whichcould negatively affect our results of operations.
We rely on the value of our brands, and the costs of maintaining and enhancing the awareness of our brandsare increasing, which could have an adverse impact on our revenues and profitability.
We rely on the success of our well-recognized brand names. We intend to maintain our strong brandrecognition by continuing to devote resources to advertising, marketing and other brand building efforts. If we arenot able to successfully maintain our brand recognition, our revenues and profitability could be adversely affected.
11

Inability to anticipate changes in consumer preferences may result in decreased demand for products, whichcould have an adverse impact on our future growth and operating results.
Our success depends in part on our ability to respond to current market trends and to anticipate the tastes anddietary habits of consumers. Consumer preferences change, and our failure to anticipate, identify or react to thesechanges could result in reduced demand for our products, which could in turn cause our operating results to suffer.
Future product recalls or safety concerns could adversely impact our results of operations.
We may be required to recall certain of our products should they be mislabeled, contaminated or damaged. Wealso may become involved in lawsuits and legal proceedings if it is alleged that the consumption of any of ourproducts causes injury, illness or death. A product recall or an adverse result in any such litigation could have amaterial adverse effect on our operating and financial results. We also could be adversely affected if consumers inour principal markets lose confidence in the safety and quality of our products.
Government regulation could adversely impact our results of operations and financial condition.
As a producer and marketer of food items, we are subject to regulation by various federal, state and localgovernment entities and agencies with respect to production processes, product quality, packaging, labeling, storageand distribution. Failure to comply with, or violations of, the regulatory requirements of one or more of theseagencies can result in a variety of sanctions, including monetary fines or compulsory withdrawal of products fromstore shelves. In addition, future regulation by these agencies, the military action in Iraq and the continuing threat ofterrorist attacks, could increase our commodity and service costs and have material adverse effect on our results ofoperations and financial condition.
Any business disruption due to political instability, armed hostilities, incidents of terrorism or naturaldisasters could adversely impact our financial performance.
If terrorist activity, armed conflict, political instability or natural disasters occur in the U.S. or other locations,such events may disrupt manufacturing, labor and other aspects of our business. In the event of such incidents, ourbusiness and financial performance could be adversely affected.
Our articles of incorporation, bylaws, and shareholder rights plan and Georgia law may inhibit a change incontrol that you may favor.
Our articles of incorporation and bylaws, shareholder rights plan and Georgia law contain provisions that maydelay, deter or inhibit a future acquisition of us not approved by our board of directors. This could occur even if ourshareholders are offered an attractive value for their shares or if a substantial number or even a majority of ourshareholders believe the takeover is in their best interest. These provisions are intended to encourage any personinterested in acquiring us to negotiate with and obtain the approval of our board of directors in connection with thetransaction. Provisions in our organizational documents that could delay, deter or inhibit a future acquisition includethe following:
• a classified board of directors;
• the requirement that our shareholders may only remove directors for cause;
• specified requirements for calling special meetings of shareholders; and
• the ability of the board of directors to consider the interests of various constituencies, including ouremployees, clients and creditors and the local community.
Our articles of incorporation also permit the board of directors to issue shares of preferred stock with suchdesignations, powers, preferences and rights as it determines, without any further vote or action by our shareholders.In addition, we have in place a shareholders’ rights plan that will trigger a dilutive issuance of common stock uponsubstantial purchases of our common stock by a third party that are not approved by the board of directors.
12

Item 1B. Unresolved Staff Comments.
None
Executive Offices
The address and telephone number of our principal executive offices are 1919 Flowers Circle, Thomasville,Georgia 31757, (229) 226-9110.
Executive Officers of Flowers Foods
The following table sets forth certain information regarding the persons who currently serve as the executiveofficers of Flowers Foods. Our Board of Directors elects all executive officers for one-year terms with the exceptionof the positions of President and Chief Operating Officer — Flowers Foods Bakeries Group and President and ChiefOperating Officer — Flowers Foods Specialty Group, which are appointed by the Chairman of the Board, Presidentand Chief Executive Officer to hold office until they resign or are removed.
EXECUTIVE OFFICERS
Name, Age and Office Business Experience
George E. DeeseAge 61Chairman of the Board,President and Chief ExecutiveOfficer
Mr. Deese has been Chairman of the Board, President and Chief ExecutiveOfficer of Flowers Foods since January 2006. Mr. Deese previously servedas President and Chief Executive Officer of Flowers Foods from January2004 to January 2006. Prior to that he served as President and ChiefOperating Officer of Flowers Foods from May 2002 until January 2004.Mr. Deese also served as President and Chief Operating Officer of FlowersBakeries from January 1997 until May 2002, President and Chief OperatingOfficer, Baked Products Group of Flowers Industries from 1983 to January1997, Regional Vice President, Baked Products Group of Flowers Industriesfrom 1981 to 1983 and President of Atlanta Baking Company from 1980 to1981.
Jimmy M. WoodwardAge 46Senior Vice President andChief Financial Officer
Mr. Woodward has been Senior Vice President and Chief Financial Officerof Flowers Foods since September 2002. Mr. Woodward previously servedas Vice President and Chief Financial Officer from November 2000 untilSeptember 2002. Prior to that, he served as Vice President and ChiefFinancial Officer at Flowers Industries from March 2000 to March 2001.Mr. Woodward also served as Treasurer and Chief Accounting Officer ofFlowers Industries from October 1997 to March 2000 and Assistant Trea-surer of Flowers Industries for more than five years prior to that time.
Gene D. LordAge 59President and Chief OperatingOfficer — Flowers FoodsBakeries Group
Mr. Lord has been President and Chief Operating Officer of Flowers FoodsBakeries Group since July 2002. Mr. Lord previously served as a RegionalVice President of Flowers Bakeries from January 1997 until July 2002. Priorto that, he served as Regional Vice President, Baked Products Group ofFlowers Industries from May 1987 until January 1997 and as President ofAtlanta Baking Company from February 1981 until May 1987. Prior to thattime, Mr. Lord served in various sales positions at Flowers Bakeries.
Allen L. ShiverAge 51President and Chief OperatingOfficer — Flowers FoodsSpecialty Group
Mr. Shiver has been President and Chief Operating Officer of Flowers FoodsSpecialty Group since April 2003. Mr. Shiver previously served as Presidentand Chief Operating Officer of Flowers Snack from July 2002 until April2003. Prior to that Mr. Shiver served as Executive Vice President of FlowersBakeries from 1998 until 2002, as a Regional Vice President of FlowersBakeries in 1998 and as President of Flowers Baking Company of Villa Ricafrom 1995 until 1998. Prior to that time, Mr. Shiver served in various salesand marketing positions at Flowers Bakeries.
13

Stephen R. AveraAge 50Senior Vice President, Secretaryand General Counsel
Mr. Avera has been Senior Vice President, Secretary and General Counsel ofFlowers Foods since September 2004. Mr. Avera previously served asSecretary and General Counsel from February 2002 until September2004. He also served as Vice President and General Counsel of FlowersBakeries from July 1998 to February 2002. Mr. Avera also previously servedas an associate and assistant general counsel of Flowers Industries fromFebruary 1986 to July 1998.
Michael A. BeatyAge 56Senior Vice President-SupplyChain
Mr. Beaty has been Senior Vice President-Supply Chain of Flowers Foodssince September 2002. Mr. Beaty previously served as Senior Vice Presidentof Bakery Operations of Flowers Bakeries from September 1994 untilSeptember 2002. He also served as Vice President of Manufacturing ofFlowers Bakeries from February 1987 until September 1994. Prior to thattime, Mr. Beaty served in management positions at various Flowers Bakeriesoperations, including Vice President of Manufacturing, Executive VicePresident and President of various Flowers operations from 1974 until 1987.
Marta Jones TurnerAge 53Senior Vice President ofCorporate Relations
Ms. Turner has been Senior Vice President of Corporate Relations ofFlowers Foods since July 2004. Ms. Turner previously served as VicePresident of Communications and Investor Relations from November2000 until July 2004. She also served as Vice President of Communicationsand Investor Relations at Flowers Industries from January 2000 to March2001. She also served as Vice President of Public Affairs of FlowersIndustries from September 1997 until January 2000 and Director of PublicRelations of Flowers Industries from 1985 until 1997.
Item 2. Properties
The company currently operates 36 production facilities, of which 34 are owned and two are leased, asindicated below. We consider that our properties are in good condition, well maintained and sufficient for ourpresent operations. During fiscal 2006, Flowers Bakeries’ production facilities taken as a whole, operatedmoderately above capacity and Flowers Specialty’s production facilities operated moderately below capacity.Our production plant locations are:
Flowers BakeriesBirmingham, Alabama New Orleans, Louisiana
Opelika, Alabama Goldsboro, North Carolina
Tuscaloosa, Alabama Jamestown, North Carolina
Batesville, Arkansas Newton, North Carolina
Bradenton, Florida Morristown, Tennessee
Jacksonville, Florida Denton, Texas
Miami, Florida El Paso, Texas
Atlanta, Georgia Houston, Texas(2)Savannah, Georgia San Antonio, Texas
Thomasville, Georgia Tyler, Texas
Tucker, Georgia (Leased) Lynchburg, Virginia
Villa Rica, Georgia Norfolk, Virginia
Baton Rouge, Louisiana Bluefield, West Virginia
Lafayette, Louisiana
Flowers SpecialtyMontgomery, Alabama London, Kentucky
Texarkana, Arkansas Winston-Salem, North Carolina
Atlanta, Georgia Cleveland, Tennessee
Suwanee, Georgia (Leased) Crossville, Tennessee
14

The company leases properties that house its shared services center and its information technology group, andowns its corporate headquarters facility, all of which are located in Thomasville, Georgia.
Item 3. Legal Proceedings
The company and its subsidiaries from time to time are parties to, or targets of, lawsuits, claims, investigationsand proceedings, which are being handled and defended in the ordinary course of business. While the company isunable to predict the outcome of these matters, it believes, based upon currently available facts, that it is remote thatthe ultimate resolution of any such pending matters will have a material adverse effect on its overall financialcondition, results of operations or cash flows in the future. However, adverse developments could negatively impactearnings in a particular future fiscal period.
On September 9, 2004, the company announced an agreement to settle a class action lawsuit related to pieshells produced by a former operating facility. The costs of this settlement, $1.8 million, net of income tax benefit,were previously recorded by the company in the first quarter of fiscal 2004 as part of discontinued operations.Additional costs of $0.2 million, net of income tax benefit, were recorded as part of discontinued operations duringthe third quarter of fiscal 2005 relating to this settlement. During the first quarter of fiscal 2006, the companyreceived an insurance recovery of $2.0 million ($1.2 million, net of income tax) relating to this settlement. Thisrecovery is recorded in discontinued operations in the consolidated statement of income for the fifty-two weeksended December 30, 2006.
The company’s facilities are subject to various federal, state and local laws and regulations regarding thedischarge of material into the environment and the protection of the environment in other ways. The company is nota party to any material proceedings arising under these regulations. The company believes that compliance withexisting environmental laws and regulations will not materially affect the consolidated financial condition or thecompetitive position of the company. The company is currently in substantial compliance with all materialenvironmental regulations affecting the company and its properties.
Item 4. Submission of Matters to a Vote of Security Holders
No matters were submitted for a vote of the security holders in the fourth quarter of fiscal 2006.
PART II
Item 5. Market for the Registrant’s Common Equity, Related Stockholder Matters and Issuer Repurchasesof Equity Securities
Shares of Flowers Foods common stock have been quoted on the New York Stock Exchange under the symbol“FLO” since March 28, 2001. The following table sets forth quarterly dividend information and the high and lowclosing sale prices of the company’s common stock on the New York Stock Exchange as reported in publishedsources.
Quarter High Low High LowMarket Price Dividend Market Price Dividend
FY 2006 FY 2005
First . . . . . . . . . . . . . . . . . . . . . . . . . . . . . . . . . $30.37 $26.15 $0.100 $21.12 $18.09 $0.083
Second . . . . . . . . . . . . . . . . . . . . . . . . . . . . . . . $31.26 $26.45 $0.125 $25.34 $18.62 $0.100
Third . . . . . . . . . . . . . . . . . . . . . . . . . . . . . . . . $29.06 $25.83 $0.125 $28.47 $24.15 $0.100
Fourth . . . . . . . . . . . . . . . . . . . . . . . . . . . . . . . $27.68 $25.57 $0.125 $30.61 $24.85 $0.100
As of February 23, 2007, there were approximately 4,091 holders of record of our common stock.
Dividends
The payment of dividends is subject to the discretion of our Board of Directors. The Board of Directors basesits decisions regarding dividends on, among other things, general business conditions, our financial results,
15

contractual, legal and regulatory restrictions regarding dividend payments and any other factors the Board mayconsider relevant. The company amended and restated its $150.0 million unsecured credit agreement increasing it to$250.0 million in June 2006, and, under the terms of the credit agreement, the company has no direct restrictions ondividends.
Securities Authorized for Issuance Under Compensation Plans
The following chart sets forth the amounts of securities authorized for issuance under the company’scompensation plans.
Plan Category (a) (b) (c)
Number of Securities tobe Issued Upon
Exercise of OutstandingOptions, Warrants and
Rights
Weighted AverageExercise Price of
Outstanding Options,Warrants and Rights
Number of Securities RemainingAvailable for Future Issuance Under
Equity Compensation Plans(Excluding Securities Reflected in
Column(a))
(Amounts in thousands, except per share data)
Equity compensation plansapproved by securityholders . . . . . . . . . . . . . . . . . 2,732 $15.56 3,243
Equity compensation plans notapproved by securityholders . . . . . . . . . . . . . . . . . — — —
Total . . . . . . . . . . . . . . . . . . 2,732 $15.56 3,243
Under the company’s compensation plans, the board of directors is authorized to grant a variety of stock-basedawards, including stock options, restricted stock awards and deferred stock, to its directors and certain of itsemployees. The number of securities set forth in column (c) above includes shares of restricted stock and deferredstock, available for future issuance under the company’s compensation plans. See Note 15 of Notes to ConsolidatedFinancial Statements for further information.
Issuer Purchases of Equity Securities
On December 19, 2002 our Board of Directors approved a plan that authorized stock repurchases of up to11.3 million shares of the company’s common stock. On November 18, 2005, the Board of Directors increased thenumber of authorized shares to 15.3 million shares. Under the plan, the company may repurchase its common stockin open market or privately negotiated transactions at such times and at such prices as determined to be in thecompany’s best interest. These purchases may be commenced or suspended without prior notice depending on then-existing business or market conditions and other factors. The following chart sets forth the amounts of our commonstock purchased by the company during the fourth quarter of fiscal 2006 under the stock repurchase plan.
PeriodTotal Number ofShares Purchased
AveragePrice
Paid perShare
Total Number ofShares Purchased
as Part ofPublicly
Announced Planor Programs
MaximumNumber ofShares thatMay Yet BePurchasedUnder thePlans or
Programs(Amounts in thousands, except price data)
October 8, 2006-November 4, 2006 . . . . . . . . . . . — $ — — 3,887
November 5, 2006-December 2, 2006. . . . . . . . . . 63 $26.33 63 3,824
December 3, 2006-December 30, 2006 . . . . . . . . . 331 $26.58 331 3,493
Total . . . . . . . . . . . . . . . . . . . . . . . . . . . . . . . . 394 $26.54 394
16

Stock Performance Graph
The chart below is a comparison of the cumulative total return (assuming the reinvestment of all dividendspaid) among Flowers Foods common stock, Standard & Poor’s 500 Index, Standard & Poor’s SmallCap 600 Indexand Standard & Poor’s 500 Packaged Foods and Meat Index for the period December 28, 2001 throughDecember 29, 2006, the last trading day of our 2006 fiscal year.
TOTAL SHAREHOLDER RETURNS
FLOWERS FOODS INC S&P 500 INDEX
S&P 500 PACKEGED FOODS & MEAT INDEX S&P SMALLCAP 600 INDEX
$0
$350
12/29/200612/30/200512/31/20041/2/200412/27/200212/28/2001
$50
$100
$150
$200
$250
$300
December 28,2001
December 27,2002
January 2,2004
December 31,2004
December 30,2005
December 29,2006
FLOWERS FOODS INC. . . . . . . . 100.00 72.55 148.76 185.26 246.16 245.28
S&P 500 INDEX . . . . . . . . . . . . . 100.00 76.65 98.83 109.92 115.32 133.53
S&P 500 PACKAGED FOODS &MEAT INDEX . . . . . . . . . . . . . . . 100.00 101.84 109.68 132.02 121.47 141.51
S&P SMALLCAP 600 INDEX . . . 100.00 84.55 117.69 144.11 155.18 178.64
Companies in the S&P 500 Index, the S&P Small Cap 600 Index and the S&P 500 Packaged Foods and MeatIndex are weighted by market capitalization and indexed to $100 at December 28, 2001. Flowers Foods’ share priceis also indexed to $100 at December 28, 2001.
17
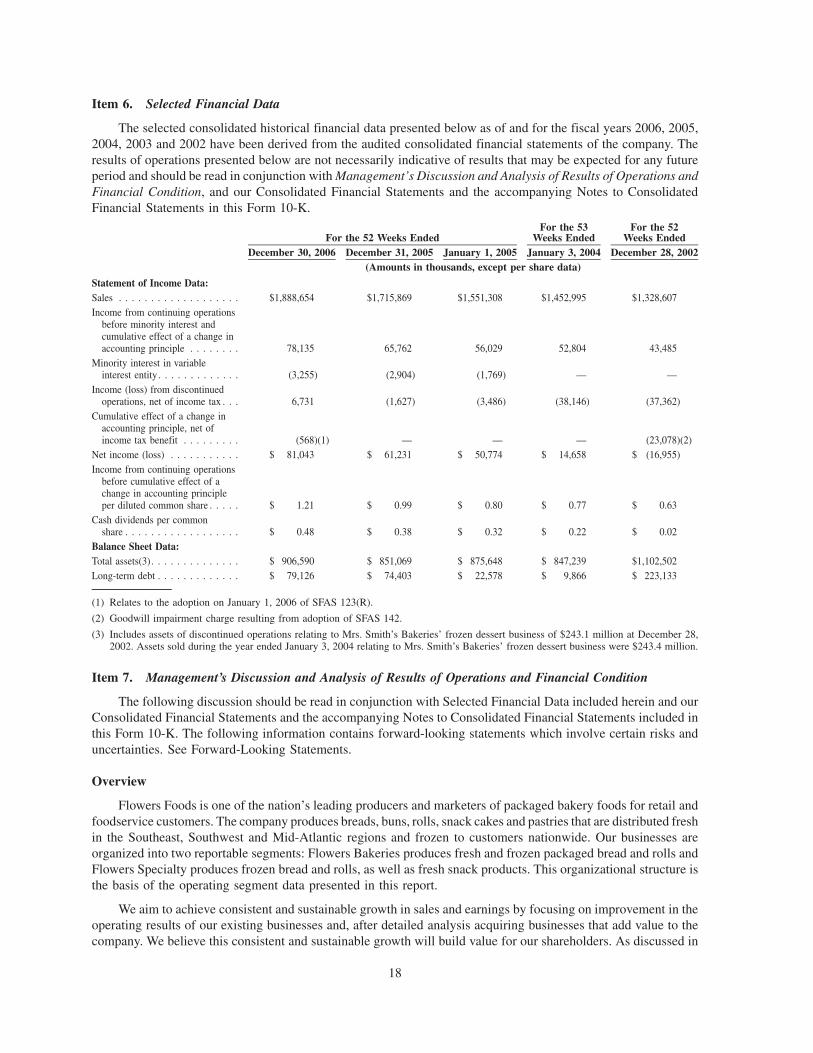
Item 6. Selected Financial Data
The selected consolidated historical financial data presented below as of and for the fiscal years 2006, 2005,2004, 2003 and 2002 have been derived from the audited consolidated financial statements of the company. Theresults of operations presented below are not necessarily indicative of results that may be expected for any futureperiod and should be read in conjunction with Management’s Discussion and Analysis of Results of Operations andFinancial Condition, and our Consolidated Financial Statements and the accompanying Notes to ConsolidatedFinancial Statements in this Form 10-K.
December 30, 2006 December 31, 2005 January 1, 2005 January 3, 2004 December 28, 2002For the 52 Weeks Ended
For the 53Weeks Ended
For the 52Weeks Ended
(Amounts in thousands, except per share data)
Statement of Income Data:Sales . . . . . . . . . . . . . . . . . . . $1,888,654 $1,715,869 $1,551,308 $1,452,995 $1,328,607Income from continuing operations
before minority interest andcumulative effect of a change inaccounting principle . . . . . . . . 78,135 65,762 56,029 52,804 43,485
Minority interest in variableinterest entity . . . . . . . . . . . . . (3,255) (2,904) (1,769) — —
Income (loss) from discontinuedoperations, net of income tax . . . 6,731 (1,627) (3,486) (38,146) (37,362)
Cumulative effect of a change inaccounting principle, net ofincome tax benefit . . . . . . . . . (568)(1) — — — (23,078)(2)
Net income (loss) . . . . . . . . . . . $ 81,043 $ 61,231 $ 50,774 $ 14,658 $ (16,955)Income from continuing operations
before cumulative effect of achange in accounting principleper diluted common share . . . . . $ 1.21 $ 0.99 $ 0.80 $ 0.77 $ 0.63
Cash dividends per commonshare . . . . . . . . . . . . . . . . . . $ 0.48 $ 0.38 $ 0.32 $ 0.22 $ 0.02
Balance Sheet Data:Total assets(3). . . . . . . . . . . . . . $ 906,590 $ 851,069 $ 875,648 $ 847,239 $1,102,502Long-term debt . . . . . . . . . . . . . $ 79,126 $ 74,403 $ 22,578 $ 9,866 $ 223,133
(1) Relates to the adoption on January 1, 2006 of SFAS 123(R).
(2) Goodwill impairment charge resulting from adoption of SFAS 142.
(3) Includes assets of discontinued operations relating to Mrs. Smith’s Bakeries’ frozen dessert business of $243.1 million at December 28,2002. Assets sold during the year ended January 3, 2004 relating to Mrs. Smith’s Bakeries’ frozen dessert business were $243.4 million.
Item 7. Management’s Discussion and Analysis of Results of Operations and Financial Condition
The following discussion should be read in conjunction with Selected Financial Data included herein and ourConsolidated Financial Statements and the accompanying Notes to Consolidated Financial Statements included inthis Form 10-K. The following information contains forward-looking statements which involve certain risks anduncertainties. See Forward-Looking Statements.
Overview
Flowers Foods is one of the nation’s leading producers and marketers of packaged bakery foods for retail andfoodservice customers. The company produces breads, buns, rolls, snack cakes and pastries that are distributed freshin the Southeast, Southwest and Mid-Atlantic regions and frozen to customers nationwide. Our businesses areorganized into two reportable segments: Flowers Bakeries produces fresh and frozen packaged bread and rolls andFlowers Specialty produces frozen bread and rolls, as well as fresh snack products. This organizational structure isthe basis of the operating segment data presented in this report.
We aim to achieve consistent and sustainable growth in sales and earnings by focusing on improvement in theoperating results of our existing businesses and, after detailed analysis acquiring businesses that add value to thecompany. We believe this consistent and sustainable growth will build value for our shareholders. As discussed in
18

Note 9 of Notes to Consolidated Financial Statements of this Form 10-K, during February 2006, the companyacquired Derst Baking Company in Savannah, Georgia, adding markets in South Carolina, eastern Georgia andnorth Florida. In October 2005, the company purchased land and a building in Newton, North Carolina andconverted the building into a bakery facility. This facility began producing buns in May 2006 and expects to beginproducing bread in the spring of 2007.
Sales are principally affected by pricing, quality, brand recognition, new product introductions and productline extensions, marketing and service. The company manages these factors to achieve a sales mix favoring itshigher-margin branded products, while using private label products to absorb overhead costs and maximize use ofproduction capacity. Sales for fiscal 2006 increased 10.1% from fiscal 2005. Contributing to this increase werechanges in the competitive landscape of the baked foods industry, the company’s growth into new markets,acquisitions and increased pricing. The change in the competitive landscape was primarily due to the exit of some ofthe company’s competitors from certain markets served by the company; therefore allowing the company to gainshare in these markets. While the company expects sales to continue to grow, it cannot guarantee the level of growthachieved in fiscal 2006 to continue, as some of the factors involved in the sales growth, such as the exiting ofmarkets by competitors, are not in control of the company.
For fiscal 2006, the company reported diluted income from continuing operations before cumulative effect of achange in accounting principle of $1.21, a 22.2% increase over the $0.99 reported for fiscal 2005. Income fromcontinuing operations before cumulative effect of a change in accounting principle was $74.9 million for fiscal2006, an increase of 19.1% as compared to $62.9 million for fiscal 2005. Diluted net income per share for fiscal2006 was $1.31 as compared to $0.96 per share for fiscal 2005, a 36.5% increase. For fiscal 2006, net income was$81.0 million, a 32.4% increase over $61.2 million reported for fiscal 2005.
Critical Accounting Estimates
Note 2 to the consolidated financial statements includes a summary of the significant accounting policies andmethods used in the preparation of the company’s consolidated financial statements.
The company’s discussion and analysis of its results of operations and financial condition are based upon theConsolidated Financial Statements of the company, which have been prepared in accordance with generallyaccepted accounting principles in the United States (“GAAP”). The preparation of these financial statementsrequires the company to make estimates and assumptions that affect the reported amounts of assets, liabilities,revenues and expenses, and related disclosure of contingent assets and liabilities at the date of the financialstatements and the reported amounts of the revenues and expenses during the reporting period. On an ongoing basis,the company evaluates its estimates, including those related to customer programs and incentives, bad debts, rawmaterials, inventories, long-lived assets, intangible assets, income taxes, restructuring, pensions and other post-retirement benefits and contingencies and litigation. The company bases its estimates on historical experience andon various other assumptions that are believed to be reasonable under the circumstances, the results of which formthe basis for making judgments about the carrying values of assets and liabilities that are not readily apparent fromother sources. Actual results may differ from these estimates under different assumptions or conditions.
The selection and disclosure of the company’s critical accounting estimates have been discussed with thecompany’s audit committee. The following is a review of the critical assumptions and estimates, and the accountingpolicies and methods listed below used in the preparation of its Consolidated Financial Statements:
• revenue recognition;
• derivative instruments;
• valuation of long-lived assets, goodwill and other intangibles;
• self-insurance reserves;
• income tax expense and accruals; and
• pension obligations.
Revenue Recognition. The company recognizes revenue from the sale of its products at the time of deliverywhen title and risk of loss pass to the customer. The company records estimated reductions to revenue for customerprograms and incentive offerings, including special pricing agreements, price protection, promotions and othervolume-based incentives, at the time the incentive is offered or at the time of revenue recognition for the underlying
19

transaction that results in progress by the customer towards earning the incentive. If market conditions were todecline, the company may take actions to increase incentive offerings, possibly resulting in an incrementalreduction of revenue. Independent distributors receive a discount equal to a percentage of the wholesale price ofproduct sold to retailers and other customers. The company records such amounts as selling, marketing andadministrative expenses. If market conditions were to decline, the company may take actions to increase distributordiscounts, possibly resulting in an incremental increase in selling, marketing and administrative expenses at thetime the discount is offered.
The consumer packaged goods industry has used scan-based trading technology over several years to shareinformation between the supplier and retailer. An extension of this technology allows the retailer to pay the supplierwhen the consumer purchases the goods rather than at the time they are delivered to the retailer. Consequently,revenue is not recognized until the product is purchased by the consumer. This technology is referred to aspay-by-scan (“PBS”). During 2001, there was a sharp increase in the use of scan-based trading. In response to thisdemand, the company began a pilot program in fiscal 2001, working with certain retailers to develop the technologyto execute PBS. The company believes it is a baked foods industry leader in PBS and is aggressively working withits larger customers, such as Wal-Mart, Winn-Dixie, Kroger and Food Lion, to expand the use of PBS. In fiscal2006, the company recorded approximately $477.3 million in sales through PBS. The company estimates that by theend of fiscal 2007, it will have approximately $525.0 million in PBS sales. See Note 2 of Notes to ConsolidatedFinancial Statements of this Form 10-K for additional information.
Derivative Instruments. The company’s cost of primary raw materials is highly correlated to the commod-ities markets. Commodities, such as our baking ingredients, experience price fluctuations. From time to time, weenter into forward purchase agreements and derivative financial instruments to reduce the impact of volatility in rawmaterial prices. If actual market conditions become significantly different than those anticipated, raw materialprices could increase significantly, adversely affecting our results of operations.
Valuation of Long-Lived Assets, Goodwill and Other Intangibles. The company records an impairmentcharge to property, plant and equipment, goodwill and intangible assets in accordance with applicable accountingstandards when, based on certain indicators of impairment, it believes such assets have experienced a decline invalue that is other than temporary. Future adverse changes in market conditions or poor operating results of theseunderlying assets could result in losses or an inability to recover the carrying value of the asset that may not bereflected in the asset’s current carrying value, thereby possibly requiring impairment charges in the future.
The company evaluates the recoverability of the carrying value of its goodwill on an annual basis or at a timewhen events occur that indicate the carrying value of the goodwill may be impaired using a two step process. Thefirst step of this evaluation is performed by calculating the fair value of the business segment, or reporting unit, withwhich the goodwill is associated. This fair value is calculated as the average of projected EBITDA (defined asearnings before interest, taxes, depreciation and amortization) using a reasonable multiplier, projected revenueusing a reasonable multiplier and a discounted cash flow model using a reasonable discount rate. This fair value iscompared to the net assets of the reporting unit, and if less than the net assets, the goodwill is measured for potentialimpairment under step two. Under step two of this calculation, goodwill is measured for potential impairment bycomparing the implied fair value of the reporting unit, determined in the same manner as a business combination,with the carrying amount of the goodwill. Based on management’s evaluation, no impairment charges relating togoodwill were necessary for the fiscal years ended December 30, 2006, December 31, 2005 or January 1, 2005.
The company has intangible assets subject to amortization related to trademarks, customer lists and non-compete agreements acquired in acquisitions in prior years. The company evaluates the recoverability of thecarrying value of these intangible assets on an annual basis or at a time when events occur that indicate the carryingvalue may be impaired. This evaluation is performed by calculating the fair value of the individual intangible assets.The fair value is calculated as the sum of the present value of a hypothetical royalty rate multiplied by projectedoperating income (defined as earnings before interest and taxes) and the present value of the terminal value based onthe Gordon growth model. This fair value is compared to the carrying value of the intangible asset, and if less thanthe carrying value, the intangible asset is written down to fair value. Based on management’s evaluation, noimpairment charges relating to intangible assets were necessary for the fiscal years ended December 30, 2006,December 31, 2005 or January 1, 2005.
20
See Note 5 of Notes to Consolidated Financial Statements of this Form 10-K for further information relating tothe company’s goodwill and other intangible assets.
Self-Insurance Reserves. We are self-insured for various levels of general liability, auto liability, workers’compensation and employee medical and dental coverage. Insurance reserves are calculated on an undiscountedbasis based on actual claim data and estimates of incurred but not reported claims developed utilizing historicalclaim trends. Projected settlements and incurred but not reported claims are estimated based on pending claims,historical trends and data. Though the company does not expect them to do so, actual settlements and claims coulddiffer materially from those estimated. Material differences in actual settlements and claims could have an adverseeffect on our results of operations and financial condition.
Income Tax Expense and Accruals. The annual tax rate is based on our income, statutory tax rates and taxplanning opportunities available to us in the various jurisdictions in which we operate. Changes in statutory ratesand tax laws in jurisdictions in which we operate may have a material effect on the annual tax rate. The effect ofthese changes, if any, would be recognized when the change takes place.
Deferred tax assets and liabilities reflect our assessment of future taxes to be paid in the jurisdictions in whichwe operate. These assessments relate to both permanent and temporary differences in the treatment of items for taxand accounting purposes, as well as estimates of our current tax exposures. The company records a valuationallowance to reduce its deferred tax assets if it is more likely than not that some or all of the deferred assets will notbe realized. While the company has considered future taxable income and ongoing prudent and feasible taxstrategies in assessing the need for the valuation allowance, if these estimates and assumptions change in the future,the company may be required to adjust its valuation allowance, which could result in a charge to, or an increase in,income in the period such determination is made.
Periodically we face audits from federal and state tax authorities, which can result in challenges regarding thetiming and amount of deductions. We provide reserves for potential exposures when we consider it probable that ataxing authority may take a sustainable position on a matter contrary to our position. We evaluate these reserves on aquarterly basis to insure that they have been appropriately adjusted for events, including audit settlements, that mayimpact our ultimate payment of such exposures. While the ultimate outcome of audits cannot be predicted withcertainty, we do not currently believe that future audits will have a material adverse effect on our consolidatedfinancial condition or results of operations. See Note 19 of Notes to Consolidated Financial Statements of thisForm 10-K for more information on income taxes.
Pension Obligations. The company records pension costs and benefit obligations related to its definedbenefit plan based on actuarial valuations. These valuations include key assumptions determined by management,including the discount rate and expected long-term rate of return on plan assets. The expected long-term rate ofreturn assumption considers the asset mix of the plan portfolio, past performance of these assets and other factors.Material changes in pension costs and in benefit obligations may occur in the future due to changes in theseassumptions. Future annual amounts could be impacted by changes in the number of plan participants, changes inthe discount rate, changes in the expected long-term rate of return, changes in the level of contributions to the planand other factors. Effective January 1, 2006, the company curtailed its defined benefit plan that covers the majorityof its workforce. Benefits under this plan were frozen, and no future benefits will accrue under this plan. Thecompany continues to maintain a plan that covers a small number of certain union employees. The companyrecorded pension income of $3.2 million for fiscal 2006. A quarter percentage point decrease in the discount ratewould impact the company’s fiscal 2006 pension income by approximately $0.2 million on a pre-tax basis. Aquarter percentage point increase in the discount rate would have no material impact on the company’s 2006pension income. A quarter percentage point change in the long-term expected rate of return would impact thecompany’s fiscal 2006 pension income by approximately $0.6 million on a pre-tax basis. A quarter percentage pointdecrease in the discount rate would increase the company’s fiscal year-end 2006 pension obligations by approx-imately $9.7 million. A quarter percentage point increase in the discount rate would decrease the company’s fiscalyear-end 2006 pension obligations by approximately $9.2 million. The company expects pension income ofapproximately $5.7 million for fiscal 2007.
The discount rate used by the company reflects rates at which pension benefits could be effectively settled. Aspermitted under Statement of Financial Accounting Standards No. 87, Employers’ Accounting for Pensions, the
21

company has historically used rates of return on high-quality fixed income investments, such as those included inthe Moody’s Aa Bond Index, to determine its discount rate. The historical reference to the Moody’s yield ischaracterized as a proxy for the discount rate that would have been generated through a more rigorous cash flowmatching technique. During fiscal 2005, the company determined it appropriate to refine the prior estimationapproach to use a more rigorous cash flow matching technique to select the discount rate, as the use of the Moody’sindex as a proxy has declined. Given the current market dynamics, the company believes the cash flow matchingtechnique provides a better estimate of the discount rate than the Moody’s index.
In developing the expected long-term rate of return on plan assets at each measurement date, the companyevaluates input from its investment advisors and actuaries in light of the plan assets’ historical actual returns andcurrent economic conditions. The average annual return on the plan assets for the last 15 years is approximately11.1% (net of investment expenses). Based on this historical annual return on plan assets, the company believes along-term rate of return assumption of 8.0% for fiscal 2007 is reasonable. The expected long-term rate of returnassumption is based on a target asset allocation of 40-60% equity securities, 10-40% debt securities, 0-40% otherdiversifying strategies (including, but not limited to, absolute return funds), 0-25% real estate and 0-25% cash. Thecompany regularly reviews such allocations and periodically rebalances the plan assets to the targeted allocationwhen considered appropriate. Pension costs do not include an explicit investment management expense assumptionand the return on asset rate reflects long-term expected returns net of investment expenses.
The company determines the fair value of substantially all its plan assets utilizing market quotes rather thandeveloping “smoothed” values, “market related” values or other modeling techniques. Plan asset gains or losses in agiven year are included with other actuarial gains and losses due to remeasurement of the plans’ projected benefitobligations (“PBO”). If the total unrecognized gain or loss exceeds 10% of the larger of (i) the PBO or (ii) themarket value of plan assets, the excess of the total unrecognized gain or loss is amortized over the estimated averagefuture lifetime of participants in the frozen pension plan. The total unrealized loss as of the fiscal 2006 measurementdate of September 30, 2005 for all of the pension plans the company sponsors was $23.7 million. Amortization of animmaterial amount of unrealized losses was required during fiscal 2006. The total unrecognized loss as of the fiscal2007 measurement date of September 30, 2006 for the pension plans the company sponsors was $14.5 million. Noamortization of these unrecognized amounts are anticipated during fiscal 2007. To the extent that this unrecognizedloss is subsequently recognized, then this loss will increase the company’s pension costs in the future.
On September 29, 2006, the Financial Accounting Standards Board issued Statement of Financial AccountingStandard No. 158, Employers’ Accounting for Defined Benefit Pension and Other Postretirement Plans, anAmendment of FASB Statements No. 87, 88, 106 and 132(R) (“SFAS 158”). SFAS 158 was effective for publiccompanies for fiscal years ending after December 15, 2006. The company adopted the balance sheet recognitionprovisions of SFAS 158 at December 30, 2006, the end of its fiscal year 2006. See Note 18 of Notes to ConsolidatedFinancial Statements of this Form 10-K for information regarding the incremental effect of adopting SFAS 158.
During fiscal 2006, fiscal 2005 and fiscal 2004, the company contributed $14.0 million, $25.0 million and$17.0 million, respectively, to the defined benefit plans. Future pension contributions will depend on marketconditions. In fiscal 2007, there are no required pension contributions under the minimum funding requirements ofERISA. The company continues to review various contribution scenarios and it has not made a determinationwhether it will make any pension contributions during fiscal 2007. The company has evaluated the potential impactof the Pension Protection Act (the “Act”), which was passed into law on August 17, 2006, on future pension planfunding requirements based on current market conditions. The Act is not anticipated to have a material effect on thelevel of future funding requirements or on the company’s liquidity and capital resources. In assessing differentscenarios, the company believes its strong cash flow and balance sheet will allow it to fund future pension needswithout affecting the business strategy of the company.
Matters Affecting Analysis
Reporting Periods. The company operates on a 52-53 week fiscal year ending the Saturday nearestDecember 31. Fiscal 2006, fiscal 2005 and fiscal 2004 consisted of 52 weeks.
22

Hurricane Katrina. On August 29, 2005, Hurricane Katrina struck the gulf coast of the United States andcaused catastrophic damage to the area, particularly New Orleans, Louisiana. The company operates a bakery inNew Orleans, which was affected by the hurricane. The New Orleans bakery was out of operation until December 8,2005 due to the many problems in the New Orleans area that were not within the company’s control. Following aredetails relating to the estimated costs associated with the hurricane incurred by us during fiscal 2005 (amounts inthousands):
Damaged inventory, uncollectible receivables, payroll costs and bakery clean-up . . . . . . . . . $2,178
Write-off of distributors’ notes receivable and settlement of routes . . . . . . . . . . . . . . . . . . . 1,186Estimated business interruption. . . . . . . . . . . . . . . . . . . . . . . . . . . . . . . . . . . . . . . . . . . . . . 1,301
Sugar contract replacement. . . . . . . . . . . . . . . . . . . . . . . . . . . . . . . . . . . . . . . . . . . . . . . . . 780
Start-up costs associated with temporarily opened facility . . . . . . . . . . . . . . . . . . . . . . . . . . 744
Estimated incremental energy costs . . . . . . . . . . . . . . . . . . . . . . . . . . . . . . . . . . . . . . . . . . 845
Total . . . . . . . . . . . . . . . . . . . . . . . . . . . . . . . . . . . . . . . . . . . . . . . . . . . . . . . . . . . . . . . . . $7,034
For the fifty-two weeks ended December 31, 2005, excluding the $1.3 million of estimated businessinterruption, $3.2 million of the costs are reflected in materials, supplies, labor and other production costs and$2.5 million of the costs are reflected in selling, marketing and administrative costs. Due to a supply disruptioncaused by hurricane damage to a Louisiana sugar refinery with which the company had contracted to purchasesugar, the company was forced to purchase sugar from another supplier at a higher price. The company temporarilyopened, until December 31, 2005, a manufacturing facility in Houston, Texas in order to fill its capacity short-falldue to the temporary idling of its New Orleans facility. As discussed below, in April 2006, this facility waspermanently opened. During fiscal 2005, the company received preliminary insurance payments of $5.5 millionrelating to claims filed as a result of Hurricane Katrina. Of the proceeds received, $3.2 million and $2.3 million wereallocated to materials, supplies, labor and other production costs and to selling, marketing and administrativeexpenses, respectively.
During fiscal 2006, the company received insurance proceeds of $4.5 million relating to Hurricane Katrina.These proceeds consisted of business interruption incurred during the first two quarters of fiscal 2006 of$1.7 million, reimbursement for property damage of $2.4 million and $0.4 million for incremental transportationexpense. Of the proceeds received, $1.0 million, $1.1 million and $2.4 million were allocated to materials, supplies,labor and other production costs, to selling, marketing and administrative expenses and to gain on insurancerecovery, respectively. All claims relating to Hurricane Katrina have been closed and no further claims will be filedby the company relating to the hurricane.
Sale of Mrs. Smith’s Bakeries’ Frozen Dessert Business in Fiscal 2003. On April 24, 2003, the companycompleted the sale of substantially all the assets of its Mrs. Smith’s Bakeries frozen dessert business to Schwan. Thecompany retained the frozen bread and roll portion of the Mrs. Smith’s Bakeries business. As a result, the frozenbread and roll business as well as the Birmingham, Alabama production facility, formerly a part of FlowersBakeries, became a part of our Flowers Snack segment, with Flowers Snack being renamed Flowers Specialty.During the fourth quarter of fiscal 2004, the Birmingham, Alabama production facility was transferred to FlowersBakeries from Flowers Specialty. For purposes of this Form 10-K, the discussion relates to our Flowers Bakeriesand Flowers Specialty business units as these businesses are currently operated. The frozen dessert business ofMrs. Smith’s Bakeries sold is reported as a discontinued operation.
Acquisitions. On February 18, 2006, the company acquired Derst Baking Company (“Derst”), a Savannah,Georgia-based bakery. Derst, with annual sales of approximately $50.0 million, produces breads and rollsdistributed to customers and consumers in South Carolina, eastern Georgia and north Florida.
On September 1, 2005, the company acquired substantially all the assets of Royal Cake Company, Inc. (“Royal”),a Winston-Salem, North Carolina-based bakery. Royal, with annual sales of approximately $24.0 million, producescookies, cereal bars and creme-filled cakes.
On September 27, 2004, the company acquired the assets of a closed bread and bun bakery in Houston, Texasfor cash from Sara Lee Bakery Group. The transaction included a list of associated private label and foodservice
23

customers that Sara Lee Bakery Group previously served in selected Texas markets. The company temporarilyopened the bakery from September 10, 2005 until December 31, 2005 in order to fill its capacity short-fall due to thetemporary idling of the company’s New Orleans bakery as a result of Hurricane Katrina as discussed above. InApril 2006, the bakery was opened on a permanent basis producing buns.
Results of Operations
The company’s results of operations, expressed as a percentage of sales, are set forth below:
December 30, 2006 December 31, 2005 January 1, 2005
For the 52Weeks Ended
For the 52Weeks Ended
For the 52Weeks Ended
Sales . . . . . . . . . . . . . . . . . . . . . . . . . . . . . . 100.00% 100.00% 100.00%
Gross margin . . . . . . . . . . . . . . . . . . . . . . . . 49.72 49.79 49.76Selling, marketing, and administrative
expenses . . . . . . . . . . . . . . . . . . . . . . . . . . 40.21 40.54 40.80Depreciation and amortization . . . . . . . . . . . . 3.40 3.46 3.66Gain on insurance recovery . . . . . . . . . . . . . . (0.16) — —Net interest income . . . . . . . . . . . . . . . . . . . . (0.26) (0.37) (0.57)
Income from continuing operations beforeincome taxes, minority interest andcumulative effect of a change inaccounting principle . . . . . . . . . . . . . . . . . 6.53 6.16 5.87
Income tax expense. . . . . . . . . . . . . . . . . . . . 2.40 2.32 2.26Minority interest in variable interest entity . . . (0.17) (0.18) (0.12)
Income (loss) from discontinued operations . . 0.36 (0.09) (0.22)Cumulative effect of a change in accounting
principle . . . . . . . . . . . . . . . . . . . . . . . . . . (0.03) — —Net income . . . . . . . . . . . . . . . . . . . . . . . . . . 4.29% 3.57% 3.27%
Fifty-Two Weeks Ended December 30, 2006 Compared to Fifty-Two Weeks Ended December 31, 2005
Consolidated Sales.
$ % $ % % IncreaseDecember 30, 2006 December 31, 2005
For the 52Weeks Ended
For the 52Weeks Ended
(Amounts inthousands)
(Amounts inthousands)
Branded Retail . . . . . . . . . . . . . . . . . . . . $ 983,332 52.1% $ 880,322 51.3% 11.7%
Store Branded Retail . . . . . . . . . . . . . . . . 242,309 12.8 214,783 12.5 12.8%
Foodservice and Other . . . . . . . . . . . . . . 663,013 35.1 620,764 36.2 6.8%
Total . . . . . . . . . . . . . . . . . . . . . . . . . . . $1,888,654 100.0% $1,715,869 100.0% 10.1%
The 10.1% increase in sales was attributable to price increases of 6.5%, favorable product mix shifts andincreased volume of 3.6%. The 3.6% increase in mix and volume resulted from the expansion of the company’sDSD system into new markets and new products, which contributed 0.6%, the February 2006 acquisition of DerstBaking Company, which contributed 2.5%, and the September 2005 acquisition of Royal Cake Company, whichcontributed 0.5%. The increase in branded retail sales was due primarily to the acquisitions and increases in pricingand volume. The company’s branded white bread labels, including Whitewheat and its Nature’s Own products werethe key components of these sales increases. The increase in store branded retail sales was due to price and volumeincreases. The increase in foodservice and other sales was primarily due to price increases and favorable productmix shifts, partially offset by a decrease in volume, primarily in contract production.
24
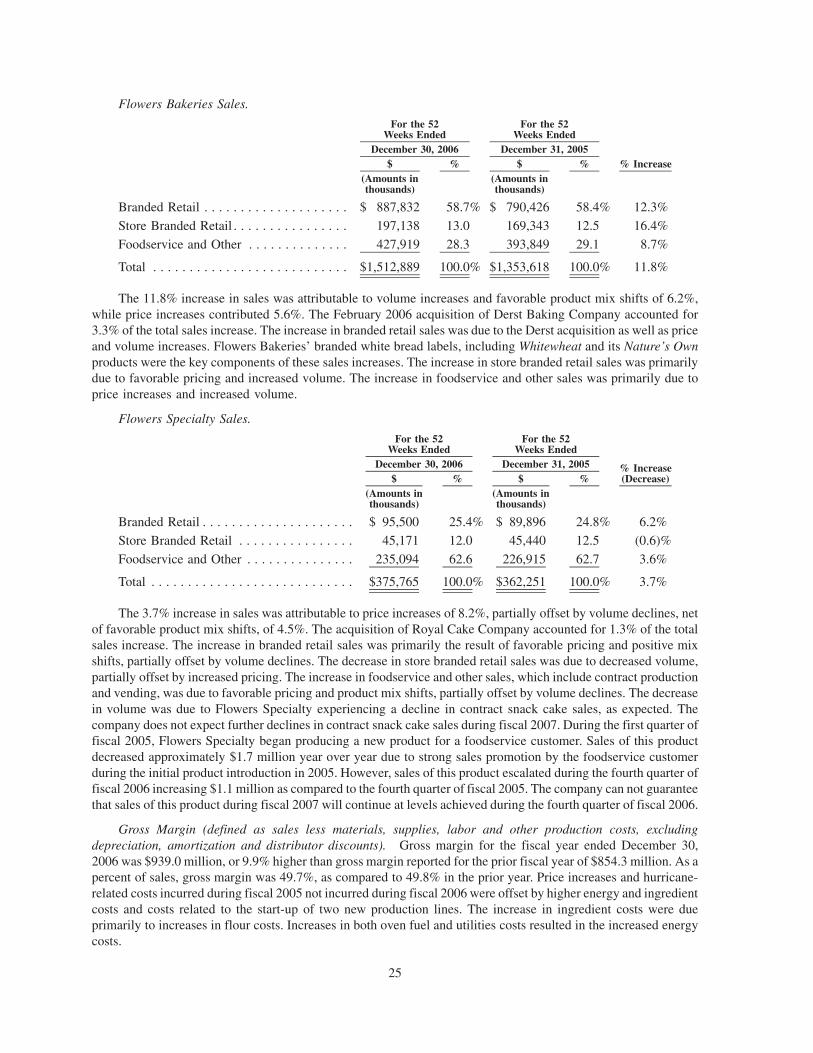
Flowers Bakeries Sales.
$ % $ % % IncreaseDecember 30, 2006 December 31, 2005
For the 52Weeks Ended
For the 52Weeks Ended
(Amounts inthousands)
(Amounts inthousands)
Branded Retail . . . . . . . . . . . . . . . . . . . . $ 887,832 58.7% $ 790,426 58.4% 12.3%
Store Branded Retail . . . . . . . . . . . . . . . . 197,138 13.0 169,343 12.5 16.4%
Foodservice and Other . . . . . . . . . . . . . . 427,919 28.3 393,849 29.1 8.7%
Total . . . . . . . . . . . . . . . . . . . . . . . . . . . $1,512,889 100.0% $1,353,618 100.0% 11.8%
The 11.8% increase in sales was attributable to volume increases and favorable product mix shifts of 6.2%,while price increases contributed 5.6%. The February 2006 acquisition of Derst Baking Company accounted for3.3% of the total sales increase. The increase in branded retail sales was due to the Derst acquisition as well as priceand volume increases. Flowers Bakeries’ branded white bread labels, including Whitewheat and its Nature’s Ownproducts were the key components of these sales increases. The increase in store branded retail sales was primarilydue to favorable pricing and increased volume. The increase in foodservice and other sales was primarily due toprice increases and increased volume.
Flowers Specialty Sales.
$ % $ %% Increase(Decrease)
December 30, 2006 December 31, 2005
For the 52Weeks Ended
For the 52Weeks Ended
(Amounts inthousands)
(Amounts inthousands)
Branded Retail . . . . . . . . . . . . . . . . . . . . . $ 95,500 25.4% $ 89,896 24.8% 6.2%
Store Branded Retail . . . . . . . . . . . . . . . . 45,171 12.0 45,440 12.5 (0.6)%
Foodservice and Other . . . . . . . . . . . . . . . 235,094 62.6 226,915 62.7 3.6%
Total . . . . . . . . . . . . . . . . . . . . . . . . . . . . $375,765 100.0% $362,251 100.0% 3.7%
The 3.7% increase in sales was attributable to price increases of 8.2%, partially offset by volume declines, netof favorable product mix shifts, of 4.5%. The acquisition of Royal Cake Company accounted for 1.3% of the totalsales increase. The increase in branded retail sales was primarily the result of favorable pricing and positive mixshifts, partially offset by volume declines. The decrease in store branded retail sales was due to decreased volume,partially offset by increased pricing. The increase in foodservice and other sales, which include contract productionand vending, was due to favorable pricing and product mix shifts, partially offset by volume declines. The decreasein volume was due to Flowers Specialty experiencing a decline in contract snack cake sales, as expected. Thecompany does not expect further declines in contract snack cake sales during fiscal 2007. During the first quarter offiscal 2005, Flowers Specialty began producing a new product for a foodservice customer. Sales of this productdecreased approximately $1.7 million year over year due to strong sales promotion by the foodservice customerduring the initial product introduction in 2005. However, sales of this product escalated during the fourth quarter offiscal 2006 increasing $1.1 million as compared to the fourth quarter of fiscal 2005. The company can not guaranteethat sales of this product during fiscal 2007 will continue at levels achieved during the fourth quarter of fiscal 2006.
Gross Margin (defined as sales less materials, supplies, labor and other production costs, excludingdepreciation, amortization and distributor discounts). Gross margin for the fiscal year ended December 30,2006 was $939.0 million, or 9.9% higher than gross margin reported for the prior fiscal year of $854.3 million. As apercent of sales, gross margin was 49.7%, as compared to 49.8% in the prior year. Price increases and hurricane-related costs incurred during fiscal 2005 not incurred during fiscal 2006 were offset by higher energy and ingredientcosts and costs related to the start-up of two new production lines. The increase in ingredient costs were dueprimarily to increases in flour costs. Increases in both oven fuel and utilities costs resulted in the increased energycosts.
25

Flowers Bakeries’ gross margin decreased to 54.7% of sales for the fiscal year ended December 30, 2006,compared to 55.2% of sales for the prior year. This decrease as a percent of sales was due to start-up costs associatedwith two new production lines and increased ingredient and energy costs. These negative items were partially offsetby the implementation of price increases and costs incurred during fiscal 2005 related to the hurricane not incurredduring fiscal 2006.
Flowers Specialty’s gross margin increased slightly to 29.6% of sales for fiscal 2006, compared to 29.5% ofsales for fiscal 2005. This increase was primarily the result of less outsourcing of production, partially offset byhigher ingredient and utilities costs, as well as, start-up costs associated with the introduction of a new product for afoodservice customer and the decline in contract snack cake production.
Selling, Marketing and Administrative Expenses. For fiscal 2006, selling, marketing and administrativeexpenses were $759.4 million, or 40.2% of sales as compared to $695.7 million, or 40.5% of sales reported for fiscal2005. This decrease as a percent of sales was due to increased sales and lower advertising and pension costs. Thesepositive items were partially offset by income of $1.4 million received during fiscal 2005 as a result of a settlementof a class action lawsuit against several of the company’s high fructose corn syrup suppliers as a result of pricingirregularities and higher stock-based compensation costs. Stock-based compensation costs increased $4.4 million,or $0.04 per share, year over year, primarily as a result of the adoption of SFAS 123R. See Note 15 of Notes toConsolidated Financial Statements of this Form 10-K for information regarding the company’s stock-basedcompensation.
Flowers Bakeries’ selling, marketing and administrative expenses include discounts paid to the independentdistributors utilized in our DSD system. Flowers Bakeries’ selling, marketing and administrative expenses were$652.8 million, or 43.2% of sales during fiscal 2006, as compared to $593.0 million, or 43.8% of sales during fiscal2005. The decrease as a percent of sales was primarily due to increased sales and lower distribution, advertising andpension costs. These positive items were partially offset by increased stock-based compensation costs of$1.5 million discussed above and the income during fiscal 2005 relating to the settlement of the class actionlawsuit discussed above.
Flowers Specialty’s selling, marketing and administrative expenses were $80.1 million, or 21.3% of salesduring fiscal 2006, as compared to $73.4 million, or 20.3% of sales during fiscal 2005. This increase as a percent ofsales was primarily attributable to higher distribution, labor and freezer storage costs. The higher distribution costswere due primarily to costs associated with the transition to a new centralized distribution center, increased fuelcosts and the continued shift of business from contract to mass merchandisers and convenience stores. Contractcustomers normally pick up the product sold, whereas the company delivers product to mass merchandisers andconvenience store customers.
Depreciation and Amortization. Depreciation and amortization expense was $64.3 million for fiscal 2006, anincrease of 8.3% from fiscal 2005, which was $59.3 million.
Flowers Bakeries’ depreciation and amortization expense increased to $51.3 million for fiscal 2006 from$47.8 million in fiscal 2005. This increase was primarily the result of increased depreciation expense due to capitalexpenditures placed in service during fiscal 2006 and the amortization of a trademark and customer relationshipsassociated with the acquisition in February 2006 of Derst Baking Company. See Note 5 of Notes to ConsolidatedFinancial Statements of this Form 10-K for further information regarding these intangibles.
Flowers Specialty’s depreciation and amortization expense increased to $13.1 million for fiscal 2006 ascompared to $11.6 million for fiscal 2005. This increase was primarily the result of increased depreciation expensedue to capital expenditures placed in service during fiscal 2006.
Gain on Insurance Recovery. As discussed above, during fiscal 2006, the company received insuranceproceeds of $4.5 million relating to damage incurred as a result of Hurricane Katrina during the third quarter offiscal 2005. Included in this reimbursement were proceeds of $2.4 million in excess of net book value of propertydamaged during the hurricane. During the first quarter of fiscal 2006, certain equipment was destroyed by fire at thecompany’s Montgomery, Alabama production facility (a part of Flowers Specialty). Property damage insuranceproceeds of $1.1 million were received during the first quarter of fiscal 2006 under the company’s insurance policy.
26

The net book value of the equipment at the time of the fire was $0.4 million, resulting in a gain of $0.7 million. Thisequipment was replaced during the first quarter and is fully operational.
Net Interest Income. For fiscal 2006, net interest income was $4.9 million, a decrease of $1.4 million fromfiscal 2005, which was $6.3 million. The decrease was primarily related to an increase in interest expense of$1.3 million as a result of a higher average amount of debt outstanding under the company’s credit facility.
Income From Continuing Operations Before Income Taxes, Minority Interest and Cumulative Effect of aChange in Accounting Principle. Income from continuing operations before income taxes, minority interest and achange in accounting principle for fiscal 2006 was $123.4 million, an increase of $17.8 million from the$105.6 million reported for fiscal 2005.
The improvement was primarily the result of improvements in the operating results of Flowers Bakeries of$19.3 million and a decrease in unallocated corporate expenses of $3.1 million, partially offset by a decrease in theoperating results of Flowers Specialty of $3.2 million and a decrease in net interest income of $1.4 million. Theincrease at Flowers Bakeries was primarily attributable to higher sales, lower advertising and distribution costs andthe gain on the insurance recovery related to Hurricane Katrina discussed above, as well as, losses incurred duringfiscal 2005 as a result of the hurricane that were not incurred in fiscal 2006. Partially offsetting these positive itemswere higher stock-based compensation costs, start-up costs associated with two new production lines and theincome in fiscal 2005 from proceeds received from the settlement of the class action lawsuit discussed herein. Thedecrease at Flowers Specialty was primarily a result of higher labor, ingredient, in-bound freight and freezer storagecosts, as well as costs associated with the transition to a new centralized distribution center and the shift of businessfrom contract to mass merchandisers and convenience stores as discussed above. Start-up costs associated with theintroduction of a new product for a foodservice customer also contributed to the decrease. These negative itemswere partially offset by decreased packaging costs, less outsourcing of production and the gain on the insurancerecovery discussed above. The decrease in unallocated corporate expenses was primarily due to lower pensioncosts, partially offset by higher stock-based compensation expense. See Net Interest Income above for a discussionof the decrease in this area.
Income Taxes. The effective tax rate for fiscal 2006 was 36.7% compared to 37.7% for fiscal 2005. Thisdecrease is primarily due to an increase in the Section 199 qualifying production activities deduction and a deferredtax benefit of approximately $0.3 million related to a change in Texas state tax law, which was signed into effect inMay 2006. The effective rate for fiscal 2005 was also impacted by an accrual of state income tax of $0.6 million, netof the federal benefit of $0.3 million, based on the outcome of a state tax audit that was settled in the first quarter offiscal 2005. The difference in the effective rate and the statutory rate is primarily due to state income taxes, the non-taxable earnings of the consolidated variable interest entity and the Section 199 qualifying production activitiesdeduction.
Minority Interest. Minority interest represents all the earnings of the company’s variable interest entity(“VIE”) under the consolidation provisions of Financial Accounting Standards Board Interpretation No. 46(“FIN 46”), Consolidation of Variable Interest Entities. All the earnings of the VIE are eliminated throughminority interest due to the company not having any equity ownership in the VIE. The company is required toconsolidate this VIE due to the VIE being capitalized with a less than substantive amount of legal form capitalinvestment and the company accounting for a significant portion of the VIE’s revenues. See Note 12 of Notes toConsolidated Financial Statements of this Form 10-K for further information regarding the company’s VIE.
Discontinued Operations. During fiscal 2004, the company announced an agreement to settle a class actionlawsuit related to pie shells produced by a former operating facility. The costs of this settlement, $1.8 million, net ofincome tax benefit were recorded by the company as part of discontinued operations. During the first quarter offiscal 2006, the company received an insurance recovery of $2.0 million ($1.2 million, net of income tax) relating tothis settlement.
During the third quarter of fiscal 2006, the IRS finalized its audit of the company’s tax years 2000 and 2001.Based upon the results of this audit, the company reversed previously established tax reserves in the amount of$6.0 million related to the deductibility of certain transaction costs incurred in connection with the divestiture of the
27

company’s Keebler investment in 2001. A deduction was allowed for a majority of these costs; therefore, the reservewas reversed through discontinued operations in the third quarter of fiscal 2006.
The IRS also finalized the results of its audit of the company’s fiscal 2003 income tax return during the thirdquarter of fiscal 2006. Based on the results of this audit, the company accrued $0.5 million of income tax expenserelated to Mrs. Smith’s, which was sold in 2003. This adjustment is also recorded in discontinued operations in theconsolidated statement of income.
Cumulative Effect of a Change in Accounting Principle. As a result of the adoption of SFAS 123R onJanuary 1, 2006, the company recorded as an expense a cumulative effect of a change in accounting principle of$0.9 million ($0.6 million, net of income tax benefit) relating to its stock appreciation rights. This was a result of theliability as of January 1, 2006 (the day of adoption of SFAS 123R) as computed using the Black-Scholes pricingmodel being greater than the recorded liability on that day. Prior to the adoption of SFAS 123R, the companycomputed expense on the vested portion of the rights as the difference between the grant date market value of itsstock and the market value of its stock at the end of the respective reporting period.
Fifty-Two Weeks Ended December 31, 2005 Compared to Fifty-Two Weeks Ended January 1, 2005
Consolidated Sales.
$ % $ % % IncreaseDecember 31, 2005 January 1, 2005
For the 52Weeks Ended
For the 52Weeks Ended
(Amounts inthousands)
(Amounts inthousands)
Branded Retail . . . . . . . . . . . . . . . . . . . . $ 880,322 51.3% $ 799,342 51.5% 10.1%
Store Branded Retail . . . . . . . . . . . . . . . . 214,783 12.5 196,146 12.6 9.5%
Foodservice and Other . . . . . . . . . . . . . . 620,764 36.2 555,820 35.9 11.7%
Total . . . . . . . . . . . . . . . . . . . . . . . . . . . $1,715,869 100.0% $1,551,308 100.0% 10.6%
The 10.6% increase in sales was attributable to favorable product mix shifts and increased volume of 6.6%,while price increases contributed 4.0%. The 6.6% increase in mix and volume resulted from growth in thecompany’s core business of 4.1%, the expansion of the company’s DSD system into new markets and new products,which contributed 0.9%, the September 2004 acquisition in Texas, which contributed 1.2% and the September 2005acquisition of Royal Cake Company, which contributed 0.4%. The increase in branded retail sales was dueprimarily to increases in volume. The company’s branded white bread labels and its Nature’s Own products are thekey components of these sales. The increase in store branded retail sales was due to volume and price increases. Theincrease in foodservice and other sales was primarily due to price increases and favorable product mix shifts,partially offset by a decrease in volume.
Flowers Bakeries Sales.
$ % $ % % IncreaseDecember 31, 2005 January 1, 2005
For the 52Weeks Ended
For the 52Weeks Ended
(Amounts inthousands)
(Amounts inthousands)
Branded Retail . . . . . . . . . . . . . . . . . . . . $ 790,426 58.4% $ 722,511 59.3% 9.4%
Store Branded Retail . . . . . . . . . . . . . . . . 169,343 12.5 149,011 12.2 13.6%
Foodservice and Other . . . . . . . . . . . . . . 393,849 29.1 347,134 28.5 13.5%
Total . . . . . . . . . . . . . . . . . . . . . . . . . . . $1,353,618 100.0% $1,218,656 100.0% 11.1%
The 11.1% increase in sales was attributable to volume increases and favorable product mix shifts of 8.0%,while price increases contributed 3.1%. 1.6% of the mix and volume increase is related to the September 2004acquisition in Texas. The increase in branded retail sales was due primarily to increases in volume. Flowers
28

Bakeries’ branded white bread labels and its Nature’s Own products are the key components of these sales. Theincrease in store branded retail sales was primarily due to increased volume. The increase in foodservice and othersales was primarily due to volume increases and favorable product mix shifts.
Flowers Specialty Sales.
$ % $ %% Increase(Decrease)
December 31, 2005 January 1, 2005
For the 52Weeks Ended
For the 52Weeks Ended
(Amounts inthousands)
(Amounts inthousands)
Branded Retail . . . . . . . . . . . . . . . . . . . . . $ 89,896 24.8% $ 76,831 23.1% 17.0%
Store Branded Retail . . . . . . . . . . . . . . . . 45,440 12.5 47,135 14.2 (3.6)%
Foodservice and Other . . . . . . . . . . . . . . . 226,915 62.7 208,686 62.7 8.7%
Total . . . . . . . . . . . . . . . . . . . . . . . . . . . . $362,251 100.0% $332,652 100.0% 8.9%
The 8.9% increase in sales was attributable to favorable product mix shifts, net of volume declines, of 2.5%,while price increases contributed 6.4%. 2.0% of the 2.5% mix and volume increase is related to the acquisition ofRoyal Cake Company. The increase in branded retail sales was the result of favorable pricing, positive mix shiftsand increased volume. The decrease in store branded retail sales was due to decreased volume, partially offset byprice increases. The increase in foodservice and other sales, which include contract production and vending, wasdue to favorable product mix shifts and pricing, partially offset by decreased volume. The decrease in volume wasdue to Flowers Specialty experiencing a decline in contract snack cake sales, which more than offset volume gainedin frozen bread and rolls within the foodservice channel. The company is replacing its lower margin contract snackcake production with sales of higher margin branded products. Flowers Specialty recorded sales of approximately$15.0 million in fiscal 2005 relating to the introduction of a new product in the first quarter of fiscal 2005 by afoodservice customer.
Gross Margin (defined as sales less materials, supplies, labor and other production costs, excludingdepreciation, amortization and distributor discounts). Gross margin for the fiscal year ended December 31,2005 was $854.3 million, or 10.7% higher than gross margin reported for the prior fiscal year of $771.9 million. As apercent of sales, gross margin remained unchanged at 49.8% as compared to the prior year. Costs associated with thehurricane discussed above and higher labor, energy and packaging costs were offset by increased sales and loweringredient costs. The decrease in ingredient costs was primarily attributable to lower prices for eggs, sweetener andcocoa.
Flowers Bakeries’ gross margin decreased to 55.2% of sales for the fiscal year ended December 31, 2005,compared to 55.9% of sales for the prior year. This decrease was primarily the result of costs associated with thehurricane and increases in ingredient, labor, packaging and energy costs. These negative items were partially offsetby increased sales and insurance proceeds received related to the hurricane discussed above. Historically, thecompany has included the difference between actual and budgeted flour cost at the corporate level, but effective thefirst quarter of fiscal 2005, the company recorded this difference in the results of each of its operating segments. Theimpact of this change for fiscal 2005 was to reduce gross margin at Flowers Bakeries 0.4%.
Flowers Specialty’s gross margin increased to 29.5% of sales for fiscal 2005, compared to 28.6% of sales forfiscal 2004. This increase was primarily a result of higher sales and lower ingredient costs. The lower ingredientcosts were primarily attributable to decreases in the costs of mixes, eggs and cocoa, partially offset by higher drysugar and flour costs. These positive items were partially offset by increased utility and repairs and maintenancecosts and outside purchases resulting from capacity shortages.
Selling, Marketing and Administrative Expenses. For fiscal 2005, selling, marketing and administrative expenseswere $695.7 million, or 40.5% of sales as compared to $632.9 million, or 40.8% of sales reported for fiscal 2004.
Flowers Bakeries’ selling, marketing and administrative expenses include discounts paid to the independentdistributors utilized in our DSD system. Flowers Bakeries’ selling, marketing and administrative expenses were$593.0 million, or 43.8% of sales during fiscal 2005, as compared to $537.4 million, or 44.1% of sales during fiscal
29

2004. The decrease as a percent of sales was primarily due to increased sales, lower compensation and advertisingcosts and a $1.4 million settlement received as part of a class action lawsuit against several of the company’s highfructose corn syrup suppliers as a result of pricing irregularities. Partially offsetting these positive items were costsrelated to the hurricane and increased distribution costs associated with geographic expansion of the company’sDSD system.
Flowers Specialty’s selling, marketing and administrative expenses were $73.4 million, or 20.3% of salesduring fiscal 2005, as compared to $63.7 million, or 19.2% of sales during fiscal 2004. The increase as a percent ofsales was primarily attributable to higher distribution expenses, partially offset by increased sales and lower laborcosts.
Depreciation and Amortization. Depreciation and amortization expense was $59.3 million for fiscal 2005, anincrease of 4.7% from fiscal 2004, which was $56.7 million.
Flowers Bakeries’ depreciation and amortization expense increased to $47.8 million for fiscal 2005 from$45.7 million in fiscal 2004. This increase was primarily the result of increased depreciation expense of $2.0 milliondue to recent capital expenditures.
Flowers Specialty’s depreciation and amortization expense of $11.6 million for fiscal 2005 remained relativelyunchanged as compared to $11.5 million for fiscal 2004.
Net Interest Income. For fiscal 2005, net interest income was $6.3 million, a decrease of $2.5 million forfiscal 2004, which was $8.8 million. The decrease was primarily related to an increase in interest expense of$2.9 million primarily as a result of borrowings under the company’s credit facility to fund two large stockrepurchases.
Income From Continuing Operations Before Income Taxes and Minority Interest. Income from continuingoperations before income taxes and minority interest for fiscal 2005 was $105.6 million, an increase of $14.5 millionfrom the $91.1 million reported for fiscal 2004.
The improvement was primarily the result of improvements in the operating results of Flowers Bakeries of$9.1 million, Flowers Specialty of $1.7 million and a decrease of $6.2 million in unallocated corporate expenses.Partially offsetting these positive items was a decrease in net interest income of $2.5 million. The increase atFlowers Bakeries was primarily attributable to higher sales and lower advertising and stock compensation costs andthe class action lawsuit settlement discussed above. These positive items were partially offset by costs associatedwith the hurricane, increased labor and utility costs and the change in the first quarter of fiscal 2005 in allocating thedifference in actual and budgeted flour costs discussed above. The improvement at Flowers Specialty was primarilya result of higher sales and lower ingredient and labor costs. The decrease in unallocated corporate expenses wasprimarily due to the change in the first quarter of fiscal 2005 in allocating the difference in actual and budgeted flourcosts as discussed above and lower pension costs. See Net Interest Income above for a discussion of the decrease inthis area.
Income Taxes. The effective tax rate for fiscal 2005 was 37.7% compared to 38.5% for fiscal 2004. Thisdecrease is primarily the result of an increase in the non-taxable earnings of a consolidated variable interest entityand a $0.4 million tax benefit associated with deductions under the American Jobs Creation Act of 2004. Theseitems were partially offset by $0.6 million, net of the federal benefit of $0.3 million, of state tax expense accrued inthe first quarter of fiscal 2005 based on the outcome of a state tax audit that began in the first quarter. The differencein the effective rate and the statutory rate is primarily due to state income taxes and the non-taxable earnings of theconsolidated variable interest entity.
Minority Interest. Minority interest represents all the earnings of the company’s VIE under the consolidationprovisions of FIN 46. All the earnings of the VIE are eliminated through minority interest due to the company nothaving any equity ownership in the VIE. The company is required to consolidate this VIE due to the VIE beingcapitalized with a less than substantive amount of legal form capital investment and the company accounting for asignificant portion of the VIE’s revenues. See Note 12 of Notes to Consolidated Financial Statements of thisForm 10-K for further information regarding the company’s VIE.
30

Discontinued Operations. On September 22, 2005, the company and Schwan reached a final settlementregarding all claims in connection with the sale in April 2003 of the company’s Mrs. Smith’s Bakeries’ frozendessert business to Schwan. This settlement included a payment of $2.0 million. This payment, $1.2 million, net oftax benefit, along with other charges related to the Mrs. Smith’s business of $0.4 million, net of tax benefits, areincluded in discontinued operations for fiscal 2005. The other charges include an adjustment of $0.2 million, net oftax benefit, relating to costs to settle a class action lawsuit related to pie shells produced by a former operatingfacility as discussed in Item 3. Legal Proceedings of this Form 10-K.
Subsequent to the sale of the Mrs. Smith’s Bakeries’ frozen dessert business to Schwan, the company paidvarious other expenses related to its operation of the Mrs. Smith’s Bakeries business, no single one of which wasmaterial to the results of operations or financial condition of the company. During the first quarter of fiscal 2004, thecompany established a reserve of $5.1 million ($3.1 million, net of income tax) as an estimate of future expenseslikely to be incurred by the company in connection with its prior ownership of the Mrs. Smith’s Bakeries business.
Liquidity and Capital Resources
Liquidity represents our ability to generate sufficient cash flows from operating activities to meet ourobligations and commitments as well as our ability to obtain appropriate financing and convert into cash those assetsthat are no longer required to meet existing strategic and financing objectives. Therefore, liquidity cannot beconsidered separately from capital resources that consist primarily of current and potentially available funds for usein achieving long-range business objectives. Currently, the company’s liquidity needs arise primarily from workingcapital requirements and capital expenditures. The company’s strategy for use of its cash flow includes payingdividends to shareholders, making acquisitions, growing internally and repurchasing shares of its common stock,when appropriate.
The company leases certain property and equipment under various operating and capital lease arrangements.Most of the operating leases provide the company with the option, after the initial lease term, either to purchase theproperty at the then fair value or renew its lease at the then fair value. The capital leases provide the company withthe option to purchase the property at a fixed price at the end of the lease term. The company believes the use ofleases as a financing alternative places the company in a more favorable position to fulfill its long-term strategy forthe use of its cash flow. See Note 11 of Notes to Consolidated Financial Statements of this Form 10-K for detailedfinancial information regarding the company’s lease arrangements.
Flowers Foods’ cash and cash equivalents increased to $13.9 million at December 30, 2006 from $11.0 millionat December 31, 2005. The increase of $2.9 million resulted from the net of $151.3 million provided by operatingactivities, $71.7 million disbursed for investing activities and $76.7 million disbursed for financing activities.Included in cash and cash equivalents at December 30, 2006 is $5.4 million related to the company’s VIE, none ofwhich is available for use by the company.
Cash Flows Provided by Operating Activities. Net cash of $151.3 million provided by operating activitiesconsisted primarily of $81.0 million in net income adjusted for certain non-cash items of $61.0 million. Cashreceived for working capital and other activities was $9.3 million.
During the first quarter of fiscal 2007, the company estimates payments totaling $20.4 million relating to itsbonus program. On July 16, 2007, the company’s outstanding employee stock appreciation rights granted in 2003will vest. At that time, cash will be paid to grantees on the rights outstanding in the amount of the difference betweenthe grant price of $14.01 and the company’s stock price on the vesting date plus dividends accrued during the vestingperiod. Currently there are 465,450 rights outstanding under this grant. The company believes it will have sufficientinternally generated cash or amounts available under its credit facility to meet these cash needs.
During fiscal 2006, the company made a voluntary cash contribution of $14.0 million to its defined benefitplan. This contribution was funded from the company’s internally generated funds and was tax deductible.Although this contribution was not required to be made by the minimum funding requirements of ERISA, thecompany believes that, due to its strong cash flow and balance sheet, this was an appropriate time to make thecontribution in order to reduce the impact of future contributions. The value of the company’s plan assets remainedbelow the ABO at its most recent plan measurement date. In fiscal 2007, there are no required pension contributions
31

under the minimum funding requirements of ERISA. The company continues to review various contributionscenarios and it has not made a determination whether it will make any pension contributions during fiscal 2007. Inassessing these different scenarios, the company believes its strong cash flow and balance sheet will allow it to fundfuture pension needs without adversely affecting the business strategy of the company.
Cash Flows Disbursed for Investing Activities. Net cash disbursed for investing activities for fiscal 2006 of$71.7 million included capital expenditures of $61.8 million. Capital expenditures at Flowers Bakeries and FlowersSpecialty were $43.9 million and $12.9 million, respectively. The company estimates capital expenditures ofapproximately $63.0 million to $64.0 million during fiscal 2007. The company also leases certain productionmachinery and equipment through various operating leases.
Cash Flows Disbursed for Financing Activities. Net cash of $76.7 million disbursed for financing activitiesconsisted primarily of stock repurchases and dividends paid of $63.6 million and $29.0 million, respectively. Theseitems were offset by borrowings of $347.4 million under the company’s credit facility and proceeds of $6.4 millionfrom the exercise of stock options. During fiscal 2006, $345.6 million of the borrowings under the company’s creditfacility were repaid. In accordance with SFAS 123R, cash income tax windfall benefits of $8.6 million related tostock award activity during fiscal 2006 are classified as cash inflows from financing activities. Because thecompany applied the modified prospective transition method in adopting SFAS 123R, prior period cash flowstatements are not restated. Therefore, cash income tax windfall benefits of $11.2 million and $2.0 million related tostock award activity during fiscal 2005 and fiscal 2004 are classified as cash inflows from operating activities.
Credit Facility. On June 6, 2006, the company further amended and restated its credit facility (the “new creditfacility”), which was previously amended and restated on October 29, 2004 (“the former credit facility”). The newcredit facility is a five-year, $250.0 million unsecured revolving loan facility that expires June 6, 2011 and providesfor lower rates on future borrowings than the company’s former credit facility. The company may request to increaseits borrowings under the new credit facility up to an aggregate of $350.0 million upon the satisfaction of certainconditions. Proceeds from the new credit facility may be used for working capital and general corporate purposes,including acquisition financing, refinancing of indebtedness and share repurchases. The new credit facility includescertain customary restrictions, which, among other things, require maintenance of financial covenants and limitencumbrance of assets and creation of indebtedness. Restrictive financial covenants include such ratios as aminimum interest coverage ratio and a maximum leverage ratio. The company believes that, given its current cashposition, its cash flow from operating activities and its available credit capacity, it can comply with the current termsof the new credit facility and can meet presently foreseeable financial requirements. As of December 30, 2006, thecompany was in compliance with all restrictive financial covenants under its credit facility.
Interest is due quarterly in arrears on any outstanding borrowings at a customary Eurodollar rate or the baserate plus the applicable margin. The underlying rate is defined as either rates offered in the interbank Eurodollarmarket or the higher of the prime lending rate or federal funds rate plus 0.5%. The applicable margin ranges from0.00% to 0.20% for base rate loans and from 0.40% to 1.075% for Eurodollar loans. In addition, a facility feeranging from 0.10% to 0.30% is due quarterly on all commitments under the new credit facility. Both the interestmargin and the facility fee are based on the company’s leverage ratio. Outstanding borrowings under the new creditfacility were $51.8 million at December 30, 2006. Subsequent to the end of fiscal 2006, the company repaid$23.8 million of these borrowings. As excess funds become available, the company may, from time to time duringfiscal 2007 repay a portion or all of these borrowings.
The company paid financing costs of $0.4 million in connection with its new credit facility. These costs weredeferred and, along with unamortized costs of $0.5 million relating to the company’s former credit facility are beingamortized over the term of the new credit facility.
Credit Rating. Currently, the company’s credit ratings by Standard and Poor’s, Moody’s Investor Service andFitch Ratings are BBB-, Baa3, and BBB, respectively. Changes in the company’s credit ratings do not trigger achange in the company’s available borrowings or costs under the new credit facility, but could affect future creditavailability.
Stock Repurchase Plan. On December 19, 2002, the Board of Directors approved a plan that authorized stockrepurchases of up to 11.3 million shares of the company’s common stock. On November 18, 2005, the Board of
32

Directors increased the number of authorized shares to 15.3 million shares. Under the plan, the company mayrepurchase its common stock in open market or privately negotiated transactions at such times and at such prices asdetermined to be in the company’s best interest. The company repurchases its common stock primarily for issuanceunder the company’s stock compensation plans and to fund possible future acquisitions. These purchases may becommenced or suspended without prior notice depending on then-existing business or market conditions and otherfactors. As of December 30, 2006, 11.8 million shares at a cost of $247.1 million have been purchased under thisplan. Included in these amounts are 2.3 million shares at a cost of $63.6 million purchased during fiscal 2006.
Income Taxes. The company experienced minimal federal cash tax payments from 1999 to 2004 dueprimarily to net operating loss carryovers. Beginning in fiscal 2005, the company began making estimated federaltax payments because the federal net operating loss carryovers had been fully utilized. The federal payments totaled$39.0 million and $20.5 million during fiscal 2006 and fiscal 2005, respectively, and were funded with cash flowsfrom operations. During fiscal 2006, the company received a $10.5 million federal income tax refund.
Distributor Arrangements. The company offers long-term financing to independent distributors for thepurchase of their territories, and substantially all of the independent distributors elect to use this financingalternative. The distributor notes have a ten-year term, and the distributors pay principal and interest weekly. Eachindependent distributor has the right to require the company to repurchase the territories and truck, if applicable, atthe original price paid by the distributor on the long-term financing arrangement in the six-month period followingthe sale of a territory to the independent distributor. Prior to July of 2006, the company was required to repurchasethe territory at the original purchase price plus interest paid by the distributor in the six-month period following thesale of a territory to the independent distributor. If the truck is leased, the company will assume the lease payment ifthe territory is repurchased during the first six-month period. If the company had been required to repurchase theseterritories, the company would have been obligated to pay $0.6 million and $0.7 million as of December 30, 2006and December 31, 2005, respectively. After the six-month period expires, the company retains a right of first refusalto repurchase these territories. Additionally, in the event the company exits a territory or ceases to utilize theindependent distribution form of doing business, the company is contractually required to purchase the territoryfrom the independent distributor for ten times average weekly branded sales. If the company acquires a territoryfrom an independent distributor, company employees operate the territory until it can be resold. The company heldan aggregate of $84.3 million and $79.3 million as of December 30, 2006 and December 31, 2005, respectively, ofdistributor notes. The company does not view this aggregate amount as a concentrated credit risk, as each noterelates to an individual distributor. The company has approximately $22.9 million and $16.4 million as ofDecember 30, 2006 and December 31, 2005, respectively, of territories held for sale.
A majority of the independent distributors lease trucks through a third-party. Though it is generally thecompany’s policy not to provide third party guarantees, the company has guaranteed in prior periods, through theirrespective terms, approximately $0.4 million in leases at December 30, 2006 that certain independent distributorshave entered into with third party financial institutions. No liability is recorded in the consolidated financialstatements with respect to such guarantees. When an independent distributor terminates its relationship with thecompany, the company, although not legally obligated, generally purchases and operates that territory utilizing thetruck of the former distributor. To accomplish this, the company subleases the truck from the distributor, whogenerally remains solely liable under the original truck lease to the third party lessor, and continues the payments onbehalf of the former distributor. Once the territory is resold to an independent distributor, the truck lease is assumedby the new independent distributor. At December 30, 2006 and December 31, 2005, the company operated 390 and366 such territories, respectively. Assuming the company does not resell these territories to new independentdistributors, at December 30, 2006 and December 31, 2005, the maximum obligation associated with these truckleases was approximately $12.2 million and $10.1 million, respectively. There is no liability recorded in theconsolidated financial statements with respect to such leases, as the obligation for each lease generally remains withthe former distributor until the territory is sold to a new distributor. The company does not anticipate operating theseterritories over the life of the lease as it intends to resell these territories to new independent distributors.
Special Purpose Entities. At December 30, 2006 and December 31, 2005, the company did not have anyrelationships with unconsolidated entities or financial partnerships, such as entities often referred to as structuredfinance or special purpose entities, which are established to facilitate off-balance sheet arrangements or othercontractually narrow or limited purposes.
33

Contractual Obligations and Commitments. The following table summarizes the company’s contractualobligations and commitments at December 30, 2006 and the effect such obligations are expected to have on itsliquidity and cash flow in the indicated future periods:
2007 2008 2009 20102011 and
Thereafter
(Amounts in thousands)Payments Due by Fiscal Year
Contractual Obligations:
Long-term debt(1) . . . . . . . . . . . . . . . . $ 1,811 $ 1,718 $ 619 $ 620 $ 53,656
Capital leases . . . . . . . . . . . . . . . . . . . 5,595 5,096 5,070 5,328 7,019
Interest on capital leases . . . . . . . . . . . 1,699 1,310 992 628 614
Non-cancelable operating leaseobligations(2) . . . . . . . . . . . . . . . . . . 32,392 29,287 27,289 23,482 79,296
Purchase obligations(3) . . . . . . . . . . . . 68,925 — — — —
Total contractual cash obligations . . . $110,422 $37,411 $33,970 $30,058 $140,585
2007 2008 2009 20102011 and
Thereafter
(Amounts in thousands)Amounts Expiring by Fiscal Year
Commitments:
Standby letters of credit(4) . . . . . . . . . . . . . . . . . . . . $4,249 $— $— $ — $—
Truck lease guarantees . . . . . . . . . . . . . . . . . . . . . . . 255 — — 115 —
Total commitments . . . . . . . . . . . . . . . . . . . . . . . . $4,504 $— $— $115 $—
(1) Interest rates are variable, therefore, expected interest payments are not included in the above information.
(2) Does not include lease payments expected to be incurred in fiscal year 2007 related to distributor vehicles andother short-term or cancelable operating leases.
(3) Represents the company’s various ingredient and packaging purchasing agreements, which meet the normalpurchases exception under SFAS 133.
(4) These letters of credit are for the benefit of certain insurance companies related to workers’ compensationliabilities recorded by the Company as of December 30, 2006.
Guarantees and Indemnification Obligations. Our company has provided various representations, warran-ties and other standard indemnifications in various agreements with customers, suppliers and other parties, as wellas in agreements to sell business assets or lease facilities. In general, these provisions indemnify the counterparty formatters such as breaches of representations and warranties, certain environmental conditions and tax matters, and,in the context of sales of business assets, any liabilities arising prior to the closing of the transactions. Non-performance under a contract could trigger an obligation of the company. The ultimate effect on future financialresults is not subject to reasonable estimation because considerable uncertainty exists as to the final outcome of anypotential claims. We do not believe that any of these commitments will have a material effect on our results ofoperations or financial condition.
On April 24, 2003, in connection with the sale of the Mrs. Smith’s Bakeries frozen dessert business to Schwan,the company agreed to provide customary indemnifications to Schwan for matters such as breaches of represen-tations and warranties, certain tax matters and liabilities arising prior to the consummation of the transaction. Thecompany purchased an insurance policy to cover certain product liability claims that may arise under theindemnification. Certain non-product liability claims were asserted by Schwan. These claims were not coveredby the insurance policy and were the company’s responsibility. On September 22, 2005, the company and Schwanreached a final settlement regarding all claims in connection with the sale. The terms of the settlement consisted of apayment by the company to Schwan of $2.0 million, which is recorded in discontinued operations for the 52 weeks
34

ended December 31, 2005. Except as described above, no other significant guarantees or indemnifications havebeen entered into by the company through December 30, 2006.
New Accounting Pronouncements
Inventory Costs. In November 2004, the Financial Accounting Standards Board (“FASB”) issued Statementof Financial Accounting Standards (“SFAS”) No. 151, Inventory Costs — an Amendment of ARB No. 43, Chapter 4(“SFAS 151”). SFAS 151 clarified the accounting for abnormal amounts of idle facility expense, freight, handlingcosts and wasted material (spoilage). SFAS 151 was effective for fiscal years beginning after June 15, 2005, thecompany’s fiscal 2006, which began January 1, 2006. This pronouncement did not have a material effect on thecompany’s results of operations or financial condition.
Stock Based Compensation. In December 2004, the FASB issued SFAS No. 123R, Share-Based Payment(“SFAS 123R”), which requires the value of stock options and similar awards be expensed. The company adoptedSFAS 123R on January 1, 2006, and applied the modified prospective transition method. This method requires thecompany to expense the remaining unrecognized portion of unvested awards outstanding at the effective date andany awards granted or modified after the effective date but does not require restatement of prior periods. See Note 15of Notes to Consolidated Financial Statements of this Form 10-K for information relating to the company’s stock-based compensation.
Accounting Changes and Error Corrections. In May 2005, the FASB issued SFAS No. 154, AccountingChanges and Error Corrections (“SFAS 154”). SFAS 154 requires that, when a company changes its accountingpolicies, it must apply the change retrospectively to all prior periods presented instead of a cumulative effectadjustment in the period of the change. SFAS 154 may also apply when the FASB issues new rules requiringchanges in accounting. However if the new rule allows cumulative effect treatment, it would take precedence overSFAS 154. This statement was effective for accounting changes and error corrections for the company’s fiscal year2006 which began on January 1, 2006.
Accounting for Uncertainty in Income Taxes. In June 2006, the FASB issued FASB Interpretation No. 48,Accounting for Uncertainty in Income Taxes — an Interpretation of FASB Statement No. 109 (“FIN 48”). FIN 48clarifies the accounting for uncertainty in income taxes in an enterprise’s financial statements in accordance withFASB Statement No. 109, Accounting for Income Taxes. FIN 48 prescribes a recognition threshold and measure-ment attribute for the financial statement recognition and measurement of a tax position taken or expected to betaken in a tax return. FIN 48 also provides guidance on derecognition, classification, interest and penalties,accounting in interim periods, disclosure and transition. FIN 48 is effective for fiscal years beginning afterDecember 15, 2006, which will be the company’s fiscal 2007 beginning December 31, 2006. The impact of thecumulative effect adjustment will be recorded in retained earnings as of December 31, 2006. The companycontinues to assess the impact of FIN 48 on its financial statements; however, the company believes the adoption ofFIN 48 will have an immaterial effect.
Financial Statement Misstatements. In September 2006 the SEC released Staff Accounting Bulletin No. 108,Financial Statement Misstatements (“SAB 108”). SAB 108 expresses the SEC staff’s views regarding the process ofquantifying financial statement misstatements. The interpretations in SAB 108 are being issued to address diversityin practice in quantifying financial statement misstatements and the potential under current practice for the build upof improper amounts on the balance sheet. SAB 108 was effective for annual financial statements covering the firstfiscal year ending after November 15, 2006, which was the company’s fiscal 2006. SAB 108 did not have an effecton the company’s financial statements.
Fair Value Measurements. In September 2006, the FASB issued SFAS No. 157, Fair Value Measurements(“SFAS 157”). SFAS 157 defines fair value, establishes a framework for measuring fair value in generally acceptedaccounting principles, and expands disclosures about fair value measurements. SFAS 157 applies under otheraccounting pronouncements that require or permit fair value measurements, the FASB having previously concludedin those accounting pronouncements that fair value is the relevant measurement attribute. Accordingly, SFAS 157does not require any new fair value measurements. However, for some entities, the application of SFAS 157 willchange current practice. SFAS 157 is effective for fiscal years beginning after November 15, 2007 (the company’s
35

fiscal year 2008), and interim periods within those fiscal years. The company will assess the effect of thispronouncement on its financial statements, but at this time, no material effect is expected.
Employers’ Accounting for Defined Benefit Pension and other Postretirement Plans. In September 2006, theFASB issued SFAS No. 158, Employers’ Accounting for Defined Benefit Pension and other Postretirement Plans,an amendment of FASB Statements No. 87, 88, 106 and 132(R) (“SFAS 158”). SFAS 158 requires recognition of theoverfunded or underfunded status of pension and other postretirement benefit plans on the balance sheet. UnderSFAS 158, gains and losses, prior service costs and credits, and any remaining transition amounts under FASBStatement No. 87, Employers’ Accounting for Pensions (“SFAS 87”) and FASB Statement No. 106, Employers’Accounting for Postretirement Benefits Other Than Pensions (“SFAS 106”) that have not yet been recognizedthrough net periodic benefit costs will be recognized in accumulated other comprehensive income, net of taxbenefits, until they are amortized as a component of net periodic cost. SFAS 158 does not change how pensions andother postretirement benefits are accounted for and reported in the income statement. Companies will continue tofollow the existing guidance in SFAS 87, FASB Statement No. 88, Employers’ Accounting for Settlements andCurtailments of Defined Benefit Pension Plans and for Termination Benefits and SFAS 106. SFAS 158 was effectivefor public companies for fiscal years ending after December 15, 2006. The company adopted the balance sheetrecognition provisions of SFAS 158 at December 30, 2006. See Note 18 of Notes to Consolidated FinancialStatements of this Form 10-K for information relating to the company’s pension and other postretirement plans.SFAS 158 also requires that employers measure the benefit obligation and plan assets as of the fiscal year end forfiscal years ending after December 15, 2008 (the company’s fiscal 2008). The company currently uses aSeptember 30 measurement date for its postretirement benefit plans. The company intends to eliminate the earlymeasurement date in 2007 and this is expected to have an immaterial effect on its financial statements.
Information Regarding Non-GAAP Financial Measures
The company prepares its consolidated financial statements in accordance with GAAP. However, from time totime, the company may present in its public statements, press releases and SEC filings, EBITDA, a non-GAAPfinancial measure, to measure the performance of the company and its operating divisions. EBITDA is used as theprimary performance measure in the company’s Annual Executive Bonus Plan. The company defines EBITDA asearnings from continuing operations before interest, income taxes, depreciation, amortization and minority interest.The company believes that EBITDA is a useful tool for managing the operations of its business and is an indicator ofthe company’s ability to incur and service indebtedness and generate free cash flow. Furthermore, pursuant to theterms of our credit facility, EBITDA is used to determine the company’s compliance with certain financialcovenants. The company also believes that EBITDA measures are commonly reported and widely used by investorsand other interested parties as measures of a company’s operating performance and debt servicing ability becausethey assist in comparing performance on a consistent basis without regard to depreciation or amortization, whichcan vary significantly depending upon accounting methods and non-operating factors (such as historical cost).EBITDA is also a widely-accepted financial indicator of a company’s ability to incur and service indebtedness.
EBITDA should not be considered an alternative to (a) income from operations or net income (loss) as ameasure of operating performance; (b) cash flows provided by operating, investing and financing activities (asdetermined in accordance with GAAP) as a measure of the company’s ability to meet its cash needs; or (c) any otherindicator of performance or liquidity that has been determined in accordance with GAAP. Our method of calculatingEBITDA may differ from the methods used by other companies, and, accordingly, our measure of EBITDA may notbe comparable to similarly titled measures used by other companies.
Item 7A. Quantitative and Qualitative Disclosures About Market Risk
The company uses derivative financial instruments as part of an overall strategy to manage market risk. Thecompany uses forward, futures, swap and option contracts to hedge existing or future exposure to changes in interestrates and commodity prices. The company does not enter into these derivative financial instruments for trading orspeculative purposes. If actual market conditions are less favorable than those anticipated, raw material prices couldincrease significantly, adversely affecting the margins from the sale of our products.
36

The company enters into commodity forward, futures and option contracts and swap agreements for wheatand, to a lesser extent, other commodities in an effort to provide a predictable and consistent commodity price andthereby reduce the impact of volatility in its raw material and packaging prices. At December 30, 2006, the fairmarket value of the company’s commodity derivative portfolio was $2.5 million. Of this fair value, $1.4 million isbased on quoted market prices and $1.1 million is based on models and other valuation methods. $2.6 million,$(0.1) million and an immaterial amount of this fair value relates to instruments that will be utilized in fiscal 2007,fiscal 2008 and fiscal 2009, respectively. A sensitivity analysis has been prepared to estimate the company’sexposure to commodity price risk. Based on the company’s derivative portfolio as of December 30, 2006, ahypothetical ten percent increase in commodity prices under normal market conditions could potentially have a$5.2 million effect on the fair value of the derivative portfolio. The analysis disregards changes in the exposuresinherent in the underlying hedged item; however, the company expects that any gain in fair value of the portfoliowould be substantially offset by increases in raw material and packaging prices.
The cash effects of the company’s commodity derivatives are included in the Consolidated Statement of CashFlows as cash flow from operating activities.
Item 8. Financial Statements and Supplementary Data
Refer to the Index to Consolidated Financial Statements and the Financial Statement Schedule for the requiredinformation.
Item 9. Changes in and Disagreements with Accountants on Accounting and Financial Disclosure
None.
Item 9A. Controls and Procedures
Management’s Evaluation of Disclosure Controls and Procedures:
We have established and maintain a system of disclosure controls and procedures that are designed to ensurethat material information relating to the company, which is required to be timely disclosed by us in reports that wefile or submit under the Securities Exchange Act of 1934 (the “Exchange Act”), is accumulated and communicatedto management in a timely fashion and is recorded, processed, summarized and reported within the time periodsspecified by the SEC’s rules and forms. An evaluation of the effectiveness of the design and operation of ourdisclosure controls and procedures (as defined in Rule 13a-15(e) under the Exchange Act was performed as of theend of the period covered by this annual report. This evaluation was performed under the supervision and with theparticipation of management, including our Chief Executive Officer (“CEO”) and Chief Financial Officer (“CFO”).
Based upon that evaluation, our CEO and CFO have concluded that these disclosure controls and procedureswere effective as of the end of the period covered by this annual report.
Management’s Report on Internal Control Over Financial Reporting:
Our management is responsible for establishing and maintaining adequate internal control over financialreporting, as such term is defined in Exchange Act Rule 13a-15(f). Under the supervision and with the participationof our management, including our CEO and CFO, we conducted an evaluation of the effectiveness of our internalcontrol over financial reporting based on the framework in “Internal Control — Integrated Framework” issued bythe Committee of Sponsoring Organizations of the Treadway Commission. Based on our evaluation under theframework in “Internal Control — Integrated Framework,” our management concluded that our internal controlover financial reporting was effective as of December 30, 2006.
Our management’s assessment of the effectiveness of our internal control over financial reporting as ofDecember 30, 2006 has been audited by PricewaterhouseCoopers LLP, an independent registered public accountingfirm, as stated in their report which is included herein.
37

Changes in Internal Control Over Financial Reporting:
There were no changes in our internal control over financial reporting that occurred during our last fiscalquarter that have materially affected or are reasonably likely to materially affect, our internal control over financialreporting.
Item 9B. Other Information
None.
PART III
Item 10. Directors and Executive Officers of the Registrant
The information required by this item with respect to directors of the company is incorporated herein byreference to the information set forth under the captions “Election of Directors” and “Section 16(a) BeneficialOwnership Reporting Compliance” in the company’s definitive proxy statement for the 2007 Annual Meeting ofShareholders expected to be filed with the SEC on or prior to April 27, 2007 (the “proxy”). The information requiredby this item with respect to executive officers of the company is set forth in Part I of this Form 10-K.
We have adopted the Flowers Foods, Inc. Code of Business Conduct and Ethics for Officers and Members ofthe Board of Directors, which applies to all of our directors and executive officers. The Code of Business Conductand Ethics is publicly available on our website at http://www.flowersfoods.com in the “Corporate Governance”section of the “Investor Center” tab. If we make any substantive amendments to our Code of Business Conduct andEthics or we grant any waiver, including any implicit waiver, from a provision of the Code of Business Conduct andEthics, that applies to any of our directors or executive officers, including our principal executive officer, principalfinancial officer, principal accounting officer or controller, we intend to disclose the nature of the amendment orwaiver on our website at the same location. Alternatively, we may elect to disclose the amendment or waiver in areport on Form 8-K filed with the SEC.
Our Chairman of the Board, President and Chief Executive Officer certified to the New York Stock Exchange(“NYSE”) on June 7, 2006 pursuant to Section 303A.12 of the NYSE’s listing standards, that he was not aware ofany violation by Flowers Foods of the NYSE’s corporate governance listing standards as of that date.
Item 11. Executive Compensation
The information required by this item is incorporated herein by reference to the information set forth under thecaption “Executive Compensation” in the proxy.
Item 12. Security Ownership of Certain Beneficial Owners and Management and Related StockholderMatters
See Item 5 of this Form 10-K for information regarding Securities Authorized for Issuance under EquityCompensation Plans. The remaining information required by this item is incorporated herein by reference to theinformation set forth under the caption “Security Ownership of Certain Beneficial Owners and Management” in theproxy.
Item 13. Certain Relationships and Related Transactions
The information required by this item is incorporated herein by reference to the information set forth under thecaption “Transactions with Management and Others” in the proxy.
Item 14. Principal Accountant Fees and Services
The information required by this item is incorporated herein by reference to the information set forth under thecaption “Principal Accountant Fees and Services” in the proxy.
38

PART IV
Item 15. Exhibits and Financial Statement Schedule
(a) List of documents filed as part of this report.
1. Financial Statements of the Registrant
Report of Independent Registered Public Accounting Firm.
Consolidated Statements of Income for the fifty-two weeks ended December 30, 2006, December 31,2005 and January 1, 2005.
Consolidated Balance Sheets at December 30, 2006 and December 31, 2005.
Consolidated Statements of Changes in Stockholders’ Equity and Comprehensive Income for the fifty-two weeks ended December 30, 2006, December 31, 2005 and January 1, 2005.
Consolidated Statements of Cash Flows for the fifty-two weeks ended December 30, 2006, December 31,2005 and January 1, 2005.
Notes to Consolidated Financial Statements.
2. Financial Statement Schedule of the Registrant
Schedule II — Valuation and Qualifying Accounts — for the fifty-two weeks ended December 30, 2006,December 31, 2005 and January 1, 2005.
3. Exhibits. The following documents are filed as exhibits hereto:
ExhibitNo. Name of Exhibit
2.1 — Distribution Agreement by and between Flowers Industries, Inc. and Flowers Foods, Inc., dated as ofOctober 26, 2000 (Incorporated by reference to Flowers Foods’ Registration Statement on Form 10,dated February 9, 2001, File No. 1-16247).
2.2 — Amendment No. 1 to Distribution Agreement, dated as of March 12, 2001, between Flowers Industries,Inc. and Flowers Foods, Inc. (Incorporated by reference to Flowers Foods’ Annual Report on Form 10-K,dated March 30, 2001, File No. 1-16247).
2.3 — Asset Purchase Agreement dated January 29, 2003 by and among The Schwan Food Company, FlowersFoods, Inc. and Mrs. Smith’s Bakeries, LLC (Incorporated by reference to Flowers Foods’ CurrentReport on Form 8-K dated May 9, 2003).
2.4 — First Amendment to Asset Purchase Agreement dated April 24, 2003 by and among The Schwan FoodCompany, Flowers Foods, Inc. and Mrs. Smith’s Bakeries, LLC (Incorporated by reference to FlowersFoods’ Current Report on Form 8-K dated May 9, 2003).
3.1 — Restated Articles of Incorporation of Flowers Foods, Inc. (Incorporated by reference to Flowers Foods’Annual Report on Form 10-K, dated March 30, 2001, File No. 1-16247).
3.2 — Amended and Restated Bylaws of Flowers Foods, Inc. (Incorporated by reference to Flowers Foods’Current Report on Form 8-K dated June 7, 2006, File No. 1-16247).
4.1 — Share Certificate of Common Stock of Flowers Foods, Inc. (Incorporated by reference to Flowers Foods’Annual Report on Form 10-K, dated March 30, 2001, File No. 1-16247).
4.2 — Rights Agreement between Flowers Foods, Inc. and First Union National Bank, as Rights Agent, datedMarch 23, 2001 (Incorporated by reference to Flowers Foods’ Annual Report on Form 10-K, datedMarch 30, 2001, File No. 1-16247).
4.3 — Amendment No. 1, dated November 15, 2002, to Rights Agreement between Flowers Foods, Inc. andWachovia Bank, N.A. (as successor in interest to First Union National Bank), as rights agent, datedMarch 23, 2001. (Incorporated by reference to Flowers Foods’ Registration Statement on Form 8-A,dated November 18, 2002, File No. 1-16247).
39

ExhibitNo. Name of Exhibit
10.1 — Employee Benefits Agreement by and between Flowers Industries, Inc. and Flowers Foods, Inc., dated asof October 26, 2000 (Incorporated by reference to Flowers Foods’ Registration Statement on Form 10,dated February 9, 2001, File No. 1-16247).
10.2 — First Amendment to Employee Benefits Agreement by and between Flowers Industries, Inc. and FlowersFoods, Inc., dated as of February 6, 2001 (Incorporated by reference to Flowers Foods’ RegistrationStatement on Form 10, dated February 9, 2001, File No. 1-16247).
10.3 — Flowers Foods, Inc. Retirement Plan No. 1 (Incorporated by reference to Flowers Foods’ Annual Reporton Form 10-K, dated March 30, 2001, File No. 1-16247).
10.4 — Flowers Foods, Inc. 2001 Equity and Performance Incentive Plan, as amended and restated as ofFebruary 11, 2005 (Incorporated by reference to Flowers Foods’ Proxy Statement on Schedule 14A,dated April 29, 2005, File No. 1-16247).
10.5 — Debenture Tender Agreement, dated as of March 12, 2001, by and among Flowers Industries, Inc.,Flowers Foods, Inc. and the Holders (Incorporated by reference to Flowers Foods’ Annual Report onForm 10-K, dated March 30, 2001, File No. 1-16247).
10.6 — Employment Agreement, effective as of December 31, 2001, by and between Flowers Foods, Inc. andG. Anthony Campbell. (Incorporated by reference to Flowers Foods’ Annual Report on Form 10-K,dated March 27, 2002, File No. 1-16247).
10.7 — Flowers Foods, Inc. Stock Appreciation Rights Plan. (Incorporated by reference to Flowers Foods’Annual Report on Form 10-K, dated March 27, 2002, File No. 1-16247).
10.8 — Flowers Foods, Inc. Annual Executive Bonus Plan. (Incorporated by reference to Flowers Foods’ AnnualReport on Form 10-K, dated March 27, 2002, File No. 1-16247).
10.9 — Flowers Foods, Inc. Supplemental Executive Retirement Plan. (Incorporated by reference to FlowersFoods’ Annual Report on Form 10-K, dated March 27, 2002, File No. 1-16247).
10.10 — Form of Indemnification Agreement, by and between Flowers Foods, Inc., certain executive officers andthe directors of Flowers Foods, Inc. (Incorporated by reference to Flowers Foods’ Annual Report onForm 10-K, dated March 28, 2003, File No. 1-16247).
10.11 — Form of Separation Agreement, by and between Flowers Foods, Inc. and certain executive officers ofFlowers Foods, Inc. (Incorporated by reference to Flowers Foods’ Annual Report on Form 10-K datedMarch 1, 2006, File No. 1-16247).
10.12 — Restricted Stock Agreement, dated as of January 4, 2004, by and between Flowers Foods, Inc. andGeorge E. Deese. (Incorporated by reference to Flowers Foods’ Annual Report on Form 10-K datedMarch 18, 2004, File No. 1-16247).
10.13 — Consulting Agreement by and between Flowers Foods, Inc. and Amos R. McMullian dated as ofJanuary 1, 2005. (Incorporated by reference to Flowers Foods’ Current Report on Form 8-K datedJanuary 3, 2005, File No. 1-16247).
10.14 — Amended and Restated Credit Agreement, dated as of October 29, 2004, among Flowers Foods, Inc., theLenders party thereto from time to time, Fleet National Bank, Harris Trust and Savings Bank andCooperative CentraleRaiffeisen-Boerenleen Bank, B.A., New York Branch, as co-documentation agents,SunTrust Bank, as syndication agent and Deutsche Bank AG, New York Branch, as administrative agent.(Incorporated by reference to Flowers Foods’ Current Report on Form 8-K dated November 2, 2004, FileNo. 1-16247).
10.15 — Ninth Amendment dated November 7, 2005 to the Flowers Foods, Inc. Retirement Plan No. 1 asAmended and restated effective as of March 26, 2001. (Incorporated by reference to Flowers Foods’Quarterly Report on Form 10-Q dated November 17, 2005, File No. 1-16247).
10.16 — Form of Restricted Stock Agreement, by and between Flowers Foods, Inc. and certain executive officersof Flowers Foods, Inc. (Incorporated by reference to Flowers Foods’ Annual Report on Form 10-K datedMarch 1, 2006, File No. 1-16247).
10.17 — Form of Option Agreement, by and between Flowers Foods, Inc. and certain executive officers ofFlowers Foods, Inc. (Incorporated by reference to Flowers Foods’ Annual Report on Form 10-K datedMarch 1, 2006, File No. 1-16247).
40

ExhibitNo. Name of Exhibit
10.18 — Amended and Restated Credit Agreement, dated as of June 6, 2006, among Flowers Foods, Inc., theLenders Party thereto from time to time, Bank of America N.A., Harris N.A. and Cooperative CentraleRaiffeisen-Boerenleen Bank, B.A., “Rabsbank International”, New York Branch, as co-documentationagents, SunTrust Bank, as syndication agent, and Deutsche Bank AG, New York Branch, asadministrative agent. (Incorporated by reference to Flowers Foods’ Current Report on Form 8-Kdated June 7, 2006, File No. 1-16247).
*10.19 — First Amendment dated August 25, 2006 to the Flowers Foods, Inc. 2001 Equity and PerformanceIncentive Plan, as previously amended and restated as of February 11, 2005.
*10.20 — Second Amendment dated January 2, 2007 to the Flowers Foods, Inc. 2001 Equity and PerformanceIncentive Plan, as previously amended and restated as of February 11, 2005.
*10.21 — Third Amendment dated January 23, 2007 to the Flowers Foods, Inc. 2001 Equity and PerformanceIncentive Plan, as previously amended and restated as of February 11, 2005.
*21 — Subsidiaries of Flowers Foods, Inc.
*23 — Consent of PricewaterhouseCoopers LLP.
*31.1 — Certification of Chief Executive Officer pursuant to Section 302 of the Sarbanes-Oxley Act of 2002.
*31.2 — Certification of Chief Financial Officer pursuant to Section 302 of the Sarbanes-Oxley Act of 2002.
*32 — Certification Pursuant to 18 U.S.C. Section 1350, as Adopted Pursuant to Section 906 of the Sarbanes-Oxley Act of 2002, by George E. Deese, Chief Executive Officer, and Jimmy M. Woodward, ChiefFinancial Officer, for the Fiscal Year Ended December 30, 2006.
* Filed herewith
41

SIGNATURES
Pursuant to the requirements of Section 13 and 15(d) of the Securities Exchange Act of 1934, Flowers Foods,Inc. has duly caused this Form 10-K to be signed on its behalf by the undersigned, thereunto duly authorized on this28th day of February, 2007.
FLOWERS FOODS, INC.
/s/ GEORGE E. DEESEGeorge E. Deese
Chairman of the Board, President andChief Executive Officer
/s/ JIMMY M. WOODWARDJimmy M. Woodward
Senior Vice President, Chief FinancialOfficer and Chief Accounting Officer
42

Pursuant to the requirements of the Securities Exchange Act of 1934, this Form 10-K has been signed below bythe following persons on behalf of Flowers Foods, Inc. and in the capacities and on the dates indicated.
Signature Title Date
/s/ GEORGE E. DEESEGeorge E. Deese
Chairman of the Board, President andChief Executive Officer
February 28, 2007
/s/ JIMMY M. WOODWARDJimmy M. Woodward
Senior Vice President, Chief FinancialOfficer and Chief Accounting Officer
February 28, 2007
/s/ JOE E. BEVERLYJoe E. Beverly
Director February 28, 2007
/s/ FRANKLIN L. BURKEFranklin L. Burke
Director February 28, 2007
/s/ MANUEL A. FERNANDEZManuel A. Fernandez
Director February 28, 2007
/s/ BENJAMIN H. GRISWOLD, IVBenjamin H. Griswold, IV
Director February 28, 2007
/s/ JOSEPH L. LANIER, Jr.Joseph L. Lanier, Jr.
Director February 28, 2007
/s/ AMOS R. MCMULLIANAmos R. McMullian
Director February 28, 2007
/s/ J.V. SHIELDS, JR.J.V. Shields, Jr.
Director February 28, 2007
/s/ MELVIN T. STITH, PH.D.Melvin T. Stith, Ph.D.
Director February 28, 2007
/s/ JACKIE M. WARD
Jackie M. Ward
Director February 28, 2007
/s/ C. MARTIN WOOD IIIC. Martin Wood III
Director February 28, 2007
43

FLOWERS FOODS, INC. AND SUBSIDIARIES
INDEX TO CONSOLIDATED FINANCIAL STATEMENTS
Page
Report of Independent Registered Public Accounting Firm. . . . . . . . . . . . . . . . . . . . . . . . . . . . . . . . . . . F-2
Consolidated Statements of Income for the fifty-two weeks ended December 30, 2006, December 31,2005 and January 1, 2005 . . . . . . . . . . . . . . . . . . . . . . . . . . . . . . . . . . . . . . . . . . . . . . . . . . . . . . . . . F-4
Consolidated Balance Sheets at December 30, 2006 and December 31, 2005. . . . . . . . . . . . . . . . . . . . . F-5Consolidated Statements of Changes in Stockholders’ Equity and Comprehensive Income for the fifty-
two weeks ended December 30, 2006, December 31, 2005 and January 1, 2005 . . . . . . . . . . . . . . . . . F-6Consolidated Statements of Cash Flows for the fifty-two weeks ended December 30, 2006,
December 31, 2005 and January 1, 2005 . . . . . . . . . . . . . . . . . . . . . . . . . . . . . . . . . . . . . . . . . . . . . . F-7Notes to Consolidated Financial Statements . . . . . . . . . . . . . . . . . . . . . . . . . . . . . . . . . . . . . . . . . . . . . . F-8
F-1

REPORT OF INDEPENDENT REGISTERED PUBLIC ACCOUNTING FIRM
To The Board of Directors and Stockholders of Flowers Foods, Inc.:
We have completed integrated audits of Flowers Foods, Inc.’s consolidated financial statements and of itsinternal control over financial reporting as of December 30, 2006 in accordance with the standards of the PublicCompany Accounting Oversight Board (United States). Our opinions, based on our audits, are presented below.
Consolidated financial statements and financial statement schedule
In our opinion, the consolidated financial statements listed in the index appearing under Item 15(a)(1), presentfairly, in all material respects, the financial position of Flowers Foods, Inc. and its subsidiaries (the “Company”) atDecember 30, 2006 and December 31, 2005 and the results of their operations and their cash flows for each of thethree years in the period ended December 30, 2006 in conformity with accounting principles generally accepted inthe United States of America. In addition, in our opinion, the financial statement schedule listed in the indexappearing under Item 15(a)(2) presents fairly, in all material respects, the information set forth therein when read inconjunction with the related consolidated financial statements. These financial statements and financial statementschedule are the responsibility of the Company’s management. Our responsibility is to express an opinion on thesefinancial statements and financial statement schedule based on our audits. We conducted our audits of thesestatements in accordance with the standards of the Public Company Accounting Oversight Board (United States).Those standards require that we plan and perform the audit to obtain reasonable assurance about whether thefinancial statements are free of material misstatement. An audit of financial statements includes examining, on a testbasis, evidence supporting the amounts and disclosures in the financial statements, assessing the accountingprinciples used and significant estimates made by management, and evaluating the overall financial statementpresentation. We believe that our audits provide a reasonable basis for our opinion.
As discussed in Note 15 to the consolidated financial statements, the company changed the manner in which itaccounts for stock-based compensation in 2006.
As discussed in Note 18 to the consolidated financial statements, the company changed the manner in which itaccounts for its defined benefit and postretirement plans effective December 30, 2006.
Internal control over financial reporting
Also, in our opinion, management’s assessment, included in Management’s Report on Internal Control OverFinancial Reporting appearing under Item 9A, that the Company maintained effective internal control over financialreporting as of December 30, 2006 based on criteria established in Internal Control — Integrated Framework issuedby the Committee of Sponsoring Organizations of the Treadway Commission (COSO), is fairly stated, in allmaterial respects, based on those criteria. Furthermore, in our opinion, the Company maintained, in all materialrespects, effective internal control over financial reporting as of December 30, 2006, based on criteria established inInternal Control — Integrated Framework issued by the COSO. The Company’s management is responsible formaintaining effective internal control over financial reporting and for its assessment of the effectiveness of internalcontrol over financial reporting. Our responsibility is to express opinions on management’s assessment and on theeffectiveness of the Company’s internal control over financial reporting based on our audit. We conducted our auditof internal control over financial reporting in accordance with the standards of the Public Company AccountingOversight Board (United States). Those standards require that we plan and perform the audit to obtain reasonableassurance about whether effective internal control over financial reporting was maintained in all material respects.An audit of internal control over financial reporting includes obtaining an understanding of internal control overfinancial reporting, evaluating management’s assessment, testing and evaluating the design and operating effec-tiveness of internal controls, and performing such other procedures as we consider necessary in the circumstances.We believe that our audit provides a reasonable basis for our opinions.
A company’s internal control over financial reporting is a process designed to provide reasonable assuranceregarding the reliability of financial reporting and the preparation of financial statements for external purposes inaccordance with generally accepted accounting principles. A company’s internal control over financial reportingincludes those policies and procedures that (i) pertain to the maintenance of records that, in reasonable detail,
F-2

accurately and fairly reflect the transactions and dispositions of the assets of the company; (ii) provide reasonableassurance that transactions are recorded as necessary to permit preparation of financial statements in accordancewith generally accepted accounting principles, and that receipts and expenditures of the company are being madeonly in accordance with authorizations of management and directors of the company; and (iii) provide reasonableassurance regarding prevention or timely detection of unauthorized acquisition, use, or disposition of the company’sassets that could have a material effect on the financial statements.
Because of its inherent limitations, internal control over financial reporting may not prevent or detectmisstatements. Also, projections of any evaluation of effectiveness to future periods are subject to the risk thatcontrols may become inadequate because of changes in conditions, or that the degree of compliance with thepolicies or procedures may deteriorate.
/s/ PricewaterhouseCoopers LLP
PricewaterhouseCoopers LLPAtlanta, GeorgiaFebruary 28, 2007
F-3
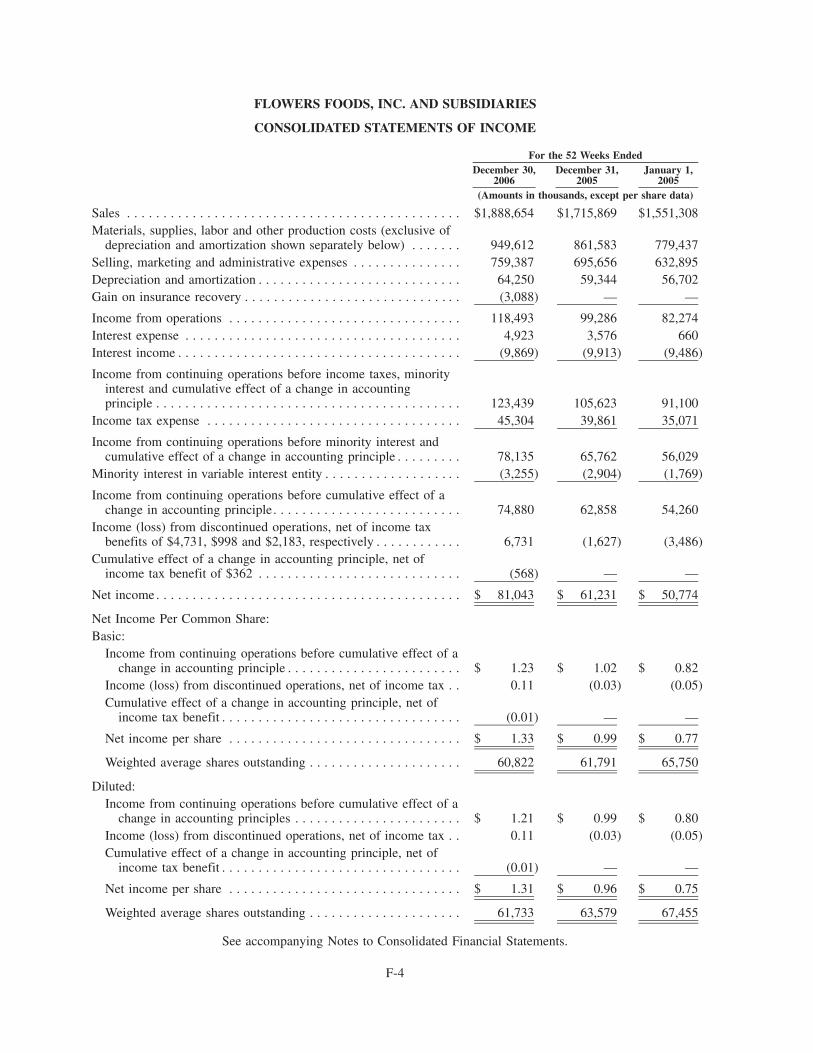
FLOWERS FOODS, INC. AND SUBSIDIARIES
CONSOLIDATED STATEMENTS OF INCOME
December 30,2006
December 31,2005
January 1,2005
For the 52 Weeks Ended
(Amounts in thousands, except per share data)
Sales . . . . . . . . . . . . . . . . . . . . . . . . . . . . . . . . . . . . . . . . . . . . . . $1,888,654 $1,715,869 $1,551,308Materials, supplies, labor and other production costs (exclusive of
depreciation and amortization shown separately below) . . . . . . . 949,612 861,583 779,437Selling, marketing and administrative expenses . . . . . . . . . . . . . . . 759,387 695,656 632,895Depreciation and amortization . . . . . . . . . . . . . . . . . . . . . . . . . . . . 64,250 59,344 56,702Gain on insurance recovery . . . . . . . . . . . . . . . . . . . . . . . . . . . . . . (3,088) — —
Income from operations . . . . . . . . . . . . . . . . . . . . . . . . . . . . . . . . 118,493 99,286 82,274Interest expense . . . . . . . . . . . . . . . . . . . . . . . . . . . . . . . . . . . . . . 4,923 3,576 660Interest income . . . . . . . . . . . . . . . . . . . . . . . . . . . . . . . . . . . . . . . (9,869) (9,913) (9,486)
Income from continuing operations before income taxes, minorityinterest and cumulative effect of a change in accountingprinciple . . . . . . . . . . . . . . . . . . . . . . . . . . . . . . . . . . . . . . . . . . 123,439 105,623 91,100
Income tax expense . . . . . . . . . . . . . . . . . . . . . . . . . . . . . . . . . . . 45,304 39,861 35,071
Income from continuing operations before minority interest andcumulative effect of a change in accounting principle . . . . . . . . . 78,135 65,762 56,029
Minority interest in variable interest entity . . . . . . . . . . . . . . . . . . . (3,255) (2,904) (1,769)
Income from continuing operations before cumulative effect of achange in accounting principle. . . . . . . . . . . . . . . . . . . . . . . . . . 74,880 62,858 54,260
Income (loss) from discontinued operations, net of income taxbenefits of $4,731, $998 and $2,183, respectively . . . . . . . . . . . . 6,731 (1,627) (3,486)
Cumulative effect of a change in accounting principle, net ofincome tax benefit of $362 . . . . . . . . . . . . . . . . . . . . . . . . . . . . (568) — —
Net income . . . . . . . . . . . . . . . . . . . . . . . . . . . . . . . . . . . . . . . . . . $ 81,043 $ 61,231 $ 50,774
Net Income Per Common Share:Basic:
Income from continuing operations before cumulative effect of achange in accounting principle . . . . . . . . . . . . . . . . . . . . . . . . $ 1.23 $ 1.02 $ 0.82
Income (loss) from discontinued operations, net of income tax . . 0.11 (0.03) (0.05)Cumulative effect of a change in accounting principle, net of
income tax benefit . . . . . . . . . . . . . . . . . . . . . . . . . . . . . . . . . (0.01) — —
Net income per share . . . . . . . . . . . . . . . . . . . . . . . . . . . . . . . . $ 1.33 $ 0.99 $ 0.77
Weighted average shares outstanding . . . . . . . . . . . . . . . . . . . . . 60,822 61,791 65,750
Diluted:Income from continuing operations before cumulative effect of a
change in accounting principles . . . . . . . . . . . . . . . . . . . . . . . $ 1.21 $ 0.99 $ 0.80Income (loss) from discontinued operations, net of income tax . . 0.11 (0.03) (0.05)Cumulative effect of a change in accounting principle, net of
income tax benefit . . . . . . . . . . . . . . . . . . . . . . . . . . . . . . . . . (0.01) — —
Net income per share . . . . . . . . . . . . . . . . . . . . . . . . . . . . . . . . $ 1.31 $ 0.96 $ 0.75
Weighted average shares outstanding . . . . . . . . . . . . . . . . . . . . . 61,733 63,579 67,455
See accompanying Notes to Consolidated Financial Statements.
F-4

FLOWERS FOODS, INC. AND SUBSIDIARIES
CONSOLIDATED BALANCE SHEETS
December 30, 2006 December 31, 2005(Amounts in thousands, except
share data)
ASSETSCurrent Assets:
Cash and cash equivalents . . . . . . . . . . . . . . . . . . . . . . . . . . . . . . . . . . . . . . . . . . . . . $ 13,914 $ 11,001
Accounts and notes receivable, net . . . . . . . . . . . . . . . . . . . . . . . . . . . . . . . . . . . . . . . . 131,879 120,751
Inventories, net:Raw materials . . . . . . . . . . . . . . . . . . . . . . . . . . . . . . . . . . . . . . . . . . . . . . . . . . . . 12,573 11,042Packaging materials . . . . . . . . . . . . . . . . . . . . . . . . . . . . . . . . . . . . . . . . . . . . . . . . 10,539 10,055Finished goods . . . . . . . . . . . . . . . . . . . . . . . . . . . . . . . . . . . . . . . . . . . . . . . . . . . 20,613 21,704
43,725 42,801
Spare parts and supplies . . . . . . . . . . . . . . . . . . . . . . . . . . . . . . . . . . . . . . . . . . . . . . . 25,724 23,241
Deferred income taxes . . . . . . . . . . . . . . . . . . . . . . . . . . . . . . . . . . . . . . . . . . . . . . . . 11,679 7,561
Other . . . . . . . . . . . . . . . . . . . . . . . . . . . . . . . . . . . . . . . . . . . . . . . . . . . . . . . . . . . 15,195 32,215
242,116 237,570
Property, Plant and Equipment:Land . . . . . . . . . . . . . . . . . . . . . . . . . . . . . . . . . . . . . . . . . . . . . . . . . . . . . . . . . . . 38,849 36,615Buildings . . . . . . . . . . . . . . . . . . . . . . . . . . . . . . . . . . . . . . . . . . . . . . . . . . . . . . . . 252,729 222,131Machinery and equipment . . . . . . . . . . . . . . . . . . . . . . . . . . . . . . . . . . . . . . . . . . . . . 583,685 550,303Furniture, fixtures and transportation equipment . . . . . . . . . . . . . . . . . . . . . . . . . . . . . . . 85,689 82,777Construction in progress . . . . . . . . . . . . . . . . . . . . . . . . . . . . . . . . . . . . . . . . . . . . . . . 16,160 29,480
977,112 921,306Less: accumulated depreciation . . . . . . . . . . . . . . . . . . . . . . . . . . . . . . . . . . . . . . . . (512,670) (469,385)
464,442 451,921
Notes Receivable . . . . . . . . . . . . . . . . . . . . . . . . . . . . . . . . . . . . . . . . . . . . . . . . . . . . . 74,428 70,357
Assets Held for Sale — Distributor Routes . . . . . . . . . . . . . . . . . . . . . . . . . . . . . . . . . . . . 22,908 16,382
Other Assets . . . . . . . . . . . . . . . . . . . . . . . . . . . . . . . . . . . . . . . . . . . . . . . . . . . . . . . . 3,038 2,667
Goodwill . . . . . . . . . . . . . . . . . . . . . . . . . . . . . . . . . . . . . . . . . . . . . . . . . . . . . . . . . . 75,537 58,567
Other Intangible Assets, net . . . . . . . . . . . . . . . . . . . . . . . . . . . . . . . . . . . . . . . . . . . . . . 24,121 13,605
$ 906,590 $ 851,069
LIABILITIES AND STOCKHOLDERS’ EQUITYCurrent Liabilities:
Current maturities of long-term debt and capital leases . . . . . . . . . . . . . . . . . . . . . . . . . . . $ 7,406 $ 4,652Accounts payable . . . . . . . . . . . . . . . . . . . . . . . . . . . . . . . . . . . . . . . . . . . . . . . . . . . 90,945 83,801Other accrued liabilities . . . . . . . . . . . . . . . . . . . . . . . . . . . . . . . . . . . . . . . . . . . . . . . 86,891 85,822
185,242 174,275
Long-Term Debt and Capital Leases . . . . . . . . . . . . . . . . . . . . . . . . . . . . . . . . . . . . . . . . 79,126 74,403
Other Liabilities:Post-retirement/post-employment obligations . . . . . . . . . . . . . . . . . . . . . . . . . . . . . . . . . 146 9,728Deferred income taxes . . . . . . . . . . . . . . . . . . . . . . . . . . . . . . . . . . . . . . . . . . . . . . . . 47,394 42,569Other . . . . . . . . . . . . . . . . . . . . . . . . . . . . . . . . . . . . . . . . . . . . . . . . . . . . . . . . . . . 25,949 33,160
73,489 85,457
Minority Interest in Variable Interest Entity . . . . . . . . . . . . . . . . . . . . . . . . . . . . . . . . . . . . 5,870 4,563
Commitments and Contingencies (Note 21) . . . . . . . . . . . . . . . . . . . . . . . . . . . . . . . . . . . .Stockholders’ Equity:
Preferred Stock — $100 par value, authorized 100,000 shares and none issued . . . . . . . . . . .Preferred Stock — $.01 par value, authorized 900,000 shares and none issued . . . . . . . . . . . .Common Stock — $.01 par value, 100,000,000 authorized shares, 67,775,496 shares and
67,775,496 shares issued, respectively . . . . . . . . . . . . . . . . . . . . . . . . . . . . . . . . . . . . 678 678Treasury stock — 7,324,865 shares and 7,457,637 shares, respectively . . . . . . . . . . . . . . . . . (162,368) (148,747)Capital in excess of par value . . . . . . . . . . . . . . . . . . . . . . . . . . . . . . . . . . . . . . . . . . . 482,157 474,708Retained earnings . . . . . . . . . . . . . . . . . . . . . . . . . . . . . . . . . . . . . . . . . . . . . . . . . . . 250,616 198,567Unearned compensation . . . . . . . . . . . . . . . . . . . . . . . . . . . . . . . . . . . . . . . . . . . . . . . — (898)Accumulated other comprehensive loss . . . . . . . . . . . . . . . . . . . . . . . . . . . . . . . . . . . . . (8,220) (11,937)
562,863 512,371
$ 906,590 $ 851,069
See accompanying Notes to Consolidated Financial Statements.
F-5

FL
OW
ER
SF
OO
DS,
INC
.AN
DSU
BSI
DIA
RIE
S
CO
NSO
LID
AT
ED
STA
TE
ME
NT
SO
FC
HA
NG
ES
INST
OC
KH
OL
DE
RS’
EQ
UIT
YA
ND
CO
MP
RE
HE
NSI
VE
INC
OM
E
Com
preh
ensi
veIn
com
e(L
oss)
Num
ber
ofSh
ares
Issu
edP
arV
alue
Cap
ital
inE
xces
sof
Par
Val
ueR
etai
ned
Ear
ning
s
Acc
umul
ated
Oth
erC
ompr
ehen
sive
Inco
me
(Los
s)N
umbe
rof
Shar
esC
ost
Une
arne
dC
ompe
nsat
ion
Tot
al
Tre
asur
ySt
ock
Com
mon
Stoc
k
(Am
ount
sin
thou
sand
s,ex
cept
shar
eda
ta)
Bal
ance
sat
Janu
ary
3,20
04.
..
..
..
..
..
..
..
..
..
..
..
..
..
..
..
..
..
..
..
..
45,1
85,1
21$4
52$4
86,7
39$1
30,9
81$(
18,3
78)
(876
,104
)$
(22,
143)
$—
$57
7,65
1N
etin
com
e.
..
..
..
..
..
..
..
..
..
..
..
..
..
..
..
..
..
..
..
..
..
..
..
..
.$5
0,77
450
,774
50,7
74D
eriv
ativ
ein
stru
men
ts.
..
..
..
..
..
..
..
..
..
..
..
..
..
..
..
..
..
..
..
..
..
.(9
,414
)(9
,414
)(9
,414
)R
educ
tion
inm
inim
umpe
nsio
nlia
bilit
y.
..
..
..
..
..
..
..
..
..
..
..
..
..
..
..
..
.5,
082
5,08
25,
082
Com
preh
ensi
vein
com
e.
..
..
..
..
..
..
..
..
..
..
..
..
..
..
..
..
..
..
..
..
.$4
6,44
2
Stoc
kre
purc
hase
s.
..
..
..
..
..
..
..
..
..
..
..
..
..
..
..
..
..
..
..
..
..
..
.(1
,381
,113
)(3
5,29
6)(3
5,29
6)Ex
erci
seof
stoc
kop
tions
(incl
udes
inco
me
tax
bene
fits
of$2
,000
).
..
..
..
..
..
..
..
..
..
.(2
,285
)15
3,62
93,
467
1,18
2Is
suan
ceof
Res
trict
edSt
ock
Awar
ds.
..
..
..
..
..
..
..
..
..
..
..
..
..
..
..
..
..
.22
63,5
201,
606
(1,6
28)
—A
mor
tizat
ion
ofR
estri
cted
Stoc
kAw
ards
..
..
..
..
..
..
..
..
..
..
..
..
..
..
..
..
..
525
525
Div
iden
dspa
id—
$0.3
16pe
rco
mm
onsh
are
..
..
..
..
..
..
..
..
..
..
..
..
..
..
..
..
(20,
767)
(20,
767)
Bal
ance
sat
Janu
ary
1,20
05.
..
..
..
..
..
..
..
..
..
..
..
..
..
..
..
..
..
..
..
..
45,1
85,1
21$4
52$4
84,4
76$1
60,9
88$(
22,7
10)
(2,0
40,0
68)
$(5
2,36
6)$(
1,10
3)$
569,
737
Net
Inco
me
..
..
..
..
..
..
..
..
..
..
..
..
..
..
..
..
..
..
..
..
..
..
..
..
..
$61,
231
61,2
3161
,231
Der
ivat
ive
inst
rum
ents
..
..
..
..
..
..
..
..
..
..
..
..
..
..
..
..
..
..
..
..
..
..
7,72
97,
729
7,72
9R
educ
tion
inm
inim
umpe
nsio
nlia
bilit
y.
..
..
..
..
..
..
..
..
..
..
..
..
..
..
..
..
.3,
044
3,04
43,
044
Com
preh
ensi
vein
com
e.
..
..
..
..
..
..
..
..
..
..
..
..
..
..
..
..
..
..
..
..
.$7
2,00
4
Adj
ustm
entf
or3-
for-
2st
ock
split
(See
Not
e14
)..
..
..
..
..
..
..
..
..
..
..
..
..
..
..
22,5
90,3
7522
6(2
26)
(2,3
88,7
03)
—St
ock
repu
rcha
ses
..
..
..
..
..
..
..
..
..
..
..
..
..
..
..
..
..
..
..
..
..
..
..
(4,1
81,8
15)
(124
,388
)(1
24,3
88)
Exer
cise
ofst
ock
optio
ns(in
clud
esin
com
eta
xbe
nefit
sof
$11,
162)
..
..
..
..
..
..
..
..
..
.(9
,715
)1,
127,
891
27,3
2017
,605
Issu
ance
and
vest
ing
ofR
estri
cted
Stoc
kAw
ards
(incl
udes
inco
me
tax
bene
fits
of$4
8).
..
..
..
..
161
20,4
9656
6(6
79)
48C
ontin
gent
shar
eis
suan
ce.
..
..
..
..
..
..
..
..
..
..
..
..
..
..
..
..
..
..
..
..
.12
4,56
212
113
3A
mor
tizat
ion
ofR
estri
cted
Stoc
kAw
ards
..
..
..
..
..
..
..
..
..
..
..
..
..
..
..
..
..
884
884
Div
iden
dspa
id—
$0.3
83pe
rco
mm
onsh
are
..
..
..
..
..
..
..
..
..
..
..
..
..
..
..
..
(23,
652)
(23,
652)
Bal
ance
sat
Dec
embe
r31
,200
5.
..
..
..
..
..
..
..
..
..
..
..
..
..
..
..
..
..
..
..
67,7
75,4
96$6
78$4
74,7
08$1
98,5
67$(
11,9
37)
(7,4
57,6
37)
$(14
8,74
7)$
(898
)$
512,
371
Rec
lass
ifica
tion
due
toch
ange
inac
coun
ting
prin
cipl
e(S
eeN
ote
15)
..
..
..
..
..
..
..
..
..
(898
)89
80
Cum
ulat
ive
effe
ctof
chan
gein
acco
untin
gpr
inci
ple
(See
Not
e18
)..
..
..
..
..
..
..
..
..
..
(9,6
30)
(9,6
30)
Net
inco
me
..
..
..
..
..
..
..
..
..
..
..
..
..
..
..
..
..
..
..
..
..
..
..
..
..
$81,
043
81,0
4381
,043
Der
ivat
ive
inst
rum
ents
..
..
..
..
..
..
..
..
..
..
..
..
..
..
..
..
..
..
..
..
..
..
(878
)(8
78)
(878
)R
educ
tion
inun
reco
gniz
edlo
ssan
dpr
ior
serv
ice
cost
..
..
..
..
..
..
..
..
..
..
..
..
..
.14
,225
14,2
2514
,225
Com
preh
ensi
vein
com
e.
..
..
..
..
..
..
..
..
..
..
..
..
..
..
..
..
..
..
..
..
.$9
4,39
0
Stoc
kre
purc
hase
s.
..
..
..
..
..
..
..
..
..
..
..
..
..
..
..
..
..
..
..
..
..
..
.(2
,326
,300
)(6
3,61
7)(6
3,61
7)Ex
erci
seof
stoc
kop
tions
(incl
udes
inco
me
tax
bene
fits
of$8
,529
).
..
..
..
..
..
..
..
..
..
.(5
,572
)99
8,33
020
,459
14,8
87Is
suan
cean
dve
stin
gof
rest
ricte
dst
ock
awar
ds(in
clud
esin
com
eta
xbe
nefit
sof
$86)
..
..
..
..
..
(3,1
60)
161,
340
3,25
191
Rev
ersi
onof
rest
ricte
dst
ock
awar
d.
..
..
..
..
..
..
..
..
..
..
..
..
..
..
..
..
..
..
13(6
00)
(13)
—R
estri
cted
stoc
kaw
ard
com
pens
atio
n.
..
..
..
..
..
..
..
..
..
..
..
..
..
..
..
..
..
.3,
015
3,01
5St
ock
optio
nco
mpe
nsat
ion
..
..
..
..
..
..
..
..
..
..
..
..
..
..
..
..
..
..
..
..
.3,
950
3,95
0St
ock
issu
edfo
racq
uisi
tion
..
..
..
..
..
..
..
..
..
..
..
..
..
..
..
..
..
..
..
..
.10
,101
1,30
0,00
226
,299
36,4
00D
ivid
ends
paid
—$0
.475
per
com
mon
shar
e.
..
..
..
..
..
..
..
..
..
..
..
..
..
..
..
.(2
8,99
4)(2
8,99
4)
Bal
ance
sat
Dec
embe
r30
,200
6.
..
..
..
..
..
..
..
..
..
..
..
..
..
..
..
..
..
..
..
67,7
75,4
96$6
78$4
82,1
57$2
50,6
16$
(8,2
20)
(7,3
24,8
65)
$(16
2,36
8)$
0$
562,
863
See
acco
mpa
nyin
gN
otes
toC
onso
lidat
edFi
nanc
ial
Stat
emen
ts
F-6

FLOWERS FOODS, INC. AND SUBSIDIARIES
CONSOLIDATED STATEMENTS OF CASH FLOWS
December 30,2006
December 31,2005
January 1,2005
For the 52 Weeks Ended
(Amounts in thousands)
Cash flows provided by (disbursed for) operating activities:Net income . . . . . . . . . . . . . . . . . . . . . . . . . . . . . . . . . . . . . . . . . . . . . . . . . $ 81,043 $ 61,231 $ 50,774Adjustments to reconcile net income to net cash provided by operating activities:
Non-cash expenses related to discontinued operations . . . . . . . . . . . . . . . . . . . . (5,509) 625 5,099Cumulative effect of a change in accounting principle . . . . . . . . . . . . . . . . . . . . 930 — —Depreciation and amortization . . . . . . . . . . . . . . . . . . . . . . . . . . . . . . . . . . . 64,250 59,344 56,702Stock based compensation . . . . . . . . . . . . . . . . . . . . . . . . . . . . . . . . . . . . . . 8,595 4,232 8,746Income tax benefit related to stock awards . . . . . . . . . . . . . . . . . . . . . . . . . . . — 11,210 2,000Deferred income taxes . . . . . . . . . . . . . . . . . . . . . . . . . . . . . . . . . . . . . . . . (11,644) 12,408 34,232Write-off of certain distributor notes . . . . . . . . . . . . . . . . . . . . . . . . . . . . . . . — 816 —Provision for inventory obsolescence . . . . . . . . . . . . . . . . . . . . . . . . . . . . . . . 910 696 498Allowances for accounts receivable . . . . . . . . . . . . . . . . . . . . . . . . . . . . . . . . 717 1,211 854Reserve for hedging counterparty receivable (See Note 8) . . . . . . . . . . . . . . . . . 229 917 —Minority interest in variable interest entity . . . . . . . . . . . . . . . . . . . . . . . . . . . 3,255 2,904 1,769Other. . . . . . . . . . . . . . . . . . . . . . . . . . . . . . . . . . . . . . . . . . . . . . . . . . . . (731) 3,714 (1,278)
Changes in assets and liabilities, net of acquisitions and disposals:Accounts receivable, net . . . . . . . . . . . . . . . . . . . . . . . . . . . . . . . . . . . . . . . (7,314) (1,708) (18,328)Inventories, net . . . . . . . . . . . . . . . . . . . . . . . . . . . . . . . . . . . . . . . . . . . . . (844) (5,371) (6,130)Other assets . . . . . . . . . . . . . . . . . . . . . . . . . . . . . . . . . . . . . . . . . . . . . . . 20,580 (17,658) (23,034)Pension obligations . . . . . . . . . . . . . . . . . . . . . . . . . . . . . . . . . . . . . . . . . . (14,000) (25,000) (17,000)Accounts payable and other accrued liabilities . . . . . . . . . . . . . . . . . . . . . . . . . 10,809 4,408 32,847Facility closing costs and severance . . . . . . . . . . . . . . . . . . . . . . . . . . . . . . . . — — (4,683)
Net cash provided by operating activities . . . . . . . . . . . . . . . . . . . . . . . . . . . . . . 151,276 113,979 123,068
Cash flows provided by (disbursed for) investing activities:Purchase of property, plant and equipment . . . . . . . . . . . . . . . . . . . . . . . . . . . (61,792) (58,846) (46,029)(Increase) decrease of notes receivable, net . . . . . . . . . . . . . . . . . . . . . . . . . . . (4,955) 2,011 (798)Acquisition of businesses, net of cash acquired . . . . . . . . . . . . . . . . . . . . . . . . (887) (9,867) (8,599)Consolidation of variable interest entity . . . . . . . . . . . . . . . . . . . . . . . . . . . . . — — 1,527Other. . . . . . . . . . . . . . . . . . . . . . . . . . . . . . . . . . . . . . . . . . . . . . . . . . . . (4,082) (3,751) 93
Net cash disbursed for investing activities . . . . . . . . . . . . . . . . . . . . . . . . . . . . . (71,716) (70,453) (53,806)
Cash flows provided by (disbursed for) financing activities:Dividends paid . . . . . . . . . . . . . . . . . . . . . . . . . . . . . . . . . . . . . . . . . . . . . (28,994) (23,652) (20,767)Exercise of stock options . . . . . . . . . . . . . . . . . . . . . . . . . . . . . . . . . . . . . . . 6,363 6,443 1,182Income tax benefit related to stock awards . . . . . . . . . . . . . . . . . . . . . . . . . . . 8,615 — —Payment of financing fees . . . . . . . . . . . . . . . . . . . . . . . . . . . . . . . . . . . . . . (391) — (378)Stock repurchases . . . . . . . . . . . . . . . . . . . . . . . . . . . . . . . . . . . . . . . . . . . (63,617) (124,388) (35,296)Change in book overdraft. . . . . . . . . . . . . . . . . . . . . . . . . . . . . . . . . . . . . . . (3,212) 10,224 (5,457)Proceeds from credit facility borrowings . . . . . . . . . . . . . . . . . . . . . . . . . . . . . 347,400 170,000 —Other debt and capital lease obligation payments . . . . . . . . . . . . . . . . . . . . . . . (342,811) (118,610) (3,504)
Net cash disbursed for financing activities . . . . . . . . . . . . . . . . . . . . . . . . . . . . . (76,647) (79,983) (64,220)
Net increase (decrease) in cash and cash equivalents . . . . . . . . . . . . . . . . . . . . . . 2,913 (36,457) 5,042Cash and cash equivalents at beginning of period . . . . . . . . . . . . . . . . . . . . . . . . 11,001 47,458 42,416
Cash and cash equivalents at end of period . . . . . . . . . . . . . . . . . . . . . . . . . . . . . $ 13,914 $ 11,001 $ 47,458
Schedule of non cash investing and financing activities:Stock issued for acquisition . . . . . . . . . . . . . . . . . . . . . . . . . . . . . . . . . . . . . . . $ 36,400 $ — $ —Stock compensation transactions . . . . . . . . . . . . . . . . . . . . . . . . . . . . . . . . . . . $ — $ 4,971 $ 3,367Capital lease obligations . . . . . . . . . . . . . . . . . . . . . . . . . . . . . . . . . . . . . . . . . $ 6,349 $ 4,446 $ 12,993
Supplemental disclosures of cash flow information:Cash paid during the period for:
Interest . . . . . . . . . . . . . . . . . . . . . . . . . . . . . . . . . . . . . . . . . . . . . . . . . . $ 4,559 $ 3,241 $ 1,258Income taxes paid, net of refunds of $10,553, $316 and $287, respectively . . . . . . $ 31,385 $ 24,955 $ 2,805
See accompanying Notes to Consolidated Financial Statements
F-7

FLOWERS FOODS, INC. AND SUBSIDIARIES
NOTES TO CONSOLIDATED FINANCIAL STATEMENTS
Note 1. Basis of Presentation
General. Flowers Foods is one of the largest producers and marketers of bakery products in the United States.Flowers Foods consists of two business segments: Flowers Foods Bakeries Group, LLC (“Flowers Bakeries”) andFlowers Foods Specialty Group, LLC (“Flowers Specialty”). Flowers Bakeries focuses on the production andmarketing of bakery products to customers in the southeastern, southwestern and mid-Atlantic areas of theUnited States. Flowers Specialty produces snack cakes for sale to co-pack, retail and vending customers as well asfrozen bread, rolls and buns for sale to retail and foodservice customers.
Sale of Mrs. Smith’s Bakeries Frozen Dessert Business. On April 24, 2003, the company completed the saleof substantially all the assets of its Mrs. Smith’s Bakeries, LLC (“Mrs. Smith’s Bakeries”) frozen dessert business toThe Schwan Food Company (“Schwan”). The company retained the frozen bread and roll portion of theMrs. Smith’s Bakeries business. The frozen dessert business of Mrs. Smith’s Bakeries is reported as a discontinuedoperation. For further information, see Note 4 below.
Note 2. Summary of Significant Accounting Policies
Principles of Consolidation. The Consolidated Financial Statements include the accounts of Flowers Foodsand its wholly-owned subsidiaries. The company maintains a transportation agreement with a thinly capitalizedentity. The company is the primary beneficiary of this entity, and, in accordance with Financial AccountingStandards Board (“FASB”) Interpretation No. 46 (“FIN 46”), Consolidation of Variable Interest Entities, thecompany consolidates this entity in its Consolidated Financial Statements. For further information, see Note 12below. Intercompany transactions and balances are eliminated in consolidation.
Fiscal Year End. The company operates on a 52-53 week fiscal year ending the Saturday nearest December 31.Fiscal 2006, fiscal 2005 and fiscal 2004 consisted of 52 weeks.
Revenue Recognition. Pursuant to Staff Accounting Bulletin No. 104, Revenue Recognition (“SAB 104”),the company recognizes revenue from the sale of product at the time of delivery when title and risk of loss pass tothe customer. The company records estimated reductions to revenue for customer programs and incentive offerings,including special pricing agreements, price protection, promotions and other volume-based incentives at the timethe incentive is offered or at the time of revenue recognition for the underlying transaction that results in progress bythe customer towards earning the incentive. Independent distributors receive a percentage of the wholesale price ofproduct sold to retailers and other customers. The company records such amounts as selling, marketing andadministrative expenses. Independent distributors do not pay royalty or royalty-related fees to the company.
The consumer packaged goods industry has used scan-based trading technology over several years to shareinformation between the supplier and retailer. An extension of this technology allows the retailer to pay the supplierwhen the consumer purchases the goods rather than at the time they are delivered to the retailer. Consequently,revenue is not recognized until the product is purchased by the consumer. This technology is referred to aspay-by-scan (“PBS”). In fiscal 2006, fiscal 2005 and fiscal 2004, the company recorded approximately $477.3 mil-lion, $422.9 million and $374.5 million, respectively, in sales through PBS.
The company’s production facility delivers the product to independent distributors, who deliver the product tooutlets of national retail accounts that are within the distributors’ geographic territory as described in the DistributorAgreement. PBS is utilized only in outlets of national retail accounts with whom the company has executed aPBS Protocol Agreement (“PBS Outlet”). In accordance with SAB 104, no revenue is recognized by the companyupon delivery of the product by the company to the distributor or upon delivery of the product by the distributor to aPBS Outlet. The product inventory in the PBS Outlet is reflected as inventory on the company’s balance sheet. Thebalance of PBS inventory at December 30, 2006 and December 31, 2005 was $2.6 million and $2.1 million,respectively.
F-8

A distributor performs a physical inventory of the product at each PBS Outlet weekly and reports the results tothe company. The inventory data submitted by the distributor for each PBS Outlet is compared with the productdelivery data. Product delivered to a PBS Outlet that is not recorded in the inventory data has been purchased by theconsumer/customer of the PBS Outlet and is recorded as sales revenue by the company.
The PBS Outlet submits the scan data that records the purchase by the consumer/customer to the companyeither daily or weekly. The company reconciles the scan data with the physical inventory data. A difference in thedata indicates that “shrink” has occurred. Shrink is product unaccounted for by scan data or PBS Outlet inventorycounts. A reduction of revenue and a balance sheet reserve is recorded at each reporting period for the estimatedcosts of shrink. The amount of shrink experienced by the company was immaterial in fiscal 2006, fiscal 2005 andfiscal 2004.
The company purchases territories from and sells territories to independent distributors from time to time. Atthe time the company purchases a territory from an independent distributor, the fair value purchase price of theterritory is recorded as “Assets Held for Sale — Distributor Routes”. Upon the sale of that territory to a newindependent distributor, generally a note receivable is recorded for the sales price of the territory, as the companyprovides direct financing to the distributor, with a corresponding credit to assets held for sale to relieve the carryingamount of the territory. Any difference between the amount of the note receivable and the territory’s carrying valueis recorded as a gain or a loss in selling, marketing and administrative expenses because the company considers itsdistributor activity a cost of distribution. No revenue is recorded when the company sells a territory to anindependent distributor. In the event the sales price of the territory exceeds the carrying amount of the territory, thegain is deferred and recorded over the 10-year life of the note receivable from the independent distributor. Inaddition, since the distributor has the right to require the company to repurchase the territory at the originalpurchase price within the six-month period following the date of sale, no gain is recorded on the sale of the territoryduring this six-month period. Upon expiration of the six-month period, the amount deferred during this period isrecorded and the remaining gain on the sale is recorded over the remaining nine and one-half years of the note. Ininstances where a territory is sold for less than its carrying value, a loss is recorded at the date of sale and anyimpairment of a territory held for sale is recorded at such time the impairment occurs. The company recorded netgains of $0.8 million during fiscal 2006, net losses of $0.7 million during fiscal 2005 and net gains of $0.4 millionduring fiscal 2004 related to the sale of territories as a component of selling, marketing and administrative expenses.Included in the net losses of $0.7 million during fiscal 2005 were losses of $1.2 million related to the write-off ofdistributors’ notes receivable and the settlement of routes as a result of the effects of Hurricane Katrina.
Cash and Cash Equivalents. The company considers deposits in banks, certificates of deposits and short-term investments with original maturities of three months or less as cash and cash equivalents.
Accounts Receivable. Accounts receivable consists of trade receivables, current portions of distributor notesreceivable and miscellaneous receivables. The company maintains allowances for doubtful accounts for estimatedlosses resulting from the inability of its customers to make required payments. Bad debts are charged to this reserveafter all attempts to collect the balance are exhausted. Allowances of $0.2 million and $0.2 million were recorded atDecember 30, 2006 and December 31, 2005, respectively. If the financial condition of the company’s customerswere to deteriorate, resulting in an impairment of their ability to make payments, additional allowances may berequired. In determining past due or delinquent status of a customer, the aged trial balance is reviewed on a weeklybasis by sales management and generally any accounts older than 7 weeks are considered delinquent.
F-9
FLOWERS FOODS, INC. AND SUBSIDIARIES
NOTES TO CONSOLIDATED FINANCIAL STATEMENTS — (Continued)

Concentration of Credit Risk. The company performs periodic credit evaluations and grants credit tocustomers, who are primarily in the grocery and foodservice markets, and generally does not require collateral. Ourtop 10 customers in fiscal 2006, fiscal 2005 and fiscal 2004 accounted for 42.0%, 40.6% and 40.5% of sales,respectively. Following is the effect our largest customer, Wal-Mart/Sam’s Club, had on the company’s sales forfiscal 2006, fiscal 2005, and fiscal 2004.
Flowers Bakeries Flowers Specialty TotalPercent of Sales
Fiscal 2006 . . . . . . . . . . . . . . . . . . . . . . . . . . . . . . . . . . 16.3% 2.6% 18.9%
Fiscal 2005 . . . . . . . . . . . . . . . . . . . . . . . . . . . . . . . . . . 14.6% 2.7% 17.3%
Fiscal 2004 . . . . . . . . . . . . . . . . . . . . . . . . . . . . . . . . . . 13.4% 2.1% 15.5%
Inventories. Inventories at December 30, 2006 and December 31, 2005 are valued at the lower of cost ormarket using the first-in-first-out method. The company writes down its inventory for estimated unmarketableinventory equal to the difference between the cost of inventory and the estimated market value based uponassumptions about future demand and market conditions.
Spare Parts and Supplies. The company maintains spare parts and supplies, which are used for repairs andmaintenance of its machinery and equipment. These spare parts and supplies allow the company to react quickly inthe event of a mechanical breakdown. These parts are valued using the first-in-first-out method and are expensed asthe part is used. Periodic physical inventories of the parts are performed, and the value of the parts is adjusted forany obsolescence or difference in the actual inventory count and the value recorded.
Property, Plant and Equipment and Depreciation. Property, plant and equipment is stated at cost. Depre-ciation expense is computed using the straight-line method based on the estimated useful lives of the depreciableassets. Certain equipment held under capital leases are classified as property, plant and equipment and the relatedobligations are recorded as liabilities. Amortization of assets held under capital leases is included in depreciationexpense. Total accumulated depreciation for assets held under capital leases was $10.6 million and $7.5 million atDecember 30, 2006 and December 31, 2005, respectively.
Buildings are depreciated over ten to forty years, machinery and equipment over three to twenty-five years,and furniture, fixtures and transportation equipment over three to fifteen years. Property under capital leases isamortized over the shorter of the lease term or the estimated useful life of the property. Depreciation expense forfiscal 2006, fiscal 2005 and fiscal 2004 was $62.7 million, $58.9 million and $56.4 million, respectively. Thecompany did not have any capitalized interest during fiscal 2006, fiscal 2005 or fiscal 2004.
The cost of maintenance and repairs is charged to expense as incurred. Upon disposal or retirement, the costand accumulated depreciation of assets are eliminated from the respective accounts. Any gain or loss is reflected inthe company’s operations.
Goodwill and Other Intangible Assets. In accordance with Statement of Financial Accounting Standards(“SFAS”) No. 142, Goodwill and Other Intangible Assets (“SFAS 142”), the company accounts for goodwill in apurchase business combination as the excess of the cost over the fair value of net assets acquired. Businesscombinations can also result in other intangible assets being recognized. Amortization of intangible assets, ifapplicable, occurs over their estimated useful lives. SFAS 142 requires companies to test goodwill for impairmenton an annual basis (or an interim basis if an event occurs that might reduce the fair value of a reporting unit below itscarrying value) using a two-step method. The company conducts this review during the fourth quarter of each fiscalyear absent any triggering event. No impairment resulted from the annual review performed in fiscal 2006, fiscal2005 or fiscal 2004. SFAS 142 also requires that an identifiable intangible asset that is determined to have anindefinite useful economic life not be amortized, but separately tested for impairment, at least annually, using a one-step fair value based approach or when certain indicators of impairment are present.
F-10
FLOWERS FOODS, INC. AND SUBSIDIARIES
NOTES TO CONSOLIDATED FINANCIAL STATEMENTS — (Continued)

Impairment of Long-Lived Assets. In accordance with SFAS No. 144 (“SFAS 144”), Accounting forImpairment or Disposal of Long-Lived Assets, the company determines whether there has been an impairmentof long-lived assets, excluding goodwill and identifiable intangible assets that are determined to have indefiniteuseful economic lives, when certain indicators of impairment are present. In the event that facts and circumstancesindicate that the cost of any long-lived assets may be impaired, an evaluation of recoverability would be performed.If an evaluation is required, the estimated future gross, undiscounted cash flows associated with the asset would becompared to the asset’s carrying amount to determine if a write-down to market value is required. Future adversechanges in market conditions or poor operating results of underlying long-lived assets could result in losses or aninability to recover the carrying value of the long-lived assets that may not be reflected in the assets’ currentcarrying value, thereby possibly requiring an impairment charge in the future.
Derivative Financial Instruments. The company enters into commodity derivatives, designated as cash flowhedges of existing or future exposure to changes in commodity prices. The company’s primary raw materials areflour, sweeteners and shortening, along with pulp, paper, and petroleum-based packaging products. The companyuses natural gas and propane as fuel for firing ovens. The company also periodically enters into interest ratederivatives to hedge exposure to changes in interest rates. See Note 8 for further details.
Treasury Stock. The company records acquisitions of its common stock for treasury at cost. Differencesbetween proceeds for reissuances of treasury stock and average cost are credited or charged to capital in excess ofpar value to the extent of prior credits and thereafter to retained earnings.
Advertising and Consumer Promotion. Advertising and consumer promotion costs are generally expensed asincurred or no later than when the advertisement appears or the event is run. Advertising and consumer promotionexpense was approximately $17.9 million, $19.4 million and $21.4 million for fiscal 2006, fiscal 2005 and fiscal2004, respectively.
Stock-Based Compensation. In December 2004, the FASB issued SFAS 123R, Share-Based Payment(“SFAS 123R”). SFAS 123R requires that the value of stock options and similar awards be expensed. Thecompany adopted SFAS 123R on January 1, 2006 and applied the modified prospective transition method. Thismethod requires the company to expense the remaining unrecognized portion of unvested awards outstanding at theeffective date and any awards granted or modified after the effective date, but does not require restatement of priorperiods. See Note 15 for information relating to the company’s stock-based compensation. Prior to the adoption ofSFAS 123R, as permitted by SFAS No. 123, Accounting for Stock-Based Compensation (“SFAS 123”), thecompany applied intrinsic value accounting for its stock option plans under Accounting Principles Board OpinionNo. 25, Accounting for Stock Issued to Employees (“APB 25”). Compensation cost for stock options, if any, wasmeasured as the excess of the market price of the company’s common stock at the date of grant over the exerciseprice to be paid by the grantee to acquire the stock. The company applied the disclosure-only provisions ofSFAS 123 and SFAS No. 148, Accounting for Stock-Based Compensation — Transition and Disclosure — anAmendment of FASB Statement No. 123 (“SFAS 148”).
F-11
FLOWERS FOODS, INC. AND SUBSIDIARIES
NOTES TO CONSOLIDATED FINANCIAL STATEMENTS — (Continued)

If the company had elected to recognize compensation expense based upon the fair value at the grant dates forstock options under these plans, the company’s net income and net income per share would have been affected asfollows:
December 31, 2005 January 1, 2005For the 52 Weeks Ended
(Amounts in thousands,except per share amounts)
Net income, as reported . . . . . . . . . . . . . . . . . . . . . . . . . . . . . . . $61,231 $50,774
Deduct: Total additional stock-based employee compensationcost, net of income tax, that would have been included in netincome under fair value method . . . . . . . . . . . . . . . . . . . . . . . (1,921) (4,815)
Pro forma net income. . . . . . . . . . . . . . . . . . . . . . . . . . . . . . . . . $59,310 $45,959
Basic net income per share as reported . . . . . . . . . . . . . . . . . . . . $ 0.99 $ 0.77
Pro forma. . . . . . . . . . . . . . . . . . . . . . . . . . . . . . . . . . . . . . . . $ 0.96 $ 0.70
Diluted net income per share as reported . . . . . . . . . . . . . . . . . . $ 0.96 $ 0.75
Pro forma. . . . . . . . . . . . . . . . . . . . . . . . . . . . . . . . . . . . . . . . $ 0.93 $ 0.68
Software Development Costs. The company expenses software development costs incurred in the prelim-inary project stage, and, thereafter, capitalizes costs incurred in developing or obtaining internally used software.Certain costs, such as maintenance and training, are expensed as incurred. Capitalized costs are amortized over aperiod of three to eight years and are subject to impairment evaluation. The net balance of capitalized softwaredevelopment costs included in plant, property and equipment was $8.4 million and $12.3 million at December 30,2006 and December 31, 2005, respectively. Amortization expense of capitalized software development costs was$4.2 million, $3.3 million and $3.3 million in fiscal 2006, fiscal 2005 and fiscal 2004, respectively.
Income Taxes. The company accounts for income taxes using an asset and liability approach that recognizesdeferred tax assets and liabilities for the expected future tax consequences of temporary differences between thecarrying amounts and the tax bases of assets and liabilities. The company records a valuation allowance to reduce itsdeferred tax assets to the amount that is more likely than not to be realized. The company has considered futuretaxable income and ongoing prudent and feasible tax planning strategies in assessing the need for the valuationallowance. In the event the company were to determine that it would be able to realize its deferred tax assets in thefuture in excess of its net recorded amount, an adjustment to the deferred tax asset would increase income in theperiod such determination was made. Likewise, should the company determine that it would not be able to realizeall or part of its net deferred tax asset in the future, an adjustment to the deferred tax asset would be charged toincome in the period such determination was made.
Self-Insurance Reserves. The company is self-insured for various levels of general liability, auto liability,workers’ compensation and employee medical and dental coverage. Insurance reserves are calculated on anundiscounted basis based on actual claim data and estimates of incurred but not reported claims developed utilizinghistorical claim trends. Projected settlements and incurred but not reported claims are estimated based on pendingclaims, historical trends and data. Though the company does not expect them to do so, actual settlements and claimscould differ materially from those estimated. Material differences in actual settlements and claims could have anadverse effect on our results of operations and financial condition.
Net Income Per Common Share. Basic net income per share is computed by dividing net income by weightedaverage common shares outstanding for the period. Diluted net income per share is computed by dividing netincome by weighted average common and common equivalent shares outstanding for the period. Common stockequivalents consist of the incremental shares associated with the company’s stock compensation plans, asdetermined under the treasury stock method.
F-12
FLOWERS FOODS, INC. AND SUBSIDIARIES
NOTES TO CONSOLIDATED FINANCIAL STATEMENTS — (Continued)

Use of Estimates. The preparation of financial statements in conformity with accounting principles generallyaccepted in the United States of America requires management to make estimates and assumptions that affect thereported amounts of assets and liabilities and disclosure of contingent assets and liabilities at the date of thefinancial statements and the reported amounts of revenues and expenses during the reporting period. Actual resultscould differ from those estimates.
Note 3. New Accounting Pronouncements
Inventory Costs. In November 2004, the FASB issued SFAS No. 151, Inventory Costs — an Amendment ofARB No. 43, Chapter 4 (“SFAS 151”). SFAS 151 clarified the accounting for abnormal amounts of idle facilityexpense, freight, handling costs and wasted material (spoilage). SFAS 151 was effective for fiscal years beginningafter June 15, 2005, the company’s fiscal 2006, which began January 1, 2006. This pronouncement did not have amaterial effect on the company’s results of operations or financial condition.
Stock Based Compensation. In December 2004, the FASB issued SFAS No. 123R, Share-Based Payment(“SFAS 123R”), which requires the value of stock options and similar awards be expensed. The company adoptedSFAS 123R on January 1, 2006, and applied the modified prospective transition method. This method requires thecompany to expense the remaining unrecognized portion of unvested awards outstanding at the effective date andany awards granted or modified after the effective date but does not require restatement of prior periods. See Note 15of Notes to Consolidated Financial Statements of this Form 10-K for information relating to the company’s stock-based compensation.
Accounting Changes and Error Corrections. In May 2005, the FASB issued SFAS No. 154, AccountingChanges and Error Corrections (“SFAS 154”). SFAS 154 requires that, when a company changes its accountingpolicies, it must apply the change retrospectively to all prior periods presented instead of a cumulative effectadjustment in the period of the change. SFAS 154 may also apply when the FASB issues new rules requiringchanges in accounting. However if the new rule allows cumulative effect treatment, it would take precedence overSFAS 154. This statement is effective for accounting changes and error corrections for the company’s fiscal year2006 which began on January 1, 2006.
Accounting for Uncertainty in Income Taxes. In June 2006, the FASB issued FASB Interpretation No. 48,Accounting for Uncertainty in Income Taxes — an Interpretation of FASB Statement No. 109 (“FIN 48”). FIN 48clarifies the accounting for uncertainty in income taxes in an enterprise’s financial statements in accordance withFASB Statement No. 109, Accounting for Income Taxes. FIN 48 prescribes a recognition threshold and measure-ment attribute for the financial statement recognition and measurement of a tax position taken or expected to betaken in a tax return. FIN 48 also provides guidance on derecognition, classification, interest and penalties,accounting in interim periods, disclosure and transition. FIN 48 is effective for fiscal years beginning afterDecember 15, 2006, which will be the company’s fiscal 2007 beginning December 31, 2006. The impact of thecumulative effect adjustment will be recorded in retained earnings as of December 31, 2006. The companycontinues to assess the impact of FIN 48 on its financial statements; however, the company believes the adoption ofFIN 48 will have an immaterial effect.
Financial Statement Misstatements. In September 2006 the SEC released Staff Accounting Bulletin No. 108,Financial Statement Misstatements (“SAB 108”). SAB 108 expresses the SEC staff’s views regarding the processof quantifying financial statement misstatements. The interpretations in SAB 108 are being issued to addressdiversity in practice in quantifying financial statement misstatements and the potential under current practice forthe build up of improper amounts on the balance sheet. SAB 108 was effective for annual financial statementscovering the first fiscal year ending after November 15, 2006, which was the company’s fiscal 2006. SAB 108 didnot have an effect on the company’s financial statements.
Fair Value Measurements. In September 2006, the FASB issued SFAS No. 157, Fair Value Measurements(“SFAS 157”). SFAS 157 defines fair value, establishes a framework for measuring fair value in generally accepted
F-13
FLOWERS FOODS, INC. AND SUBSIDIARIES
NOTES TO CONSOLIDATED FINANCIAL STATEMENTS — (Continued)

accounting principles, and expands disclosures about fair value measurements. SFAS 157 applies under otheraccounting pronouncements that require or permit fair value measurements, the FASB having previously concludedin those accounting pronouncements that fair value is the relevant measurement attribute. Accordingly, SFAS 157does not require any new fair value measurements. However, for some entities, the application of SFAS 157 willchange current practice. SFAS 157 is effective for fiscal years beginning after November 15, 2007 (the company’sfiscal year 2008), and interim periods within those fiscal years. The company will assess the effect of thispronouncement on its financial statements, but at this time, no material effect is expected.
Employers’ Accounting for Defined Benefit Pension and other Postretirement Plans. In September 2006, theFASB issued SFAS No. 158, Employers’ Accounting for Defined Benefit Pension and other Postretirement Plans,an amendment of FASB Statements No. 87, 88, 106 and 132(R) (“SFAS 158”). SFAS 158 requires recognition of theoverfunded or underfunded status of pension and other postretirement benefit plans on the balance sheet. UnderSFAS 158, gains and losses, prior service costs and credits, and any remaining transition amounts under FASBStatement No. 87, Employers’ Accounting for Pensions (“SFAS 87”) and FASB Statement No. 106, Employers’Accounting for Postretirement Benefits Other Than Pensions (“SFAS 106”) that have not yet been recognizedthrough net periodic benefit costs will be recognized in accumulated other comprehensive income, net of taxbenefits, until they are amortized as a component of net periodic cost. SFAS 158 does not change how pensions andother postretirement benefits are accounted for and reported in the income statement. Companies will continue tofollow the existing guidance in SFAS 87, FASB Statement No. 88, Employers’ Accounting for Settlements andCurtailments of Defined Benefit Pension Plans and for Termination Benefits and SFAS 106. SFAS 158 was effectivefor public companies for fiscal years ending after December 15, 2006. The company adopted the balance sheetrecognition provisions of SFAS 158 at December 30, 2006. See Note 18 of Notes to Consolidated FinancialStatements of this Form 10-K for information relating to the company’s pension and other postretirement plans.SFAS 158 also requires that employers measure the benefit obligation and plan assets as of the fiscal year end forfiscal years ending after December 15, 2008 (the company’s fiscal 2008). The company currently uses aSeptember 30 measurement date for its postretirement benefit plans. The company intends to eliminate the earlymeasurement date in 2007 and this is expected to have an immaterial effect on its financial statements.
Note 4. Discontinued Operations
On April 24, 2003, the company completed the sale of substantially all the assets of its Mrs. Smith’s Bakeriesfrozen dessert business to Schwan. For accounting purposes, the frozen dessert business sold to Schwan is presentedas discontinued operations for all periods presented. Accordingly, certain transactions are included in Income (loss)from discontinued operations, net of income tax in the consolidated statements of income. An analysis of this lineitem is as follows:
December 30, 2006 December 31, 2005 January 1, 2005For the 52 Weeks Ended
(Amounts in thousands)
Claim settlement. . . . . . . . . . . . . . . . . . . . . . $ — $(2,000) $ —
Provision for retained liabilities . . . . . . . . . . . — (625) (5,099)
Insurance recovery . . . . . . . . . . . . . . . . . . . . 2,000 — —
Other . . . . . . . . . . . . . . . . . . . . . . . . . . . . . . — — (570)
Pre-tax discontinued operation . . . . . . . . . . . 2,000 (2,625) (5,669)
Income tax benefit . . . . . . . . . . . . . . . . . . . . 4,731 998 2,183
Income (loss) from discontinued operations,net of income tax . . . . . . . . . . . . . . . . . . . $6,731 $(1,627) $(3,486)
During fiscal 2004, based on claim activity, the company established a reserve of $5.1 million ($3.1 million,net of income tax) as an estimate of future expenses likely to be incurred by the company in connection with
F-14
FLOWERS FOODS, INC. AND SUBSIDIARIES
NOTES TO CONSOLIDATED FINANCIAL STATEMENTS — (Continued)

Mrs. Smith’s. The balance of this reserve as of December 30, 2006 and December 31, 2005 was $0.1 million and$0.3 million, respectively. Included in this reserve was $1.8 million, net of income tax benefit, regarding asettlement of a class action lawsuit related to pie shells produced by Mrs. Smith’s. Additional costs of $0.2 million,net of income tax benefit, were recorded as part of discontinued operations during fiscal 2005 relating to thissettlement. During the first quarter of fiscal 2006, the company received an insurance recovery of $2.0 million($1.2 million, net of income tax) relating to this settlement and such recovery is recorded in discontinued operationsfor the 52 weeks ended December 30, 2006.
During the third quarter of fiscal 2006, the Internal Revenue Service (“IRS”) finalized its audit of thecompany’s tax years 2000 and 2001. Based upon the results of this audit, the company reversed previouslyestablished tax reserves in the amount of $6.0 million related to the deductibility of certain transaction costsincurred in connection with the divestiture of the company’s Keebler investment in 2001. A deduction was allowedfor a majority of these costs; therefore, the reserve was reversed through discontinued operations in the 52 weeksended December 30, 2006.
The IRS also finalized the results of its audit of the company’s fiscal 2003 income tax return during the thirdquarter of fiscal 2006. Based on the results of this audit, the company accrued $0.5 million of income tax expenserelated to Mrs. Smith’s. This adjustment is also recorded in discontinued operations in the consolidated statement ofincome for the 52 weeks ended December 30, 2006.
There were no revenues or results of operations recorded for the discontinued operation for the 52 weeksending December 30, 2006, December 31, 2005 and January 1, 2005.
Note 5. Goodwill and Other Intangible Assets
The change in the carrying amount of goodwill during fiscal 2006 is as follows (amounts in thousands):
Flowers Bakeries Flowers Specialty Total
Balance as of December 31, 2005 . . . . . . . . . . . . . . . $54,891 $3,676 $58,567
Acquisition(1) . . . . . . . . . . . . . . . . . . . . . . . . . . . . . . 16,970 — 16,970
Balance as of December 30, 2006 . . . . . . . . . . . . . . . $71,861 $3,676 $75,537
(1) The company acquired Derst Baking Company in Savannah, Georgia on February 18, 2006. See Note 9 forfurther information regarding this acquisition. Derst was a stock acquisition, therefore, the goodwill is notdeductible for tax purposes.
The following table sets forth information for other intangible assets:
December 30,2006
December 31,2005
(Amounts in thousands)
Intangible assets not subject to amortization:
Distribution routes . . . . . . . . . . . . . . . . . . . . . . . . . . . . . . . . . . . . . . $ — $ 903
Intangible assets subject to amortization:
Trademarks . . . . . . . . . . . . . . . . . . . . . . . . . . . . . . . . . . . . . . . . . . . 12,038 5,907
Customer relationships . . . . . . . . . . . . . . . . . . . . . . . . . . . . . . . . . . . 11,241 5,721
Non-compete agreements . . . . . . . . . . . . . . . . . . . . . . . . . . . . . . . . . 842 1,074
Total intangible assets, net . . . . . . . . . . . . . . . . . . . . . . . . . . . . . . $24,121 $13,605
F-15
FLOWERS FOODS, INC. AND SUBSIDIARIES
NOTES TO CONSOLIDATED FINANCIAL STATEMENTS — (Continued)

As part of the acquisition of Derst Baking Company in February 2006, the company acquired a trademark,which is valued at $7.0 million and is being amortized straight-line over 40 years, and customer relationships valuedat $6.6 million, which are being amortized over 15 years using an accelerated amortization method.
In connection with the acquisition of Derst Baking Company, distribution routes valued at $0.9 million,previously classified as intangible assets were transferred to assets held for sale, as the company expects to sellthese routes to independent distributors in early 2007.
In October 2002, the company acquired Ideal Baking Company in Batesville, Arkansas. As part of thisacquisition, the Ideal trademark was recorded as an indefinite-lived intangible asset, with a carrying value of$1.9 million. In September 2001, the company acquired Kotarides Baking Company in Norfolk, Virginia, whichdistributes breads and buns under the Mary Jane brand. The company recorded this trademark as an indefinite-livedintangible asset, with a carrying value of $3.3 million. In December 2005, as a result of the company’s growth of itsNature’s Own trademark, the company determined that these trademarks should be recorded as definite-livedintangibles with estimated lives of 20 years for the Ideal trademark and 25 years for the Mary Jane trademark.Amortization of these trademarks began in the first quarter of fiscal 2006.
The company has a non-compete agreement related to an acquisition that is amortized over the five-year termof the agreement. Amortization expense related to customer relationships, the non-compete agreement andtrademarks for fiscal 2006, fiscal 2005 and fiscal 2004 was $2.1 million, $1.1 million and $0.9 million, respectively.Estimated amortization expense for fiscal 2007, fiscal 2008, fiscal 2009, fiscal 2010 and fiscal 2011 is $2.0 million,$1.5 million, $1.5 million, $1.4 million and $1.4 million, respectively.
In connection with the sale of the Mrs. Smith’s Bakeries frozen dessert business, the company entered into a5-year non-compete agreement (“agreement”) with Schwan valued at $3.0 million. The company is recognizingincome related to this agreement as a reduction of amortization expense over the life of the agreement. Thecompany reduced amortization expense by $0.6 million, $0.6 million and $0.6 million in fiscal 2006, fiscal 2005and fiscal 2004, respectively, resulting from this agreement. Amortization expense will be reduced in fiscal 2007and fiscal 2008 by $0.6 million and $0.2 million, respectively, resulting from this agreement.
For intangible assets subject to amortization, the cost and accumulated amortization was $28.5 million and$4.5 million, respectively at December 30, 2006. As of December 31, 2005, the cost and accumulated amortizationwas $14.9 million and $2.3 million, respectively.
Note 6. Notes Receivable
Between September 1996 and March 2001, the independent distributor notes, entered into in connection withthe purchase of the distributors’ territories (the “distributor notes”), were made directly between the distributor anda third party financial institution. In March 2001, the company purchased the aggregate outstanding distributor notebalance of $77.6 million from the third party financial institution. The purchase price of the distributor note balancerepresented the notional and fair value of the notes at the purchase date. Accordingly, beginning at that time, thecompany has provided direct financing to independent distributors for the purchase of the distributors’ territoriesand records the notes receivable on the consolidated balance sheet. The territories are financed over ten yearsbearing an interest rate of 12%. During fiscal 2006, fiscal 2005 and fiscal 2004, $9.7 million, $9.5 million and$9.5 million, respectively, were recorded as interest income relating to the distributor notes. The distributor notesare collateralized by the independent distributors’ territories. At December 30, 2006 and December 31, 2005, theoutstanding balance of the distributor notes was $84.3 million and $79.3 million, respectively, of which the currentportion of $9.8 million and $9.0 million, respectively, is recorded in accounts and notes receivable, net. AtDecember 30, 2006 and December 31, 2005, the company has evaluated the collectibility of the distributor notesand determined that a reserve is not necessary. Payments on these distributor notes are collected by the companyweekly in the distributor settlement process.
F-16
FLOWERS FOODS, INC. AND SUBSIDIARIES
NOTES TO CONSOLIDATED FINANCIAL STATEMENTS — (Continued)

Note 7. Assets Held for Sale — Distributor Routes
The company purchases territories from and sells territories to independent distributors from time to time. Thecompany repurchases territories from independent distributors in circumstances when the company decides to exit aterritory or when the distributor elects to terminate its relationship with the company. In the event the companydecides to exit a territory or ceases to utilize the independent distribution form of doing business, the company iscontractually required to purchase the territory from the independent distributor for ten times average weeklybranded sales. In the event an independent distributor terminates its relationship with the company, the company,although not legally obligated, normally repurchases and operates that territory as a company-owned territory.Territories purchased from independent distributors are recorded on the company’s consolidated balance sheets as“Assets Held for Sale — Distributor Routes” while the company actively seeks another distributor to purchase theterritory. At December 30, 2006 and December 31, 2005, territories recorded as assets held for sale were$22.9 million and $16.4 million, respectively. The company held and operated 560 and 460 such independentdistributor territories for sale at December 30, 2006 and December 31, 2005, respectively. The carrying value ofeach territory is recorded as an asset held for sale, is not amortized and is evaluated for impairment in accordancewith the provisions of SFAS 142.
Territories held for sale and operated by the company are sold to independent distributors at a multiple ofaverage weekly branded sales, which approximate the fair market value of the territory. Subsequent to the purchaseof a territory by the distributor, in accordance with the terms of the distributor arrangement, the independentdistributor has the right to require the company to repurchase the territory and truck, if applicable, at the originalpurchase price paid by the distributor on the long-term financing arrangement within the six-month periodfollowing the date of sale. Prior to July of 2006, the company was required to repurchase the territory at the originalpurchase price plus interest paid by the distributor in the six-month period following the sale of a territory to theindependent distributor. If the truck is leased, the company will assume the lease payment if the territory isrepurchased during the first six-month period. If the company had been required to repurchase these territories, thecompany would have been obligated to pay $0.6 million and $0.7 million as of December 30, 2006 andDecember 31, 2005, respectively. Should the independent distributor wish to sell the territory after the six-monthperiod has expired, the company has the right of first refusal.
Note 8. Derivative Financial Instruments
The company enters into commodity derivatives, designated as cash flow hedges of existing or future exposureto changes in commodity prices. The company’s primary raw materials are flour, sweeteners and shortening, alongwith pulp, paper and petroleum-based packaging products. Natural gas, used as fuel for firing ovens, is an importantproduction input. The company also periodically enters into interest rate derivatives to hedge exposure to changesin interest rates.
As of December 30, 2006, the company’s hedge portfolio contained commodity derivatives with a fair value of$2.5 million, which is recorded in other current and long-term assets and/or liabilities. The positions held in theportfolio are used to hedge economic exposure to changes in various raw material and production input prices andeffectively fix the price, or limit increases in prices, for a period of time extending into fiscal 2009. Under SFAS 133,these instruments are designated as cash-flow hedges. The effective portion of changes in fair value for thesederivatives (as defined in SFAS 133) is recorded each period in other comprehensive income (loss), and anyineffective portion of the change in fair value is recorded to current period earnings in selling, marketing andadministrative expenses. The company held no commodity derivatives at December 30, 2006 that did not qualifyfor hedge accounting under SFAS 133. During fiscal 2006, fiscal 2005 and fiscal 2004, there was no income orexpense recorded in current earnings due to changes in fair value of these instruments.
As of December 30, 2006, the balance in accumulated other comprehensive income (loss) related to derivativetransactions was $1.4 million. Of this total, approximately $1.6 million, $(0.1) million and an immaterial amount
F-17
FLOWERS FOODS, INC. AND SUBSIDIARIES
NOTES TO CONSOLIDATED FINANCIAL STATEMENTS — (Continued)
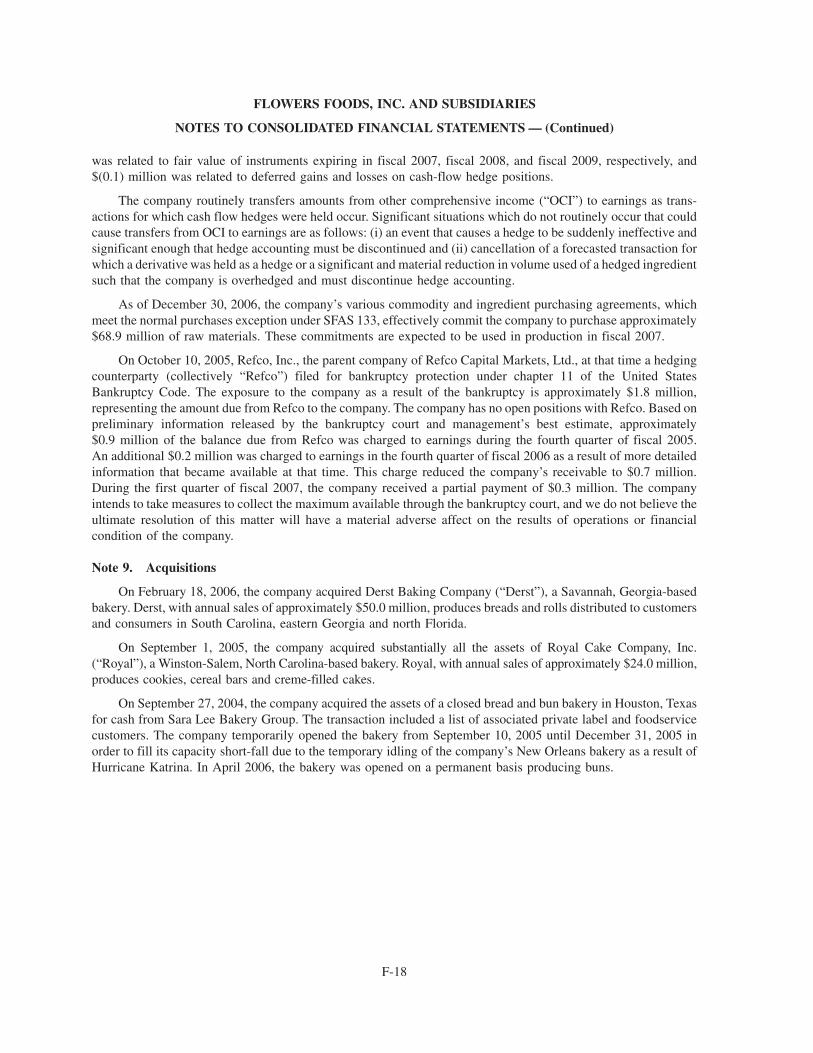
was related to fair value of instruments expiring in fiscal 2007, fiscal 2008, and fiscal 2009, respectively, and$(0.1) million was related to deferred gains and losses on cash-flow hedge positions.
The company routinely transfers amounts from other comprehensive income (“OCI”) to earnings as trans-actions for which cash flow hedges were held occur. Significant situations which do not routinely occur that couldcause transfers from OCI to earnings are as follows: (i) an event that causes a hedge to be suddenly ineffective andsignificant enough that hedge accounting must be discontinued and (ii) cancellation of a forecasted transaction forwhich a derivative was held as a hedge or a significant and material reduction in volume used of a hedged ingredientsuch that the company is overhedged and must discontinue hedge accounting.
As of December 30, 2006, the company’s various commodity and ingredient purchasing agreements, whichmeet the normal purchases exception under SFAS 133, effectively commit the company to purchase approximately$68.9 million of raw materials. These commitments are expected to be used in production in fiscal 2007.
On October 10, 2005, Refco, Inc., the parent company of Refco Capital Markets, Ltd., at that time a hedgingcounterparty (collectively “Refco”) filed for bankruptcy protection under chapter 11 of the United StatesBankruptcy Code. The exposure to the company as a result of the bankruptcy is approximately $1.8 million,representing the amount due from Refco to the company. The company has no open positions with Refco. Based onpreliminary information released by the bankruptcy court and management’s best estimate, approximately$0.9 million of the balance due from Refco was charged to earnings during the fourth quarter of fiscal 2005.An additional $0.2 million was charged to earnings in the fourth quarter of fiscal 2006 as a result of more detailedinformation that became available at that time. This charge reduced the company’s receivable to $0.7 million.During the first quarter of fiscal 2007, the company received a partial payment of $0.3 million. The companyintends to take measures to collect the maximum available through the bankruptcy court, and we do not believe theultimate resolution of this matter will have a material adverse affect on the results of operations or financialcondition of the company.
Note 9. Acquisitions
On February 18, 2006, the company acquired Derst Baking Company (“Derst”), a Savannah, Georgia-basedbakery. Derst, with annual sales of approximately $50.0 million, produces breads and rolls distributed to customersand consumers in South Carolina, eastern Georgia and north Florida.
On September 1, 2005, the company acquired substantially all the assets of Royal Cake Company, Inc.(“Royal”), a Winston-Salem, North Carolina-based bakery. Royal, with annual sales of approximately $24.0 million,produces cookies, cereal bars and creme-filled cakes.
On September 27, 2004, the company acquired the assets of a closed bread and bun bakery in Houston, Texasfor cash from Sara Lee Bakery Group. The transaction included a list of associated private label and foodservicecustomers. The company temporarily opened the bakery from September 10, 2005 until December 31, 2005 inorder to fill its capacity short-fall due to the temporary idling of the company’s New Orleans bakery as a result ofHurricane Katrina. In April 2006, the bakery was opened on a permanent basis producing buns.
F-18
FLOWERS FOODS, INC. AND SUBSIDIARIES
NOTES TO CONSOLIDATED FINANCIAL STATEMENTS — (Continued)

Note 10. Other Accrued Liabilities
Other accrued liabilities consist of:
December 30,2006
December 31,2005
(Amounts in thousands)
Employee compensation. . . . . . . . . . . . . . . . . . . . . . . . . . . . . . . . . . . . $51,749 $40,188
Pension contribution . . . . . . . . . . . . . . . . . . . . . . . . . . . . . . . . . . . . . . — 14,000
Fair value of derivative instruments . . . . . . . . . . . . . . . . . . . . . . . . . . . 2,040 1,374
Insurance. . . . . . . . . . . . . . . . . . . . . . . . . . . . . . . . . . . . . . . . . . . . . . . 17,346 13,279
Other . . . . . . . . . . . . . . . . . . . . . . . . . . . . . . . . . . . . . . . . . . . . . . . . . . 15,756 16,981
Total . . . . . . . . . . . . . . . . . . . . . . . . . . . . . . . . . . . . . . . . . . . . . . . . $86,891 $85,822
Note 11. Debt, Lease and Other Commitments
Long-term debt consisted of the following at December 30, 2006 and December 31, 2005:
Interest Rate atDecember 30,
2006Final
MaturityDecember 30,
2006December 31,
2005(Amounts in thousands)
Unsecured credit facility . . . . . . . . . . . . . . 6.3% 2011 $51,800 $50,000
Capital lease obligations . . . . . . . . . . . . . . 6.7% 2014 28,108 24,866
Other notes payable . . . . . . . . . . . . . . . . . . 5.6% 2013 6,624 4,189
86,532 79,055
Due within one year . . . . . . . . . . . . . . . . . . 7,406 4,652
Due after one year . . . . . . . . . . . . . . . . . . . $79,126 $74,403
On June 6, 2006, the company further amended and restated its credit facility (the “new credit facility”), whichwas previously amended and restated on October 29, 2004 (“the former credit facility”). The new credit facility is afive-year, $250.0 million unsecured revolving loan facility that provides for lower rates on future borrowings thanthe company’s former credit facility through June 6, 2011. The company may request to increase its borrowingsunder the new credit facility up to an aggregate of $350.0 million upon the satisfaction of certain conditions.
Interest is due quarterly in arrears on any outstanding borrowings at a customary Eurodollar rate or the baserate plus the applicable margin. The underlying rate is defined as either rates offered in the interbank Eurodollarmarket or the higher of the prime lending rate or federal funds rate plus 0.5%. The applicable margin ranges from0.0% to 0.20% for base rate loans and from 0.40% to 1.075% for Eurodollar loans. In addition, a facility fee rangingfrom 0.10% to 0.30% is due quarterly on all commitments under the new credit facility. Both the interest margin andthe facility fee are based on the company’s leverage ratio. There were $51.8 million in outstanding borrowingsunder the new credit facility at December 30, 2006.
The new credit facility includes certain customary restrictions, which, among other things, require mainte-nance of financial covenants and limit encumbrance of assets and creation of indebtedness. Restrictive financialcovenants include such ratios as a minimum interest coverage ratio and a maximum leverage ratio. The companybelieves that, given its current cash position, its cash flow from operating activities and its available credit capacity,it can comply with the current terms of the new credit facility and can meet presently foreseeable financialrequirements. As of December 30, 2006, the company was in compliance with all restrictive financial covenantsunder the new credit facility.
F-19
FLOWERS FOODS, INC. AND SUBSIDIARIES
NOTES TO CONSOLIDATED FINANCIAL STATEMENTS — (Continued)

The company paid financing costs of $0.4 million in connection with its new credit facility. These costs weredeferred and, along with unamortized costs of $0.5 million relating to the company’s former credit facility are beingamortized over the term of the new credit facility.
On October 29, 2004, the company amended and restated its then existing credit facility, which was a$150.0 million unsecured credit agreement executed on October 24, 2003. The former credit facility was in effect atDecember 31, 2005 and was a five-year, $150.0 million unsecured revolving loan facility. The company couldrequest to increase its borrowings under the former credit facility up to an aggregate of $225.0 million upon thesatisfaction of certain conditions. Interest on the former credit facility was due quarterly in arrears on anyoutstanding borrowings at a customary Eurodollar rate or the base rate plus the applicable margin. The underlyingrate was defined as either rates offered in the interbank Eurodollar market or the higher of the prime lending rate orfederal funds rate plus 0.5%. The applicable margin ranged from 0.0% to 0.20% for base rate loans and from0.625% to 1.20% for Eurodollar loans. In addition, a facility fee ranging from 0.125% to 0.30% was due quarterlyon all commitments under the former credit facility. Both the interest margin and the facility fee were based on thecompany’s leverage ratio. Financial covenants and other restrictions under the former credit facility were the sameas those under the new credit facility.
Included in accounts payable in the consolidated balance sheets are book overdrafts of $16.4 million and$19.6 million as of December 30, 2006 and December 31, 2005, respectively.
Though it is generally the company’s policy not to provide third party guarantees, the company has guaranteedin prior periods, through their respective terms, approximately $0.4 million and $0.9 million in leases atDecember 30, 2006 and December 31, 2005, respectively, that certain independent distributors have entered intowith third party financial institutions related to distribution vehicle financing. In the ordinary course of business,when an independent distributor terminates his or her relationship with the company, the company, although notlegally obligated, generally operates the territory until it is resold. The company uses the former independentdistributor’s vehicle to operate these territories and makes the lease payments to the third party financial institutionin place of the former distributor. These payments are recorded as selling, marketing and administrative expensesand amounted to $4.3 million, $2.9 million and $3.5 million for fiscal 2006, fiscal 2005 and fiscal 2004,respectively. Assuming the company does not resell the territories to new independent distributors, the maximumobligation for the vehicles being used by the company at December 30, 2006 and December 31, 2005, wasapproximately $12.2 million and $10.1 million, respectively. The company does not anticipate operating theseterritories over the life of the lease as it intends to resell these territories to new independent distributors. Therefore,no liability is recorded on the consolidated balance sheets at December 30, 2006 and December 30, 2005 related tothis obligation.
The company also had standby letters of credit (“LOC’s”) outstanding of $4.2 million at both December 30,2006 and December 31, 2005, which reduce the availability of funds under the new credit facility. The outstandingLOC’s are for the benefit of certain insurance companies. None of the LOC’s are recorded as a liability on theconsolidated balance sheets.
Assets recorded under capital lease agreements included in property, plant and equipment consist ofmachinery and equipment and transportation equipment.
F-20
FLOWERS FOODS, INC. AND SUBSIDIARIES
NOTES TO CONSOLIDATED FINANCIAL STATEMENTS — (Continued)

Aggregate maturities of debt outstanding, including capital leases, as of December 30, 2006, are as follows(amounts in thousands):
2007 . . . . . . . . . . . . . . . . . . . . . . . . . . . . . . . . . . . . . . . . . . . . . . . . . . . . . . . . . . . . . . . . $ 7,406
2008 . . . . . . . . . . . . . . . . . . . . . . . . . . . . . . . . . . . . . . . . . . . . . . . . . . . . . . . . . . . . . . . . 6,8142009 . . . . . . . . . . . . . . . . . . . . . . . . . . . . . . . . . . . . . . . . . . . . . . . . . . . . . . . . . . . . . . . . 5,689
2010 . . . . . . . . . . . . . . . . . . . . . . . . . . . . . . . . . . . . . . . . . . . . . . . . . . . . . . . . . . . . . . . . 5,948
2011 . . . . . . . . . . . . . . . . . . . . . . . . . . . . . . . . . . . . . . . . . . . . . . . . . . . . . . . . . . . . . . . . 55,835
2012 and thereafter . . . . . . . . . . . . . . . . . . . . . . . . . . . . . . . . . . . . . . . . . . . . . . . . . . . . . 4,840
Total . . . . . . . . . . . . . . . . . . . . . . . . . . . . . . . . . . . . . . . . . . . . . . . . . . . . . . . . . . . . . . $86,532
Leases
The company leases certain property and equipment under various operating and capital lease arrangementsthat expire over the next 20 years. The property and equipment includes distribution facilities and thrift storelocations and equipment including production, sales and distribution and office equipment. Initial lease terms rangefrom two to twenty-five years. Many of the operating leases provide the company with the option, after the initiallease term, either to purchase the property at the then fair value or renew its lease at fair value rents for periods fromone month to ten years. Rent escalations vary in these leases, from no escalation over the initial lease term, toescalations linked to changes in economic variables such as the Consumer Price Index. The capital leases areprimarily used for distribution vehicle financing and provide the company with the option to purchase the vehiclesat a fixed residual or fair value at the end of the lease term. Future minimum lease payments under scheduled leasesthat have initial or remaining noncancelable terms in excess of one year are as follows:
Capital Leases Operating Leases(Amounts in thousands)
2007 . . . . . . . . . . . . . . . . . . . . . . . . . . . . . . . . . . . . . . . . . . . . . . . $ 7,294 $ 32,392
2008 . . . . . . . . . . . . . . . . . . . . . . . . . . . . . . . . . . . . . . . . . . . . . . . 6,406 29,287
2009 . . . . . . . . . . . . . . . . . . . . . . . . . . . . . . . . . . . . . . . . . . . . . . . 6,062 27,289
2010 . . . . . . . . . . . . . . . . . . . . . . . . . . . . . . . . . . . . . . . . . . . . . . . 5,956 23,482
2011 . . . . . . . . . . . . . . . . . . . . . . . . . . . . . . . . . . . . . . . . . . . . . . . 3,612 20,467
2012 and thereafter . . . . . . . . . . . . . . . . . . . . . . . . . . . . . . . . . . . . 4,021 58,829
Total minimum payments . . . . . . . . . . . . . . . . . . . . . . . . . . . . . . 33,351 $191,746
Amount representing interest . . . . . . . . . . . . . . . . . . . . . . . . . . . . . 5,243
Obligations under capital leases . . . . . . . . . . . . . . . . . . . . . . . . . . . 28,108
Obligations due within one year . . . . . . . . . . . . . . . . . . . . . . . . . . . 5,595
Long-term obligations under capital leases . . . . . . . . . . . . . . . . . . . $22,513
Rent expense for all operating leases amounted to $45.7 million for fiscal 2006, $39.4 million for fiscal 2005and $30.9 million for fiscal 2004.
Guarantees and Indemnification Obligations
The company has provided various representations, warranties and other standard indemnifications in variousagreements with customers, suppliers and other parties as well as in agreements to sell business assets or leasefacilities. In general, these provisions indemnify the counterparty for matters such as breaches of representationsand warranties, certain environmental conditions and tax matters, and, in the context of sales of business assets, any
F-21
FLOWERS FOODS, INC. AND SUBSIDIARIES
NOTES TO CONSOLIDATED FINANCIAL STATEMENTS — (Continued)

liabilities arising prior to the closing of the transactions. Non-performance under a contract could trigger anobligation of the company. The ultimate effect on future financial results is not subject to reasonable estimationbecause considerable uncertainty exists as to the final outcome of any potential claims.
No material guarantees or indemnifications have been entered into by the company through December 30, 2006.
Note 12. Variable Interest Entity
The company maintains a transportation agreement with a thinly capitalized entity. This entity transports asignificant portion of the company’s fresh bakery products from the company’s production facilities to outlyingdistribution centers. The company represents a significant portion of the entity’s revenue. This entity qualifies as aVariable Interest Entity (“VIE”), but not a Special Purpose Entity and, under FIN 46, the company is the primarybeneficiary. In accordance with FIN 46, the company consolidated this entity effective with the first quarter of fiscal2004. There was no cumulative effect recorded. The VIE has collateral that is sufficient to meet its capital lease andother debt obligations, and the owner of the VIE personally guarantees the obligations of the VIE. The VIE’screditors have no recourse against the general credit of the company.
Following is the effect of the VIE during fiscal 2006, fiscal 2005 and fiscal 2004:
VIE % of Total VIE % of Total VIE % of TotalFiscal 2006 Fiscal 2005 Fiscal 2004
(Dollars in thousands)
Assets as of respective fiscal year ends . . $33,194 3.7% $28,137 3.3% $22,579 2.6%
Sales . . . . . . . . . . . . . . . . . . . . . . . . . . . $12,633 0.7% $12,402 0.7% $12,403 0.8%
Income from continuing operationsbefore income taxes, minority interest,and cumulative effect of a change inaccounting principle . . . . . . . . . . . . . . $ 3,255 2.6% $ 2,904 2.7% $ 1,769 1.9%
The assets consist primarily of $23.9 million, $21.1 million and $16.2 million, respectively, of transportationequipment recorded as capital lease obligations.
Note 13. Fair Value of Financial Instruments
The carrying value of cash and cash equivalents, accounts and notes receivable and short-term debtapproximates fair value because of the short-term maturity of the instruments. SFAS No. 107, Disclosures aboutFair Value of Financial Instruments, states that the appropriate interest rate that should be used to estimate the fairvalue of the distributor notes should be the current market rate at which similar loans would be made to distributorswith similar credit ratings and for the same maturities. However, the company utilizes approximately 3,000independent distributors all with varied financial histories and credit risks. Considering the diversity of credit risksamong the independent distributors, the company has no method to accurately determine a market interest rate. Thecarrying value of the distributor notes at December 30, 2006 and December 31, 2005 were $84.3 million and$79.3 million, respectively, with an interest rate of 12%. The fair value of the company’s long-term debt atDecember 30, 2006 approximates the recorded value due to the variable nature of the stated interest rates. The fairvalue of the company’s outstanding derivative financial instruments based on valuation models using quoted marketprices as of December 30, 2006 and December 31, 2005, was $1.1 million and $0.1 million, respectively.
Note 14. Stockholders’ Equity
Flowers Foods’ articles of incorporation provide that its authorized capital consist of 100,000,000 shares ofcommon stock having a par value of $0.01 per share and 1,000,000 shares of preferred stock of which(a) 100,000 shares have been designated by the Board of Directors as Series A Junior Participating PreferredStock, having a par value per share of $100 and (b) 900,000 shares of preferred stock, having a par value per share of
F-22
FLOWERS FOODS, INC. AND SUBSIDIARIES
NOTES TO CONSOLIDATED FINANCIAL STATEMENTS — (Continued)

$0.01, have not been designated by the Board of Directors. No shares of preferred stock have been issued byFlowers Foods.
Common Stock
The holders of Flowers Foods common stock are entitled to one vote for each share held of record on allmatters submitted to a vote of shareholders. Subject to preferential rights of any issued and outstanding preferredstock, including the Series A Preferred Stock, holders of common stock are entitled to receive ratably suchdividends, if any, as may be declared by the Board of Directors of the company out of funds legally available. In theevent of a liquidation, dissolution or winding-up of the company, holders of common stock are entitled to shareratably in all assets of the company, if any, remaining after payment of liabilities and the liquidation preferences ofany issued and outstanding preferred stock, including the Series A Preferred Stock. Holders of common stock haveno preemptive rights, no cumulative voting rights and no rights to convert their shares of common stock into anyother securities of the company or any other person.
Preferred Stock
The Board of Directors has the authority to issue up to 1,000,000 shares of preferred stock in one or more seriesand to fix the designations, relative powers, preferences, rights, qualifications, limitations and restrictions of allshares of each such series, including without limitation, dividend rates, conversion rights, voting rights, redemptionand sinking fund provisions, liquidation preferences and the number of shares constituting each such series, withoutany further vote or action by the holders of Flowers Foods common stock. Pursuant to such authority, the Board ofDirectors has designated 100,000 shares of preferred stock as Series A Junior Participating Preferred Stock inconnection with the adoption of the rights plan described below. Although the Board of Directors does not presentlyintend to do so, it could issue from the 900,000 undesignated preferred shares, additional series of preferred stock,with rights that could adversely affect the voting power and other rights of holders of Flowers Foods common stockwithout obtaining the approval of Flowers Foods shareholders. In addition, the issuance of preferred shares coulddelay or prevent a change in control of Flowers Foods without further action by its shareholders.
Shareholder Rights Plan
In 2001, the Flowers Foods Board of Directors approved and adopted a shareholder rights plan that providedfor the issuance of one right for each share of Flowers Foods common stock held by shareholders of record onMarch 26, 2001. Under the plan, the rights trade together with the common stock and are not exercisable. In theabsence of further board action, the rights generally will become exercisable, and allow the holder to acquireadditional common stock, if a person or group acquires 15% or more of the outstanding shares of Flowers Foodscommon stock. Rights held by persons who exceed the applicable threshold will be void. Flowers Foods’ Board ofDirectors may, at its option, redeem all rights for $0.01 per right generally at any time prior to the rights becomingexercisable. The rights will expire on March 26, 2011, unless earlier redeemed, exchanged or amended by the Boardof Directors.
On November 15, 2002, the Board of Directors of Flowers Foods approved an amendment to the company’sshareholder rights plan allowing certain investors, including existing investors and qualified institutional investors,to beneficially own up to 20% of the company’s outstanding common stock without triggering the exerciseprovisions.
Stock Repurchase Plan
On December 19, 2002, the Board of Directors approved a plan that authorized stock repurchases of up to11.3 million shares of the company’s common stock. On November 18, 2005, the Board of Directors increased thenumber of authorized shares to 15.3 million shares. Under the plan, the company may repurchase its common stockin open market or privately negotiated transactions at such times and at such prices as determined to be in the
F-23
FLOWERS FOODS, INC. AND SUBSIDIARIES
NOTES TO CONSOLIDATED FINANCIAL STATEMENTS — (Continued)

company’s best interest. The company repurchases its common stock primarily for issuance under the company’sstock compensation plans and to fund possible future acquisitions. These purchases may be commenced orsuspended without prior notice depending on then-existing business or market conditions and other factors. As ofDecember 30, 2006, 11.8 million shares at a cost of $247.1 million have been purchased under this plan. Included inthese amounts are 2.3 million shares at a cost of $63.6 million purchased during fiscal 2006.
Dividends
During fiscal 2006, fiscal 2005 and fiscal 2004, the company paid dividends of $29.0 million, or $0.475 pershare, $23.7 million, or $0.383 per share and $20.8 million, or $0.316 per share, respectively.
Stock Split
On June 3, 2005, the Board of Directors declared a 3-for-2 stock split payable on July 1, 2005, which resultedin the issuance of 22.6 million shares.
Note 15. Stock Based Compensation
Effective January 1, 2006, the company adopted SFAS 123R, which requires that the value of stock options andsimilar awards be expensed. SFAS 123R applies to any unvested awards that were outstanding on the effective dateand to all new awards granted or modified after the effective date. The company adopted SFAS 123R using themodified prospective transition method. This method requires the company to expense the remaining unrecognizedportion of unvested awards outstanding at the effective date and any awards granted or modified after the effectivedate, but does not require restatement of prior periods. Therefore, the company’s income statements for the fifty-two weeks ended December 31, 2005 and January 1, 2005 have not been restated to reflect the impact ofSFAS 123R. See Note 2 for disclosure of pro forma results for these reporting periods. Under this transition method,compensation expense recognized during the fifty-two weeks ended December 30, 2006 included: (i) compensationexpense for share-based awards granted prior to, but not vested as of, December 31, 2005, based on the grant datefair value estimated in accordance with the original provisions of SFAS 123, and (ii) compensation expense forshare-based awards granted subsequent to December 31, 2005, based on the grant date fair value estimated inaccordance with the provisions of SFAS 123R.
In accordance with FASB Staff Position FAS 123R-3, Transition Election to Accounting for the Tax Effects ofShare Based Payment Awards, the company applied the short-cut method for determining its Capital in Excess ofPar Value Pool (“APIC Pool”). This includes simplified methods to establish the beginning balance of theAPIC Pool related to the tax effects of share-based compensation, and to determine the subsequent impact on theAPIC Pool and consolidated statements of cash flows of the tax effects of share-based awards that are outstandingupon adoption of SFAS 123R.
Flowers Foods’ 2001 Equity and Performance Incentive Plan (“EPIP”) authorizes the compensation com-mittee of the Board of Directors to make awards of options to purchase our common stock, restricted stock,performance stock and performance units and deferred stock. Our officers, key employees and non-employeedirectors (whose grants are generally approved by the full board of directors) are eligible to receive awards underthe EPIP. The aggregate number of shares that may be issued or transferred under the EPIP is 9,750,000 shares.Over the life of the EPIP, the company has only issued options and restricted stock. Options granted prior toJanuary 1, 2006 may not be exercised later than ten years after the date of grant and become exercisable four yearsfrom the date of grant and generally vest at that time or upon change in control of Flowers Foods. Options grantedon January 3, 2006 may not be exercised later than seven years after the date of grant and become exercisable threeyears from the date of grant and generally vest at that time or upon change in control of Flowers Foods. Non-employee director options generally become exercisable one year from the date of grant and vest at that time. Thefollowing is a summary of stock options and restricted stock outstanding under the EPIP. Information relating to thecompany’s stock appreciation rights which are not issued under the EPIP is also disclosed below.
F-24
FLOWERS FOODS, INC. AND SUBSIDIARIES
NOTES TO CONSOLIDATED FINANCIAL STATEMENTS — (Continued)

Stock Options
On January 3, 2006 and during fiscal 2003 and fiscal 2001, non-qualified stock options (“NQSOs”) topurchase 437,300 shares, 2,138,175 shares and 3,445,200 shares, respectively were granted to eligible employeespursuant to the EPIP. In fiscal 2001, NQSOs to purchase 303,750 shares were granted to non-employee directors.The optionees are required to pay the market value, determined as of the grant date, which was $28.02 for the fiscal2006 grant, $14.01 for the fiscal 2003 grant and $6.31 for the fiscal 2001 grant, to exercise these options. Duringfiscal 2005, the employee options awarded in fiscal 2001 vested. As of December 30, 2006, there were 241,851NQSOs outstanding with an exercise price of $6.31, 2,055,000 NQSOs outstanding with an exercise price of$14.01, which will vest in July 2007, and 435,400 NQSOs outstanding with an exercise price of $28.02, which willvest in January 2009.
The stock option activity for fiscal 2006, fiscal 2005 and fiscal 2004 pursuant to the EPIP is set forth below:
Options
WeightedAverageExercise
Price Options
WeightedAverageExercise
Price Options
WeightedAverageExercise
Price
December 30, 2006 December 31, 2005 January 1, 2005For the 52 Weeks Ended
(Amounts in thousands, except price data)
Outstanding at beginning of year . . 3,306 $11.14 5,035 $ 9.59 5,441 $9.35
Granted . . . . . . . . . . . . . . . . . . . . . 437 $28.02 — — — —
Exercised . . . . . . . . . . . . . . . . . . . (998) $ 6.37 (1,729) $ 6.60 (406) $6.31
Forfeitures . . . . . . . . . . . . . . . . . . . (13) $16.12 — — — —
Outstanding at end of year . . . . . . . 2,732 $15.56 3,306 $11.14 5,035 $9.59
Exercisable at end of year . . . . . . . 600 1,599 1,313
Weighted average fair value ofoptions granted during the year . . $28.02 $ — $ —
As of December 30, 2006, all options outstanding under the EPIP had an average exercise price of $15.56 and aweighted average remaining contractual life of 6.2 years.
During fiscal 2006, fiscal 2005 and fiscal 2004, the company recorded stock-based compensation expense of$3.9 million, $0 million and $0 million, respectively, relating to stock options using the Black-Scholes option-pricing model applying the following assumptions:
2006 Grant 2003 Grant
Weighted average fair value per share ($) . . . . . . . . . . . . . . . . . . . . . . . . . . 9.30 6.15
Dividend yield (%) . . . . . . . . . . . . . . . . . . . . . . . . . . . . . . . . . . . . . . . . . . 1.60 1.61
Expected volatility (%) . . . . . . . . . . . . . . . . . . . . . . . . . . . . . . . . . . . . . . . 36.00 36.89
Risk-free interest rate (%) . . . . . . . . . . . . . . . . . . . . . . . . . . . . . . . . . . . . . 4.25 4.35
Expected option life (years) . . . . . . . . . . . . . . . . . . . . . . . . . . . . . . . . . . . . 5.00 10.00
F-25
FLOWERS FOODS, INC. AND SUBSIDIARIES
NOTES TO CONSOLIDATED FINANCIAL STATEMENTS — (Continued)

The following is a description of the methods used to arrive at the above assumptions:
2006 Grant:
Dividend yield — estimated yield based on the historical dividend payment for the four most recent dividendpayments prior to the grant date.
Expected volatility — based on historical volatility over five years using daily stock prices.
Risk-free interest rate — United States Treasury Constant Maturity rates as of January 3, 2006 (grant date).
Expected option life — assumption is based on simplified formula determined in accordance with StaffAccounting Bulletin No. 107, Share-Based Payment.
2003 Grant:
Dividend yield — estimated dividend yield based on an annual dividend of $0.27.
Expected volatility — based on historical volatility over two years using daily stock prices.
Risk-free interest rate — United States Treasury Constant Maturity rates as of July 16, 2003 (grant date).
Expected option life — equals expected life of grant.
As of December 30, 2006, there was $4.1 million of total unrecognized compensation expense related tooutstanding stock options. This cost is expected to be recognized on a straight-line basis over a weighted-averageperiod of 1.5 years.
Cash received from option exercises during fiscal 2006, fiscal 2005 and fiscal 2004 was $6.4 million,$6.4 million and $1.2 million, respectively. The cash tax windfall benefit realized for the tax deductions from optionexercises was $8.5 million, $11.2 million and $2.0 million, respectively, during fiscal 2006, fiscal 2005 and fiscal2004. The total intrinsic value of stock options exercised was $21.9 million, $28.6 million and $5.1 million forfiscal 2006, fiscal 2005 and fiscal 2004, respectively.
Restricted Stock
On January 4, 2004, the effective date of his election as Chief Executive Officer, George Deese was granted75,000 shares of restricted stock pursuant to the EPIP. The fair value of these restricted shares on the date of grantwas approximately $1.3 million. These shares become fully vested on the fourth anniversary of the date of grant.The company recorded $0.3 million, $0.4 million and $0.3 million in compensation expense during fiscal 2006,fiscal 2005 and fiscal 2004, respectively, related to this restricted stock.
During the second quarter of fiscal 2006, the second quarter of fiscal 2005, the first quarter of fiscal 2005 andthe second quarter of fiscal 2004, non-employee directors were granted an aggregate of 25,640 shares,29,340 shares, 1,404 shares and 20,280 shares, respectively, of restricted stock. The fair value of these restrictedshares on the date of grant was $0.7 million, $0.6 million, $0.1 million and $0.3 million, respectively. These sharesbecome fully vested on the first anniversary of the date of grant. The shares granted during fiscal 2005 vested infiscal 2006 and the shares granted in fiscal 2004, vested in fiscal 2005. The company recorded $0.7 million,$0.6 million and $0.2 million in compensation expense during fiscal 2006, fiscal 2005 and fiscal 2004, respectively,related to this restricted stock.
On January 3, 2006, certain key employees were granted 135,700 shares of restricted stock, which containcertain performance and market conditions, at a grant date price of $28.02. These shares vest on January 3, 2008. Inorder for these shares to vest and become nonforfeitable on this date, the following performance measure must beachieved by the company: the company’s average return on invested capital calculated on continuing operations forthe cumulative two year vesting period (fiscal 2006 and fiscal 2007) must equal or exceed its weighted average cost of
F-26
FLOWERS FOODS, INC. AND SUBSIDIARIES
NOTES TO CONSOLIDATED FINANCIAL STATEMENTS — (Continued)

capital for the same two year period. In the event this performance measure is achieved, the awards vest. However, thenumber of awards exercisable will be adjusted according to achievement of a management objective based on therelative performance of the company’s total return to shareholders (“company’s TSR”) determined for its 2006 and2007 fiscal years compared to the total return to shareholders of the Standard & Poor’s 500 Packaged Food and MeatIndex (“S&P TSR”) for the same, or approximately the same, period (a market condition). Based on this comparison,the grant will be modified as follows: (i) if the company’s TSR is equal to the fiftieth percentile S&P TSR, there will beno adjustment; (ii) if the company’s TSR is less than the S&P TSR, the grant will be reduced by 1.3% for eachpercentile below the fiftieth by which the company’s TSR is less than the S&P TSR at the fiftieth percentile, but in noevent will the reduction exceed twenty percent; and (iii) if the company’s TSR exceeds the S&P TSR at the fiftiethpercentile, the grant will be increased by 1.3% for each percentile above the fiftieth by which the company’s TSRexceeds the S&P TSR at the fiftieth percentile, but in no event will the increase exceed twenty percent. The estimatedfair value of this restricted stock is $29.16, and the company recorded expense of $2.0 million during the fifty-twoweeks ended December 30, 2006 related to this restricted stock. The fair value estimate was determined using a MonteCarlo simulation model, which utilizes multiple input variables to determine the probability of the company achievingthe market condition discussed above. Inputs into the model included the following for the company and comparatorcompanies: (i) total stockholder return from the beginning of the performance cycle through the measurement date;(ii) volatility; (iii) risk-free interest rates; and (iv) the correlation of the comparator companies’ total stockholderreturn. The inputs are based on historical capital market data.
The restricted stock activity for fiscal 2006, fiscal 2005 and fiscal 2004 is set forth below:
Number ofShares
WeightedAverage Fair
ValueNumber of
Shares
WeightedAverage Fair
ValueNumber of
Shares
WeightedAverage Fair
Value
December 30, 2006 December 31, 2005 January 1, 2005For the 52 Weeks Ended
(Amounts in thousands, except price data)
Balance at beginning ofyear . . . . . . . . . . . . . . . 106 $18.67 95 $17.09 — —
Granted . . . . . . . . . . . . . . 162 $29.17 31 $22.25 95 $17.09
Vested . . . . . . . . . . . . . . . (31) $22.25 (20) $16.45 — —
Forfeitures. . . . . . . . . . . . (1) $29.16 — — — —
Balance at end of year . . . 236 $25.37 106 $18.67 95 $17.09
As of December 30, 2006, there was $2.6 million of total unrecognized compensation expense related tounvested restricted stock. This cost is expected to be recognized on a straight-line basis over a weighted-averageperiod of 0.9 years.
Stock Appreciation Rights
The company previously awarded stock appreciation rights (“rights”) to key employees throughout thecompany. These rights vest at the end of four years and are payable in cash equal to the difference between the grantprice and the fair market value of the rights on the vesting date plus dividends accrued during the vesting period. Inaccordance with SFAS 123R, the company records compensation expense for these rights on measurement datesbased on changes between the grant price and an estimated fair value of the rights using the Black-Scholes option-pricing model. Prior to the adoption of SFAS 123R (fiscal 2005 and fiscal 2004), the company computed expense onthe vested portion of the rights as the difference between the grant date market value of its stock and the marketvalue of its stock at the end of the respective reporting period. During fiscal 2006, fiscal 2005, and fiscal 2004, thecompany recorded expense of $1.5 million, $2.3 million and $7.8 million, respectively, related to these rights.
The company also allows non-employee directors to convert their retainers and committee chairman fees intorights. These rights vest after one year and can be exercised over nine years. The company records compensation
F-27
FLOWERS FOODS, INC. AND SUBSIDIARIES
NOTES TO CONSOLIDATED FINANCIAL STATEMENTS — (Continued)

expense for these rights at a measurement date based on changes between the grant price and an estimated fair valueof the rights using the Black-Scholes option-pricing model. Prior to the adoption of SFAS 123R (fiscal 2005 andfiscal 2004), the company computed expense on the vested portion of the rights as the difference between the grantdate market value of its stock and the market value of its stock at the end of the respective reporting period. Duringfiscal 2006, fiscal 2005 and fiscal 2004 the company recorded expense of $0.1 million, $1.0 million and$0.4 million, respectively, related to these rights.
The fair value of the rights at December 30, 2006 ranged from $28.61 to $39.62. The following assumptionswere used to determine fair value of the rights discussed above using the Black-Scholes option-pricing model atDecember 30, 2006: dividend yield 1.70%; expected volatility 34.00%; risk-free interest rate 4.76% and expectedlife of 0.50 years to 4.90 years.
The rights activity for fiscal 2006, fiscal 2005 and fiscal 2004 is set forth below:
December 30,2006
December 31,2005
January 1,2005
For the 52 Weeks Ended
(Amounts in thousands, except price data)
Balance at beginning of year . . . . . . . . . . . . . . . . . . . . . . . 623 1,649 1,666
Rights granted . . . . . . . . . . . . . . . . . . . . . . . . . . . . . . . . . 25 34 28
Rights vested . . . . . . . . . . . . . . . . . . . . . . . . . . . . . . . . . . — (1,035) (45)
Rights exercised . . . . . . . . . . . . . . . . . . . . . . . . . . . . . . . . (29) (15) —
Forfeitures . . . . . . . . . . . . . . . . . . . . . . . . . . . . . . . . . . . . — (10) —
Balance at end of year . . . . . . . . . . . . . . . . . . . . . . . . . . . 619 623 1,649
Weighted average — grant date fair value . . . . . . . . . . . . . $14.68 $ 14.10 $ 8.79
As a result of the adoption of SFAS 123R on January 1, 2006, the company recorded as an expense acumulative effect of a change in accounting principle of $0.9 million ($0.6 million, net of income tax benefit)relating to its stock appreciation rights. This was a result of the liability as of January 1, 2006 (the day of adoption ofSFAS 123R) as computed using the Black-Scholes pricing model being greater than the recorded liability on thatday. Prior to the adoption of SFAS 123R, the company computed expense on the vested portion of the rights as thedifference between the grant date market value of its stock and the market value of its stock at the end of therespective reporting period.
F-28
FLOWERS FOODS, INC. AND SUBSIDIARIES
NOTES TO CONSOLIDATED FINANCIAL STATEMENTS — (Continued)

Stock-Based Compensation Expense Summary
Stock-based compensation expense recognized during fiscal 2006, fiscal 2005 and fiscal 2004 is set forthbelow:
December 30,2006
December 31,2005
January 1,2005
For the 52 Weeks Ended
(Amounts in thousands, except price data)
Total stock-based compensation expense included in selling,marketing and administrative expenses . . . . . . . . . . . . . . . $8,595 $4,232 $8,746
Income tax effect . . . . . . . . . . . . . . . . . . . . . . . . . . . . . . . . . 3,154 1,595 3,367
Total stock-based compensation expense included in incomefrom continuing operations before cumulative effect of achange in accounting principle . . . . . . . . . . . . . . . . . . . . . $5,441 $2,637 $5,379
Impact on earnings per share on income from continuingoperations before cumulative effect of a change inaccounting principle: . . . . . . . . . . . . . . . . . . . . . . . . . . . . .
Basic . . . . . . . . . . . . . . . . . . . . . . . . . . . . . . . . . . . . . . . . $ (0.09) $ (0.04) $ (0.08)
Diluted . . . . . . . . . . . . . . . . . . . . . . . . . . . . . . . . . . . . . . . $ (0.09) $ (0.04) $ (0.08)
Note 16. Comprehensive Income (Loss)
The company had other comprehensive income (losses) resulting from its accounting for derivative financialinstruments and additional minimum liability related to its defined benefit pension plans. Total comprehensiveincome, determined as net income adjusted by other comprehensive income (loss), was $94.4 million, $72.0 millionand $46.4 million for fiscal 2006, fiscal 2005 and fiscal 2004, respectively.
During fiscal 2006, fiscal 2005 and fiscal 2004, changes to accumulated other comprehensive loss, net ofincome tax, were as follows:
2006 2005 2004(Amounts in thousands)
Accumulated other comprehensive loss, beginning balance . . . . . $(11,937) $(22,710) $(18,378)
Derivative transactions:
Net deferred gains on closed contracts, net of income tax of$981, $4 and $38, respectively . . . . . . . . . . . . . . . . . . . . . . 1,567 6 60
Reclassified to earnings (materials, labor and other productioncosts), net of income tax of $(1,095), $30 and $(4),respectively . . . . . . . . . . . . . . . . . . . . . . . . . . . . . . . . . . . . (1,748) 48 (6)
Effective portion of change in fair value of hedginginstruments, net of income tax of $(436), $4,805 and$(5,927), respectively . . . . . . . . . . . . . . . . . . . . . . . . . . . . . (697) 7,675 (9,468)
Additional minimum pension liability, net of income tax of$8,904, $1,905 and $3,184, respectively . . . . . . . . . . . . . . . . . 14,225 3,044 5,082
Cumulative effect of change in accounting principle (SeeNote 18), net of income tax of $(6,027) . . . . . . . . . . . . . . . . . (9,630) — —
Accumulated other comprehensive loss, ending balance . . . . . . . $ (8,220) $(11,937) $(22,710)
F-29
FLOWERS FOODS, INC. AND SUBSIDIARIES
NOTES TO CONSOLIDATED FINANCIAL STATEMENTS — (Continued)

The balance of accumulated other comprehensive loss consists of the following:
December 30,2006
December 31,2005
(Amounts in thousands)
Derivative financial instruments . . . . . . . . . . . . . . . . . . . . . . . . . . . . . . $ 1,410 $ 2,288
Pension and postretirement related . . . . . . . . . . . . . . . . . . . . . . . . . . . . (9,630) (14,225)
Total . . . . . . . . . . . . . . . . . . . . . . . . . . . . . . . . . . . . . . . . . . . . . . . . $(8,220) $(11,937)
Note 17. Earnings Per Share
Net income per share is calculated using the weighted average number of common and common equivalentshares outstanding during each period. The common stock equivalents consists primarily of the incremental sharesassociated with the company’s stock compensation plans. The following table sets forth the computation of basicand diluted net income per share:
December 30,2006
December 31,2005
January 1,2005
For the 52 Weeks Ended
(Amounts in thousands, except per share data)
NumeratorIncome from continuing operations before cumulative
effect of a change in accounting principle . . . . . . . . . . . $74,880 $62,858 $54,260
Income (loss) from discontinued operations . . . . . . . . . . . . 6,731 (1,627) (3,486)
Cumulative effect of a change in accounting principle . . . . (568) — —
Net income . . . . . . . . . . . . . . . . . . . . . . . . . . . . . . . . . . . . $81,043 $61,231 $50,774
DenominatorBasic weighted average shares outstanding . . . . . . . . . . . . 60,822 61,791 65,750
Add: Shares of common stock assumed upon vesting andexercise of stock awards . . . . . . . . . . . . . . . . . . . . . . . . 911 1,788 1,705
Diluted weighted average shares outstanding . . . . . . . . . . . 61,733 63,579 67,455
Net Income Per Common Share:BasicIncome from continuing operations before cumulative
effect of a change in accounting principle . . . . . . . . . . . $ 1.23 $ 1.02 $ 0.82
Income (loss) from discontinued operations . . . . . . . . . . . . 0.11 (0.03) (0.05)
Cumulative effect of a change in accounting principle . . . . (0.01) — —
Net income . . . . . . . . . . . . . . . . . . . . . . . . . . . . . . . . . . . . $ 1.33 $ 0.99 $ 0.77
DilutedIncome from continuing operations before cumulative
effect of a change in accounting principle . . . . . . . . . . . $ 1.21 $ 0.99 $ 0.80
Income (loss) from discontinued operations . . . . . . . . . . . . 0.11 (0.03) (0.05)
Cumulative effect of a change in accounting principle . . . . (0.01) — —
Net income . . . . . . . . . . . . . . . . . . . . . . . . . . . . . . . . . . . . $ 1.31 $ 0.96 $ 0.75
F-30
FLOWERS FOODS, INC. AND SUBSIDIARIES
NOTES TO CONSOLIDATED FINANCIAL STATEMENTS — (Continued)

Stock options to purchase 435,400 shares of common stock and 159,990 shares of restricted stock were notincluded in the computation of diluted earnings per share for the fifty-two weeks ended December 30, 2006 becausetheir effect would have been anti-dilutive.
Note 18. Postretirement Plans
On September 29, 2006, the FASB issued SFAS No. 158, Employers’ Accounting for Defined Benefit Pensionand other Postretirement Plans, an amendment of FASB Statements No. 87, 88, 106 and 132(R) (“SFAS 158”).SFAS 158 requires recognition of the overfunded or underfunded status of pension and other postretirement benefitplans on the balance sheet. Under SFAS 158, gains and losses, prior service costs and credits, and any remainingtransition amounts under FASB Statement No. 87, Employers’ Accounting for Pensions (“SFAS 87”) and FASBStatement No. 106, Employers’ Accounting for Postretirement Benefits Other Than Pensions (“SFAS 106”) thathave not yet been recognized through net periodic benefit costs will be recognized in accumulated othercomprehensive income, net of tax effects, until they are amortized as a component of net periodic cost. SFAS 158does not change how pensions and other postretirement benefits are accounted for and reported in the incomestatement. Companies will continue to follow the existing guidance in SFAS 87, FASB Statement No. 88,Employers’ Accounting for Settlements and Curtailments of Defined Benefit Pension Plans and for TerminationBenefits and SFAS 106. SFAS 158 was effective for public companies for fiscal years ending after December 15,2006. The company adopted the balance sheet recognition provisions of SFAS 158 at December 30, 2006, the end ofits fiscal year 2006. The incremental effect of adopting SFAS 158 is summarized below:
BeforeAdoptingSFAS 158
Adjustmentsto AdoptSFAS 158
AfterAdoptingSFAS 158
(Amounts in thousands)
Assets:Noncurrent benefit asset — increase (decrease) . . . . . . . . . . . $21,636 $(14,161) $ 7,475
Deferred tax asset — increase (decrease) . . . . . . . . . . . . . . . . $ 8,330 $ (5,452) $ 2,878
Liabilities:Current benefit liability — increase . . . . . . . . . . . . . . . . . . . . $ — $ 390 $ 390
Noncurrent benefit liability — increase . . . . . . . . . . . . . . . . . $ 6,515 $ 1,106 $ 7,621
Stockholders’ Equity:Accumulated other comprehensive income — (decrease) . . . . . . $ 1,410 $ (9,630) $(8,220)
SFAS 158 also requires that employers measure the benefit obligation and plan assets as of the fiscal year endfor fiscal years ending after December 15, 2008. The company currently uses a September 30 measurement date forits postretirement plans. The company intends to eliminate the early measurement date in 2007.
Defined Benefit Plans
The company has trusteed, noncontributory defined benefit pension plans covering certain employees. Thebenefits are based on years of service and the employee’s career earnings. The plans are funded at amountsdeductible for income tax purposes but not less than the minimum funding required by the Employee RetirementIncome Security Act of 1974 (“ERISA”). As of December 30, 2006 and December 31, 2005, the assets of the plansincluded certificates of deposit, marketable equity securities, mutual funds, corporate and government debtsecurities, private and public real estate partnerships, other diversifying strategies and annuity contracts. In additionto the pension plans, the company also had an unfunded supplemental retirement plan for certain highlycompensated employees. Benefits provided by this supplemental plan were reduced by benefits provided underthe defined benefit pension plan. This supplemental plan was terminated and benefits of $0.6 million were paid tothe covered employees during the fourth quarter of fiscal 2005. This termination resulted in settlement costs of
F-31
FLOWERS FOODS, INC. AND SUBSIDIARIES
NOTES TO CONSOLIDATED FINANCIAL STATEMENTS — (Continued)

$0.1 million during fiscal 2005. One of the company’s defined benefit pension plans is not fully funded. Thecompany uses a September 30 measurement date for its plans.
During the third quarter of fiscal 2005, the company announced the curtailment of one of its defined benefitpension plans effective January 1, 2006, the beginning of the company’s fiscal year 2006. As a result of thecurtailment, a charge of $0.2 million was recorded in the third quarter of fiscal 2005 due to accelerated recognitionof prior service costs. The company expects pension income of approximately $5.7 million for fiscal 2007.
The net periodic pension cost for the company’s pension plans include the following components:
December 30,2006
December 31,2005
January 1,2005
For the 52 Weeks Ended
(Amounts in thousands)
Service cost . . . . . . . . . . . . . . . . . . . . . . . . . . . . . . . . . . . $ 1,812 $ 6,258 $ 6,037
Interest cost . . . . . . . . . . . . . . . . . . . . . . . . . . . . . . . . . . . 15,755 16,024 15,368
Expected return on plan assets. . . . . . . . . . . . . . . . . . . . . . (20,792) (18,286) (15,153)
Amortization:
Prior service cost . . . . . . . . . . . . . . . . . . . . . . . . . . . . . . . — 46 51
Actuarial loss . . . . . . . . . . . . . . . . . . . . . . . . . . . . . . . . . . 25 1,994 2,649
Net periodic pension (income) cost . . . . . . . . . . . . . . . . . . (3,200) 6,036 8,952
Curtailment loss . . . . . . . . . . . . . . . . . . . . . . . . . . . . . . — 225 —
Settlement loss . . . . . . . . . . . . . . . . . . . . . . . . . . . . . . . — 118 —
Total net periodic benefit (income) cost . . . . . . . . . . . . . . . $ (3,200) $ 6,379 $ 8,952
Actual return on plan assets for fiscal 2006, fiscal 2005 and fiscal 2004 was $24.0 million, $40.8 million and$21.9 million, respectively.
No amounts will be amortized from accumulated other comprehensive income into net periodic benefit cost infiscal 2007 relating to the company’s pension plans.
F-32
FLOWERS FOODS, INC. AND SUBSIDIARIES
NOTES TO CONSOLIDATED FINANCIAL STATEMENTS — (Continued)

The funding status and the amounts recognized in the Consolidated Balance Sheets for the company’s pensionplans are as follows:
December 30,2006
December 31,2005
(Amounts in thousands)
Change in benefit obligation:Benefit obligation at beginning of year . . . . . . . . . . . . . . . . . . . . . . . $277,544 $266,341Service cost . . . . . . . . . . . . . . . . . . . . . . . . . . . . . . . . . . . . . . . . . . . 1,812 6,258
Interest cost . . . . . . . . . . . . . . . . . . . . . . . . . . . . . . . . . . . . . . . . . . . 15,755 16,024
Actuarial (gain) loss . . . . . . . . . . . . . . . . . . . . . . . . . . . . . . . . . . . . . (5,975) 18,973
Curtailment . . . . . . . . . . . . . . . . . . . . . . . . . . . . . . . . . . . . . . . . . . . — (16,601)
Settlement . . . . . . . . . . . . . . . . . . . . . . . . . . . . . . . . . . . . . . . . . . . . — (565)
Benefits paid . . . . . . . . . . . . . . . . . . . . . . . . . . . . . . . . . . . . . . . . . . (12,271) (12,886)
Benefit obligation at end of year . . . . . . . . . . . . . . . . . . . . . . . . . . . . $276,865 $277,544
Change in plan assets:Fair value of plan assets at beginning of year . . . . . . . . . . . . . . . . . . $257,146 $204,276
Actual return on plan assets . . . . . . . . . . . . . . . . . . . . . . . . . . . . . . . 23,965 40,756
Employer contribution . . . . . . . . . . . . . . . . . . . . . . . . . . . . . . . . . . . 14,000 25,000
Benefits paid . . . . . . . . . . . . . . . . . . . . . . . . . . . . . . . . . . . . . . . . . . (12,271) (12,886)
Fair value of plan assets at end of year . . . . . . . . . . . . . . . . . . . . . . . $282,840 $257,146
Funded status, end of year:Fair value of plan assets . . . . . . . . . . . . . . . . . . . . . . . . . . . . . . . . . . $282,840 $257,146
Benefit obligations . . . . . . . . . . . . . . . . . . . . . . . . . . . . . . . . . . . . . . 276,865 277,544
Funded status . . . . . . . . . . . . . . . . . . . . . . . . . . . . . . . . . . . . . . . . . . 5,975 (20,398)
Unrecognized net actuarial loss. . . . . . . . . . . . . . . . . . . . . . . . . . . . . — 23,666
Amount recognized at end of year . . . . . . . . . . . . . . . . . . . . . . . . . . $ 5,975 $ 3,268
Amounts recognized in the balance sheet:Noncurrent asset . . . . . . . . . . . . . . . . . . . . . . . . . . . . . . . . . . . . . . . $ 7,475 $ —
Noncurrent liability . . . . . . . . . . . . . . . . . . . . . . . . . . . . . . . . . . . . . (1,500) —
Accrued benefit cost. . . . . . . . . . . . . . . . . . . . . . . . . . . . . . . . . . . . . — (19,861)
Accumulated other comprehensive income . . . . . . . . . . . . . . . . . . . . — 23,129
Amount recognized at end of year . . . . . . . . . . . . . . . . . . . . . . . . . . $ 5,975 $ 3,268
Amounts recognized in accumulated other comprehensive income:Net actuarial loss . . . . . . . . . . . . . . . . . . . . . . . . . . . . . . . . . . . . . . . $ 14,492 $ —
Accumulated benefit obligation at end of year . . . . . . . . . . . . . . . . . . $276,350 $277,006
The projected benefit obligation, accumulated benefit obligation and fair value of plan assets for pension planswith an accumulated benefit obligation and projected benefit obligation in excess of plan assets at December 30,2006 were $26.8 million, $26.3 million and $25.3 million, respectively. The projected benefit obligation,accumulated benefit obligation and fair value of plan assets for pension plans with an accumulated benefit
F-33
FLOWERS FOODS, INC. AND SUBSIDIARIES
NOTES TO CONSOLIDATED FINANCIAL STATEMENTS — (Continued)

obligation and projected benefit obligation in excess of plan assets at December 31, 2005 were $277.5 million,$277.0 million and $257.1 million, respectively.
Assumptions used in accounting for the company’s pension plans at each of the respective period-ends are asfollows:
December 30,2006
December 31,2005
January 1,2005
Weighted average assumptions used to determine benefitobligations:
Measurement date . . . . . . . . . . . . . . . . . . . . . . . . . . . . 9/30/2006 9/30/2005 9/30/2004
Discount rate . . . . . . . . . . . . . . . . . . . . . . . . . . . . . . . . 6.00% 5.75% 6.00%Rate of compensation increase . . . . . . . . . . . . . . . . . . . 3.50% 3.50% 3.50%
Weighted average assumptions used to determine net cost:
Measurement date . . . . . . . . . . . . . . . . . . . . . . . . . . . . 9/30/2005 9/30/2004 9/30/2003
Discount rate . . . . . . . . . . . . . . . . . . . . . . . . . . . . . . . . 5.75% 6.00% 6.00%
Expected return on plan assets . . . . . . . . . . . . . . . . . . . 8.00% 8.50% 8.50%
Rate of compensation increase . . . . . . . . . . . . . . . . . . . 3.50% 3.50% 3.50%
In developing the expected long-term rate of return on plan assets at each measurement date, the companyevaluates input from its investment advisors and actuaries in light of the plan assets’ historical actual returns,targeted asset allocation and current economic conditions. The average annual return on the plan assets for the last15 years is approximately 11.1% (net of investment expenses). Based on these factors the long-term rate of returnassumption for the plan was set at 8.0% for fiscal 2007.
Plan Assets
The plan asset allocation as of the plan measurement date for December 30, 2006 and December 31, 2005, andtarget asset allocations for 2007 are as follows:
Asset Category
TargetAllocation
2007 2006 2005
Percentage of PlanAssets at the
Measurement Date
Equity securities . . . . . . . . . . . . . . . . . . . . . . . . . . . . . . . . . . . . . . 40-60% 64.5% 67.4%
Debt securities . . . . . . . . . . . . . . . . . . . . . . . . . . . . . . . . . . . . . . . 10-40% 10.2% 9.9%
Real estate . . . . . . . . . . . . . . . . . . . . . . . . . . . . . . . . . . . . . . . . . . 0-25% 6.7% 6.0%
Other diversifying strategies(1) . . . . . . . . . . . . . . . . . . . . . . . . . . . 0-40% 13.2% 12.6%
Cash . . . . . . . . . . . . . . . . . . . . . . . . . . . . . . . . . . . . . . . . . . . . . . 0-25% 2.2% 1.4%
Other . . . . . . . . . . . . . . . . . . . . . . . . . . . . . . . . . . . . . . . . . . . . . . 0% 3.2% 2.7%
Total . . . . . . . . . . . . . . . . . . . . . . . . . . . . . . . . . . . . . . . . . . . . 100.0% 100.0%
(1) Includes, but not limited to, absolute return funds.
Equity securities include Flowers’ common stock of 1,231,219 shares and 1,231,219 shares in the amount of$33.2 million and $33.9 million (11.7% and 13.2% of total plan assets) as of December 30, 2006 and December 31,2005, respectively.
The Finance Committee (the “committee”) of the Board of Directors establishes investment guidelines andstrategies and regularly monitors the performance of the plans’ assets. Management is responsible for executingthese strategies and investing the pension assets in accordance with ERISA and fiduciary standards. The investment
F-34
FLOWERS FOODS, INC. AND SUBSIDIARIES
NOTES TO CONSOLIDATED FINANCIAL STATEMENTS — (Continued)

objective of the pension plans is to preserve the plans’ capital and maximize investment earnings within acceptablelevels of risk and volatility. The committee and members of management meet on a regular basis with its investmentadvisors to review the performance of the plans’ assets. Based upon performance and other measures andrecommendations from its investment advisors, the committee rebalances the plans’ assets to the targeted allocationwhen considered appropriate.
Cash Flows
Company contributions are as follows:
Year Required Discretionary(Amounts in thousands)
2005 . . . . . . . . . . . . . . . . . . . . . . . . . . . . . . . . . . . . . . . . . . . . . . . . . . . . . $— $25,000
2006 . . . . . . . . . . . . . . . . . . . . . . . . . . . . . . . . . . . . . . . . . . . . . . . . . . . . . $— $14,000
2007 . . . . . . . . . . . . . . . . . . . . . . . . . . . . . . . . . . . . . . . . . . . . . . . . . . . . . $— $ —
All contributions are made in cash. The contributions made during fiscal 2005 and fiscal 2006 were notrequired to be made by the minimum funding requirements of ERISA, but the company believes, due to its strongcash flow and financial position, these were the appropriate times in which to make the contributions in order toreduce the impact of future contributions. The company continues to assess various contribution scenarios and it hasnot made a determination whether it will make a discretionary pension contribution during fiscal 2007.
Benefit Payments
The following are benefits paid by the company during fiscal 2006, fiscal 2005, fiscal 2004 and expected to bepaid from fiscal 2007 through fiscal 2016. All benefits are expected to be paid from the plans’ assets.
Pension Benefits(Amounts in thousands)
2004 . . . . . . . . . . . . . . . . . . . . . . . . . . . . . . . . . . . . . . . . . . . . . . . . . . . . . . . $11,5402005 . . . . . . . . . . . . . . . . . . . . . . . . . . . . . . . . . . . . . . . . . . . . . . . . . . . . . . . $12,886
2006 . . . . . . . . . . . . . . . . . . . . . . . . . . . . . . . . . . . . . . . . . . . . . . . . . . . . . . . $12,271
Estimated Future Payments:
2007 . . . . . . . . . . . . . . . . . . . . . . . . . . . . . . . . . . . . . . . . . . . . . . . . . . . . . . . $12,902
2008 . . . . . . . . . . . . . . . . . . . . . . . . . . . . . . . . . . . . . . . . . . . . . . . . . . . . . . . $13,292
2009 . . . . . . . . . . . . . . . . . . . . . . . . . . . . . . . . . . . . . . . . . . . . . . . . . . . . . . . $13,689
2010 . . . . . . . . . . . . . . . . . . . . . . . . . . . . . . . . . . . . . . . . . . . . . . . . . . . . . . . $14,045
2011 . . . . . . . . . . . . . . . . . . . . . . . . . . . . . . . . . . . . . . . . . . . . . . . . . . . . . . . $14,368
2012 � 2016 . . . . . . . . . . . . . . . . . . . . . . . . . . . . . . . . . . . . . . . . . . . . . . . . . $81,216
Postretirement Benefit Plan
The company provides certain medical and life insurance benefits for eligible retired employees. The medicalplan covers eligible retirees under the active medical and dental plans. The plan incorporates an up-front deductible,coinsurance payments and employee contributions at COBRA premium levels. Eligibility and maximum period ofcoverage is based on age and length of service. The life insurance plan offers coverage to a closed group of retirees.In December 2003, the Medicare Prescription Drug, Improvement and Modernization Act of 2003 (the “Act”) wasenacted. The Act established a voluntary prescription drug benefit under Medicare, known as “Medicare Part D,”and a federal subsidy to sponsors of retiree health care benefit plans that provide a prescription drug benefit that is atleast actuarially equivalent to Medicare Part D. The company has determined that its prescription drug plan for
F-35
FLOWERS FOODS, INC. AND SUBSIDIARIES
NOTES TO CONSOLIDATED FINANCIAL STATEMENTS — (Continued)

retirees is not actuarially equivalent to Medicare Part D and that the Act will have no material effects on theobligations reported in these financial statements.
The net periodic postretirement benefit expense for the company includes the following components:
December 30,2006
December 31,2005
January 1,2005
For the 52 Weeks Ended
(Amounts in thousands)
Service cost . . . . . . . . . . . . . . . . . . . . . . . . . . . . . . . . . . . $ 321 $270 $246
Interest cost . . . . . . . . . . . . . . . . . . . . . . . . . . . . . . . . . . . 404 346 320
Amortization:
Prior service cost. . . . . . . . . . . . . . . . . . . . . . . . . . . . . . 333 333 333
Actuarial loss . . . . . . . . . . . . . . . . . . . . . . . . . . . . . . . . 21 — —
Total net periodic pension cost . . . . . . . . . . . . . . . . . . . . . $1,079 $949 $899
Approximately $0.3 million will be amortized from accumulated other comprehensive income into netperiodic benefit cost in fiscal 2007 relating to the company’s postretirement benefit plan.
F-36
FLOWERS FOODS, INC. AND SUBSIDIARIES
NOTES TO CONSOLIDATED FINANCIAL STATEMENTS — (Continued)

The unfunded status and the amounts recognized in the consolidated balance sheets for the company’spostretirement obligation are as follows:
December 30,2006
December 31,2005
(Amounts in thousands)
Change in benefit obligation:Benefit obligation at beginning of year . . . . . . . . . . . . . . . . . . . . . . . $ 6,420 $ 5,651Service cost . . . . . . . . . . . . . . . . . . . . . . . . . . . . . . . . . . . . . . . . . . . 321 270
Interest cost . . . . . . . . . . . . . . . . . . . . . . . . . . . . . . . . . . . . . . . . . . . 404 346
Participant contributions . . . . . . . . . . . . . . . . . . . . . . . . . . . . . . . . . . 195 171
Actuarial (gain) loss . . . . . . . . . . . . . . . . . . . . . . . . . . . . . . . . . . . . . (953) 533
Benefits paid . . . . . . . . . . . . . . . . . . . . . . . . . . . . . . . . . . . . . . . . . . (593) (551)
Federal subsidy on benefits paid . . . . . . . . . . . . . . . . . . . . . . . . . . . . — —
Acquisition (relates to acquisition of Derst Baking Company — seeNote 9) . . . . . . . . . . . . . . . . . . . . . . . . . . . . . . . . . . . . . . . . . . . . 792 —
Benefit obligation at end of year . . . . . . . . . . . . . . . . . . . . . . . . . . . . $ 6,586 $ 6,420
Change in plan assets:Fair value of plan assets at beginning of year . . . . . . . . . . . . . . . . . . $ — $ —
Employer contributions . . . . . . . . . . . . . . . . . . . . . . . . . . . . . . . . . . 398 380
Participant contributions . . . . . . . . . . . . . . . . . . . . . . . . . . . . . . . . . . 195 171
Benefits paid . . . . . . . . . . . . . . . . . . . . . . . . . . . . . . . . . . . . . . . . . . (593) (551)
Fair value of plan assets at end of year . . . . . . . . . . . . . . . . . . . . . . . $ — $ —
Funded status, end of year:Fair value of plan assets . . . . . . . . . . . . . . . . . . . . . . . . . . . . . . . . . . $ — $ —
Benefit obligations . . . . . . . . . . . . . . . . . . . . . . . . . . . . . . . . . . . . . . 6,586 6,420
Funded status . . . . . . . . . . . . . . . . . . . . . . . . . . . . . . . . . . . . . . . . . . (6,586) (6,420)
Contribution between measurement date and fiscal year end . . . . . . . 74 82
Unrecognized net actuarial loss. . . . . . . . . . . . . . . . . . . . . . . . . . . . . — 973
Unrecognized prior service cost . . . . . . . . . . . . . . . . . . . . . . . . . . . . — 1,498
Amount recognized at end of year . . . . . . . . . . . . . . . . . . . . . . . . . . $(6,512) $(3,867)
Amounts recognized in the balance sheet:Current liability . . . . . . . . . . . . . . . . . . . . . . . . . . . . . . . . . . . . . . . . $ (390) $ —
Noncurrent liability . . . . . . . . . . . . . . . . . . . . . . . . . . . . . . . . . . . . . (6,122) —
Accrued benefit cost. . . . . . . . . . . . . . . . . . . . . . . . . . . . . . . . . . . . . — (3,867)
Amount recognized at end of year . . . . . . . . . . . . . . . . . . . . . . . . . . $(6,512) $(3,867)
Amounts recognized in accumulated other comprehensive income:Prior service cost . . . . . . . . . . . . . . . . . . . . . . . . . . . . . . . . . . . . . . . $ 1,165 $ —
F-37
FLOWERS FOODS, INC. AND SUBSIDIARIES
NOTES TO CONSOLIDATED FINANCIAL STATEMENTS — (Continued)

Assumptions used in accounting for the company’s postretirement plans that are not fully funded at each of therespective period-ends are as follows:
December 30,2006
December 31,2005
January 1,2005
Weighted average assumptions used to determine benefitobligations:
Measurement date . . . . . . . . . . . . . . . . . . . . . . . . . . . . 9/30/2006 9/30/2005 9/30/2004
Discount rate . . . . . . . . . . . . . . . . . . . . . . . . . . . . . . . . 5.75% 5.75% 6.00%
Rate of compensation increase . . . . . . . . . . . . . . . . . . . N/A N/A N/A
Health care cost trend rate used to determine benefitobligations:
Initial rate . . . . . . . . . . . . . . . . . . . . . . . . . . . . . . . . . . 9.00% 10.00% 8.00%Ultimate rate . . . . . . . . . . . . . . . . . . . . . . . . . . . . . . . . 5.50% 5.50% 5.50%
Year trend reaches the ultimate rate . . . . . . . . . . . . . . . 2011 2011 2008
Weighted average assumptions used to determine net cost:
Measurement date . . . . . . . . . . . . . . . . . . . . . . . . . . . . 9/30/2005 9/30/2004 9/30/2003
Discount rate . . . . . . . . . . . . . . . . . . . . . . . . . . . . . . . . 5.75% 6.00% 6.00%
Expected return on plan assets . . . . . . . . . . . . . . . . . . . N/A N/A N/A
Rate of compensation increase . . . . . . . . . . . . . . . . . . . N/A N/A N/A
Health care cost trend rate used to determine net cost:
Initial rate . . . . . . . . . . . . . . . . . . . . . . . . . . . . . . . . . . 10.00% 8.00% 9.00%
Ultimate rate . . . . . . . . . . . . . . . . . . . . . . . . . . . . . . . . 5.50% 5.50% 5.50%
Year trend reaches the ultimate rate . . . . . . . . . . . . . . . 2011 2008 2008
Assumed health care cost trend rates have a significant effect on the amounts reported for the health care plans.A one-percentage change in assumed health care cost trend rates would have the following effects:
December 30,2006
December 31,2005
January 1,2005
December 30,2006
December 31,2005
January 1,2005
For the Year Ended For the Year EndedOne-Percentage Point Decrease One-Percentage Point Increase
(Amounts in thousands)
Effect on total of serviceand interest cost . . . . . $ (74) $ (68) $ (75) $ 65 $ 54 $ 49
Effect on postretirementbenefit obligation. . . . . $(392) $(678) $(549) $451 $696 $316
Cash Flows
YearMinimum Funding
Requirement Discretionary(Amounts in thousands)
2004 . . . . . . . . . . . . . . . . . . . . . . . . . . . . . . . . . . . . . . . . . . . . . . . $225 $—
2005 . . . . . . . . . . . . . . . . . . . . . . . . . . . . . . . . . . . . . . . . . . . . . . . $380 $—
2006 . . . . . . . . . . . . . . . . . . . . . . . . . . . . . . . . . . . . . . . . . . . . . . . $398 $—
2007 (Expected) . . . . . . . . . . . . . . . . . . . . . . . . . . . . . . . . . . . . . . $390 $—
All contributions are made in cash. Of the $0.4 million expected to be contributed to fund postretirementbenefit plans during 2007, the entire amount will be required to pay for benefits. Contributions by participants to
F-38
FLOWERS FOODS, INC. AND SUBSIDIARIES
NOTES TO CONSOLIDATED FINANCIAL STATEMENTS — (Continued)

postretirement benefits were $0.2 million, $0.2 million and $0.1 million for fiscal 2006, fiscal 2005 and fiscal 2004,respectively.
Benefit Payments
The following are benefits paid by the company during fiscal 2006, fiscal 2005 and fiscal 2004 and expected tobe paid from fiscal 2007 through fiscal 2016. All benefits are expected to be paid from the company’s assets.
Postretirement Benefits(Amounts in thousands)
2004 . . . . . . . . . . . . . . . . . . . . . . . . . . . . . . . . . . . . . . . . . . . . . . . . . . . . . . . $ 225
2005 . . . . . . . . . . . . . . . . . . . . . . . . . . . . . . . . . . . . . . . . . . . . . . . . . . . . . . . $ 380
2006 . . . . . . . . . . . . . . . . . . . . . . . . . . . . . . . . . . . . . . . . . . . . . . . . . . . . . . . $ 398
Estimated Future Payments:
2007 . . . . . . . . . . . . . . . . . . . . . . . . . . . . . . . . . . . . . . . . . . . . . . . . . . . . . . . $ 390
2008 . . . . . . . . . . . . . . . . . . . . . . . . . . . . . . . . . . . . . . . . . . . . . . . . . . . . . . . $ 402
2009 . . . . . . . . . . . . . . . . . . . . . . . . . . . . . . . . . . . . . . . . . . . . . . . . . . . . . . . $ 384
2010 . . . . . . . . . . . . . . . . . . . . . . . . . . . . . . . . . . . . . . . . . . . . . . . . . . . . . . . $ 414
2011 . . . . . . . . . . . . . . . . . . . . . . . . . . . . . . . . . . . . . . . . . . . . . . . . . . . . . . . $ 452
2012 � 2016 . . . . . . . . . . . . . . . . . . . . . . . . . . . . . . . . . . . . . . . . . . . . . . . . . $2,506
Other Plans
The company contributes to various multiemployer, union-administered defined benefit and defined contri-bution pension plans. Benefits provided under the multiemployer pension plans are generally based on years ofservice and employee age. Expense under these plans was $0.5 million for fiscal 2006, $0.5 million for fiscal 2005and $0.5 million for fiscal 2004.
The Flowers Foods 401(k) Retirement Savings Plan covers substantially all of the company’s employees whohave completed certain service requirements. The cost and contributions for those employees who also participatein the defined benefit pension plan is 25% of the first $400 contributed by the employee. Effective April 1, 2001, thecosts and contributions for employees who do not participate in the defined benefit pension plan was 2% ofcompensation and 50% of the employees’ contributions, up to 6% of compensation. Effective January 1, 2006, thecosts and contributions for employees who do not participate in the defined benefit pension plan increased to 3% ofcompensation and 50% of the employees contributions, up to 6% of compensation. During fiscal 2006, fiscal 2005and fiscal 2004, the total cost and contributions were $11.9 million, $5.6 million and $5.1 million, respectively.
F-39
FLOWERS FOODS, INC. AND SUBSIDIARIES
NOTES TO CONSOLIDATED FINANCIAL STATEMENTS — (Continued)

Note 19. Income Taxes
The company’s income tax expense consists of the following:
December 30,2006
December 31,2005
January 1,2005
For the 52 Weeks Ended
(Amounts in thousands)
Current Taxes:
Federal . . . . . . . . . . . . . . . . . . . . . . . . . . . . . . . . . . . . . $ 50,587 $22,404 $ —
State . . . . . . . . . . . . . . . . . . . . . . . . . . . . . . . . . . . . . . . 6,361 5,409 839
56,948 27,813 839
Deferred Taxes:
Federal . . . . . . . . . . . . . . . . . . . . . . . . . . . . . . . . . . . . . (11,236) 9,411 32,109
State . . . . . . . . . . . . . . . . . . . . . . . . . . . . . . . . . . . . . . . (408) 2,637 2,123
(11,644) 12,048 34,232
Income tax expense. . . . . . . . . . . . . . . . . . . . . . . . . . . . . . $ 45,304 $39,861 $35,071
Deferred tax assets (liabilities) are comprised of the following:
December 30,2006
December 31,2005
(Amounts in thousands)
Self-insurance . . . . . . . . . . . . . . . . . . . . . . . . . . . . . . . . . . . . . . . . . . . $ 6,498 $ 5,028
Compensation and employee benefits . . . . . . . . . . . . . . . . . . . . . . . . . . 10,240 10,890
Deferred income . . . . . . . . . . . . . . . . . . . . . . . . . . . . . . . . . . . . . . . . . 3,757 2,757
Loss carryforwards . . . . . . . . . . . . . . . . . . . . . . . . . . . . . . . . . . . . . . . 9,193 11,863
Equity-Based Compensation . . . . . . . . . . . . . . . . . . . . . . . . . . . . . . . . . 2,738 —
Other . . . . . . . . . . . . . . . . . . . . . . . . . . . . . . . . . . . . . . . . . . . . . . . . . . 7,883 9,791
Deferred tax assets valuation allowance . . . . . . . . . . . . . . . . . . . . . . . . (5,434) (6,915)
Deferred tax assets . . . . . . . . . . . . . . . . . . . . . . . . . . . . . . . . . . . . . . 34,875 33,414
Depreciation . . . . . . . . . . . . . . . . . . . . . . . . . . . . . . . . . . . . . . . . . . . . (58,593) (63,797)
Hedging . . . . . . . . . . . . . . . . . . . . . . . . . . . . . . . . . . . . . . . . . . . . . . . (882) (1,432)
Intangible Assets . . . . . . . . . . . . . . . . . . . . . . . . . . . . . . . . . . . . . . . . . (6,346) —
Other . . . . . . . . . . . . . . . . . . . . . . . . . . . . . . . . . . . . . . . . . . . . . . . . . . (4,769) (3,193)
Deferred tax liabilities . . . . . . . . . . . . . . . . . . . . . . . . . . . . . . . . . . . (70,590) (68,422)
Net deferred tax liability . . . . . . . . . . . . . . . . . . . . . . . . . . . . . . . . . . $(35,715) $(35,008)
Various subsidiaries have state net operating loss carryforwards of $225.3 million with expiration datesthrough fiscal 2023. The utilization of these carryforwards could be limited in the future; therefore, a valuationallowance has been recorded. Should the company determine at a later date that certain of these losses which havebeen reserved for may be utilized, a benefit may be recognized in the consolidated statement of income. Likewise,should the company determine at a later date that certain of these net operating losses for which a deferred tax assethas been recorded may not be utilized, a charge to the consolidated statement of income may be necessary.
F-40
FLOWERS FOODS, INC. AND SUBSIDIARIES
NOTES TO CONSOLIDATED FINANCIAL STATEMENTS — (Continued)

Income tax expense differs from the amount computed by applying the U.S. federal income tax rate (35%)because of the effect of the following items:
December 30,2006
December 31,2005
January 1,2005
For the 52 Weeks Ended
(Amounts in thousands)
Tax at U.S. federal income tax rate . . . . . . . . . . . . . . . . . . $43,204 $36,968 $31,886
State income taxes, net of federal income tax benefit . . . . . 4,080 5,277 2,841
(Decrease) increase in valuation allowance. . . . . . . . . . . . . (223) 82 41Section 199 qualifying production activities . . . . . . . . . . . . (1,304) (447) —
Jobs tax credit . . . . . . . . . . . . . . . . . . . . . . . . . . . . . . . . . (153) (506) —
Other . . . . . . . . . . . . . . . . . . . . . . . . . . . . . . . . . . . . . . . . (300) (1,513) 303
Income tax expense . . . . . . . . . . . . . . . . . . . . . . . . . . . . $45,304 $39,861 $35,071
Additionally, the company recognized income tax benefits in discontinued operations of $4.7 million,$1.0 million and $2.2 million for fiscal 2006, fiscal 2005 and fiscal 2004, respectively (see Note 4). The companyalso recognized an income tax benefit during fiscal 2006 of $0.4 million related to the cumulative effect of a changein accounting principle as a result of the adoption of SFAS 123(R) (see Note 15).
During the third quarter of fiscal 2006, the IRS finalized its audit of the company’s tax years 2000 and 2001.Based upon the results of this audit, the company reversed previously established tax reserves in the amount of$6.0 million related to the deductibility of certain transaction costs incurred in connection with the divestiture of thecompany’s Keebler investment in 2001. A deduction was allowed for a majority of these costs; therefore, thereserve was reversed through discontinued operations in the third quarter of fiscal 2006.
The IRS also finalized the results of its audit of the company’s fiscal 2003 income tax return during the thirdquarter of fiscal 2006. Based on the results of this audit, the company accrued $0.5 million of income tax expenserelated to Mrs. Smith’s, which was sold during fiscal 2003. This adjustment is also recorded in discontinuedoperations in the consolidated statement of income for the fifty-two weeks ended December 30, 2006.
Note 20. Commitments and Contingencies
The company and its subsidiaries from time to time are parties to, or targets of, lawsuits, claims, investigationsand proceedings, including personal injury, commercial, contract, environmental, antitrust, product liability, healthand safety and employment matters, which are being handled and defended in the ordinary course of business.While the company is unable to predict the outcome of these matters, it believes, based upon currently availablefacts, that it is remote that the ultimate resolution of any such pending matters will have a material adverse effect onits overall financial condition, results of operations or cash flows in the future. However, adverse developmentscould negatively impact earnings in a particular future fiscal period. (See Note 11.)
The company has recorded current liabilities of $17.1 million and $12.9 million related to self-insurancereserves at December 30, 2006 and December 31, 2005, respectively. The reserves include an estimate of expectedsettlements on pending claims, defense costs and a provision for claims incurred but not reported. These estimatesare based on the company’s assessment of potential liability using an analysis of available information with respectto pending claims, historical experience and current cost trends. The amount of the company’s ultimate liability inrespect of these matters may differ materially from these estimates.
In the event the company ceases to utilize the independent distribution form of doing business or exits aterritory, the company is contractually required to purchase the territory from the independent distributor for tentimes average weekly branded sales.
F-41
FLOWERS FOODS, INC. AND SUBSIDIARIES
NOTES TO CONSOLIDATED FINANCIAL STATEMENTS — (Continued)

See Note 11 relating to debt, leases and other commitments.
Note 21. Segment Reporting
Flowers Bakeries produces fresh and frozen packaged bread and rolls and Flowers Specialty produces frozenbread and rolls and snack products. The company evaluates each segment’s performance based on income or lossbefore interest and income taxes, excluding unallocated expenses and charges which the company’s managementdeems to be an overall corporate cost or a cost not reflective of the segments’ core operating businesses. Prior to fiscal2005, the company included the difference between actual and budgeted flour cost in Other Income (Loss) fromOperations in the table below. Effective the first quarter of fiscal 2005, the company recorded this activity in the resultsof each of its operating segments. Information for the fifty-two weeks ended January 1, 2005 has not been restated toreflect this change. During the fifty-two weeks ended December 30, 2006, Flowers Bakeries and Flowers Specialtyrecorded expense of $5.1 million and $0.8 million, respectively, relating to this change. During the fifty-two weeksended December 31, 2005, Flowers Bakeries and Flowers Specialty recorded expense of $5.2 million and $0.5 million,respectively, relating to this change. Information regarding the operations in these reportable segments is as follows:
December 30,2006
December 31,2005
January 1,2005
For the 52 Weeks Ended
(Amounts in thousands)
Sales:
Flowers Bakeries . . . . . . . . . . . . . . . . . . . . . . . . . . . . $1,535,734 $1,379,440 $1,218,656
Flowers Specialty . . . . . . . . . . . . . . . . . . . . . . . . . . . . 440,732 415,497 382,237
Eliminations:Sales from Flowers Specialty to Flowers Bakeries . . (64,967) (53,246) (49,585)
Sales from Flowers Bakeries to Flowers Specialty . . (22,845) (25,822) —
$1,888,654 $1,715,869 $1,551,308
Depreciation and Amortization:
Flowers Bakeries . . . . . . . . . . . . . . . . . . . . . . . . . . . . $ 51,309 $ 47,816 $ 45,718Flowers Specialty . . . . . . . . . . . . . . . . . . . . . . . . . . . . 13,118 11,558 11,520
Other(1) . . . . . . . . . . . . . . . . . . . . . . . . . . . . . . . . . . . (177) (30) (536)
$ 64,250 $ 59,344 $ 56,702
Income (Loss) from Operations:
Flowers Bakeries . . . . . . . . . . . . . . . . . . . . . . . . . . . . $ 126,183 $ 106,833 $ 97,768Flowers Specialty . . . . . . . . . . . . . . . . . . . . . . . . . . . . 18,544 21,742 20,030
Other(1) . . . . . . . . . . . . . . . . . . . . . . . . . . . . . . . . . . . (26,234) (29,289) (35,524)
$ 118,493 $ 99,286 $ 82,274
Net Interest Income . . . . . . . . . . . . . . . . . . . . . . . . . . . . $ 4,946 $ 6,337 $ 8,826
Income From Continuing Operations Before IncomeTaxes, Minority Interest and Cumulative Effect of aChange in Accounting Principle . . . . . . . . . . . . . . . . . $ 123,439 $ 105,623 $ 91,100
F-42
FLOWERS FOODS, INC. AND SUBSIDIARIES
NOTES TO CONSOLIDATED FINANCIAL STATEMENTS — (Continued)

December 30,2006
December 31,2005
January 1,2005
For the 52 Weeks Ended
(Amounts in thousands)
Capital Expenditures:
Flowers Bakeries . . . . . . . . . . . . . . . . . . . . . . . . . . . . $ 43,924 $ 50,986 $ 33,391
Flowers Specialty . . . . . . . . . . . . . . . . . . . . . . . . . . . . 12,890 6,338 9,624
Other(1) . . . . . . . . . . . . . . . . . . . . . . . . . . . . . . . . . . . 4,978 1,522 3,014
$ 61,792 $ 58,846 $ 46,029
December 30,2006
December 31,2005
As of
Assets:
Flowers Bakeries . . . . . . . . . . . . . . . . . . . . . . . . . . . . . . . . . . . . . . . $693,328 $630,337
Flowers Specialty . . . . . . . . . . . . . . . . . . . . . . . . . . . . . . . . . . . . . . . 153,586 144,935
Other(2). . . . . . . . . . . . . . . . . . . . . . . . . . . . . . . . . . . . . . . . . . . . . . 59,676 75,797
$906,590 $851,069
(1) Represents Flowers Foods’ corporate head office amounts.
(2) Represents Flowers Foods’ corporate head office assets including primarily cash and cash equivalents, deferredtaxes and deferred financing costs.
Sales by product category in each reportable segment are as follows (amounts in thousands):
FlowersBakeries
FlowersSpecialty Total
FlowersBakeries
FlowersSpecialty Total
FlowersBakeries
FlowersSpecialty Total
December 30, 2006 December 31, 2005 January 1, 2005For the 52 Weeks Ended
Branded Retail . . . . . . $ 887,832 $ 95,500 $ 983,332 $ 790,426 $ 89,896 $ 880,322 $ 722,511 $ 76,831 $ 799,342
Store Branded Retail . . 197,138 45,171 242,309 169,343 45,440 214,783 149,011 47,135 196,146
Foodservice andOther . . . . . . . . . . 427,919 235,094 663,013 393,849 226,915 620,764 347,134 208,686 555,820
Total . . . . . . . . . . . . $1,512,889 $375,765 $1,888,654 $1,353,618 $362,251 $1,715,869 $1,218,656 $332,652 $1,551,308
F-43
FLOWERS FOODS, INC. AND SUBSIDIARIES
NOTES TO CONSOLIDATED FINANCIAL STATEMENTS — (Continued)

Note 22. Unaudited Quarterly Financial Information
Results of operations for each of the four quarters in the respective fiscal years are as follows (each quarterrepresents a period of twelve weeks, except the first quarter, which includes sixteen weeks):
First Quarter Second Quarter Third Quarter Fourth Quarter(Amounts in thousands, except per share data)
Sales . . . . . . . . . . . . . . . . . . . . . 2006 $563,613 $445,772 $441,091 $438,1782005 $506,040 $405,300 $408,005 $396,524
Gross margin (defined as salesless materials, supplies, laborand other production costs,excluding depreciation,amortization and distributordiscounts) . . . . . . . . . . . . . . . . 2006 $284,278 $221,747 $218,408 $214,609
2005 $253,276 $202,789 $202,050 $196,171
Income from continuingoperations before cumulativeeffect of a change inaccounting principle . . . . . . . . 2006 $ 22,260 $ 19,724 $ 17,060 $ 15,836
2005 $ 19,997 $ 17,657 $ 13,472 $ 11,732
Net income . . . . . . . . . . . . . . . . 2006 $ 22,914 $ 19,724 $ 22,569 $ 15,8362005 $ 19,997 $ 17,657 $ 11,845 $ 11,732
Basic income per common sharefrom continuing operationsbefore cumulative effect of achange in accountingprinciple . . . . . . . . . . . . . . . . . 2006 $ 0.37 $ 0.32 $ 0.28 $ 0.26
2005 $ 0.31 $ 0.29 $ 0.22 $ 0.19
Diluted income per commonshare from continuingoperations before cumulativeeffect of a change inaccounting principle . . . . . . . . 2006 $ 0.36 $ 0.32 $ 0.28 $ 0.26
2005 $ 0.31 $ 0.28 $ 0.22 $ 0.19
Basic net income per commonshare . . . . . . . . . . . . . . . . . . . 2006 $ 0.38 $ 0.32 $ 0.37 $ 0.26
2005 $ 0.31 $ 0.29 $ 0.19 $ 0.19
Diluted net income per commonshare . . . . . . . . . . . . . . . . . . . 2006 $ 0.37 $ 0.32 $ 0.37 $ 0.26
2005 $ 0.31 $ 0.28 $ 0.19 $ 0.19
Note 23. Subsequent Events
Dividend. On February 16, 2007, the Board of Directors declared a dividend of $0.125 per share on thecompany’s common stock to be paid on March 16, 2007 to shareholders of record on March 2, 2007.
F-44
FLOWERS FOODS, INC. AND SUBSIDIARIES
NOTES TO CONSOLIDATED FINANCIAL STATEMENTS — (Continued)
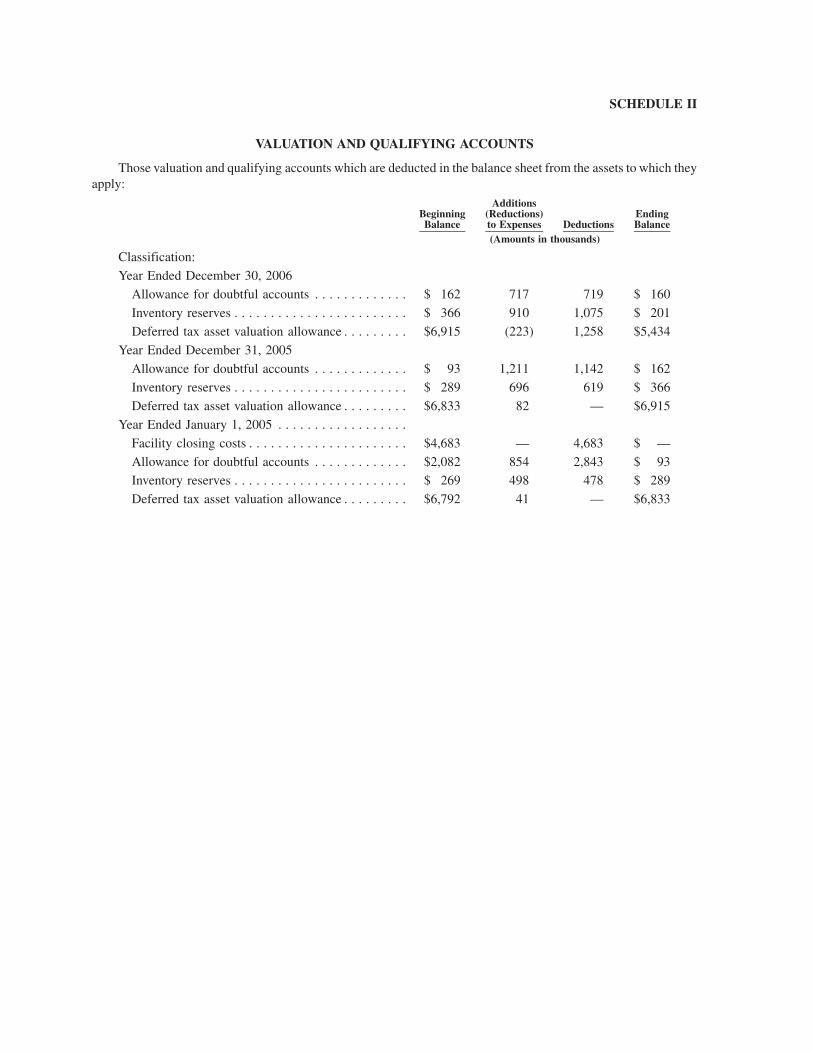
SCHEDULE II
VALUATION AND QUALIFYING ACCOUNTS
Those valuation and qualifying accounts which are deducted in the balance sheet from the assets to which theyapply:
BeginningBalance
Additions(Reductions)to Expenses Deductions
EndingBalance
(Amounts in thousands)
Classification:
Year Ended December 30, 2006
Allowance for doubtful accounts . . . . . . . . . . . . . $ 162 717 719 $ 160
Inventory reserves . . . . . . . . . . . . . . . . . . . . . . . . $ 366 910 1,075 $ 201
Deferred tax asset valuation allowance . . . . . . . . . $6,915 (223) 1,258 $5,434
Year Ended December 31, 2005
Allowance for doubtful accounts . . . . . . . . . . . . . $ 93 1,211 1,142 $ 162
Inventory reserves . . . . . . . . . . . . . . . . . . . . . . . . $ 289 696 619 $ 366
Deferred tax asset valuation allowance . . . . . . . . . $6,833 82 — $6,915
Year Ended January 1, 2005 . . . . . . . . . . . . . . . . . .
Facility closing costs . . . . . . . . . . . . . . . . . . . . . . $4,683 — 4,683 $ —
Allowance for doubtful accounts . . . . . . . . . . . . . $2,082 854 2,843 $ 93Inventory reserves . . . . . . . . . . . . . . . . . . . . . . . . $ 269 498 478 $ 289
Deferred tax asset valuation allowance . . . . . . . . . $6,792 41 — $6,833

Flowers Foods At a Glance
White breads, buns, rolls Snack cakes, pastries
Flowers Foods, Inc. (NYSE: FLO), headquartered in Thomasville, Ga., is one of the nation’s leading producers and marketers ofpackaged bakery foods for retail and foodservice customers.The company’s 36 highly efficient bakeries produce breads, buns, rolls,snack cakes, and pastries that are distributed fresh throughout the Southeast, Southwest, and Mid-Atlantic region and frozen tocustomers nationwide. Flowers’ brands include Nature’s Own, Whitewheat, Cobblestone Mill, ButterKrust, Evangeline Maid, Dandee,Mary Jane,Captain John Derst,European Bakers, Mrs.Freshley’s, Blue Bird, Mi Casa, as well as regional franchised brands, such as Sunbeam and Bunny.
Soft variety and premiumspecialty breads, buns, rolls
O U R R E A C H
Flowers’ fresh bakery foods are available to approximately38 percent of the U.S.population in 19 states in the Southeast, Southwest,and Mid-Atlantic region andin the District of Columbia.Our frozen products and ourMrs.Freshley’s brand of snackcakes are available nationally.
National Frozen products/snack cake distributionthrough customerwarehouses
Regional Fresh bakeryfood distributionthrough direct-store-delivery
D I S T R I B U T I O N S A L E S C H A N N E L S
80% Direct-store-delivery(DSD)
37% Supermarket/drug
23%Mass merchandiser/discount
7% Conveniencestore
3% Vending2% Thrift store
28%Foodservice
P R O D U C T M I X
20% Direct to customers’warehouses
75% Fresh breads, buns, rolls
9% Frozen bread,rolls
16% Freshsnackcakes, pastries
INVESTOR INFORMATIONSTOCK LISTINGFlowers Foods’ common stock is listed on the NewYork Stock Exchange under the ticker symbol FLO.
WEB SITEInformation on Flowers Foods is posted on theInternet at www.flowersfoods.com.
FINANCIAL INFORMATIONFlowers Foods’ annual report, Form 10-K, pressreleases, and other financial documents are availablethrough the Investor Center on the company’s Website. Individuals may request investor packetsthrough the Web site.
CORPORATE GOVERNANCEThe following corporate governance documents are available on the company’s Web site: CorporateGovernance Guidelines, Audit Committee Charter, Compensation Committee Charter,Nominating/Corporate Governance CommitteeCharter, Finance Committee Charter, StockOwnership Guidelines, Disclosure Policy, EmployeeCode of Conduct, and Code of Business Conductand Ethics for Executive Officers and Directors.These documents are also available by writing to ourinvestor relations department at the corporateaddress noted on this page.
MANAGEMENT CERTIFICATIONSFlowers Foods’ Chief Executive Officer provides theNew York Stock Exchange (NYSE) with certificationin a timely manner as required by NYSE Rule303A.12.The company’s Chief Executive Officer and Chief Financial Officer have each filed therequired certifications regarding the quality of thecompany’s public disclosure with the Securities andExchange Commission as exhibits to our AnnualReport on Form 10-K.
ANNUAL MEETINGFlowers Foods will hold its annual meeting of share-holders at 11:00 a.m. on Friday, June 1, 2007 at theThomasville Cultural Center in Thomasville, Ga.
WEBCASTSFlowers Foods broadcasts quarterly earningsconference calls and other live presentations overthe Internet.The company posts notices of thesewebcasts and archived webcasts on the FlowersWeb site and individuals can sign up to receive e-mail notification of webcasts. Upcoming 2007webcasts are scheduled for May 24, June 1,August 16, and November 8.These dates aresubject to change. For the most currentinformation on these events, please visit theInvestor Center at www.flowersfoods.com.
SHAREHOLDER SERVICESAs Flowers Foods’ transfer and dividend reinvest-ment agent, Computershare offers shareholders avariety of services, including change of address,replacement of lost stock certificates, and assistancewith stock transfers. Shareholders may callComputershare toll free at 800.568.3476 or write to Computershare, Mail Room, P.O. Box 43078,Providence, RI 02940-3078.
INVESTOR RELATIONS CONTACTMarta Jones TurnerSenior Vice President of Corporate Relations229.227.2348 or [email protected]
SHAREHOLDER RELATIONS CONTACTLisa R. HayShareholder Relations Specialist229.227.2216 or [email protected]
GENERAL INFORMATION/MEDIA CONTACTMary A. KrierVice President of Communications229.227.2333 or [email protected]
CORPORATE OFFICE1919 Flowers CircleThomasville, GA 31757Phone: 229.226.9110
Des
ign:
ww
w.cr
ittgr
aham
.com

DOING WHAT WE DO BEST
0620
2006 annual report
1919 Flowers Circle • Thomasville, Georgia 31757 • www.flowersfoods.com
FL
OW
ER
S F
OO
DS
20
06
AN
NU
AL
RE
PO
RT