Embed Size (px)
Citation preview
Chapter 19
Multimedia Annotation, Querying and Analysis in ANVIL Michael Kipp DFKI Saarbrücken, Germany [email protected]
Abstract
While the availability of multimedia data, including video, audio and human movement recording, is steadily growing, the integrated viewing, annotation, and analysis of these complex data is still a challenge. This chapter introduces ANVIL as an example of a multimedia annotation and analysis tool and presents recent extensions: The 3D viewing of motion capture data allows a more precise annotation of human movement. The automatic computation of agreement scores facilitates the validation of annotated corpora. Cross-modal association analysis can be used to detect correlations between specific event classes from different modalities. For complex querying, an SQL database has been integrated which can be accessed through a custom query language. This combination of features can be exploited in many contexts, from qualitative behavior analysis to the collection of training data for information extraction. A discussion on open issues like tool interoperabilty and scheme standardization closes the chapter.
1. Introduction
The goal of finding meaning in data has two extreme manifestations. In the computing sciences, researchers search for automatic methods to extract meaning from low-level data. Most of the contributions in this volume pursue this goal. In the empirical sciences, researchers attempt to interpret surface behaviors of humans or animals according to precise guidelines. While the methods of the two fields are different, they share the underlying data (video and audio files, motion capture data etc.) as well as the general aim. Both approaches can benefit from each other and are in fact often combined. The computer scientist needs to explore his/her data in a qualitative fashion to determine promising predictors and to build training and test corpora. The empirical scientist can use automatic, quantitative methods to bootstrap the manual annotation process and to increase the objectivity of the approach. Both kinds of research need appropriate tools to support this process. For the qualitative annotation, browsing and analysis of videos, several tools have been developed (Rohlfing et al. 2006, Bigbee et al. 2001). All tools were developed in a specific research context but are generalizable to a certain extent. This chapter presents the ANVIL1 tool (Kipp 2008, Martin & Kipp 2002, Kipp 2001) as one incarnation of multimedia annotation tools. More specifically, recent extensions to ANVIL are presented that make a first step toward an integrated multimedia annotation, browsing and analysis platform. The extensions comprise of 3D motion capture viewing, database integration and a number of analysis features. The
1 http://www.anvil-software.de
2 Chapter 19
driving force behind these extensions was the need to go beyond single modality, single media analysis to cross-modal, multimedia analysis.
A common target of analysis is human behavior. For something as complex as human behavior, research has moved from performing unimodal analysis to multimodal analysis. Likewise, with an increased availability of capture and storage devices, researchers are moving from few media sources (e.g. a single video) to multiple media sources. For human motion, the most precise media is motion capture data which can be acquired using various techniques, from complex marker-based optical systems to inexpensive inertia-based systems (Roetenberg et al. 08). A complex data situation for human behavior analysis would consist of multiple video, audio and motion capture files (Fikkert et al. 2008). Existing annotation tools cannot display motion capture data as a 3D-animated skeleton which is the most appropriate visualization. This is surprising since the automatic segmentation and classification of motion capture data is a common problem in computer graphics (Barbic et al. 2004). To be useful for e.g. animation, motion capture data must be annotated with semantic information (Arikan et al. 2003). A viewing and annotation tool is a natural starting point for developing automatic annotation techniques.
Apart from viewing the media, complex search and filter operations on existing annotations are necessary, especially in large corpora. An SQL compliant database was integrated into ANVIL to utilize the full power of the SQL query language. One form of cross-modal analysis, association analysis, uses such queries to collect potential association tuples. In association analysis the annotation categories of co-occurring annotations from different tracks are quantitatively analyzed. Unimodal analysis features focus on a single track and, for instance, the transition of categories (essentially a Markov model), which can be visualized by a transition diagram. However, before significant analysis can take place, the consistency of the annotations has to be validated. For this, ANVIL offers automatic agreement computation using kappa statistics.
This chapter is organized as follows. First, the main concepts of the ANVIL tool, as a representative for multimedia annotation tools, are briefly introduced and related work is surveyed. Then, the database and multiple media integration, especially the 3D motion capture viewer, are presented. Furthermore, three analysis features, coding agreement computation, unimodal transition diagrams and cross-modal association analysis are discussed. The chapter concludes with a brief discussion of tool interoperability and scheme standardization.
2. ANVIL: A Multimedia Annotation Tool
In the last ten years, a number of video annotation tools have emerged. In most of them annotations are placed on parallel time-aligned tracks or tiers, so that annotations appear like notes on a musical score (Fig. 1). Another important aspect of these tools is the possibility to define a coding scheme which describes the structure of annotations and imposes certain constraints on how annotations from different tracks relate to each other.
This chapter presents ANVIL, a widely used video annotation tool in multimodality research (Kipp 2001). In ANVIL, the user transcribes events that occur in the video on
Kipp 3
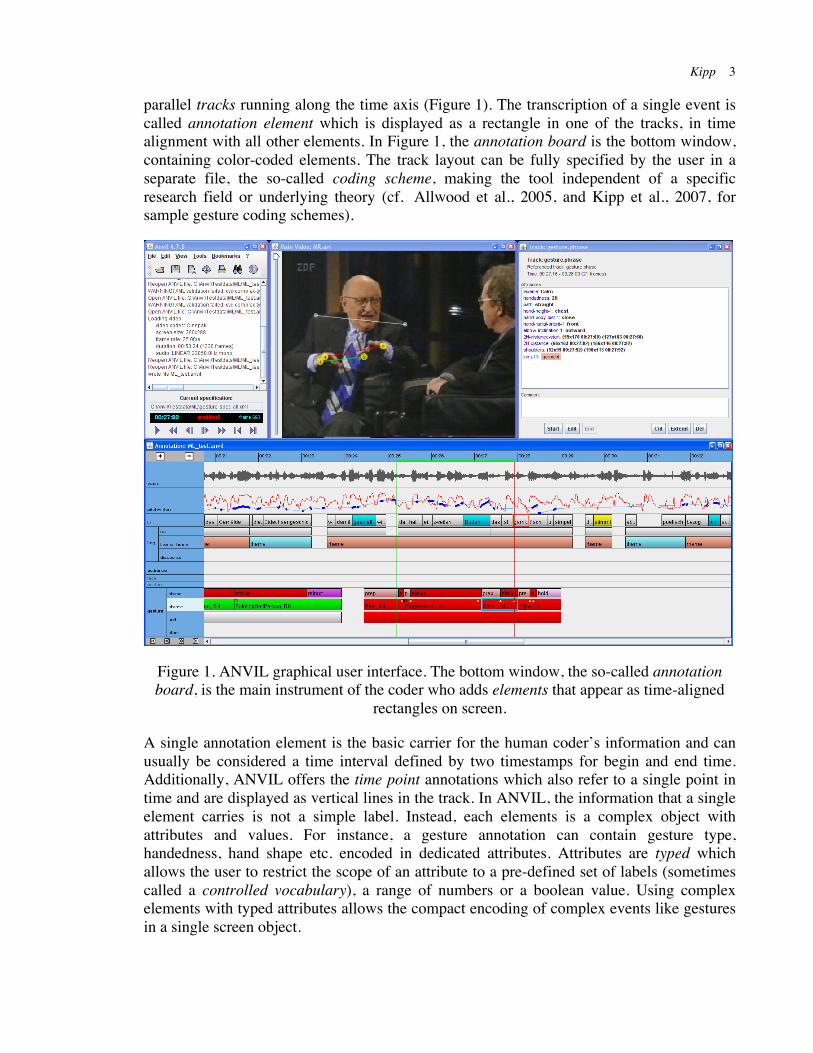
parallel tracks running along the time axis (Figure 1). The transcription of a single event is called annotation element which is displayed as a rectangle in one of the tracks, in time alignment with all other elements. In Figure 1, the annotation board is the bottom window, containing color-coded elements. The track layout can be fully specified by the user in a separate file, the so-called coding scheme, making the tool independent of a specific research field or underlying theory (cf. Allwood et al., 2005, and Kipp et al., 2007, for sample gesture coding schemes).
Figure 1. ANVIL graphical user interface. The bottom window, the so-called annotation board, is the main instrument of the coder who adds elements that appear as time-aligned
rectangles on screen.
A single annotation element is the basic carrier for the human coder’s information and can usually be considered a time interval defined by two timestamps for begin and end time. Additionally, ANVIL offers the time point annotations which also refer to a single point in time and are displayed as vertical lines in the track. In ANVIL, the information that a single element carries is not a simple label. Instead, each elements is a complex object with attributes and values. For instance, a gesture annotation can contain gesture type, handedness, hand shape etc. encoded in dedicated attributes. Attributes are typed which allows the user to restrict the scope of an attribute to a pre-defined set of labels (sometimes called a controlled vocabulary), a range of numbers or a boolean value. Using complex elements with typed attributes allows the compact encoding of complex events like gestures in a single screen object.
4 Chapter 19
The underlying assumption for tracks is that all encodings in one track have similar properties, more concretely: each track has its own set of typed attributes which have to be defined by the user in the coding scheme. For example, for a track “gesture” could have two attributes “type'” and “handedness”. Tracks come in various flavors to model the fact that a certain relationship holds between a track A and a reference track B. For instance, an element in A may always have a corresponding element in B with the exact same begin/end times. In this case, track A would be declared a singleton type track with reference track B. Another type, span, models the condition that each element of track A consists of a sequence of elements in reference track B. The spanning element in track A inherits the begin time of the first element in this sequence and the end time of the last one. The inheritance of timestamps is the main advantage of track types: The begin/end times of singleton and span type tracks are always propagated from the reference track, making manual alignment unnecessary and the coding process more robust.
Relationships between tracks reflect systematic relationships between their contained elements, in the above cases these are temporal correspondence or containment. However, one may need to encode arbitrary relationships between encoded elements which is especially important in cross-modal analysis. ANVIL allows to do this in the form of logical links. A link is a special type of attribute that contains a list of links to other elements which can be used, for instance, for co-reference coding.
Elements in tracks have a start and end time as inherent properties. However, sometimes an element in a video exists for the whole duration of the video (e.g. an object on a table) or is not even concrete (a person). In ANVIL, one can encode such non-temporal entities in a data container called a annotation set which is the equivalent of a track, but without time information (Martin & Kipp 2002). A set is visualized using a simple table. In conjunction with logical links these elements allow the encoding of complex relations.
While ANVIL and related tools are inherently time-based, for a number of applications it is not enough to encode when something happened, but also where on the screen. In such cases, ANVIL allows to perform spatial coding by drawing directly on the video screen (Kipp 2008). In Figure 1, the coder marked-up point locations on the video screen which are displayed as connected dots. The screen locations are encoded as timestamped screen coordinates in a special type of attribute. This is an essential feature for video-based information extraction and is also being used for coding facial expression based on FACS (facial action coding system, cf. Ekman & Friesen 1978).
Finally, since a corpus usually consist of numerous media files and corresponding annotation files, a project tool facilitates corpus management by grouping multiple annotation files together that are based on the same coding scheme. The project tool allows to perform all search, export and analysis operations over the whole corpus.
ANVIL is implemented in Java, thus platform independent, and uses XML for data exchange. It is available free of charge for educational and research purposes.
Kipp 5
3. Related Annotation Tools
This section gives a concise overview of tools with a functionality similar to that of ANVIL. This survey is not exhaustive – for more thorough tool surveys consult Bigbee et al. (2001) and Rohlfing et al. (2006). Note that the whole area of ontological annotation is not mentioned here (see Chapter 22, this volume).
ELAN2, developed at the MPI for Psycholinguistics (Wittenburg et al. 2006), is written in Java and XML-based. Tracks are called tiers in ELAN, and on every tier the annotations consist of single strings, i.e. ELAN lacks the ability to encode multiple attributes on each tier. This implies that a single ANVIL track must be expanded to a set of tiers in ELAN. ELAN does, however, offer to predefine so-called controlled vocabularies to restrict the user input to a set of labels. In ANVIL, this can be achieved using that ValueSet attribute type. ELAN also knows about track relationships. The time subdivision relationship between tiers A and B implies that every element of A is decomposed into a contiguous sequence of elements in tier B. This is the inverse relation to ANVIL’s span relationship. The major difference is that ELAN’s relation forces the coder to first code the whole and then subdivide it, whereas ANVIL forces the coder to first code the parts and then join them (the subtle difference is that ANVIL’s relation allow gaps between subelements and ELAN does not). Another important relation in ELAN is symbolic association which is equivalent to ANVIL’s singleton relation. ELAN also offers multiple video viewing but does not support motion capture viewing. One major difference between ELAN and ANVIL lies in the fact that ANVIL keeps the structure of the annotation (i.e. declaration of tracks and attributes) in a separate file, the so-called coding scheme, whereas ELAN stores this information together with the annotated data. This can cause consistency problems when dealing with large collections of annotation files that should conform to the same scheme. ELAN is well known in gesture research and sign language communities. EXMARaLDA3 is a video annotation tool mainly targeted at the research field of conversation analysis (Schmidt 2004). To some degree, it is theory-dependent (for instance, each tier has a speaker assigned to it) and based on the general annotation graph framework (Bird & Liberman 2001). It is also Java- and XML-based, but neither supports track relationships nor complex elements. However, like ANVIL it has the notion of projects and has a dedicated corpus management tool. MacVisSTA4 is a video annotation tool targeted at human communication and interaction analysis (Rose et al. 2004). The system is restricted to Mac OS and features the integration of multiple data sources, including motion capture data. However, the latter is not displayed in the form of a 3D skeleton but only as curve plots. MacVisSTA features database integration in two ways: first to an external database for collaborative coding and second to an embedded database for querying. The hybrid architecture may be extended
2 http://www.lat-mpi.eu/tools/elan
3 http://www.exmaralda.org
4 http://sourceforge.net/projects/macvissta
6 Chapter 19
through plugins. PRAAT5 is an audio analysis and annotation tool, mainly targeted at phonetics research, developed at the Institute of Phonetic Sciences, University of Amsterdam (Boersma & Weenink 2005). It runs on multiple platforms and is certainly the most widely used tool in phonetics. For annotation, PRAAT also offers multiple tracks which come in two flavors: one records elements with a duration, one only elements with a single time point. This corresponds to ANVIL’s interval and point tracks. The actual information stored in elements are simple strings. Since PRAAT allows very precise playback control on audio files, it is very suitable for speech transcription. ANVIL can import PRAAT encoded data and it is actually recommendable to use PRAAT as a supplementary tool for ANVIL to do both speech transcription and intonation analysis which can also be imported and displayed in ANVIL. Advene6 is developed at LIRIS laboratory, University Claude Bernard Lyon 1. It aims at providing a system for sharing annotations on digital videos (movies, courses, etc) and providing tools for editing and visualization of so-called hypervideos which are generated from annotations and videos. Users can then exchange analyzed and commented multimedia data. Advene can import ANVIL data. Advene can be considered a meta-tool as it provides services on top of other tools, thus enabling to profit from the strengths of various tools in an integrated workflow.
To sum up, while there are several similar tools for multi-level multimedia annotation, ANVIL has a number of unique characteristics. Most importantly, ANVIL is the only tool that treats annotations as objects with typed attributes, making annotations much more compact if the user chooses to exploit this feature. It is also the only tool that keeps the coding scheme strictly separated from the annotated data which has proven to be a major advantage in the iterative development of coding schemes. Another unique feature are symbolic links, an essential tool when investigating cross-modal relationships. ANVIL is also the only tool that allows the encoding of spatial information on the video frame, important for preparing information extraction training material, and the only tool to offer a fully 3D motion capture viewer. ANVIL shares with MacVisSTA an embedded database for complex queries, with ELAN the use of track relationships to make coding more robust and with EXMARaLDA a dedicated corpus management tool. There are tools that can be used for importing to ANVIL, namely PRAAT, and tools that consume ANVIL files, namely Advene. For the future, it would be desirable to increase interoperability between tools so that end users can exploit the individuals strengths of various tools on the same data.
4. Database Integration
Multi-layer annotations of multiple media can quickly become cluttered, so that the user needs query functionality to efficiently find relevant information. Since ANVIL allows to package multiple bits of information into a single element, queries are even more important.
The SQL query language is not only very powerful but also an industry standard. Therefore, ANVIL internally maps the user's annotations to a temporary SQL database that is kept in
5 http://www.praat.org
6 http://liris.cnrs.fr/advene
Kipp 7
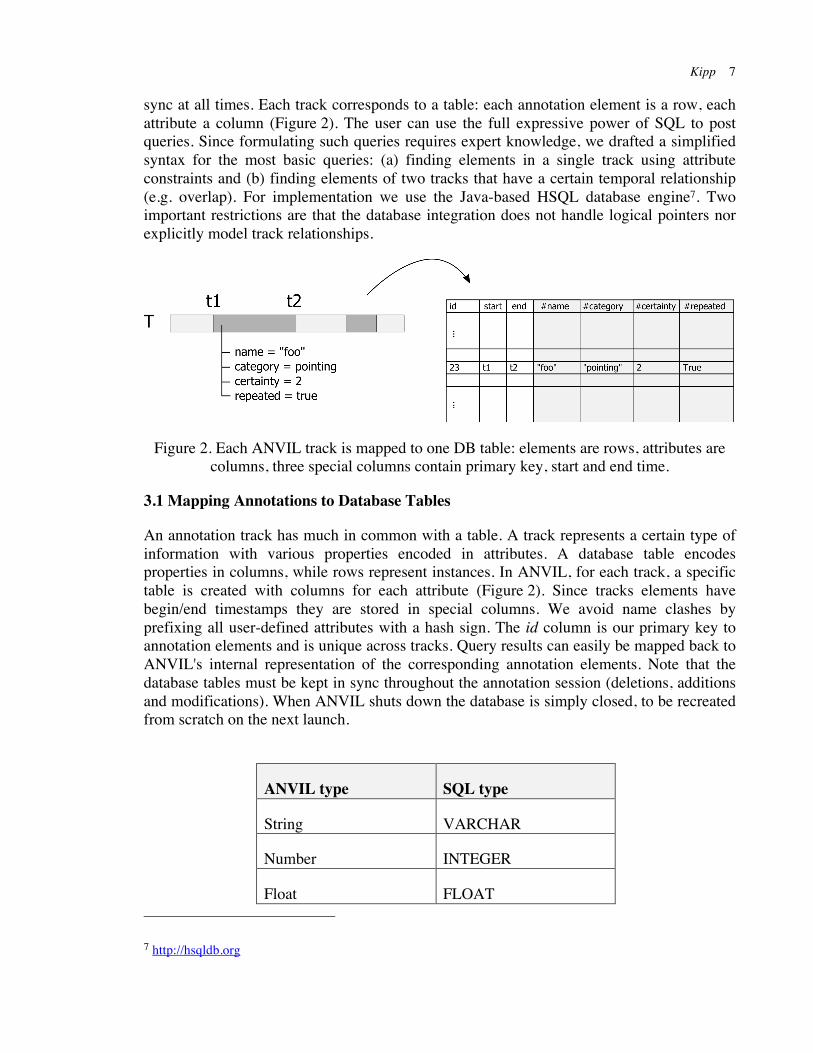
sync at all times. Each track corresponds to a table: each annotation element is a row, each attribute a column (Figure 2). The user can use the full expressive power of SQL to post queries. Since formulating such queries requires expert knowledge, we drafted a simplified syntax for the most basic queries: (a) finding elements in a single track using attribute constraints and (b) finding elements of two tracks that have a certain temporal relationship (e.g. overlap). For implementation we use the Java-based HSQL database engine7. Two important restrictions are that the database integration does not handle logical pointers nor explicitly model track relationships.
Figure 2. Each ANVIL track is mapped to one DB table: elements are rows, attributes are columns, three special columns contain primary key, start and end time.
3.1 Mapping Annotations to Database Tables
An annotation track has much in common with a table. A track represents a certain type of information with various properties encoded in attributes. A database table encodes properties in columns, while rows represent instances. In ANVIL, for each track, a specific table is created with columns for each attribute (Figure 2). Since tracks elements have begin/end timestamps they are stored in special columns. We avoid name clashes by prefixing all user-defined attributes with a hash sign. The id column is our primary key to annotation elements and is unique across tracks. Query results can easily be mapped back to ANVIL's internal representation of the corresponding annotation elements. Note that the database tables must be kept in sync throughout the annotation session (deletions, additions and modifications). When ANVIL shuts down the database is simply closed, to be recreated from scratch on the next launch.
ANVIL type SQL type
String VARCHAR
Number INTEGER
Float FLOAT
7 http://hsqldb.org
8 Chapter 19
Boolean BOOLEAN
ValueSet VARCHAR
Table 1. Mapping between ANVIL and SQL data types.
In the mapping depicted in Fig. 2, we have to convert ANVIL value types to SQL data types. For most types there is a corresponding type (e.g. SQL type integer for ANVIL type number), for all others we simply chose the SQL varchar type which is an arbitrary string of alphanumeric characters (Table 1).
4.2 Single-Track Queries
A query is a request for a subset of all annotation elements, given some constraints. The single-track query restricts this to a single track. Constraints can be formulated in SQL syntax depending on the SQL data type (Table 1): Strings can be queried using regular expressions, numbers can be queried with numeric comparison operators (<, > etc.). Since SQL syntax must be learned and can quickly become tedious to write, we offer a simplified scripting language that allows to specify track plus a, possibly nested, combination of attribute constraints, for instance:
[ mytrack , ( att1 = 2H OR att1 = LH ) AND anotherAtt <> null ]
This is translated to the somewhat unwieldy SQL expression:
SELECT "mytrack"."id", "mytrack"."#att1", "mytrack"."#anotherAtt"
FROM "mytrack"
WHERE ("mytrack"."#att1" = '2H' OR "mytrack"."#att1" = 'LH')
AND "mytrack"."#anotherAtt" <> 'null'
The expression returns all elements in track mytrack which have value 2H or LH in att1 and have a non-empty attribute called anotherAtt. In ANVIL, the returned IDs are used to collect the corresponding ANVIL elements.
4.3 Temporal Relationship Queries
To explore cross-modal interactions researchers have to scrutinize the relationship between elements of different tracks, comparing those which temporally coincide or have some other systematic temporal relationship. However, in order to analyze, for example, pair-wise relationships between elements of different tracks, one has to define under which conditions element E1 of track T1 and element E2 of track T2 are compared. One way to do this is to let the user define the temporal relation that must hold so that two elements are comparable. We use seven of the Allen relations for this: equals, before, meets, overlaps, starts, finishes and during. In addition, we let the user specify a tolerance limit in seconds (a float value).
Kipp 9
For example, the relation (equals, .4) holds if the start time of element E1 and the start time of element E2 differ by maximally .4 seconds (and if the same holds for the end time).
Again, to spare the user from using long and complex SQL expressions we have a special syntax to ask for elements from two tracks that are characterized by a certain temporal relationship. An example is:
R[overlaps, .8] [ firstTrack, hand = 2H ] [ otherTrack, hand <> null ]
As one can see, this is an extension of the previously introduced example. It uses two single-track queries and defines a temporal relationship constraint on top of the resulting track elements sets.
Temporal relationship queries are the first step for analysis, e.g. in the form of association analysis in ANVIL (Section 6.3). For the future, our scripting language will be extended in the direction of other end-user oriented query languages like Pig Latin (Olsten et al. 2008) which is based on successive filter, grouping and aggregation operations over data sets.
5. Integrating Motion Capture
ANVIL presupposes that a certain event was documented using multiple types and instances of media. For instance, psychotherapists interested in changes of facial expression, posture and interpersonal distance and orientation during a therapy session, must record the session with multiple video cameras and microphones. Other media like biometric measurements, eye tracking and motion capture can complement the setup. In ANVIL, the challenge is to allow for synchronized playback of multiple media streams. In particular, the integration of 3D motion capture playback is desirable because it allows a fine-grained 3D reconstruction of human motion. While nowadays motion capture is mainly used in computer animation, it has the potential of becoming the next generation tool for human behavior research.
5.1 Multiple Videos
Video playback in ANVIL is handled by the Java Media Framework (JMF), complemented by the JFFMPEG8 package which adds a number of codecs. When playing multiple videos, the internal framework has to synchronize the different media using a single clock. Since in JMF each video is itself modeled as a clock, one video is declared the master video while all others are so-called slaves, and are basically controlled by the master video's progression in time. The integration of other media like motion capture also rely on the master video’s clock function.
5.2 Motion Capture Data
As motion capture (mocap) is becoming more affordable (e.g. through the use of inertial sensors (Roetenberg et al. 2008)), such technology is becoming more likely to be employed in human behavior analysis (Fikkert et al. 2008). Similar technologies like cyber-gloves
8 http://jffmpeg.sourceforge.net
10 Chapter 19
have already been used in sign language research (Crasborn et al. 2006). In psycholinguistics, such data could bring long-awaited refinement of theories of human gesture behavior (Kita et al. 1998). In a more general context, the large existing open libraries9 of motion capture data need the advancement of intuitive retrieval technology to be fully usable (see e.g. Müller et al., 2005). For all these research issues, an annotation tool with an integrated 3D viewer is an important asset to perform qualitative analysis or to create training material.
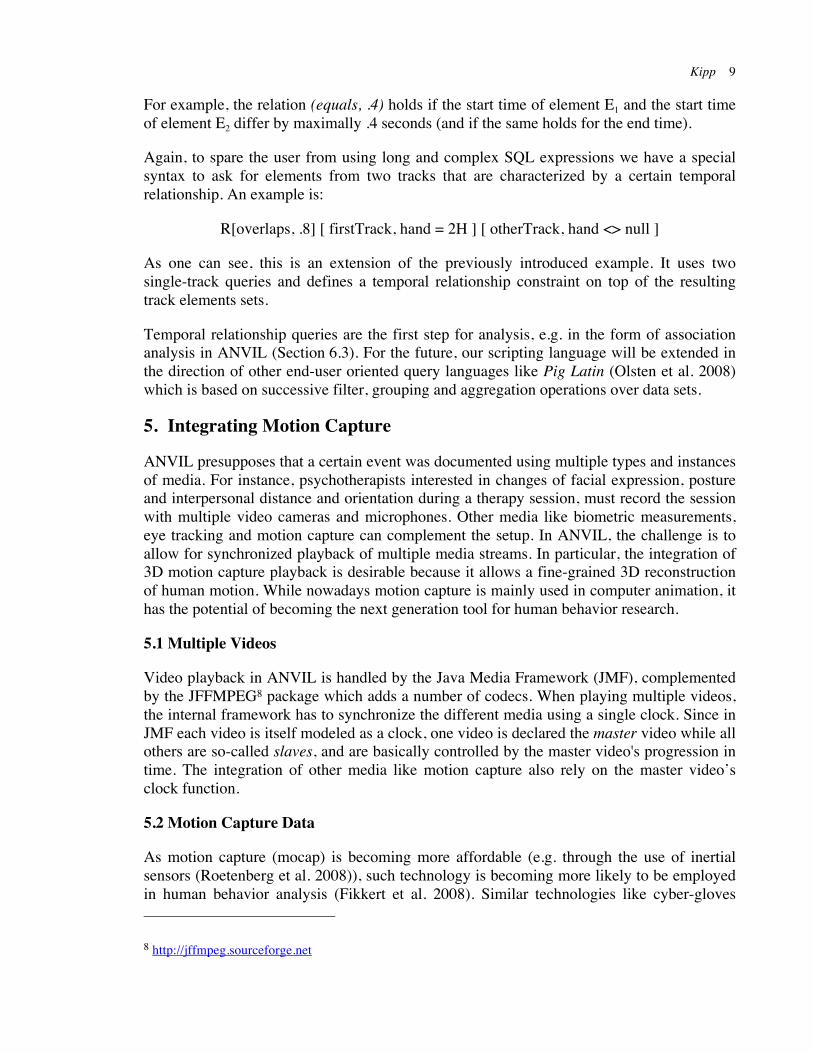
Figure 3. ANVIL integrates a 3D viewer for motion capture data, synchronized with the 2D video recording(s) of the capture session.
Motion capture recording requires a specialized studio with several high-speed cameras. The human performer is equipped with either passive or active markers. These markers are then used in post-processing to reconstruct the relative angles of bones with respect to joints. Fortunately, while there are multiple ways and technologies to perform motion capture, for the final representation of motion capture data there are standardized file formats. The most
9 for instance, the CMU Graphics Lab motion capture database, see http://mocap.cs.cmu.edu
Kipp 11
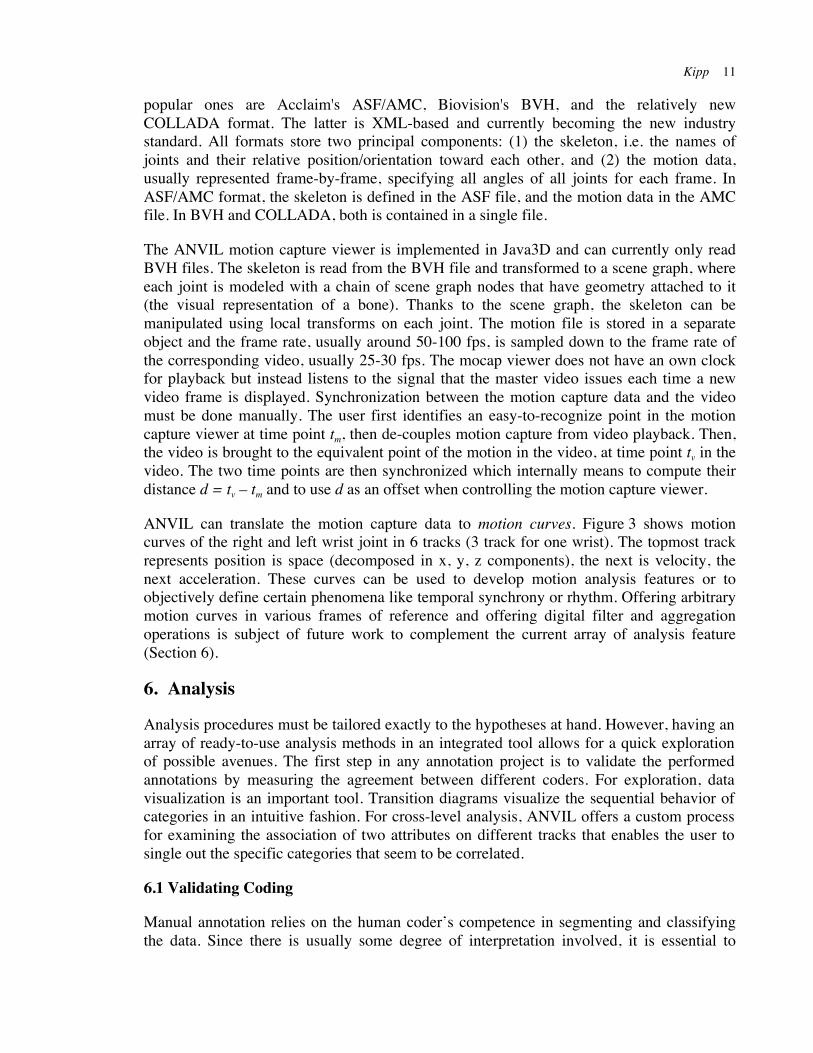
popular ones are Acclaim's ASF/AMC, Biovision's BVH, and the relatively new COLLADA format. The latter is XML-based and currently becoming the new industry standard. All formats store two principal components: (1) the skeleton, i.e. the names of joints and their relative position/orientation toward each other, and (2) the motion data, usually represented frame-by-frame, specifying all angles of all joints for each frame. In ASF/AMC format, the skeleton is defined in the ASF file, and the motion data in the AMC file. In BVH and COLLADA, both is contained in a single file.
The ANVIL motion capture viewer is implemented in Java3D and can currently only read BVH files. The skeleton is read from the BVH file and transformed to a scene graph, where each joint is modeled with a chain of scene graph nodes that have geometry attached to it (the visual representation of a bone). Thanks to the scene graph, the skeleton can be manipulated using local transforms on each joint. The motion file is stored in a separate object and the frame rate, usually around 50-100 fps, is sampled down to the frame rate of the corresponding video, usually 25-30 fps. The mocap viewer does not have an own clock for playback but instead listens to the signal that the master video issues each time a new video frame is displayed. Synchronization between the motion capture data and the video must be done manually. The user first identifies an easy-to-recognize point in the motion capture viewer at time point tm, then de-couples motion capture from video playback. Then, the video is brought to the equivalent point of the motion in the video, at time point tv in the video. The two time points are then synchronized which internally means to compute their distance d = tv – tm and to use d as an offset when controlling the motion capture viewer.
ANVIL can translate the motion capture data to motion curves. Figure 3 shows motion curves of the right and left wrist joint in 6 tracks (3 track for one wrist). The topmost track represents position is space (decomposed in x, y, z components), the next is velocity, the next acceleration. These curves can be used to develop motion analysis features or to objectively define certain phenomena like temporal synchrony or rhythm. Offering arbitrary motion curves in various frames of reference and offering digital filter and aggregation operations is subject of future work to complement the current array of analysis feature (Section 6).
6. Analysis
Analysis procedures must be tailored exactly to the hypotheses at hand. However, having an array of ready-to-use analysis methods in an integrated tool allows for a quick exploration of possible avenues. The first step in any annotation project is to validate the performed annotations by measuring the agreement between different coders. For exploration, data visualization is an important tool. Transition diagrams visualize the sequential behavior of categories in an intuitive fashion. For cross-level analysis, ANVIL offers a custom process for examining the association of two attributes on different tracks that enables the user to single out the specific categories that seem to be correlated.
6.1 Validating Coding
Manual annotation relies on the human coder’s competence in segmenting and classifying the data. Since there is usually some degree of interpretation involved, it is essential to
12 Chapter 19
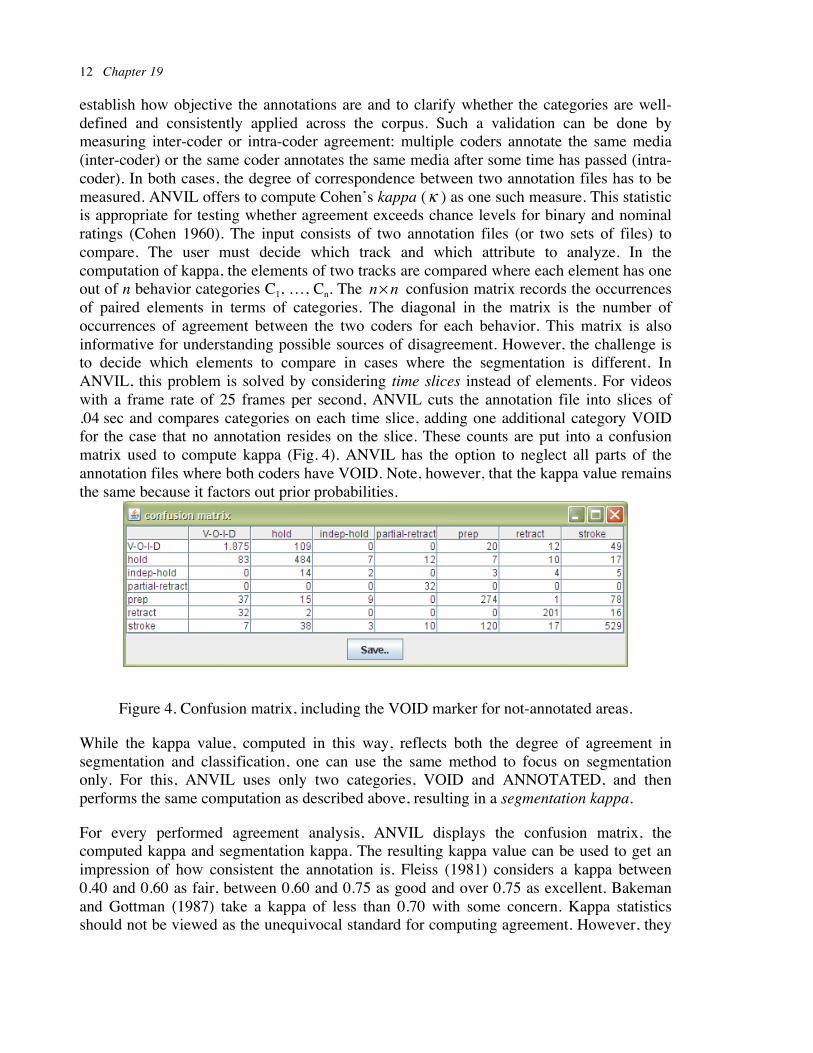
establish how objective the annotations are and to clarify whether the categories are well-defined and consistently applied across the corpus. Such a validation can be done by measuring inter-coder or intra-coder agreement: multiple coders annotate the same media (inter-coder) or the same coder annotates the same media after some time has passed (intra-coder). In both cases, the degree of correspondence between two annotation files has to be measured. ANVIL offers to compute Cohen’s kappa ( ) as one such measure. This statistic is appropriate for testing whether agreement exceeds chance levels for binary and nominal ratings (Cohen 1960). The input consists of two annotation files (or two sets of files) to compare. The user must decide which track and which attribute to analyze. In the computation of kappa, the elements of two tracks are compared where each element has one out of n behavior categories C1, …, Cn. The confusion matrix records the occurrences of paired elements in terms of categories. The diagonal in the matrix is the number of occurrences of agreement between the two coders for each behavior. This matrix is also informative for understanding possible sources of disagreement. However, the challenge is to decide which elements to compare in cases where the segmentation is different. In ANVIL, this problem is solved by considering time slices instead of elements. For videos with a frame rate of 25 frames per second, ANVIL cuts the annotation file into slices of .04 sec and compares categories on each time slice, adding one additional category VOID for the case that no annotation resides on the slice. These counts are put into a confusion matrix used to compute kappa (Fig. 4). ANVIL has the option to neglect all parts of the annotation files where both coders have VOID. Note, however, that the kappa value remains the same because it factors out prior probabilities.
Figure 4. Confusion matrix, including the VOID marker for not-annotated areas.
While the kappa value, computed in this way, reflects both the degree of agreement in segmentation and classification, one can use the same method to focus on segmentation only. For this, ANVIL uses only two categories, VOID and ANNOTATED, and then performs the same computation as described above, resulting in a segmentation kappa.
For every performed agreement analysis, ANVIL displays the confusion matrix, the computed kappa and segmentation kappa. The resulting kappa value can be used to get an impression of how consistent the annotation is. Fleiss (1981) considers a kappa between 0.40 and 0.60 as fair, between 0.60 and 0.75 as good and over 0.75 as excellent. Bakeman and Gottman (1987) take a kappa of less than 0.70 with some concern. Kappa statistics should not be viewed as the unequivocal standard for computing agreement. However, they
Kipp 13
are almost always preferable to simple proportion (percentage) of agreement which does not factor out chance agreement.
6.2 Transition Diagrams
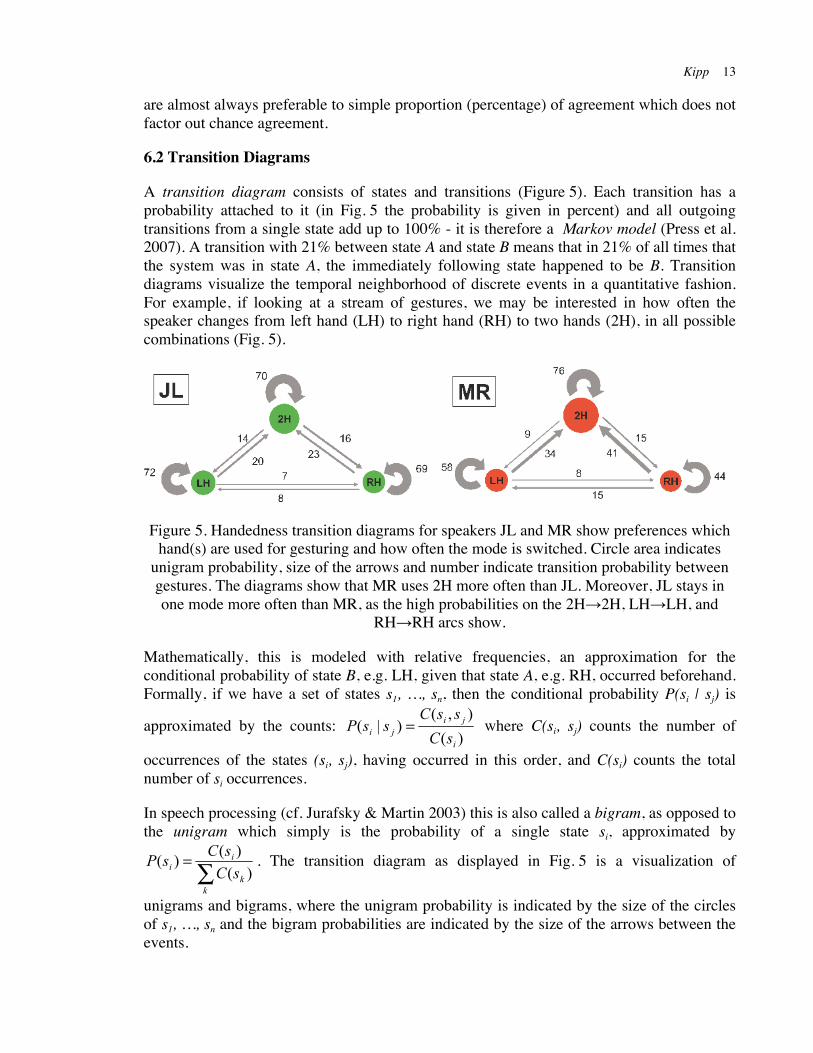
A transition diagram consists of states and transitions (Figure 5). Each transition has a probability attached to it (in Fig. 5 the probability is given in percent) and all outgoing transitions from a single state add up to 100% - it is therefore a Markov model (Press et al. 2007). A transition with 21% between state A and state B means that in 21% of all times that the system was in state A, the immediately following state happened to be B. Transition diagrams visualize the temporal neighborhood of discrete events in a quantitative fashion. For example, if looking at a stream of gestures, we may be interested in how often the speaker changes from left hand (LH) to right hand (RH) to two hands (2H), in all possible combinations (Fig. 5).
Figure 5. Handedness transition diagrams for speakers JL and MR show preferences which hand(s) are used for gesturing and how often the mode is switched. Circle area indicates
unigram probability, size of the arrows and number indicate transition probability between gestures. The diagrams show that MR uses 2H more often than JL. Moreover, JL stays in one mode more often than MR, as the high probabilities on the 2H→2H, LH→LH, and
RH→RH arcs show.
Mathematically, this is modeled with relative frequencies, an approximation for the conditional probability of state B, e.g. LH, given that state A, e.g. RH, occurred beforehand. Formally, if we have a set of states s1, …, sn, then the conditional probability P(si | sj) is
approximated by the counts: where C(si, sj) counts the number of
occurrences of the states (si, sj), having occurred in this order, and C(si) counts the total number of si occurrences.
In speech processing (cf. Jurafsky & Martin 2003) this is also called a bigram, as opposed to the unigram which simply is the probability of a single state si, approximated by
. The transition diagram as displayed in Fig. 5 is a visualization of
unigrams and bigrams, where the unigram probability is indicated by the size of the circles of s1, …, sn and the bigram probabilities are indicated by the size of the arrows between the events.
14 Chapter 19
Transition diagrams give an immediate visualization of the bigram distribution and may guide the detection of regularities. The above example of gesture handedness was used, e.g. by Kipp et al. (2007a) and Neff et al. (2008) to detect and model idiosyncrasies in gesture behavior for two distinct speakers. The way a human speaker uses left hand, right hand or two hands is quite specific to the individual performer, a hypothesis validated in a recent semiotic study (Calbris 2008).
6.3 Association Analysis
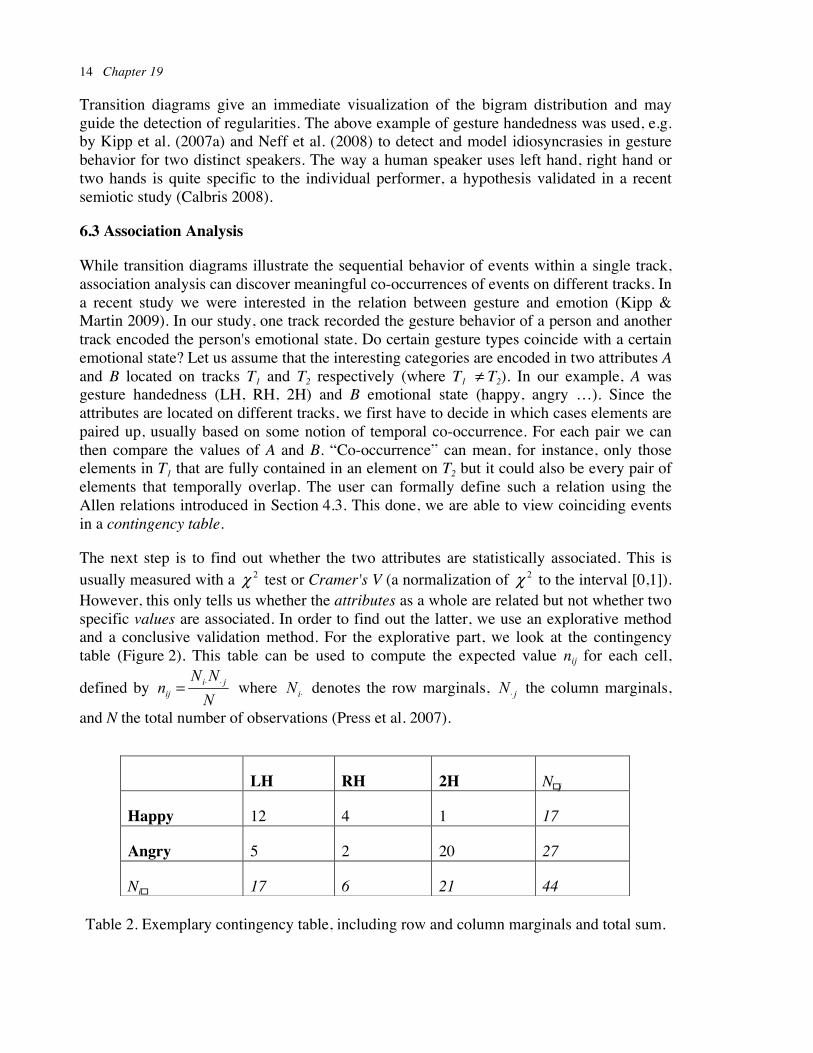
While transition diagrams illustrate the sequential behavior of events within a single track, association analysis can discover meaningful co-occurrences of events on different tracks. In a recent study we were interested in the relation between gesture and emotion (Kipp & Martin 2009). In our study, one track recorded the gesture behavior of a person and another track encoded the person's emotional state. Do certain gesture types coincide with a certain emotional state? Let us assume that the interesting categories are encoded in two attributes A and B located on tracks T1 and T2 respectively (where T1 T2). In our example, A was gesture handedness (LH, RH, 2H) and B emotional state (happy, angry …). Since the attributes are located on different tracks, we first have to decide in which cases elements are paired up, usually based on some notion of temporal co-occurrence. For each pair we can then compare the values of A and B. “Co-occurrence” can mean, for instance, only those elements in T1 that are fully contained in an element on T2 but it could also be every pair of elements that temporally overlap. The user can formally define such a relation using the Allen relations introduced in Section 4.3. This done, we are able to view coinciding events in a contingency table.
The next step is to find out whether the two attributes are statistically associated. This is usually measured with a test or Cramer's V (a normalization of to the interval [0,1]). However, this only tells us whether the attributes as a whole are related but not whether two specific values are associated. In order to find out the latter, we use an explorative method and a conclusive validation method. For the explorative part, we look at the contingency table (Figure 2). This table can be used to compute the expected value nij for each cell,
defined by where denotes the row marginals, the column marginals,
and N the total number of observations (Press et al. 2007).
Table 2. Exemplary contingency table, including row and column marginals and total sum.
LH RH 2H N�j
Happy 12 4 1 17
Angry 5 2 20 27
Ni� 17 6 21 44
Kipp 15
LH RH 2H
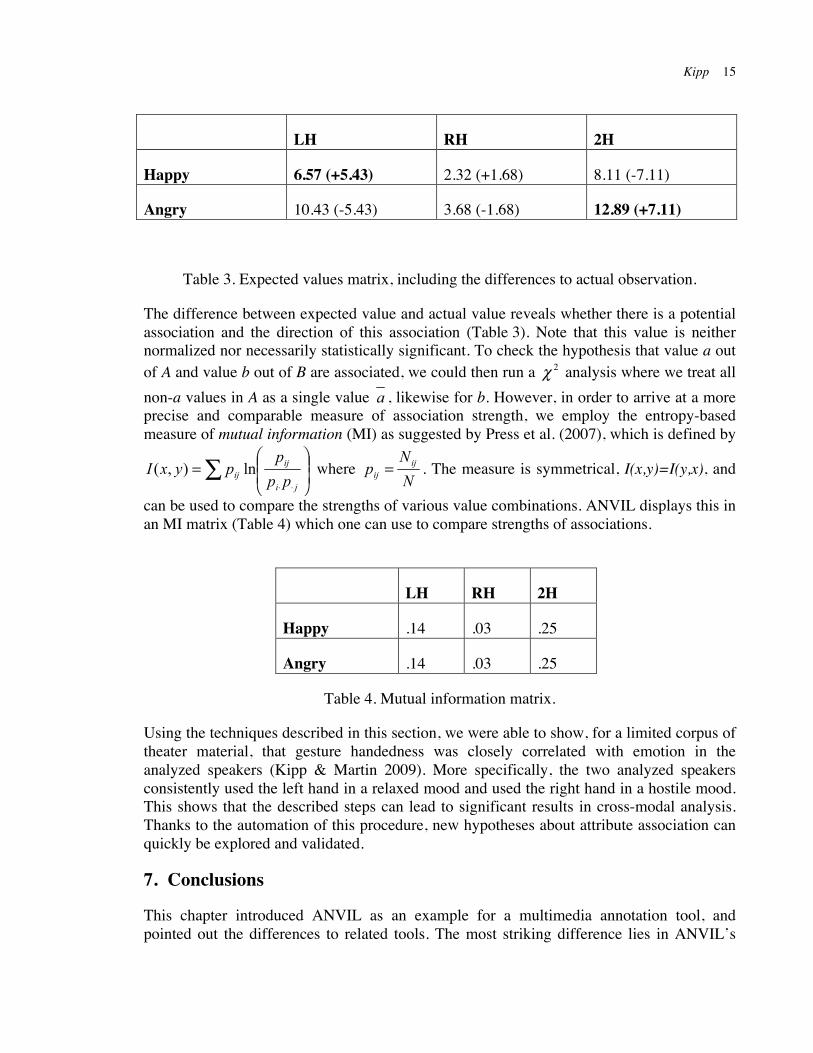
Happy 6.57 (+5.43) 2.32 (+1.68) 8.11 (-7.11)
Angry 10.43 (-5.43) 3.68 (-1.68) 12.89 (+7.11)
Table 3. Expected values matrix, including the differences to actual observation.
The difference between expected value and actual value reveals whether there is a potential association and the direction of this association (Table 3). Note that this value is neither normalized nor necessarily statistically significant. To check the hypothesis that value a out of A and value b out of B are associated, we could then run a analysis where we treat all non-a values in A as a single value , likewise for b. However, in order to arrive at a more precise and comparable measure of association strength, we employ the entropy-based measure of mutual information (MI) as suggested by Press et al. (2007), which is defined by
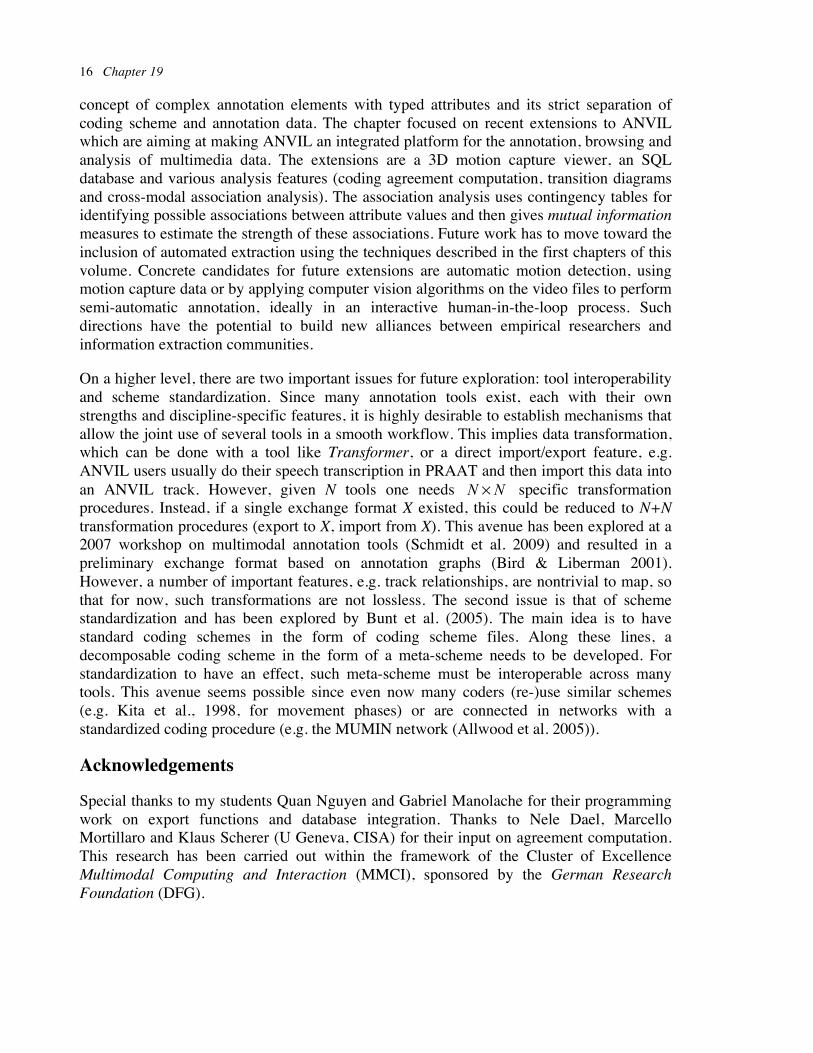
where . The measure is symmetrical, I(x,y)=I(y,x), and
can be used to compare the strengths of various value combinations. ANVIL displays this in an MI matrix (Table 4) which one can use to compare strengths of associations.
LH RH 2H
Happy .14 .03 .25
Angry .14 .03 .25
Table 4. Mutual information matrix.
Using the techniques described in this section, we were able to show, for a limited corpus of theater material, that gesture handedness was closely correlated with emotion in the analyzed speakers (Kipp & Martin 2009). More specifically, the two analyzed speakers consistently used the left hand in a relaxed mood and used the right hand in a hostile mood. This shows that the described steps can lead to significant results in cross-modal analysis. Thanks to the automation of this procedure, new hypotheses about attribute association can quickly be explored and validated.
7. Conclusions
This chapter introduced ANVIL as an example for a multimedia annotation tool, and pointed out the differences to related tools. The most striking difference lies in ANVIL’s
16 Chapter 19
concept of complex annotation elements with typed attributes and its strict separation of coding scheme and annotation data. The chapter focused on recent extensions to ANVIL which are aiming at making ANVIL an integrated platform for the annotation, browsing and analysis of multimedia data. The extensions are a 3D motion capture viewer, an SQL database and various analysis features (coding agreement computation, transition diagrams and cross-modal association analysis). The association analysis uses contingency tables for identifying possible associations between attribute values and then gives mutual information measures to estimate the strength of these associations. Future work has to move toward the inclusion of automated extraction using the techniques described in the first chapters of this volume. Concrete candidates for future extensions are automatic motion detection, using motion capture data or by applying computer vision algorithms on the video files to perform semi-automatic annotation, ideally in an interactive human-in-the-loop process. Such directions have the potential to build new alliances between empirical researchers and information extraction communities.
On a higher level, there are two important issues for future exploration: tool interoperability and scheme standardization. Since many annotation tools exist, each with their own strengths and discipline-specific features, it is highly desirable to establish mechanisms that allow the joint use of several tools in a smooth workflow. This implies data transformation, which can be done with a tool like Transformer, or a direct import/export feature, e.g. ANVIL users usually do their speech transcription in PRAAT and then import this data into an ANVIL track. However, given N tools one needs specific transformation procedures. Instead, if a single exchange format X existed, this could be reduced to N+N transformation procedures (export to X, import from X). This avenue has been explored at a 2007 workshop on multimodal annotation tools (Schmidt et al. 2009) and resulted in a preliminary exchange format based on annotation graphs (Bird & Liberman 2001). However, a number of important features, e.g. track relationships, are nontrivial to map, so that for now, such transformations are not lossless. The second issue is that of scheme standardization and has been explored by Bunt et al. (2005). The main idea is to have standard coding schemes in the form of coding scheme files. Along these lines, a decomposable coding scheme in the form of a meta-scheme needs to be developed. For standardization to have an effect, such meta-scheme must be interoperable across many tools. This avenue seems possible since even now many coders (re-)use similar schemes (e.g. Kita et al., 1998, for movement phases) or are connected in networks with a standardized coding procedure (e.g. the MUMIN network (Allwood et al. 2005)).
Acknowledgements
Special thanks to my students Quan Nguyen and Gabriel Manolache for their programming work on export functions and database integration. Thanks to Nele Dael, Marcello Mortillaro and Klaus Scherer (U Geneva, CISA) for their input on agreement computation. This research has been carried out within the framework of the Cluster of Excellence Multimodal Computing and Interaction (MMCI), sponsored by the German Research Foundation (DFG).
Kipp 17
References
Allwood, J., Cerrato, L., Dybkjaer, L., Jokinen, K., Navarretta, C. and Paggio, P. 2005. The MUMIN multimodal coding scheme. Technical report.
Arikan, O., Forsyth, D. A. and O'Brien, J. F. 2003. Motion synthesis from annotations. In: ACM Transactions on Graphics 22 (3), ACM Press, pp. 402-408.
Bakeman, R., & Gottman, J. M. 1987. Applying observational methods: A systematic view. In: J. D. Osofsky (Ed.), Handbook of infant development, New York, Wiley, pp. 818-854.
Barbic, J., Safonova, A., Pan, J.-Y., Faloutsos, C., Hodgins, J. K. and Pollard, N. S. 2004. Segmenting motion capture data into distinct behaviors. In: Proc. of the Int. Conf. on Graphics interface, pp. 185–194.
Bigbee, T., Loehr, D. and Harper, L. 2001. Emerging requirements for multi-modal annotation and analysis tools. In: Proceedings of the 7th European Conference on Speech Communication and Technology (Eurospeech), pp. 1533-1536.
Bird, S. and Liberman, M. 2001. A Formal Framework for Linguistic Annotation. In: Speech Communication, 33 (1–2), pp. 23-60.
Boersma, P. and Weenink, D. 2005. Praat: doing phonetics by computer (version 4.3.14) [computer program]. Retrieved from http://www.praat.org/.
Bunt, H., Kipp, M., Maybury, M. T. and Wahlster, W. 2005. Fusion and Coordination For Multimodal Interactive Information Presentation. In: Oliviero Stock and Massimo Zancanaro (eds.) Multimodal Intelligent Information Presentation, Springer, pp. 325-340.
Calbris, G. 2008. From left to right...: Coverbal gestures and their symbolic use of space. In: Metaphor and Gesture, John Benjamins, Amsterdam, pp. 27–53.
Cohen, J. A. 1960. A coefficient of agreement for nominal scales. In: Educational and Psychological Measurement, 20 (1), Sage Publications, pp. 37-46.
Crasborn, O., Sloetjes, H., Auer, E. and Wittenburg, P. 2006. Combining video and numeric data in the analysis of sign languages with the ELAN annotation software. In: C. Vetoori (Ed.), Proceedings of the 2nd Workshop on the Representation and Processing of Sign languages: Lexicographic matters and didactic scenarios, ELRA, Paris, pp. 82-87.
Ekman, P. & Friesen, W. V. 1978. Facial Action Coding System. Consulting Psychologists Press, Inc.
18 Chapter 19
Fikkert, W., van der Kooij, H. Ruttkay, Z. and van Welbergen, H. 2008. Measuring behavior using motion capture symposium. In: Proceedings of Measuring Behavior, Noldus, pp. 13-32.
Fleiss, J. L., Levin, B., & Paik, M. C. 2004. Statistical methods for rates and proportions. New York: Wiley.
Jurafsky, D. and Martin, J. H. 2003. Speech and Language Processing, Prentice Hall.
Kipp, M. 2008. Spatiotemporal coding in ANVIL. In: Proceedings of the 6th international conference on Language Resources and Evaluation (LREC), ELRA, http://www.lrec-conf.org/proceedings/lrec2008.
Kipp, M. 2001. Anvil – a Generic Annotation Tool for Multimodal Dialogue. In: Proceedings of Eurospeech, ISCA Archive, pp. 1367–1370.
Kipp, M. and Martin, J.-C. 2009. Gesture and Emotion: Can basic gestural form features discriminate emotions? In: Proceedings of the International Conference on Affective Computing and Intelligent Interaction (ACII-09), IEEE Press.
Kipp, M., Neff, M. and Albrecht, I. 2007. An Annotation Scheme for Conversational Gestures: How to economically capture timing and form. In: Journal on Language Resources and Evaluation - Special Issue on Multimodal Corpora, 41(3-4), Springer, pp. 325–339.
Kipp, M., Neff, M., Kipp, K. H. and Albrecht, I. 2007. Toward Natural Gesture Synthesis: Evaluating gesture units in a data-driven approach. In: Proc. of the 7th International Conference on Intelligent Virtual Agents (IVA-07), Springer, pp. 15–28.
Kita, S., van Gijn, I. and van der Hulst, H. 1998. Movement phases in signs and co-speech gestures, and their transcription by human coders. In: Wachsmuth, I. and Fröhlich, M. (eds.) Gesture and Sign Language in Human-Computer Interaction, Springer, pp. 23–35.
Martin, J.-C. and Kipp, M. 2002. Annotating and Measuring Multimodal Behaviour – Tycoon Metrics in the Anvil Tool. In: Proceedings of the Third International Conference on Language Resources and Evaluation (LREC), ELRA, pp. 31–35.
Müller, M., Röder, T. and Clausen, M. 2005. Efficient content-based retrieval of motion capture data. In: ACM Transactions on Graphics, 24 (3), ACM Press, pp. 677–685.
Neff, M., Kipp, M., Albrecht, I. and Seidel, H.-P. 2008. Gesture Modeling and Animation Based on a Probabilistic Recreation of Speaker Style. In: ACM Transactions on Graphics, 27(1), ACM Press, pp. 1–24.
Olston, C., Reed, B., Srivastava, U., Kumar, R. and Tomkins, A. 2008. Pig latin: a not-so-foreign language for data processing. In: Proceedings of the 2008 ACM SIGMOD international conference on management of data, ACM Press, pp. 1099-1110.
Kipp 19
Press, W. H., Teukolsky, S. A., Vetterling, W. T. and Flannery, B. P. 2007. Numerical Recipes: The Art of Scientific Computing. Cambridge University Press.
Rohlfing, K., Loehr, D., Duncan, S., Brown, A., Franklin, A., Kimbara, I., Milde, J.-T., Parrill, F., Rose, T., Schmidt, T., Sloetjes, H., Thies, A. and Wellinghoff, S. 2006. Comparison of multimodal annotation tools — workshop report. In: Gesprächsforschung, 7, Verlag für Gesprächsforschung, pp. 99–123.
Roetenberg, D., Luinge, H. and Slycke, P. 2008. 6 DOF motion analysis using inertial sensors. In: Proceedings of Measuring Behavior, Noldus, pp. 14-15.
Rose, T., Quek, F. and Shi, Y. 2004. MacVissta: A system for multimodal analysis. In: Proceedings of the 6th International Conference on Multimodal Interfaces (ICMI), ACM Press, pp. 259-264.
Schmidt, T. 2004. Transcribing and annotating spoken language with Exmaralda. In: Proceedings of the LREC-Workshop on XML based richly annotated corpora, ELRA, Paris.
Schmidt, T., Ehmer, O., Hoyt, J., Kipp, M., Loehr, D., Rose, T., Sloetjes, H., Duncan, S., and Magnusson, M. 2009. An exchange format for multimodal annotations. In: Multimodal Corpora: From Models of Natural Interaction to Systems and Applications, Lecture Notes on Aritificial Intelligence, LNAI 5509, Springer, pp. 207-222.
Wittenburg, P., Brugman, H., Russel, A., Klassmann, A. and Sloetjes, H. 2006. ELAN: A professional framework for multimodality research. In: Proceedings of the Fifth International Conference on Language Resources and Evaluation (LREC), ELRA, Paris.