Embed Size (px)
DESCRIPTION
Department of Employment, Training & Rehabilitation Dennis Perea, Interim Director Bill Anderson, Chief Economist David Schmidt, Supervising Economist Prepared by the Research and Analysis Bureau and presented to the Employment Security Council, Oct. 2014. Nevada Labor Market Briefing. - PowerPoint PPT Presentation
Citation preview

The Nevada Department of Employment, Training and Rehabilitation is a proactive workforce & rehabilitation agency
Nevada Labor Market Briefing
Department of Employment, Training & Rehabilitation
Dennis Perea, Interim Director
Bill Anderson, Chief Economist
David Schmidt, Supervising Economist
Prepared by the Research and Analysis Bureau and presented to the Employment Security Council, Oct. 2014
The Nevada Department of Employment, Training and Rehabilitation is a proactive workforce & rehabilitation agency
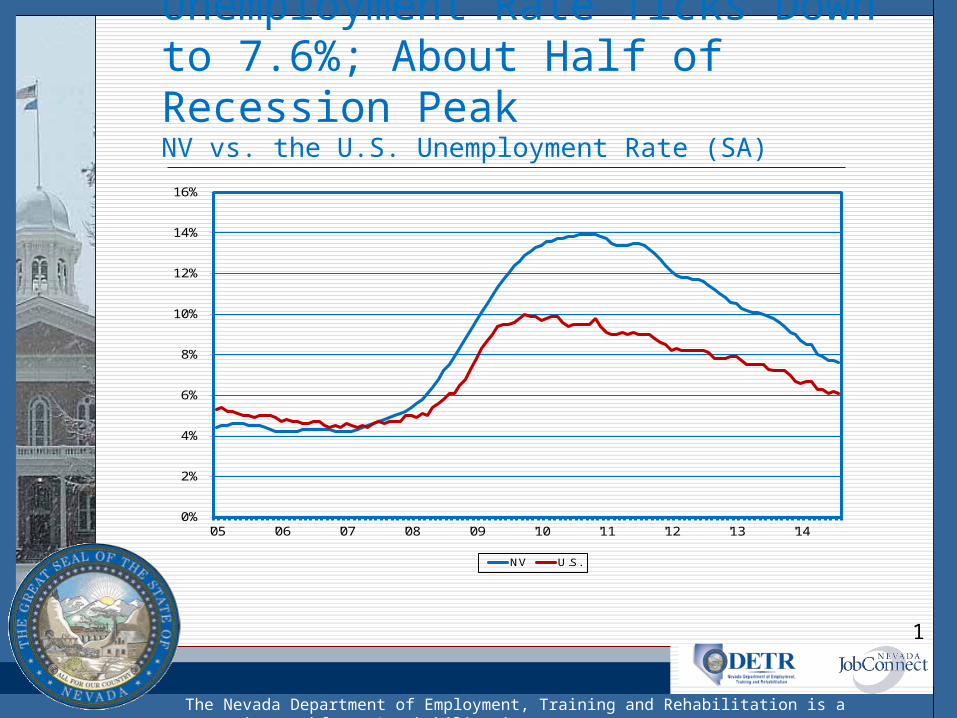
Unemployment Rate Ticks Down to 7.6%; About Half of Recession PeakNV vs. the U.S. Unemployment Rate (SA)
0%
2%
4%
6%
8%
10%
12%
14%
16%
'05 '06 '07 '08 '09 '10 '11 '12 '13 '14
NV U.S.
1
The Nevada Department of Employment, Training and Rehabilitation is a proactive workforce & rehabilitation agency
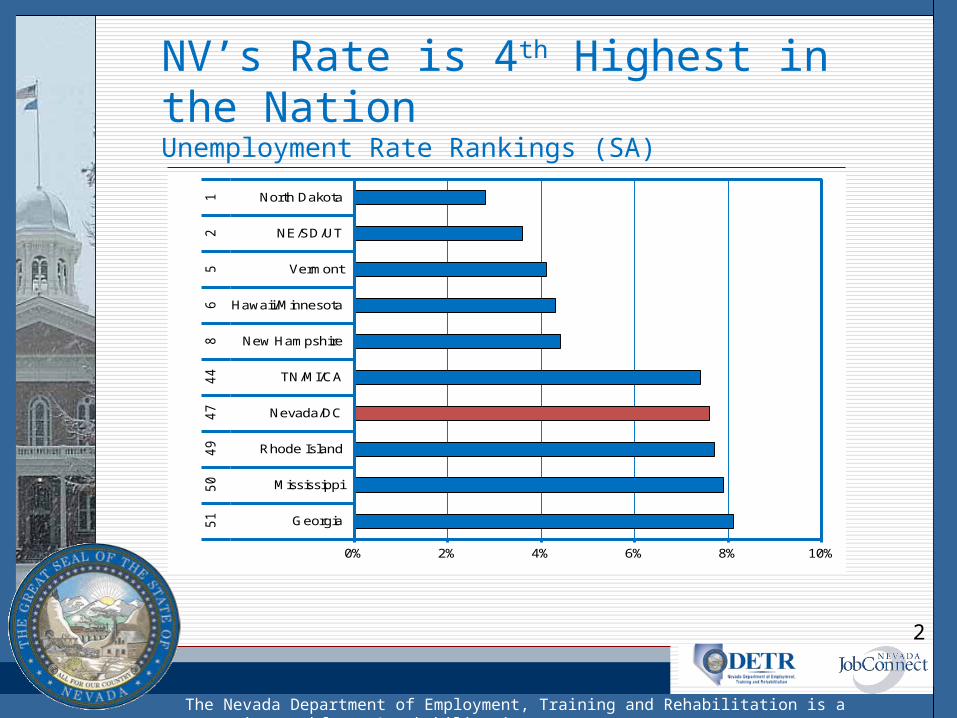
NV’s Rate is 4th Highest in the NationUnemployment Rate Rankings (SA)
0% 2% 4% 6% 8% 10%
Georgia
Mississippi
Rhode Island
Nevada/DC
TN/MI/CA
New Hampshire
Hawaii/Minnesota
Vermont
NE/SD/UT
North Dakota5
15
04
94
74
48
65
21
2
The Nevada Department of Employment, Training and Rehabilitation is a proactive workforce & rehabilitation agency
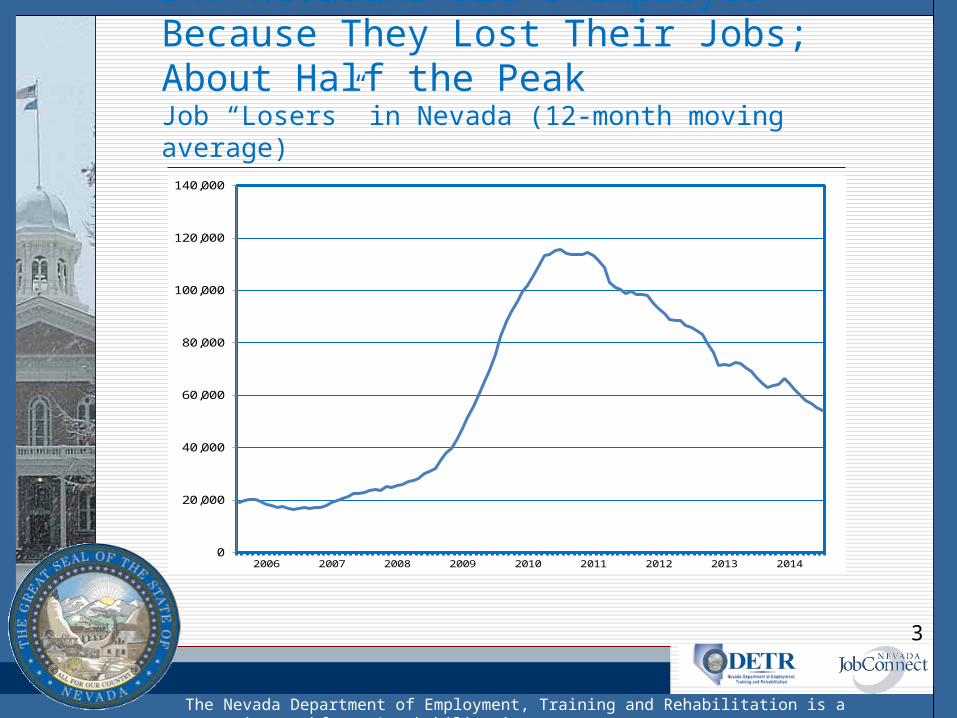
54K Nevadans are Unemployed Because They Lost Their Jobs; About Half the PeakJob “Losers” in Nevada (12-month moving average)
0
20,000
40,000
60,000
80,000
100,000
120,000
140,000
2006 2007 2008 2009 2010 2011 2012 2013 2014
3
The Nevada Department of Employment, Training and Rehabilitation is a proactive workforce & rehabilitation agency
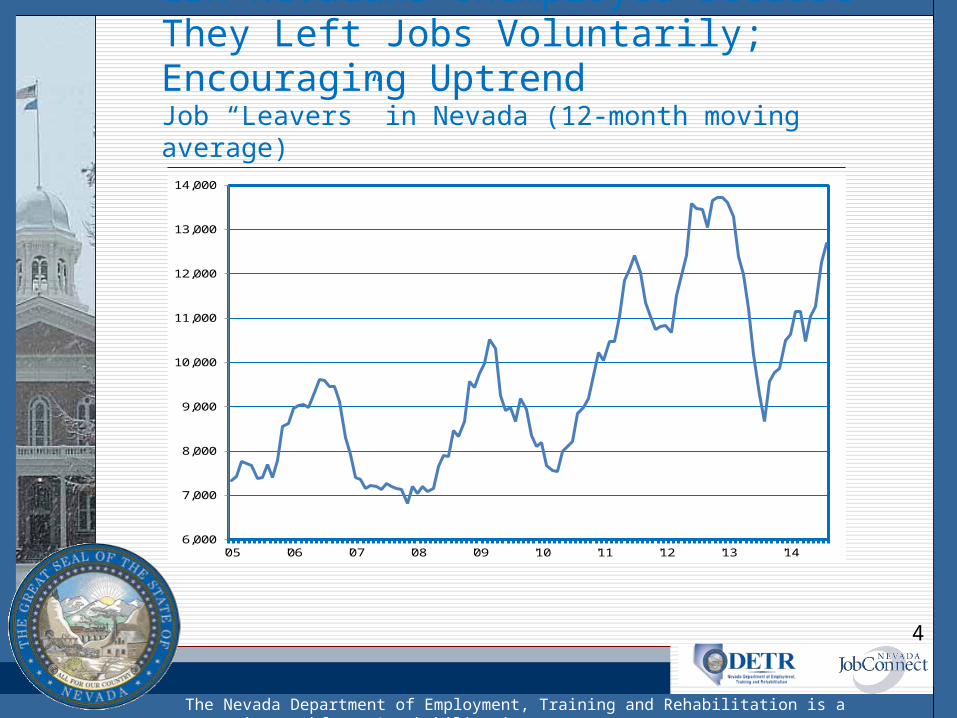
13K Nevadans Unemployed Because They Left Jobs Voluntarily; Encouraging UptrendJob “Leavers” in Nevada (12-month moving average)
6,000
7,000
8,000
9,000
10,000
11,000
12,000
13,000
14,000
'05 '06 '07 '08 '09 '10 '11 '12 '13 '14
4
The Nevada Department of Employment, Training and Rehabilitation is a proactive workforce & rehabilitation agency
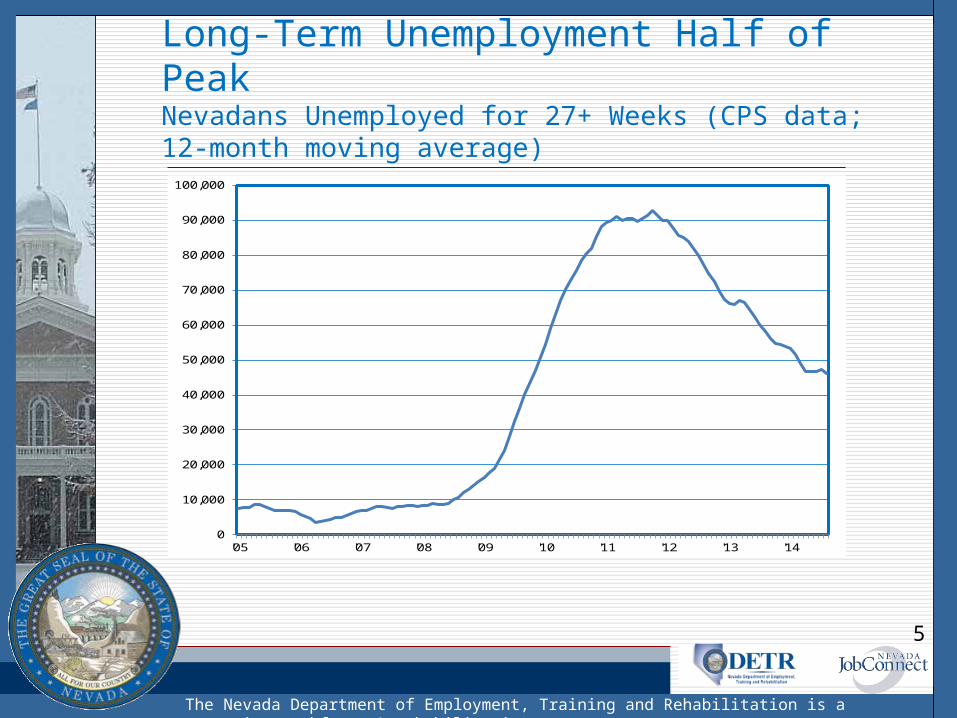
Long-Term Unemployment Half of PeakNevadans Unemployed for 27+ Weeks (CPS data; 12-month moving average)
0
10,000
20,000
30,000
40,000
50,000
60,000
70,000
80,000
90,000
100,000
'05 '06 '07 '08 '09 '10 '11 '12 '13 '14
5
The Nevada Department of Employment, Training and Rehabilitation is a proactive workforce & rehabilitation agency
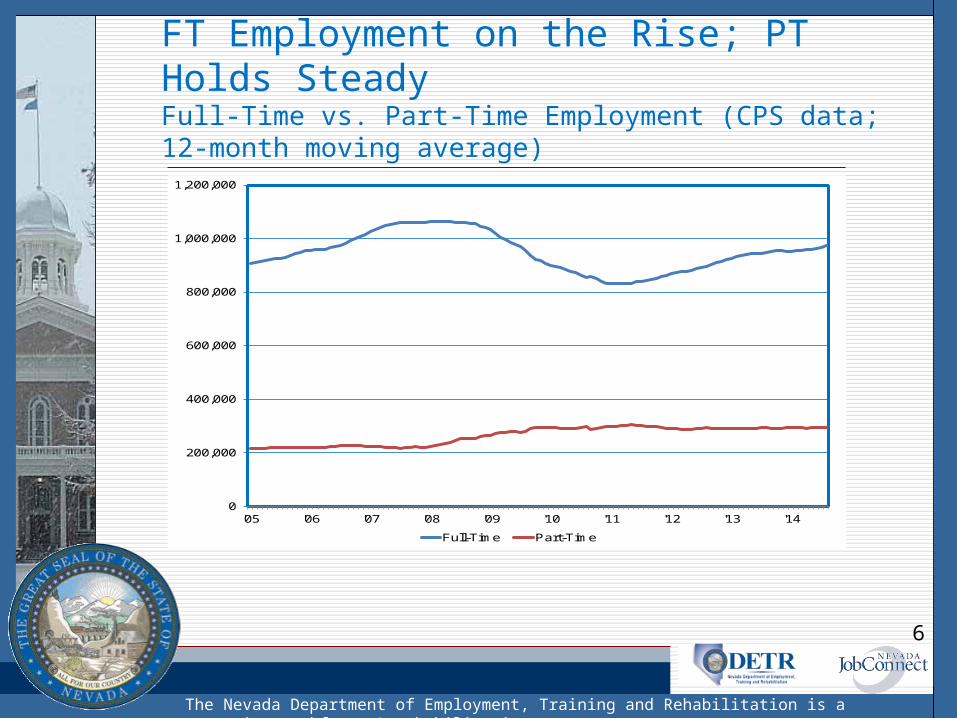
FT Employment on the Rise; PT Holds SteadyFull-Time vs. Part-Time Employment (CPS data; 12-month moving average)
0
200,000
400,000
600,000
800,000
1,000,000
1,200,000
'05 '06 '07 '08 '09 '10 '11 '12 '13 '14
Full-Time Part-Time
6

The Nevada Department of Employment, Training and Rehabilitation is a proactive workforce & rehabilitation agency
Including Discouraged Workers Adds About a Percentage Point to the “Official” RateAlternative Measures Of Labor Underutilization
Measure Underutilization Concept Level
Official Ratejobless persons available to take a job who have actively sought work in the past four weeks
8.8%
U-1 jobless 15 weeks or longer 4.9%
U-2job losers and persons losing a temporary job
4.8%
U-3 similar to official rate 8.8%
U-4 U-3 plus discouraged workers 9.7%
U-5U-4 plus others marginally attached to the labor force
10.5%
U-6U-5 plus those employed part-time for economic reasons
16.2%
Alternative Measures of Labor Underutilization(Year-ending 2014:IIQ)
7

The Nevada Department of Employment, Training and Rehabilitation is a proactive workforce & rehabilitation agency
NV Adds 41,200 Jobs Relative to Year-Ago; Trending up for 44 monthsNonfarm Jobs in Nevada (SA)
1,000,000
1,050,000
1,100,000
1,150,000
1,200,000
1,250,000
1,300,000
1,350,000
1,400,000
'04 '05 '06 '07 '08 '09 '10 '11 '12 '13 '14
8
The Nevada Department of Employment, Training and Rehabilitation is a proactive workforce & rehabilitation agency
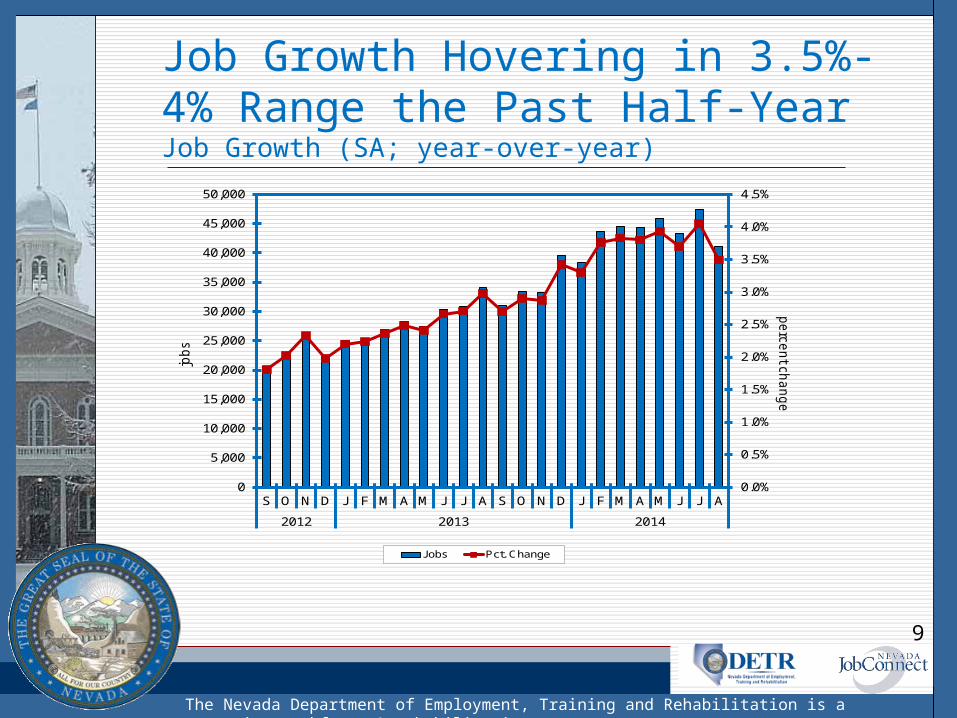
Job Growth Hovering in 3.5%-4% Range the Past Half-YearJob Growth (SA; year-over-year)
0.0%
0.5%
1.0%
1.5%
2.0%
2.5%
3.0%
3.5%
4.0%
4.5%
0
5,000
10,000
15,000
20,000
25,000
30,000
35,000
40,000
45,000
50,000
S O N D J F M A M J J A S O N D J F M A M J J A
2012 2013 2014
perc
ent c
hange
jobs
Jobs Pct. Change
9
The Nevada Department of Employment, Training and Rehabilitation is a proactive workforce & rehabilitation agency
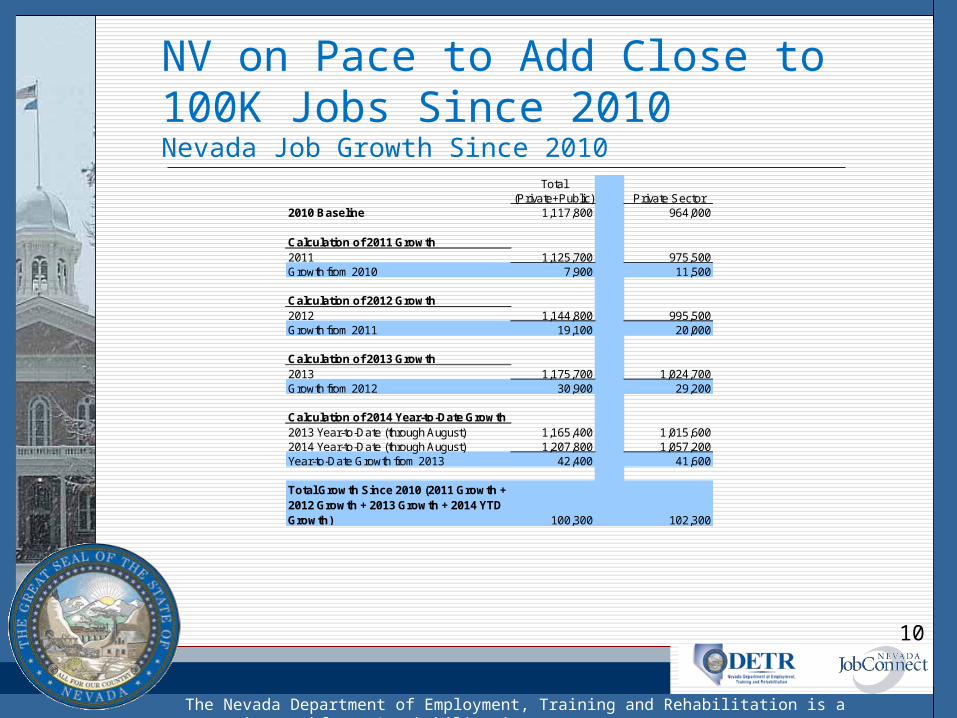
NV on Pace to Add Close to 100K Jobs Since 2010Nevada Job Growth Since 2010
Total(Private+Public) Private Sector
2010 Baseline 1,117,800 964,000
Calculation of 2011 Growth2011 1,125,700 975,500Growth from 2010 7,900 11,500
Calculation of 2012 Growth2012 1,144,800 995,500Growth from 2011 19,100 20,000
Calculation of 2013 Growth2013 1,175,700 1,024,700Growth from 2012 30,900 29,200
Calculation of 2014 Year-to-Date Growth2013 Year-to-Date (through August) 1,165,400 1,015,6002014 Year-to-Date (through August) 1,207,800 1,057,200Year-to-Date Growth from 2013 42,400 41,600
Total Growth Since 2010 (2011 Growth + 2012 Growth + 2013 Growth + 2014 YTD Growth) 100,300 102,300
10
The Nevada Department of Employment, Training and Rehabilitation is a proactive workforce & rehabilitation agency
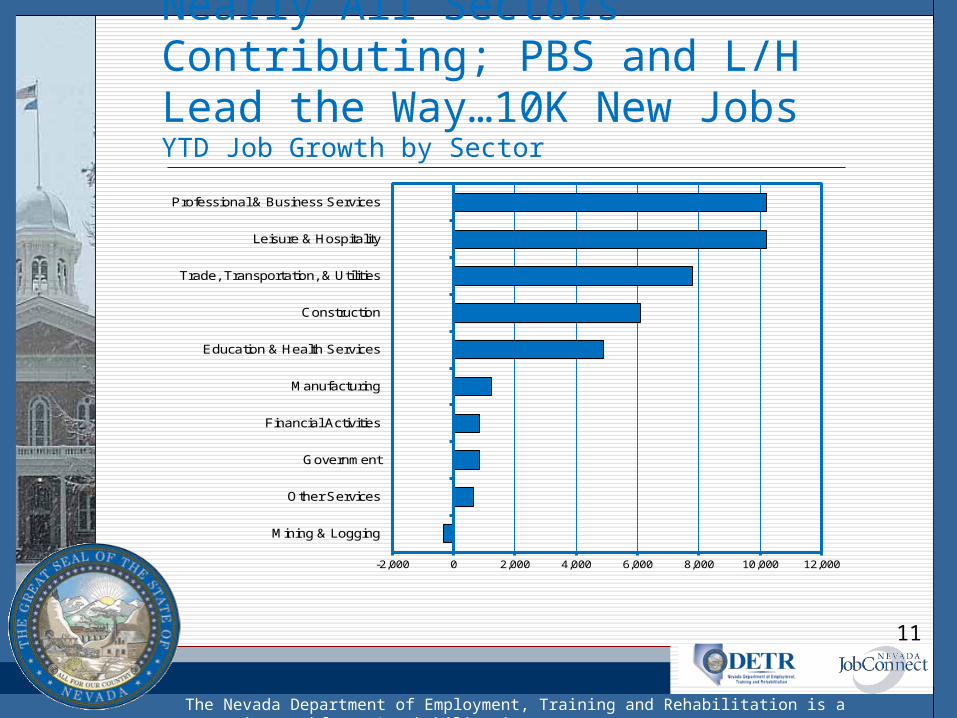
Nearly All Sectors Contributing; PBS and L/H Lead the Way…10K New JobsYTD Job Growth by Sector
-2,000 0 2,000 4,000 6,000 8,000 10,000 12,000
Mining & Logging
Other Services
Government
Financial Activities
Manufacturing
Education & Health Services
Construction
Trade, Transportation, & Utilities
Leisure & Hospitality
Professional & Business Services
11
The Nevada Department of Employment, Training and Rehabilitation is a proactive workforce & rehabilitation agency
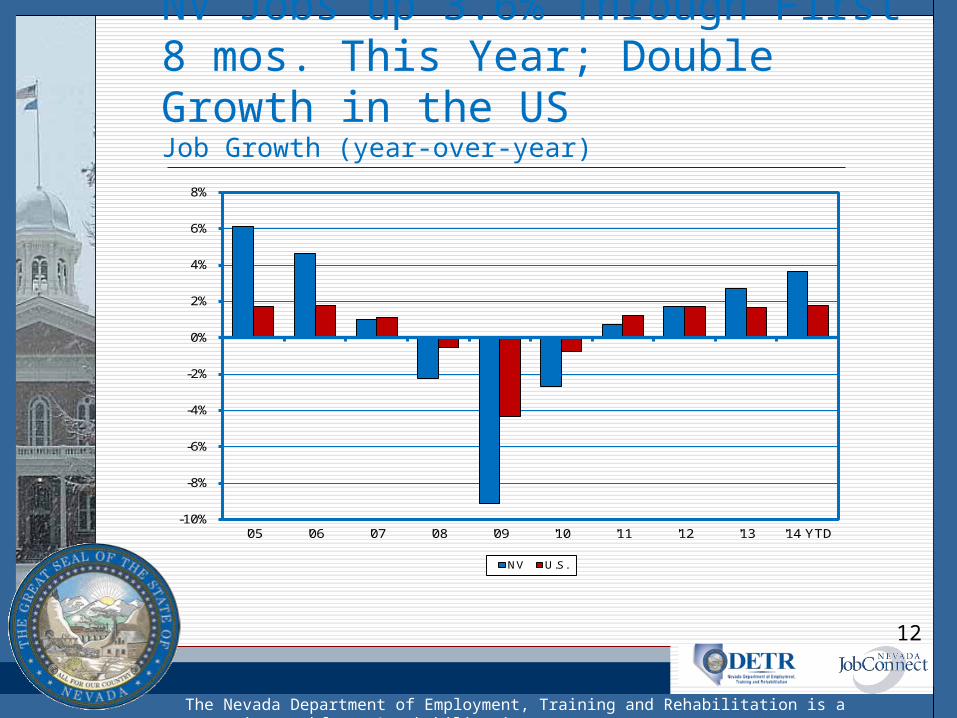
NV Jobs up 3.6% Through First 8 mos. This Year; Double Growth in the USJob Growth (year-over-year)
-10%
-8%
-6%
-4%
-2%
0%
2%
4%
6%
8%
'05 '06 '07 '08 '09 '10 '11 '12 '13 '14 YTD
NV U.S.
12

The Nevada Department of Employment, Training and Rehabilitation is a proactive workforce & rehabilitation agency
NV Job Growth Outpaces US in Nine of Ten Super SectorsYTD Job Growth; NV minus US
-8% -6% -4% -2% 0% 2% 4% 6% 8% 10%
Mining & Logging
Leisure & Hospitality
Government
Financial Activities
Other Services
Trade, Transportation, & Utilities
Manufacturing
Education & Health Services
Professional & Business Services
Construction
13
The Nevada Department of Employment, Training and Rehabilitation is a proactive workforce & rehabilitation agency
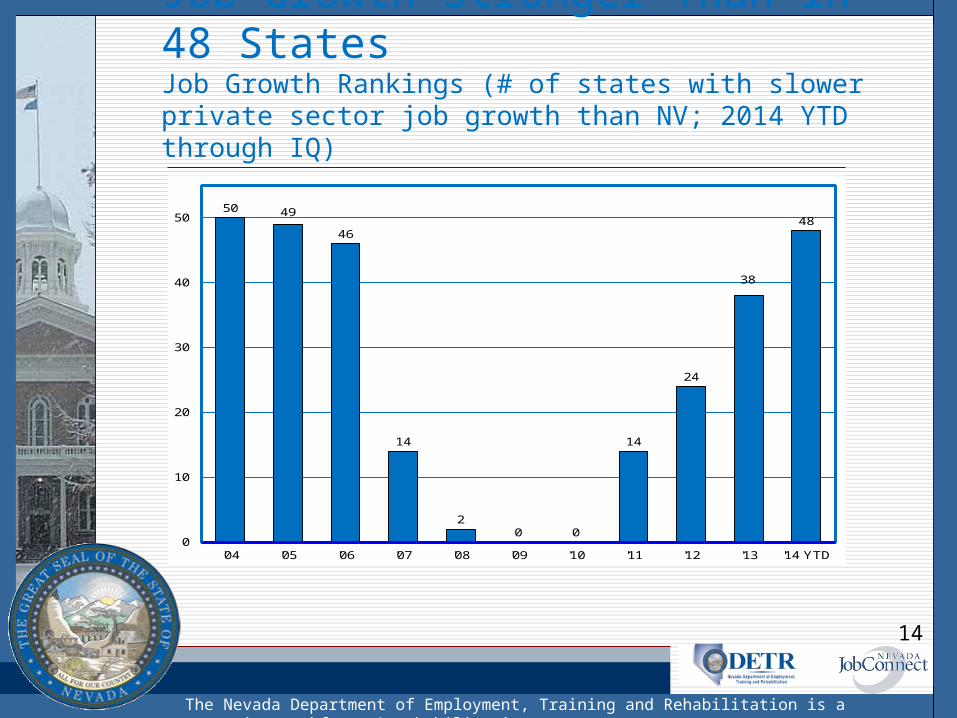
Job Growth Stronger Than in 48 StatesJob Growth Rankings (# of states with slower private sector job growth than NV; 2014 YTD through IQ)
50 49
46
14
20 0
14
24
38
48
0
10
20
30
40
50
'04 '05 '06 '07 '08 '09 '10 '11 '12 '13 '14 YTD
14
The Nevada Department of Employment, Training and Rehabilitation is a proactive workforce & rehabilitation agency
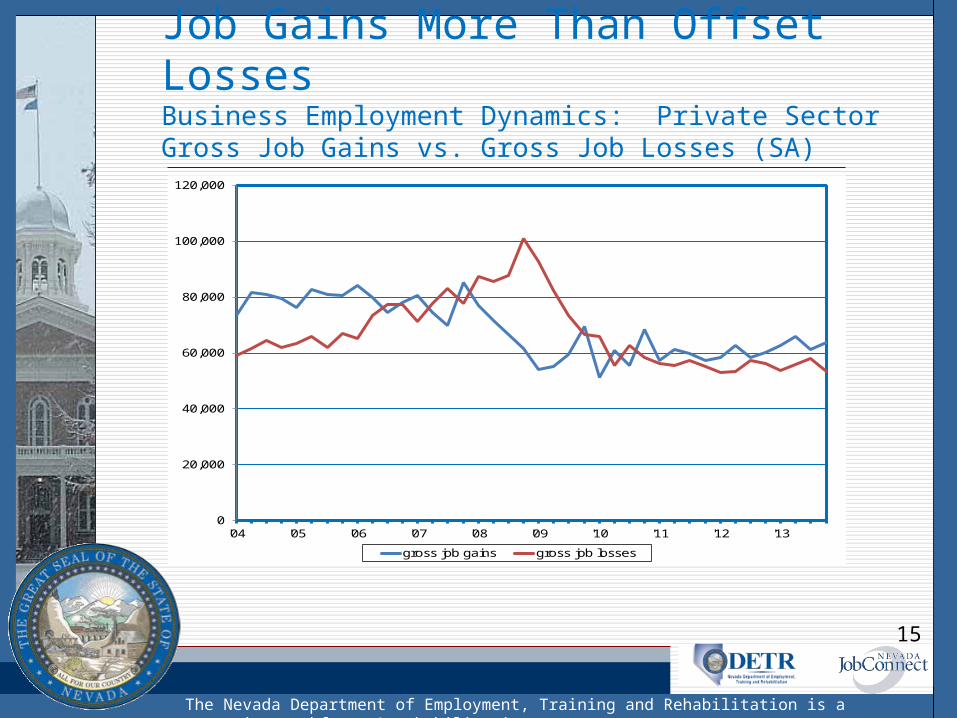
Job Gains More Than Offset LossesBusiness Employment Dynamics: Private Sector Gross Job Gains vs. Gross Job Losses (SA)
0
20,000
40,000
60,000
80,000
100,000
120,000
'04 '05 '06 '07 '08 '09 '10 '11 '12 '13
gross job gains gross job losses
15

The Nevada Department of Employment, Training and Rehabilitation is a proactive workforce & rehabilitation agency
New Jobs > Losses From ClosingsBusiness Employment Dynamics: Gross Job Gains vs. Gross Losses in New & Closing Establishments(SA)
6,000
8,000
10,000
12,000
14,000
16,000
18,000
'04 '05 '06 '07 '08 '09 '10 '11 '12 '13
gains from openings losses from closings
16
The Nevada Department of Employment, Training and Rehabilitation is a proactive workforce & rehabilitation agency
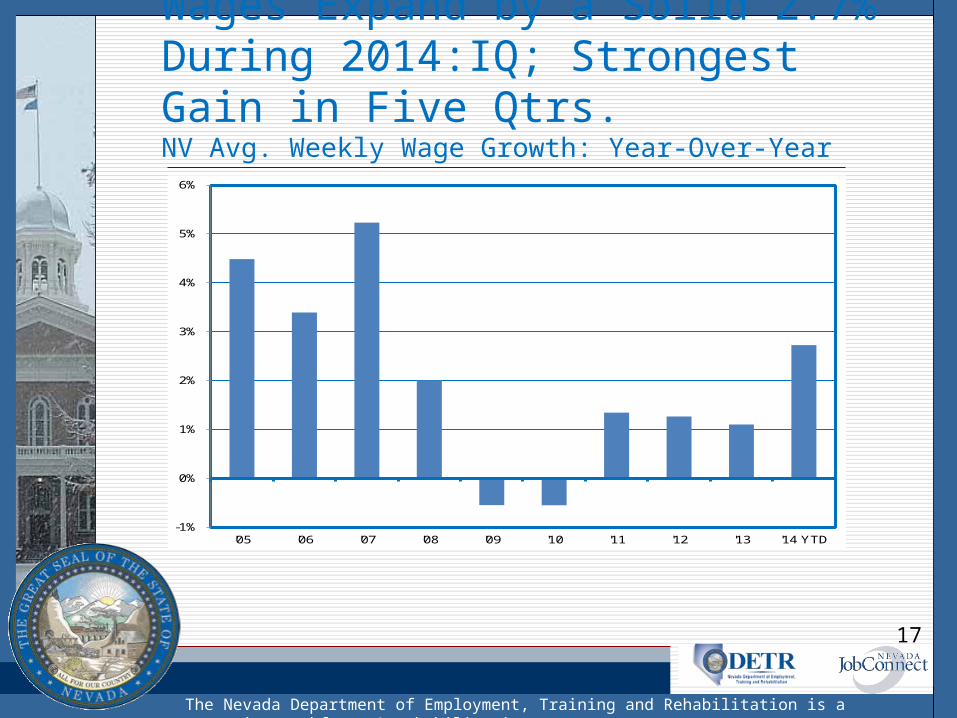
Wages Expand by a Solid 2.7% During 2014:IQ; Strongest Gain in Five Qtrs.NV Avg. Weekly Wage Growth: Year-Over-Year
-1%
0%
1%
2%
3%
4%
5%
6%
'05 '06 '07 '08 '09 '10 '11 '12 '13 '14 YTD
17
The Nevada Department of Employment, Training and Rehabilitation is a proactive workforce & rehabilitation agency
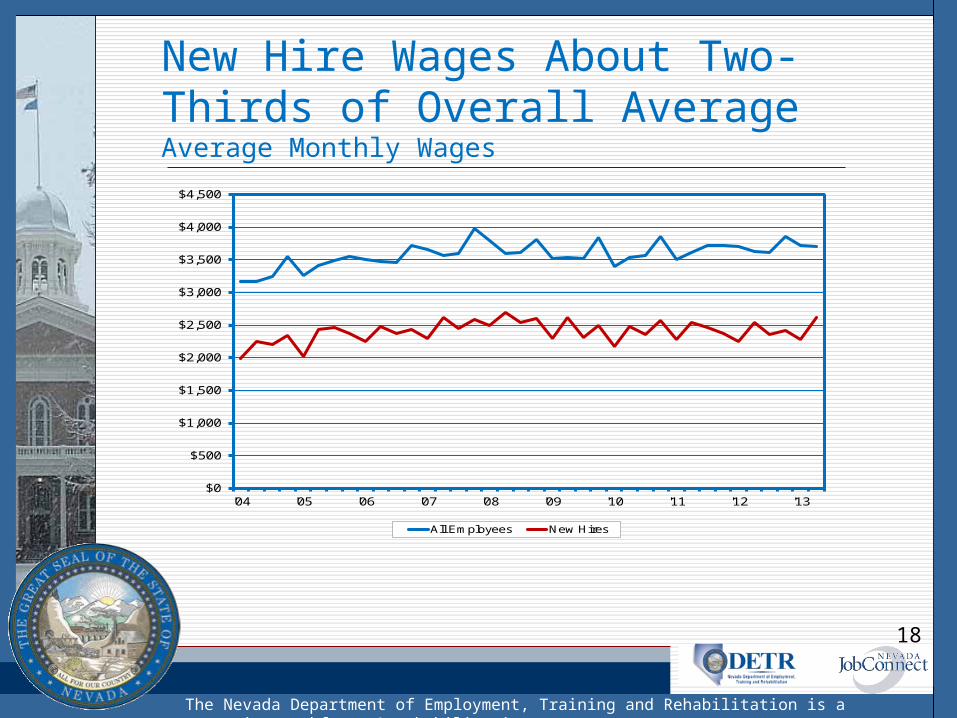
New Hire Wages About Two-Thirds of Overall AverageAverage Monthly Wages
$0
$500
$1,000
$1,500
$2,000
$2,500
$3,000
$3,500
$4,000
$4,500
'04 '05 '06 '07 '08 '09 '10 '11 '12 '13
All Employees New Hires
18
The Nevada Department of Employment, Training and Rehabilitation is a proactive workforce & rehabilitation agency
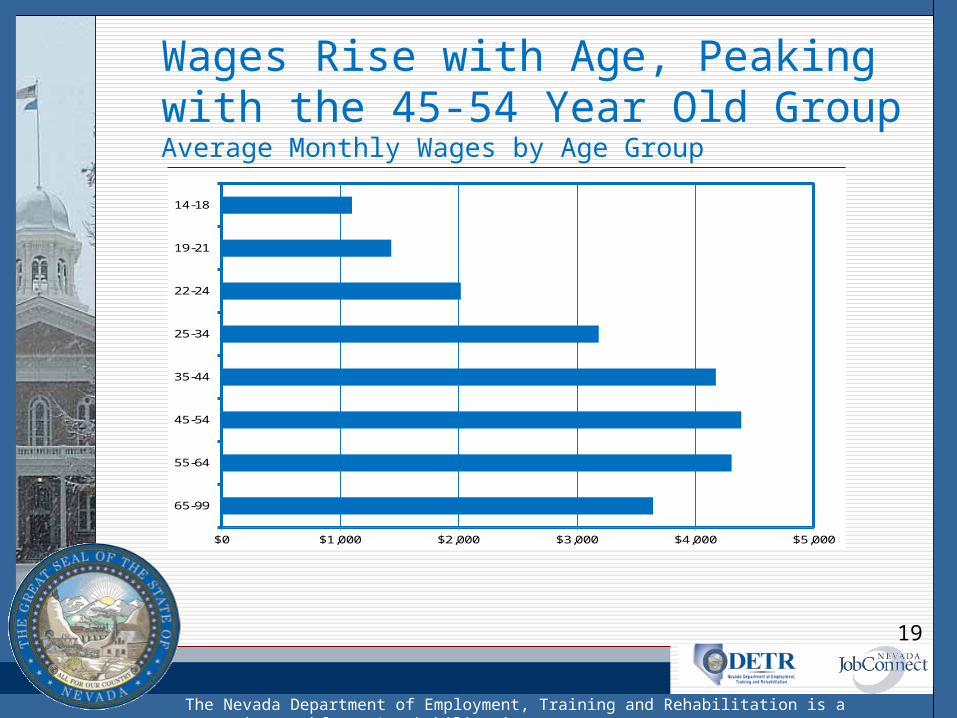
Wages Rise with Age, Peaking with the 45-54 Year Old GroupAverage Monthly Wages by Age Group
$0 $1,000 $2,000 $3,000 $4,000 $5,000
65-99
55-64
45-54
35-44
25-34
22-24
19-21
14-18
19
The Nevada Department of Employment, Training and Rehabilitation is a proactive workforce & rehabilitation agency
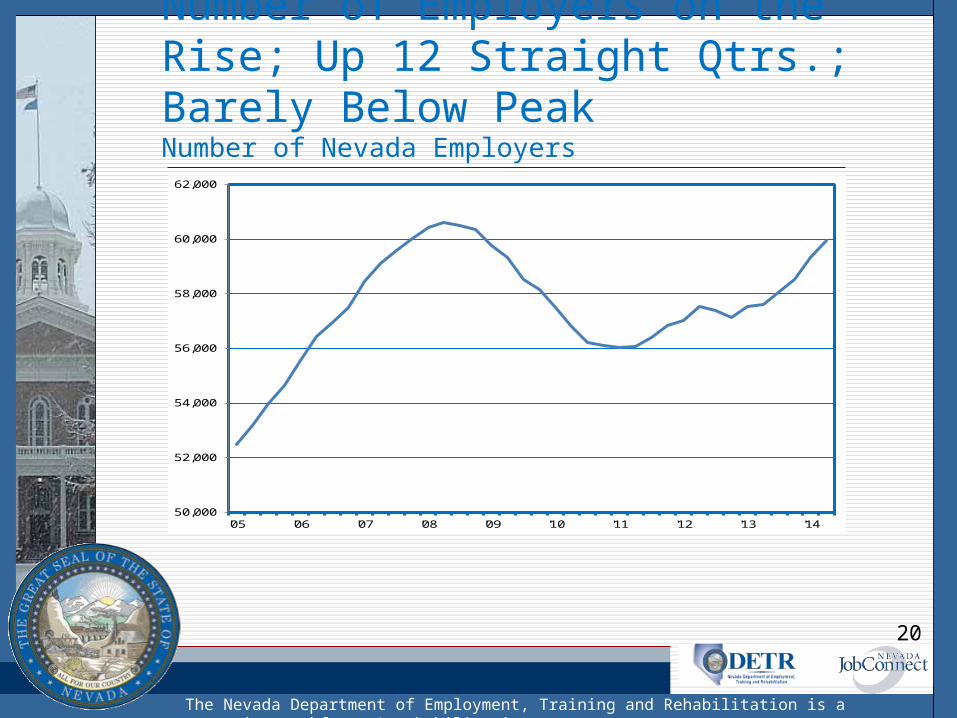
Number of Employers on the Rise; Up 12 Straight Qtrs.; Barely Below PeakNumber of Nevada Employers
50,000
52,000
54,000
56,000
58,000
60,000
62,000
'05 '06 '07 '08 '09 '10 '11 '12 '13 '14
20
The Nevada Department of Employment, Training and Rehabilitation is a proactive workforce & rehabilitation agency
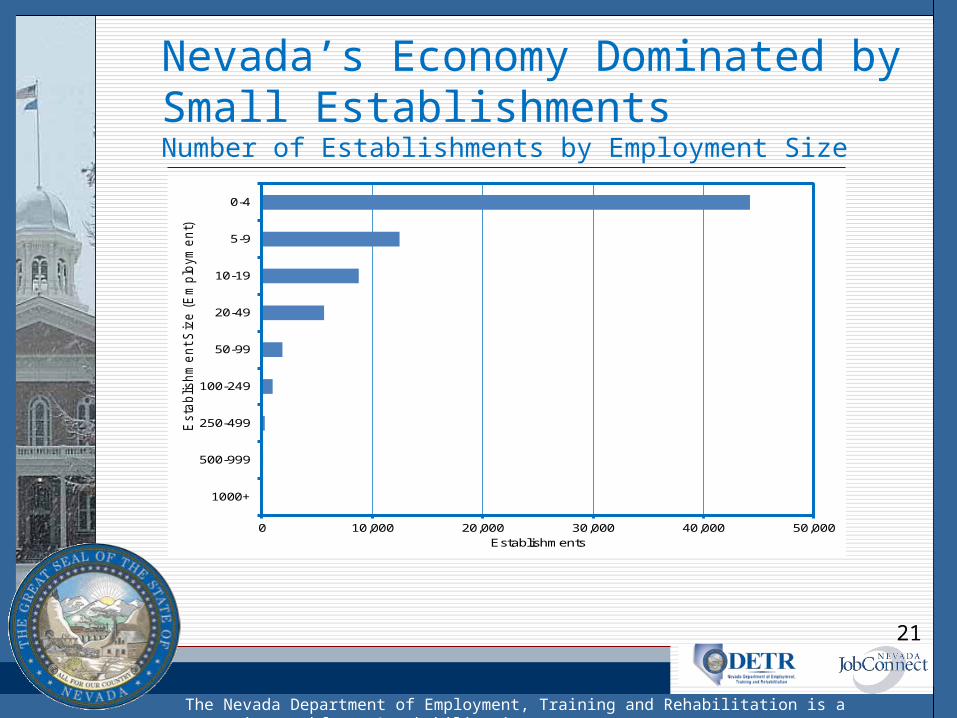
Nevada’s Economy Dominated by Small EstablishmentsNumber of Establishments by Employment Size
0 10,000 20,000 30,000 40,000 50,000
1000+
500-999
250-499
100-249
50-99
20-49
10-19
5-9
0-4
Establishments
Esta
blishm
ent S
ize (
Em
plo
ym
ent)
21
The Nevada Department of Employment, Training and Rehabilitation is a proactive workforce & rehabilitation agency
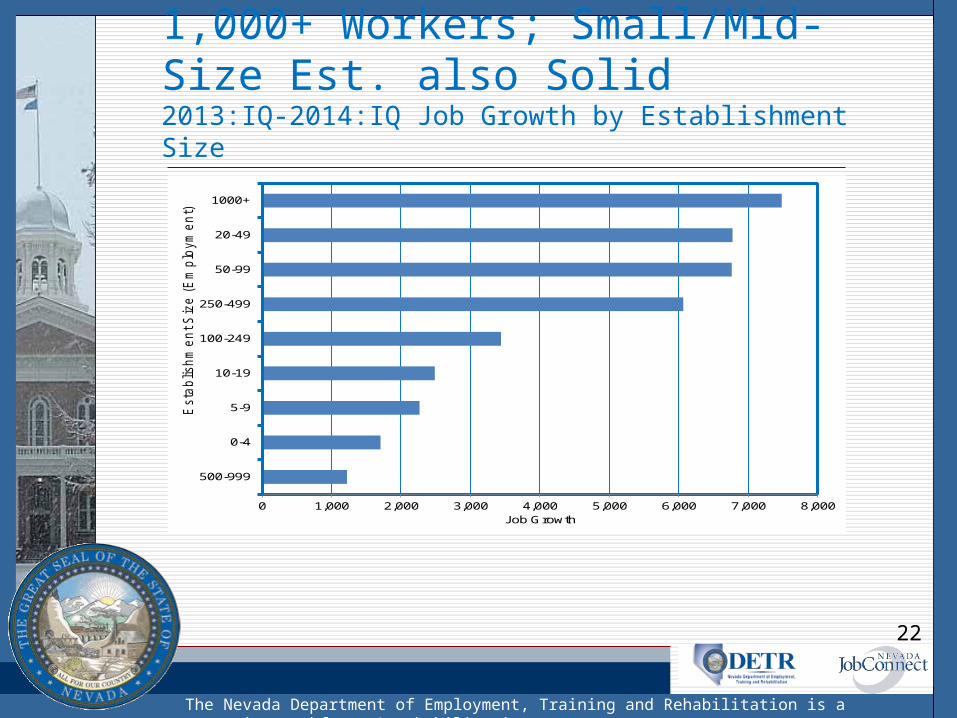
Big Job Gain in Est. with 1,000+ Workers; Small/Mid-Size Est. also Solid2013:IQ-2014:IQ Job Growth by Establishment Size
0 1,000 2,000 3,000 4,000 5,000 6,000 7,000 8,000
500-999
0-4
5-9
10-19
100-249
250-499
50-99
20-49
1000+
Job Growth
Esta
blishm
ent S
ize (
Em
plo
ym
ent)
22
The Nevada Department of Employment, Training and Rehabilitation is a proactive workforce & rehabilitation agency
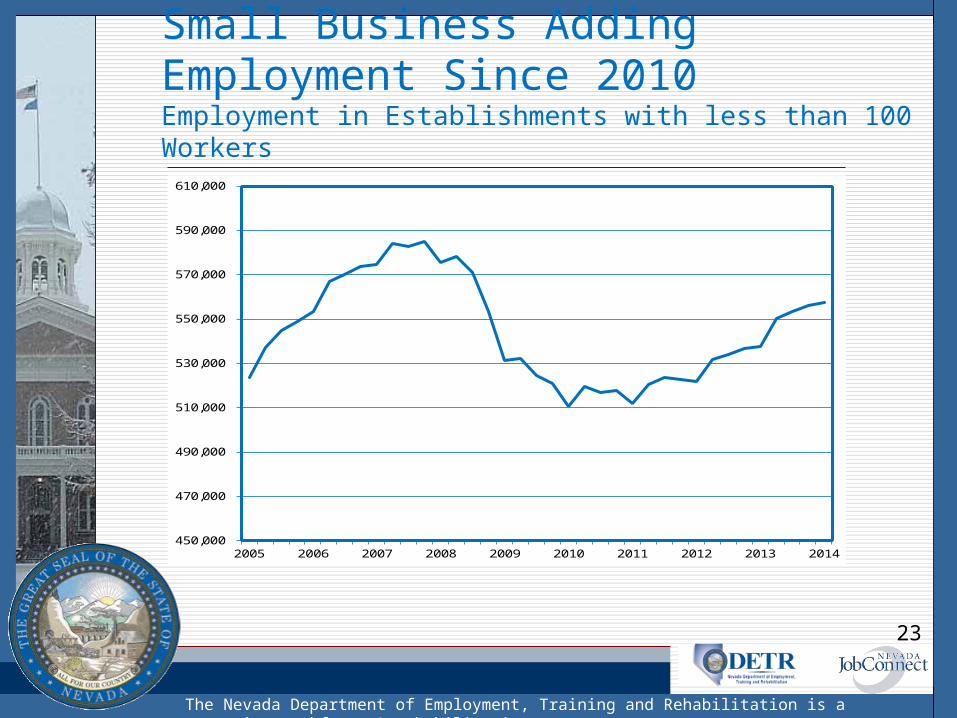
Small Business Adding Employment Since 2010Employment in Establishments with less than 100 Workers
450,000
470,000
490,000
510,000
530,000
550,000
570,000
590,000
610,000
2005 2006 2007 2008 2009 2010 2011 2012 2013 2014
23
The Nevada Department of Employment, Training and Rehabilitation is a proactive workforce & rehabilitation agency
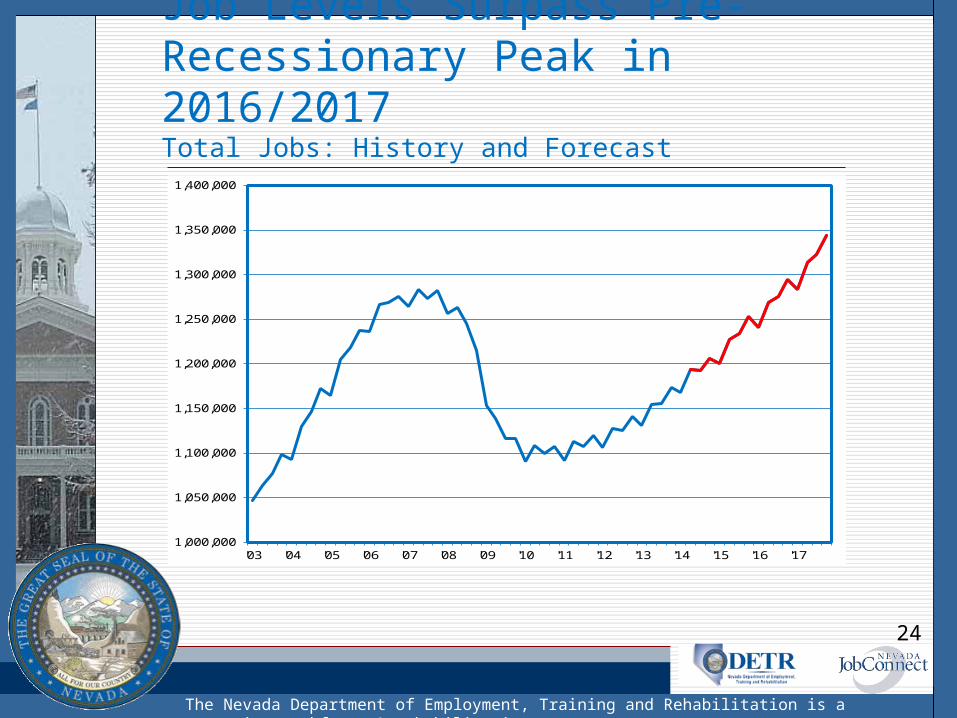
Job Levels Surpass Pre-Recessionary Peak in 2016/2017Total Jobs: History and Forecast
24
1,000,000
1,050,000
1,100,000
1,150,000
1,200,000
1,250,000
1,300,000
1,350,000
1,400,000
'03 '04 '05 '06 '07 '08 '09 '10 '11 '12 '13 '14 '15 '16 '17
The Nevada Department of Employment, Training and Rehabilitation is a proactive workforce & rehabilitation agency
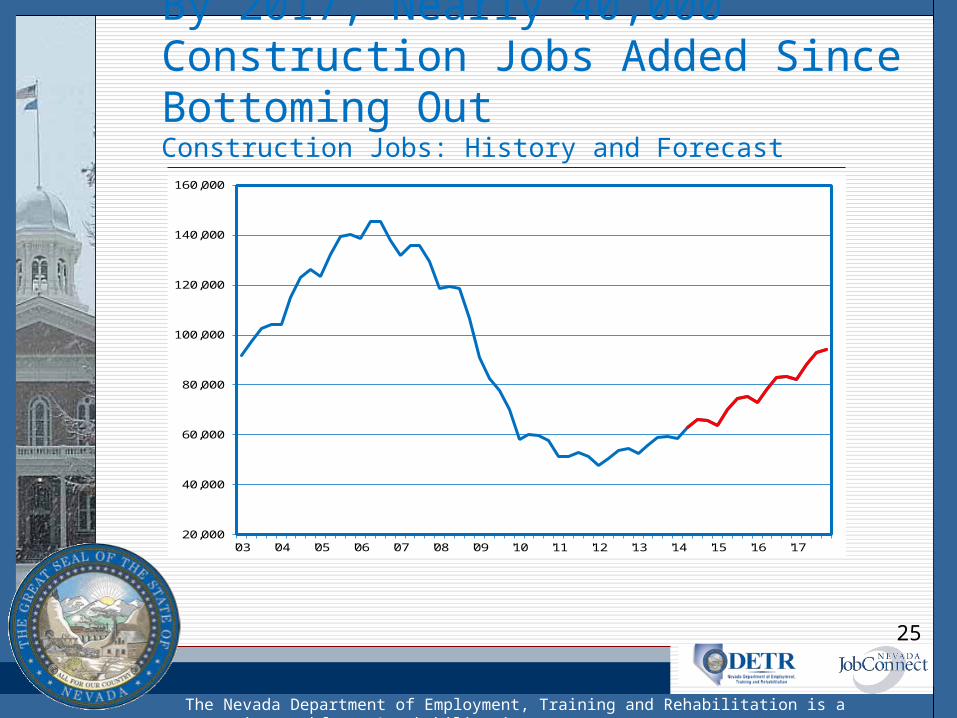
By 2017, Nearly 40,000 Construction Jobs Added Since Bottoming OutConstruction Jobs: History and Forecast
25
20,000
40,000
60,000
80,000
100,000
120,000
140,000
160,000
'03 '04 '05 '06 '07 '08 '09 '10 '11 '12 '13 '14 '15 '16 '17

The Nevada Department of Employment, Training and Rehabilitation is a proactive workforce & rehabilitation agency
Going Forward, Growth Expected to Strengthen for Manufacturing JobsManufacturing Jobs: History and Forecast
26
35,000
37,000
39,000
41,000
43,000
45,000
47,000
49,000
51,000
53,000
'03 '04 '05 '06 '07 '08 '09 '10 '11 '12 '13 '14 '15 '16 '17

The Nevada Department of Employment, Training and Rehabilitation is a proactive workforce & rehabilitation agency
Retail Trade Should Continue Adding About 4,000 Jobs AnnuallyRetail Trade Jobs: History and Forecast
27
100,000
110,000
120,000
130,000
140,000
150,000
160,000
'03 '04 '05 '06 '07 '08 '09 '10 '11 '12 '13 '14 '15 '16 '17

The Nevada Department of Employment, Training and Rehabilitation is a proactive workforce & rehabilitation agency
Expectations are for an Additional 3,000 Healthcare Jobs per YearHealthcare/Social Assistance Jobs: History and Forecast
28
70,000
80,000
90,000
100,000
110,000
120,000
130,000
'03 '04 '05 '06 '07 '08 '09 '10 '11 '12 '13 '14 '15 '16 '17

The Nevada Department of Employment, Training and Rehabilitation is a proactive workforce & rehabilitation agency
AFS Jobs Have Reached Historical Peak; 40K Additional Jobs ExpectedAccommodation/Food Services Jobs: History and Forecast
29
250,000
275,000
300,000
325,000
350,000
375,000
'03 '04 '05 '06 '07 '08 '09 '10 '11 '12 '13 '14 '15 '16 '17

The Nevada Department of Employment, Training and Rehabilitation is a proactive workforce & rehabilitation agency
NV’s Unemployment Rate Trending Down…6.5% in 2015; 5.5% in 2016Unemployment Rate: History and Forecast
0%
2%
4%
6%
8%
10%
12%
14%
'07 '08 '09 '10 '11 '12 '13 '14 '15 '16
30

The Nevada Department of Employment, Training and Rehabilitation is a proactive workforce & rehabilitation agency
For Additional Information, Please Contact:
Nevada Department of Employment, Training and Rehabilitation
Research and Analysis Bureau
Bill Anderson
Chief Economist
(775) 684-0450
http://www.nevadaworkforce.com
follow us on Twitter @nvlabormarket