Embed Size (px)
Citation preview
Nevada County Conditions, Trends, and Forecasts 2007
Presented by:Dr. David GalloDepartment of EconomicsandCenter for Economic DevelopmentCalifornia State University, Chico
Topics
Current conditions Recent trends Forecasts (where available) through 2030 Implications of deviations from past trends
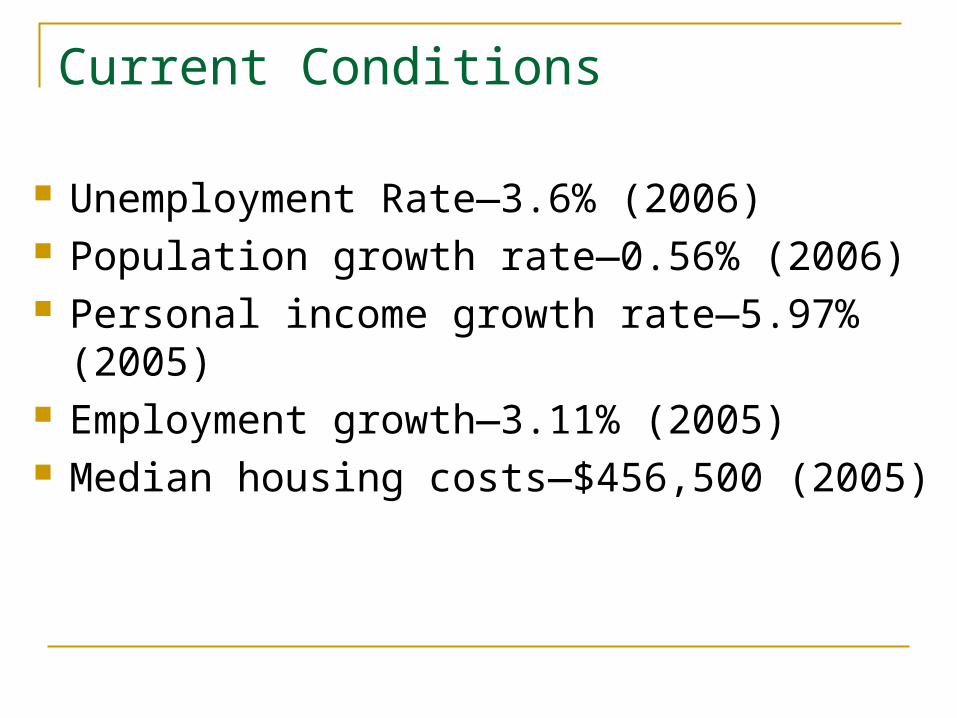
Current Conditions
Unemployment Rate—3.6% (2006) Population growth rate—0.56% (2006) Personal income growth rate—5.97% (2005) Employment growth—3.11% (2005) Median housing costs—$456,500 (2005)
Trends and Forecasts
Personal income Employment Industry growth: Earnings and employment Population Age composition
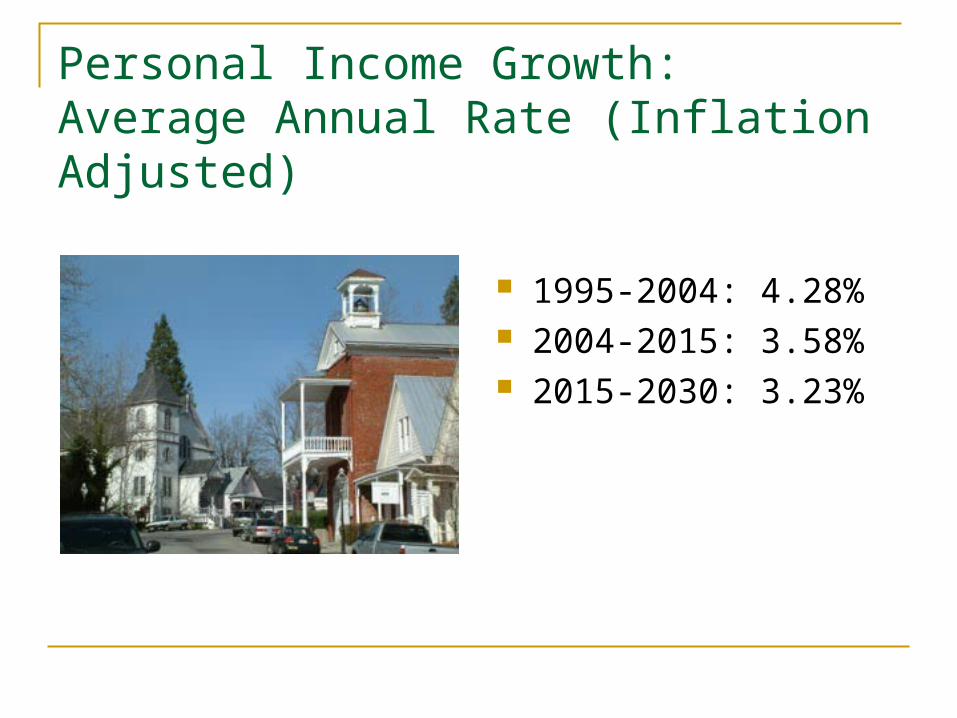
Personal Income Growth:Average Annual Rate (Inflation Adjusted)
1995-2004: 4.28% 2004-2015: 3.58% 2015-2030: 3.23%
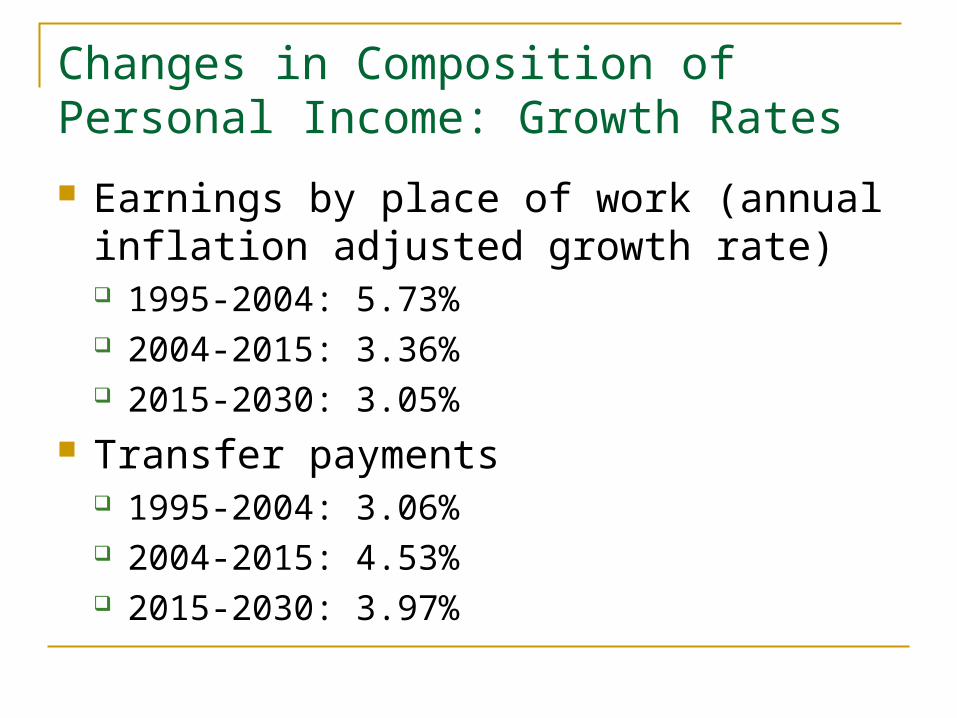
Changes in Composition of Personal Income: Growth Rates
Earnings by place of work (annual inflation adjusted growth rate) 1995-2004: 5.73% 2004-2015: 3.36% 2015-2030: 3.05%
Transfer payments 1995-2004: 3.06% 2004-2015: 4.53% 2015-2030: 3.97%
Interpretive Intermission I: Changes in Income Sources An increasing percentage of county personal
income is from transfer payments The 1995-2004 rate of growth in earnings was not
sustainable as employment growth was greater than labor force growth
We will see that much of the projected change is due to changes in population age distribution
Slower growth in the working age population More rapid growth in the senior component of
population
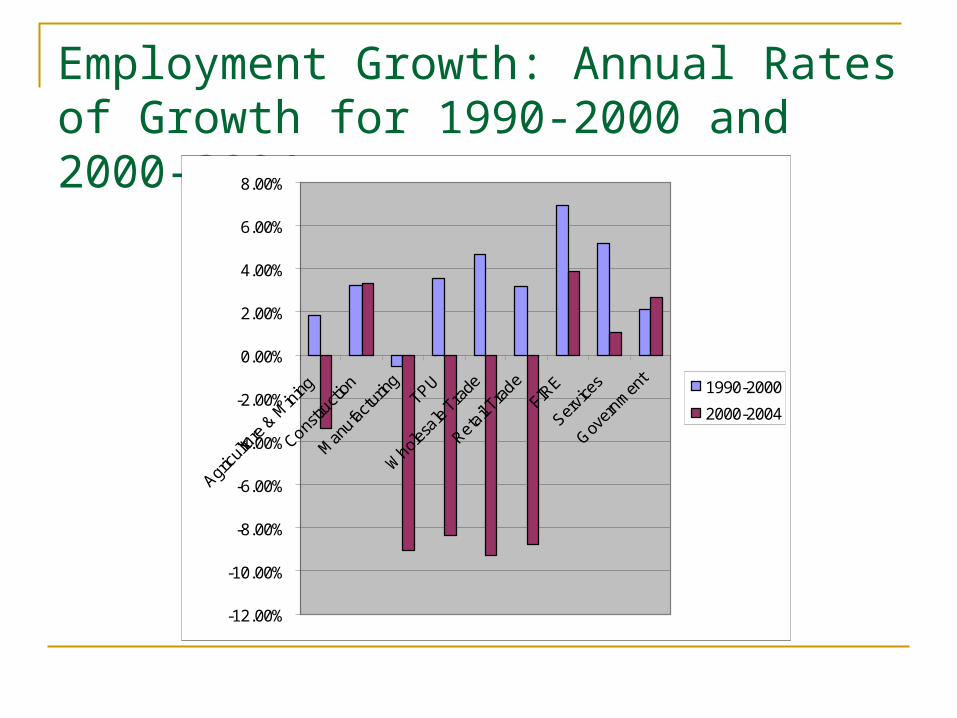
Employment Growth: Annual Rates of Growth for 1990-2000 and 2000-2004
-12.00%
-10.00%
-8.00%
-6.00%
-4.00%
-2.00%
0.00%
2.00%
4.00%
6.00%
8.00%
Agricu
lture
& M
ining
Constru
ction
Man
ufactu
ring
TPU
Whole
sale
Trade
Retail T
rade
FIRE
Servic
es
Gover
nmen
t 1990-2000
2000-2004
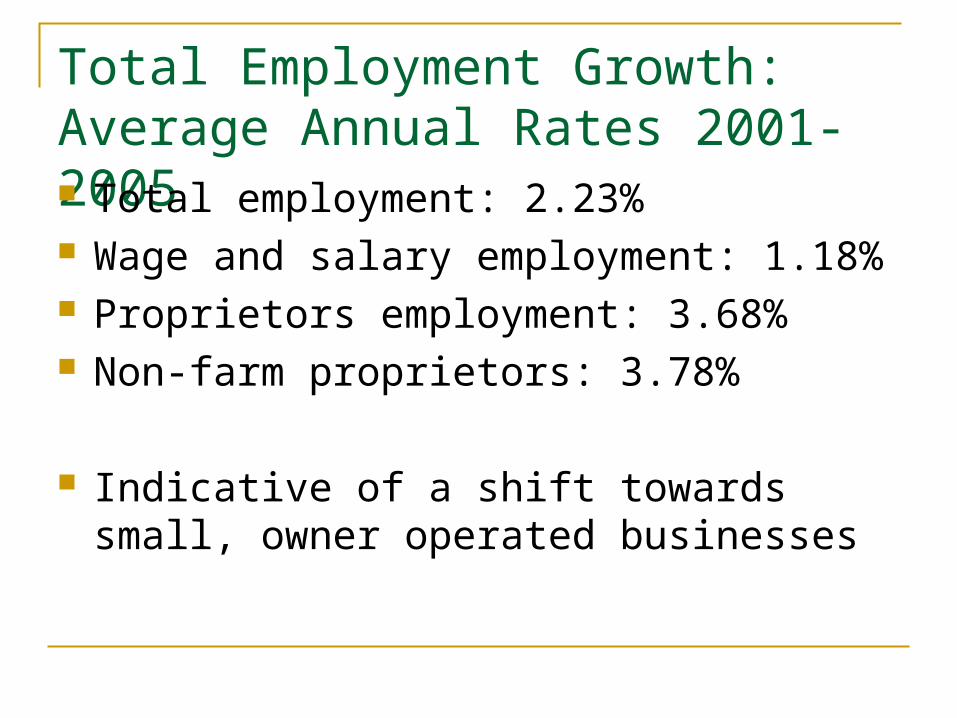
Total Employment Growth:Average Annual Rates 2001-2005 Total employment: 2.23% Wage and salary employment: 1.18% Proprietors employment: 3.68% Non-farm proprietors: 3.78%
Indicative of a shift towards small, owner operated businesses
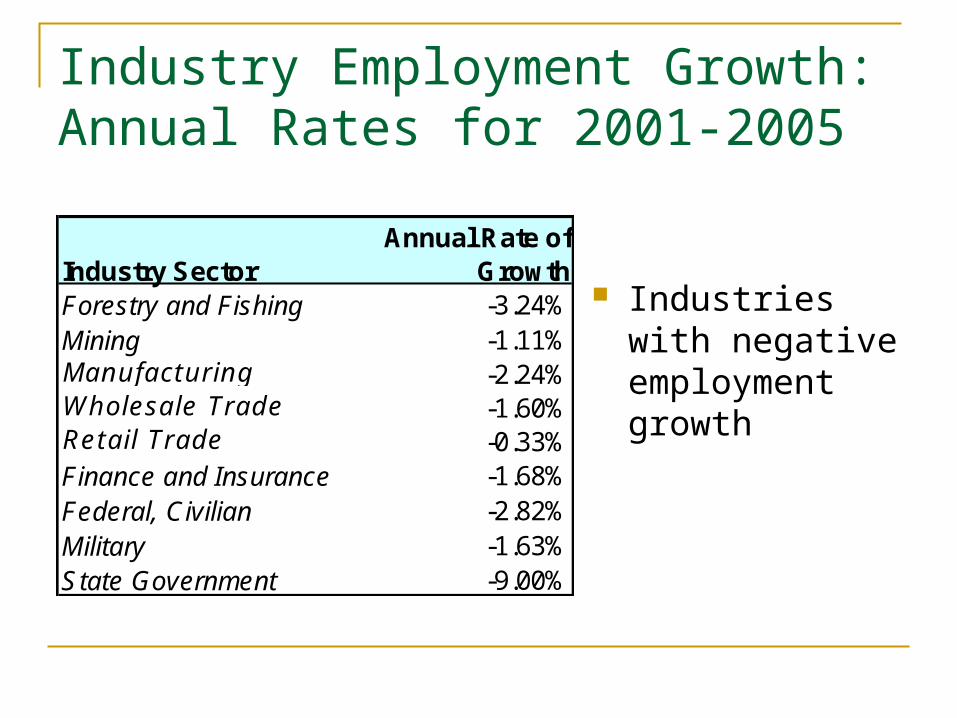
Industry Employment Growth: Annual Rates for 2001-2005
Industries with negative employment growth
Industry SectorAnnual Rate of
GrowthForestry and Fishing -3.24%Mining -1.11%Manufacturing -2.24%Wholesale Trade -1.60%Retail Trade -0.33%Finance and Insurance -1.68%Federal, Civilian -2.82%Military -1.63%State Government -9.00%
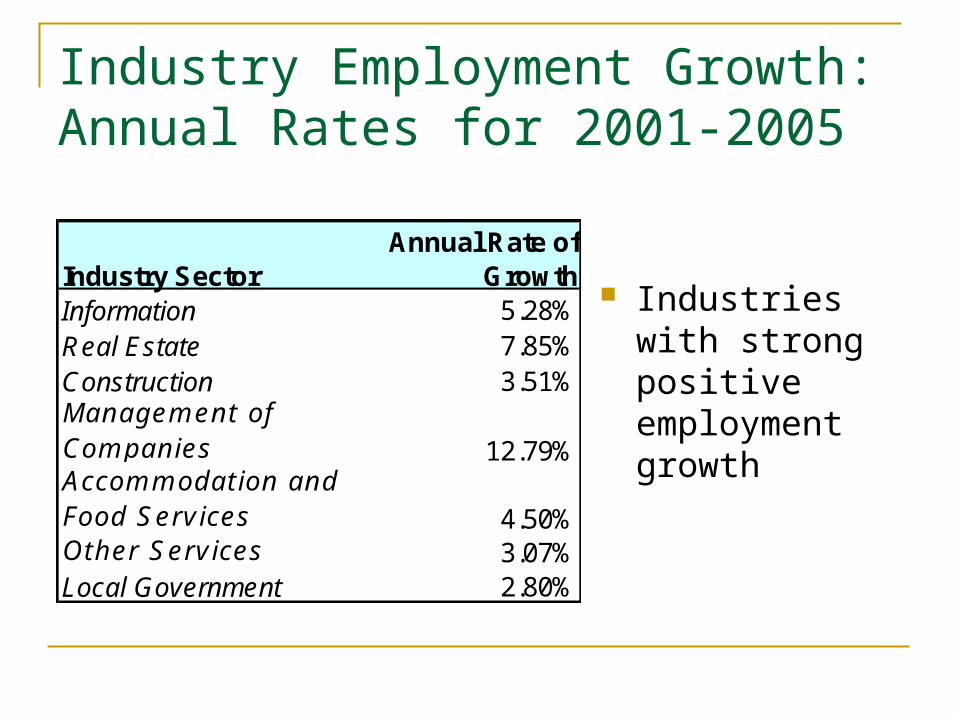
Industry Employment Growth: Annual Rates for 2001-2005
Industries with strong positive employment growth
Industry SectorAnnual Rate of
GrowthInformation 5.28%Real Estate 7.85%Construction 3.51%Management of Companies 12.79%Accommodation and Food Services 4.50%Other Services 3.07%Local Government 2.80%
Interpretive Intermission II: Employment Growth Fastest growing sectors (in terms of
employment) are linked to: Small business growth in the information sector
(information and management of companies) Tourism growth (accommodations and food
services) The recent housing boom (construction and real
estate)
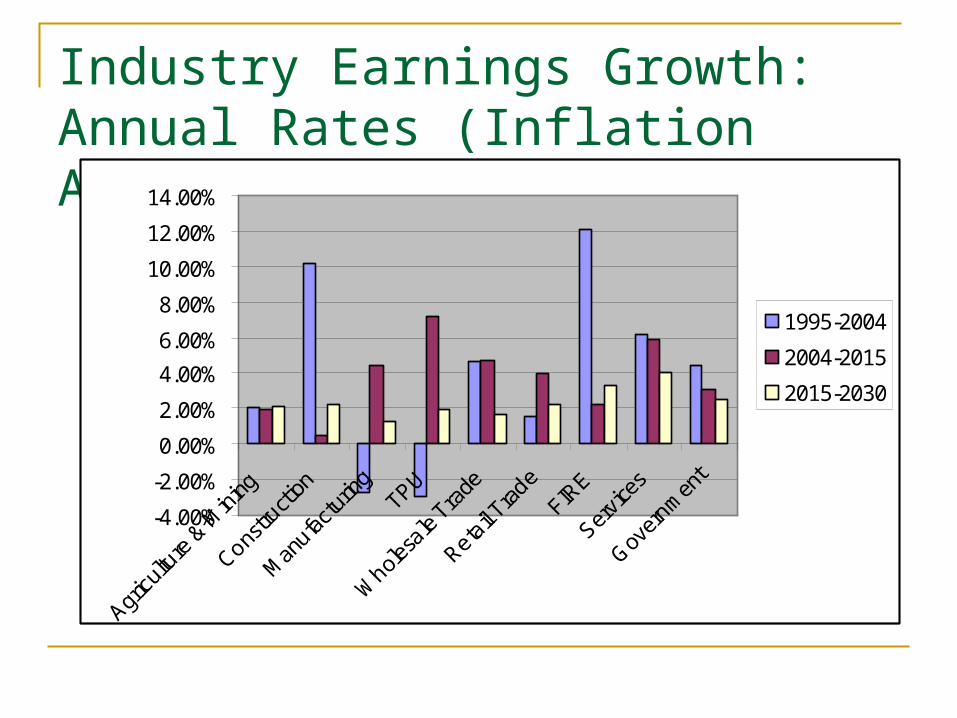
Industry Earnings Growth: Annual Rates (Inflation Adjusted)
-4.00%
-2.00%
0.00%
2.00%
4.00%
6.00%
8.00%
10.00%
12.00%
14.00%
Agricu
lture
& M
ining
Constru
ction
Man
ufactu
ring
TPU
Whole
sale
Trade
Retail T
rade
FIRE
Servic
es
Gover
nmen
t
1995-2004
2004-2015
2015-2030
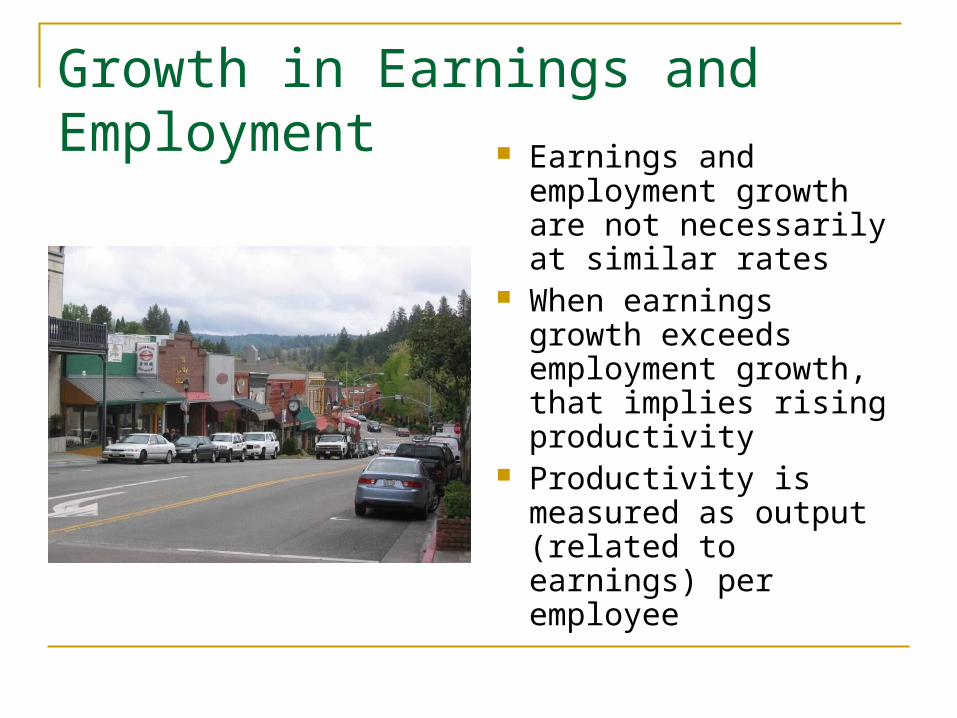
Growth in Earnings and Employment Earnings and
employment growth are not necessarily at similar rates
When earnings growth exceeds employment growth, that implies rising productivity
Productivity is measured as output (related to earnings) per employee
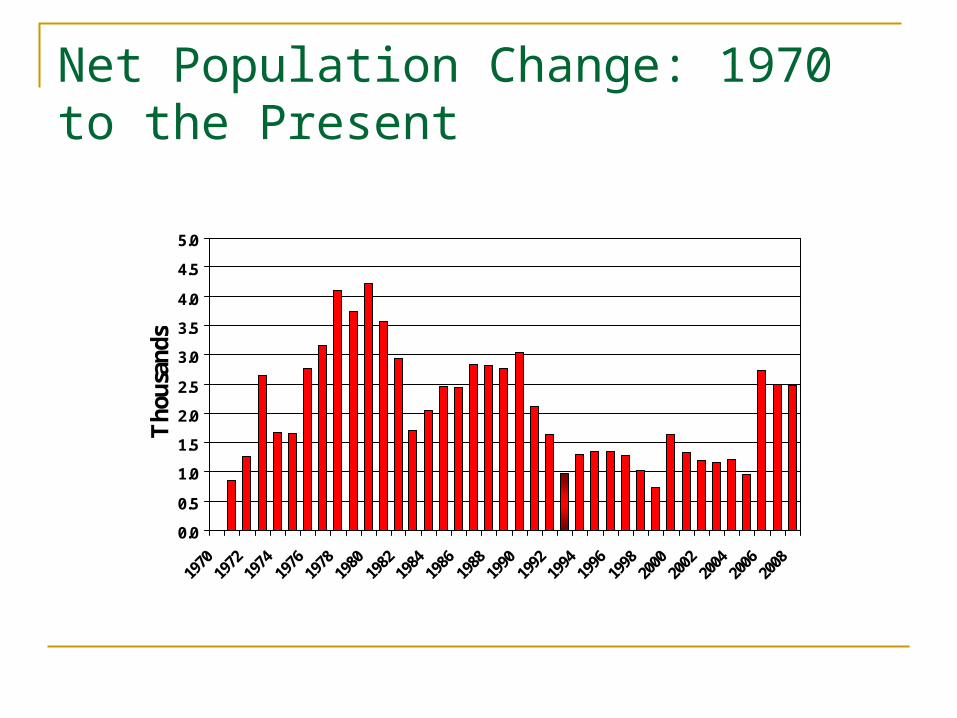
Net Population Change: 1970 to the Present
0.0
0.5
1.0
1.5
2.0
2.5
3.0
3.5
4.0
4.5
5.0
1970
1972
1974
1976
1978
1980
1982
1984
1986
1988
1990
1992
1994
1996
1998
2000
2002
2004
2006
2008
Tho
usan
ds
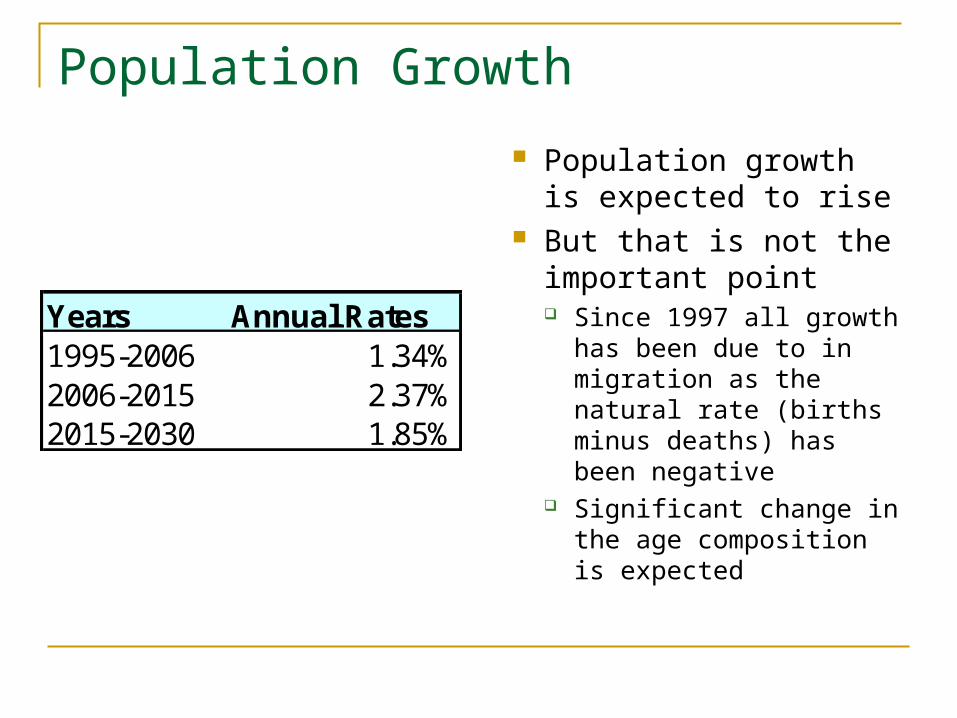
Population Growth
Population growth is expected to rise
But that is not the important point Since 1997 all growth
has been due to in migration as the natural rate (births minus deaths) has been negative
Significant change in the age composition is expected
Years Annual Rates1995-2006 1.34%2006-2015 2.37%2015-2030 1.85%
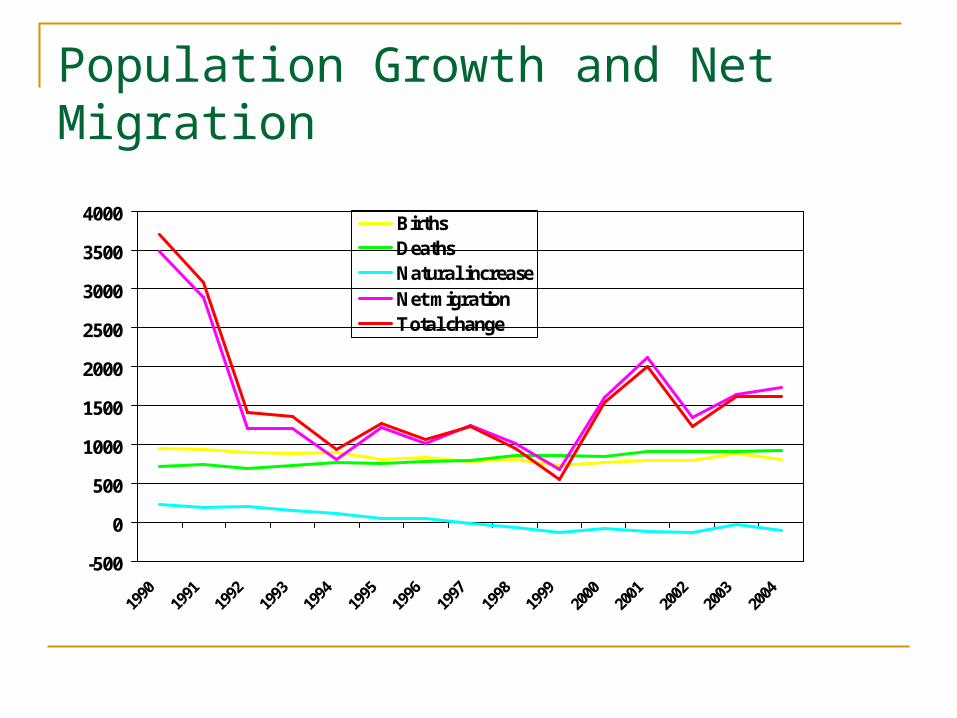
Population Growth and Net Migration
-500
0
500
1000
1500
2000
2500
3000
3500
4000
1990
1991
1992
1993
1994
1995
1996
1997
1998
1999
2000
2001
2002
2003
2004
BirthsDeathsNatural increaseNet migrationTotal change
Population Growth and the Quality of Life
Population growth in Nevada County is strictly determined by in migration
Willingness of people to move here depends on maintaining local amenities, natural and otherwise
Availability and cost of appropriate housing is also important
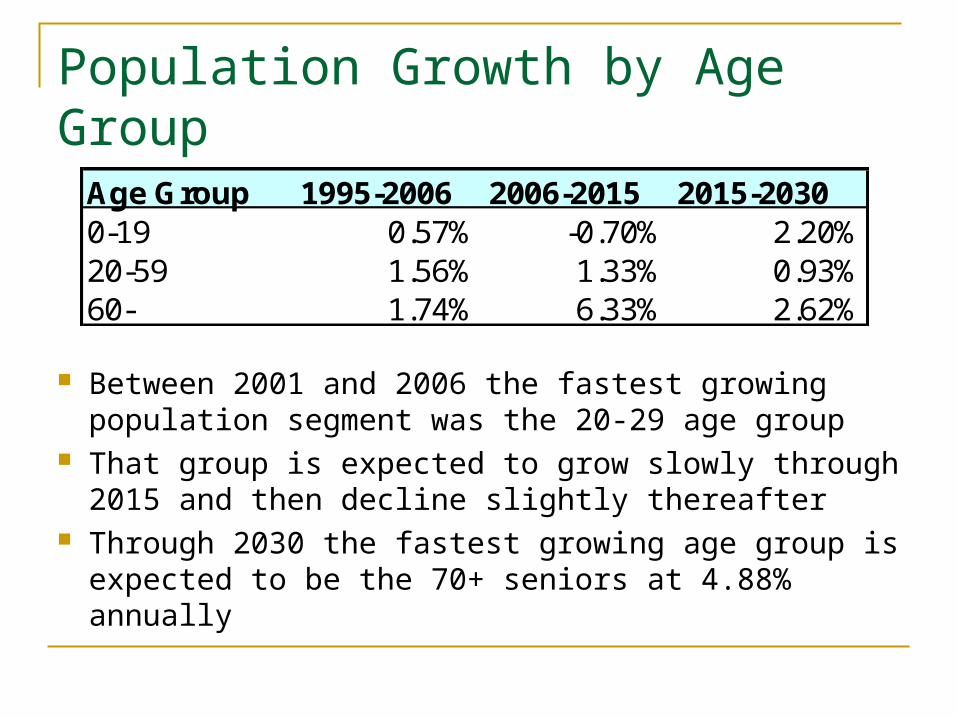
Population Growth by Age Group
Age Group 1995-2006 2006-2015 2015-20300-19 0.57% -0.70% 2.20%20-59 1.56% 1.33% 0.93%60- 1.74% 6.33% 2.62%
Between 2001 and 2006 the fastest growing population segment was the 20-29 age group
That group is expected to grow slowly through 2015 and then decline slightly thereafter
Through 2030 the fastest growing age group is expected to be the 70+ seniors at 4.88% annually
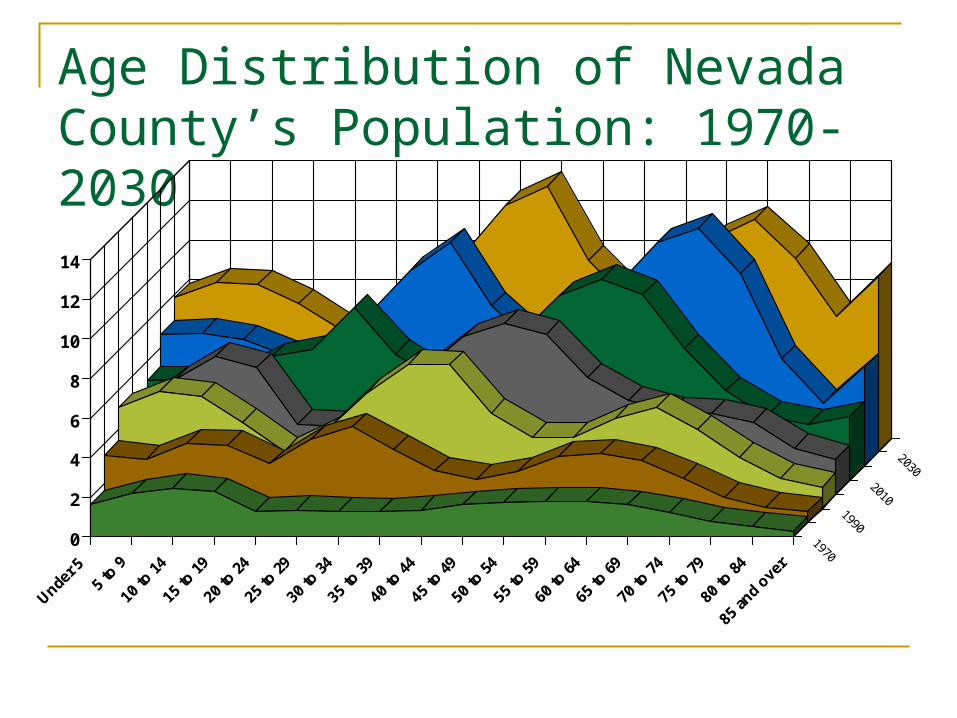
Age Distribution of Nevada County’s Population: 1970-2030
2030
202020102000
0
2
4
6
8
10
12
14
Under 5
5 to
9
10 to
14
15 to
19
20 to
24
25 to
29
30 to
34
35 to
39
40 to
44
45 to
49
50 to
54
55 to
59
60 to
64
65 to
69
70 to
74
75 to
79
80 to
84
85 an
d ove
r
1970
1990
2010
2030
Interpretive Intermission III: Population Growth and the Labor Force Growth in the 20-59 age group is projected to slow
through the year 2030 Reduced pool of labor available for local businesses Overall population growth in Nevada County is
expected to increase over rates experienced during 1995-2006
Most of that growth is expected to be seniors After 2015, growth in the school aged population is
expected to increase

Intermission III (Continued): Structural Market Changes due to Changes in Age Distribution Increased demand for goods and services
preferred by seniors, including: Medical services Smaller housing units Public transportation
After 2015 projections indicate increased demand for educational services for K-12 students
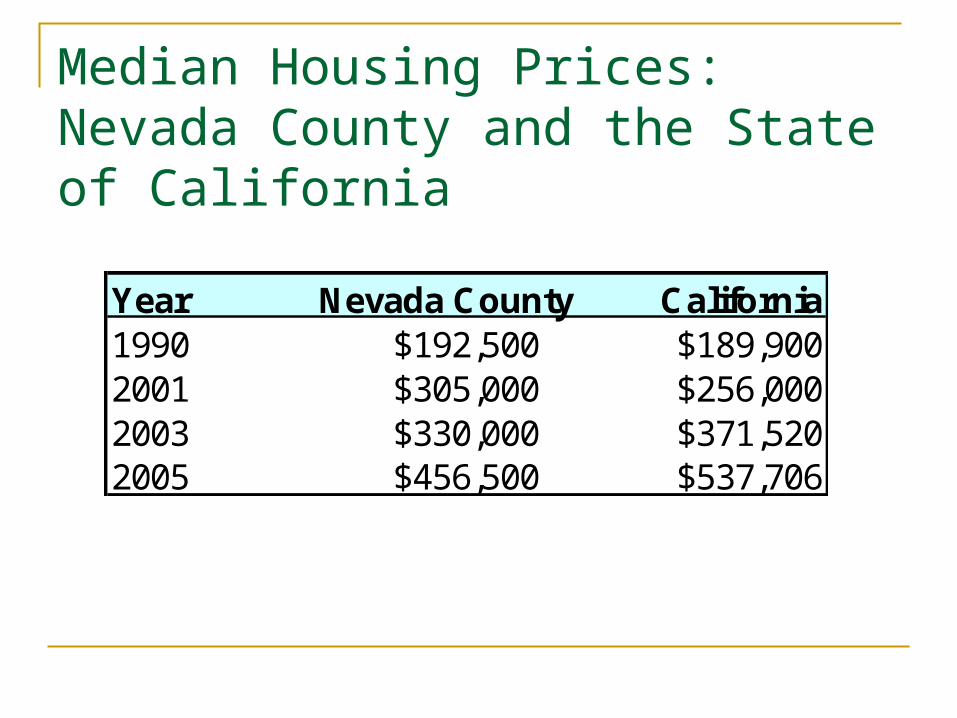
Median Housing Prices: Nevada County and the State of California
Year Nevada County California1990 $192,500 $189,9002001 $305,000 $256,0002003 $330,000 $371,5202005 $456,500 $537,706
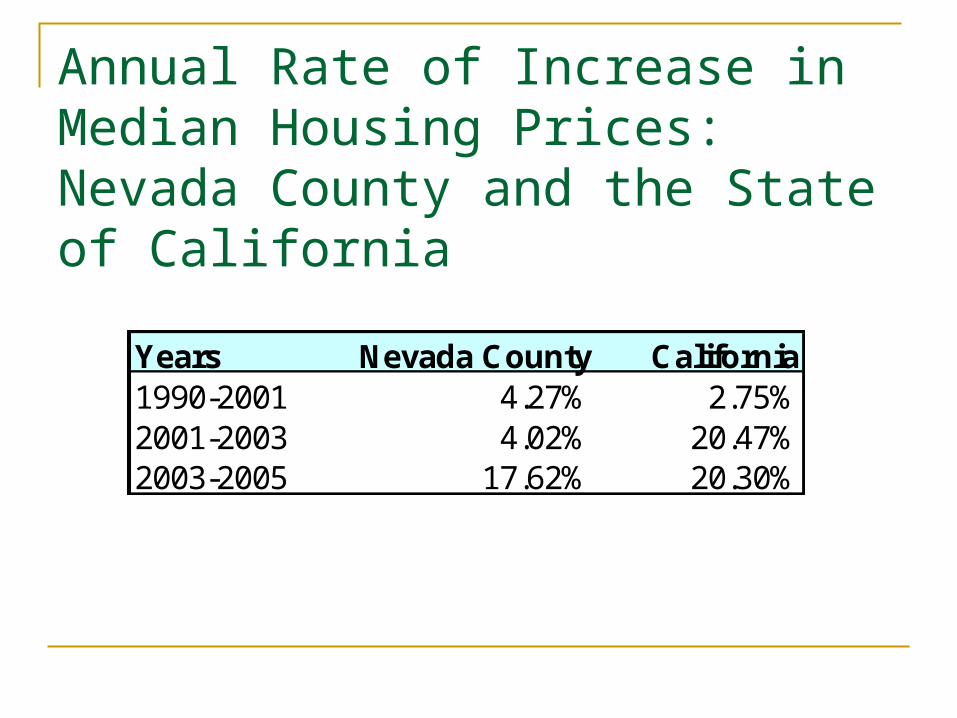
Annual Rate of Increase in Median Housing Prices: Nevada County and the State of California
Years Nevada County California1990-2001 4.27% 2.75%2001-2003 4.02% 20.47%2003-2005 17.62% 20.30%
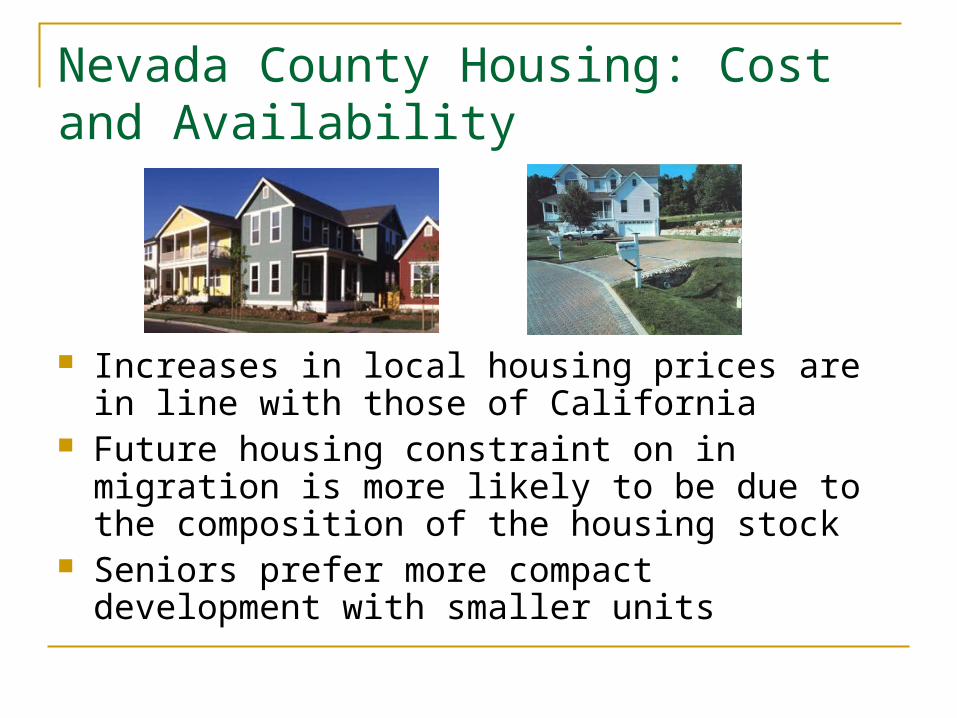
Nevada County Housing: Cost and Availability
Increases in local housing prices are in line with those of California
Future housing constraint on in migration is more likely to be due to the composition of the housing stock
Seniors prefer more compact development with smaller units
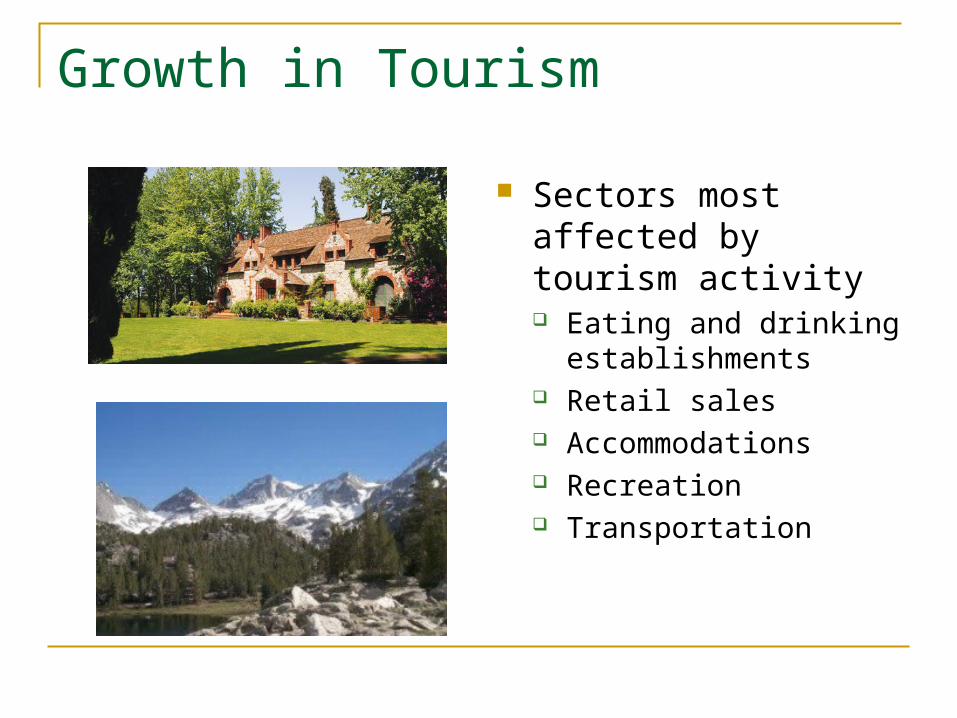
Growth in Tourism
Sectors most affected by tourism activity Eating and drinking
establishments Retail sales Accommodations Recreation Transportation
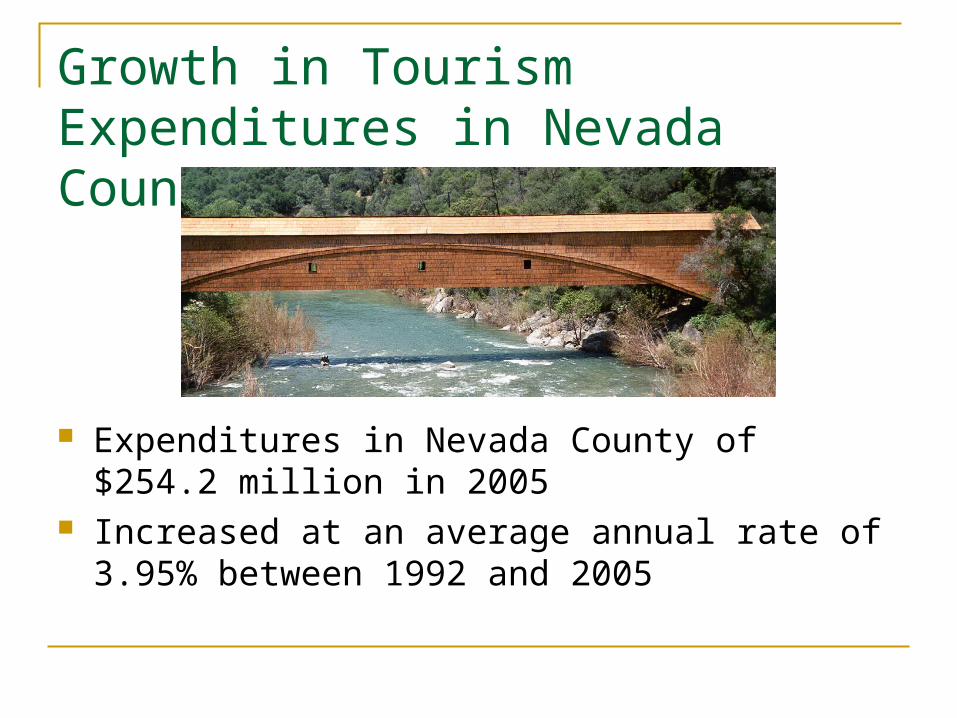
Growth in Tourism Expenditures in Nevada County
Expenditures in Nevada County of $254.2 million in 2005
Increased at an average annual rate of 3.95% between 1992 and 2005
Earnings of Tourism-Related Businesses in Nevada County
Tourism earnings by Nevada County businesses of $79.7 million in 2005
Increased at an average annual rate of 4.21% between 1992 and 2005
The Economic Future of Nevada County Continued population growth at moderate
rates A shift towards more retirees and fewer
families headed by wage employees More small information-based businesses
and service providers Growth industries are likely to be tourism and
retiree based
Changing Industry Focus: Attracting and Retaining Retirees Meeting demands of retirees: Housing,
medical services, public transportation needs, etc Changes in the mix of residential units Need to attract the appropriate medical
professionals and specialists Local government costs of expanded public
transportation
Changing Industry Focus: Supporting Continued Growth in Tourism Preservation and enhancement of
environmental amenities Preservation and promotion of sites of
historical interest Development and support of appropriate
tourist-oriented retail