Embed Size (px)
Citation preview
NEUTRON DIFFRACTION MEASUREMENTS ON A LARGE SIZE ROLLER BEARING
R.H. Vegter1, T. Pirling2 and M. Peel3
1SKF Engineering & Research Centre, Kelvinbaan 16
3439 MT Nieuwegein The Netherlands
2Institut Laue-Langevin
6 rue Jules Horowitz 38000 Grenoble
France
3European Synchrotron Radiation Facility Polygone Scientifique Louis Néel
6 rue Jules Horowitz 38000 Grenoble
France ABSTRACT In common with many engineering applications the introduction of compressive surface stresses plays an important role in the performance of roller bearings. Since the introduced stress profiles depend on the treatment method and the necessary balancing tensile stresses may have unexpected consequences, it is necessary to quantify the stresses throughout the bearing. Today, most characterization of residual stresses is performed using laboratory X-ray diffraction. However, due to the limited sample size that most laboratory set-ups can handle and due to the limited penetration depth of X-rays in bearing steel, the measurements are always destructive. In this paper we present an investigation into the residual stresses in a large bearing ring of 620 mm diameter using neutron diffraction to overcome this problem. In the measurement, information was gathered from the whole cross-section of the large ring. The surface stresses were measured using laboratory X-Rays combined with successive layer removal. A comparison is made between both the neutron diffraction and X-ray diffraction measurements. INTRODUCTION Residual stresses play a major role in bearing performance as they often influence success in both manufacturing operations and during subsequent use. It can be convenient to separate stresses into those introduced by the manufacturing process and those that develop during service. However, it should not be forgotten that they are linked: the residual stresses that are created during manufacturing will influence the development of residual stresses during bearing operation [1], [2], [3], [4], [5].
545Copyright ©JCPDS-International Centre for Diffraction Data 2009 ISSN 1097-0002Advances in X-ray Analysis, Volume 52

This document was presented at the Denver X-ray Conference (DXC) on Applications of X-ray Analysis. Sponsored by the International Centre for Diffraction Data (ICDD). This document is provided by ICDD in cooperation with the authors and presenters of the DXC for the express purpose of educating the scientific community. All copyrights for the document are retained by ICDD. Usage is restricted for the purposes of education and scientific research. DXC Website – www.dxcicdd.com
ICDD Website - www.icdd.com
Advances in X-ray Analysis, Volume 52
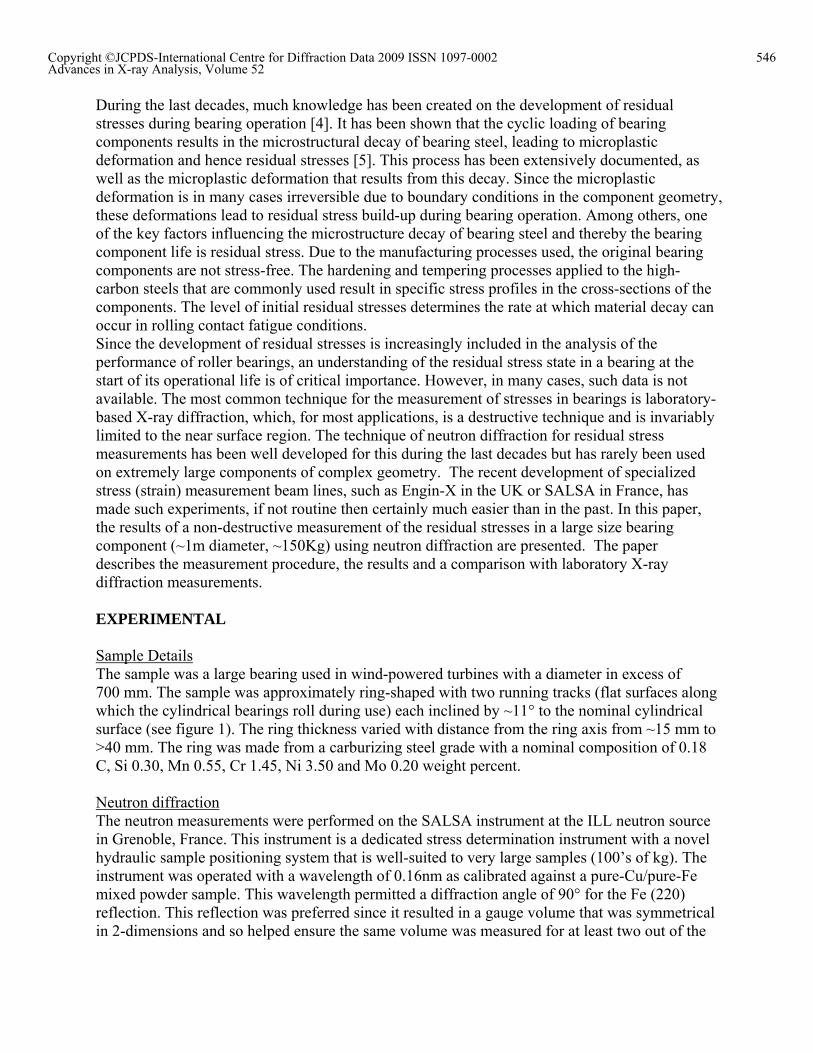
During the last decades, much knowledge has been created on the development of residual stresses during bearing operation [4]. It has been shown that the cyclic loading of bearing components results in the microstructural decay of bearing steel, leading to microplastic deformation and hence residual stresses [5]. This process has been extensively documented, as well as the microplastic deformation that results from this decay. Since the microplastic deformation is in many cases irreversible due to boundary conditions in the component geometry, these deformations lead to residual stress build-up during bearing operation. Among others, one of the key factors influencing the microstructure decay of bearing steel and thereby the bearing component life is residual stress. Due to the manufacturing processes used, the original bearing components are not stress-free. The hardening and tempering processes applied to the high-carbon steels that are commonly used result in specific stress profiles in the cross-sections of the components. The level of initial residual stresses determines the rate at which material decay can occur in rolling contact fatigue conditions. Since the development of residual stresses is increasingly included in the analysis of the performance of roller bearings, an understanding of the residual stress state in a bearing at the start of its operational life is of critical importance. However, in many cases, such data is not available. The most common technique for the measurement of stresses in bearings is laboratory-based X-ray diffraction, which, for most applications, is a destructive technique and is invariably limited to the near surface region. The technique of neutron diffraction for residual stress measurements has been well developed for this during the last decades but has rarely been used on extremely large components of complex geometry. The recent development of specialized stress (strain) measurement beam lines, such as Engin-X in the UK or SALSA in France, has made such experiments, if not routine then certainly much easier than in the past. In this paper, the results of a non-destructive measurement of the residual stresses in a large size bearing component (~1m diameter, ~150Kg) using neutron diffraction are presented. The paper describes the measurement procedure, the results and a comparison with laboratory X-ray diffraction measurements. EXPERIMENTAL Sample Details The sample was a large bearing used in wind-powered turbines with a diameter in excess of 700 mm. The sample was approximately ring-shaped with two running tracks (flat surfaces along which the cylindrical bearings roll during use) each inclined by ~11° to the nominal cylindrical surface (see figure 1). The ring thickness varied with distance from the ring axis from ~15 mm to >40 mm. The ring was made from a carburizing steel grade with a nominal composition of 0.18 C, Si 0.30, Mn 0.55, Cr 1.45, Ni 3.50 and Mo 0.20 weight percent. Neutron diffraction The neutron measurements were performed on the SALSA instrument at the ILL neutron source in Grenoble, France. This instrument is a dedicated stress determination instrument with a novel hydraulic sample positioning system that is well-suited to very large samples (100’s of kg). The instrument was operated with a wavelength of 0.16nm as calibrated against a pure-Cu/pure-Fe mixed powder sample. This wavelength permitted a diffraction angle of 90° for the Fe (220) reflection. This reflection was preferred since it resulted in a gauge volume that was symmetrical in 2-dimensions and so helped ensure the same volume was measured for at least two out of the
546Copyright ©JCPDS-International Centre for Diffraction Data 2009 ISSN 1097-0002Advances in X-ray Analysis, Volume 52
three directions. However, this reflection was not suitable in all cases due to the difficulties in getting the slits close to the measurement point in the complex sample. In most cases the instrument was used with a conventional slit system (seen in the photos). The sample thickness necessitated a large gauge volume to keep counting times to realistic values. Spatial resolution was preserved by using a matchstick-shaped gauge by setting the gauge height to a nominal 15 mm. The vertical divergence of the beam means the real height was likely to be 20-25 mm at the sample. The sample and detector slits were then set to 1-2 mm so that the volume was square in the other two dimensions.
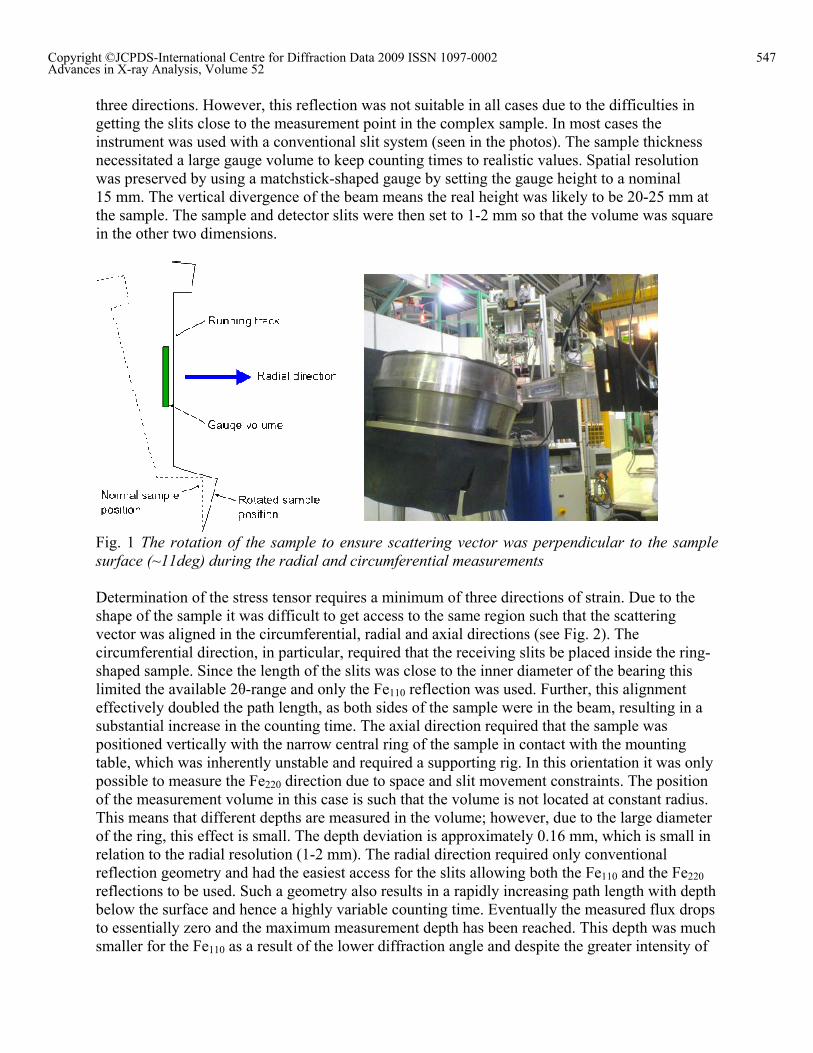
Fig. 1 The rotation of the sample to ensure scattering vector was perpendicular to the sample surface (~11deg) during the radial and circumferential measurements Determination of the stress tensor requires a minimum of three directions of strain. Due to the shape of the sample it was difficult to get access to the same region such that the scattering vector was aligned in the circumferential, radial and axial directions (see Fig. 2). The circumferential direction, in particular, required that the receiving slits be placed inside the ring-shaped sample. Since the length of the slits was close to the inner diameter of the bearing this limited the available 2θ-range and only the Fe110 reflection was used. Further, this alignment effectively doubled the path length, as both sides of the sample were in the beam, resulting in a substantial increase in the counting time. The axial direction required that the sample was positioned vertically with the narrow central ring of the sample in contact with the mounting table, which was inherently unstable and required a supporting rig. In this orientation it was only possible to measure the Fe220 direction due to space and slit movement constraints. The position of the measurement volume in this case is such that the volume is not located at constant radius. This means that different depths are measured in the volume; however, due to the large diameter of the ring, this effect is small. The depth deviation is approximately 0.16 mm, which is small in relation to the radial resolution (1-2 mm). The radial direction required only conventional reflection geometry and had the easiest access for the slits allowing both the Fe110 and the Fe220 reflections to be used. Such a geometry also results in a rapidly increasing path length with depth below the surface and hence a highly variable counting time. Eventually the measured flux drops to essentially zero and the maximum measurement depth has been reached. This depth was much smaller for the Fe110 as a result of the lower diffraction angle and despite the greater intensity of
547Copyright ©JCPDS-International Centre for Diffraction Data 2009 ISSN 1097-0002Advances in X-ray Analysis, Volume 52
this reflection. Nevertheless, there was considerable overlap allowing a direct comparison of the two reflections, which was desirable since the other two directions used only one or the other reflection. In all cases the sample was rotated such that the running track was parallel to the long axis of the gauge volume (~11°), see Fig. 1. As a consequence the inner surface was inclined to the gauge volume and the pseudo-strain profile due to partially submerged gauge volumes was particularly complex in this location. Another complexity is the variation of radius along the measurement volume when oriented in axial direction. This could also contribute to error in the measurement since the stress gradients are expected to be larger in areas with smaller radii. In order to get the lattice parameter of an unstressed sample, a small section of a large ring identical to the ring measured in the full analysis was taken. This consisted of a 5x5x35 mm column that was cut from the centre of one of the raceways. The reference sample was scanned top to bottom (outer to inner surface of the ring) using each of the slit sizes used during the experiment, for each reflection. In this measurement, an effective volume of 5x1x1 mm was used (resolution 1 mm in radial direction). In this way, material property gradient effects were minimized by taking as small volume as possible.
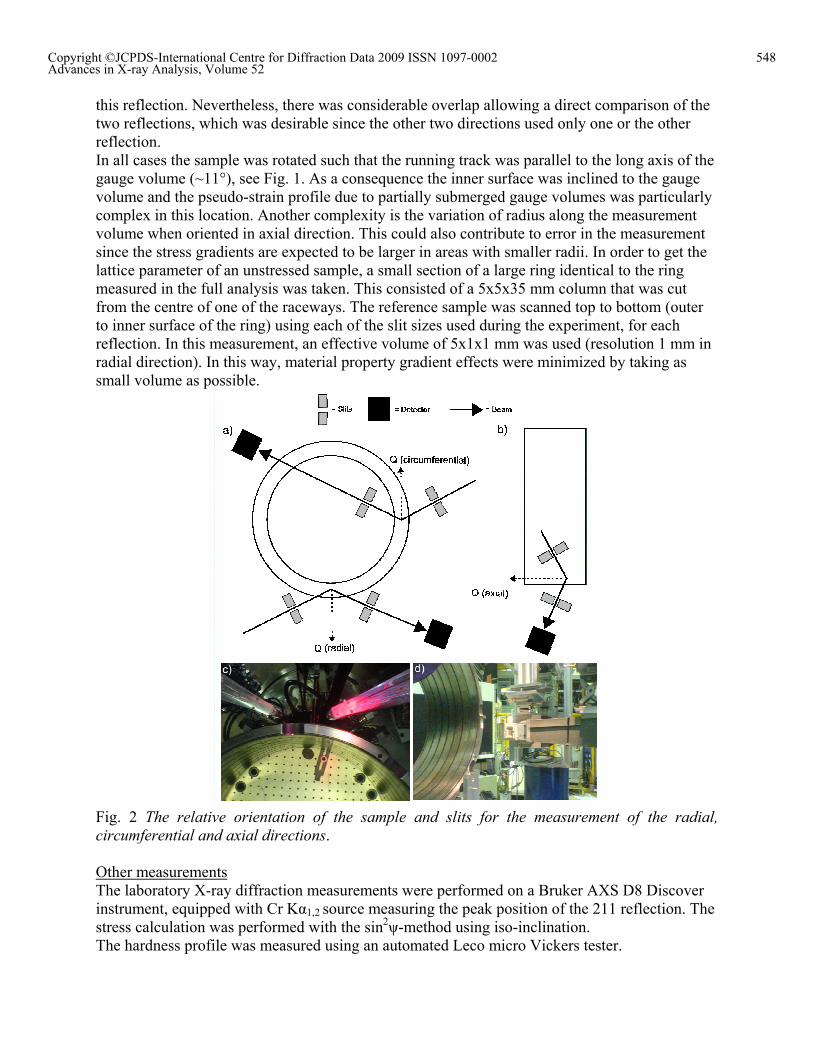
Fig. 2 The relative orientation of the sample and slits for the measurement of the radial, circumferential and axial directions. Other measurements The laboratory X-ray diffraction measurements were performed on a Bruker AXS D8 Discover instrument, equipped with Cr Kα1,2 source measuring the peak position of the 211 reflection. The stress calculation was performed with the sin2ψ-method using iso-inclination. The hardness profile was measured using an automated Leco micro Vickers tester.
548Copyright ©JCPDS-International Centre for Diffraction Data 2009 ISSN 1097-0002Advances in X-ray Analysis, Volume 52

RESULTS Measurements were performed both with neutron diffraction and X-ray diffraction. Beside that, some information of the microstructure is given for relating the stress profile to the metallurgy. Hardness profile Since the investigated rings are case-hardened, the hardness profile is of importance. In Fig. 3, the hardness is plotted as function of depth. It can be seen that the case-depth is approximately 3 mm. This has consequences for the diffraction measurements, the stresses should be measured in the first 3 mm without having material from larger depth in the measurements volume.
Hardness (HV1) - Depth profile at outer diameter
0
100
200
300
400
500
600
700
800
0.0 1.0 2.0 3.0 4.0 5.0 6.0 7.0 8.0 9.0 10.0
Depth below raceway surface (mm)
Har
dnes
s (H
V1)
Fig. 3 Hardness profile as measured at the outer surface of the ring. Neutron diffraction on an unstressed reference In general the variation in the lattice parameter in the d0 sample is small and limited to around ±200µε (see Fig. 4). This is not unexpected since such variations are only likely to occur due to the case hardening procedure which is limited to the near surface region. Given the low variation in lattice parameter within the bulk of the material and the absence of notable systematic variations, a constant value equal to the average of the measurements was used to calculate the strains.
-600.0
-400.0
-200.0
0.0
200.0
400.0
600.0
800.0
1000.0
0 2 4 6 8 10 12 14 16 18
Distance below outer surface (mm)
Latt
ice
stra
in (
10-6
)
1x1mm 220 1.5x1.5mm 220 2x2mm 220 1.5x1.5mm 110 Average Fig. 4 The unstressed reference values for the lattice parameter, expressed as a pseudo-strain, for different gauge dimensions and lattice reflections.
549Copyright ©JCPDS-International Centre for Diffraction Data 2009 ISSN 1097-0002Advances in X-ray Analysis, Volume 52
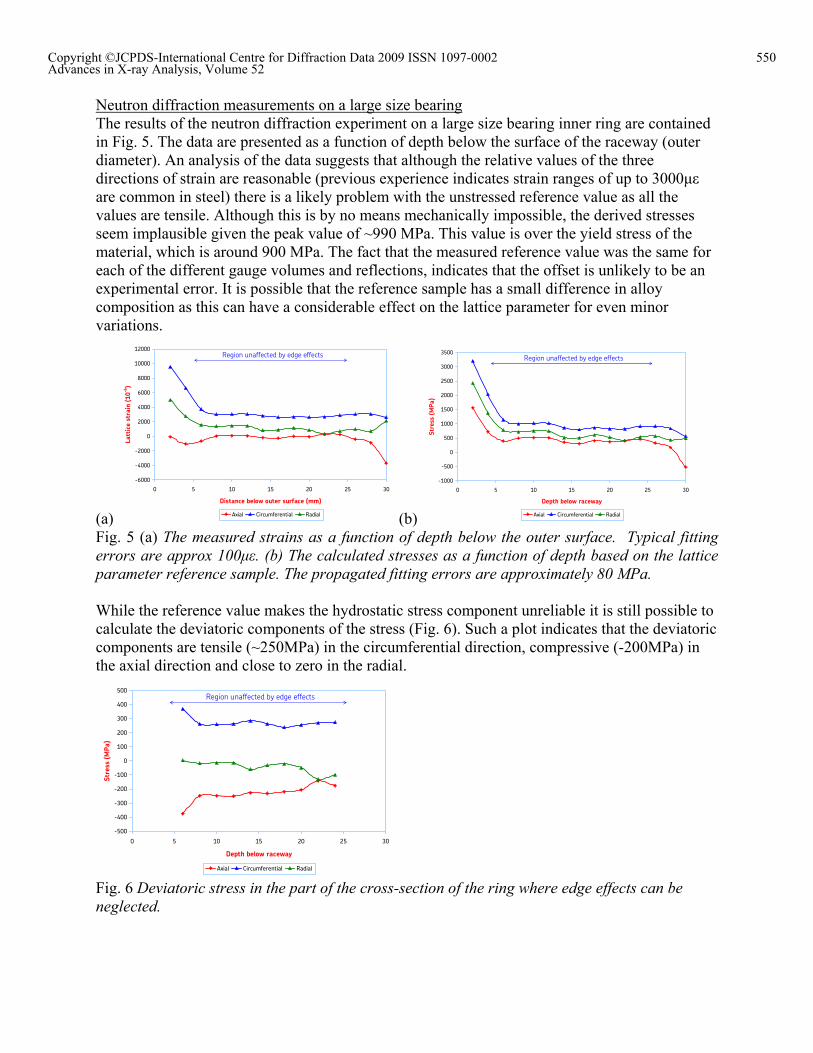
Neutron diffraction measurements on a large size bearing The results of the neutron diffraction experiment on a large size bearing inner ring are contained in Fig. 5. The data are presented as a function of depth below the surface of the raceway (outer diameter). An analysis of the data suggests that although the relative values of the three directions of strain are reasonable (previous experience indicates strain ranges of up to 3000µε are common in steel) there is a likely problem with the unstressed reference value as all the values are tensile. Although this is by no means mechanically impossible, the derived stresses seem implausible given the peak value of ~990 MPa. This value is over the yield stress of the material, which is around 900 MPa. The fact that the measured reference value was the same for each of the different gauge volumes and reflections, indicates that the offset is unlikely to be an experimental error. It is possible that the reference sample has a small difference in alloy composition as this can have a considerable effect on the lattice parameter for even minor variations.
(a)
-6000
-4000
-2000
0
2000
4000
6000
8000
10000
12000
0 5 10 15 20 25 30
Distance below outer surface (mm)
Latt
ice
stra
in (
10-6
)
Axial Circumferential Radial
Region unaffected by edge effects
(b)
-1000
-500
0
500
1000
1500
2000
2500
3000
3500
0 5 10 15 20 25 30
Depth below raceway
Stre
ss (
MPa
)
Axial Circumferential Radial
Region unaffected by edge effects
Fig. 5 (a) The measured strains as a function of depth below the outer surface. Typical fitting errors are approx 100µε. (b) The calculated stresses as a function of depth based on the lattice parameter reference sample. The propagated fitting errors are approximately 80 MPa. While the reference value makes the hydrostatic stress component unreliable it is still possible to calculate the deviatoric components of the stress (Fig. 6). Such a plot indicates that the deviatoric components are tensile (~250MPa) in the circumferential direction, compressive (-200MPa) in the axial direction and close to zero in the radial.
-500
-400
-300
-200
-100
0
100
200
300
400
500
0 5 10 15 20 25 30
Depth below raceway
Stre
ss (
MPa
)
Axial Circumferential Radial
Region unaffected by edge effects
Fig. 6 Deviatoric stress in the part of the cross-section of the ring where edge effects can be neglected.
550Copyright ©JCPDS-International Centre for Diffraction Data 2009 ISSN 1097-0002Advances in X-ray Analysis, Volume 52

In contrast to the hydrostatic stress, the deviatoric component is insensitive to the uncertainty in the lattice parameter which does not play a role in this calculation. The measured stress-free lattice parameter can deviate from the actual value, but since this is equally the case for any measured direction within the same volume of material, this only influences the hydrostatic part. Hence, the deviatoric stress is accurate, but it only represents a part of the stress state. X-ray diffraction measurements The residual stresses in the near-surface area were also measured by laboratory X-ray diffraction. In order to carry out the measurements, a small piece (25x25 mm) was taken from a ring that is identical to the ring investigated in neutron diffraction by electro-discharge machining. For this measurement, the standard sin2ψ-method was applied, making use of the Cr Kα1,2 reflection. No correction for changes in lattice parameter due to the gradient in carbon was made; the used reference values were valid for hardened high carbon steel. Stresses were measured at the surface and a large number of steps below the surface up to a depth of 4000 µm. The results of the measurements are plotted in Fig. 7. In the figures, both the stresses and the Full Width at Half Maximum are plotted. The FWHM can be used as an indirect measure for changes in hardness as both are altered by plastic deformation or solute changes which induce local distortions in the lattice parameter.
(a)
Depth profiles from outer surface
-700
-600
-500
-400
-300
-200
-100
0
100
0 500 1000 1500 2000 2500 3000 3500 4000
Depth below surface (µm)
Res
idua
l str
ess
(MPa
)
0.0
1.0
2.0
3.0
4.0
5.0
6.0
7.0
8.0
FWH
M (
° 2-
th.)
R.S. FWHM (b)
Depth profiles from inner surface
-700
-600
-500
-400
-300
-200
-100
0
100
0 500 1000 1500 2000 2500 3000 3500 4000
Depth below surface (µm)
Res
idua
l str
ess
(MPa
)
0.0
1.0
2.0
3.0
4.0
5.0
6.0
7.0
8.0
FWH
M (
° 2-
th.)
R.S. FWHM Fig. 7 Stress profile and Full Width at Half Maximum of the 211-reflection as measured at the (a) outer surface of the ring and (b) the inner surface of the ring. The stress component is in the circumferential direction. DISCUSSION The objective of this study is to determine the stress state in a large roller bearing using both neutron diffraction and laboratory X-ray diffraction. It can be seen that a significant discrepancy exists in the residual stress measurements as determined with the two methods – apparently due to the difficulties in determining the unstressed lattice parameter. In addition, the two methods measure the stress in very different regions. In the laboratory diffraction profile the stress measurements is performed in the first 4 mm, whereas the neutron diffraction measurements primarily cover the bulk with essentially no overlap once the edge effected points are removed. In case of neutron measurements in the circumferential (hoop) direction, the stress is 800 MPa at the position 4 mm below the inner surface of the ring and 900 MPa at the position 6 mm below the outer surface of the ring (the raceway). These values have to be compared then with the laboratory measurements. In this case, the stress values at 4 mm from the surface are for the
551Copyright ©JCPDS-International Centre for Diffraction Data 2009 ISSN 1097-0002Advances in X-ray Analysis, Volume 52
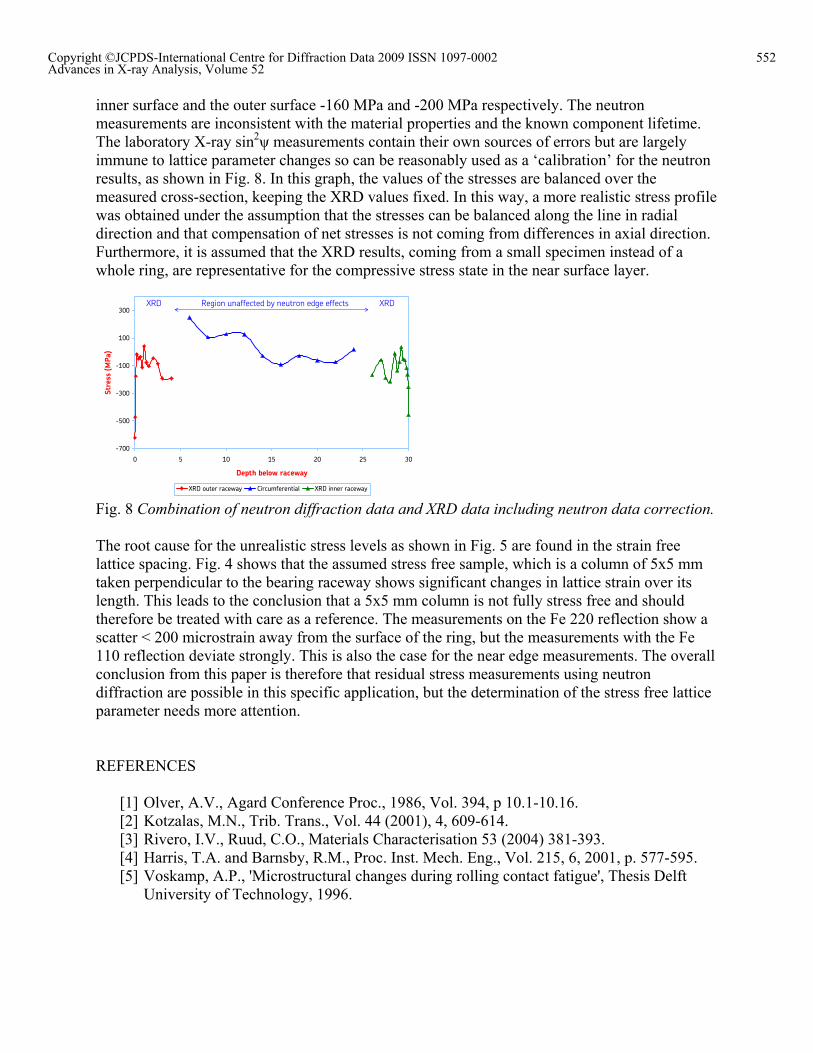
inner surface and the outer surface -160 MPa and -200 MPa respectively. The neutron measurements are inconsistent with the material properties and the known component lifetime. The laboratory X-ray sin2ψ measurements contain their own sources of errors but are largely immune to lattice parameter changes so can be reasonably used as a ‘calibration’ for the neutron results, as shown in Fig. 8. In this graph, the values of the stresses are balanced over the measured cross-section, keeping the XRD values fixed. In this way, a more realistic stress profile was obtained under the assumption that the stresses can be balanced along the line in radial direction and that compensation of net stresses is not coming from differences in axial direction. Furthermore, it is assumed that the XRD results, coming from a small specimen instead of a whole ring, are representative for the compressive stress state in the near surface layer.
-700
-500
-300
-100
100
300
0 5 10 15 20 25 30
Depth below raceway
Stre
ss (
MPa
)
XRD outer raceway Circumferential XRD inner raceway
Region unaffected by neutron edge effectsXRD XRD
Fig. 8 Combination of neutron diffraction data and XRD data including neutron data correction. The root cause for the unrealistic stress levels as shown in Fig. 5 are found in the strain free lattice spacing. Fig. 4 shows that the assumed stress free sample, which is a column of 5x5 mm taken perpendicular to the bearing raceway shows significant changes in lattice strain over its length. This leads to the conclusion that a 5x5 mm column is not fully stress free and should therefore be treated with care as a reference. The measurements on the Fe 220 reflection show a scatter < 200 microstrain away from the surface of the ring, but the measurements with the Fe 110 reflection deviate strongly. This is also the case for the near edge measurements. The overall conclusion from this paper is therefore that residual stress measurements using neutron diffraction are possible in this specific application, but the determination of the stress free lattice parameter needs more attention. REFERENCES
[1] Olver, A.V., Agard Conference Proc., 1986, Vol. 394, p 10.1-10.16. [2] Kotzalas, M.N., Trib. Trans., Vol. 44 (2001), 4, 609-614. [3] Rivero, I.V., Ruud, C.O., Materials Characterisation 53 (2004) 381-393. [4] Harris, T.A. and Barnsby, R.M., Proc. Inst. Mech. Eng., Vol. 215, 6, 2001, p. 577-595. [5] Voskamp, A.P., 'Microstructural changes during rolling contact fatigue', Thesis Delft
University of Technology, 1996.
552Copyright ©JCPDS-International Centre for Diffraction Data 2009 ISSN 1097-0002Advances in X-ray Analysis, Volume 52