Embed Size (px)
Citation preview

2018 International Congress of Diabetes and Metabolism
Neuroprotective effect of insulinsignaling
Department of Anatomy & Neurology
Ajou University School of Medicine
Sun Ah Park

• Lecture/consultation fee: none
• Grants: NRF-2018M3C7A1056293 & NRF-2018R1A2B6009439
• Stock: none
• Employment: none
• Membership on the board of directors or anyrelationship with another organization: none
Conflict of interest disclosure
Committee of Scientific Affairs

2018 International Congress of Diabetes and Metabolism
NeuroprotectiveEffect ofInsulin
The impact of Insulinresistance (deficiency)
on the brain
Therapeutic trialsusing Insulin /
Insulin-mimics inbrain disorders
Clinical evidence Experimental evidence

2018 International Congress of Diabetes and Metabolism
Brain under diabetic condition
• With hyper-(hypoinsulinemia (later)) and hyperglycemia
• Degree & distribution of insulin resistance is not uniform.
Hyperinsulinemia
↓CNS insulin levels
↓CSF/serum insulin ratio in T2DM ↓Responsiveness of
cells to insulin
↓ Brain capillary
insulin receptors
↓ BBB transport
+ With aging ⇒① ↑ Dependency on glycolysis
② ↑ Oxidation (incl. Receptors for NT, Insulin, etc.) ③ ↑ Insulin resistance
(Marks et al., Endocrinology 1990)

2018 International Congress of Diabetes and Metabolism
Clinical evidence of brain damage in T2DM
Greater Brain Atrophy in T2DM (Moran et al., 2013;Biessels and Reijmer 2014)) Both Gray and White matter atrophy (Biessels et
al., 2014) ↓Brain connectivity on DTI (Reijmer et al., 2013)
Brain total ®ional volume,
Connectivity

2018 International Congress of Diabetes and Metabolism
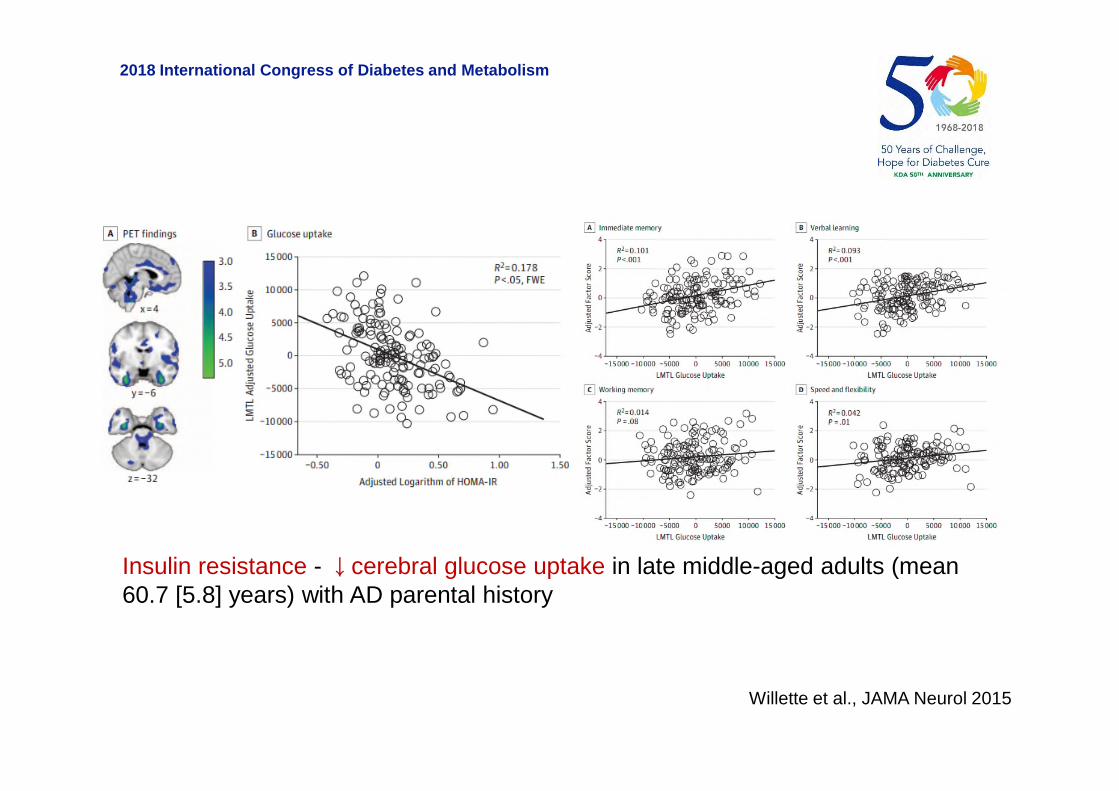
Higher HOMA-IR = [basal Glucose level (mg/dL) ⅹ basal Insulin(μU/mL)]/405⇒ ↓Glucose metabolism on FDG-PET &⇒ Predict worse memory performance
(Willette et al., JAMA Neurol 2015)
Glucose-uptake:Brain metabolism
2018 International Congress of Diabetes and Metabolism
Insulin resistance - ↓cerebral glucose uptake in late middle-aged adults (mean60.7 [5.8] years) with AD parental history
Willette et al., JAMA Neurol 2015

2018 International Congress of Diabetes and Metabolism
T2DM – [No consistent associations] - Brain amyloid or Tau-PETuptake
(Roberts, J Nucl Med 2014; Tomita, Geriatri Gerontol Int 2013, AnnNeurol 2017; Chiang, J Neurol Sci 2017)
Insulin Resistance – ↑Amyloid uptake (PiB)(Willette et al., Alzheimers Dement 2015),
T2DM - ↑Tau uptake (PBB3)(Takenoshita et al., Curr Alzheimer Res 2018)
Aβ, Tau pathology: PET

2018 International Congress of Diabetes and Metabolism
Association of Insulin resistance with cerebral amyloid deposition in latemiddle-aged adults (mean 60.4 [5.7] years) with normal cognition
Willette et al., Alz Dement 2015
APOE ε4 versus non-APOE ε4 [p = .132]

2018 International Congress of Diabetes and Metabolism
DM – [Contradictory results] - CSF AD biomarkers in T2DM DM - ↑tTau & pTau in CSF
(Moran et al., Neurology, 2015; Laws et al, Sci Rep 2017) DM - ↑Aβ42 in CSF, ↓Aβ uptake in cortex (Li et al., Alz Dement (Amst)
2018)
Jack Jr, LancetNeurol 2013
Aβ, Tau pathology:
CSF
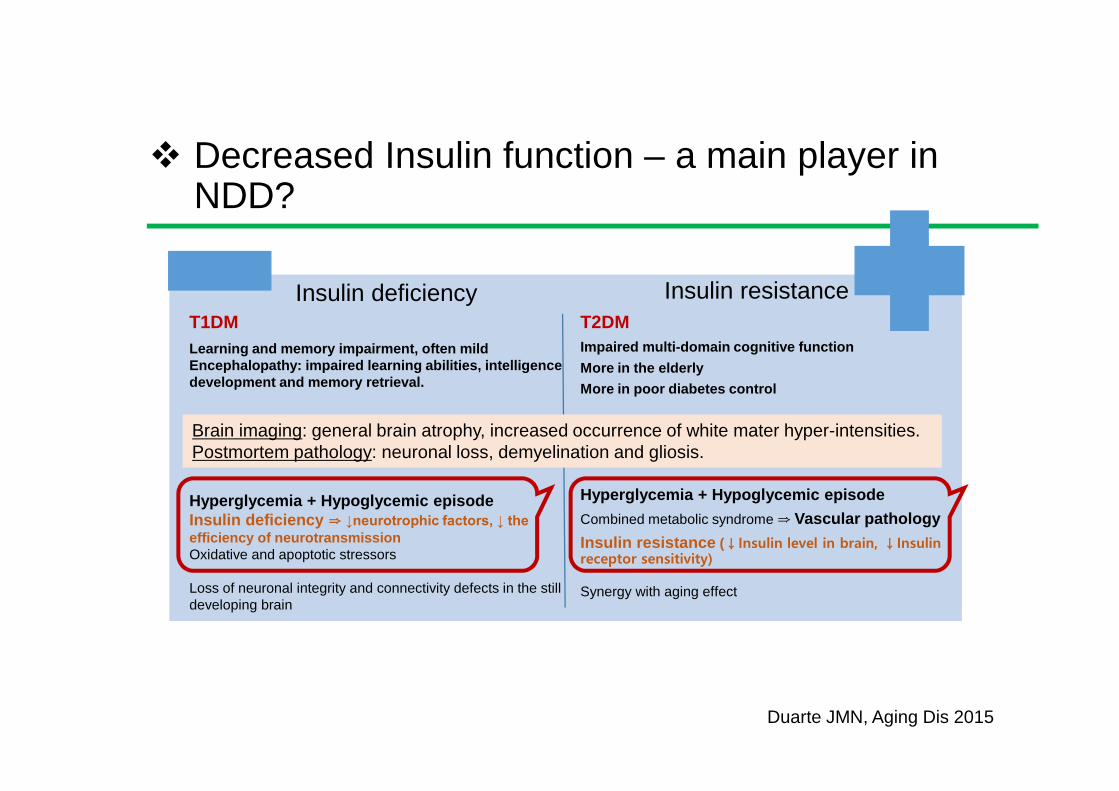
Decreased Insulin function – a main player inNDD?
T1DM
Learning and memory impairment, often mildEncephalopathy: impaired learning abilities, intelligencedevelopment and memory retrieval.
Hyperglycemia + Hypoglycemic episodeInsulin deficiency ⇒ ↓neurotrophic factors, ↓ the efficiency of neurotransmissionOxidative and apoptotic stressors
Loss of neuronal integrity and connectivity defects in the stilldeveloping brain
T2DM
Impaired multi-domain cognitive function
More in the elderly
More in poor diabetes control
Hyperglycemia + Hypoglycemic episode
Combined metabolic syndrome ⇒ Vascular pathology
Insulin resistance (↓Insulin level in brain, ↓Insulinreceptor sensitivity)
Synergy with aging effect
Insulin deficiency Insulin resistance
Duarte JMN, Aging Dis 2015
Brain imaging: general brain atrophy, increased occurrence of white mater hyper-intensities.Postmortem pathology: neuronal loss, demyelination and gliosis.

2018 International Congress of Diabetes and Metabolism
Diabetic characteristics in Alzheimer’s disease
Impaired glucose metabolism in brain① ↓Fluorodeoxyglucose PET signals Brain atrophy Cognitive declineprofile② ↑Glucose level in hippocampus on MRS from AD patients after glucoseintake - ↓Glucose metabolism e (Haley AP et al., Magn Resn Imaging 2006)
baseline After glucose intake

2018 International Congress of Diabetes and Metabolism
Parameter AD ↑ ↓ Details Study
Blood insulin ↑-Fasting or after glucose tolerance test -In women only (1 study) -Only in non-APOE4 and moderate/severe AD (1 study) -Meta-analysis of 11 studies: 5 report overall ↑, 1 ↑ in women, 1 ↑ with advanced stage (Ma et al., 2016)
Bucht et al., 1983; Fujisawa et al., 1991; Stolk et al., 1997; Craft et al., 1998; Ma et al., 2016
CSF insulin ↑ -Also found small increase with vascular dementia Fujisawa et al., 1991
↓ -Only in non-APOE4 and moderate/severe AD -No relationship to APOE or AD severity Craft et al., 1998; Gil-Bea et al., 2010
No change -No relationship with AD severity or cognition Molina et al., 2002
Brain insulin No change -Comparing controls >65 y/o and AD patients Frölich et al., 1998
↓-Comparing controls <65 y/o and AD patients -mRNA: in hippocampus and hypothalamus -mRNA: progressive reduction with Braak stage
Frölich et al., 1998; Rivera et al., 2005; Steen et al., 2005
Brain IR (total) ↓-Comparing controls <65 y/o and AD patients -mRNA and protein -mRNA: progressive reduction with Braak stage
Frölich et al., 1998; Rivera et al., 2005; Steen et al., 2005
↑ -Comparing controls >65 y/o and AD patients Frölich et al., 1998
No change-Potential changes in cellular distribution -Also no change in p-IR -Only reduced in patients with T2D and AD
Moloney et al., 2010; Liu et al., 2011; Ho et al., 2012; Talbot et al., 2012
Brain p-IR and activity
↓ -In hippocampus -Reduced insulin binding -TK activity reduced compared to all controls Frölich et al., 1998; Rivera et al., 2005; Steen et al., 2005
Brain IRS1 (total) ↓ -mRNA in 3 regions -Also reductions in IRS2 Steen et al., 2005; Moloney et al., 2010
No change -Also no change in IRS2 -Only reduced in patients with T2D and AD Liu et al., 2011; Talbot et al., 2012
Brain p(Ser)-IRS1↑-Regardless of APOE status and reduced ex vivo insulin stimulation -Highest in AD, butalso elevated in some tauopathies
Moloney et al., 2010Talbot et al., 2012Bomfim et al., 2012Yarchoan et al., 2014
Brain AKT (total) ↓ -Reduced in AD and in patients with T2D and AD Griffin et al., 2005; Liu et al., 2011
No change Steen et al., 2005; Talbot et al., 2012
Adopted from Stanley et al., J Exp Med 2016
Insulin related changes in AD patients
2018 International Congress of Diabetes and Metabolism
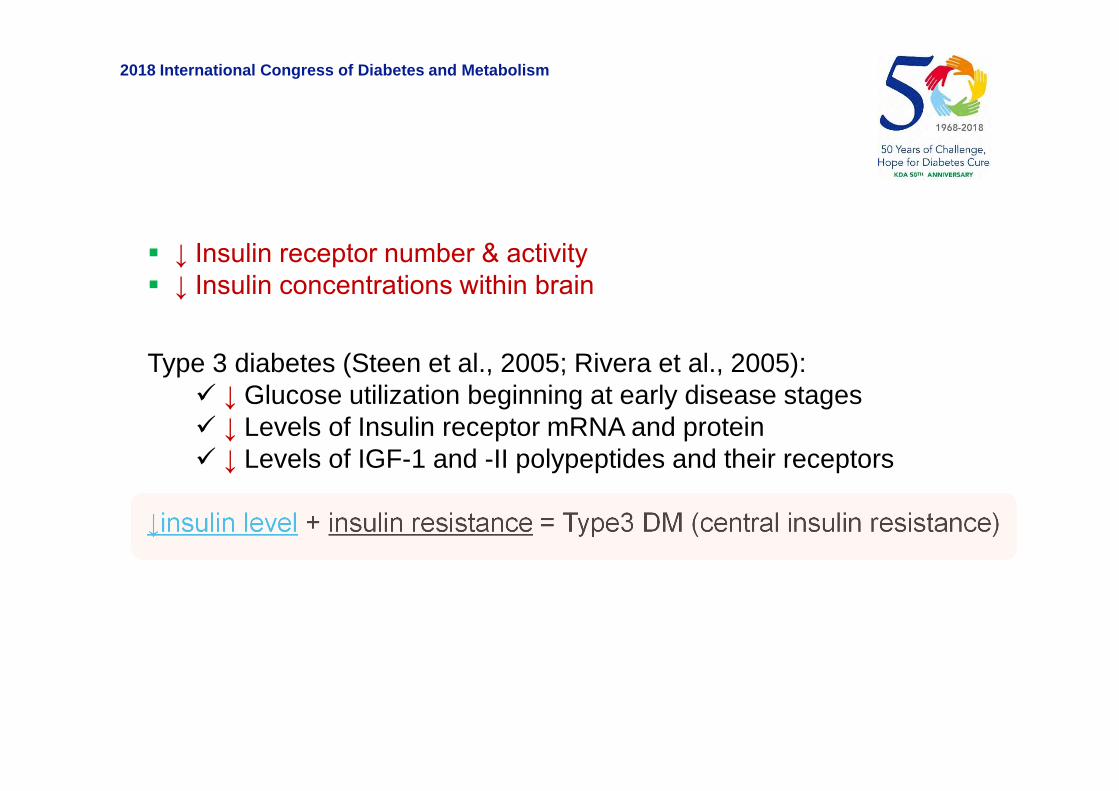
Type 3 diabetes (Steen et al., 2005; Rivera et al., 2005): ↓ Glucose utilization beginning at early disease stages ↓ Levels of Insulin receptor mRNA and protein ↓ Levels of IGF-1 and -II polypeptides and their receptors
↓insulin level + insulin resistance = Type3 DM (central insulin resistance)
↓ Insulin receptor number & activity ↓ Insulin concentrations within brain

2018 International Congress of Diabetes and Metabolism
Conclusions 1
Frequent observation of neuronal damage in T2DM: correlationwith insulin resistance markers, e.g. HOMA-IR
− Atrophy− Disturbed neural connections− ↓ Glucose metabolism− ↓ Cognitive functions− Tends to increase Alzheimer’s pathology, Aβ and Tau
Evidence of insulin resistance in AD brain− ↓ Insulin receptor number & activity− ↓ Insulin concentrations within brain− ↓ Glucose brain metabolism
Harmful effect of Insulin resistance / Insulin deficiency on brain

2018 International Congress of Diabetes and Metabolism
Source
① Mainly from the periphery through a saturable transport
system of the BBB, 0.5–0.6 μl/g-min
② Different permeability in different regions of the brain
③ Produced by a small group of cells in the olfactory mucosa
(Lacroix et al., 2008)
④ Regulated by various factors
Insulin is for what in brain?

2018 International Congress of Diabetes and Metabolism
Banks et al., Pharmacol Therapeutics 2012*Havrankova et al., PNAS 1978
Insulin transport through BBB
GLUT-2
GLUT-2)
GLU
T-1
GLUT-4
GG
Sense bloodglucoselevels
G Glucose
Higherinsulininthebrainthanintheplasma
(x25, x10~100)*
I
2018 International Congress of Diabetes and Metabolism
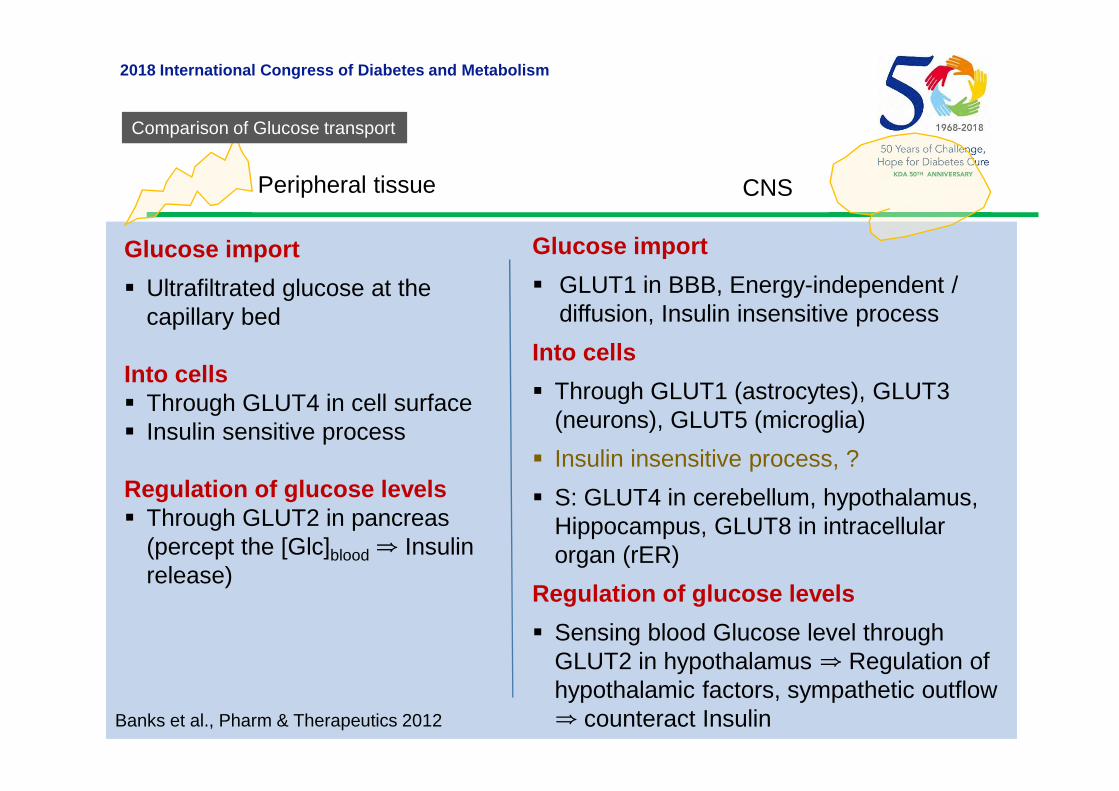
Glucose import
Ultrafiltrated glucose at thecapillary bed
Into cells Through GLUT4 in cell surface Insulin sensitive process
Regulation of glucose levels Through GLUT2 in pancreas
(percept the [Glc]blood ⇒ Insulinrelease)
Glucose import
GLUT1 in BBB, Energy-independent /diffusion, Insulin insensitive process
Into cells
Through GLUT1 (astrocytes), GLUT3(neurons), GLUT5 (microglia)
Insulin insensitive process, ?
S: GLUT4 in cerebellum, hypothalamus,Hippocampus, GLUT8 in intracellularorgan (rER)
Regulation of glucose levels
Sensing blood Glucose level throughGLUT2 in hypothalamus ⇒ Regulation ofhypothalamic factors, sympathetic outflow⇒ counteract Insulin
Peripheral tissue CNS
Banks et al., Pharm & Therapeutics 2012
Comparison of Glucose transport

2018 International Congress of Diabetes and Metabolism
Functions of Insulin in brain
Function- Physiologic Euglycemic State -
① Maintaining healthysynaptic transmission② Synaptic plasticity,↑NMDA receptorexpression③↑synapse numbers anddendritic spine formation④ Regulation of cellularprocesses including growth,differentiation andmetabolism⑤ Cellular proliferation,Neuron survival, andantioxidant defense⑥ Mediation of vascularfunction through nitric oxide(NO) and endothelin-1
Function
- Counter act withperipheral insulin interms of energyhomeostsis duringhypoglycemia① ↑Serum glucose ② Regulation ofhypothalamic factors,sympathetic outflow③ ↓Feeding, ↓Body wt.
- Thermogenesis- Protein synthesis- Regulation of lipolysis
Function- At BBB -
: Regulate BBBfunction① ↑Transport to brain: Tyr, Trp,Leptin② ↑p-Glycoprotein
(Wan et al., 1997, Zhao et al., 1999, Beattie et al., 2000, Man et al.,2000, Passafaro et al., 2001, Skeberdis et al., 2001, Dou et al., 2005, Valencianoet al., 2006, Chiu et al., 2008, Zhao et al., 1999, Dou et al., 2005, Chiu et al., 2008)Reviewed in Kleinridders, et al., 2014, Neth & Craft, 2017)

2018 International Congress of Diabetes and Metabolism
Insulin binds only to the IR atphysiological condition
Affinity of IR: Insulin > IGF-2 (ⅹ0.1 affinity,higher for IRA), IGF-1 (ⅹ0.02-0.01 affinity)
Tyrosine kinase receptors Function [metabolic]:
①Glucose import through GLUT4②Glycogenesis, Protein synthesis③Regulation of lipid synthesis④Survival, proliferation in mitosis-competent
cells, growth (hypertrophy)
IR(A & B)
Insulin receptor
Glycogensynthesis
Glycolysis & Fattyacid synthesis
Influx ofGlucose

2018 International Congress of Diabetes and Metabolism
IGF-1
IGF-1 and IGF-2 > Insulin (ⅹ0.01 affinity) Tyrosine kinase receptors, 60% homology
with Insulin receptor Function [growth promoting effect]:① Survival, proliferation in mitosis-competent cells, growth (hypertrophy),② anti-inflammation, anti-oxidants, CTxresistance
Higashi et al., J Gerontol 2012
IGF-1 binds to IGF-1R &IGF-1/Insulin hybrid-R
2018 International Congress of Diabetes and Metabolism
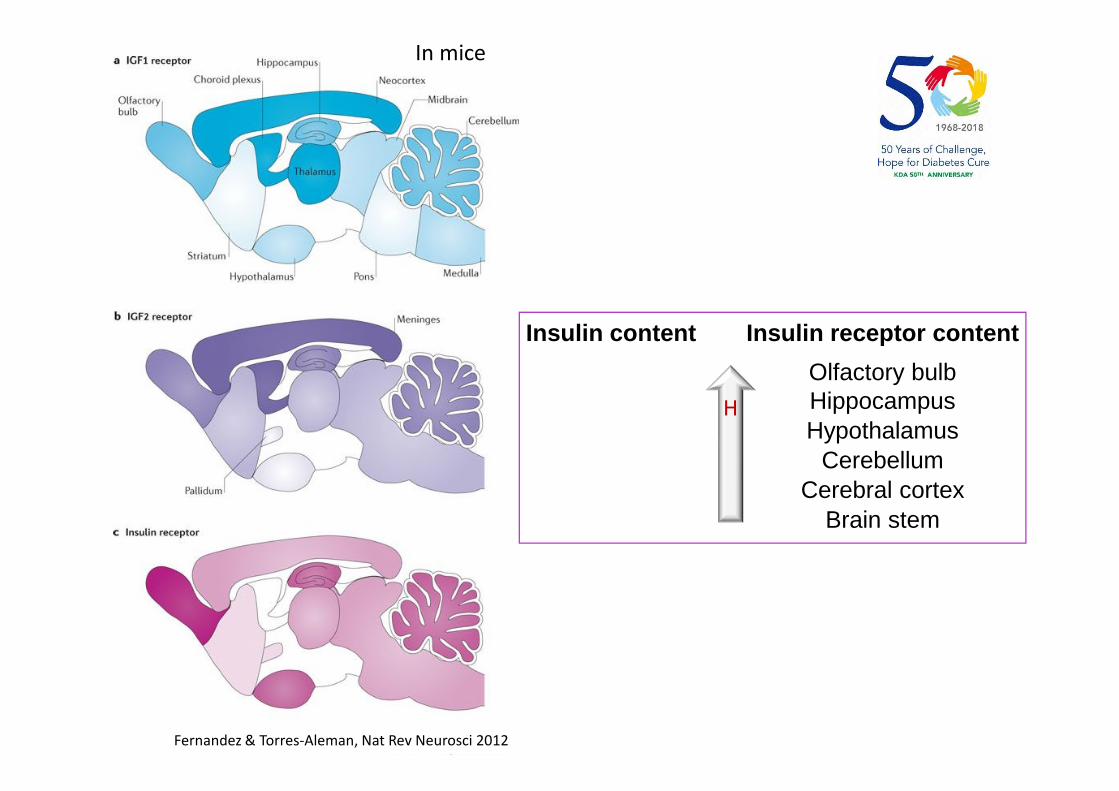
Fernandez & Torres-Aleman, Nat Rev Neurosci 2012
Olfactory bulbHippocampusHypothalamus
CerebellumCerebral cortex
Brain stem
H
In mice
Insulin content Insulin receptor content

2018 International Congress of Diabetes and Metabolism
Haeusler et al., Nat Rev Mol Cell Biol 2018

2018 International Congress of Diabetes and Metabolism
0.3 mU/kg/min regular human insulin
Normal saline
maintained at euglycemiausing 20% glucose i.v. if necessary
Under the condition of inhibition of basal insulin secretion
Within basal insulin levelsWithin
Insulin dependentglucose import intothe brain cells
Above basal levels No impact on glucose uptake
Bingham et al., Diabetes 2002

2018 International Congress of Diabetes and Metabolism
Models Metabolism Brain Function
Mouse IR knockout in nestin expressing neurons
↑Food intake, Obesity, ↑Body fat, Mild insulin resistance (Bruning JC et al
., 2000)Defective counterregulatory response to hypoglycemia (Fisher et al., 200
5; Diggs-Andrews 2010)
↓pAkt and pGSK3-beta, ↑pTauNo alteration in neuronal proliferation/survival, memor
y, or basal brain glucose metabolism (Schubert M, et al., 2004)
Mouse IR knockout in tyrosine hydroxylase expre
ssing neurons
↑Body weight, ↑Body fat, and hyperphagia (Konner AC et al., 2011)
Rat hypothalamic IR antisense knockdown
↑Food intake, ↑Body fat (Obici S et al., 2002; Grillo CA et al., 2007)
Impaired insulin action to inhibit glucose production (Obici S et al., 2002)or No change in insulin release (Grill
o CA et al., 2007)
Mouse IR kinase +/−Failure of recognition of a novel object
Difficulty in memory retention of an object (Das et al.,2005)
Mouse IRS-2-knockout
↓ Neuronal proliferation during development by 50%, but no increase in apoptosis
↑p-Tau at S202 in cytoplasmic deposits, No behavior data (Schubert et al., 2003)
Experimental Evidence: Genetic modulationof Insulin Signaling

2018 International Congress of Diabetes and Metabolism
Tg2576 AD mouse withIRS-2(-/-), IGF-1R(-/-) orIR(-/-) in nestin expressin
g neurons
IGF-1R /IRS-2 deficiency ⇒①Prevent premature mortality in Tg2576, ②↓APP processing and Aβ accumulation
IR deficiency⇒ no effect (Freude et al., 2009)
Tg2576 AD mouse withIR knockout in nestin ex
pressing neurons
nIR (-/-) ⇒ ↓Aβ burden, No rescue from premature mortality nIR (+/-) ⇒ no change in Aβ load, But partial rescues of premature mortality (Stöhr et
al., 2013)
Tg2576 AD mouse withIRS-2 knockout
↓Amyloid deposition↑ p-Tau (at S409, S396/404, S235, S202) with reduced PP2A activity
Improved behavioral deficits (Killick R et al., BBRC 2009)
2018 International Congress of Diabetes and Metabolism
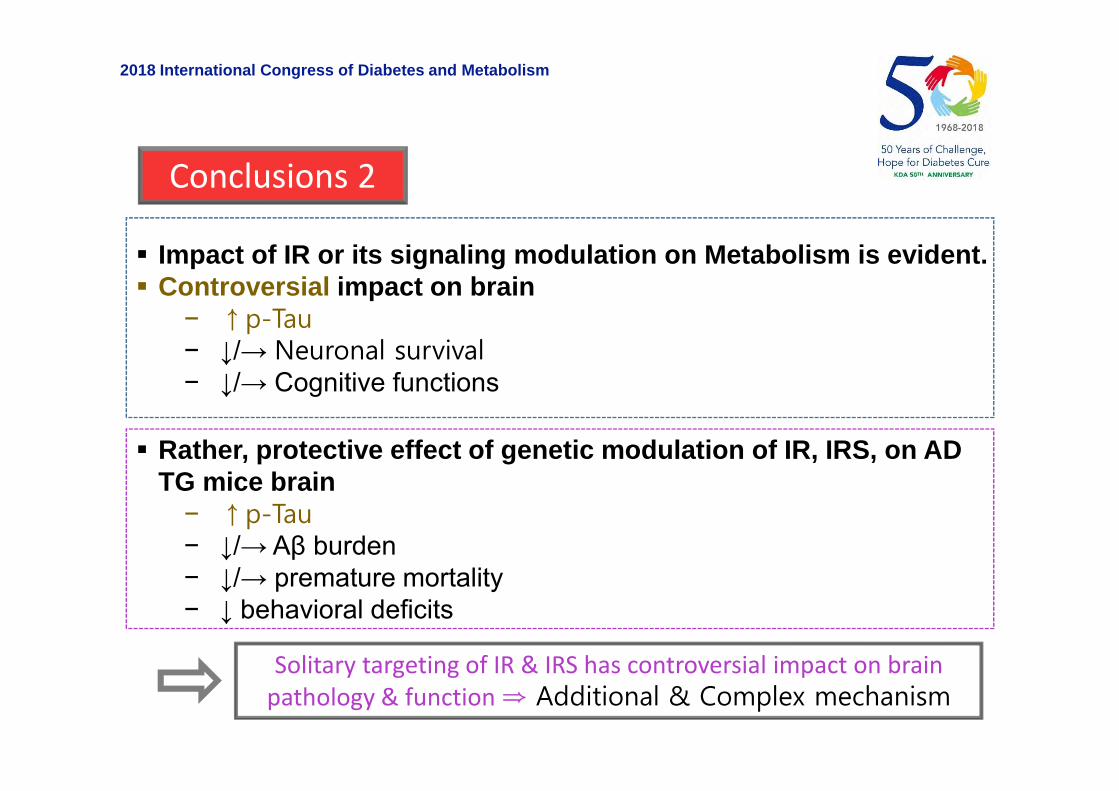
Conclusions 2
Impact of IR or its signaling modulation on Metabolism is evident. Controversial impact on brain
− ↑p-Tau− ↓/→ Neuronal survival− ↓/→ Cognitive functions
Rather, protective effect of genetic modulation of IR, IRS, on ADTG mice brain
− ↑p-Tau− ↓/→ Aβ burden− ↓/→ premature mortality− ↓ behavioral deficits
Solitary targeting of IR & IRS has controversial impact on brainpathology & function⇒ Additional & Complex mechanism

• Hyperinsulinemia → IDE deficiency → ↓Aβ clearance
Contribution of Insulin resistance in AD pathogenesis 1
IDEAβ
IDEI
I
IDEAβ
Aβ
IDEI
Insulin ↑
IDEI Aβ
Aβ
AβIDEI

2018 International Congress of Diabetes and Metabolism
from Abcam.com
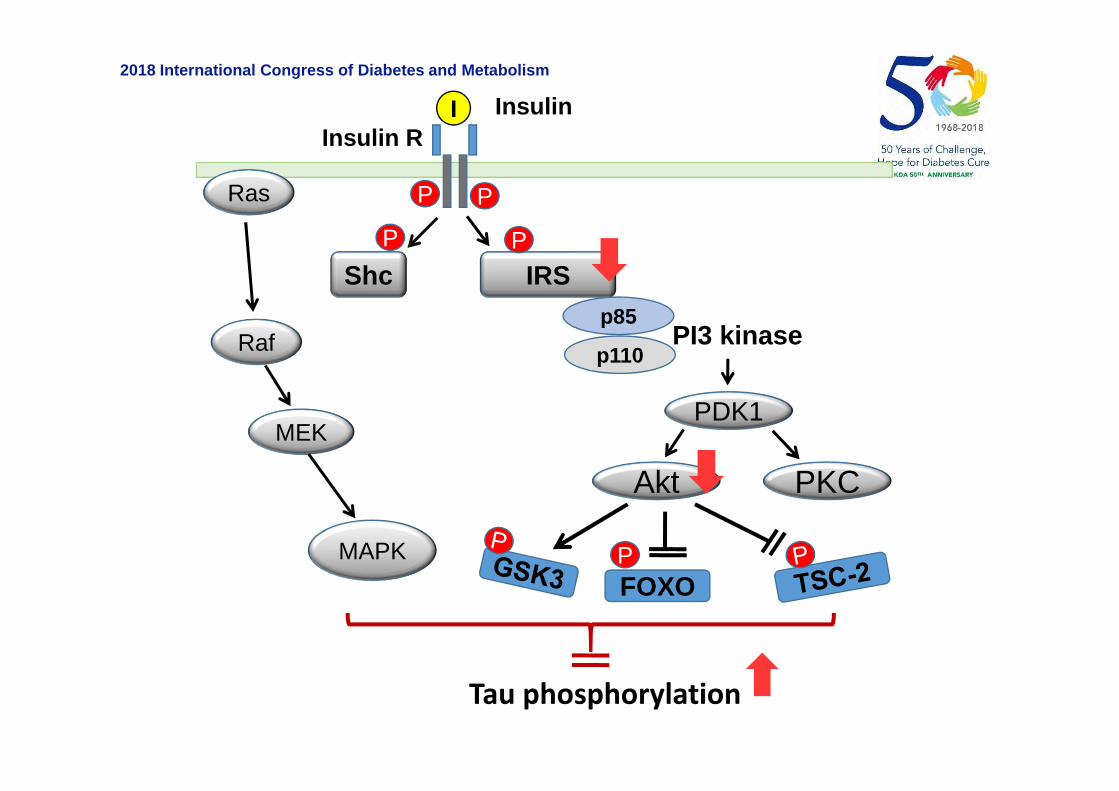
Contribution of Insulin resistance in AD pathogenesis 2
2018 International Congress of Diabetes and Metabolism
PP
Insulin
Insulin R
p85
p110PI3 kinase
I
PDK1
Akt
Shc
P
IRS
P
FOXOP
PKC
Ras
Raf
MEK
MAPK
Tau phosphorylation

2018 International Congress of Diabetes and Metabolism
Contribution of Insulin resistance in AD pathogenesis 3
Insulin Signaling Defects
↓SREBP-2/SCAP in brain
↓ Cholesterol synthesis
↓Synaptogenesis
Cognitive & Mood Disturbances
Altered Glutamate Receptor activities
Altered synaptic plasticity
Impaired neuronal functions

2018 International Congress of Diabetes and Metabolism
Throughsystemic /metabolicalterations
Dyslipidemia
Hypothermia
Hypothalamichypogonadism
Appetite
Contribution of Insulin resistance in AD pathogenesis 4
Kleinridders et al., Diabetes 2014

Glutamine
GLUT1/3
GlucoseG
Glucose
Fructose-6-P
GFATGlutamate
Glucosamine-6-P
UDP-GlcNAc
Tau Tau
UDPKinase
Phosphatase
Tau
Contribution of↓Glucose metabolism in AD pathogenesis
hex
osa
min
eb
iosy
nth
etic
pat
hw
ay

2018 International Congress of Diabetes and Metabolism
Insulin, Insulin-mimetic C-peptide
BBZDR/Wor rats, T2DM model [LiZG et al., 2007]
↓Diabetic condition related AD pathology:↓neuronal loss, ↓gliosis, ↓synaptophysin decrease &↓incr
ease of APP, ↓β-secretase, ↓Aβ
GLP-1 analogue:
LiraglutideExendin-4Val(8)GLP-1 analogue
STZ systemic injection to 3xTG ADmice [Li Y et al., 2010]
↓The diabetic effect of STZ; ↑insulin, ↓glucose, ↓HbA1C
↓Soluble Aβ, ↓APP, No change in total tauAPP/PS1 mice [McClean et al., 20
11]↑Memory↓Synapse loss, ↑Synaptic plasticity in hippocampus ↓
Aβ plaques, ↓Soluble AβO, ↓Activated microglia.Aβ40 i.c.v, injected Wistar rats [Wa
ng XH, et al., 2010]↓Aβ-induced LTP detrimentsRestore Aβ-induced impairment of spatial learning &
memoryAPP/PS1 mice & AβO i.c.v. injecte
d primates [Bomfim TR, 2012]↓ Phosphorylation of JNK & IRS-1, ↓Soluble Aβ, ↓Aβ
plaque, ↑Spatial memory, memory retentionRecovery of Aβ-induced memory impairment
APP/PS1-21 mice [Gengler et al., 2012]
Protect LTP, ↓ Age-related synaptic degeneration, ↓Dense-core plaque number
Therapeutic trials using Insulin or mimics
AD

2018 International Congress of Diabetes and Metabolism
Leptin CRND8 (K670N & M671L & V717F) mice [Greco SJ et al., 2010]
↓Aβ1-40, ↓Amyloid burden in hippocampus, ↓C99-CTF,↓β-secretase activity maybe through PPAR gamma agonistic effect↓P-tau at AT8 & Ser396Improve cognitive performance in novel object recognition & fear conditioning tests
Rosiglitazone APPV717I mice [Heneka MT et al.,2005]
↓Reactive astrogliosis & microglial activation, ↓COX-2, ↓iNOS and inflammatory markers, ↓BACE-1 mRNA & protein, ↓Soluble Aβ42, ↓Aβ42 deposits
Tg2576 mice [Pedersen WA et al.,2006]
↑ Spatial learning, ↓Serum corticosterone levelAttenuate reduction in IDE mRNA and activity↓ Aβ42 without affecting deposition
PDAPP (J20) mice [Escribano L etal., 2010]
↑ Aβ clearance, ↓ Aβ aggregates & AβO↓ Neuropil thread containing phosphorylated tau↓ Proinflammatory markers↑ Object recognition & spatial memory
APPswe/PS1E9 mice [Toledo EMet al., 2010; O’Reilly JA et al., 2012]
↓ Insoluble Aβ42, ↓Reactive astrogliosis & microglial activation
Improved behavioral deficitsPioglitazone PDAPP (J20) mice [Nicolakakis N
et al., 2008]↑Cerebrovascular reactivity, ↑Cerebral glucose utilizationReverse SOD2 increase, ↓Reactive astrogliosis, ↑Fibers
of cholinergic neurons, No change in Aβ plaque and spatial memory

Comparison 1: glibenclamide (glyburide) versus repaglinide
Comparison 2: intensive glycemic control versus standard glycemic controlComparison 3: rosiglitazone plus metformin versus glibenclamide (glyburide) plus metforminComparison 4: Metformin versus placebo
Global cognitive function Incidence of MCI Incidence of dementia
2008-2016Cochrane Database of Systematic Reviews 2017, Issue 6. Art. No.: CD003804.
DOI: 10.1002/
No good evidence
Meta-analysis of the prevention of dementia by anti-DM strategy

2018 International Congress of Diabetes and Metabolism
Pioglitazone (insulin sensitizer, PPAR-r agonists)
3,494 cognitively normal participants based on their ApoE and TOMM40 (Translocase of the outer
mitochondrial membrane 40 homolog rs 10524523) genotype (in normal participants with high risk of
MCI-AD)
⇒ 5-year follow-up: no difference in the delay of MCI-AD onset by piogliotazone
NCT01931566
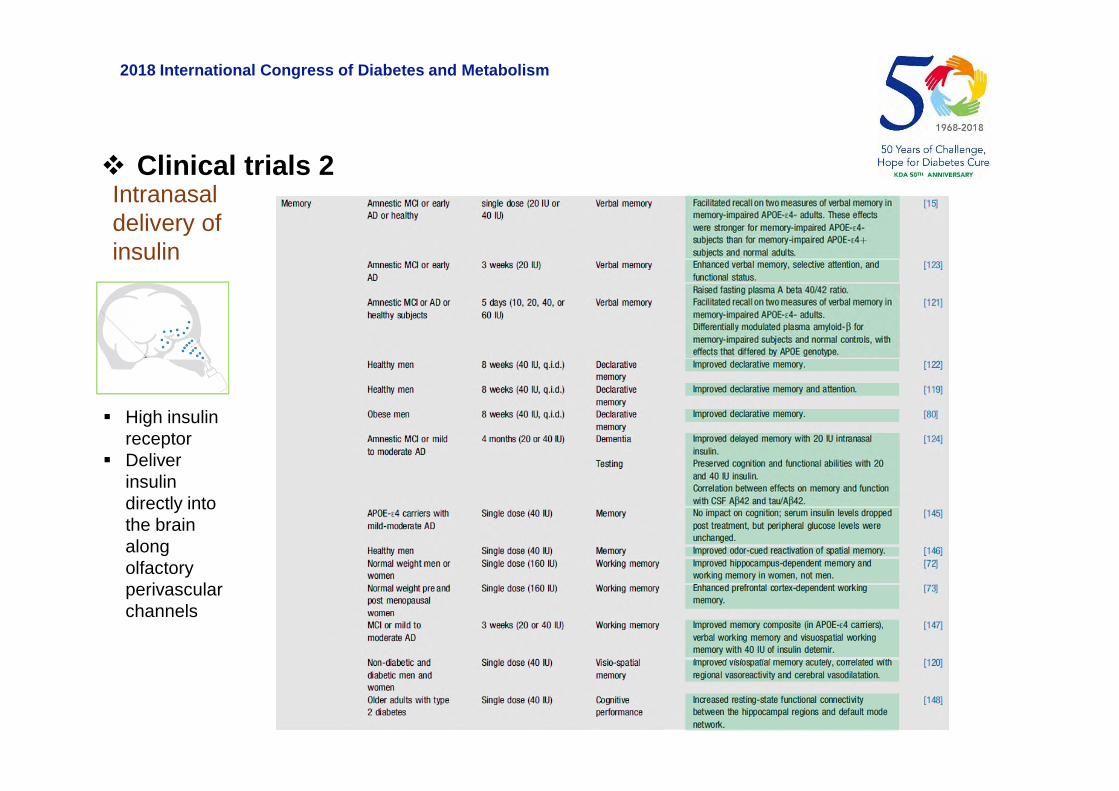
Clinical trials 1
2018 International Congress of Diabetes and Metabolism
Intranasaldelivery ofinsulin
High insulinreceptor
Deliverinsulindirectly intothe brainalongolfactoryperivascularchannels
Clinical trials 2

2018 International Congress of Diabetes and Metabolism
Name Synonyms FDA Status
Nasal Insulin Detamir, Levemir, Humulin, NovolinAD (Phase 2/3), MCI (Phase 2),PD (Phase 2), MSA (Phase 2)
Champman et al., Neuropharmacology 2017
Clinical trials 3

2018 International Congress of Diabetes and Metabolism
Conclusions 3
Therapeutic trial studies using Insulin & anti-DM in animals:protective
Therapeutic trial studies in human: negative result by not, butnot-yet
More evidences are needed in human.

2018 International Congress of Diabetes and Metabolism
Epidemiological / Clinical study inDM or preDM condition
Genetic modulation of IR (IRS) in wildtype: controversial Genetic modulation of IR (IRS) in AD -
TG mice: rather contradictory
Therapeutic trial studies usingInsulin & anti-DM in animals:beneficial & protective
Therapeutic trial studies in human:beneficial, but need more data
Need of more sophisticated strategy- time, duration, stage on disease process, genetic background
- More detailed / combined targeting

Thank you