Embed Size (px)
Citation preview
0270.f+574/81/0101-0040$02.00/0 The Journal of Neuroscience Copyright 0 Society for Neuroscience Vol. 1, No. 1, pp. 40-48 Printed in U.S.A. January 1981
NEURONAL AND BEHAVIORAL SENSITIVITY TO BINAURAL TIME DIFFERENCES IN THE OWL’
ANDREW MOISEFF AND MASAKAZU KONISHI
Division of Biology, 216-76, California Institute of Technology, Pasadena, California 91125
Abstract
We demonstrated that ongoing time disparity (OTD) was a sufficient cue for the azimuthal component of receptive fields of auditory neurons in the owl (Tyto c&a) midbrain and that OTDs were sufficient to mediate meaningful behavioral responses. We devised a technique which enabled us to change easily between free field and dichotic stimuli while recording from single auditory neurons in the owl mesencephalicus lateralis pars dorsalis (MLD). MLD neurons with restricted spatial receptive fields (“space-mapped neurons”) showed marked sensitivity to specific ongoing time disparities. The magnitudes of these disparities were in the behaviorally significant range of tens of microseconds. The ongoing time disparities were correlated significantly with the azimuthal center of receptive fields. Space-mapped neurons were insensitive to transient disparities. MLD neurons which were not space-mapped, i.e., were omnidirectional, did not show any sensitivity to specific OTDs. We confirmed the behavioral relevance of OTD as a cue for localizing a sound in azimuth by presenting OTD differences to tame owls. Using head turning as an assay, we showed that OTD was a sufficient cue for the azimuth of a sound. The relationship between azimuth and OTD obtained from our neurophysiological experiments matched closely the relationship obtained from our behavioral experiments.
Studies of sound localization behavior and its neural correlates have long relied on dichotic presentation of auditory stimuli. Dichotic stimulation enables the inde- pendent control of the auditory stimuli presented to the two ears. Thus, an experimenter has independent control over such parameters as interaural time differences and interaural intensity differences. Without dichotic stimu- lation, it would be difficult to determine the importance of different interaural cues for sound localization. The use of dichotic stimulation as a tool for investigating the phenomenon of sound localization in real space has had one major disadvantage. In no case had a direct compar- ison been made between the response of single auditory neurons to free field and dichotic stimulation. Accord- ingly, it was never demonstrated that dichotic stimula- tion could excite auditory neurons in a manner similar to free field stimuli. In our present study, we devised a system for switching easily between free field and di- chotic conditions while recording from single auditory neurons in the owl mesencephalicus lateralis pars dorsalis (MLD), a homologue of the mammalian inferior collicu-
I We thank our electrical engineers, David Hodge, John Powers, and Mike Walsh, for their assistance, Herb Adams for constructing me- chanical devices, Eugene and Cynthia Akutagawa for the care of owls, and Dr. Eric Knudsen for critically reading the first draft of this paper. This work was supported by National Institutes of Health Grant NS 14617-02 to M. K. and a Helen Hay Whitney postdoctoral fellowship to
A. M.
lus. Using this system, we could map the receptive field of an auditory neuron under free field conditions and then measure the sensitivity of the same neuron to independently controllable interaural differences pre- sented dichotically. In addition, we tested the behavioral relevance of our results by measuring the behavioral responses to the interaural parameters to which MLD “space-mapped” neurons, neurons with discrete spatial receptive fields, were sensitive.
We concentrated our efforts on investigating whether the owl used interaural time differences for determining the azimuth of a sound. Interaural time delays result when the distance from a sound source to each of the two ears is different, as is the case when the source is not on the median sagittal plane. The time it takes a sound wave to traverse this difference in distance is the inter- aural time delay. An interaural time delay is evident in two parts of a sound, the envelope of the signal and the waveform making up the signal. Effects on the envelope, for example, differences in onset time or offset time, are known as “transient disparities.” Time differences be- tween the arrival of homologous parts of a continuing waveform at the ears are known as “ongoing time dis- parities” (Tobias and Schubert, 1959). In cases where the continuing waveform is a periodic signal, such as a pure tone, ongoing time disparities are often expressed as phase differences.
We recorded from single auditory neurons in the owl’s MLD. Neurons within a distinct region of MLD respond
The Journal of Neuroscience Binaural Time Sensitivity in the Owl 41
only to sound from a discrete area of space (Knudsen and Konishi, 1978). The area to which these “space-mapped” neurons responded was their “receptive field” and was mapped out in response to free field stimulation. We demonstrated that space-mapped neurons are sensitive to ongoing time disparity and confirmed the use of this cue by the behaving barn owl.
Materials and Methods
Physiological recordings were obtained from seven adult barn owls (Tyto &a). The surgical procedures were the same as those used by Knudsen and Konishi (1978). The owls were anesthetized with ketamine hydro- chloride (4 mg/kg) (Ketaset, Bristol Laboratories) prior to surgery and kept anesthetized by periodic injections of the same drug. A section of skull, approximately 1 cm in diameter, was replaced with a stainless steel well allowing access to the brain surface. For some experi- ments, no further surgery was required; microelectrodes were inserted through the forebrain into the midbrain using stereotactic coordinates. In some cases, it was necessary to remove the forebrain by aspiration, enabling us to visually position the microelectrodes with respect to the optic lobe. Throughout the experiment, the owl was held in a restraining device designed to hold the owl’s head rigidly for single neuron recording.
Microelectrodes were made by coating platinum- iridium wires with glass after the method of Wolbarsht et al. (1960). They were placed at the desired brain locations with a custom-made micromanipulator. A re- mote controlled stepping motor was used to advance the electrode. Electrode positions were marked with electri- cal lesions and were confirmed by conventional histolog- ical procedures (Knudsen and Konishi, 1978).
Stimulus. Two separate types of stimulus systems were used throughout these experiments: a free field system and a dichotic system. The free field system has been described previously (Knudsen and Konishi, 1978). Briefly, experiments were performed in a 5 x 3 x 3 m anechoic soundproof room. A speaker was mounted on a “hoop,” a semicircular track with a radius of 1 m, with which we could position the loudspeaker anywhere on an imaginary sphere around the animal’s head at a distance of 1 m. White noise or sine waves (General Radio 1310B) pulses were attenuated (HP350D), amplified (Macintosh 40), and presented through the hoop-mounted speaker.
The dichotic stimulus system was designed in such a way that we could establish a dichotic system anytime during an experiment, and just as easily, re-establish a free field system. Miniature condenser microphones (Knowles model BT-1759) were used as speakers by modulating their polarization voltage with the desired signal. The condenser speakers were mounted in exter- nally threaded stainless steel tubes 7 mm in diameter and 11 mm in length. Flanged, stainless steel rings, which fit into the owl’s ear canals, were constructed with matching internal threads. The rings fit tightly into the external ear canal where they were sutured into place with 6/O silk prior to the recording session. Dichotic stimulation was then accomplished by threading the earphone tubes into the sutured “ear-rings.” Conversely,
free field conditions required only that the earphone tubes be removed from the ear-rings.
We monitored the behavioral responses of the tame owls in response to free field auditory stimulation with and without the ear-rings in place. Using the monitoring method which will be described later, we observed no differences in the ability of the owls to localize sound when the ear-rings were in place compared to when the ear-rings were not in place.
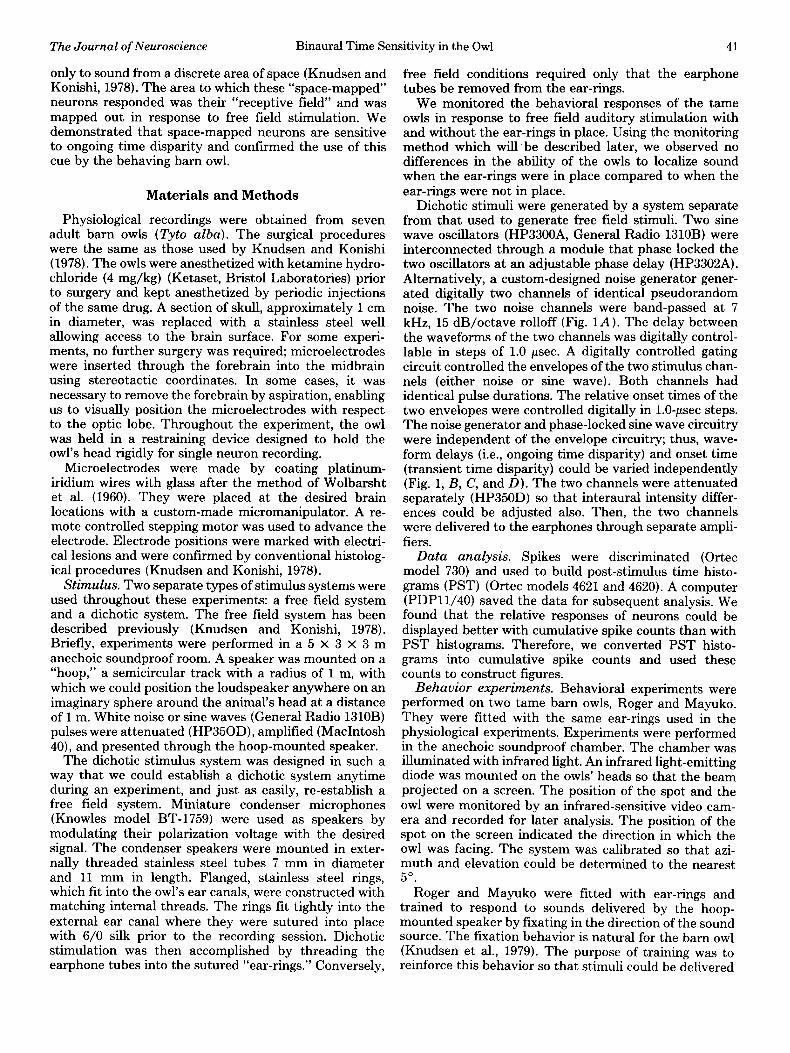
Dichotic stimuli were generated by a system separate from that used to generate free field stimuli. Two sine wave oscillators (HP33OOA, General Radio 1310B) were interconnected through a module that phase locked the two oscillators at an adjustable phase delay (HP3302A). Alternatively, a custom-designed noise generator gener- ated digitally two channels of identical pseudorandom noise. The two noise channels were band-passed at 7 kHz, 15 dB/octave rolloff (Fig. 1A ). The delay between the waveforms of the two channels was digitally control- lable in steps of 1.0 psec. A digitally controlled gating circuit controlled the envelopes of the two stimulus chan- nels (either noise or sine wave). Both channels had identical pulse durations. The relative onset times of the two envelopes were controlled digitally in l.O+sec steps. The noise generator and phase-locked sine wave circuitry were independent of the envelope circuitry; thus, wave- form delays (i.e., ongoing time disparity) and onset time (transient time disparity) could be varied independently (Fig. 1, B, C, and D). The two channels were attenuated separately (HP350D) so that interaural intensity differ- ences could be adjusted also. Then, the two channels were delivered to the earphones through separate ampli- fiers.
Data analysis. Spikes were discriminated (Ortec model 730) and used to build post-stimulus time histo- grams (PST) (Ortec models 4621 and 4620). A computer (PDP11/40) saved the data for subsequent analysis. We found that the relative responses of neurons could be displayed better with cumulative spike counts than with PST histograms. Therefore, we converted PST histo- grams into cumulative spike counts and used these counts to construct figures.
Behavior experiments. Behavioral experiments were performed on two tame barn owls, Roger and Mayuko. They were fitted with the same ear-rings used in the physiological experiments. Experiments were performed in the anechoic soundproof chamber. The chamber was illuminated with infrared light. An infrared light-emitting diode was mounted on the owls’ heads so that the beam projected on a screen. The position of the spot and the owl were monitored by an infrared-sensitive video cam- era and recorded for later analysis. The position of the spot on the screen indicated the direction in which the owl was facing. The system was calibrated so that azi- muth and elevation could be determined to the nearest 5”.
Roger and Mayuko were fitted with ear-rings and trained to respond to sounds delivered by the hoop- mounted speaker by fixating in the direction of the sound source. The fixation behavior is natural for the barn owl (Knudsen et al., 1979). The purpose of training was to reinforce this behavior so that stimuli could be delivered
42 Moiseff and Konishi Vol. 1, No. 1, Jan. 1981
!
Figure 1. Dichotic noise stimulus. Two channels of pseudorandom noise were generated digitally and band-passed at 7 kHz. Transient disparity and ongoing time disparity were independently controllable. The initial portion of the dichotic stimuli are shown to illustrate this independence. A, No transient disparity or ongoing time disparity between the two channels. B, 500~psec ongoing time disparity, zero transient disparity. C, 500~psec transient disparity, zero ongoing time disparity. D, 500~psec transient disparity and 500~psec ongoing time disparity. Time calibration, 5 msec.
repeatedly without resulting in habituation of the behav- ior. Training consisted solely of positive reinforcement of the head-turning behavior. A small piece of food was given to the owl by a remote control feeding device whenever the owl responded to sound with a head sac- cade and fixated for a few seconds. Training to respond to the speaker was considered complete when the owl consistently responded to low intensity auditory stimuli. After completion of the free field training, earphones were inserted into the ear-rings, establishing a dichotic stimulus delivery system. The behavior of the owls was monitored on the video system in response to dichotic auditory stimulation. The position of the projected spot was measured before and after stimulus delivery. The difference in azimuth between these two measurements was the measure of how far the owl turned its head. The dichotic stimuli elicited behaviors consistent with exter- nalization of the stimulus. That is, differences in binaural parameters resulted in head saccades whose final fixation points suggested that the owl detected the sound as emanating from predictable regions of space. This appar- ent externalization did not require training. We rewarded the performance of this behavior to avoid habituation to repeated stimulation.
Sound calibration. Stimulus sound intensities were determined by surgically implanting a probe tube (1.2 mm in diameter and 2 cm in length) into the external auditory meatus directly next to the tympanum. The probe tube, in turn, was connected to a Bruel & Kjaer %- inch (12.5-cm) condenser microphone. Sound measure- ments were obtained in decibels, sound pressure level (SPL) (re: 20 PPa). The maximum sound intensity which we could deliver through our earphones was 49 dB SPL. The earphones attenuated ambient sounds reaching the tympanum by at least 20 dB over the frequency range of 6 to 8 kHz. Direct measurements of interaural time delays were obtained by implanting surgically two Bruel & Kjaer %-inch (3.2-cm) condenser microphones, one in each ear, directly next to the tympana.
Certain conventions were maintained throughout this paper concerning the description of the data. The refer- ence point for measurements of azimuth and elevation was directly in front of the animal. Negative azimuths refer to angular deviations to the left of the medial sag&al plane-the greater the magnitude of the angle, the greater the deviation from the medial sag&al plane. When referring to elevations, negative angles refer to directions below the horizontal plane, positive angles to
The Journal of Neuroscience Binaural Time Sensitivity in the Owl 43
directions above the horizontal plane; again, the greater the magnitude, the greater the deviation from a level position. Time measurements, transient disparity and ongoing time disparity, were negative when the signal at the left ear lead the signal at the right ear and were positive when the signal at the left ear lagged the signal at the right ear.
Results
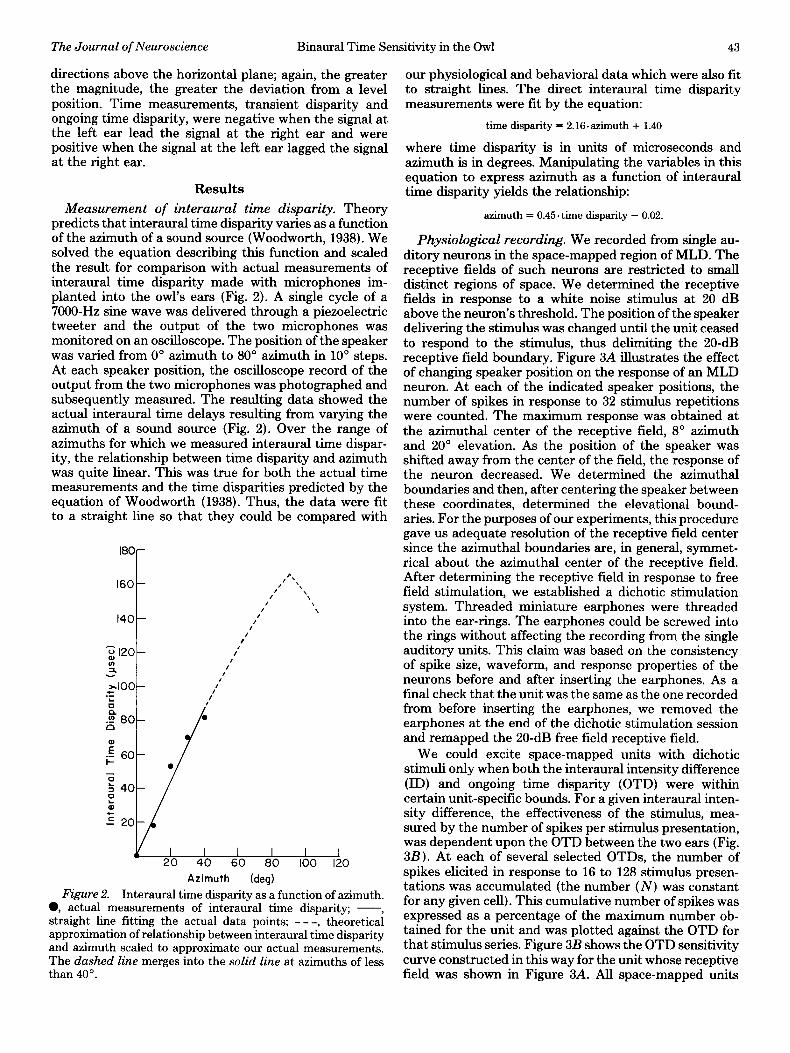
Measurement of interaural time disparity. Theory predicts that interaural time disparity varies as a function of the azimuth of a sound source (Woodworth, 1938). We solved the equation describing this function and scaled the result for comparison with actual measurements of interaural time disparity made with microphones im- planted into the owl’s ears (Fig. 2). A single cycle of a 7000-Hz sine wave was delivered through a piezoelectric tweeter and the output of the two microphones was monitored on an oscilloscope. The position of the speaker was varied from 0” azimuth to 80” azimuth in 10’ steps. At each speaker position, the oscilloscope record of the output from the two microphones was photographed and subsequently measured. The resulting data showed the actual interaural time delays resulting from varying the azimuth of a sound source (Fig. 2). Over the range of azimuths for which we measured interaural time dispar- ity, the relationship between time disparity and azimuth was quite linear. This was true for both the actual time measurements and the time disparities predicted by the equation of Woodworth (1938). Thus, the data were fit to a straight line so that they could be compared with
180 r
Azimuth (deg)
Figure 2. Interaural time disparity as a function of azimuth. 0, actual measurements of interaural time disparity; -, straight line fitting the actual data points; - - -, theoretical approximation of relationship between interaural time disparity and azimuth scaled to approximate our actual measurements. The dashed line merges into the solid line at azimuths of less than 40”.
our physiological and behavioral data which were also fit to straight lines. The direct interaural time disparity measurements were fit by the equation:
time disparity = 2.16.azimuth + 1.40
where time disparity is in units of microseconds and azimuth is in degrees. Manipulating the variables in this equation to express azimuth as a function of interaural time disparity yields the relationship:
azimuth = 0.45. time disparity - 0.02.
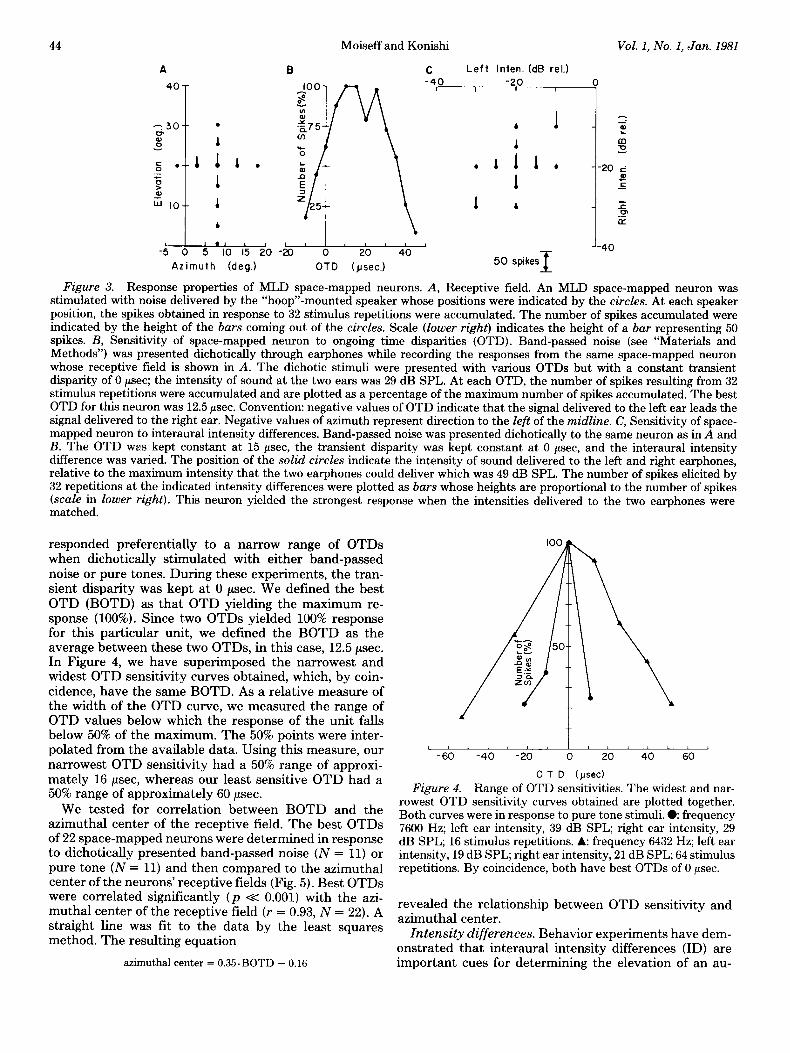
Physiological recording. We recorded from single au- ditory neurons in the space-mapped region of MLD. The receptive fields of such neurons are restricted to small distinct regions of space. We determined the receptive fields in response to a white noise stimulus at 20 dB above the neuron’s threshold. The position of the speaker delivering the stimulus was changed until the unit ceased to respond to the stimulus, thus delimiting the 20-dB receptive field boundary. Figure 3A illustrates the effect of changing speaker position on the response of an MLD neuron. At each of the indicated speaker positions, the number of spikes in response to 32 stimulus repetitions were counted. The maximum response was obtained at the azimuthal center of the receptive field, 8’ azimuth and 20” elevation. As the position of the speaker was shifted away from the center of the field, the response of the neuron decreased. We determined the azimuthal boundaries and then, after centering the speaker between these coordinates, determined the elevational bound- aries. For the purposes of our experiments, this procedure gave us adequate resolution of the receptive field center since the azimuthal boundaries are, in general, symmet- rical about the azimuthal center of the receptive field. After determining the receptive field in response to free field stimulation, we established a dichotic stimulation system. Threaded miniature earphones were threaded into the ear-rings. The earphones could be screwed into the rings without affecting the recording from the single auditory units. This claim was based on the consistency of spike size, waveform, and response properties of the neurons before and after inserting the earphones. As a final check that the unit was the same as the one recorded from before inserting the earphones, we removed the earphones at the end of the dichotic stimulation session and remapped the 20-dB free field receptive field.
We could excite space-mapped units with dichotic stimuli only when both the interaural intensity difference (ID) and ongoing time disparity (OTD) were within certain unit-specific bounds. For a given interaural inten- sity difference, the effectiveness of the stimulus, mea- sured by the number of spikes per stimulus presentation, was dependent upon the OTD between the two ears (Fig. 3B). At each of several selected OTDs, the number of spikes elicited in response to 16 to 128 stimulus presen- tations was accumulated (the number (N) was constant for any given cell). This cumulative number of spikes was expressed as a percentage of the maximum number ob- tained for the unit and was plotted against the OTD for that stimulus series. Figure 3B shows the OTD sensitivity curve constructed in this way for the unit whose receptive field was shown in Figure 3A. All space-mapped units
44 Moiseff and Konishi Vol. 1, No. 1, Jan. 1981
B C Left Inten. (dB rel.)
I , , I ,
-5 0 5 IO 15 20
Azimuth (deg.)
100 -40 -20 Q ? a- 5 -%75 b l-3 m
i-7”” L
FJ 1 - B
G . 111, - -20 c’ z 1 2
E
= 25 1 b - z .P (L
-?+e-&- -20 OTD (psec.)
J-40
50 spikes I
Figure 3. Response properties of MLD space-mapped neurons. A, Receptive field. An MLD space-mapped neuron was stimulated with noise delivered by the “hoop’‘-mounted speaker whose positions were indicated by the circles. At each speaker position, the spikes obtained in response to 32 stimulus repetitions were accumulated. The number of spikes accumulated were indicated by the height of the bars coming out of the circles. Scale (lower right) indicates the height of a bar representing 50 spikes. B, Sensitivity of space-mapped neuron to ongoing time disparities (OTD). Band-passed noise (see “Materials and Methods”) was presented dichotically through earphones while recording the responses from the same space-mapped neuron whose receptive field is shown in A. The dichotic stimuli were presented with various OTDs but with a constant transient disparity of 0 psec; the intensity of sound at the two ears was 29 dB SPL. At each OTD, the number of spikes resulting from 32 stimulus repetitions were accumulated and are plotted as a percentage of the maximum number of spikes accumulated. The best OTD for this neuron was 12.5 psec. Convention: negative values of OTD indicate that the signal delivered to the left ear leads the signal delivered to the right ear. Negative values of azimuth represent direction to the left of the midline. C, Sensitivity of space- mapped neuron to interaural intensity differences. Band-passed noise was presented dichotically to the same neuron as in A and B. The OTD was kept constant at 15 psec, the transient disparity was kept constant at 0 psec, and the interaural intensity difference was varied. The position of the solid circles indicate the intensity of sound delivered to the left and right earphones, relative to the maximum intensity that the two earphones could deliver which was 49 dB SPL. The number of spikes elicited by 32 repetitions at the indicated intensity differences were plotted as bars whose heights are proportional to the number of spikes (scale in lower right). This neuron yielded the strongest response when the intensities delivered to the two earphones were matched.
responded preferentially to a narrow range of OTDs when dichotically stimulated with either band-passed noise or pure tones. During these experiments, the tran- sient disparity was kept at 0 psec. We defined the best OTD (BOTD) as that OTD yielding the maximum re- sponse (100%). Since two OTDs yielded 100% response for this particular unit, we defined the BOTD as the average between these two OTDs, in this case, 12.5 psec. In Figure 4, we have superimposed the narrowest and widest OTD sensitivity curves obtained, which, by coin- cidence, have the same BOTD. As a relative measure of the width of the OTD curve, we measured the range of OTD values below which the response of the unit fails below 50% of the maximum. The 50% points were inter- polated from the available data. Using this measure, our c I 1 1 c j j
narrowest OTD sensitivity had a 50% range of approxi- -60 -40 -20 0 20 40 60
mately 16 psec, whereas our least sensitive OTD had a 0 T D (psec)
50% range of approximately 60 psec. Figure 4. Range of OTD sensitivities. The widest and nar-
We tested for correlation between BOTD and the rowest OTD sensitivity curves obtained are plotted together.
azimuthal center of the receptive field. The best OTDs Both curves were in response to pure tone stimuli. e frequency
of 22 space-mapped neurons were determined in response 7600 Hz; left ear intensity, 39 dB SPL; right ear intensity, 29
to dichotically presented band-passed noise (N = 11) or dB SPL; 16 stimulus repetitions. A: frequency 6432 Hz; left ear intensity, 19 dB SPL; right ear intensity, 21 dB SPL; 64 stimulus
pure tone (N = 11) and then compared to the azimuthal repetitions. By coincidence, both have best OTDs of 0 psec. center of the neurons’ receptive fields (Fig. 5). Best OTDs were correlated significantly (p < 0.001) with the azi- muthal center of the receptive field (r = 0.93, N = 22). A
revealed the relationship between OTD sensitivity and
straight line was fit to the data by the least squares azimuthal center.
method. The resulting equation Intensity differences. Behavior experiments have dem-
onstrated that interaural intensity differences (ID) are azimuthal center = 0.35. BOTD - 0.16 important cues for determining the elevation of an au-
The Journal of Neuroscience Binaural Time Sensitivity in the Owl 45
-301 Figure 5. Relationship between OTD and azimuthal center
of receptive field. The azimuthal center of the receptive fields of 22 space-mapped neurons are plotted against the best OTDs of these neurons. The correlation coefficient between the azi- muthal center and best OTD is r = 0.93 (statistically significant at p < 0.001). A straight line was fit to the data resulting in the equation: azimuthal center = 0.35. best OTD + 0.16.
ditory stimulus (Knudsen and Konishi, 1979). Space- mapped neurons responded best to specific IDS. The data in Figure 3C indicated a neuron that was most sensitive to a zero ID. The neuron strongly responded when both ears were stimulated at equal sound intensities, for ex- ample, when both ears were stimulated at -20 dB (rel.). When the ID was varied by increasing or decreasing the stimulus intensity at one ear while keeping the intensity at the other ear constant, the neuron’s response de- creased markedly. When, on the other hand, the intensity at both ears was increased but the ID was kept constant, the neuron responded strongly, as at the -10 dB relative to the left and right intensity point in Figure 3C. This indicated that MLD space-mapped units responded as true intensity difference detectors.
Absence of time-intensity tradeoff. Our data indicated that OTDs were used to determine azimuth. Behavioral studies (Knudsen and Konishi, 1979) demonstrated that IDS of high frequency (>6-kHz) components of sounds were used to determine elevation. To insure accurate sound localization in both azimuth and elevation, the owl must process these cues independently; i.e., neither cue must interfere with the processing of the other cue. We tested the validity of this independence by measuring the effect, if any, of ID sensitivity on OTD sensitivity-the time-intensity tradeoff. OTD sensitivity curves were measured at different IDS (Fig. 6). The BOTDs did not change when the ID was varied. When the ID was set beyond the range to which the cells were sensitive, no value of OTD would cause the cells to respond. This suggested that, at this level of the owl auditory system, there was no interaction between OTD and ID.
Transient disparities. The responses of five neurons to stimuli with various transient disparities (onset time differences) but constant ID and OTD were measured. Varying the transient disparity did not markedly alter the cumulative spike counts obtained (Fig. 7). Transient time delays up to several hundred microseconds were tested on some neurons, but in no case did we observe any effect on the cumulative spike counts. None of the five neurons tested showed any preference for specific transient disparities.
I I1 I Id I I I1 I I I I I
-60 -40 -20 0 20 40 60 OTD (psec)
Figure 6. Effect of interaural intensity differences on best OTD. OTD sensitivity curves were obtained from the same neuron in response to band-passed noise. The intensity differ- ences between the two ears were different for the two curves. e 0-dB intensity difference; left and right intensities were 29 dB SPL. k lo-dB intensity difference; left intensity was 29 dB SPL; right intensity was 19 dB SPL. Both curves were gener- ated from 32 stimulus repetitions at each point. The best OTDs of the two curves are equal (-10 psec).
11 11 1 I I I II I I J -60 -40 -20 0 20 40 60
Transient Disparity (psec.1
Figure 7. Sensitivity to transient disparity. This space- mapped neuron was stimulated with band-passed noise with constant OTD and interaural intensity difference but various transient disparities. Varying the transient disparity did not alter significantly the responsiveness of the neuron. Eachpoint represents the total number of spikes resulting from 32 stimulus repetitions, expressed as a percentage of the maximum number of spikes obtained. Negative values of transient disparity indi- cate that the signal delivered to the left ear leads the signal delivered to the right ear.
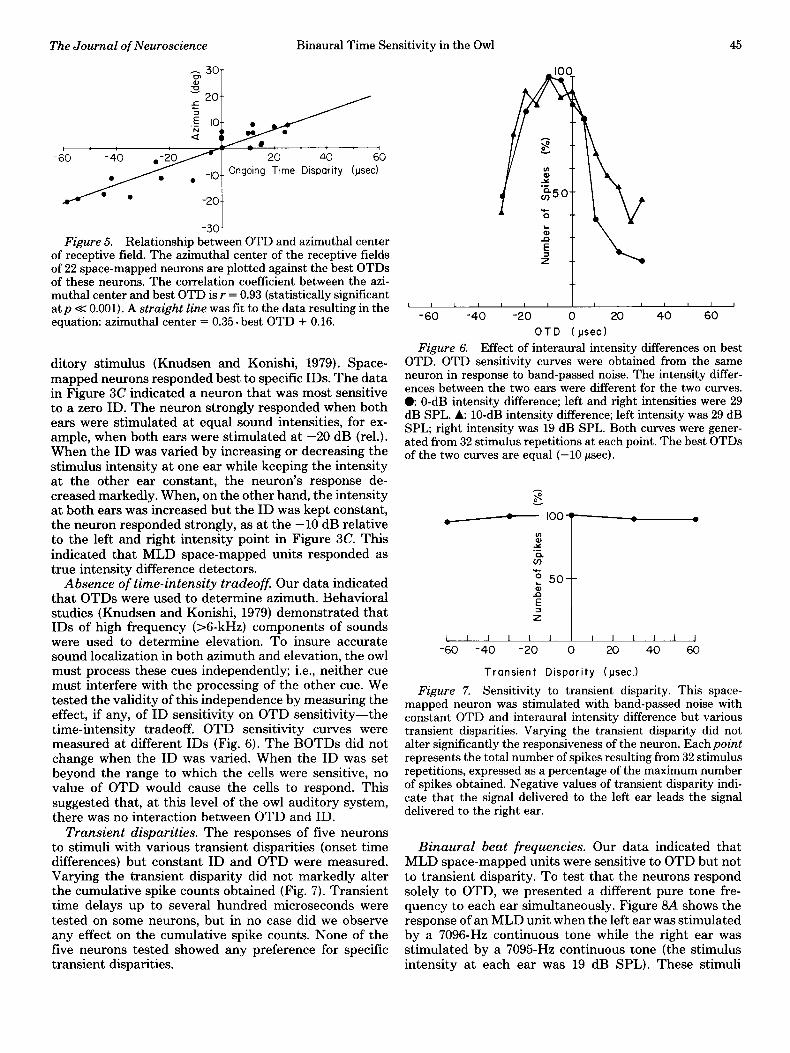
Binaural beat frequencies. Our data indicated that MLD space-mapped units were sensitive to OTD but not to transient disparity. To test that the neurons respond solely to OTD, we presented a different pure tone fre- quency to each ear simultaneously. Figure 8A shows the response of an MLD unit when the left ear was stimulated by a 7096-Hz continuous tone while the right ear was stimulated by a 7095Hz continuous tone (the stimulus intensity at each ear was 19 dB SPL). These stimuli
46
A
Moiseff and Konishi Vol. 1, No. 1, Jan. 1981
B
Figure 8. Continuous varying of OTD. A, Bottom, actual spike record from a space-mapped neuron. The two ears were stimulated with pure tones of slightly different frequency (left ear, 7096 Hz; right ear, 7095 Hz). The effect of the slight frequency difference was to continually vary the phase difference (OTD) between the two ears without any transient disparities being present. Top, the signals delivered to the two ears were electronically added for display. The amplitude variations seen in the record indicate the OTD differences between the ears. Maximum amplitude signifies 0 OTD (0” phase difference), minimum signifies a 70-psec OTD (180” phase difference). B, Spontaneous activity level of the same neuron (bottom) in the absence of auditory stimulation (top). Time calibration: 500 msec.
presented continuously varying phase (OTD) differences to the two ears without any onset or offset transients being present. For the purpose of displaying the varying phase difference between stimuli, the signals delivered to the two ears were added and displayed on an oscilloscope. The amplitude variations of the resulting display indi- cated the relative phase differences at the two ears; the maximum amplitude indicated no phase difference (0 pet) and the minimum amplitude indicated a 180“ phase difference (70 psec). The neuron, which was sponta- neously active in the absence of auditory stimulation (Fig. 8B), was inhibited by certain phase differences and excited by other phase differences (Fig. 8A). This clearly demonstrated that neurons were sensitive to phase (i.e., OTD) differences of high frequency stimuli, in this case greater than 7 kHz, in the absence of onset and/or offset transients.
Behavioral confirmation. Two tame owls, Roger and Mayuko, were used to test the hypothesis that phase differences were sufficient to determine the azimuth of a sound source. Ear canal rings, identical to those used in the physiological experiments, were sutured into Ma- yuko’s and Roger’s ear canals. The miniature earphones were screwed into the ear rings, enabling us to stimulate the owls with dichotic stimuli identical to those used in the neurophysiological experiments.
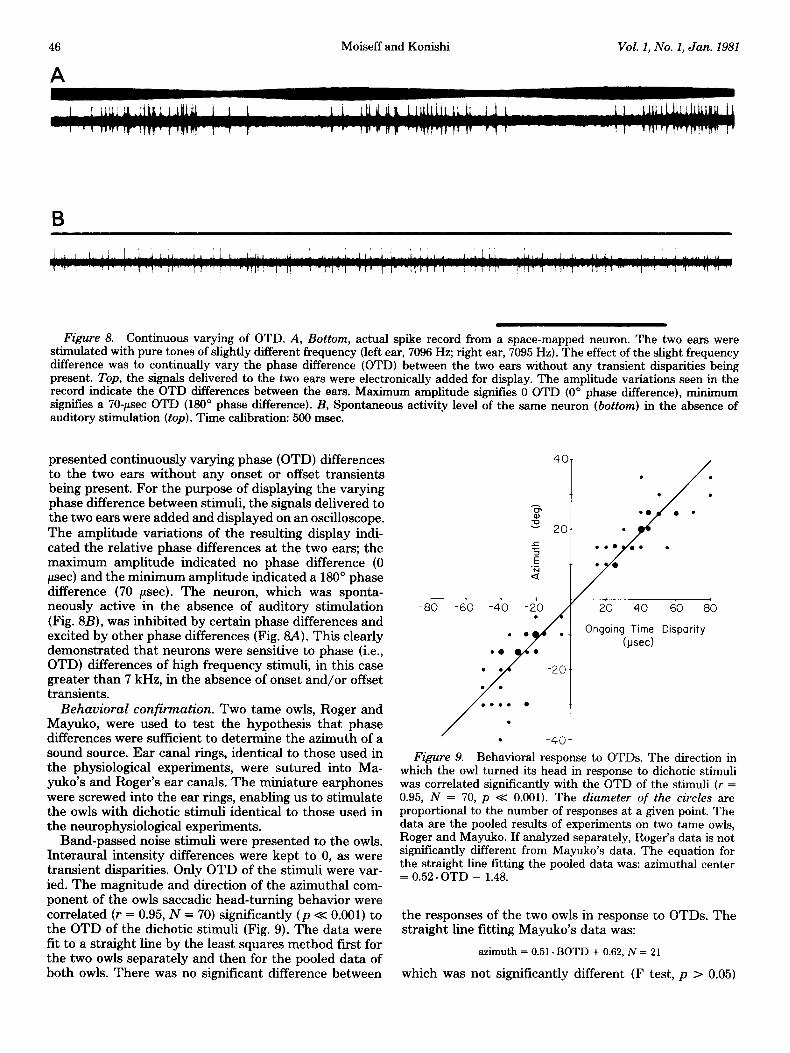
Band-passed noise stimuli were presented to the owls. Interaural intensity differences were kept to 0, as were transient disparities. Only OTD of the stimuli were var- ied. The magnitude and direction of the azimuthal com- ponent of the owls saccadic head-turning behavior were correlated (r = 0.95, N = 70) significantly (p << 0.001) to the OTD of the dichotic stimuli (Fig. 9). The data were fit to a straight line by the least squares method first for the two owls separately and then for the pooled data of both owls. There was no significant difference between
-80
Figure 9. Behavioral response to OTDs. The direction in which the owl turned its head in response to dichotic stimuli was correlated significantly with the OTD of the stimuli (r = 0.95, N = 70, p c 0.001). The diameter of the circles are
proportional to the number of responses at a given point. The data are the pooled results of experiments on two tame owls, Roger and Mayuko. If analyzed separately, Roger’s data is not significantly different from Mayuko’s data. The equation for the straight line fitting the pooled data was: azimuthal center = 0.52. OTD - 1.48.
the responses of the two owls in response to OTDs. The straight line fitting Mayuko’s data was:
azimuth = 0.51. BOTD + 0.62, N = 21
which was not significantly different (F test, p > 0.05)
The Journal of Neuroscience Binaural Time Sensitivity in the Owl 47
from the straight line fitting Roger’s data:
azimuth = 0.52. BOTD - 2.37, N = 49
The equation describing the pooled data was:
azimuth = 0.52. BOTD - 1.48, N = 70
This behavioral result confirms that OTD is a sufficient cue for extracting azimuthal information from a stimulus. The equation for the pooled behavioral data was com- pared to the equation obtained for the neurophysiological data and no significant difference (F test, p > 0.05) was found between the two slopes.
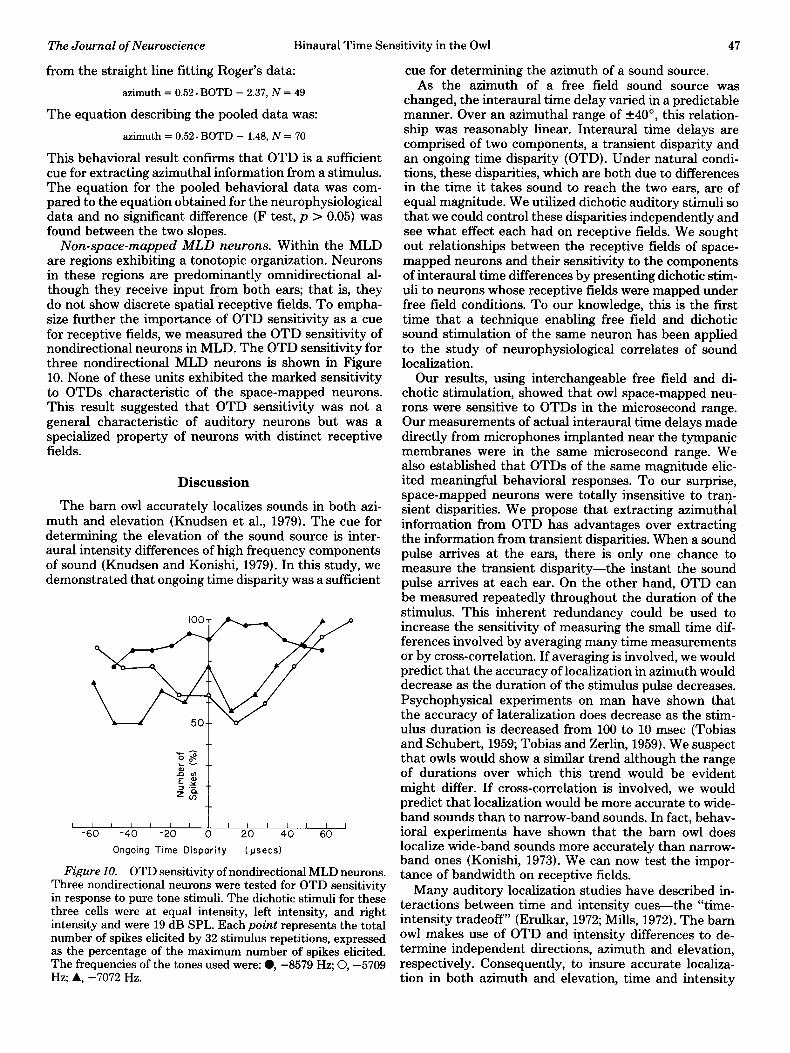
Non-space-mapped MLD neurons. Within the MLD are regions exhibiting a tonotopic organization. Neurons in these regions are predominantly omnidirectional al- though they receive input from both ears; that is, they do not show discrete spatial receptive fields. To empha- size further the importance of OTD sensitivity as a cue for receptive fields, we measured the OTD sensitivity of nondirectional neurons in MLD. The OTD sensitivity for three nondirectional MLD neurons is shown in Figure 10. None of these units exhibited the marked sensitivity to OTDs characteristic of the space-mapped neurons. This result suggested that OTD sensitivity was not a general characteristic of auditory neurons but was a specialized property of neurons with distinct receptive fields.
Discussion
The barn owl accurately localizes sounds in both azi- muth and elevation (Knudsen et al., 1979). The cue for determining the elevation of the sound source is inter- aural intensity differences of high frequency components of sound (Knudsen and Konishi, 1979). In this study, we demonstrated that ongoing time disparity was a sufficient
I I1 I / II I I I I I I1 I
-60 -40 -20 0 20 40 60
Ongoing Time Disparity (ysecs)
Figure 10. OTD sensitivity of nondirectional MLD neurons. Three nondirectional neurons were tested for OTD sensitivity in response to pure tone stimuli. The dichotic stimuli for these three cells were at equal intensity, left intensity, and right intensity and were 19 dB SPL. Each point represents the total number of spikes elicited by 32 stimulus repetitions, expressed as the percentage of the maximum number of spikes elicited. The frequencies of the tones used were: 0, -8579 Hz; 0, -5709 Hz; A, -7072 Hz.
cue for determining the azimuth of a sound source. As the azimuth of a free field sound source was
changed, the interaural time delay varied in a predictable manner. Over an azimuthal range of +40°, this relation- ship was reasonably linear. Interaural time delays are comprised of two components, a transient disparity and an ongoing time disparity (OTD). Under natural condi- tions, these disparities, which are both due to differences in the time it takes sound to reach the two ears, are of equal magnitude. We utilized dichotic auditory stimuli so that we could control these disparities independently and see what effect each had on receptive fields. We sought out relationships between the receptive fields of space- mapped neurons and their sensitivity to the components of interaural time differences by presenting dichotic stim- uli to neurons whose receptive fields were mapped under free field conditions. To our knowledge, this is the first time that a technique enabling free field and dichotic sound stimulation of the same neuron has been applied to the study of neurophysiological correlates of sound localization.
Our results, using interchangeable free field and di- chotic stimulation, showed that owl space-mapped neu- rons were sensitive to OTDs in the microsecond range. Our measurements of actual interaural time delays made directly from microphones implanted near the tympanic membranes were in the same microsecond range. We also established that OTDs of the same magnitude elic- ited meaningful behavioral responses. To our surprise, space-mapped neurons were totally insensitive to tran- sient disparities. We propose that extracting azimuthal information from OTD has advantages over extracting the information from transient disparities. When a sound pulse arrives at the ears, there is only one chance to measure the transient disparity-the instant the sound pulse arrives at each ear. On the other hand, OTD can be measured repeatedly throughout the duration of the stimulus. This inherent redundancy could be used to increase the sensitivity of measuring the small time dif- ferences involved by averaging many time measurements or by cross-correlation. If averaging is involved, we would predict that the accuracy of localization in azimuth would decrease as the duration of the stimulus pulse decreases. Psychophysical experiments on man have shown that the accuracy of lateralization does decrease as the stim- ulus duration is decreased from 100 to 10 msec (Tobias and Schubert, 1959; Tobias and Zerlin, 1959). We suspect that owls would show a similar trend although the range of durations over which this trend would be evident might differ. If cross-correlation is involved, we would predict that localization would be more accurate to wide- band sounds than to narrow-band sounds. In fact, behav- ioral experiments have shown that the barn owl does localize wide-band sounds more accurately than narrow- band ones (Konishi, 1973). We can now test the impor- tance of bandwidth on receptive fields.
Many auditory localization studies have described in- teractions between time and intensity cues-the “time- intensity tradeoff” (Erulkar, 1972; Mills, 1972). The barn owl makes use of OTD and intensity differences to de- termine independent directions, azimuth and elevation, respectively. Consequently, to insure accurate localiza- tion in both azimuth and elevation, time and intensity
48 Moiseff and Konishi Vol. 1, No. 1, Jan. 1981
differences must not interact in the owl auditory system. Our result that space-mapped neurons do not show any evidence of a tradeoff between time and intensity sug- gests that time and intensity differences are processed independently by the owl’s auditory system. This inde- pendence enables the owl to perform bi-coordinate local- ization.
The data presented in this paper demonstrated clearly that the owl auditory system was able to compare ongo- ing time disparities in the range of tens of microseconds. This is evidence that the owl auditory system can encode the phase of high frequency tones. To date, studies of the auditory nerves of songbirds have only shown phase locking to tones of about 4 kHz (Sachs et al., 1974). The frequencies for which the OTD comparisons were taking place (greater than 7 kHz, for example), had periods on the order of 143 psec. The auditory system must encode the phase of such stimuli accurately. The auditory system must also be able to retain this accuracy while transmit- ting this temporal information from the site of transduc- tion (the hair cells) to the site of eventual comparison (as yet unknown). It also poses a question as to how the auditory system makes comparisons of microsecond ac- curacy from information transmitted as action potentials or synaptic potentials which themselves last hundreds or thousands of microseconds. Presently, we are investigat- ing the mechanisms by which OTD information is en- coded and processed by the owl nervous system.
References
Erulkar, S. D. (1972) Comparative aspects of spatial localization of sound. Physiol. Rev. 52: 237-360.
Knudsen, E. I., and M. Konishi (1978) Space and frequency are represented separately in the auditory midbrain of the owl. J. Neurophysiol. 41: 870-884.
Knudsen, E. I., and M. Konishi (1979) Mechanisms of sound localization on the barn owl (Tyto alba). J. Comp. Physiol. 133: 13-21.
Knudsen, E. I., G. G. Blasdel, and M. Konishi (1979) Sound localization by the barn owl (Z’yto alba) measured with the search coil technique. J. Comp. Physiol. 133: l-11.
Konishi, M. (1973) How the owl tracks its prey. Am. Sci. 61: 414-424.
Mills, A. W. (1972) Auditory localization. In Foundations of Modern Auditory Theory, J. V. Tobias, ed., pp. 303-346, Academic Press, New York.
Sachs, M. B., E. D. Young, and R. H. Lewis (1974) Discharge patterns of single fibers in the pigeon auditory nerve. Brain Res. 70: 431-447.
Tobias, J. V., and E. D. Schubert (1959) Effective onset duration of auditory stimuli. J. Acoust. Sot. Am. 31: 1595-1605.
Tobias, J. V., and S. Zerlin (1959) Laterahzation threshold as a function of stimulus duration. J. Acoust. Sot. Am. 31: 1591- 1594.
Wolbarsht, M. L., E. F. MacNichol, and M. G. Wagner (1960) Glass insulated platinum microelectrode. Science 132: 1309- 1310.
Woodworth, R. S. (1938) Experimental Psychology, Holt, Ri- nehart & Winston, Inc., New York.