Embed Size (px)
Citation preview
IEEE Symposium on Biological Data Visualization 2013October 13 - 14, Atlanta, Georgia, USA 978-1-4799-1659-7/13/$31.00 ©2013 IEEE
Accepted for publication by IEEE. ©2013 IEEE. Personal use of this material is permitted. Permission from IEEE must be obtained for all other uses, in any current or future media, including reprinting/republishing this material for advertising or promotional purposes, creating new collective works, for resale or redistribution to servers or lists, or reuse of any copyrighted component of this work in other works.
neuroMap - Interactive Graph-Visualization of the Fruit Fly’s Neural CircuitJohannes Sorger∗ Katja Buhler† Florian Schulze‡ Tianxiao Liu§ Barry Dickson¶
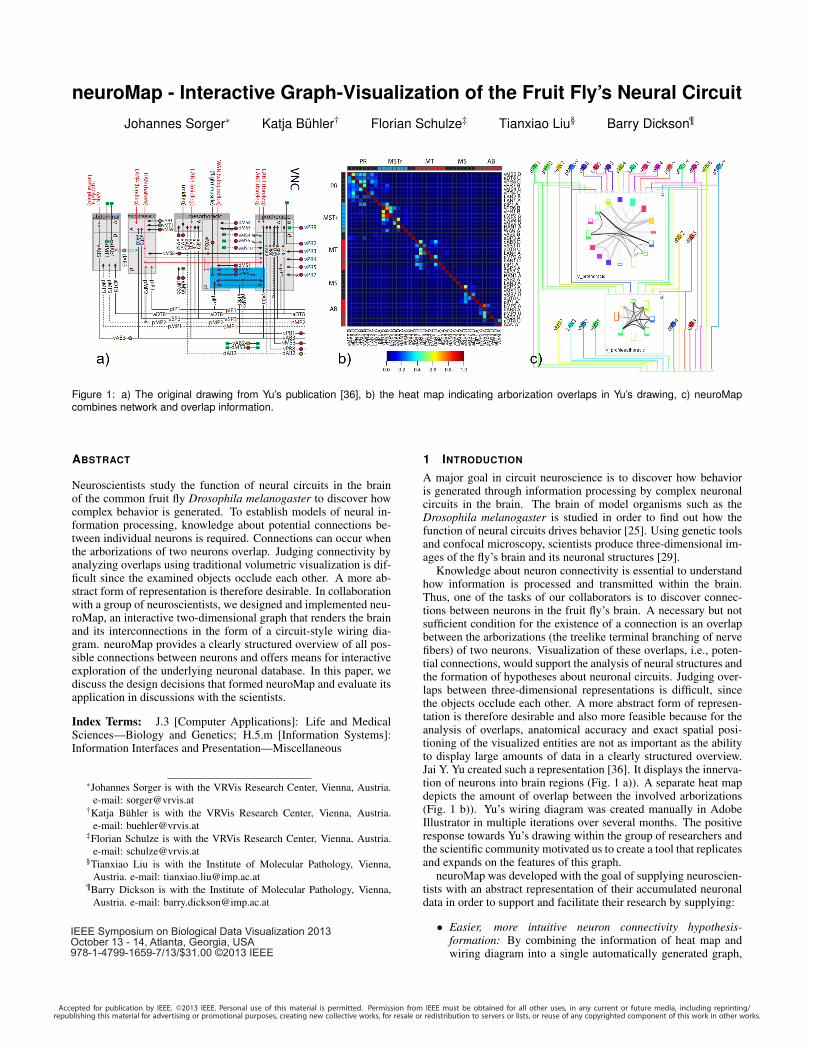
Figure 1: a) The original drawing from Yu’s publication [36], b) the heat map indicating arborization overlaps in Yu’s drawing, c) neuroMapcombines network and overlap information.
ABSTRACT
Neuroscientists study the function of neural circuits in the brainof the common fruit fly Drosophila melanogaster to discover howcomplex behavior is generated. To establish models of neural in-formation processing, knowledge about potential connections be-tween individual neurons is required. Connections can occur whenthe arborizations of two neurons overlap. Judging connectivity byanalyzing overlaps using traditional volumetric visualization is dif-ficult since the examined objects occlude each other. A more ab-stract form of representation is therefore desirable. In collaborationwith a group of neuroscientists, we designed and implemented neu-roMap, an interactive two-dimensional graph that renders the brainand its interconnections in the form of a circuit-style wiring dia-gram. neuroMap provides a clearly structured overview of all pos-sible connections between neurons and offers means for interactiveexploration of the underlying neuronal database. In this paper, wediscuss the design decisions that formed neuroMap and evaluate itsapplication in discussions with the scientists.
Index Terms: J.3 [Computer Applications]: Life and MedicalSciences—Biology and Genetics; H.5.m [Information Systems]:Information Interfaces and Presentation—Miscellaneous
∗Johannes Sorger is with the VRVis Research Center, Vienna, Austria.e-mail: [email protected]
†Katja Buhler is with the VRVis Research Center, Vienna, Austria.e-mail: [email protected]
‡Florian Schulze is with the VRVis Research Center, Vienna, Austria.e-mail: [email protected]
§Tianxiao Liu is with the Institute of Molecular Pathology, Vienna,Austria. e-mail: [email protected]
¶Barry Dickson is with the Institute of Molecular Pathology, Vienna,Austria. e-mail: [email protected]
1 INTRODUCTION
A major goal in circuit neuroscience is to discover how behavioris generated through information processing by complex neuronalcircuits in the brain. The brain of model organisms such as theDrosophila melanogaster is studied in order to find out how thefunction of neural circuits drives behavior [25]. Using genetic toolsand confocal microscopy, scientists produce three-dimensional im-ages of the fly’s brain and its neuronal structures [29].
Knowledge about neuron connectivity is essential to understandhow information is processed and transmitted within the brain.Thus, one of the tasks of our collaborators is to discover connec-tions between neurons in the fruit fly’s brain. A necessary but notsufficient condition for the existence of a connection is an overlapbetween the arborizations (the treelike terminal branching of nervefibers) of two neurons. Visualization of these overlaps, i.e., poten-tial connections, would support the analysis of neural structures andthe formation of hypotheses about neuronal circuits. Judging over-laps between three-dimensional representations is difficult, sincethe objects occlude each other. A more abstract form of represen-tation is therefore desirable and also more feasible because for theanalysis of overlaps, anatomical accuracy and exact spatial posi-tioning of the visualized entities are not as important as the abilityto display large amounts of data in a clearly structured overview.Jai Y. Yu created such a representation [36]. It displays the innerva-tion of neurons into brain regions (Fig. 1 a)). A separate heat mapdepicts the amount of overlap between the involved arborizations(Fig. 1 b)). Yu’s wiring diagram was created manually in AdobeIllustrator in multiple iterations over several months. The positiveresponse towards Yu’s drawing within the group of researchers andthe scientific community motivated us to create a tool that replicatesand expands on the features of this graph.
neuroMap was developed with the goal of supplying neuroscien-tists with an abstract representation of their accumulated neuronaldata in order to support and facilitate their research by supplying:
• Easier, more intuitive neuron connectivity hypothesis-formation: By combining the information of heat map andwiring diagram into a single automatically generated graph,
neuroMap visualizes arborizations as nodes and the poten-tial connections between them as edges, thus letting the usergrasp all potential connections of the analyzed data at a singleglance (Fig. 1 c)).
• Visual exploration of the accumulated neuronal data: Fea-tures such as arborization overlap queries, filter mechanisms,and the merging of brain regions allow the user to extend thegraph in directions of interest, to focus on important detailsand to filter out less relevant information, thus enabling in-teractive exploration of the neuronal database from within thevisualization.
• Fast generation of neural circuit graphics for presentationpurposes: Researchers use diagrams of neural structuresto demonstrate scientific findings in papers or presentations[36, 18, 35]. Creating these diagrams manually is a laborious,time-consuming task. neuroMap generates these structuresautomatically while offering a variety of layout algorithms toachieve results that are meaningful and visually pleasing.
Using two-dimensional graphs to visualize biological networks isnot an entirely new idea [15]. Nevertheless, there are still openproblems in biological network visualization, as stated by Albrechtet al. [1]. Problems relevant to our approach include the follow-ing: the visualization of multiple attributes (object type, overlapamount, gender, neuron association), location constraints (assign-ment of nodes to specific brain regions), visualization of flows andpaths (highlighting of related entities). Existing tools tackle someof these problems, but not in a combination that is desirable for ourapproach, as discussed in section 3. This, along with the require-ment to integrate the visualization into an existing framework, ledto the development of our solution.
This paper introduces and evaluates a novel approach for visu-alizing and exploring potential neuronal connections. neuroMap isthe first interactive tool that enables visualization and exploration ofneural networks at the arborization level with overlap informationthat indicates the probability of a connection.
2 BIOLOGICAL BACKGROUND
2.1 Research TasksThe neuroscientist aims to understand information-processing andstorage within the nervous system. Neural functions are criticallydependent on neural structure, particularly on the pattern of con-nections between individual neurons. However, the nervous sys-tem typically contains hundreds to billions of individual neuronswith little stereotype at the cellular level. Some invertebrates, suchas Drosophila melanogaster and C. elegans, have relatively smalland stereotyped nervous systems, making it possible to define theirneuronal organization at the cellular level. Knowing the cellularorganization of the nervous system, the investigator can begin toformulate and test hypotheses regarding the functions of individ-ual neurons, both at the behavioral level and in terms of the neu-ral computations they perform. However, the complex architectureof the nervous system, even for these simple invertebrate models,makes visual representations of neuronal connectivity particularlychallenging. A task of our collaborating group of scientists is tofind the neuron relay for a specific sensory input. Gustatory andolfactory sensory inputs are known to play important roles in thefly’s courtship behavior. After determining primary (sensory) neu-rons and secondary neurons, which relay the information from theprimary neurons, the next step is to identify the third order of neu-rons in this circuit. Based on the anatomy of neurons, the scientistsformulate functional models that can be tested using the genetictools available in these organisms to directly monitor or manipulateneuronal activity.
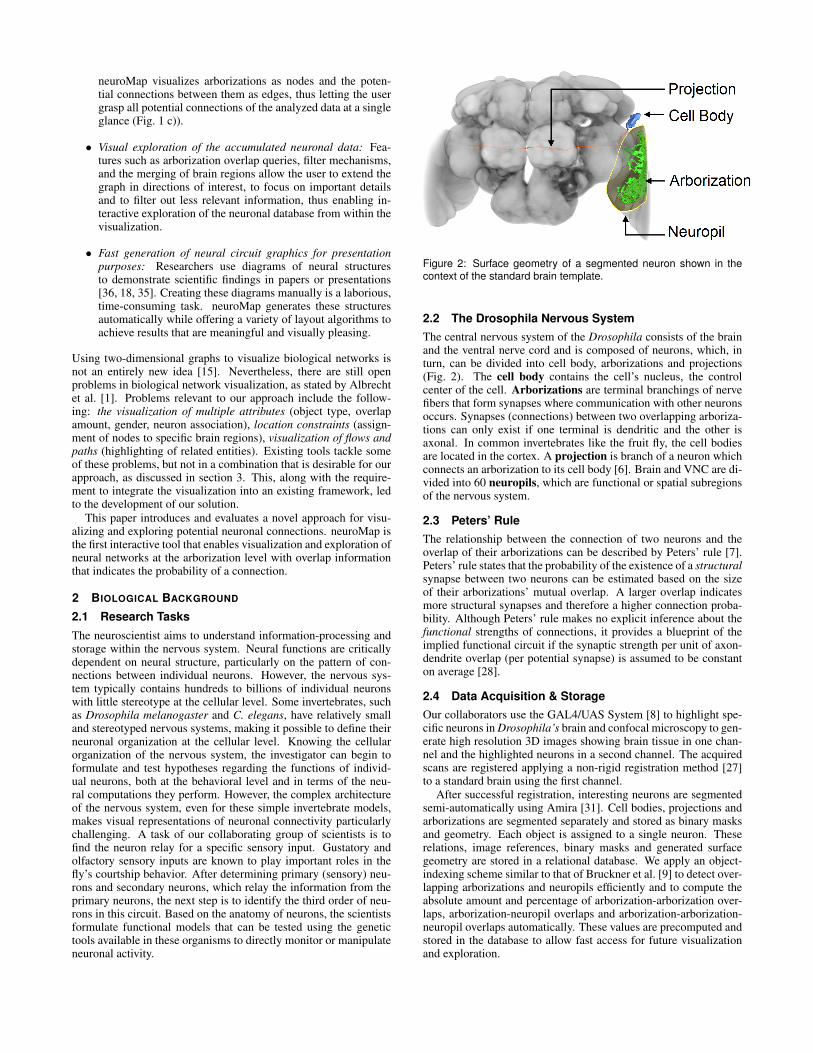
Figure 2: Surface geometry of a segmented neuron shown in thecontext of the standard brain template.
2.2 The Drosophila Nervous SystemThe central nervous system of the Drosophila consists of the brainand the ventral nerve cord and is composed of neurons, which, inturn, can be divided into cell body, arborizations and projections(Fig. 2). The cell body contains the cell’s nucleus, the controlcenter of the cell. Arborizations are terminal branchings of nervefibers that form synapses where communication with other neuronsoccurs. Synapses (connections) between two overlapping arboriza-tions can only exist if one terminal is dendritic and the other isaxonal. In common invertebrates like the fruit fly, the cell bodiesare located in the cortex. A projection is branch of a neuron whichconnects an arborization to its cell body [6]. Brain and VNC are di-vided into 60 neuropils, which are functional or spatial subregionsof the nervous system.
2.3 Peters’ RuleThe relationship between the connection of two neurons and theoverlap of their arborizations can be described by Peters’ rule [7].Peters’ rule states that the probability of the existence of a structuralsynapse between two neurons can be estimated based on the sizeof their arborizations’ mutual overlap. A larger overlap indicatesmore structural synapses and therefore a higher connection proba-bility. Although Peters’ rule makes no explicit inference about thefunctional strengths of connections, it provides a blueprint of theimplied functional circuit if the synaptic strength per unit of axon-dendrite overlap (per potential synapse) is assumed to be constanton average [28].
2.4 Data Acquisition & StorageOur collaborators use the GAL4/UAS System [8] to highlight spe-cific neurons in Drosophila’s brain and confocal microscopy to gen-erate high resolution 3D images showing brain tissue in one chan-nel and the highlighted neurons in a second channel. The acquiredscans are registered applying a non-rigid registration method [27]to a standard brain using the first channel.
After successful registration, interesting neurons are segmentedsemi-automatically using Amira [31]. Cell bodies, projections andarborizations are segmented separately and stored as binary masksand geometry. Each object is assigned to a single neuron. Theserelations, image references, binary masks and generated surfacegeometry are stored in a relational database. We apply an object-indexing scheme similar to that of Bruckner et al. [9] to detect over-lapping arborizations and neuropils efficiently and to compute theabsolute amount and percentage of arborization-arborization over-laps, arborization-neuropil overlaps and arborization-arborization-neuropil overlaps automatically. These values are precomputed andstored in the database to allow fast access for future visualizationand exploration.
2.5 Existing InfrastructureOur collaborators’ visualization and data-mining framework pro-vides interactive 3D visualization for volume and geometry data,and parallel coordinates and heat maps for data analysis. To selectdata for display and analysis, two paths are provided: a databaseinterface for defining semantic queries and a visual query interfacefor exploration based on spatial relationships. Query results can beloaded into the framework’s workspace from which they can be as-signed to different views. However, for the task of connectivity hy-pothesis formation, the available features are not optimally suited.Judging overlaps in 3D is infeasible due to occlusion. The avail-able 2D visualizations are static (heat map) or too abstract (parallelcoordinates) for intuitive exploration of overlaps.
2.6 Yu’s DrawingThe motivation for and starting point of neuroMap’s design processwas Yu’s wiring diagram of a courtship behavior-related neural cir-cuit (Fig. 1 a)) [36]. The drawing depicts neural pathways of agroup of neurons that extend from sensory input to motor output ina schematic overview. The diagram was used to present the publica-tion’s findings to the scientific community and to inspire hypothesisformation about potential functional neural connections. Comparedto traditional 3D visualization, our collaborators regarded Yu’s di-agram as an improved way of viewing the brain’s wiring becauseit offers more information at a glance through its abstraction of theexamined data.
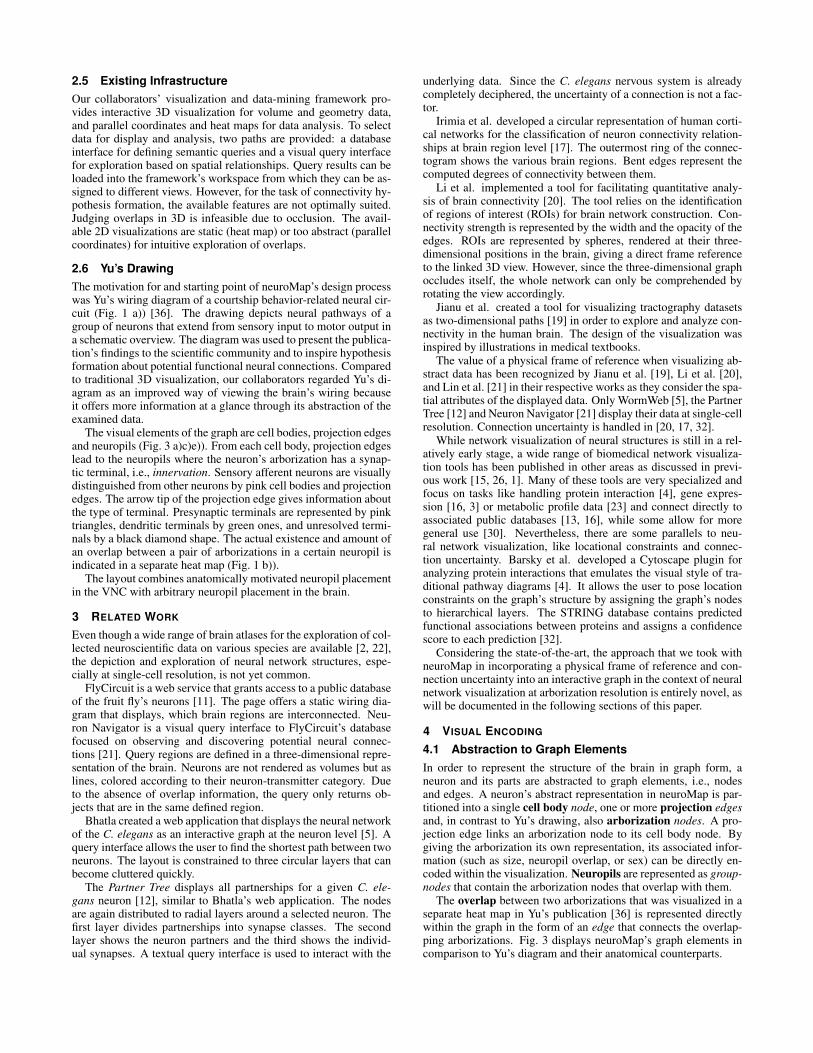
The visual elements of the graph are cell bodies, projection edgesand neuropils (Fig. 3 a)c)e)). From each cell body, projection edgeslead to the neuropils where the neuron’s arborization has a synap-tic terminal, i.e., innervation. Sensory afferent neurons are visuallydistinguished from other neurons by pink cell bodies and projectionedges. The arrow tip of the projection edge gives information aboutthe type of terminal. Presynaptic terminals are represented by pinktriangles, dendritic terminals by green ones, and unresolved termi-nals by a black diamond shape. The actual existence and amount ofan overlap between a pair of arborizations in a certain neuropil isindicated in a separate heat map (Fig. 1 b)).
The layout combines anatomically motivated neuropil placementin the VNC with arbitrary neuropil placement in the brain.
3 RELATED WORK
Even though a wide range of brain atlases for the exploration of col-lected neuroscientific data on various species are available [2, 22],the depiction and exploration of neural network structures, espe-cially at single-cell resolution, is not yet common.
FlyCircuit is a web service that grants access to a public databaseof the fruit fly’s neurons [11]. The page offers a static wiring dia-gram that displays, which brain regions are interconnected. Neu-ron Navigator is a visual query interface to FlyCircuit’s databasefocused on observing and discovering potential neural connec-tions [21]. Query regions are defined in a three-dimensional repre-sentation of the brain. Neurons are not rendered as volumes but aslines, colored according to their neuron-transmitter category. Dueto the absence of overlap information, the query only returns ob-jects that are in the same defined region.
Bhatla created a web application that displays the neural networkof the C. elegans as an interactive graph at the neuron level [5]. Aquery interface allows the user to find the shortest path between twoneurons. The layout is constrained to three circular layers that canbecome cluttered quickly.
The Partner Tree displays all partnerships for a given C. ele-gans neuron [12], similar to Bhatla’s web application. The nodesare again distributed to radial layers around a selected neuron. Thefirst layer divides partnerships into synapse classes. The secondlayer shows the neuron partners and the third shows the individ-ual synapses. A textual query interface is used to interact with the
underlying data. Since the C. elegans nervous system is alreadycompletely deciphered, the uncertainty of a connection is not a fac-tor.
Irimia et al. developed a circular representation of human corti-cal networks for the classification of neuron connectivity relation-ships at brain region level [17]. The outermost ring of the connec-togram shows the various brain regions. Bent edges represent thecomputed degrees of connectivity between them.
Li et al. implemented a tool for facilitating quantitative analy-sis of brain connectivity [20]. The tool relies on the identificationof regions of interest (ROIs) for brain network construction. Con-nectivity strength is represented by the width and the opacity of theedges. ROIs are represented by spheres, rendered at their three-dimensional positions in the brain, giving a direct frame referenceto the linked 3D view. However, since the three-dimensional graphoccludes itself, the whole network can only be comprehended byrotating the view accordingly.
Jianu et al. created a tool for visualizing tractography datasetsas two-dimensional paths [19] in order to explore and analyze con-nectivity in the human brain. The design of the visualization wasinspired by illustrations in medical textbooks.
The value of a physical frame of reference when visualizing ab-stract data has been recognized by Jianu et al. [19], Li et al. [20],and Lin et al. [21] in their respective works as they consider the spa-tial attributes of the displayed data. Only WormWeb [5], the PartnerTree [12] and Neuron Navigator [21] display their data at single-cellresolution. Connection uncertainty is handled in [20, 17, 32].
While network visualization of neural structures is still in a rel-atively early stage, a wide range of biomedical network visualiza-tion tools has been published in other areas as discussed in previ-ous work [15, 26, 1]. Many of these tools are very specialized andfocus on tasks like handling protein interaction [4], gene expres-sion [16, 3] or metabolic profile data [23] and connect directly toassociated public databases [13, 16], while some allow for moregeneral use [30]. Nevertheless, there are some parallels to neu-ral network visualization, like locational constraints and connec-tion uncertainty. Barsky et al. developed a Cytoscape plugin foranalyzing protein interactions that emulates the visual style of tra-ditional pathway diagrams [4]. It allows the user to pose locationconstraints on the graph’s structure by assigning the graph’s nodesto hierarchical layers. The STRING database contains predictedfunctional associations between proteins and assigns a confidencescore to each prediction [32].
Considering the state-of-the-art, the approach that we took withneuroMap in incorporating a physical frame of reference and con-nection uncertainty into an interactive graph in the context of neuralnetwork visualization at arborization resolution is entirely novel, aswill be documented in the following sections of this paper.
4 VISUAL ENCODING
4.1 Abstraction to Graph ElementsIn order to represent the structure of the brain in graph form, aneuron and its parts are abstracted to graph elements, i.e., nodesand edges. A neuron’s abstract representation in neuroMap is par-titioned into a single cell body node, one or more projection edgesand, in contrast to Yu’s drawing, also arborization nodes. A pro-jection edge links an arborization node to its cell body node. Bygiving the arborization its own representation, its associated infor-mation (such as size, neuropil overlap, or sex) can be directly en-coded within the visualization. Neuropils are represented as group-nodes that contain the arborization nodes that overlap with them.
The overlap between two arborizations that was visualized in aseparate heat map in Yu’s publication [36] is represented directlywithin the graph in the form of an edge that connects the overlap-ping arborizations. Fig. 3 displays neuroMap’s graph elements incomparison to Yu’s diagram and their anatomical counterparts.
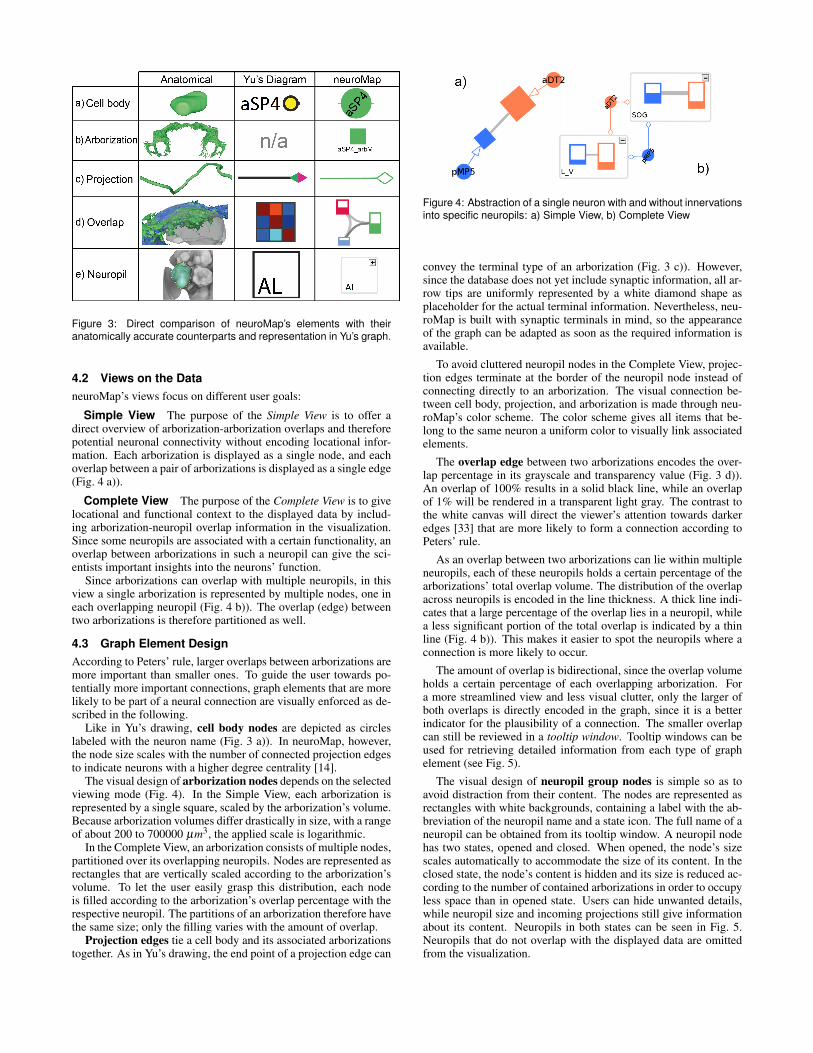
Figure 3: Direct comparison of neuroMap’s elements with theiranatomically accurate counterparts and representation in Yu’s graph.
4.2 Views on the DataneuroMap’s views focus on different user goals:
Simple View The purpose of the Simple View is to offer adirect overview of arborization-arborization overlaps and thereforepotential neuronal connectivity without encoding locational infor-mation. Each arborization is displayed as a single node, and eachoverlap between a pair of arborizations is displayed as a single edge(Fig. 4 a)).
Complete View The purpose of the Complete View is to givelocational and functional context to the displayed data by includ-ing arborization-neuropil overlap information in the visualization.Since some neuropils are associated with a certain functionality, anoverlap between arborizations in such a neuropil can give the sci-entists important insights into the neurons’ function.
Since arborizations can overlap with multiple neuropils, in thisview a single arborization is represented by multiple nodes, one ineach overlapping neuropil (Fig. 4 b)). The overlap (edge) betweentwo arborizations is therefore partitioned as well.
4.3 Graph Element DesignAccording to Peters’ rule, larger overlaps between arborizations aremore important than smaller ones. To guide the user towards po-tentially more important connections, graph elements that are morelikely to be part of a neural connection are visually enforced as de-scribed in the following.
Like in Yu’s drawing, cell body nodes are depicted as circleslabeled with the neuron name (Fig. 3 a)). In neuroMap, however,the node size scales with the number of connected projection edgesto indicate neurons with a higher degree centrality [14].
The visual design of arborization nodes depends on the selectedviewing mode (Fig. 4). In the Simple View, each arborization isrepresented by a single square, scaled by the arborization’s volume.Because arborization volumes differ drastically in size, with a rangeof about 200 to 700000 µm3, the applied scale is logarithmic.
In the Complete View, an arborization consists of multiple nodes,partitioned over its overlapping neuropils. Nodes are represented asrectangles that are vertically scaled according to the arborization’svolume. To let the user easily grasp this distribution, each nodeis filled according to the arborization’s overlap percentage with therespective neuropil. The partitions of an arborization therefore havethe same size; only the filling varies with the amount of overlap.
Projection edges tie a cell body and its associated arborizationstogether. As in Yu’s drawing, the end point of a projection edge can
Figure 4: Abstraction of a single neuron with and without innervationsinto specific neuropils: a) Simple View, b) Complete View
convey the terminal type of an arborization (Fig. 3 c)). However,since the database does not yet include synaptic information, all ar-row tips are uniformly represented by a white diamond shape asplaceholder for the actual terminal information. Nevertheless, neu-roMap is built with synaptic terminals in mind, so the appearanceof the graph can be adapted as soon as the required information isavailable.
To avoid cluttered neuropil nodes in the Complete View, projec-tion edges terminate at the border of the neuropil node instead ofconnecting directly to an arborization. The visual connection be-tween cell body, projection, and arborization is made through neu-roMap’s color scheme. The color scheme gives all items that be-long to the same neuron a uniform color to visually link associatedelements.
The overlap edge between two arborizations encodes the over-lap percentage in its grayscale and transparency value (Fig. 3 d)).An overlap of 100% results in a solid black line, while an overlapof 1% will be rendered in a transparent light gray. The contrast tothe white canvas will direct the viewer’s attention towards darkeredges [33] that are more likely to form a connection according toPeters’ rule.
As an overlap between two arborizations can lie within multipleneuropils, each of these neuropils holds a certain percentage of thearborizations’ total overlap volume. The distribution of the overlapacross neuropils is encoded in the line thickness. A thick line indi-cates that a large percentage of the overlap lies in a neuropil, whilea less significant portion of the total overlap is indicated by a thinline (Fig. 4 b)). This makes it easier to spot the neuropils where aconnection is more likely to occur.
The amount of overlap is bidirectional, since the overlap volumeholds a certain percentage of each overlapping arborization. Fora more streamlined view and less visual clutter, only the larger ofboth overlaps is directly encoded in the graph, since it is a betterindicator for the plausibility of a connection. The smaller overlapcan still be reviewed in a tooltip window. Tooltip windows can beused for retrieving detailed information from each type of graphelement (see Fig. 5).
The visual design of neuropil group nodes is simple so as toavoid distraction from their content. The nodes are represented asrectangles with white backgrounds, containing a label with the ab-breviation of the neuropil name and a state icon. The full name of aneuropil can be obtained from its tooltip window. A neuropil nodehas two states, opened and closed. When opened, the node’s sizescales automatically to accommodate the size of its content. In theclosed state, the node’s content is hidden and its size is reduced ac-cording to the number of contained arborizations in order to occupyless space than in opened state. Users can hide unwanted details,while neuropil size and incoming projections still give informationabout its content. Neuropils in both states can be seen in Fig. 5.Neuropils that do not overlap with the displayed data are omittedfrom the visualization.
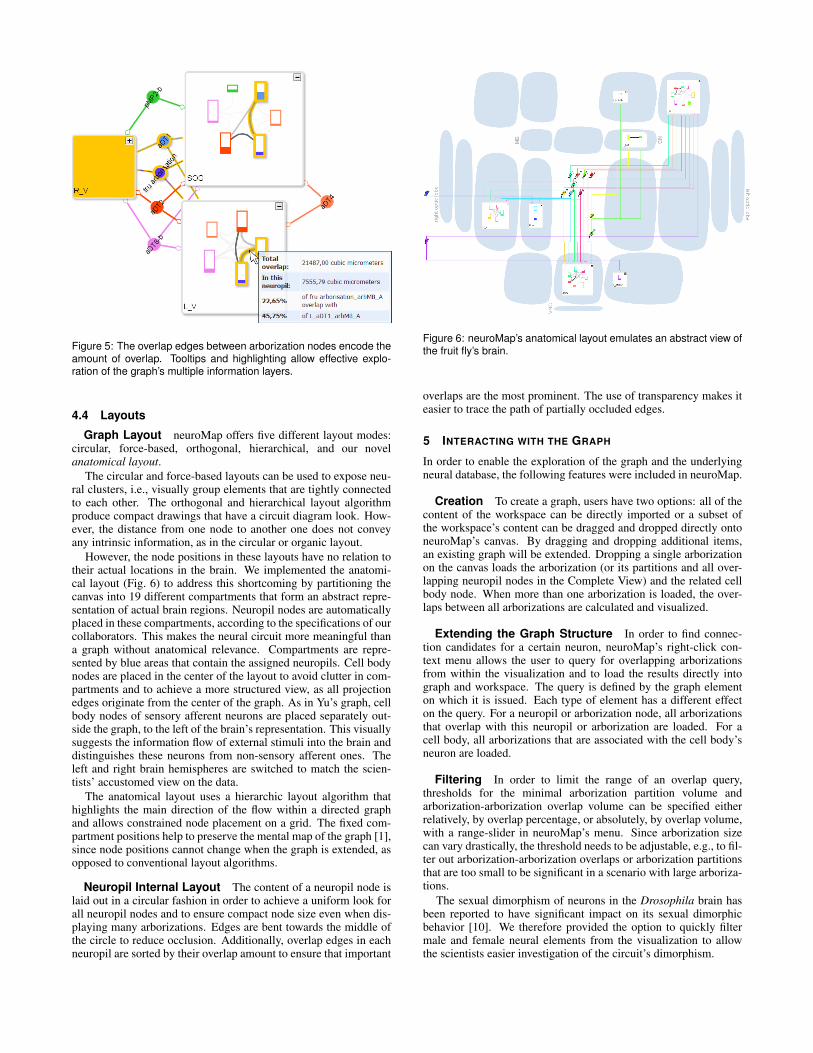
Figure 5: The overlap edges between arborization nodes encode theamount of overlap. Tooltips and highlighting allow effective explo-ration of the graph’s multiple information layers.
4.4 Layouts
Graph Layout neuroMap offers five different layout modes:circular, force-based, orthogonal, hierarchical, and our novelanatomical layout.
The circular and force-based layouts can be used to expose neu-ral clusters, i.e., visually group elements that are tightly connectedto each other. The orthogonal and hierarchical layout algorithmproduce compact drawings that have a circuit diagram look. How-ever, the distance from one node to another one does not conveyany intrinsic information, as in the circular or organic layout.
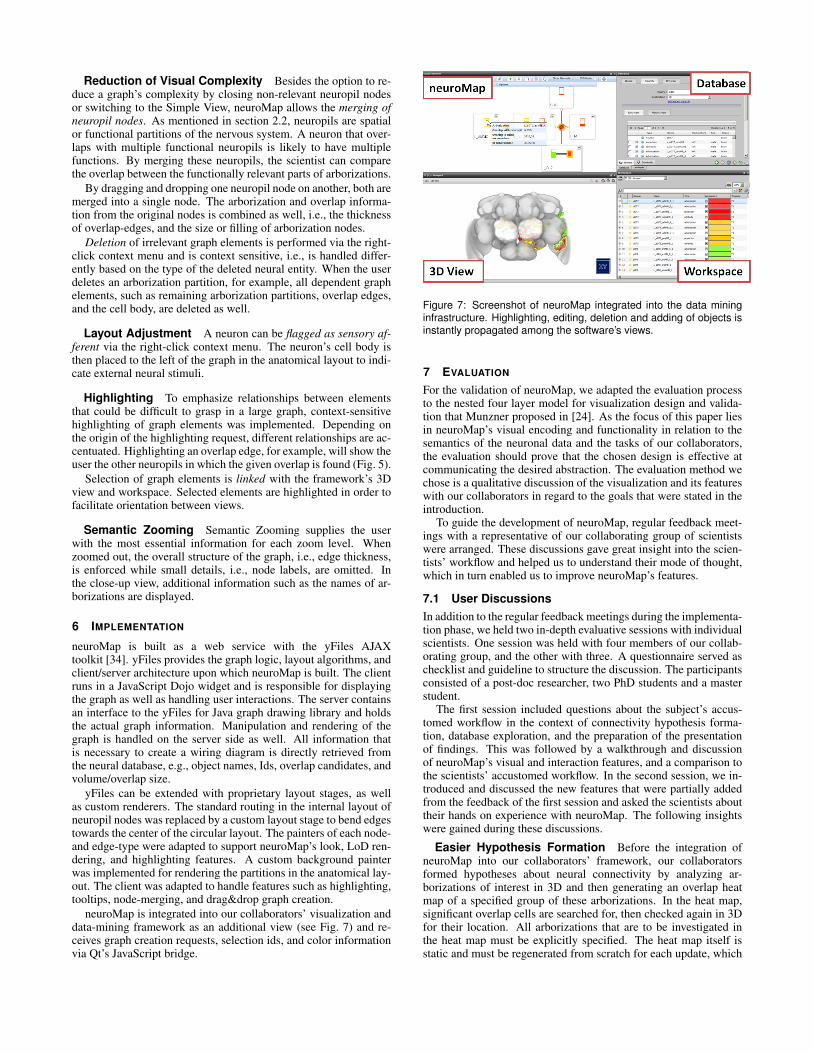
However, the node positions in these layouts have no relation totheir actual locations in the brain. We implemented the anatomi-cal layout (Fig. 6) to address this shortcoming by partitioning thecanvas into 19 different compartments that form an abstract repre-sentation of actual brain regions. Neuropil nodes are automaticallyplaced in these compartments, according to the specifications of ourcollaborators. This makes the neural circuit more meaningful thana graph without anatomical relevance. Compartments are repre-sented by blue areas that contain the assigned neuropils. Cell bodynodes are placed in the center of the layout to avoid clutter in com-partments and to achieve a more structured view, as all projectionedges originate from the center of the graph. As in Yu’s graph, cellbody nodes of sensory afferent neurons are placed separately out-side the graph, to the left of the brain’s representation. This visuallysuggests the information flow of external stimuli into the brain anddistinguishes these neurons from non-sensory afferent ones. Theleft and right brain hemispheres are switched to match the scien-tists’ accustomed view on the data.
The anatomical layout uses a hierarchic layout algorithm thathighlights the main direction of the flow within a directed graphand allows constrained node placement on a grid. The fixed com-partment positions help to preserve the mental map of the graph [1],since node positions cannot change when the graph is extended, asopposed to conventional layout algorithms.
Neuropil Internal Layout The content of a neuropil node islaid out in a circular fashion in order to achieve a uniform look forall neuropil nodes and to ensure compact node size even when dis-playing many arborizations. Edges are bent towards the middle ofthe circle to reduce occlusion. Additionally, overlap edges in eachneuropil are sorted by their overlap amount to ensure that important
Figure 6: neuroMap’s anatomical layout emulates an abstract view ofthe fruit fly’s brain.
overlaps are the most prominent. The use of transparency makes iteasier to trace the path of partially occluded edges.
5 INTERACTING WITH THE GRAPH
In order to enable the exploration of the graph and the underlyingneural database, the following features were included in neuroMap.
Creation To create a graph, users have two options: all of thecontent of the workspace can be directly imported or a subset ofthe workspace’s content can be dragged and dropped directly ontoneuroMap’s canvas. By dragging and dropping additional items,an existing graph will be extended. Dropping a single arborizationon the canvas loads the arborization (or its partitions and all over-lapping neuropil nodes in the Complete View) and the related cellbody node. When more than one arborization is loaded, the over-laps between all arborizations are calculated and visualized.
Extending the Graph Structure In order to find connec-tion candidates for a certain neuron, neuroMap’s right-click con-text menu allows the user to query for overlapping arborizationsfrom within the visualization and to load the results directly intograph and workspace. The query is defined by the graph elementon which it is issued. Each type of element has a different effecton the query. For a neuropil or arborization node, all arborizationsthat overlap with this neuropil or arborization are loaded. For acell body, all arborizations that are associated with the cell body’sneuron are loaded.
Filtering In order to limit the range of an overlap query,thresholds for the minimal arborization partition volume andarborization-arborization overlap volume can be specified eitherrelatively, by overlap percentage, or absolutely, by overlap volume,with a range-slider in neuroMap’s menu. Since arborization sizecan vary drastically, the threshold needs to be adjustable, e.g., to fil-ter out arborization-arborization overlaps or arborization partitionsthat are too small to be significant in a scenario with large arboriza-tions.
The sexual dimorphism of neurons in the Drosophila brain hasbeen reported to have significant impact on its sexual dimorphicbehavior [10]. We therefore provided the option to quickly filtermale and female neural elements from the visualization to allowthe scientists easier investigation of the circuit’s dimorphism.
Reduction of Visual Complexity Besides the option to re-duce a graph’s complexity by closing non-relevant neuropil nodesor switching to the Simple View, neuroMap allows the merging ofneuropil nodes. As mentioned in section 2.2, neuropils are spatialor functional partitions of the nervous system. A neuron that over-laps with multiple functional neuropils is likely to have multiplefunctions. By merging these neuropils, the scientist can comparethe overlap between the functionally relevant parts of arborizations.
By dragging and dropping one neuropil node on another, both aremerged into a single node. The arborization and overlap informa-tion from the original nodes is combined as well, i.e., the thicknessof overlap-edges, and the size or filling of arborization nodes.
Deletion of irrelevant graph elements is performed via the right-click context menu and is context sensitive, i.e., is handled differ-ently based on the type of the deleted neural entity. When the userdeletes an arborization partition, for example, all dependent graphelements, such as remaining arborization partitions, overlap edges,and the cell body, are deleted as well.
Layout Adjustment A neuron can be flagged as sensory af-ferent via the right-click context menu. The neuron’s cell body isthen placed to the left of the graph in the anatomical layout to indi-cate external neural stimuli.
Highlighting To emphasize relationships between elementsthat could be difficult to grasp in a large graph, context-sensitivehighlighting of graph elements was implemented. Depending onthe origin of the highlighting request, different relationships are ac-centuated. Highlighting an overlap edge, for example, will show theuser the other neuropils in which the given overlap is found (Fig. 5).
Selection of graph elements is linked with the framework’s 3Dview and workspace. Selected elements are highlighted in order tofacilitate orientation between views.
Semantic Zooming Semantic Zooming supplies the userwith the most essential information for each zoom level. Whenzoomed out, the overall structure of the graph, i.e., edge thickness,is enforced while small details, i.e., node labels, are omitted. Inthe close-up view, additional information such as the names of ar-borizations are displayed.
6 IMPLEMENTATION
neuroMap is built as a web service with the yFiles AJAXtoolkit [34]. yFiles provides the graph logic, layout algorithms, andclient/server architecture upon which neuroMap is built. The clientruns in a JavaScript Dojo widget and is responsible for displayingthe graph as well as handling user interactions. The server containsan interface to the yFiles for Java graph drawing library and holdsthe actual graph information. Manipulation and rendering of thegraph is handled on the server side as well. All information thatis necessary to create a wiring diagram is directly retrieved fromthe neural database, e.g., object names, Ids, overlap candidates, andvolume/overlap size.
yFiles can be extended with proprietary layout stages, as wellas custom renderers. The standard routing in the internal layout ofneuropil nodes was replaced by a custom layout stage to bend edgestowards the center of the circular layout. The painters of each node-and edge-type were adapted to support neuroMap’s look, LoD ren-dering, and highlighting features. A custom background painterwas implemented for rendering the partitions in the anatomical lay-out. The client was adapted to handle features such as highlighting,tooltips, node-merging, and drag&drop graph creation.
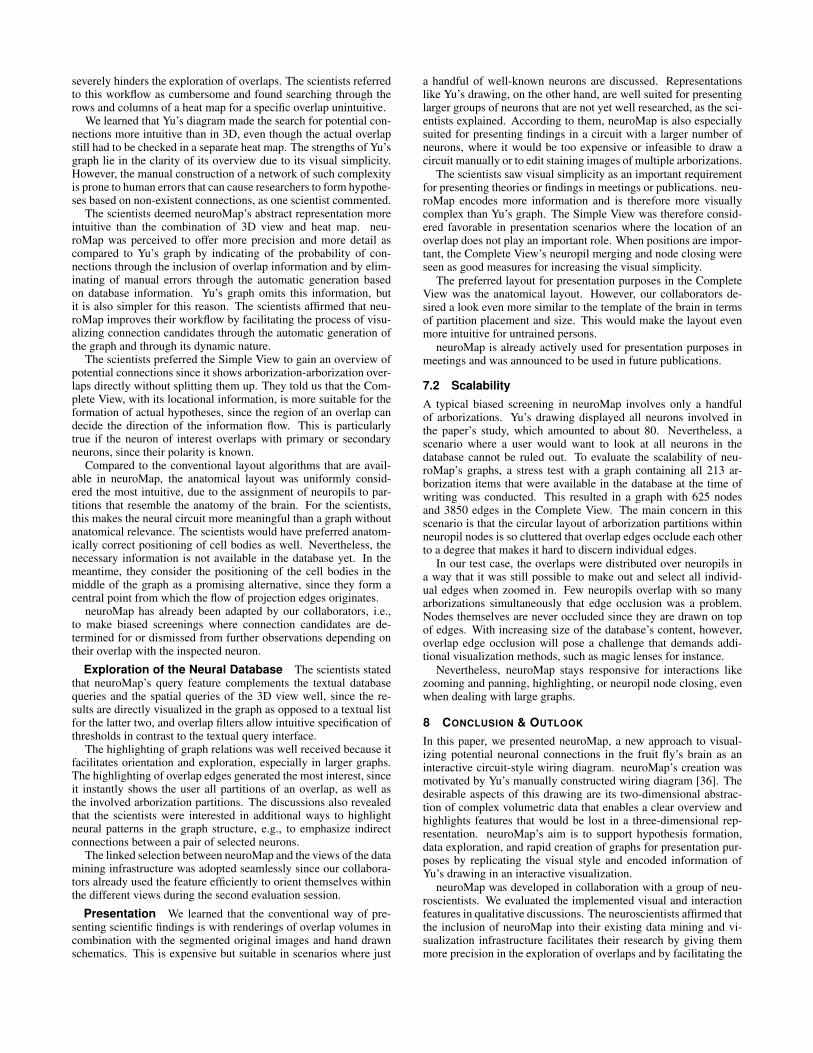
neuroMap is integrated into our collaborators’ visualization anddata-mining framework as an additional view (see Fig. 7) and re-ceives graph creation requests, selection ids, and color informationvia Qt’s JavaScript bridge.
Figure 7: Screenshot of neuroMap integrated into the data mininginfrastructure. Highlighting, editing, deletion and adding of objects isinstantly propagated among the software’s views.
7 EVALUATION
For the validation of neuroMap, we adapted the evaluation processto the nested four layer model for visualization design and valida-tion that Munzner proposed in [24]. As the focus of this paper liesin neuroMap’s visual encoding and functionality in relation to thesemantics of the neuronal data and the tasks of our collaborators,the evaluation should prove that the chosen design is effective atcommunicating the desired abstraction. The evaluation method wechose is a qualitative discussion of the visualization and its featureswith our collaborators in regard to the goals that were stated in theintroduction.
To guide the development of neuroMap, regular feedback meet-ings with a representative of our collaborating group of scientistswere arranged. These discussions gave great insight into the scien-tists’ workflow and helped us to understand their mode of thought,which in turn enabled us to improve neuroMap’s features.
7.1 User DiscussionsIn addition to the regular feedback meetings during the implementa-tion phase, we held two in-depth evaluative sessions with individualscientists. One session was held with four members of our collab-orating group, and the other with three. A questionnaire served aschecklist and guideline to structure the discussion. The participantsconsisted of a post-doc researcher, two PhD students and a masterstudent.
The first session included questions about the subject’s accus-tomed workflow in the context of connectivity hypothesis forma-tion, database exploration, and the preparation of the presentationof findings. This was followed by a walkthrough and discussionof neuroMap’s visual and interaction features, and a comparison tothe scientists’ accustomed workflow. In the second session, we in-troduced and discussed the new features that were partially addedfrom the feedback of the first session and asked the scientists abouttheir hands on experience with neuroMap. The following insightswere gained during these discussions.
Easier Hypothesis Formation Before the integration ofneuroMap into our collaborators’ framework, our collaboratorsformed hypotheses about neural connectivity by analyzing ar-borizations of interest in 3D and then generating an overlap heatmap of a specified group of these arborizations. In the heat map,significant overlap cells are searched for, then checked again in 3Dfor their location. All arborizations that are to be investigated inthe heat map must be explicitly specified. The heat map itself isstatic and must be regenerated from scratch for each update, which
severely hinders the exploration of overlaps. The scientists referredto this workflow as cumbersome and found searching through therows and columns of a heat map for a specific overlap unintuitive.
We learned that Yu’s diagram made the search for potential con-nections more intuitive than in 3D, even though the actual overlapstill had to be checked in a separate heat map. The strengths of Yu’sgraph lie in the clarity of its overview due to its visual simplicity.However, the manual construction of a network of such complexityis prone to human errors that can cause researchers to form hypothe-ses based on non-existent connections, as one scientist commented.
The scientists deemed neuroMap’s abstract representation moreintuitive than the combination of 3D view and heat map. neu-roMap was perceived to offer more precision and more detail ascompared to Yu’s graph by indicating of the probability of con-nections through the inclusion of overlap information and by elim-inating of manual errors through the automatic generation basedon database information. Yu’s graph omits this information, butit is also simpler for this reason. The scientists affirmed that neu-roMap improves their workflow by facilitating the process of visu-alizing connection candidates through the automatic generation ofthe graph and through its dynamic nature.
The scientists preferred the Simple View to gain an overview ofpotential connections since it shows arborization-arborization over-laps directly without splitting them up. They told us that the Com-plete View, with its locational information, is more suitable for theformation of actual hypotheses, since the region of an overlap candecide the direction of the information flow. This is particularlytrue if the neuron of interest overlaps with primary or secondaryneurons, since their polarity is known.
Compared to the conventional layout algorithms that are avail-able in neuroMap, the anatomical layout was uniformly consid-ered the most intuitive, due to the assignment of neuropils to par-titions that resemble the anatomy of the brain. For the scientists,this makes the neural circuit more meaningful than a graph withoutanatomical relevance. The scientists would have preferred anatom-ically correct positioning of cell bodies as well. Nevertheless, thenecessary information is not available in the database yet. In themeantime, they consider the positioning of the cell bodies in themiddle of the graph as a promising alternative, since they form acentral point from which the flow of projection edges originates.
neuroMap has already been adapted by our collaborators, i.e.,to make biased screenings where connection candidates are de-termined for or dismissed from further observations depending ontheir overlap with the inspected neuron.
Exploration of the Neural Database The scientists statedthat neuroMap’s query feature complements the textual databasequeries and the spatial queries of the 3D view well, since the re-sults are directly visualized in the graph as opposed to a textual listfor the latter two, and overlap filters allow intuitive specification ofthresholds in contrast to the textual query interface.
The highlighting of graph relations was well received because itfacilitates orientation and exploration, especially in larger graphs.The highlighting of overlap edges generated the most interest, sinceit instantly shows the user all partitions of an overlap, as well asthe involved arborization partitions. The discussions also revealedthat the scientists were interested in additional ways to highlightneural patterns in the graph structure, e.g., to emphasize indirectconnections between a pair of selected neurons.
The linked selection between neuroMap and the views of the datamining infrastructure was adopted seamlessly since our collabora-tors already used the feature efficiently to orient themselves withinthe different views during the second evaluation session.
Presentation We learned that the conventional way of pre-senting scientific findings is with renderings of overlap volumes incombination with the segmented original images and hand drawnschematics. This is expensive but suitable in scenarios where just
a handful of well-known neurons are discussed. Representationslike Yu’s drawing, on the other hand, are well suited for presentinglarger groups of neurons that are not yet well researched, as the sci-entists explained. According to them, neuroMap is also especiallysuited for presenting findings in a circuit with a larger number ofneurons, where it would be too expensive or infeasible to draw acircuit manually or to edit staining images of multiple arborizations.
The scientists saw visual simplicity as an important requirementfor presenting theories or findings in meetings or publications. neu-roMap encodes more information and is therefore more visuallycomplex than Yu’s graph. The Simple View was therefore consid-ered favorable in presentation scenarios where the location of anoverlap does not play an important role. When positions are impor-tant, the Complete View’s neuropil merging and node closing wereseen as good measures for increasing the visual simplicity.
The preferred layout for presentation purposes in the CompleteView was the anatomical layout. However, our collaborators de-sired a look even more similar to the template of the brain in termsof partition placement and size. This would make the layout evenmore intuitive for untrained persons.
neuroMap is already actively used for presentation purposes inmeetings and was announced to be used in future publications.
7.2 ScalabilityA typical biased screening in neuroMap involves only a handfulof arborizations. Yu’s drawing displayed all neurons involved inthe paper’s study, which amounted to about 80. Nevertheless, ascenario where a user would want to look at all neurons in thedatabase cannot be ruled out. To evaluate the scalability of neu-roMap’s graphs, a stress test with a graph containing all 213 ar-borization items that were available in the database at the time ofwriting was conducted. This resulted in a graph with 625 nodesand 3850 edges in the Complete View. The main concern in thisscenario is that the circular layout of arborization partitions withinneuropil nodes is so cluttered that overlap edges occlude each otherto a degree that makes it hard to discern individual edges.
In our test case, the overlaps were distributed over neuropils ina way that it was still possible to make out and select all individ-ual edges when zoomed in. Few neuropils overlap with so manyarborizations simultaneously that edge occlusion was a problem.Nodes themselves are never occluded since they are drawn on topof edges. With increasing size of the database’s content, however,overlap edge occlusion will pose a challenge that demands addi-tional visualization methods, such as magic lenses for instance.
Nevertheless, neuroMap stays responsive for interactions likezooming and panning, highlighting, or neuropil node closing, evenwhen dealing with large graphs.
8 CONCLUSION & OUTLOOK
In this paper, we presented neuroMap, a new approach to visual-izing potential neuronal connections in the fruit fly’s brain as aninteractive circuit-style wiring diagram. neuroMap’s creation wasmotivated by Yu’s manually constructed wiring diagram [36]. Thedesirable aspects of this drawing are its two-dimensional abstrac-tion of complex volumetric data that enables a clear overview andhighlights features that would be lost in a three-dimensional rep-resentation. neuroMap’s aim is to support hypothesis formation,data exploration, and rapid creation of graphs for presentation pur-poses by replicating the visual style and encoded information ofYu’s drawing in an interactive visualization.
neuroMap was developed in collaboration with a group of neu-roscientists. We evaluated the implemented visual and interactionfeatures in qualitative discussions. The neuroscientists affirmed thatthe inclusion of neuroMap into their existing data mining and vi-sualization infrastructure facilitates their research by giving themmore precision in the exploration of overlaps and by facilitating the
workflow required for finding these overlaps. The discussions indi-cated that the stated goal of providing means for easier hypothesisformation was met.
Future efforts will go towards improving the visual style of theanatomical layout to make it more suitable for publication purposes,ensuring the scalability of the content of neuropil nodes, and ex-ploring further highlighting options for graph structures. We planto release a public standalone version of neuroMap in the future.
The high interest and enthusiasm towards neuroMap show thatthere is potential in its deployment. We are excited to see how notonly our collaborators, but also the broader neuroscientific commu-nity can benefit from this novel way of looking at neuronal data.
ACKNOWLEDGEMENTS
This work was funded by a grant from the Competence Centersfor Excellent Technologies (COMET): 824190, and has been par-tially supported by a grant from the Austrian Science Fund (FWF):P24597.
REFERENCES
[1] M. Albrecht, A. Kerren, K. Klein, O. Kohlbacher, P. Mutzel, W. Paul,F. Schreiber, and M. Wybrow. On open problems in biological net-work visualization. In Graph Drawing, volume 5849, pages 256–267.Springer Berlin Heidelberg, 2010.
[2] J. Armstrong, K. Kaiser, A. Muller, K. Fischbach, N. Merchant,and N. Strausfeld. Flybrain, an On-Line Atlas and Database of theDrosophila Nervous System. Neuron, 15(1):17–20, 1995.
[3] C. Baker, M. Carpendale, P. Prusinkiewicz, and M. Surette. GeneVis:Visualization Tools for Genetic Regulatory Network Dynamics. InProceedings of the Conference on Visualization ’02, VIS ’02, pages243–250, Washington, DC, USA, 2002. IEEE Computer Society.
[4] A. Barsky, T. Munzner, J. Gardy, and R. Kincaid. Cerebral: Visu-alizing Multiple Experimental Conditions on a Graph with BiologicalContext. IEEE Transactions on Visualization and Computer Graphics,14:1253–1260, 2008.
[5] N. Bhatla. An Interactive Visualization of the C. Elegans Neural Net-work . http://wormweb.org/neuralnet, June 2009. Ac-cessed: 07/2012.
[6] J. E. Blankenship and B. Houck. Nervous System (Invertebrate).McGraw-Hill’s AccessScience, 2012.
[7] V. Braitenberg and A. Schuz. Cortex: Statistics and Geometry of Neu-ronal Connectivity, volume 249. Springer Berlin Heidelberg, 1998.
[8] A. Brand and N. Perrimon. Targeted Gene Expression as a Means ofAltering Cell Fates and Generating Dominant Phenotypes. Develop-ment, 118(2):401–415, 1993.
[9] S. Bruckner, V. Solteszova, M. Groller, J. Hladuvka, K. Buhler, J. Yu,and B. Dickson. Braingazer - visual queries for neurobiology re-search. Visualization and Computer Graphics, IEEE Transactions on,15(6):1497 –1504, nov.-dec. 2009.
[10] S. Cachero, A. D. Ostrovsky, J. Y. Yu, B. J. Dickson, and G. S. Jefferis.Sexual dimorphism in the fly brain. Current Biology, 20(18):1589 –1601, 2010.
[11] A. Chiang, C. Lin, C. Chuang, H. Chang, C. Hsieh, C. Yeh, C. Shih,J. Wu, G. Wang, and Y. Chen. Three-Dimensional Reconstruction ofBrain-Wide Wiring Networks in Drosophila at Single-Cell Resolution.Current Biology, 21(1):1–11, 2011.
[12] S. Cook, C. Brittin, D. Hall, and S. Emmons. The Worm WiringProject . http://www.wormwiring.org/, June 2012. Ac-cessed: 07/2012.
[13] E. Demir, O. Babur, U. Dogrusoz, A. Gursoy, G. Nisanci, R. Cetin-Atalay, and M. Ozturk. Patika: An Integrated Visual Environment forCollaborative Construction and Analysis of Cellular Pathways. Bioin-formatics, 18(7):996–1003, 2002.
[14] R. Diestel. Graph Theory. Springer Berlin Heidelberg, 2005.[15] N. Gehlenborg, S. O’Donoghue, N. Baliga, A. Goesmann, M. Hibbs,
H. Kitano, O. Kohlbacher, H. Neuweger, R. Schneider, D. Tenenbaum,and A. Gavin. Visualization of Omics Data for Systems Biology. Na-ture methods, 7(3 Suppl):56–68, Mar. 2010.
[16] Z. Hu, J. Hung, Y. Wang, Y. Chang, C. Huang, M. Huyck, andC. DeLisi. VisANT 3.5: Multi-Scale Network Visualization, Analysisand Inference Based on the Gene Ontology. Nucleic Acids Research,37(suppl 2):W115–W121, 2009.
[17] A. Irimia, M. Chambers, C. Torgerson, and J. Van Horn. Circular Rep-resentation of Human Cortical Networks for Subject and Population-Level Connectomic Visualization. NeuroImage, 60:1340–1351, 2012.
[18] M. Ito, N. Masuda, K. Shinomiya, K. Endo, and K. Ito. System-atic Analysis of Neural Projections Reveals Clonal Composition ofthe Drosophila Brain. Current Biology, 23(8):644 –655, March 2013.
[19] R. Jianu, C. Demiralp, and D. Laidlaw. Exploring Brain Connectivitywith Two-Dimensional Neural Maps. IEEE Transactions on Visual-ization and Computer Graphics, 18:978–987, 2012.
[20] K. Li, L. Guo, C. Faraco, H. Zhu, D. andChen, Y. Yuan, J. Lv, F. Deng,X. Jiang, T. Zhang, X. Hu, D. Zhang, and T. Miller, L.S.and Liu.Visual Analytics of Brain Networks. NeuroImage, 61(1):82–97, 2012.
[21] C. Lin, K. Tsai, S. Wang, C. Hsieh, H. Chang, and A. Chiang. TheNeuron Navigator: Exploring the Information Pathway Through theNeural Maze. Visualization Symposium, IEEE Pacific, 0:35–42, 2011.
[22] N. Milyaev, D. Osumi-Sutherland, S. Reeve, N. Burton, R. Baldock,and J. Armstrong. The Virtual Fly Brain Browser and Query Interface.Bioinformatics, 28(3):411–415, 2012.
[23] B. Mlecnik, M. Scheideler, H. Hackl, J. Hartler, F. Sanchez-Cabo, andZ. Trajanoski. PathwayExplorer: Web Service for Visualizing High-Throughput Expression Data on Biological Pathways. Nucleic AcidsResearch, 33(suppl 2):W633–W637, 2005.
[24] T. Munzner. A Nested Model for Visualization Design and Valida-tion. IEEE Transactions on Visualization and Computer Graphics,15(6):921–928, nov.-dec. 2009.
[25] S. R. Olsen and R. I. Wilson. Cracking neural circuits in a tiny brain:new approaches for understanding the neural circuitry of drosophila.Trends in Neurosciences, 31(10):512 – 520, 2008.
[26] G. Pavlopoulos, A. Wegener, and R. Schneider. A Survey of Visu-alization Tools for Biological Network Analysis. BioData Mining,1(1):1–12, 2008.
[27] T. Rohlfing and C. Maurer Jr. Nonrigid Image Registration in Shared-Memory Multiprocessor Environments with Application to Brains,Breasts, and Bees. IEEE Transactions on Information Technology inBiomedicine, 7(1):16–25, 2003.
[28] G. Shepherd, A. Stepanyants, I. Bureau, D. Chklovskii, and K. Svo-boda. Geometric and Functional Organization of Cortical Circuits.Nature neuroscience, 8(6):782–790, 2005.
[29] J. H. Simpson. Mapping and manipulating neural circuits in the flybrain. In S. F. Goodwin, editor, Genetic Dissection of Neural Circuitsand Behavior, volume 65 of Advances in Genetics, pages 79 – 143.Academic Press, 2009.
[30] M. Smoot, K. Ono, J. Ruscheinski, P. Wang, and T. Ideker. Cytoscape2.8: New Features for Data Integration and Network Visualization.Bioinformatics, 27(3):431–432, 2011.
[31] D. Stalling, M. Westerhoff, and H. Hege. Amira: A Highly InteractiveSystem for Visual Data Analysis. In The Visualization Handbook,pages 749–767. Elsevier, 2005.
[32] C. Von Mering, M. Huynen, D. Jaeggi, S. Schmidt, P. Bork, andB. Snel. String: a database of predicted functional associations be-tween proteins. Nucleic acids research, 31(1):258–261, 2003.
[33] M. Ward, G. Grinstein, and D. Keim. Interactive Data Visualization:Foundations, Techniques, and Applications. A. K. Peters, Ltd., Natick,MA, USA, 2010.
[34] R. Wiese, M. Eiglsperger, and M. Kaufmann. yFiles - Visualizationand Automatic Layout of Graphs. In Graph Drawing Software, pages173–191. Springer Berlin Heidelberg, 2004.
[35] H. Yu, T. Awasaki, M. Schroeder, F. Long, J. Yang, Y. He, P. Ding,J. Kao, G. Wu, H. Peng, G. Myers, and T. Lee. Clonal Developmentand Organization of the Adult Drosophila Central Brain. Current Bi-ology, 23(8):633 –643, March 2013.
[36] J. Yu, M. Kanai, E. Demir, G. Jefferis, and B. Dickson. Cellular Or-ganization of the Neural Circuit that Drives Drosophila Courtship Be-havior. Current Biology, 20(18):1602–1614, 2010.