Embed Size (px)
Citation preview


NEUROFEEDBACK ANDNEUROMODULATIONTECHNIQUES ANDAPPLICATIONS

This page intentionally left blank
NEUROFEEDBACK ANDNEUROMODULATIONTECHNIQUES ANDAPPLICATIONS
Edited by
ROBERT COBEN
JAMES R. EVANS
Amsterdam • Boston • Heidelberg • London • New York • Oxford
Paris • San Diego • San Francisco • Singapore • Sydney • Tokyo
Academic press is an imprint of Elsevier

Academic Press is an imprint of Elsevier
32 Jamestown Road, London NW1 7BY, UK
30 Corporate Drive, Suite 400, Burlington, MA 01803, USA
525 B Street, Suite 1900, San Diego, CA 92101-4495, USA
First edition 2011
Copyright r 2011 Elsevier Inc. All rights reserved.
No part of this publication may be reproduced, stored in a retrieval system
or transmitted in any form or by any means electronic, mechanical, photocopying,
recording or otherwise without the prior written permission of the publisher.
Permissions may be sought directly from Elsevier’s Science & Technology Rights
Department in Oxford, UK: phone (144) (0) 1865 843830; fax (144) (0) 1865 853333;
email: [email protected]. Alternatively, visit the Science and Technology Books
website at www.elsevierdirect.com/rights for further information.
Notice
No responsibility is assumed by the publisher for any injury and/or damage to persons or
property as a matter of products liability, negligence or otherwise, or from any use or
operation of any methods, products, instructions or ideas contained in the material herein.
Because of rapid advances in the medical sciences, in particular, independent verification
of diagnoses and drug dosages should be made.
British Library Cataloguing-in-Publication Data
A catalogue record for this book is available from the British Library
Library of Congress Cataloging-in-Publication Data
A catalog record for this book is available from the Library of Congress
ISBN: 978-0-12-382235-2
For information on all Academic Press publications
visit our website at www.elsevierdirect.com
Typeset by MPS Limited, a Macmillan Company, Chennai, India
www.macmillansolutions.com
Printed and bound in United States of America
11 12 13 10 9 8 7 6 5 4 3 2 1

CONTENTS
Contributors xi
Preface xv
Part One: Neuromodulation: Analysis Techniques 1
1. Use of Quantitative EEG to Predict Therapeutic Outcome inNeuropsychiatric Disorders 3Jack Johnstone and Joy Lunt
Introduction 3
Foundations of Clinical EEG: Reliability 4
Quantitative EEG 5
Quantitative EEG/ERP and Medication Management 7
Prediction of Neurofeedback Protocol Efficacy 12
Using EEG to Guide Transcranial Magnetic Stimulation 17
Conclusion 19
References 20
2. EEG Source Analysis: Methods and Clinical Implications 25Marco Congedo and Leslie Sherlin
Introduction 25
Method 27
Clinical Examples 39
Discussion 43
References 44
3. ERP-Based Endophenotypes: Application in Diagnosis andNeurotherapy 47Juri D. Kropotov, Andreas Mueller, and Valery A. Ponomarev
Introduction 47
Event-Related Potentials (ERPs) 48
Theoretical Considerations 49
New Methods in ERP Analysis 52
v
HBI Reference Database 53
GO/NO-GO Task 53
Methodology of Decomposition of Collection of ERPs into Independent
Components 56
Methodology of Decomposition of Individual ERPs into Independent
Components 57
Independent Components in GO/NO-GO Task 58
Application of ERP/ICA Methodology for ADHD � Response Inhibition 65
ERPs as Indexes of Neurofeedback Efficacy 66
ERPs as Index of tDCS effect 70
References 73
4. EEG Vigilance and Phenotypes in Neuropsychiatry:Implications for Intervention 79Martijn Arns, Jay Gunkelman, Sebastian Olbrich, Christian Sander,
and Ulrich Hegerl
Introduction 79
History of EEG Research in ADHD and Depression 83
EEG and qEEG: Models and Theory 94
EEG Vigilance Model 95
EEG Phenotype Model 105
EEG Phenotype vs. EEG Vigilance: Towards a Coherent Model? 112
Acknowledgments 115
References 115
Part Two: Endogenous Neuromodulation Strategies 125
5. Neurofeedback with Children with Attention DeficitHyperactivity Disorder: A Randomized Double-BlindPlacebo-Controlled Study 127Roger J. deBeus and David A. Kaiser
Introduction 128
Method 132
Results 139
Discussion 141
Conclusions 148
Acknowledgments 148
References 148
vi Contents

6. Emerging Empirical Evidence Supporting Connectivity-GuidedNeurofeedback for Autistic Disorders 153Robert Coben and Lori A. Wagner
Introduction 153
Major Treatments for ASD: An Overview 155
Neurofeedback for ASD 168
qEEG Evaluation and ASD 170
Discussion 175
References 176
7. Neurofeedback and Epilepsy 183Gabriel Tan, D. Corydon Hammond, Jonathan Walker, Ellen Broelz,
and Ute Strehl
Introduction 183
Research Synopsis 184
Clinical Protocols 186
Individualizing Neurofeedback Based on qEEG Findings 187
Low Energy Neurofeedback System (LENS) 198
Observations and Implications for Future Direction 200
References 201
8. Feedback of Slow Cortical Potentials: Basics, Application,and Evidence 205Sarah Wyckoff and Ute Strehl
Basics 206
Technical and Training Requirements 209
Diagnosis and Evaluation 215
Evidence Base and Indications 217
Conclusion 222
References 222
9. Real-Time Regulation and Detection of Brain States fromfMRI Signals 227Ranganatha Sitaram, Sangkyun Lee, Sergio Ruiz, and Niels Birbaumer
Introduction 227
Historical Development of Real-Time fMRI 228
viiContents

Overview of the fMRI�BCI System 232
fMRA�BCI in Research and Clinical Treatment 238
Conclusions 248
References 249
Part Three: Exogenous Neuromodulation Strategies 255
10. Repetitive Transcranial Magnetic Stimulation in Depression:Protocols, Mechanisms, and New Developments 257Desirée Spronk, Martijn Arns, and Paul B. Fitzgerald
Introduction 257
Protocols 261
Mechanisms of rTMS Treatment in Depression 270
New Developments 277
Acknowledgments 282
References 283
11. Transcranial Magnetic Stimulation for Tinnitus 293Berthold Langguth and Dirk de Ridder
Tinnitus: Introduction 293
Transcranial Magnetic Stimulation 296
Conclusion 311
References 312
12. Neurophysiological Effects of Transcranial Direct CurrentStimulation 319Jay S. Reidler, Soroush Zaghi, and Felipe Fregni
Introduction 319
The Growing Field of Brain Stimulation 320
Electrophysiology of tDCS 323
Neurochemistry of tDCS 337
Safety Considerations for tDCS 340
Conclusions and Future Directions 341
Acknowledgment 344
References 344
viii Contents

Part Four: Mechanism of Change and Long-Term Consolidation:Beginning Evidence 351
13. Functional Neuroimaging Evidence Supporting Neurofeedbackin ADHD 353Johanne Lévesque and Mario Beauregard
Introduction 353
Biological Basis of ADHD 354
Impact of Neurofeedback Training on the Neural Substrates of
Selective Attention and Response Inhibition in Children with ADHD 361
Putative Neural Mechanisms Underlying the Effects of Neurofeedback in ADHD 366
Conclusion 368
References 369
14. The Immediate Effects of EEG Neurofeedback on CorticalExcitability and Synchronization 381Tomas Ros and John H. Gruzelier
Introduction 381
Methods 383
Results 387
Discussion 395
References 399
15. Enduring Effects of Neurofeedback in Children 403Robert Coben, Martijn Arns, and Mirjam E.J. Kouijzer
Introduction 403
Neurofeedback as a Treatment for Children with ADHD 405
Long-Term Effects of Neurofeedback 406
Neurofeedback as a Treatment for Children with ASD 408
Enduring Behavioral and Neuropsychological Benefits of Neurofeedback in ASD 413
Discussion 417
Acknowledgment 419
References 419
Index 423
Color Plate Section
ixContents

This page intentionally left blank

CONTRIBUTORS
Martijn Arns
Research Institute Brainclinics, Nijmegen, and Utrecht University, Department of
Experimental Psychology, Utrecht, The Netherlands
Mario Beauregard
Centre de Recherche en Neuropsychologie et Cognition (CERNEC), Departement de
Psychologie, Universite de Montreal; Departement de Radiologie, Universite de
Montreal; Centre de Recherche en Sciences Neurologiques (CRSN), Universite de
Montreal, and Centre de Recherche du Centre Hospitalier de l’Universite de Montreal
(CRCHUM), Canada
Niels Birbaumer
Institute of Medical Psychology and Behavioral Neurobiology, University of Tubingen,
Tubingen, Germany; and Ospedale San Camillo, Istituto di Ricovero e Cura a Carattere
Scientifico, Venezia � Lido, Italy
Ellen Broelz
Institute of Medical Psychology and Behavioral Neurobiology, University of Tubingen,
Tubingen, Germany
Robert Coben
Neurorehabilitation and Neuropsychological Services, Massapequa Park, New York, USA
Marco Congedo
ViBS Team (Vision and Brain Signal Processing), GIPSA-Lab, National Center for
Scientific Research (CNRS), Grenoble University, Grenoble, France
Dirk de Ridder
TRI Tinnitus Clinic, BRAI2N and Department of Neurosurgery, University of Antwerp,
Antwerp, Belgium
Roger J. deBeus
Department of Psychiatry and Behavioral Sciences, Quillen College of Medicine,
East Tennessee State University, Johnson City, Tennessee, USA
Paul B. Fitzgerald
Monash Alfred Psychiatry Research Center (MAPrc), The Alfred and Monash University,
School of Psychology and Psychiatry, Melbourne, Victoria, Australia
Felipe Fregni
Laboratory of Neuromodulation, Spaulding Rehabilitation Hospital, Harvard Medical
School, Boston, Massachusetts, and Berenson-Allen Center for Noninvasive Brain
Stimulation, Beth Israel Deaconess Medical Center, Harvard Medical School, Boston,
Massachusetts, USA
John H. Gruzelier
Department of Psychology, Goldsmiths, University of London, London, UK
xi

Jay Gunkelman
Q-Pro Worldwide, Crockett, California, USA
D. Corydon Hammond
University of Utah School of Medicine, Salt Lake City, Utah, USA
Ulrich Hegerl
University of Leipzig, Leipzig, Germany
Jack Johnstone
Q-Metrx, Inc., Burbank, California, and Department of Psychology, University of
California Los Angeles, Los Angeles, California, USA
David A. Kaiser
Wavestate Inc., Marina Del Ray, California, USA
Mirjam E.J. Kouijzer
Behavioral Science Institute, Radboud University Nijmegen, Nijmegen, The Netherlands
Juri D. Kropotov
Institute of the Human Brain of the Russian Academy of Sciences, St Petersburg, Russia;
and Institute of Psychology, Norwegian University of Science and Technology,
Trondheim, Norway
Berthold Langguth
Department of Psychiatry and Psychotherapy and Tinnitus Clinic,
University of Regensburg, Regensburg, Germany
Sangkyun Lee
Institute of Medical Psychology and Behavioral Neurobiology, University of Tubingen,
Tubingen, and Graduate School of Neural and Behavioural Sciences, International Max
Planck Research School, Tubingen, Germany
Johanne Levesque
Institut PsychoNeuro, Laval, Canada
Joy Lunt
Brain Potential, Inc., Burbank, California, USA
Andreas Mueller
Brain and Trauma Foundation, Grison, and Praxis fur Kind, Organisation und
Entwicklung, Chur, Switzerland
Sebastian Olbrich
University of Leipzig, Leipzig, Germany
Valery A. Ponomarev
Institute of the Human Brain of the Russian Academy of Sciences, St Petersburg, Russia
Jay S. Reidler
Laboratory of Neuromodulation, Spaulding Rehabilitation Hospital, Harvard Medical
School, Boston, Massachusetts, USA
Tomas Ros
Department of Psychology, Goldsmiths, University of London, London, UK
xii Contributors

Sergio Ruiz
Institute of Medical Psychology and Behavioral Neurobiology, University of Tubingen,
Tubingen, and Graduate School of Neural and Behavioral Sciences, International Max
Planck Research School, Tubingen, Germany, and Department of Psychiatry, Faculty of
Medicine, Pontificia Universidad Catolica de Chile, Santiago, Chile
Christian Sander
University of Leipzig, Leipzig, Germany
Leslie Sherlin
Neurotopia, Inc., Los Angeles, California; Nova Tech EEG, Inc., Mesa, Arizona, and
Southwest College of Naturopathic Medicine, Tempe, Arizona, USA
Ranganatha Sitaram
Institute of Medical Psychology and Behavioral Neurobiology, University of Tubingen,
Tubingen, Germany
Desiree Spronk
Research Institute Brainclinics, Nijmegen, The Netherlands
Ute Strehl
Institute of Medical Psychology and Behavioral Neurobiology, University of Tubingen,
Tubingen, Germany
Gabriel Tan
Michael E. DeBakey Veterans Affairs Medical Center, Houston, Texas, and Baylor
College of Medicine, Houston, Texas, USA
Lori A. Wagner
Neurorehabilitation and Neuropsychological Services, Massapequa Park, New York, USA
Jonathan Walker
Neurotherapy Center of Dallas, Dallas, Texas, USA
Sarah Wyckoff
Institute of Medical Psychology and Behavioral Neurobiology, University of Tubingen,
Tubingen, Germany
Soroush Zaghi
Laboratory of Neuromodulation, Spaulding Rehabilitation Hospital, Harvard Medical
School, Boston, Massachusetts, and Berenson-Allen Center for Noninvasive Brain
Stimulation, Beth Israel Deaconess Medical Center, Harvard Medical
School, Boston, Massachusetts, USA
xiiiContributors

This page intentionally left blank

PREFACE
It was not many years ago that the term “neuromodulation” would have
been considered a contradictory term by many � at least in regard to mod-
ification of a damaged or dysfunctional central nervous system. Although it
generally had been assumed that learning and memory somehow resulted
in relatively permanent modifications of brain structure and/or function,
the notion persisted that neural function and structure basically were set by
genetics and were relatively immune to change. However, within the past
couple of decades developments in neuroimaging have enabled scientific
research providing evidence of neural plasticity far greater than previously
had been imagined. Research on neural plasticity is burgeoning, along
with a plethora of scientifically unsubstantiated claims by practitioners from
many different professions for “brain-based” methods for remediation of
various medical, psychological, and educational problems.
Despite the fact that, until recently, brain plasticity was not a generally
accepted concept, for many years there have been remedial approaches
where advocates make either explicit or implied claims that their use
results in modulation of brain function. Some involve intensive, graduated
practice of functions that had been impaired by brain damage, e.g., cogni-
tive rehabilitation. Some involve exposure of clients to various types of
stimuli, which usually are rhythmic or of specified frequency (e.g., audi-
tory/visual stimulation with light/sound machines, music therapy). Often
this is done with the assumption that rhythms of the brain are entrained
or otherwise modified by such exogenous stimuli. Some consider electro-
shock therapy and transcranial magnetic stimulation to fall into this cate-
gory. Still others emphasize self-directed activity, such as making precise
movements in synchrony with a metronome, or learning self-control of
one’s brain rhythms (EEG) with the aid of electronic equipment that pro-
vides feedback concerning specific aspects of those endogenous rhythms,
i.e., EEG biofeedback or neurofeedback. Practitioners of such remedial
approaches generally have been marginalized by mainstream medicine,
psychology, and education, partially due to the aforementioned belief in
immutability of brain structure/function, but also due to perceived, or
real, lack of scientific support for efficacy of the methods involved.
It is the editors’ opinion that two procedures for neuromodulation
hold special promise due to emerging scientific evidence of their enduring
xv

effectiveness with a variety of conditions that are known, or believed, to
be due to brain damage and/or dysfunction. These are neurofeedback
(NF) and transcranial magnetic stimulation (TMS) in their various forms.
Research and clinical practice in NF began in earnest in the 1960s and
1970s, decreased considerably for a while thereafter, but, since the early
1990s, have grown rapidly. There are NF practitioners in many countries
around the world, professional NF associations have been formed on three
continents, at least ten books have been published dealing primarily with
NF, and a professional journal devoted almost exclusively to NF ( Journal
of Neurotherapy) has been published regularly since 1995. Unlike many
other groups with claims of facilitation of neuromodulation, the field of
NF actively promotes scientific research; and in Australia, Belgium,
Canada, England, Germany, the Netherlands, Russia and the United
States (as well as some other countries) rigorous scientific research on the
mechanisms and efficacy of NF is being actively pursued. The field has
evolved far from its beginnings when research participants or patients
could be provided feedback concerning only degree of power or percent-
age of power in a specific EEG frequency band at a single scalp electrode
site. Today, feedback can be adjusted to reflect not only EEG power at all
frequency/site combinations (now including even ultra low frequencies
such as 0.001 Hertz), but also degree of connectivity (e.g., coherence)
between all site combinations. Using low resolution electromagnetic
tomography (LORETA) procedures, feedback concerning EEG activity in
various subcortical areas and cortical networks or “hubs” presently is pos-
sible. And, feedback of information concerning activity in cortical and
subcortical regions using functional MRI (fMRI) is receiving considerable
research attention as an alternative or supplement to EEG biofeedback.
TMS, as usually defined today, is a relative newcomer to the field of
neuromodulation. In this approach weak electrical currents are produced in
brain tissues by applying rapidly changing magnetic fields to specific scalp
locations. In some contrast to NF, which historically has been associated
mainly with the field of psychology, TMS primarily is associated with medi-
cal research and practice. Also in some contrast to NF, where laboratory dis-
coveries quickly were applied to clinical practice, the field of TMS appears
to be moving more cautiously, building upon solid research findings prior
to making claims for clinical efficacy. As with NF, scientific research on
TMS and its potential clinical uses is occurring in many parts of the world.
Despite growing clinical use of TMS, and especially of NF, and despite
emerging research results supporting their efficacy, both remain on the
xvi Preface

fringes of medical, psychological, and education practice. Charges of
“show me the data” often are made by critics who claim there is no solid
scientific support for these approaches. Such evidence exists, but hereto-
fore has been scattered among many different professional journals and
other sources. The editors perceived a need for the latest and best theoriz-
ing and research findings concerning these neuromodulation techniques
to be brought together in a single source to which professionals and other
interested persons would have ready access. We believe that this book
accomplishes that goal. Although there certainly are others, it could be
argued that the chapter authors of this text constitute the majority of the
leading NF and TMS theoreticians and scientists of today’s world. Several
books have been published on the general topic of neuromodulation or
specifically on neurofeedback. While a few have chapters detailing sup-
portive research, most were oriented primarily toward theories of efficacy,
descriptions of various approaches to NF, and/or details of clinical
practice. This book is unique in its emphasis on solid scientific support
as it brings together for the first time the neuromodulation fields of
NF and TMS.
Rob Coben
Jim Evans
xviiPreface

This page intentionally left blank

PARTOneOneNeuromodulation:Analysis Techniques

This page intentionally left blank

CHAPTER11Use of Quantitative EEG toPredict Therapeutic Outcomein Neuropsychiatric DisordersJack Johnstone1 and Joy Lunt21Q-Metrx, Inc., Burbank, California, and Department of Psychology, University of California Los Angeles,Los Angeles, California, USA2Brain Potential, Inc., Burbank, California, USA
Contents
Introduction 3Foundations of Clinical EEG: Reliability 4Quantitative EEG 5Quantitative EEG/ERP and Medication Management 7Prediction of Neurofeedback Protocol Efficacy 12Using EEG to Guide Transcranial Magnetic Stimulation 17Conclusion 19References 20
INTRODUCTION
The thesis of this chapter is that recording and analysis of EEG signals can be
used in more productive ways than to identify and categorize behavioral disor-
ders. More recent applications of EEG have been directed toward prediction
of outcome of therapeutic intervention. Here we review use of EEG to guide
interventions using medication, neurofeedback, and transcranial magnetic
stimulation.
Clinical electroencephalography (EEG) typically involves visual exami-
nation of multichannel waveform displays by an experienced clinician,
usually a neurologist, to detect and characterize seizure disorders and
encephalopathies. EEG is the technique of choice for this purpose because
it is noninvasive and cost-effective. Further, EEG provides sub-millisecond
time resolution so that changes in neurophysiological activity can be stud-
ied in detail over time, far exceeding the time resolution available with
3Neurofeedback and Neuromodulation Techniques and ApplicationsDOI: 10.1016/B978-0-12-382235-2.00001-9
© 2011 Elsevier Inc.All rights reserved.

other functional neuroimaging measures such as functional magnetic reso-
nance imaging (fMRI), single positron emission tomography (SPECT),
and positron emission tomography (PET). A large body of work docu-
ments the general acceptance of EEG in the medical literature (for a
comprehensive review see Niedermeyer & Lopes da Silva, 2004).
FOUNDATIONS OF CLINICAL EEG: RELIABILITY
When EEG is read visually by experienced experts there is often considerable
lack of agreement on the presence and significance of EEG “abnormalities”
and many patterns are considered “normal variants” or “maturational”.
There have been numerous studies of the inter- and intra-rater reliability in
evaluation of EEG signals. An early study by Williams et al. (1985) investi-
gated inter-observer reliability in a random sample of 100 electroencephalo-
graphers. Ten-second samples of EEG records were evaluated from 12 EEGs.
They concluded that there is considerable variability in EEG interpretation
and that characteristics of the individual performing the interpretation were
an important factor. Spencer et al. (1985) included review of 144 scalp ictal
EEGs from 54 patients by three electroencephalographers. They found
approximately 60% agreement in determination of the lobe of the brain
involved in seizure onset and approximately 70% agreement for side of onset.
They concluded that reliable determination of localization in scalp ictal
records requires additional formal criteria.
A more recent study by Williams et al. (1990) showed that prior clini-
cal diagnosis was an influential factor in EEG interpretation. Piccinelli
et al. (2005) studied inter-rater reliability in patients with childhood idio-
pathic epilepsy. They report that experienced electroencephalographers
have an “at least moderate agreement” on the majority of features of a
wake and sleep EEG. Importantly, they also conclude that agreement was
“unsatisfactory” when assessing background EEG activity. Gerber et al.
(2008) studied inter-observer agreement in EEG interpretation in criti-
cally ill adults. They found moderate agreement “beyond chance” for the
presence of rhythmic and periodic patterns. Agreement for other features
was “slight to fair”.
Boutros et al. (2005) reviewed the basis for determining EEG as “nor-
mal”, and, specifically, how normal adults are selected for studies using
EEG in neuropsychiatric research. They noted that EEG abnormalities
have been reported in as many as 57.5% of normal adults (Struve, 1985).
The authors defined seven criteria for normalcy, including (1) absence of
4 Jack Johnstone and Joy Lunt

systemic disorders with CNS involvement (metabolic, endocrine), (2)
absence of traumatic brain injury, childhood neurologic disorders, and
dementia, (3) absence of Axis I psychiatric disorders, excluding alcohol and
drug abuse, (4) absence of alcohol abuse or dependence, (5) absence of psy-
chotropic medications, (6) absence of first-degree relatives with psychiatric
disorders, and (7) Axis II personality disorder or mental subnormality.
These criteria were reviewed in 38 studies reported in the literature using
visual EEG interpretation. They showed that the majority of studies met
no criteria, or only one or two criteria. The overall conclusion is that
boundaries for normal, unquantified EEG are poorly defined.
It is clear that because of the ambiguity about the definition of “nor-
mal”, and lack of agreement among clinicians regarding the presence or
absence of significant EEG abnormalities, either epileptic or abnormal
rhythmicity, use of qualitative EEG alone does not have sufficient predic-
tive power to effectively guide intervention in patients with neuropsychi-
atric disorders. The addition of quantitative EEG analysis increases both
reliability and predictive power.
QUANTITATIVE EEG
The term “quantitative EEG” (qEEG) refers to quantitative signal analysis
of the digitized electroencephalogram. The use of Fourier or Wavelet anal-
ysis is most often used to estimate the frequency spectrum. Many studies
using qEEG compare an individual pattern of features such as absolute and
relative EEG power, coherence, peak alpha frequency, asymmetry, and
related measures to a reference database. Statistical deviations from the
database can then be examined for clinical significance. A number of
such databases are commercially available (see reviews by Johnstone &
Gunkelman, 2003; Thatcher & Lubar, 2009). These databases each have
strengths and weaknesses but overall were developed taking into account
the criteria for normalcy suggested by Boutros et al. (2005), described
above.
A number of studies indicate robust test�retest reliability for quantified
EEG, and are reviewed below. The excellent reproducibility of findings in
qEEG studies argues that the poor reliability seen for qualitative EEG is
due to differences in interpretation rather than error of measurement or
other technical factors.
An early qEEG reliability study by Fein et al. (1983) investigated the
test�retest reliability of EEG spectral analysis in groups of dyslexic and
5Quantitative EEG to Predict Therapeutic Outcome in Neuropsychiatric Disorders

control children. They measured the coefficient of variation within subjects
over two repetitions of 3-minute recordings with eyes closed and with eyes
open. This technique showed significant second-to-second variability of
EEG without a consistent pattern of effects of group, reference used, task
or repetition. EEG spectra were averaged over the 3-minute segment and
compared to a similar segment recorded following a battery of behavioral
tasks, approximately 4 hours later. Intra-class correlations (ICC) were com-
puted to assess stability comparing the two 3-minute segments. The ICCs
were typically above 0.9 for control subjects. Similar analyses with dyslexics
showed somewhat lower reliability in specific leads and reference configura-
tions, but EEG spectral profiles also were stable over a 4�5 hour period.
These results were consistent for measures of absolute power as well as rela-
tive power. The authors conclude that, overall, these data demonstrate a
high degree of reliability in EEG spectra in children under well-controlled
recording conditions.
A follow-up study (Fein, Galin, Yingling, Johnstone, & Nelson, 1984)
with the same subjects indicated that despite differences in recording equip-
ment and procedures, the EEG spectra were found to be highly stable over a
period of 1�3 years. Subsequent studies confirm the generally robust
test�retest reliability of qEEG analyses (Burgess & Gruzelier, 1993; Fernandez
et al., 1993; Gasser, Bacher, & Steinberg, 1985; Harmony et al., 1993; Lund,
Sponheim, Iacono, & Clementz, 1995; Salinsky et al., 1991; see also
Thatcher, Biver, & North, 2003). It is clear that qEEG evaluation when based
on standardized and well-controlled recording and analysis procedures can
produce replicable and, therefore, potentially useful clinical results.
The utility of a method for producing valid and useful clinical findings is
based on a foundation of accurate and reliable measurement. It is also rele-
vant to address the clinical applications and “intended use” of the method,
for example, EEG considered as a valid diagnostic procedure, aiding in
placing individuals into distinct diagnostic categories with well-defined
behavioral boundaries. Indeed, quantitative EEG has been criticized for
not being diagnostic of complex neurobehavioral syndromes and was con-
sidered by the American Academy of Neurology to be “investigational for
clinical use in post-concussion syndrome, mild or moderate head injury,
learning disability, attention disorders, schizophrenia, depression, alcohol-
ism, and drug abuse” (Nuwer, 1997). Many other authors disagree, how-
ever, providing evidence that application of qEEG to diagnose psychiatric
disorders does have clinical utility (for reviews see Coburn et al., 2006;
Hughes & John, 1999).
6 Jack Johnstone and Joy Lunt

Clinical applications of qEEG now are also being explored in medica-
tion management, development of neurofeedback protocols, and guiding
transcranial magnetic stimulation therapy. Visual interpretation of EEG
waveforms alone has not been found to be useful in these important appli-
cations, likely because of the poor reliability of interpretation, as discussed
above. In a recent comprehensive review of the topic, Thatcher (2010)
reaches similar conclusions and also suggests that increased reliability
allows for better predictive validity. Combining visual examination of the
EEG waveforms by an experienced expert with quantitative EEG analyses,
however, will likely improve overall predictive accuracy compared to each
of these procedures used separately.
An alternate approach to using brain electrical activity to diagnose psy-
chiatric disorders is consideration of individual EEG patterns as “inter-
mediate phenotypes.” Johnstone, Gunkelman, & Lunt (2005) suggested
that since qEEG patterns are highly reliable and stable and often show a
genetic basis, yet are not isomorphic with behavioral categories, these pat-
terns may be useful as predictors of clinical response. Candidate pheno-
types have been offered, and will be described in this chapter along with
possible intervention strategies for medication and EEG biofeedback
(neurofeedback) based on these phenotypes. Such use of qEEG to predict
and guide therapeutic outcome is recent, and appears to the authors to be
more promising than the often-used clinical diagnostic approach.
Different diagnostic categories are differentially represented in phenotype
categories. Further, it should be recognized that individuals may manifest
features of several phenotypes, and that features distinguishing phenotypes
are on a continuum without distinct boundaries. For example, many chil-
dren with attention deficit disorder show an excess of frontocentral activity
in the theta frequency range, 4�7 Hz. However, not all individuals show
this pattern and certain individuals show a pattern of excessive fast activity
anteriorly. Therefore, although it is possible to accurately measure the
amount of anterior theta or beta activity, these measures are not specifically
“diagnostic” of the disorder. It is believed to be more effective to use the
neurophysiological markers to guide neurophysiological intervention than to
diagnose a behavioral category and use it as a guide.
QUANTITATIVE EEG/ERP AND MEDICATION MANAGEMENT
A large body of literature often referred to as “Pharmaco-EEG” has
shown effects of most of the commonly used psychopharmacologic agents
7Quantitative EEG to Predict Therapeutic Outcome in Neuropsychiatric Disorders

on most measures of brain electrical activity. The most commonly used
psychopharmacologic agents have been shown to have specific effects on
EEG. Table 1.1 shows a summary of known medication effects on EEG
(for review see Saletu, Anderer, & Saletu-Zyhlarz, 2006).
More recently, quantitative EEG features have been used to predict
therapeutic response to medication, and more effectively manage psychi-
atric medication clinically (“predictive model”). Suffin and Emory (1995)
recorded baseline EEG after patients were washed out of all psychoactive
medication. Two groups of patients were selected: One group of patients
was diagnosed with attentional disorders without affective symptoms and
another group with affective disorders without attentional symptoms.
These patients were medicated according to standard clinical practice and
the Clinical Global Improvement scale (CGI) was used to assess outcome.
There were clear associations between specific EEG features at baseline
and effects of medications: Individuals with slow EEG patterns tended to
respond better to stimulant medication. Individuals with excessive frontal
alpha activity responded better to antidepressant medications and those
Table 1.1 Effects of common psychiatric medications on EEGClass Medications (examples) Effects on EEG
Psychostimulants Ritalin, Dexedrine,
Adderall
Decreases slow activity (delta and
theta frequencies); increases fast
activity (beta frequencies)
Benzodiazepines Xanax, Valium, Ativan Increased 14�25 Hz
Anticonvulsant properties
Barbiturates Phenobarbitol Increases delta activity and
increases 18�35 Hz beta
spindles. High dosage produces
“burst-suppression”
Tricyclic
antidepressants
Elavil, Tofanil,
Norpramin,
Sinequan, Pamelor
Increases both slow and fast
activity and decreases alpha
frequency activity (sedating)
SSRIs Prozac, Effexor, Zoloft,
Luvox, Paxil,
Lexipro, Celexa
Produces less delta, decreases
alpha, and increases beta (less
sedating)
Other
antidepressants
Wellbutrin (Zyban) Reduces seizure threshold,
non-sedating
Mood stabilizers
(anticyclics)
Lithium, Tegretol Increases theta frequency activity.
Overdose produces marked
slowing and triphasic discharges
8 Jack Johnstone and Joy Lunt

with deviations in EEG coherence responded better to anticonvulsants or
anticyclics, independent of clinical diagnosis. The authors concluded that the
pattern of deviations from the reference database was a better predictor of
clinical response than was clinical diagnosis. A prospective follow-up study
compared clinical outcome with medication selection based on patterns
of deviations from a reference database compared to standard clinical prac-
tice (Suffin et al., 2007). Clinical outcome was significantly improved
using qEEG guidance in medication selection. Based on these findings
physicians were encouraged to select psychopharmacologic agents based
on similarity with qEEG profiles of known responders to specific agents.
The phenotype model, described above, was used by Arns, Gunkelman,
Breteler, and Spronk (2008) in a study demonstrating the utility of the
intermediate EEG phenotype model in selecting stimulant medications
for treatment of children with ADHD.
Use of qEEG methods to guide selection and management of psychi-
atric medication has been studied extensively, and recently was reviewed
by Leuchter, Cook, Hunter, and Korb (2009). These authors consider
several EEG features as potential biomarkers of medication response in
major depression, including some results from low resolution electromag-
netic tomography, LORETA (see also Mulert et al., 2007). LORETA
results are consistent with other imaging modalities such as PET, in sug-
gesting that elevated theta activity in anterior cingulate cortex is measur-
able from prefrontal scalp recording electrodes and can be used as a
biomarker for response to antidepressant medication.
Evoked and event-related potentials are related measures based on aver-
aging EEG in response to sensory stimuli or other specific internal or exter-
nal events. An evoked potential method that shows promise as a biomarker
for antidepressant response is the loudness-dependent auditory evoked
response (LDAEP). This evoked response originates in primary auditory cor-
tex and appears to be sensitive to central serotonergic activity (Juckel,
Molnar, Hegert, Csepe, & Karmos, 1997). When stimuli are presented with
increasing intensity, individuals with diminished serotonergic activity show
an increased or more sensitive response to increasing auditory stimulus
intensity than individuals formerly diagnosed with depression and taking
SSRI (selective serotonin reuptake inhibitor) medication. The presence of a
strong LDAEP has been shown to predict treatment outcome with antide-
pressant medication in major depression (Juckel et al., 2007). Juckel et al.
(2010) also provide evidence that the mechanism of the LDAEP has a
genetic basis.
9Quantitative EEG to Predict Therapeutic Outcome in Neuropsychiatric Disorders

Auditory evoked potentials have also been used extensively in pharmaco-
logic treatment in schizophrenia. The method most often used in evoked
potential studies of schizophrenia is the auditory paired click paradigm, pio-
neered in the work of Freedman and Adler (see Adler et al., 1982; Freedman
et al., 1983). This technique is the subject of a recent review (Patterson et al.,
2008). Many studies have found a difference in the amplitude of the response
to the first compared to the second click in closely timed paired stimuli, and
that this decrement is smaller in schizophrenics. This has been widely inter-
preted as reflecting defective sensory gating in schizophrenics. There is con-
siderable variability across studies, and the technique is sensitive to a number
of technical factors, including electrode location, band pass filtering, number
of trials averaged, age, and rules regarding inclusion of the P30 component
(the preceding positive peak in the auditory evoked potential waveform).
Olincy et al. (2006) administered a low and a high dose of an α-7 nico-
tinic agonist to a group of 12 non-smoking schizophrenics and studied
changes in the P50 component and neurocognitive performance. The drug
produced inhibition of the response to the second click in paired stimuli.
Improvements in neurocognitive measures of attention were documented
for the low drug dose. This study showed not only the utility of the P50 bio-
marker in assessing change in the central nervous system associated with a
specific agent, but also that the magnitude of changes in response could assist
in determining the most effective dose.
Large clinical trials have now been carried out and published on the use of
frontal EEG measures to manage antidepressant medications (Leuchter et al.,
2009a; Leuchter et al., 2009b). The Biomarkers for Rapid Identification of
Treatment Response in Major Depression (“BRITE-MD”) was a large multi-
site trial (N5 220 participants completing the study) that used a neurophysio-
logical biomarker to predict treatment response. Changes in the Hamilton-D
scale were used to measure clinical outcome. An antidepressant treatment
response index (“ATR”) was derived from the power spectrum at baseline
compared to the end of one week of the antidepressant escitalopram. The
index is “a weighted combination of the relative theta and alpha power at
week 1, and the difference between alpha 1 power (8.5�12 Hz) at baseline
and alpha 2 power (9�11.5 Hz) at week 1”.
Patients received quantitative EEG assessments at baseline and following
one week of treatment with escitalopram. Patients were then randomized
into treatment groups with (1) continued administration of escitalopram,
(2) addition of bupropion to escitalopram, or (3) switch to bupropion. The
10 Jack Johnstone and Joy Lunt
ATR predicted both response and remission at 8 weeks with 74% accuracy.
Prediction of outcome based on genotyping, physician assessment, and
serum drug levels were not significant (see Leuchter et al., 2009a). These
authors reported that the ATR was also able to predict differential response
to antidepressant medication. Patients with ATR values below a specific
threshold were likely to respond to escitalopram and above the threshold
were more likely to respond to bupropion.
Another large-scale study (N5 89) compared selection of medication for
major depression based on algorithms developed in the “Sequenced Treatment
Alternatives to Relieve Depression” (STARD) study that did not use EEG as a
predictor (Rush et al., 2006), with medication guided by use of quantitative
EEG features (DeBattista et al., 2009). There was a clear improvement on a
number of measures of clinical outcome, including the Quick Inventory of
Depressive Symptomatology and the Montgomery�Asberg Depression Rating
Scale, with qEEG-guided intervention compared to STARD algorithms.
Overall, a number of qEEG and evoked potential procedures have
been described that have significant potential for guiding therapeutic
intervention with medication. The main use for quantitative EEG and
evoked potential technology in this regard has been in studies of major
depression and schizophrenia. In addition, however, quantitative EEG
methods are being actively used in other neurophysiological interventions.
A particularly productive line of inquiry involves consideration of changes
in evoked potentials due to phase reset mechanisms (as opposed to the
averaged activity of fixed generators of evoked potential components).
Since it is our opinion that this could have major implications for guiding
intervention strategies, we describe here some details of the procedure.
Evoked potentials are usually recorded by means of averaging segments
or trials of EEG following the presentation of sensory stimuli. These poten-
tials are generally considered to be fixed latency, fixed polarity, responses that
appear superimposed on the background EEG. This is the basis of the
“evoked” model. Recent literature has emphasized the need to consider that
ERPs are generated at least in part by a reset of on-going oscillations, i.e.,
phase reset (Klimesch, Sauseng, Hanslmayr, Gruber, & Freunberger, 2007),
the so-called “phase reset” model. Reduction in amplitude from the first to
the second stimulus in a pair may be due to alterations in phase-locking.
The role of phase-locking has been studied using intracranial recording in
epilepsy patients (Rosburg et al., 2009). Poor gators showed less phase-
locked beta frequency oscillation (20�30 Hz) in the 200�315 msec region
11Quantitative EEG to Predict Therapeutic Outcome in Neuropsychiatric Disorders

following the first stimulus. This was found to be related to poorer memory
encoding.
The relation between brain oscillations and auditory evoked potentials has
been studied directly in schizophrenia (Brockhaus-Dumke, Mueller, Faigle, &
Klosterkoetter, 2008). This work included 32 schizophrenic patients and
32 controls with EEG continuously recorded during an auditory paired
click paradigm. The authors concluded that analyzing phase and amplitude
in single trials provides more information on auditory information proces-
sing and reflects differences between schizophrenic patients and controls
better than analyzing averaged ERP responses. Unfortunately this study
found group differences in the N100 component which was predicted by
phase-locking in the theta and alpha frequency ranges, but not the com-
monly reported findings with the P50 component which was predicted by
phase-locking in the beta and gamma frequencies.
PREDICTION OF NEUROFEEDBACK PROTOCOL EFFICACY
Neurofeedback involves recording, analyzing, and presenting results of quan-
titative EEG analyses in near real-time to individuals in order to promote
changes in brain electrical activity. There is no requirement for conscious
awareness in neurofeedback training. In fact, a need for conscious awareness
would limit the applicability of training in real-world situations. Following
neurofeedback training, individuals do not need to willfully and consciously
modify specific EEG patterns in order to effect behavioral change.
In the past, most training criteria have been set for individuals based on
evaluation of behavior using a concept of arousal or symptom presentation.
Now, increasingly, training incorporates characterization of neurophysio-
logic status using EEG and quantitative EEG, and evoked potentials to help
predict outcome.
There are different ways to examine “arousal”. Physiologically, our
arousal level is usually considered in terms of the sleep/wake cycle. It is
not unusual to see individuals who have problems regulating this activity.
People who fall asleep as soon as they sit still, or people who cannot fall
asleep as they lay in bed are examples of what happens when there are dif-
ficulties managing arousal. Prominent EEG changes seen with decreased
arousal are easy to detect with recordings from the sensorimotor strip.
These changes are used to assess depth of sleep: For example, differential
appearances of discharges at the vertex (Cz) signal progression to Stage II
12 Jack Johnstone and Joy Lunt

sleep. Historically, neurofeedback practitioners began using protocols that
remained on or near the sensorimotor strip (Lubar, 1985; Sterman &
Friar, 1972; Tansey, 1984) with the goal of regulating arousal. Protocols
often included Cz, C3 or C4, each with an ear reference.
The mechanism of arousal of the cortex by subcortical activity can be
measured by sensors placed on the sensorimotor strip. When this mechanism
is dysfunctional, we may observe particular aberrant behaviors. However,
this remains a very subjective process and clinicians are not always able to
make an accurate prediction of treatment efficacy based on this information
alone. As clinicians employ more complicated protocols to help individuals
modulate their arousal level, it is important to include objective information
that can provide more guidance about the physiology of an individual’s brain
and how this might impact their level of arousal, and, hence, their response
to treatment.
Early neurofeedback work with autism is a good example of the
importance of modulation of general arousal. It was often thought that
autistic children were highly over-aroused. This was based on their beha-
viors (e.g., “stimming”), and protocols were used to “calm” these children
(Jarusiewicz, 2002). However, as more of these children had qEEG analy-
ses done, it was noted that the pattern of brain electrical activity included
far more slow content as compared to normative databases. It seemed that
there was a mismatch between the observed “over-aroused” behaviors
and the slower EEG patterns.
It is useful to think of the dimensions of arousal on an x, y graph. If we
track the physiological arousal level on the y axis and the behavioral arousal
on the x axis, we will find that there are times that these two match and
times when they clearly do not. When neurofeedback practitioners have
both pieces of information, they often better predict successful protocols
that address issues of arousal.
At this point in the development of neurofeedback methods, neurofeed-
back clinicians need not limit themselves to the work on the sensorimotor
strip, and, therefore, more comprehensive models have been considered.
Johnstone (2008) suggested a role for qEEG in assisting in neurofeedback
protocol development. Three main concerns were addressed: (1) general
regulatory or arousal-based symptoms, (2) identifying focal regions of inter-
est for training, and (3) evaluating connectivity among brain regions, both
between and within hemispheres.
Assessment of general arousal is not as relevant and offers little guidance
when looking at problems in localized areas of the brain. It is under these
13Quantitative EEG to Predict Therapeutic Outcome in Neuropsychiatric Disorders

circumstances that evaluation of regional brain function is needed.
Identification of focal or regional abnormality using qEEG, when consid-
ered in the context of behavioral symptoms and neurocognitive function,
can more specifically guide protocol development. Examples of behaviors
that are often correlated with regional abnormality in qEEG include lan-
guage disability, difficulty with perception of emotional expression, avoid-
ance behaviors in sensory integration disorders, specific memory difficulties,
poor impulse control, lack of judgment, and numerous others. While
changes in behavior can be helpful in tracking progress, more information
can be very useful prior to neurofeedback training in finding neurophysio-
logical causes or correlates of symptoms. qEEG analysis can be especially
helpful in these circumstances. Specific information about frequency ranges,
locations and connectivity issues can then be matched with behavioral
symptoms in developing neurofeedback protocols to address regionally
based issues.
qEEG analysis can be used not only to ascertain the need to modulate
arousal and regional activation, but also neural connectivity. Certain clinical
presentations are best characterized as “disconnection syndromes”, and in
such cases detection and remediation of abnormalities in EEG coherence
are often clinically effective. The importance of disconnection syndromes in
clinical neuropsychology is well known and coherence abnormalities have
been documented in many studies of pathological conditions (Leocani &
Comi, 1999). Neurofeedback training to increase and decrease connectivity
has been recently shown to be useful in studies of autistic individuals
(Coben, 2007; Coben & Padolsky, 2007).
The most direct method for using qEEG information to guide neuro-
feedback training involves feedback of information based on the extent of
the z-score deviation for a specific feature, often called “live z-score train-
ing”. One of the most intriguing aspects of this method is the apparent
capacity of the brain to respond to multiple z-score training demands
simultaneously. If this aspect of the method can be further validated, it
suggests a more efficient way to carry out complex protocols within a
brief period of time. It is important that the selection of z-scores to be
trained are based on clinical criteria and take into account artifact, drowsi-
ness, and transients, which are best identified in the raw EEG signal. In
addition, selection of z-scores to be modified should not be based exclu-
sively on the magnitude of z-score deviations because this can lead to
ineffective or negative outcomes. The case history presented below is an
14 Jack Johnstone and Joy Lunt

example of when not to train certain patterns of z-score deviations. We
emphasize the importance of clinical correlation with symptoms, com-
plaints, and results of other diagnostic testing, including psychometric
evaluation, in protocol development.
Also important is the dynamic information that can be gathered from
the raw EEG signal. Identification of transient events and paroxysmal
bursts are examples of information that can be helpful in protocol devel-
opment. Neurofeedback training, both on the sensorimotor strip and in
regions identified by visual inspection of EEG have been shown to be
efficacious in treatment of epileptic disorders (Sterman, 2000), using such
techniques as threshold adjustment. The threshold adjustment routine
allows the clinician to provide feedback about transient paroxysmal events
that are best identified in the raw EEG and can be characterized within a
specific frequency range for feedback. These transient events may be of
considerable clinical significance but are generally poorly resolved in
time-averaged qEEG analyses.
EEG patterns, or phenotypes, have been identified that often can be
linked to behavioral patterns (Johnstone et al., 2005). For example, excess
frontal theta frequency activity is one of the phenotypes seen in individuals
who suffer from attentional difficulties. However, it is important for clini-
cians to understand that this pattern does not exist exclusively as a biomarker
for attention, and cannot be considered diagnostic. It is seen in other presen-
tations as well. It can be seen in cases of brain injury, depression, and other
difficulties. So, it remains important to know the specific behaviors and
symptom presentation of each client to best make use of the objective data
that can be collected from the raw EEG signal and the qEEG analysis.
Other measurement and analysis tools are emerging that are likely to
enhance successful prediction of favorable outcome by helping in selec-
tion of specific neurofeedback protocols. For example, magnetoencepha-
lography (MEG) provides additional information about sources of brain
activity. EEG databases can be developed to specifically address predicting
outcome in neurofeedback. Integration of neurocognitive assessment will
provide a better understanding of the psychological correlates of pheno-
type patterns, and should allow more accurate prediction of therapeutic
outcome using neurofeedback methods.
A case study demonstrating the utility of using the information in the
raw EEG signal, results of a qEEG report, and the information gathered
in a clinical interview follows.
15Quantitative EEG to Predict Therapeutic Outcome in Neuropsychiatric Disorders

Case StudyA 14-year-old male presents with multiple complaints that have not been
resolved in treatment by two separate psychiatrists and a clinical psycholo-
gist. Parents began to seek treatment for him when his generalized anxi-
ety escalated in the 6th grade. He would often be so anxious that he
would crawl under either his, or the teacher’s desk. He also experienced
severe separation anxiety if his mother left the room for more than 5
minutes, and would repeatedly ask where she was and insist that he had
to go find her. He was unable to go to sleep unless his mother sat at his
bedside, and, even so, it would often take more than 2 hours for him to fall
asleep. He was difficult to wake in the morning regardless of how long he
had been allowed to sleep. Several times a week, he would sleepwalk to
other areas of the house and often get into a bed, not his own, to sleep for
the rest of the night. He was very hyperactive and was unable to sit at a
table for a meal or sit still in a classroom. He constantly “drummed” on
anything, including his own arms and legs. Recording his first EEG was a
challenge. He displayed an extremely low frustration tolerance and poor
impulse control. He often lashed out physically at his sister and also had
physically aggressive episodes at school. Due to the unpredictably of his
behaviors, his family rarely knew what to expect from him and he was
unable to establish friendships.
Responses to medications were poor and/or adverse. Administration
of Ativan for anxiety was followed by the patient putting his fist through
a plate of glass and needing physical restraint to transport him to the hos-
pital for care. Use of Ambien and Lunesta for sleep was followed by sig-
nificant agitation. Following a small dose of Remeron, parents noted a
slight improvement as it “took the edge off” and “subdued him slightly”.
But, there was no improvement in initiation of sleep or parasomnias. The
patient used a low dose of Remeron for about 6 months. Because of neg-
ative or minimal response to medication the parents decided to begin
neurofeedback training. Prior to training, a full clinical evaluation and an
EEG/qEEG study was performed.
Visual inspection of his clinical EEG showed that there were bursts
of spindling beta activity in the left frontal and right frontal regions, that
were seen both bisynchronously and with shifting laterality. Results of
qEEG analyses showed excessive beta activity in frontal regions bilater-
ally and an associated marked lack of interhemispheric beta coherence,
particularly in prefrontal leads. These findings suggested the need to
suppress beta activity in both hemispheres, and specifically not increase
the significantly decreased z-scores for interhemispheric beta coherence.
This approach has been described previously (Johnstone & Lunt, 2007).
Neurofeedback protocols were developed emphasizing two-channel
16 Jack Johnstone and Joy Lunt

sum training to suppress frequently occurring beta bursts over frontal
regions of both hemispheres.
Following approximately 60 sessions of training using frontal beta sup-
pression and additional protocols to modulate centroparietal activity, a
repeat qEEG was performed. The EEG was now read as within normal
limits and difference topographs comparing the two recordings show a
marked decrease in anterior beta. Database comparisons indicated that
there was no longer significantly elevated anterior beta or significantly
decreased anterior beta coherence. This was accompanied by marked
clinical improvement documented by parents and teachers.
The outcome following qEEG guided neurofeedback is summarized
below:
Before After
Chronic generalized
anxiety
Occasional moments of anxiety that are
appropriate to the situation
Separation anxiety Gone � now able to be away from home for
several days with friends or family
Chronic insomnia Able to fall asleep easily without anyone
staying with him
Sleep disturbances
(sleep walking)
No longer does this
Hyperactivity
“drumming”
Physical activity is now purposeful and within
normal limits, no more drumming
Frustration tolerance Now able to tolerate more frustrating
circumstances without over reacting
Lack of impulse
control
Now able to stop and consider consequences
Unable to establish
friendships
Now has several good friends
It cannot be concluded that neurofeedback was the sole reason for
clinical improvement but given prior repeated trials with medication and
behavioral counseling, it is clear that neurofeedback had an important
influence on favorable clinical outcome.
USING EEG TO GUIDE TRANSCRANIAL MAGNETICSTIMULATION
Puri and Lewis (1996) suggested that transcranial magnetic stimulation
(TMS) is a viable and important tool for diagnosis and therapy in
17Quantitative EEG to Predict Therapeutic Outcome in Neuropsychiatric Disorders

psychiatric disorders. Subsequently, transcranial magnetic stimulation has
been the subject of many hundreds of research studies over the past
decade. Two main types of stimulation typically are used: low frequency
stimulation (,1 Hz, “TMS”) and high frequency stimulation (.5 Hz,
“repetitive TMS”, or “rTMS”). Low frequency high field stimulation
generally produces inhibitory effects and higher frequency stimulation
produces excitatory effects. TMS is currently being studied as a potential
treatment for many disorders including epilepsy, depression, bipolar disor-
der, schizophrenia, posttraumatic stress disorder, obsessive�compulsive
disorder, anxiety, stroke, and chronic pain. Numerous reviews of the tech-
nology and applications are now available (see George & Belmaker, 2006;
Wassermann, Epstein, & Ziemann, 2008).
Most clinical work has been directed toward the treatment of depres-
sion, using rTMS over the left dorsolateral prefrontal cortex. In a recent
review Brunelin et al. (2007) stated “the antidepressive properties of
rTMS now appear obvious”. Rosenberg et al. (2002) studied rTMS to left
frontal cortex in patients with major depression. Stimulation was focused
5 cm anterior to the site of optimal motor stimulation. Seventy-five per-
cent of the patients had a significant antidepressant response to rTMS, and
50% had sustained response at 2-month follow-up.
Overall, research shows the technique to be safe (Janicak et al., 2008).
Lisanby et al. (2009) demonstrated efficacy using daily rTMS in a popula-
tion of 164 individuals with major depression, showing a 22% reduction
in symptoms compared to 9% with a sham control. It is clear that
although rTMS may be clinically useful, it is not yet an optimal treatment,
and techniques are needed to improve efficacy, particularly with treat-
ment-resistant depression. One method used to improve efficacy was indi-
vidualized placement of the stimulating coil by means of structural MRI
(Fitzgerald et al., 2009). These researchers report significantly improved
depression scales following 4 weeks of rTMS by using coil placement
based on individual MRI compared to standard placement based on the
motor response.
Jin et al. (2006) used measurement of individual alpha frequency
to set stimulation rates in an rTMS study of schizophrenics. A series of
27 subjects with predominantly negative symptoms of schizophrenia
received daily rTMS to midfrontal cortex for a period of 2 weeks. The
authors documented that rTMS based on individualized alpha frequency
(“αTMS”), significantly improved the therapeutic effect compared to
lower frequency, higher frequency, and sham stimulation. In addition,
18 Jack Johnstone and Joy Lunt

therapeutic improvement was highly correlated with increased frontal
alpha activity.
Magno-EEG resonant therapy (MERT) is an innovative form of TMS
developed by Jin (personal communication, 2010). The MERT technique
uses EEG to identify stimulus intensity, frequency, location, and duration
needed to normalize EEG activity, particularly the dominant alpha frequency.
Most rTMS protocols use the same frequency, location, and duration of stim-
ulation on all patients, and do not consider intrinsic EEG frequency. With
MERT, a customized treatment is developed for each individual based on
analysis of the resting EEG.
MERT has been used primarily to target the dominant background
EEG activity. The amount and frequency of EEG alpha activity, typically
in the 8�13 Hz range, has been shown to be associated with overall brain
metabolism, as well as cognitive functions generally, and a variety of types
of mental disorders. Research is now being directed towards study of
depression, anxiety, schizophrenia, and addiction. Further work obviously
will be needed to specify optimal frequencies and stimulation techniques
for different disorders.
CONCLUSION
A growing body of literature suggests there is significant value in using
EEG information for guiding clinical intervention with medication, neu-
rofeedback, and TMS. Studies of medication have largely focused on
applications in depression and schizophrenia. Further work should extend
this approach to additional clinical populations. Further development of
predictive algorithms should emphasize newer pharmaceutical and neutra-
ceuticals, used separately and in combination with other agents of the
same or different classes. In addition, more detailed outcome measures
beyond clinical global improvement scales should be employed in studies
that use a combination of agents.
Research on neurofeedback would also benefit from development of
predictive algorithms that combine behavioral analysis, neurocognitive
assessment, and neurophysiological methods. It is expected that specific
constellations of these features could be identified to more objectively
guide development of successful neurofeedback protocols.
Much research is under way to apply transcranial magnetic stimulation to
problems in neurology and psychiatry. Basic research to facilitate our under-
standing of intracranial current flow is likely to be helpful in optimizing
19Quantitative EEG to Predict Therapeutic Outcome in Neuropsychiatric Disorders

rTMS procedures. Further individualization of stimulation rates and stimula-
tion site(s) based on EEG and ERP features will also likely increase clinical
efficacy of these techniques.
REFERENCESAdler, L. E., Pachtman, E., Franks, R. D., Pecevich, M. C., Waldo, M., & Freedman, R.
(1982). Neurophysiological evidence for a defect in neuronal mechanisms involved insensory gating in schizophrenia. Biological Psychiatry, 17, 639�655.
Arns, M., Gunkelman, J., Breteler, M., & Spronk, D. (2008). EEG phenotypes predicttreatment outcome to stimulants in children with ADHD. Journal of IntegrativeNeuroscience, 7, 421�438.
Boutros, N., Mirolo, H. A., & Struve, F. (2005). Normative data for the unquantifiedEEG: Examination of adequacy for neuropsychiatric research. Journal ofNeuropsychiatry and Clinical Neuroscience, 17, 84�90.
Brockhaus-Dumke, A., Mueller, R., Faigle, U., & Klosterkoetter, J. (2008). Sensory gatingrevisited: Relation between brain oscillations and auditory evoked potentials in schizo-phrenia. Schizophrenia Research, 99, 238�249.
Brunelin, J., Poulet, E., Boeuve, C., Zeroug-vial, H., d’Amato, T., & Saoud, M. (2007).Efficacy of repetitive transcranial magnetic stimulation (rTMS) in major depression: Areview. L’Encephale (abstract in English), 33, 126�134.
Burgess, A., & Gruzelier, J. (1993). Individual reliability of amplitude distribution intopographic mapping of EEG. Electroencephalography and Clinical Neurophysiology, 86,219�223.
Coben, R. (2007). Connectivity guided neurofeedback for autistic spectrum disorder.Biofeedback, 35, 131�135.
Coben, R., & Padolsky, I. (2007). Assessment guided neurofeedback for autistic spectrumdisorder. Journal of Neurotherapy, 11, 5�23.
Coburn, K. L., Lauterbach, E. C., Boutros, N. N, Black, K. J., Arciniegas, D. B., &Coffet, C. E. (2006). The value of quantitative electroencephalography in clinical psy-chiatry: Committee on research of the American Neuropsychiatric Association.Journal of Neuropsychiatry and Clinical Neuroscience, 18, 460�500.
DeBattista, C., Kinrys, G., & Hoffman, D. (2009). Referenced-EEGs (rEEGs) efficacycompared to STARD for patients with depression treatment failure. Presented at USPsychiatric and Mental Health Congress, 2009.
Fein, G., Galin, D., Johnstone, J., Yingling, C. D., Marcus, M., & Kiersch, M. (1983).EEG power spectra in normal and dyslexic children: I. Reliability during passive con-ditions. Electroencephalography and Clinical Neurophysiology, 55, 399�405.
Fein, G., Galin, D., Yingling, C. D., Johnstone, J., & Nelson, M. A. (1984). EEG spectrain 9-13 year old boys are stable over 1-3 years. Electroencephalography and ClinicalNeurophysiology, 58, 517�518.
Fernandez, T., Harmony, T., Rodriguez, M., Reyes, A., Marosi, E., & Bernal, J. (1993).Test�retest reliability of EEG spectral parameters during cognitive tasks: I. Absoluteand relative power. International Journal of Neuroscience, 68, 255�261.
Fitzgerald, P. B., Hoy, K., McQueen, S., Maller, J. J., Herring, S., Segrave, R., et al.(2009). A randomized trial of rTMS targeted with MRI based neuro-navigation intreatment-resistant depression. Neuropsychopharmacology, 34, 1255�1262.
Freedman, R., Adler, L., Waldo, M., Pachtman, E., & Franks, R. (1983).Neurophysiological evidence for a defect in inhibitory pathways in schizophrenia:A comparison of medicated and drug-free patients. Biological Psychiatry, 18, 989�1005.
20 Jack Johnstone and Joy Lunt

Gasser, T., Bacher, P., & Steinberg, H. (1985). Test�retest reliability of spectral parametersof the EEG. Electroencephalography and Clinical Neurophysiology, 60, 312�319.
George, M. S., & Belmaker, R. H. (Eds.), (2006). Transcranial magnetic stimulation in clinicalpsychiatry. Arlington, VA: American Psychiatric Publishing.
Gerber, P. A., Chapman, K. E., Chung, S. S., Drees, C., Maganti, R. K., Ng, Y., et al.(2008). Interobserver agreement in the interpretation of EEG patterns in critically illadults. Journal of Clinical Neurophysiology, 25, 241�249.
Harmony, T., Fernandez, T., Rodriguez, M., Reyes, A., Marosi, E., & Bernal, J. (1993).Test�retest reliability of spectral parameters during cognitive tasks: II. Coherence.International Journal of Neuroscience, 68, 263�271.
Hughes, J. R., & John, E. R. (1999). Conventional and quantitative electroencephalogra-phy in psychiatry. Journal of Neuropsychiatry and Clinical Neurosciences, 11, 190�208.
Janicak, P. G., O’Reardon, J. P., Sampson, S. M., Husain, M. M., Lisanby, S. H., Rado, J. T., et al.(2008). Transcranial magnetic stimulation (TMS) in the treatment of major depression: Acomprehensive summary of safety experience from acute exposure, extended exposureand during reintroduction treatment. Journal of Clinical Psychiatry, 69, 222�232.
Jarusiewicz, B. (2002). Efficacy of neurofeedback for children in the autistic spectrum:A pilot study. Journal of Neurotherapy, 6, 39�49.
Jin, Y., Potkin, S. G., Kemp, A. S., Huerta, S. T., Alva, G., Thai, T. M., et al. (2006).Therapeutic effects of individualized alpha frequency transcranial magnetic stimulation(αTMS) on the negative symptoms of schizophrenia. Schizophrenia Bulletin, 32,556�561.
Johnstone, J. (2008). A three-stage neuropsychological model of neurofeedback: Historicalperspectives. Biofeedback, 36, 142�147.
Johnstone, J., & Gunkelman, J. (2003). Use of databases in qEEG evaluation. Journal ofNeurotherapy, 7, 31�52.
Johnstone, J., Gunkelman, J., & Lunt, J. (2005). Clinical database development:Characterization of EEG phenotypes. Clinical Electroencephalography and Neuroscience,36, 99�107.
Johnstone, J., & Lunt, J. (2007). NF sum training for patterns with shifting laterality. Oralpresentation, International Society for Research and Neurofeedback Annual Meeting,San Diego, CA, September 7, 2007.
Juckel, G., Molnar, M., Hegert, U., Csepe, V., & Karmos, G. (1997). Auditory evokedpotentials as indicator of brain serotonergic activity: First evidence in behaving cats.Biological Psychiatry, 41, 1181�1195.
Juckel, G., Pogarell, O., Augustin, H., Mulert, C., & Muller-Siecheneder, F. (2007).Differential prediction of first clinical response to serotongergic and norandrener-gic antidepressants using the loudness dependence of auditory evoked potentials inpatients with major depressive disorder. Journal of Clinical Psychiatry, 68,1206�1212.
Juckel, G., Schumacher, C., Giegling, I., Assion, H-J., Mavrogiorgou, P., Pogarell, O., et al.(2010). Serotonergic functioning as measured by the loudness dependence of auditoryevoked potentials is related to a haplotype in the brain-derived neurotrophic factor(BDNF) gene. Journal of Psychiatric Research, 44, 541�546.
Klimesch, W., Sauseng, P., Hanslmayr, S., Gruber, W., & Freunberger, R. (2007). Event-related phase reorganization may explain evoked neural dynamics. Neuroscience andBehavioral Reviews, 31, 1003�1016.
Leocani, L., & Comi, G. (1999). EEG coherence in pathological conditions. Journal ofClinical Neurophysiology, 16, 548�555.
Leuchter, A. F., Cook, I., Hunter, A., & Korb, A. (2009). Use of clinical electrophysiologyfor the selection of medication in the treatment of major depressive disorder: The stateof the evidence. Clinical Electroencephalography and Neuroscience, 49, 78�83.
21Quantitative EEG to Predict Therapeutic Outcome in Neuropsychiatric Disorders

Leuchter, A. F., Cook, I., Marangell, L. B., Gilmer, W. S., Burgoyne, K. S., Howland, R. H.,et al. (2009a). Comparative effectiveness of biomarkers and clinical indicators for predict-ing outcomes of SSRI treatment in Major Depressive Disorder: Results of the BRITE-MD study. Psychiatry Research, 169, 124�131.
Leuchter, A. F., Cook, I., Gilmer, W. S., Marangell, L. B., Burgoyne, K. S., Howland,R. H., et al. (2009b). Effectiveness of a quantitative electroencephalographic biomarkerfor predicting differential response or remission with escitalopram and bupropion inmajor depressive disorder. Psychiatry Research, 169, 132�138.
Lisanby, S. H., Husain, M. M., Rosenquist, P. B., Maixner, D., Gutierrez, R., Krystal, A.,et al. (2009). Daily left prefrontal repetitive transcranial magnetic stimulation (rTMS)in the acute treatment of major depression: Clinical predictors of outcome in a multi-site, randomized controlled clinical trial. Neuropsychopharmacology, 34, 522�534.
Lubar, J. (1985). EEG biofeedback and learning disabilities. Theory into Practice, 26,106�111.
Lund, T. R., Sponheim, S. R., Iacono, W. G., & Clementz, B. A. (1995). Internal consis-tency reliability of resting EEG power spectra in schizophrenic and normal subjects.Psychophysiology, 32, 66�71.
Niedermeyer, E., & Lopes da Silva, F. (Eds.), (2004). Electroencephalography: Basic principles,clinical applications, and related fields (5th ed.). Philadelphia: Lippincott Williams &Wilkins.
Nuwer, M. (1997). Assessment of digital EEG, quantitative EEG, and EEG brain mapping:Report of the American Academy of Neurology and the American ClinicalNeurophysiology Society. Neurology, 49, 277�292.
Mulert, C., Juckel, G., Brunnmeier, M., Karch, S., Leicht, G., Mergi, R., et al. (2007).Rostral anterior cingulate cortex activity in the theta band predicts response to anti-depressant medication. Clinical Electroencephalography and Neuroscience, 38, 78�81.
Olincy, A., Harris, J. G., Johnson, L. L., Pender, V., Kongs, S., Allensworth, D., et al.(2006). Proof-of-concept trial of an α7 nicotinic agonist in schizophrenia. Archives ofGeneral Psychiatry, 63, 630�638.
Patterson, J. V., Hetrick, W. P., Boutros, N. N., Jin, Y., Sandman, C., Stern, H., et al.(2008). P50 Sensory gating ratios in schizophrenics and controls: A review and dataanalysis. Psychiatry Research, 158, 226�247.
Piccinelli, P., Viri, M., Zucca, C., Borgatti, R., Romeo, A., Giordano, L., et al. (2005).Inter-rater reliability of the EEG reading in patients with childhood idiopathic epi-lepsy. Epilepsy Research, 66, 195�198.
Puri, B. K., & Lewis, S. W. (1996). Transcranial magnetic stimulation in psychiatricresearch. British Journal of Psychiatry, 169, 675�677.
Rosenberg, P. B., Mehndiratta, R. B., Mehndiratta, Y. P., Wamer, A., Rosse, R. B., &Balish, M. (2002). Repetitive transcranial magnetic stimulation treatment of comorbidposttraumatic stress disorder and major depression. Journal of Neuropsychiatry andClinical Neurosciences, 14, 270�276.
Rosburg, T., Trautner, P., Fell, J., Moxon, K. A., Elger, C. E., & Boutros, N. N. (2009).Sensory gating in intracranial recording: The role of phase locking. NeuroImage, 44,1041�1049.
Rush, A. J., Trivedi, M. H., Wisniewski, S. R., Nierenberg, A. A., Stewart, J. W.,Warden, D., et al. (2006). Acute and longer-term outcomes in depressed outpatientsrequiring one or several treatment steps: A STARD report. American Journal ofPsychiatry, 163, 1905�1917.
Saletu, B., Anderer, P., & Saletu-Zyhlarz, G. M. (2006). EEG topography and tomography(LORETA) in the classification and evaluation of the pharmacodynamics of psycho-tropic drugs. Clinical Electroencephalography and Neuroscience, 37, 66�80.
22 Jack Johnstone and Joy Lunt

Salinsky, M. C., Oken, B. S., & Morehead, L. (1991). Test�retest reliability in EEG fre-quency analysis. Electroencephalography and Clinical Neurophysiology, 79, 382�392.
Spencer, S. S., Williamson, P. D., Bridgers, S. L., Mattson, R. H., Cicchetti, D. V., &Spencer, D. D. (1985). Reliability and accuracy of localization by scalp ictal EEG.Neurology, 35, 1567�1575.
Sterman, M. B. (2000). Basic concepts and clinical findings in the treatment of seizure dis-orders with EEG operant conditioning. Clinical Electroencephalography, 31, 45�55.
Sterman, M. B., & Friar, L. (1972). Suppression of seizures in epileptics following sensori-motor EEG feedback training. Electroencephalography and Clinical Neurophysiology, 33,89�95.
Struve, F. A. (1985). Clinical electroencephalography as an assessment method in psychiat-ric patients. In R. C. Hall, & T. P. Beresford (Eds.), Handbook of psychiatric diagnosticprocedures (Vol. 2, pp. 1�48). New York: Spectrum Publications.
Suffin, S. C., & Emory, W. H. (1995). Neurometric subgroups in attentional and affective disor-ders and their association with pharmacotherapeutic outcome. Clinical Electroencephalography,26, 76�83.
Suffin, S. C., Gutierrez, N. M., Karan, S., Aurora, G., Emory, W. H., & Kling, A. (2007).A QEEG database method for predicting pharmacotherapeutic outcome in refractorymajor depressive disorders. Journal of American Physicians and Surgeons, 12, 104�108.
Tansey, M. A. (1984). EEG sensorimotor rhythm biofeedback training: Some effects on theneurological precursors of learning disabilities. International Journal of Psychophysiology, 3,85�99.
Thatcher, R. W. (2010). Validity and reliability of quantitative electroencephalography.Journal of Neurotherapy, 14, 122�152.
Thatcher, R. W., Biver, C., & North, D. (2003). Quantitative EEG and the Frye andDaubert standards of admissibility. Clinical Electroencephalography, 34, 39�53.
Thatcher, R. W., & Lubar, J. F. (2009). History of the scientific standards of qEEG norma-tive databases. In T. H. Budzynski, H. K. Budzynski, J. R. Evans, & A. Abarbanel(Eds.), Introduction to quantitative EEG and neurofeedback (2nd ed., pp. 29�62). NewYork: Academic Press.
Wassermann, E., Epstein, C., & Ziemann, U. (Eds.), (2008). Oxford handbook of transcranialstimulation. New York: Oxford University Press.
Williams, G. W., Luders, H. O., Brickner, A., Goormastic, M., & Klass, D. W. (1985).Interobserver variability in EEG interpretation. Neurology, 35, 1714�1719.
Williams, G. W., Lesser, R. P., Silvers, J. B., Brickner, A., Goormastic, M., Fatica, K. J., et al.(1990). Clinical diagnoses and EEG interpretation. Cleveland Clinic Journal of Medicine, 57,437�440.
23Quantitative EEG to Predict Therapeutic Outcome in Neuropsychiatric Disorders

This page intentionally left blank

CHAPTER22EEG Source Analysis: Methodsand Clinical ImplicationsMarco Congedo1 and Leslie Sherlin21ViBS Team (Vision and Brain Signal Processing), GIPSA-Lab, National Center for Scientific Research(CNRS), Grenoble University, Grenoble, France2Neurotopia, Inc., Los Angeles, California; Nova Tech EEG, Inc., Mesa, Arizona, and Southwest College ofNaturopathic Medicine, Tempe, Arizona, USA
Contents
Introduction 25Method 27
Principles of EEG Physics 27Volume Conduction and EEG 28The Concept of Statistical Correlation 29The Concept of Blind Source Separation (BSS) 33Performing BSS by Decorrelation 34Conditions for Successful BSS 37
Clinical Examples 39Discussion 43References 44
INTRODUCTION
Over the past two decades analysis of electroencephalographic (EEG) record-
ings has received a strong growth thanks to the discovery of “source analysis”.
By this we mean moving from the sensor space, the data as recorded from the
extracranial electrodes, into the source space, representing some form of
intracranial current source that generates the observed measurement. This
movement has somewhat compensated for the poor spatial resolution of
EEG, and therefore this neuroimaging modality has been rediscovered and is
now among the much more sophisticated and newer modalities such as
MEG (magnetoencephalography), fMRI (functional magnetic resonance
imaging), PET (positron emission tomography), and nIRS (near infra-red
spectroscopy).
25Neurofeedback and Neuromodulation Techniques and ApplicationsDOI: 10.1016/B978-0-12-382235-2.00002-0
© 2011 Elsevier Inc.All rights reserved.

EEG source analysis has been applied purposefully in cognitive and
clinical studies. More recently it has also become prominent in real-time
EEG applications such as neurofeedback and brain�computer interface. Those
applications best exploit the high-temporal resolution of EEG, due to the
high sampling rate of EEG (in the order of milliseconds) and the fact that
EEG signals instantaneously grasp electrical current variations in the brain.
But what do we mean in practice by “source analysis”? Two major
families of EEG source analysis methods can be found currently in the
literature: (1) the methods based on a head model and an inverse solution
(e.g., Pascual-Marqui, Michel, & Lehmann, 1994), which attempt to
localize the current source in the brain; and (2) the so-called “blind” or
“semi-blind” methods (e.g., Congedo, Gouy-Pailler & Jutten, 2008),
which attempt to recover the source time course without explicitly
modeling the subject’s head. We have been using both the first (Lubar,
Congedo, & Askew, 2003; Sherlin & Congedo, 2005; Sherlin et al., 2007)
and second kind of methods (Gouy-Pailler, Congedo, Brunner, Jutten, &
Pfurtscheller, 2010; Van der Loo et al., 2009). The two families can be
fruitfully combined by applying a blind method before the source locali-
zation (Congedo, Lotte, & Lecuyer, 2006). In this chapter we will con-
centrate on the second family of methods mentioned, the blind source
separation (BSS), and, more particularly, on a unified flexible technique
that has proven to be useful in many different experimental and clinical
situations.
The goal of this chapter is to explain and illustrate the appeal of BSS
for EEG data, focusing on neurofeedback applications. We explicitly
address readers without a strong mathematical background, mainly medi-
cal doctors and clinicians, preferring an intuitive understanding of the
material rather than a formal one. This chapter can be conceived as a
journey starting from the physical basis of EEG recordings, the concept of
correlation, passing through the understanding of the blind source separa-
tion concept, to finally see why and how the technique turns out to be
very useful in neurofeedback. We hope that at the end of this chapter the
reader will be left with a conceptual understanding of the BSS concepts,
which usually are treated formally by and for engineers. We intentionally
refrain from using linear algebra notation, the natural language for the
multivariate EEG source analysis. For a more formal treatment of the
material presented here we refer to the review paper by Congedo et al.
(2008). The main ideas expressed in this chapter have been foreseen in
Congedo and Joffe (2007).
26 Marco Congedo and Leslie Sherlin

METHOD
Principles of EEG PhysicsEEG source analysis methods can be understood considering the theory
of brain volume conduction, that is, how the current in the brain reaches
the electrode sensors. It is well established that the generators of brain
electric fields recordable from the scalp are macroscopic post-synaptic
potentials created by assemblies of pyramidal cells of the neocortex
(Speckmann & Elger, 2005). Pyramidal cells are aligned and oriented per-
pendicularly to the cortical surface. Synchronous firing of these cells is
possible thanks to a dense net of local horizontal connections (mostly
,1 mm). At recording distances larger than about three/four times the
diameter of the synchronized assemblies the resulting post-synaptic poten-
tial behaves as if it were produced by electric dipoles, that is, as if in a
propagating medium we were recording from a distance the potential var-
iations created by batteries of alternating current. More formally stated,
in the multipole expansion higher terms vanish and we may be satisfied
by such dipole approximation (Lopes da Silva & Van Rotterdam, 2005;
Nunez & Srinivasan, 2006, Ch. 3). As is well known, electromagnetic
phenomena are governed by the four Maxwell equations. Three physical
phenomena justify a tremendous simplification of such electromagnetic
equations in the case of scalp EEG:
1. Unless dipoles are moving there is no appreciable delay in the scalp sensor
measurement (Lopes da Silva & Van Rotterdam, 2005), i.e., all sensors
record the current of all dipoles simultaneously and instantaneously.
2. In brain electric fields there is no appreciable electromagnetic coupling
(magnetic induction) in frequencies up to about 1 MHz, thus the
quasi-static approximation of Maxwell equations holds throughout the
spectrum of interest (Nunez & Srinivasan, 2006, pp. 535-540).
3. For source oscillations below 40 Hz it has been verified experimentally
that capacitive effects are also negligible, implying that potential differ-
ence is in phase with the corresponding generator (Nunez & Srinivasan,
2006, p. 61).
These three phenomena strongly support the linear superposition princi-
ple, according to which the relation between neocortical dipolar fields and
scalp potentials may be approximated by a system of linear equations (see
Sarvas, 1987 for the equations for MEG), which we will explain next.
Despite this being a great simplification, we need to keep in mind that
scalp EEG may reflect only macroscopic cerebral phenomena, that is, a
27EEG Source Analysis: Methods and Clinical Implications
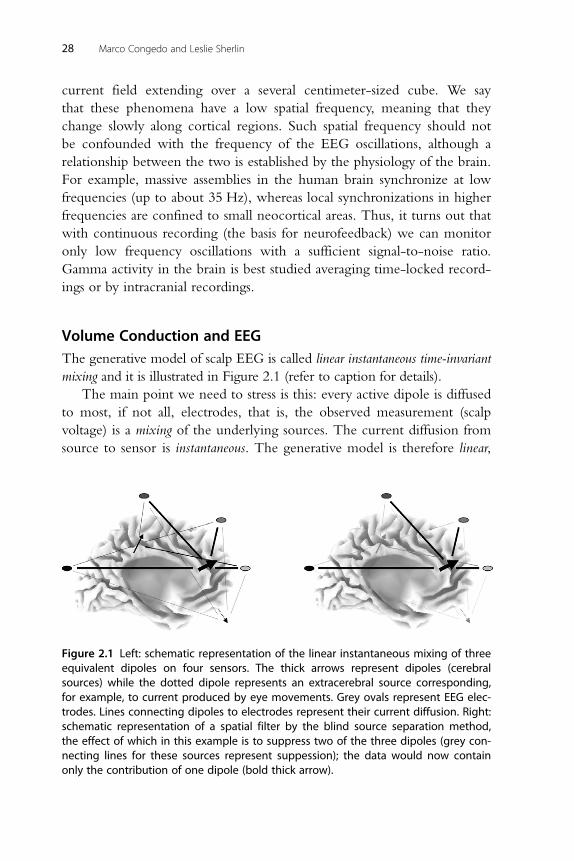
current field extending over a several centimeter-sized cube. We say
that these phenomena have a low spatial frequency, meaning that they
change slowly along cortical regions. Such spatial frequency should not
be confounded with the frequency of the EEG oscillations, although a
relationship between the two is established by the physiology of the brain.
For example, massive assemblies in the human brain synchronize at low
frequencies (up to about 35 Hz), whereas local synchronizations in higher
frequencies are confined to small neocortical areas. Thus, it turns out that
with continuous recording (the basis for neurofeedback) we can monitor
only low frequency oscillations with a sufficient signal-to-noise ratio.
Gamma activity in the brain is best studied averaging time-locked record-
ings or by intracranial recordings.
Volume Conduction and EEGThe generative model of scalp EEG is called linear instantaneous time-invariant
mixing and it is illustrated in Figure 2.1 (refer to caption for details).
The main point we need to stress is this: every active dipole is diffused
to most, if not all, electrodes, that is, the observed measurement (scalp
voltage) is a mixing of the underlying sources. The current diffusion from
source to sensor is instantaneous. The generative model is therefore linear,
Figure 2.1 Left: schematic representation of the linear instantaneous mixing of threeequivalent dipoles on four sensors. The thick arrows represent dipoles (cerebralsources) while the dotted dipole represents an extracerebral source corresponding,for example, to current produced by eye movements. Grey ovals represent EEG elec-trodes. Lines connecting dipoles to electrodes represent their current diffusion. Right:schematic representation of a spatial filter by the blind source separation method,the effect of which in this example is to suppress two of the three dipoles (grey con-necting lines for these sources represent suppession); the data would now containonly the contribution of one dipole (bold thick arrow).
28 Marco Congedo and Leslie Sherlin

meaning that we can write the voltage of the ith electrode as a linear
combination (weighted sum) of source activity, such as
xiðtÞ5 ai1 � s1ðtÞ1 ai2 � s2ðtÞ1 . . .1 aiM � sM ðtÞ ð2:1Þwhere xi(t) is the ith electrode measurement at time instant t, s1(t). . .sM(t)are the contributions of M visible sources at the same time instant and the
ai1. . .aiM are the mixing coefficients uniquely expressing the relation
between source s1(t). . .sM(t) and the ith electrode. Note that some mixing
coefficients may be null, thus the above generative model is quite general,
having the ability to relate the sensor measurement to any number and
configuration of underlying sources. Also, note that in this particular
model the mixing coefficients do not depend on time, that is, they are
fixed. That is why we call the model time-invariant. Above all, keep in mind
that the mixing coefficients will depend on source position, intensity, pole
separation, and orientation. The smaller the distance between the source
and the electrode, the higher the coefficients will be. The coefficients will
also be higher for dipoles pointing in the direction of the electrode and
vanishing as the dipole is perpendicular to such direction (Nunez &
Srinivasan, 2006). This phenomenon, explains why “source localization”
cannot be attained using scalp topographical maps, and is illustrated in
Figure 2.2 (refer to caption for details).
In summary, in addition to the simplification of the superposition
principle aforementioned, our generative model implicitly assumes that
the dipoles have fixed location and orientation during the observation
period. However, their activity may be intermittent during the observa-
tion period. These are reasonable assumptions as the dipole location and
orientation are fixed by cortical anatomy. With these assumptions in
mind, let us now explore the concept of correlation, which will open the
way to understanding the blind source separation (BSS) process.
The Concept of Statistical CorrelationThe Pearson product-moment correlation is a well-known concept. Two variables
are said to be positively correlated if when one increases the other tends to
increase as well. They are said to be negatively correlated when one increases
and the other tends to decrease. They are said to be non-correlated if there
is neither of these tendencies. An important characteristic of correlation is
that it is a dimensionless measure (standardized), meaning that correlations
obtained on different pairs of variables are comparable, regardless of the unit
29EEG Source Analysis: Methods and Clinical Implications

in which the variables are expressed. For example, suppose we suspect that
there is a relationship between age and weight of individuals. Figure 2.3 shows
the scatter plot of 456 random cases taken from the NHANES database (see
caption for details). As can be seen from the plot, there is a significant positive
correlation between age and weight up until about age 20, then the correla-
tion disappears. If instead of the weight in kilograms we take the weight in
pounds, we obtain exactly the same correlation values. Furthermore if we
Position ofmax absolutepotential
Tangential component
Tangential plane
Radial component
λ
Radius
Figure 2.2 Schematic representation of the current diffusion for radial and tangentialdipoles in an infinite homogeneous isotropic conductive spherical medium, whichonly roughly approximates the human head. The dipoles extend within the smallsphere labeled as “λ”. If the direction of the dipole is radial (indicated by the boldarrow) the maximum observed voltage on the surface of the sphere will be in theposition indicated by the bold square. If the direction of the dipole is tangential(indicated by a light arrow), the maximum absolute observed voltage on the surfaceof the sphere will be approximately in the position indicated by the two lightsquares. Thus, whereas the radial dipole will result in a monopolar scalp map, thetangential dipole will result in a bipolar scalp map, although the position ofthe dipole is exactly the same.
30 Marco Congedo and Leslie Sherlin

consider next the correlation between age and height and the two values of
correlations differ, we can compare the two correlations and say that one is
stronger then the other. The perfect negative correlation is equal to 21
and the perfect positive correlation is equal to 11, while two variables are
said to be perfectly uncorrelated if the correlation equals zero. Perfect cor-
relation is obtained if the points of the scatter plot align perfectly; the more
the data points are dispersed the smaller the correlation. If the data are
normally distributed, a spherical cloud of data points always indicates the
absence of correlation. Correlation exists only if the cloud assumes an ellip-
soidal shape with inclined axes. The concept of correlation is entangled
with the concepts of linear regression and prediction. In fact, if two variables
are correlated we may obtain a prediction of the value of either variable
knowing the value of the other; i.e., if the correlation is significant, the lin-
ear regression is necessarily significant (the slope of the line best fitting the
scatter plot is significantly different from zero). For instance, in Figure 2.3
it appears obvious that knowing the age of an individual after age 20 does
not give us an indication about what his/her weight would be, but a rea-
sonable weight range can be predicted for age 0�20. Indeed, such ranges
200.0
166.7
133.3
100.0
Wei
ght
66.7
33.3
0.00.0 10.0 20.0 30.0 40.0 50.0
Age
60.0 70.0 80.0 90.0 100.0
Figure 2.3 Scatter plot age/weight of 456 random cases taken from the NHANES(National Health and Nutrition Examination Survey) database. (Source: http://www.denofinquiry.com/nhanes/source/choose.php.)
31EEG Source Analysis: Methods and Clinical Implications

are given to pediatric doctors in the form of percentiles (confidence inter-
vals) to check the normal growth of our children.
When it comes to time-series, particularly sinusoidal time-series
(which is the case with EEG oscillations), the correlation depends on the
phase of the sinusoids. Figure 2.4 depicts two periods of three sinusoids
with identical frequency, but different phase. The phase difference or shift
between any one of the three sinusoids and itself is zero, thus the autocor-
relation is obviously exactly 11. The phase shift between the sinusoids
shown top and middle is 180� (half of a cycle). That is, the middle wave
is the top wave with the sign switched; thus their correlation is exactly
equal to 21. You can check from the plot that as one wave rises the other
falls, and vice versa, with no exception. Needless to say, you can predict
exactly the value of the middle wave knowing the value of the top wave,
that is, there is no additional information at all in the middle wave. The
phase shift between the top and bottom sinusoids is 90� (one-quarter of a
cycle), and it happens that at this particular phase shift the correlation is
exactly zero. This relationship is so important that the names sine and
cosine, respectively, have been assigned to these two sinusoids. From what
we have said it follows that a wave with the same frequency and any other
phase shift will be correlated somehow to the sine and to the cosine.
Actually, we can go further and say that any other such wave can be writ-
ten as a linear combination of the sine and cosine. For this reason we say
Figure 2.4 Two cycles of three sinusoidal waves. As compared to the top wave, themiddle wave has a 180� phase shift and the bottom wave a 90� phase shift. See textfor further properties.
32 Marco Congedo and Leslie Sherlin

that the sine and the cosine form an orthogonal basis. This idea informed
the great intuition of Joseph Fourier (1768�1830), who demonstrated
that under rather general conditions any periodic time-series, regardless of
its complexity, and even if it is not at all sinusoidal, can be written as an
infinite sum of sines and cosines at different frequencies. When you com-
pute the power spectrum of the EEG by Fast Fourier Transform (FFT),
you actually compute a non-standardized version of the correlation
between your data and the sine and cosine wave at each discrete frequency
for which you want to compute the power. You do not need to check
the amount of sinusoidal components in your time-series at any phase
shift; you just need to do that for the sine and cosine. Then you add up
the two to obtain the power. It turns out that those two particular waves,
being orthogonal, and thus spanning the whole phase cycle, account by
themselves for any possible phase shift in your data.
The Concept of Blind Source Separation (BSS)One way to perform BSS of human EEG is to require a linear transforma-
tion of the data canceling the correlation between sensor measurements.
What does that mean? In Figure 2.1 we have shown that each electrode
records a mixing of source activity. This would imply that electrode time-
series are correlated, even if the dipole time-series are not correlated. This
happens because the sensor measurements at different electrodes share a
portion of the same sources. Indeed, this is what we observe in continu-
ous EEG recordings. A typical example is given in Figure 2.5 (refer to
caption for details). Arranging all pair-wise correlations between the 19
time-series of Figure 2.5 in a matrix we obtain the correlation matrix,
also shown in graphical form in Figure 2.5. The correlation matrix is far
from being diagonal, that is to say, there is a lot of correlation between
electrodes. An expert eye would see this already in the raw EEG data.
Note also the similarity of the power spectra, autocorrelation functions,
and Hurst exponents of the channels, pointing out, again, the similarity of
the EEG time courses at different electrodes. Turning back to what we
have said about correlation and prediction, let us state that since the cor-
relation among electrodes is high, there is a great deal of redundant infor-
mation in scalp EEG. Redundancy is presented at the scalp electrodes due
to the volume conduction and the fact that the scalp sensors are recording
the summation of all sources, previously described as mixing of signals,
under the electrode site. Such redundancy is a waste, in the sense that we
33EEG Source Analysis: Methods and Clinical Implications

can explain the data with less than 19 time-series, by identifying the unique
information carried by each, just as the sine and cosine alone explain sinus-
oids with any phase shift. It is additionally a distraction, because the signal
at two correlated electrodes is less clear, much like listening to two speeches
mixed together as compared to listening to them separately. Now, assume
the dipolar activity itself is uncorrelated, and let us ask, for instance, whether
we can in some way “filter” the input of the 19 time-series and receive as
output a smaller number of uncorrelated time-series. And even further,
would this filter be able to recover the source activity itself? The answer to
these questions is exactly what BSS attempts to achieve. Next, we will see
how it works and what conditions are necessary for its success.
Performing BSS by DecorrelationConsider the equation 85 4/2. We can invert the 4 and multiply it at
both sides to get 1/43 85 2. Similarly, referring to our mixing model in
Eq 2.1, we want to invert the equations and solve for a given source sj(t)
starting from N scalp electrodes to recover M sources such as
sjðtÞ5 bj1 � x1ðtÞ1 bj2 � x2ðtÞ1 . . .1 bjN � xN ðtÞ ð2:2Þ
Figure 2.5 (See Color Plate Section) From left to right: about 5.5 s of eyes-closed EEGrecorded at the standard 19 leads described by the 10�20 electrode placement sys-tem, the 193 19 correlation matrix of EEG time-series, the power spectra (red plot:1 Hz�32 Hz), autocorrelation function (blue plot: lag5 0�1 s) and Hurst exponent(green bars) of the 19 EEG signals. The entries of the correlation matrix are color coded,with white coding correlation equal to zero and red (blue) coding correlation equal to 1(21). The entries in diagonal are the autocorrelations, hence they all equal 1. Note thatelectrode T3 is much less correlated to other electrodes as compared to the others.This is because it contains a considerable amount of muscle artifacts (as seen alsofrom the high-frequency content of the power spectrum and the flat autocorrelationfunction), which does not distribute through the head to other electrodes.
34 Marco Congedo and Leslie Sherlin
Examples eyes-closed EEG
FP1FP2F7F3FZF4F8T3C3CZC4T4T5P3PZP4T6O1O2
S 1.0 2.0 3.0 4.0 5.0 9 17 25 33 0.3 0.5 0.8 1.0

In Eq 2.2 the coefficients bj1. . .bjN are called demixing coefficients. They
are found “inverting” the mixing coefficients in Eq 2.1 and provide
“weights” to be applied to scalp electrode samples to recover the source,
that is, to suppress all the others. The basic idea of BSS neurofeedback is
to use one or more chosen sources sj(t) as the basis for the feedback signal
and not the raw sensor data. In doing so we obtain two advantages: first,
if the source is successfully extracted the feedback signal truly reflects neo-
cortical oscillations. This is not necessarily true for scalp sensor measure-
ment. Second, by selecting a number of sources we implicitly filter out all
the remaining ones, that is, the feedback signal will not be affected by
irrelevant brain activity and separated artifacts. These two advantages are
often referred to as increased sensitivity and specificity, respectively.
In order to solve Eq 2.2 the mixing coefficients or the demixing coef-
ficients must be estimated. If we estimate them using only the observed
data the method is named “blind” because those coefficients are not mod-
eled using head geometry. As a matter of fact, we want to estimate
both the mixing (or demixing) coefficients and the sources from the data
only. At first, this sounds a little too ambitious. Nonetheless, it can be
shown that such estimation is possible under some mild assumptions on
the sources, which we will list further on, preserving the waveform of the
sources. However, there is a price to pay, which is known as the three BSS
indeterminacies: order, sign, and energy. The order indeterminacy means that
the sources are extracted in an arbitrary order. This implies that, for exam-
ple, if we run the algorithm on different segments of the data we have to
make sure to match the sources in order to compare them. The sign inde-
terminacy means that the actual sign of the sources cannot be known.
Typically this is not a limitation because the relevant information is in the
waveform, not in its sign and measures such as power are invariant under
sign switching. The energy (power) indeterminacy means that the actual
power (in absolute terms) of the sources is not known. Again, typically,
this is not a limitation as, for example in neurofeedback, we are interested
only in the relative power change of the source over time. The sign and
energy indeterminacy have been separated for ease of exposition, however
in reality they amount to the same indeterminacy, referred to together as
the scaling indeterminacy. In fact, multiplying the source time-series for a
scaling factor, which can be positive or negative, we account for both the
sign and energy indeterminacy. Referring to Eq 2.1, let us take the exam-
ple of multiplying each source by a number and its coefficient by its
inverse. The final resulting scalp voltage would not change. If the number
35EEG Source Analysis: Methods and Clinical Implications

is negative the source will switch sign. Hence, all we can do in seeking a
solution to Eq. 2.2 is to artificially fix the scaling of the source, for exam-
ple, by requiring that the output source will have unitary energy, it does
not matter what the sign is.
Assuming that the sources are decorrelated, one may require a linear
transformation of the EEG data resulting in a diagonal correlation matrix
(see Figure 2.5). However, it is well known that a decorrelation of the
EEG time-series alone does not solve the problem. The method to decorr-
elate a multiple time-series is known as principal component analysis
(PCA). PCA has been known since the time of Karl Pearson (1857�1936),
and more recently has been formalized by Harold Hotelling (1895�1973).
For many years researchers have tried to apply PCA to EEG data with
inaccurate results in terms of source extraction. The reason is that there are
infinite numbers of such decorrelating matrices with unitary output that
can be found by PCA. That is, PCA does not estimate the actual sources, it
finds only an economical representation of the data by decorrelating the
input. It is said that PCA solves “half” of the ICA problem. In fact, once
decorrelation is attained by PCA, another transformation is required in
order to obtain the sought solution. This fact can be understood intuitively
in geometrical terms: suppose we have two sensors and two sources and
the data are normally distributed. Once we have decorrelated the sensor
data and forced unitary energy, we see that the scatter plot will form a
circle-shaped cloud of points. Now, you can rotate (a special kind of linear
transformation) the cloud as you wish and the shape will not change, that
is, the data will still be uncorrelated. Every possible rotation will provide a
different linear transformation of the data. The crucial question is, what is
the unique rotation that will recover the actual sources? The same argu-
ment applies for any number of sensors. With three sensors and three
sources the cloud will form a sphere that can be rotated in three dimens-
ions, but the argument is the same. With more than three dimensions the
argument is the same, just; the visualization of the phenomenon becomes
impossible (the cloud will form a hyper-sphere).
A method estimating the actual (de)mixing coefficients under an inde-
pendence assumption, not just an arbitrary decorrelating transformation,
was found in the 1980s by some colleagues of the first author in Grenoble
(Herault & Jutten, 1986; Jutten & Herault, 1991). The method was called
independent component analysis (ICA). This discovery has resulted in a
great deal of research. ICA today is a special case of the broadest family of
BSS algorithms, which are applied in several fields of engineering such as
36 Marco Congedo and Leslie Sherlin

speech enhancement, image processing, geophysical data analysis, wireless
communications, and biological signal analysis.
In this chapter we do not focus on ICA, but on BSS decorrelating
methods. In Congedo, Gouy-Pailler and Jutten (2008) we have argued
that these methods are well adapted to continuously recorded EEG.
Conditions for Successful BSSThe secret to achieving BSS by decorrelation methods is in a theorem
(Afsari, 2008), a detailed explanation of which is beyond the scope of this
chapter. For our purposes, let us accept that we need to find a set of
demixing coefficients respecting data decorrelation plus at least one more
decorrelating condition. According to the principles we have previously
described, the data decorrelation will make the data hyperspherical and
the additional decorrelation condition(s) will find the unique rotation
requested to identify the sources. Data decorrelation implies that the trans-
formed data correlation matrix is diagonal. A suitable transformation of
the data as per Eq 2.2 must diagonalize also at least another matrix of stat-
istics describing the dependence between the EEG time-series. The two
most important ways these additional statistics can be defined are:
1. Considering two or more data segments and requiring that the trans-
formation diagonalize the correlation matrix for all of them.
2. Filter the data in two or more band-pass regions and require that the
transformation diagonalize the correlation matrix for all of them.
The first procedure will succeed if the source energy in the two or more
segments is not constant, but will change in a way that is unique to each
source. For instance, if the subject takes part in two experimental conditions,
those sources activating in one of the two conditions can be found by this
BSS procedure. Another example is the recovering of the generators of par-
ticular EEG rhythms. It will suffice to select two segments, one in which the
rhythm is present and the other where it is absent or substantially reduced,
and diagonalize the correlation matrix for both of them. The second proce-
dure will recover sources as long as their power spectrum is not proportional.
In this case the unique “variation” of the source necessary for its identifica-
tion is not the energy over time or across conditions, but the power spectral
profile itself. The two procedures can be combined to succeed if either of
the two conditions are respected (see Congedo et al., 2008). In practice, the
BSS is more efficient when more than two matrices are jointly diagonalized.
The method to perform such a joint diagonalization has been named
37EEG Source Analysis: Methods and Clinical Implications

Approximate Joint Diagonalization (AJD: Congedo & Pham, 2009; Pham &
Congedo, 2009; Tichavsky & Yeredor, 2009) and will not be detailed here.
In summary, BSS can be obtained by diagonalizing simultaneously a set of
correlation matrices, which may be estimated at different time segments
and/or experimental conditions and/or frequencies. The choice of the
matrix set to be diagonalized is instrumental to the success of the BSS. A val-
idation of BSS obtained with the second procedure (Van der Loo et al.,
2007) is given in Figure 2.6 (see text for details).
Figure 2.6 (See Color Plate Section) A tinnitus patient was implanted with two rows ofeight extradural intracranial recording electrodes. Nineteen scalp electrodes (EEG) andthe intracranial electrodes (iEEG) were recorded simultaneously with a common refer-ence positioned on the vertex. (a) Position of the 19 electrodes on the scalp (10�20 sys-tem). (b) Demonstration of the surgical procedure to insert the extradural electrodes. (c)Computerized tomography of the patient’s head showing the location of the electrodes(over the left secondary auditory cortex). (d) Example 9 seconds of the scalp EEG data.(e) Example 7 seconds of the intracranial data. (f) Four of the 18 sources estimated fromscalp EEG data only with time-course corresponding exactly to the extradural recordingin (e). (g) Correlation matrix between the 18 sources estimated from the scalp EEG andthe eight extradural recordings (iEEG). The first source in (f) is strongly correlated withthe iEEG, which can be seen also from the time-course. The source localization of thefirst source by sLORETA confirmed that the source is generated by the secondary audi-tory cortex (data not shown here; see Van der Loo et al., 2007).
38 Marco Congedo and Leslie Sherlin
20%
20%
20%
20%(a)
(d)
(g)
(e)
(f)
(b) (c)20%
20%
10%
20%
20%
20%
20%
10%
10%
Inion
FP1
EEG (Down recording); 128Hr SR; 1–44Hz band-pass
FP2F7F3FZF4F8T3C3CZC4T4T5P3PZP4T6O1O2
iEEG
EEG source components
s 14.75
±1
EEGsource
(N = 18)
iEEG(N = 8)
0
15.75 16.75
e1
e2
e3
e4
e5
e6
e7
e8
s
s
19.50 20.50 21.50 22.50 23.50 24.50 8 16 24 32 0.3 0.5 0.8 1.0
8 16 24 32 0.3 0.5 0.8 1.019.50 20.50 21.50 22.50 23.50 24.50
Inion
NasionVertex
10%
10%
Nasion
Preauricalpoint
F3
F1T3
A1
Pg1
Fp1Pz
Fp1
Pg1 Pg2
F7
A1 A2
F3
C3C2
C4
P4PzP3
O1O2
F2 F2 F8
T4T3
T5 T6
Fp2
O1
FzCz
P3
C3
T5

CLINICAL EXAMPLES
In this section we demonstrate how and why BSS may prove to be useful
in neurofeedback by giving real data examples.
This first example demonstrates how BSS may be used to isolate
and extract frontal theta activity. Figure 2.7 (top) shows a 4-second epoch
F1 - Raw EEG - Epoch 1
F1 - Raw EEG - Epoch 2
FP1FP2F7F3FZF4F8T3C3CZC4T4T5P3PZP4T6O1O2
S 1.0 2.0 3.0 4.0 8 16 24 32 0.3 0.5 0.8 1.0
FP1FP2F7F3FZF4F8T3C3CZC4T4T5P3PZP4T6O1O2
S 1.0 2.0 3.0 4.0 8 16 24 32 0.3 0.5 0.8 1.0
Figure 2.7 Top: A 4 s epoch (epoch 1) extracted from the raw eyes-open EEG recordingof a 16-year-old female patient with a diagnosis of attention deficit hyperactivity disor-der (inattentive type). From left to right: electrode labels according to the 10�20 inter-national system, raw EEG tracing (upward deflection is negative potential; the spacebetween two horizontal centering lines is 75 μV), average power spectrum (from zero to32 Hz; arbitrary units) and autocorrelation function (the space between two horizontalcentering lines is autocorrelation5 1 in the upward direction and 21 in the downwarddirection). The gray-shaded area in the background of EEG tracings is the global fieldpower, the sum of the square of potentials across electrodes for each sample (arbitraryunits). Bottom: As top but for another 4 s epoch (epoch 2).
39EEG Source Analysis: Methods and Clinical Implications

(epoch 1) extracted from an eyes-open recording of a 16-year-old female
patient with a diagnosis of attention deficit hyperactivity disorder (inattentive
type). Notice the burst of theta sinusoidal activity (around 6�7 Hz), easily
visible at electrode FZ from around second 1 to 3.2. Elsewhere in the epoch,
the dipole layer is almost silent, with low-amplitude patternless tracing
(noise). Figure 2.7 (bottom) shows another 4-second epoch extracted from
the same recording a few seconds later (epoch 2). At this time the frontal
activity of the patient is dominated by more persistent and weaker oscilla-
tions with dominant frequency around 9�10 Hz, which are visible to a
somewhat lesser degree at electrode FZ. Frontal theta activity is virtually
absent in epoch 2, which is instead characterized by strong occipital domin-
ant rhythms at 10�11 Hz (occipital alpha) also spreading frontally (a possible
indication of abnormal brain functioning). It appears obvious that the two
brain states portrayed by these EEG tracings are quite different. Visual
inspection of the entire recording from this patient (not shown) reveals that
the theta burst of epoch 1 is infrequent, whereas generalized alpha, such as in
epoch 2, is more frequent. Attention deficit disorder may manifest itself with
several characteristic patterns of abnormal brain electrical activity, typically
involving the frontal lobe in medial regions. Slowing in the theta and/or
alpha range, depending on age, has been repeatedly reported as a marker of
this disorder (Lubar, 1997). We now show how BSS can help with character-
izing the dipole layer responsible for the theta burst visible in epoch 1.
Figure 2.8 shows the 17 source components estimated by the BSS
algorithm using the second approach aforementioned, here named AJDC
(approximate joint diagonalization of cospectra) and described in detail in
Congedo, Gouy-Pailler and Jutten (2008). Notice that we are using these
two epochs only to estimate the demixing matrix. In Figure 2.8 the com-
ponents are sorted in descending order of explained variance for epoch 1
in the frequency range 1�20 Hz. The first component describes accu-
rately the theta burst of epoch 1, as can be seen by comparing its time
course, power spectrum, and autocorrelation function to the raw tracing
at electrode FZ, its power spectrum and autocorrelation function
(Figure 2.7, top). Notice that in this instance the component does not
seem to have much better SNR (signal-to-noise ratio) as compared to the
raw tracing at FZ. This is due to the fact that the raw tracing has already a
very high SNR; in fact this was the reason to choose this epoch for esti-
mating the source component of interest.
Next, we illustrate on an unknown epoch the gain in SNR and inter-
ference suppression that we can reach via BSS. Figure 2.9 (top) shows
40 Marco Congedo and Leslie Sherlin

another 4 s epoch from the same recording (epoch 3). Figure 2.9 (bottom)
shows the estimated components using the same demixing matrix used to
estimate source components in Figure 2.8. In the raw EEG the tracing at
FZ for this epoch is a mixture of theta and alpha activity, plus a slow
F1 - AJDC Components - Epoch 1
F1 - AJDC Components - Epoch 2
1234567891011121314151617
1234567891011121314151617
S 1.0 2.0 3.0 4.0 8 16 24 32 0.3 0.5 0.8 1.0
S 1.0 2.0 3.0 4.0 8 16 24 32 0.3 0.5 0.8 1.0
Figure 2.8 Top: Source components for epoch 1 in Figure 2.7 top (epoch 1). Fromleft to right: component serial number labels, component tracing (black curves;arbitrary units), average power spectrum (from zero to 32 Hz; arbitrary units) andautocorrelation function (the space between two horizontal centering lines is auto-correlation5 1 in the upward direction and 21 in the downward direction). The grayshaded area in the background of source component tracings is the global fieldpower, the sum of the square of source amplitude across components for each sam-ple (arbitrary units). Bottom: Same as top, but for epoch 2 shown at bottom inFigure 2.7.
41EEG Source Analysis: Methods and Clinical Implications

(,4 Hz) component, as can be seen with help of the power-spectrum.
Compare this time course with the first component extracted by BSS.
This is our component extraction pointing to the dipole layer responsible
for the theta burst in Figure 2.7 (top), which the waveform clearly resem-
bles. Evidently, for this epoch the extracted component as compared to
the FZ tracing displays a much higher SNR, and the alpha oscillation has
been almost completely suppressed.
This example illustrates an important point: each row vector of the
demixing matrix can be conceived as a spatial filter extracting dipole layers
from specific brain regions. BSS components may result in higher SNR and
in the suppression of interference generated in other regions, which
affects the scalp measurement because of volume conduction. The effect
F1 - Raw EEG - Epoch 3
F1 - AJDC Components Epoch 3
FP1FP2F7F3FZF4F8T3C3CZC4T4T5P3PZP4T6O1O2
1234567891011121314151617
S 1.0 2.0 3.0 4.0 8 16 24 32 0.3 0.5 0.8 1.0
S 1.0 2.0 3.0 4.0 8 16 24 32 0.3 0.5 0.8 1.0
Figure 2.9 Raw EEG tracing (top) and source components (bottom) for epoch 3extracted from the recording of the patient. See captions for Figures 2.7 and 2.8.
42 Marco Congedo and Leslie Sherlin

of volume conduction is appreciated comparing the diversity of source
components as compared to raw EEG tracings. Notice also the diversity
of power spectra in the bottom of Figure 2.9 as compared to the top, that
is, of the sources as compared to the raw tracings. The application of this
concept is straightforward. For instance, suppose the experimenter or the
clinician wishes to monitor off-line or on-line the occurrence of frontal
midline theta bursts. Then, instead of using EEG data band-pass filtered
in the frequency region of interest at electrode FZ, he/she may use the
extracted source s(t). At the expense of using more electrodes, he/she
would gain in SNR and/or interference suppression. In this sense, BSS
may be used instead of inverse solutions for monitoring real-time brain
electrical fields (Congedo, Lubar, & Joffe, 2004; Congedo, 2006). Notice
that, in contrast to frequency band-pass filters, BSS spatial filters can sup-
press interference also if it has the same spectral content as the component
of interest. In contrast to spatial filters based on EEG inverse solution, the
weighting vector estimated by BSS does not depend on a head model or
on electrode placement. Moreover, it estimates the orientation of the
dipolar field, with considerable gain in its separation power.
Interestingly, we have performed BSS analysis estimating co-spectral
matrices on as little as 3.5 s of EEG featuring the activity of interest
(epoch 1). This is a demonstration of the efficiency of some BSS algor-
ithms, particularly; those based on second order statistics (Congedo et al.,
2008).
DISCUSSION
In this chapter we have made a journey through physics, electrophysiol-
ogy and statistics to explain on an intuitive level the concept of blind
source separation (BSS). We have argued that BSS can become very useful
for neurofeedback, improving upon existing methods for extracting brain
activity of interest in real-time. BSS-neurofeedback and inverse solution-
neurofeedback are attracting increased interest in the neurofeedback com-
munity. Presently, however, very few neurofeedback software designs
allow these advanced techniques. In order to promote real-time EEG
applications such as those discussed here, a consortium of French
Institutions has developed the Open-ViBE platform (Open Virtual Brain
Environment; Renard et al., 2010). Several neurofeedback scenarios are
already available for Open-ViBE. Open-ViBE is completely free and
open-source and can be downloaded at http://openvibe.inria.fr/.
43EEG Source Analysis: Methods and Clinical Implications

REFERENCESAfsari, B. (2008). Sensitivity analysis for the problem of matrix joint diagonalization,
SIAM. Journal on Matrix Analysis and Applications, 30(3), 1148�1171.Congedo, M. (2006). Subspace projection filters for real-time electromagnetic brain imag-
ing. IEEE Transactions on Biomedical Engineering, 53(8), 1624�1634.Congedo, M., Gouy-Pailler, C., & Jutten, C. (2008). On the blind source separation of
human electroencephalogram by approximate joint diagonalization of second orderstatistics. Clinical Neurophysiology, 119, 2677�2686.
Congedo, M., & Joffe, D. (2007). Multi-channel spatial filters for neurofeedback.In J. Evans (Ed.), Neurofeedback: Dynamics and clinical applications. New York:Haworth Press.
Congedo, M., Lotte, F., & Lecuyer, A. (2006). Classification of movement intention byspatially filtered electromagnetic inverse solutions. Physics in Medicine and Biology, 51,1971�1989.
Congedo, M., Lubar, J. F., & Joffe, D. (2004). Low-resolution electromagnetic tomogra-phy neurofeedback. IEEE Transactions on Neuronal Systems & Rehabilitation Engineering,12(4), 387�397.
Congedo, M., & Pham, D.-T. (2009). Least-squares joint diagonalization of a matrix setby a congruence transformation, SinFra’09 (Singaporean-French IPAL Symposium),Singapore, February 18�20.
Gouy-Pailler, C., Congedo, M, Brunner, C., Jutten, C., & Pfurtscheller, G. (2010).Nonstationary brain source separation for multiclass motor imagery. IEEE Transactionson Biomedical Engineering, 57(2), 469�478.
Herault, J. & Jutten, C. (1986). Space or time adaptive signal processing by neural networkmodels. In: Proceedings of the International Conference on Neural Networks for Computing,Snowbird (Utah), 151, 206�211.
Jutten, C., & Herault, J. (1991). Blind separation of sources, Part 1: an adaptive algorithmbased on neuromimetic architecture. Signal Process, 24(1), 1�10.
Lopes da Silva, F., & Van Rotterdam, A. (2005). Biophysical aspects of EEG and magneto-encephalogram generation. In E. Niedermeyer, & F. Lopes da Silva (Eds.),Electroencephalography. Basic principles, clinical applications, and related fields (5th ed.,pp. 107�125). New York: Lippincott Williams & Wilkins.
Lubar, J. F. (1997). Neocortical dynamics: Implications for understanding the role ofneurofeedback and related techniques for the enhancement of attention. AppliedPsychophysiology and Biofeedback, 22(2), 111�126.
Lubar, J. F., Congedo, M., & Askew, J. H. (2003). Low-resolution electromagnetic tomog-raphy (LORETA) of cerebral activity in chronic depressive disorder. InternationalJournal of Psychophysiology, 49, 175�185.
Nunez, P. L., & Srinivasan, R. (2006). Electric field of the brain (2nd ed.). New York:Oxford University Press.
Pascual-Marqui, R. D., Michel, C. M., & Lehmann, D. (1994). Low resolution electro-magnetic tomography: A new method for localizing electrical activity in the brain.International Journal of Psychophysiology, 18(1), 49�65.
Pham, D.-T., & Congedo, M. (2009). Least square joint diagonalization of matrices underan intrinsic scale constraint, ICA 2009 (8th International Conference on IndependentComponent Analysis and Signal Separation), March 15�18, Paraty, Brasil, 298-305.
Renard, Y., Lotte, F., Gibert, G., Congedo, M., Maby, E., Delannoy, V., et al. (2010).OpenViBE: An open-source software platform to design, test and use brain�computer interfaces in real and virtual environments. PRESENCE: Teleoperators andVirtual Environments, 19(1), 35�53.
44 Marco Congedo and Leslie Sherlin

Sarvas, J. (1987). Basic mathematical and electromagnetic concepts of the biomagneticinverse problem. Physics in Medicine and Biology, 32(1), 11�22.
Sherlin, L., Budzynski, T., Kogan-Budzynski, H., Congedo, M., Fischer, M. E., &Buchwald, D. (2007). Low-resolution electromagnetic brain tomography (LORETA)of monozygotic twins discordant for chronic fatigue syndrome. Neuroimage, 34(4),1438�1442.
Sherlin, L., & Congedo, M. (2005). Obsessive compulsive dimension localized using lowresolution electromagnetic tomography (LORETA). Neuroscience Letters, 387(2),72�74.
Speckmann, E.-J., & Elger, C. E. (2005). Introduction to the neurophysiological basis ofthe EEG and DC potentials. In E. Niedermeyer, & F. Lopes da Silva (Eds.),Electroencephalography. Basic principles, clinical applications, and related fields (5th ed.,pp. 17�29). New York: Lippincott Williams & Wilkins.
Tichavsky, P., & Yeredor, A. (2009). Fast approximate joint diagonalization incorporatingweight matrices. IEEE Transactions on Signal Process, 57(3), 878�891.
Van der Loo, E., Congedo, M., Plazier, M., Van De Heyning, P., & De Ridder, D.(2007). Correlation between independent components of scalp EEG and intracranialEEG (iEEG) time series. International Journal of Bioelectromagnetism, 9(4), 270�275.
Van der Loo, E., Gais, S., Congedo, M., Vanneste, S., & Plazier, M. (2009). Tinnitusintensity dependent gamma oscillations of the contralateral auditory cortex. PLoSONE, 4(10), e7396 doi:10.1371/journal.pone.0007396.
45EEG Source Analysis: Methods and Clinical Implications

This page intentionally left blank

CHAPTER33ERP-Based Endophenotypes:Application in Diagnosis andNeurotherapyJuri D. Kropotov1,2, Andreas Mueller3, and Valery A. Ponomarev11Institute of the Human Brain of the Russian Academy of Sciences, St Petersburg, Russia2Institute of Psychology, Norwegian University of Science and Technology, Trondheim, Norway3Brain and Trauma Foundation, Grison, and Praxis fur Kind, Organisation und Entwicklung, Chur,Switzerland
Contents
Introduction 47Event-Related Potentials (ERPs) 48Theoretical Considerations 49New Methods in ERP Analysis 52HBI Reference Database 53GO/NO-GO Task 53
Eye Movement Correction 55Methodology of Decomposition of Collection of ERPs into IndependentComponents 56Methodology of Decomposition of Individual ERPs into Independent Components 57Independent Components in GO/NO-GO Task 58Application of ERP/ICA Methodology for ADHD � Response Inhibition 65ERPs as Indexes of Neurofeedback Efficacy 66ERPs as Index of tDCS Effect 70References 73
INTRODUCTION
In a narrow sense brain neuromodulation includes methods of transcranial
Direct Current Stimulation (tDCS) and neurofeedback. These two meth-
ods are based on knowledge regarding underlying neurophysiological pro-
cesses. It is obvious that before doing any neuromodulatory approach on a
client we need to know how his/her cortex is self-regulated and how
47Neurofeedback and Neuromodulation Techniques and ApplicationsDOI: 10.1016/B978-0-12-382235-2.00003-2
© 2011 Elsevier Inc.All rights reserved.

information is processed in the cortex. A recently emerged branch of
neuroscience, called neurometrics, helps in answering these two questions.
According to E. Roy John, the founder of this field, neurometrics is
a method of quantitative EEG that provides a precise, reproducible estimate ofthe deviation of an individual record from norm. This computer analysis makesit possible to detect and quantify abnormal brain organization, to give a quan-titative definition of the severity of brain disease, and to identify subgroups ofpathophysiological abnormalities within groups of patients with similar clinicalsymptoms.
(John, 1990)
Several normative EEG-based databases exist (NxLink, introduced in
John, 1977; Neuroguide, described in Thatcher et al., 1999; Brain Resource
Company presented in Gordon, Cooper, Rennie, Hermens, & Williams,
2005). These databases were very helpful in defining neuronal correlates of
some brain dysfunctions such as ADHD (Arns, de Ridder, Strehl, Breteler, &
Coenen, 2009), traumatic brain injury (Thatcher et al., 1999), and dementia
(Prichep et al., 1994).
One of the parameters measured in these databases is EEG power in a
certain frequency band. Spectral characteristics of spontaneous EEG used in
all normative databases include absolute and relative EEG power in different
frequency bands, at different electrode sites, as well as measures of coherence
between EEG recorded from pairs of electrodes. Spontaneous EEG in a
healthy brain represents a mixture of different rhythmicities which are con-
ventionally separated into alpha, theta, and beta rhythms. Recent research
shows that each of these rhythmicities is generated by a specific neuronal net-
work: posterior and central alpha rhythms are generated by thalamo-cortical
networks, beta rhythms appear to be generated by local cortical networks,
while the frontal midline theta rhythm (the only healthy theta rhythm in the
human brain) is hypothetically generated by the septo-hippocampal neuronal
network (for a recent review see Kropotov, 2009). In general terms, spontan-
eous oscillations reflect mechanisms of cortical self-regulation implemented
by distinct neuronal mechanisms.
EVENT-RELATED POTENTIALS (ERPs)
Another important aspect of brain functioning is the response of the brain
to stimuli, and actions evoked by those stimuli. This electrical brain
response is measured by event-related potentials (ERPs). Technically,
ERPs are obtained by simple averaging of all EEG epochs in many
48 Juri D. Kropotov et al.

sequentially presented trials in a single subject and for a single electrode.
Consequently, ERPs can be considered as voltage deflections, generated
by cortical neurons that are time-locked to specific events and associated
with stages of information flow in specific cortical areas.
It should be stressed here that ERPs, even in a simple behavioral para-
digm, are generated by multiple neuronal sources. The sources are associ-
ated with ERP components which, in practice, are defined by their
positive or negative polarity, latency, scalp distribution, and relationship to
experimental variables (Duncan et al., 2009). Research during the past 50
years has separated several ERP components such as mismatch negativity,
N400, error-related negativities, different types of P300, etc.
The guidelines for the use of ERPs in clinical research are presented
in a recent paper by a group of distinguished researchers in the field
(Duncan et al., 2009). The methodological issues emphasized in the paper
are as follows: (1) minimizing eye movements in order to get a signal-to-
noise ratio as high as possible; (2) measuring components defined as “the
contribution of the recorded waveform of a particular generator process,
such as the activation of a localized area of cerebral cortex by a specific
pattern of input.” Components can be disentangled by means of experi-
mental manipulation if they are differentially sensitive in amplitude and
latency to different manipulations (Donchin et al., 1986).
THEORETICAL CONSIDERATIONS
As we know from research in neuroscience, behavior is determined by
multiple brain systems playing different roles in planning, execution, and
memorization of human sensorimotor actions. These brain systems in
turn are determined by genes and their complex interactions with each
other and the environment. So, in contrast to genotype, behavior can be
considered as a phenotype of a subject. In the past, psychiatry mainly
relied on behavior. Recently, however, a concept of endophenotype was
introduced in psychiatry (Gottesman & Gould, 2003). Endophenotypes
are heritable, quantifiable traits (such as EEG power in specific frequency
bands, or components of event-related potentials) that index an indivi-
dual’s liability to develop or manifest a given disease or behavioral trait.
Endophenotypes represent simpler clues to genetic mechanisms than the
behavioral symptoms. The whole idea of introducing this concept is based
on the assumption that a more accurate psychiatric diagnosis can be made
using knowledge about brain systems (such as the executive system) and
49ERP-Based Endophenotypes: Application in Diagnosis and Neurotherapy

brain operations (such as action selection and action monitoring).
The term comes from the Greek word endos, meaning “interior, within”.
In another words, endophenotype denotes a measurable component along
the pathway between phenotype and genotype). An example of a physio-
logical endophenotype could be given by a late positive fluctuation (the
P3b waveform) of ERPs elicited in the oddball paradigm in response to
target stimuli. This waveform appears to reflect the context updating
(Donchin, 1981) and can be considered as an index of working memory.
In this chapter we present a theory according to which the brain is
divided into several functional systems, playing different roles in organiza-
tion of behavior: sensory system, affective system, executive system, mem-
ory systems, and attentional networks (Kropotov, 2009). Each of these
brain functional systems can be considered as a set of overlapping neuronal
networks, each performing a specific computation associated with a dis-
tinct psychological operation.
Neuronal elements in a neuronal network receive multiple inputs and
transfer them into action potentials. The transfer operation performed by
a neuron (output versus input) represents a non-linear relationship des-
cribed by a sigmoid function. Similarly, the transfer function of a neuronal
net as a whole also can be described by the sigmoid function presented in
Figure 3.1(a). The shape of this function means that: (1) the neuronal net-
work is poorly activated by a low input because the inputs in the majority
of neurons do not exceed thresholds; (2) the neuronal network changes
activity almost linearly to a moderate input; (3) the activation of the neu-
ronal network reaches a plateau at higher levels of input � a so-called
“ceiling” effect.
We can further suggest that the performance of the system is defined
by the ability of the system to react to a small change in the input.
Mathematically, the performance of the system is defined by the first deriv-
ative dO/dI (Figure 3.1b). The first derivative is represented by a so-called
inverted-U shape. In psychophysiology it is known as the Yerkes�Dodson
Law (Curtin, 1984).
So, the neural network is characterized by two parameters: level of
activation (that is, the input signal which drives the system), and the
responsiveness of the system (reaction of the system to a small change in
the input). In neurophysiological studies these two parameters are usually
named tonic and phasic activities respectively. We speculate that, for the
brain, tonic and phasic activities have two different functional meanings,
the first associated with the state and the second with the response. For
50 Juri D. Kropotov et al.

example, for the attentional network the tonic activity can be associated
with non-specific arousal, while the phasic activity can be associated with
selective attention. We presume that the reactivity of a certain functional
network is reflected in a distinct ERP component. So, when we measure
an ERP component in a population of subjects the distribution of the
subjects over the component would be expected to look like that depicted
in Figure 3.1(c). Indeed, the majority of the population of healthy subjects
would have the component with amplitude around an average level and
only few would have the component deviant from normality thus form-
ing a normal or log-normal distribution.
In reality, response of a neuronal network consists of reactions of excit-
atory and inhibitory neurons that produce potentials of different polarities.
O(output) High
Middle
I (input)
Optomal performance
ResponsedO/dI
I (input) Numberof subjects
(a)
(b)(c)
Low
Response(ERP)component
Figure 3.1 Reactivity of neuronal network. (a) Schematic representation of thedependence of the overall activity of a hypothetical neuronal network on the inputdriving the system. (b) Schematic representation of the dependence of the responseof the system on its input. The response is defined as a reaction of the system to asmall and elementary increase of the input. (c) Distribution of subjects over reactivityof the system. The distribution is closer to the Gausisan, in which smaller amplitudescorrespond to poor performance.
51ERP-Based Endophenotypes: Application in Diagnosis and Neurotherapy

Moreover, the neuronal reaction evolves in time in a hierarchically orga-
nized network. The process of shaping the component is determined by a
complex interaction between feed-forward and feed-back pathways inter-
connecting lower and higher level layers of the network.
NEW METHODS IN ERP ANALYSIS
Recently, the practical application of ERPs was accelerated by introducing
new mathematical techniques for ERP analysis. One of these techniques
is independent component analysis (ICA). ICA is a decomposition tech-
nique which is regarded as a solution of the “blind source separation
(BSS)” problem (James & Hesse, 2005). ICA decomposes data such that
the resulting component activities have minimal mutual information. The
mutual information is considered as a measure of statistical independence
of the components (Congedo et al., 2008).
It should be stressed here that the concept of statistical independence
goes far beyond statistical orthogonality. Independence implies that two or
more variables are not only orthogonal (uncorrelated), but also that all
higher order moments are zero. In this respect the ICA differs from prin-
cipal component analysis (PCA), which assumes only statistical orthogo-
nality (Bugli & Lambert, 2007). From a more practical point of view,
another advantage of ICA is that this approach can be applied to low den-
sity EEG data (Makeig et al., 2002). In research involving ERPs, ICA has
been applied for separating the observed signals into both physiologically
and behaviorally distinct components.
There are at least three different methods of applying ICA to ERP
analysis which deal with different input and output datasets, and which
allow different questions to be addressed: (1) the input data for the first
method represent single-trial ERP epochs from a single subject: the ICA
components are defined either separately for each subject, with subsequent
cluster analysis (Makeig et al., 2004; Zeman, Till, Livingston, Tanaka, &
Driessen, 2007), or for all trials in all subjects (Debener, Makeig, Delorme, &
Engel, 2005; Mehta, Jerger, Jerger, & Martin, 2009); (2) the input data
for the second method are averaged ERPs recorded in response to
many stimulus types and many task conditions (Makeig et al., 1999);
and (3) the input data for the third method are from averaged ERPs
recoded in a few task conditions, but for many subjects (Liu et al.,
2009; Olbrich, Maes, Valerius, Langosch, & Feige, 2005).
52 Juri D. Kropotov et al.

HBI REFERENCE DATABASE
In this chapter we introduce a methodology that was recently implemented
in the HBI (Human Brain Index) reference database. The database includes
19-channel EEG recordings of more than 1000 healthy subjects in resting
conditions with eyes open and eyes closed as well as in six task conditions.
Subjects were recruited from students of St Petersburg State University
(recordings were made by I. S. Nikishena), the staff of the Institute of the
Human Brain of Russian Academy of Sciences (recordings were made by
E. A. Yakovenko), students of the Norwegian University of Science and
Technology, Trondheim (recordings were made by S. Hollup), and healthy
subjects from Chur, Switzerland, recruited by Dr Andreas Mueller (record-
ings were made by E. P. Tereshchenko, I. Terent’ev, and G. Candrian).
The investigation was carried out in accordance with the Declaration of
Helsinki, and all subjects provided informed consent. The tasks were specif-
ically developed for recording components associated with visual and audi-
tory processing, facial emotion recognition, working memory, engagement
(GO) and disengagement (NO-GO) operations, mathematical- and speech-
related operations, and novelty reactions.
Exclusion criteria were: (1) an eventful perinatal period; (2) presence
of head injury with cerebral symptoms; (3) history of neurological or psy-
chiatric diseases; (4) history of convulsion; and (5) current medication or
drugs. Inclusion also required normal mental and physical development,
as well as average or better grades in school.
GO/NO-GO TASK
Here we provide details of the two-stimulus GO/NO-GO task that was
developed to study sensory and executive functions in the human brain.
Three categories of visual stimuli were selected: (1) 20 different images
of animals, referred to later as “A”; (2) 20 different images of plants,
referred to as “P”; (3) 20 different images of people of different profes-
sions, presented together with an artificial “novel” sound, referred to as
“H1 Sound”. All visual stimuli were selected to have similar size and
luminosity. The randomly varying novel sounds consisted of five 20 ms
fragments filled with tones of different frequencies (500, 1000, 1500, 2000,
and 2500 Hz). Each time a new combination of tones was used and the
novel sounds appeared unexpectedly (probability of appearance: 12.5%).
Stimulus intensity was about 75 dB SPL, measured at the patient’s head.
53ERP-Based Endophenotypes: Application in Diagnosis and Neurotherapy

The trials consisted of presentations of paired stimuli with inter-stimulus
intervals of 1 s. Duration of stimuli was 100 ms. Four categories of trials
were used (see Figure 3.2): A�A, A�P, P�P, and P�(H1 Sound).
The trials were grouped into four blocks with 100 trials each. In each
block a unique set of five A, five P, and five H stimuli were selected. Each
block consisted of a pseudo-random presentation of 100 pairs of stimuli
with equal probability for each stimulus category and for each trial cate-
gory. Participants practiced the task before the recording started. Subjects
rested for a few minutes after each 200 trials. Subjects sat upright in a
comfortable chair looking at a computer screen. The task was to press a
button with the right hand to all A�A pairs as fast as possible, and to
withhold button pressing to other pairs A�P, P�P, P�(H1 Sound)
(Figure 3.2).
According to the task design, two preparatory sets were distinguished
in the trials (Figure 3.2). They are: “Continue set”, in which A is pre-
sented as the first stimulus and the subject is supposed to prepare to
respond; and the “Discontinue set”, in which P is presented as the first
stimulus and the subject does not need to prepare to respond. In a
“Continue set” A�A pairs will be referred to as “GO trials”, A�P pairs as
“NO-GO trials”. In a “Discontinue set” P�P pairs will be referred to as
“Ignore trials” and P�(H1 Sound) pairs as “Novel trials” (see Figure 3.2).
GOA A
A P
P P
P H+Sound
300
NOGO
ContinueSet
DiscontinueSet
Ignore
Novel 100 100
3000 mc
1000
Figure 3.2 Schematic representation of the two-stimulus GO/NO-GO task. From topto bottom: time dynamics of stimuli in four categories of trials. Abbreviations: A, P, Hstimuli are “Animals”, “Plants”, and “Humans”. GO trials are when A�A stimuli requirethe subject to press a button. NO-GO trials are A�P stimuli, which require suppres-sion of a prepared action. GO and NO-GO trials represent “Continue set” in whichsubjects have to prepare for action after the first stimulus presentation (A). Ignoretrials are stimuli pairs beginning with a P, which require no preparation for action.Novel trials are pairs requiring no action, with presentation of a novel sound as thesecond stimuli. Ignore and Novel trials represent “Discontinue set”, in which subjectsdo not need to prepare for action after the first stimulus presentation. Time intervalsare depicted at the bottom.
54 Juri D. Kropotov et al.

The subject responses were recorded in a separate channel on the
amplifier. Averages for response latency and response time variance across
trials were calculated for each subject individually. Omission errors (failure
to respond in GO trials) and commission errors (failure to suppress a
response to NO-GO trials) were also computed for each subject separately.
In gathering data EEG was recorded from 19 scalp sites, bandpass
filtered between 0.53 and 50 Hz and digitized at a rate of 250 samples
per second per channel. The electrodes were applied according to the
International 10�20 system. The EEG was recorded referentially to linked
ears, allowing computational re-referencing of the data (re-montaging).
For decomposing ERPs into independent components, the EEG computa-
tionally was re-referenced to the common average montage. EOG was
recorded from two electrodes placed above and below the right eye. All
electrode impedances were below 5 Ohms.
To standardize data collection procedures across the four laboratories,
the same protocol was used: (1) EEG was recorded with a 19-channel
electroencephalographic PC-controlled system, the “Mitsar-201” (CE
0537) manufactured by Mitsar, Ltd (www.mitsar-medical.com); (2) elec-
trodes were applied using caps manufactured by Electro-cap International,
Inc. (www.electro-cap.com/caps.htm); (3) the tin recessed electrodes con-
tacted the scalp using ECI ELECTRO-GEL; (4) stimuli were presented
on similar 17 inch computer screens which were positioned 1.5 meters in
front of the subjects and occupied the same range of the visual field
(3.8�); (5) images of stimuli as well as the stimuli presentation protocols
were standardized; (6) all trials were presented using “Psytask”, a com-
puter code written by one of the authors (VAP); (7) subjects were
recruited according to the same inclusion/exclusion criteria (see para-
graph “Subjects” above).
Eye Movement CorrectionEyeblink artifacts were corrected by zeroing the activation curves of indi-
vidual ICA components corresponding to eye blinks using methods similar
to those described in Jung et al. (2000) and Vigario (1997). Comparison of
this method with an EOG regression technique is described by
Tereshchenko, Ponomarev, Kropotov, and Muller (2009). In addition,
epochs with excessive amplitude of filtered EEG and/or excessive
faster and/or slower frequency activity were automatically marked and
excluded from further analysis. The epoch exclusion thresholds were set as
55ERP-Based Endophenotypes: Application in Diagnosis and Neurotherapy

follow: (1) 100 µV for non-filtered EEG; (2) 50 µV for slow waves in the
0�1 Hz band; and (3) 35 µV for fast waves filtered in the band 20�35 Hz.
METHODOLOGY OF DECOMPOSITION OF COLLECTION OFERPs INTO INDEPENDENT COMPONENTS
The goal of independent component analysis (ICA) is to utilize the differ-
ences in scalp distribution between different generators of ERP activity to
separate the corresponding activation time courses (Makeig, Bell, Jung, &
Sejnowski, 1996). Components are constructed by optimizing the mutual
independence of all activation time curves, leading to a natural and intui-
tive definition of an ERP component as a stable potential distribution
which cannot be further decomposed into independently activated sources.
In the present study ICA was performed on the full ERP scalp loca-
tion3 time-series matrix. ERPs were constructed in response to the second
(S2) stimuli in a time interval 2100 and 11000 ms after the second (S2)
stimulus presentation. The ICA of the ERPs was made separately for
Continue sets and Discontinue sets The number of training points was
computed as follows: Number of subjects (297)3Number of categories of
trials (2) (GO/NO-GO for Continue set, Novel/Ignore for Discontinue
set)3Number of 4 ms time intervals (250 samples/s3 1.1)5 163,350. This
number is much larger than that required to obtain good quality decompo-
sition: 203 1925 7220 (Onton & Makeig, 2006).
Assumptions that underlie the application of ICA to individual ERPs
are as follow: (1) summation of the electric currents induced by separate
generators is linear at the scalp electrodes; (2) spatial distribution of com-
ponents’ generators remains fixed across time; (3) generators of spatially
separated components vary independently from each other across subjects
(Makeig et al., 1996; Onton & Makeig, 2006).
Briefly, the method implemented is as follows: The input data are the
collection of individual ERPs arranged in a matrix P of 19 channels (rows)
by T time points (columns) in which T is a product of N (number of sub-
jects) and number of time intervals in the epoch of analysis for the two task
conditions. The ICA finds an “unmixing” matrix (U) that gives the matrix
S of the sources (ICs) when multiplied by the original data matrix (P),
S5UP
where S and P are 193T matrices and U is 193 19 matrix. S(t) are max-
imally independent. In our work matrix U is found by means of the
56 Juri D. Kropotov et al.

Infomax algorithm, which is an iteration procedure that maximizes the
mutual information between S.
According to the linear algebra,
P5U 21S;
where U21 is the inverse matrix of U (also called mixing matrix),
and the ith column of the mixing matrix represents the topography of
i-independent component; Si represents time course of the i-independent
component. The ICA method (Makeig et al., 1996) was implemented in
the analysis software written by one of the authors (VAP). The topographies
and activation time courses of the components were tested against the cor-
responding results obtained by means of “InforMax” software in EEGLAB,
a freely available interactive Matlab toolbox for processing continuous
and event-related electrophysiological data (http://sccn.ucsd.edu/eeglab).
The topographies of the independent components are presented as
topographic maps, while time courses of the components (also called
“activation time courses”) are presented as graphics with time corres-
ponding to the x-axis. In this paper the “power” of the components is
characterized by a variance VARi5PP
(Uij21Sik)
2/(NsampNchan) where
Nsamp5 number of time points and Nchan5 number of channels. The
topographies are divided by the square root of the variance of the corre-
sponding components, while the normalized activation curves are multi-
plied by the square root of the variance.
METHODOLOGY OF DECOMPOSITION OF INDIVIDUAL ERPsINTO INDEPENDENT COMPONENTS
The essence of neurometrics is a comparison of individual EEG para-
meters with normative data. In our approach there is a need for decom-
posing an individual’s ERPs into independent components by means of
the spatial filters extracted for the collection of “normal” ERPs. It is done
as follows: The ith independent source Si can be found as
Si5UziP;
where Uzi is matrix U in which all rows are zeroed except the ith row.
According to linear algebra,
Pi5U 21Si5U 21UziP:
In our work, we used this filter for decomposing individual ERP dif-
ference waves into the independent components.
57ERP-Based Endophenotypes: Application in Diagnosis and Neurotherapy

The sLORETA (standardized low resolution tomography) imaging
approach was used for locating the generators of the ICA components
extracted in this study (ICs). The free software is provided by the Key
Institute for Brain�Mind Research in Zurich, Switzerland (www.uzh.ch/
keyinst/loreta.htm). For theoretical issues of this method see Pascual-
Marqui (2002).
Amplitudes of the components were computed for each condition and
each subject separately. Student’s t-test was used for assessing statistical sig-
nificance of deviation of the ICs from the baseline, as well as for assessing
statistical significance of the difference between conditions. To assess the
strength of a component in one condition (for example, NO-GO) in
comparison to another condition (for example, GO) the effect size was
calculated as d5M12M2/SD where M1 and M2 are mean values of the
component in conditions 1 and 2, and SD is the pooled standard devia-
tion (Cohen, 1988).
Using the above-mentioned technology, we are able to decompose
individual ERPs into distinct components. Comparison with the database
can be easily made by computing z-scores for each time interval and for
each component separately.
INDEPENDENT COMPONENTS IN GO/NO-GO TASK
From 19 components separated by ICA those that corresponded to hori-
zontal and vertical eye movements were excluded from further analysis.
Among the remaining components only those with highest values of vari-
ance (altogether constituting more than 90% of the signal variance) were
analyzed. To estimate the reliability of the ICA decomposition we used a
split-half method. All subjects participating in the study were separated
into two groups, either odd or even, according to the number at which
they appeared in the database. This separation gives an equivalent age and
gender distribution in both groups. ICA was applied to the array of ERPs
computed to the second stimulus for the two subject groups, as well as for
the Continue and Discontinue task conditions. Topographies and time
courses of the resultant ICs were compared with each other. The measure
of similarity of components is given by two correlation coefficients
obtained separately for topographies and time courses.
Visual inspection of the extracted components shows that some ICs
computed for Continue and Discontinue sets are quite similar. The
58 Juri D. Kropotov et al.

components that do not differ between the two preparatory sets are pre-
sented in Figure 3.3.
In our two-stimulus paradigm design, the second paired stimuli have
one thing in common: they all include brief presentations of visual stimuli.
So, if our null hypothesis is correct, and the ICA enables us to decompose
ERPs into functionally meaningful components, then there must be com-
ponents that are common to Continue and Discontinue sets, and that
reflect stages of visual information flow. We indeed were able to separate at
least three set-invariant components which (according to their time course
and localization) reflect sequential stages of visual information processing
in the occipital�temporal�parietal networks.
One of the components was localized in the occipital lobe and con-
sisted of a sequence of positive (with peak latency of 100 ms), negative
(150 ms) and positive (240 ms) fluctuations resembling previous findings
of the visual N1 wave (see, for example, Hillyard & Anllo-Vento, 1998;
Naatanen, 1992; Paz-Caballero & Garcıa-Austt, 1992).
The other two visual components were localized over the temporal-
parietal junction in the left and right hemispheres and consisted of a
sequence of positive (with peak latency of 120 ms), negative (170 ms),
and positive (240 ms) fluctuations. These two ICs appear to correspond to
bilateral occipito-temporally distributed N170 waves described in numer-
ous studies on ERP correlates of object processing (Itier & Taylor, 2004).
The N170 wave is reliably larger for faces than to any object category
tested (Itier & Taylor, 2004a,b). Although the exact neuronal generators
of this wave are still debated, this wave may reflect structural visual encod-
ing (Rossion et al., 2003).
Our recent study with stroke patients who experienced hemispatial
neglect in the visual field contralateral to the area of damage (Kropotov,
Brunner, in preparation) showed severe impairment of the P 240 fluctua-
tion of the component. This fact enables us to suggest that the above-
mentioned components generated in the left and right temporal-parietal
junctions are associated with detecting salience of the visual stimulus.
The remaining independent components are set dependent and are
analyzed separately for each preparatory set. In order to associate the com-
ponents with some functional meaning GO and NO-GO conditions
were contrasted for the Continue set, while Novel and Ignore conditions
were contrasted for the Discontinue set.
The components that are specific for Continue set are presented in
Figure 3.4. According to sLORETA they are localized to the middle
59ERP-Based Endophenotypes: Application in Diagnosis and Neurotherapy

–5
–10
–5
–5
0
0
+5
+5
(Y)
–10
–5
0
+5
(Y)
(Z)
2.9
Continue set Discontinue setmax
min
–2.9
–5
0
+5
(Z)
(X,Y, Z)-(0,–90, –15)(mm) ; (203E-1)
(X,Y, Z)-(–55,–65, –35 1)(mm) : (1,82E-1)
[WinEEGLoretaVoltage ; 0ms]
[WinEEGLoretaVoltage ; 0ms]
[WinEEGLoretaVoltage ; 0ms]
(X,Y, Z)-(–45,–55, –10) (mm) : (1,70E-1)
0 +5cm (X)
–5 0 +5 cm (X)
–10
–5
0
+5
(Y)
(Y)
L R
–5 0
0 200 400 600 ms
0 max
+5cm (X) +5 0 –5 –10 cm –5 0 +5cm (X)
–5
0
+5
(Z)
–5
0
+5
(Z)A P L R
(Y) –5 +50 +10 cm
(Y) –5 +50 +10 cm –5 +5 cm (X)0
1.6
–1.6
1.6
–1.6
–5 +5 cm (X)0
A P
–5
0
+5
(Z)
–5
0
+5
(Z)
sLORETA
sLORETA
sLORETA
A P
L R
L R
Figure 3.3 Occipitally and temporally generated components are similar for Continueand Discontinue sets. At the left is the topography and on the right the time course ofthe components. Below each pair of graphs is the sLORETA imaging of the component.
60 Juri D. Kropotov et al.

parietal cortex, supplementary motor cortex, frontal eye fields of the fron-
tal lobe, and the anterior part of the cingulate cortex.
Our ICA data show that the P300 GO wave (elicited in response to GO
cues) consists of at least two ICs with similar peak latencies (around
340�350 ms). The largest IC is a parietally distributed positive component,
and the smallest is a frontally generated component. According to
sLORETA the large component is generated in Brodmann areas 5 and 7 of
the parietal cortex, while the smaller component is generated over the BA 8.
The parietal P300 component has similar time course for GO and
NO-GO conditions up to 280 ms and deviates substantially at 340 ms
with effect size of 1.5. The frontal P300 component was observed with
almost the same amplitude but with slightly different latencies for GO and
NO-GO conditions. It appeared that the parietal (BA 5 and 7) and frontal
(Y)
(Y)
-5
0
0 +5
+5
-5
-10
-5 +5 cm0 (X)
-5 +5 cm0 (X)
-10 cm-5
-10 cm-5
0+5 +5 cm (X)0-5
+5 cm (X)0-50+5
(Y) -10 cm-50+5
A P
A P
A P
L R
L R
L
L R
R
[WinEEGLoretaVoltage: Oms]
[WinEEGLoretaVoltage: Oms]
[WinEEGLoretaVoltage: Oms]
[WinEEGLoretaVoltage: Oms]
sLORETA
sLORETA
sLORETA
sLORETA
(X, Y, Z)-(-5, -35, 50) (mm) : (1,21E-1)
P3b0 max
max
min
0 200
4.3
3.9
P3 prefrontal
P3 conflictmonitoring
-3.9
1.2
-1.2
6.0
-6.2
-4.3
P3 actionsuppression
400 600 ms
(X, Y, Z)-(5, 20, 65) (mm) : (3,72E-1)
(X, Y, Z)-(5, 40, 55) (mm) : (5,67E-1)
(X, Y, Z)-(-2, 4, -5) (mm) : (1,13E-1)
(Y)
0
+5
-5
-10
(Y)
-5 +5 cm0 (X)
L R
0
+5
-5
-10
(Y)
-5 +5 cm0 (X)
L R
0
+5
-5
-10
(Y)
(Z)
-5
0
+5
(Z)
-5
0
+5
(Z)
+5 cm (X)0-5
L R
-5
0
+5
(Z)
+5 cm (X)0-5
L R
-5
0
+5
(Z)
-5
0
+5
(Z)
-5
0
+5
(Z)
(Y) -10 cm-50+5
A P
-5
0
+5
(Z)
Figure 3.4 Independent components specifically generated in Continue set �Executive components. From left to right: topography, time course separately for GO(thin line) and NO-GO (thick line) conditions, and sLORETA imaging.
61ERP-Based Endophenotypes: Application in Diagnosis and Neurotherapy

(BA 8) areas were activated by both GO and NO-GO cues during at least
the first 280 ms.
These ERP data fit well with recent fMRI (functional magnetic reson-
ance imaging) studies showing that visual images of task-relevant stimuli
are topographically represented both in parietal and frontal cortical areas
(for a recent review see Silver & Kastner, 2009). The parietal P300 com-
ponent dominates during a 300�400 ms time window in GO condition
in comparison to NO-GO condition. The peak latency (around 340 ms)
and topography (parietal distribution) of this component fit the corre-
sponding parameters of a conventional P3b wave which is elicited in odd-
ball paradigms in response to rare targets (for review see Polich, 2007).
This component is quite similar to the parietal component extracted by
ICA on an array of individual ERPs computed for healthy subjects and
schizophrenic patients performing a one stimulus GO/NO-GO task
(Olbrich et al., 2005).
Several functional meanings of the P3b components were suggested
(for recent reviews see Polich, 2007). The most influential of them
relates the component to the updating of working memory (Donchin,
1981). However, this was loosely defined at the psychological level,
and was not associated with a neurophysiological circuit or cellular
mechanism. Consequently it was criticized (Verleger, 1988). In intra-
cranial recordings (Clarke, Halgren, & Chauvel, 1999; Kropotov &
Ponomarev, 1991) the P3b-like waves were found in various cortical
and subcortical structures, indicating a widespread distribution of the
P3b component.
Analysis of independent components in our work shows that the late
positive wave to NO-GO cues includes two ICs. The first component has
a central distribution with peak latency of 340 ms, which is 60 ms shorter
than the mean latency of response, and it is completely absent in response
to GO cues. According to sLORETA imaging, this component is gener-
ated over the premotor cortex (Brodmann area 6). This component
appears to correspond to subdurally recorded potentials found over pre-
supplementary motor cortex in GO/NO-GO tasks in epileptic patients in
response to NO-GO cues (Ikeda et al., 1999). The involvement of this
part of the cortex in motor inhibition was demonstrated by the fact that
direct stimulation of the pre-supplementary motor cortex in epileptic
patients inhibited ongoing, habitual motor actions (Ikeda, Luders,
Burgess, & Shibasaki, 1993). A recent meta-analysis of fMRI studies in
GO/NO-GO tasks demonstrates that the Brodmann area 6 is one of the
62 Juri D. Kropotov et al.

most commonly activated areas of the cortex (Simmonds, Pekar, &
Mostofsky, 2008), thus supporting the involvement of this area in response
selection and response inhibition. We associate the centrally distributed
P340 NO-GO-related IC separated in our study with inhibition of a pre-
pared motor action in response to NO-GO cues.
The second NO-GO-related IC identified in the study has a more
frontal distribution in comparison to the P340 motor suppression compo-
nent. This second component peaks at 400 ms, corresponding to the
mean latency of response to GO cues. It should be stressed here that,
when contrasted to GO cues, this component exhibits a strong negative
peak at 270 ms. This negative part of the IC may be associated with the
NO-GO N270 component commonly found as a difference between
ERPs to NO-GO and GO cues and coined as the N2 NO-GO (Bekker,
Kenemans, & Verbaten, 2005; Pfefferbaum, Ford, Weller, & Kopell,
1985). This N2 NO-GO peaks before a virtual response, it has been
associated with response inhibition (Jodo & Kayama, 1992) and conflict
monitoring (Nieuwenhuis, Yeung, van den Wildenberg, & Ridderinkhof,
2003). The wave has been inconsistently localized in various cortical areas
including the anterior cingulate cortex (Bekker et al., 2005), the inferior
prefrontal and left premotor areas (Kiefer, Marzinzik, Weisbrod, Scherg, &
Spitzer, 1998), the medial posterior cortex (Nieuwenhuis et al., 2003), and
the right lateral orbitofrontal areas (Bokura, Yamaguchi, & Kobayashi,
2001). Our sLORETA imaging supports source localization of the compo-
nent in the anterior cingulate cortex.
Taking in account involvement of the anterior cingulate cortex in a
hypothetical conflict monitoring operation (Botvinick, 2007; Schall,
Stuphorn, & Brown, 2002; van Veen & Carter, 2002), we associate the
P400 frontal-central IC selected in our work with conflict monitoring.
Indeed, in the two-stimulus paradigm used here the subject develops a
behavioral model: to press a button in response to two “animals” (A�A).
When the second stimulus is a “plant” appearing after first “animal”
(NO-GO condition), this stimulus does not fit the behavioral model (a
conflict), and this conflict seems to activate neurons in the anterior cingu-
late cortex that monitor this conflict situation.
The components that are specific for the Discontinue set are presented
in Figure 3.5. They include a component generated in the primary audi-
tory cortex. It has a negative part with a latency of 120 ms which corre-
sponds to the conventional auditory N1 component which has been
found in numerous studies previously (for review see Naatanen, 1992).
63ERP-Based Endophenotypes: Application in Diagnosis and Neurotherapy

The second novelty component has a central distribution with a posi-
tive fluctuation peaking at 220 ms, corresponding to the novelty compo-
nent found in previous studies by using conventional current density
mapping (Escera et al., 1998), by principal component analysis (Dien,
Spencer, & Donchin, 2003), and by IC analysis performed on single-trial
EEG epochs (Debener et al., 2005).
Two models were suggested to explain the functional meaning of the
novelty P3a: an attention-switching model (Escera, Yago, & Alho, 2001) and
a response inhibition model (Goldstein et al., 2002). In the attention-switch-
ing model the novelty P3 reflects involuntary switching of attention to devi-
ant events that distract the subject from a primary task. In the response
inhibition model, it is assumed that the detection of a deviant event leads to
context updating and, after proper identification of the stimulus, to suppres-
sion of response that was activated by the deviance detection. In our work
(Y)
(Y)
–5
0
0 +5
+5
–5
–10
–5 +5 cm (X)0
–5 +5 cm (X)0
–10 cm–5
–10 cm–5
0+5 +5 cm (X)0–5
+5 cm (X)0–50+5
(Y) –10 cm–50+5
A P
A P
A P
L R
L R
L
L R
R
[WinEEGLoretaVoltage: 0ms]
[WinEEGLoretaVoltage: 0ms]
[WinEEGLoretaVoltage: 0ms]
[WinEEGLoretaVoltage: 0ms]
sLORETA
sLORETA
sLORETA
sLORETA
(X, Y, Z)-(–5, 10, 70) (mm) : (3,42E-1)P3bearly 0 max
max
min
0 200
3.6
3.5
–3.5
3.7
–3.7
2.9
–2.9
–3.6
P3b late
Frontalmidline theta
N1auditory
400 600 ms
(X, Y, Z)-(0, –40, 50) (mm) : (1.01E-1)
(X, Y, Z)-(5, 15, 50) (mm) : (1.08E-1)
[X, Y, Z)-(–30, –30, 20) (mm) : (1,01E-1]
(Y)
0
+5
–5
–10
(Y)
–5 +5 cm (X)0
L R
0
+5
–5
–10
(Y)
–5 +5 cm (X)0
L R
0
+5
–5
–10
(Y)
(Z)
–5
0
+5
(Z)
–5
0
+5
(Z)
+5 cm (X)0-5
L R
–5
0
+5
(Z)
+5 cm (X)0–5
L R
–5
0
+5
(Z)
–5
0
+5
(Z)
–5
0
+5
(Z)
(Y) –10 cm–50+5
A P
–5
0
+5
(Z)
Figure 3.5 Independent components specifically generated in Discontinue setnovelty-related components. From left to right: topography, time course separatelyfor Ignore (thin line) and Novel (thick line) conditions, and sLORETA imaging.
64 Juri D. Kropotov et al.

using sLORETA imaging, this component is generated in the premotor cor-
tical area, which supports the response inhibition model. Indeed the topo-
graphy of this component is similar to the topography of the P3 suppression
component separated from the collection of NO-GO and GO ERPs (see
discussion of executive components above).
The third component has a parietal distribution with a positive wave
peaking at 360 ms. It fits quite well with the topography and time course
of the parietally distributed component (P3b) observed in our present
work in response to GO and NO-GO cues. The late parietal part of the
electrical brain response to novel stimuli was reported in previous studies
(Escera et al., 1998, 2001).
Our work confirmed the previous attempts at separating novelty-
related components and enabled us to dissociate a new component. This
component was found to be generated in the mid-cingulate cortex and
consists of a burst of theta waves with a frequency of 6.25 Hz. The fre-
quency and location of this theta burst corresponds to the parameters of
the “frontal midline theta” rhythm (Inanaga, 1998). The functional mean-
ing of the frontal midline theta rhythm in humans is not clear, however
some evidence associates it with an orienting response (Dietl, Dirlich,
Vogl, Lechner, & Strian, 1999) and with allocation of cognitive resources
by an attentional system (Sauseng, Hoppe, Klimesch, Gerloff, & Hummel,
2007). It should be noted here that application of principal component
analysis enabled some authors (Dien et al., 2003) to localize the novelty P3
in the anterior cingulate cortex.
APPLICATION OF ERP/ICA METHODOLOGY FOR ADHD �RESPONSE INHIBITION
We use the above-mentioned methodology for analysis of ERP data in an
ADHD population when compared to norms. According to Russel
Barkley, the core of the disorder is impairment of response inhibition
(Barkley, 1997). If this hypothesis is correct, then we should see a decrease
of the independent component associated with action suppression in an
ADHD population. Here we present the results of our study with a group
of ADHD children of ages 8 to 12. We compared independent compon-
ents presented above between this group and a group of healthy subjects
of the same age taken from the HBI database. We found that two out of
11 independent components were significantly reduced in the ADHD
population, with relative large effect size (Figure 3.6). The first of these
65ERP-Based Endophenotypes: Application in Diagnosis and Neurotherapy

two components (Figure 3.6, top) appears to be associated with action
suppression (see discussion above regarding the executive components)
whereas the second component is associated with detecting salience of the
stimulus (see discussion of the sensory components).
Note that ERP components were obtained by spatial filtration
described above (see methodology of decomposition of individual ERPs
into independent components). That means that any individual ERPs can
be decomposed into independent components and any individual compon-
ent can be statistically compared to normative data. The results of such
comparison are presented in the scattergram in Figure 3.7.
The scattergram maps each individual’s ERP independent components
(circles � normal, triangles � ADHD) into the two-dimensional space
with indexes of action inhibition and salience of the stimulus depicted at
the x- and y-axis correspondingly. Two groups of the ADHD population
can be separated: those with decrease of the action suppression compo-
nent (might be associated with impulsive/hyperkinetic type of ADHD)
and those with decrease of the salience detection component (might be
associated with inattention type of ADHD).
ERPs AS INDEXES OF NEUROFEEDBACK EFFICACY
In a critique raised by Loo and Barkley it is stated that neurofeedback
studies do not report pre- and post-qEEG differences since the EEG is
µV Cz
T5
84
0
Norms
200 ms
ADHD360 ms
ADHD Norms
320 ms
Figure 3.6 Reduction of central and left temporal independent components inADHD. Number of ADHD patients is 94, number of control subjects, 69. Top: timecourses and topographies of independent components obtained on 19 channel ERPsby spatial filtration. Thick line: ADHD; thin line: healthy subjects.
66 Juri D. Kropotov et al.

the basis of treatment in neurofeedback (Loo & Barkley, 2005). One
explanation of a few reports in the literature regarding post-pre spectra
differences resides in a large variance of EEG spectra in theta, alpha, and
beta frequency bands. There are several endophenotypes of EEG spectra
in the normal and ADHD populations (Johnstone, Gunkelman, & Lunt,
2005). This heterogeneity leads to a large variance of EEG power taken
for any frequency band. Consequently, changes induced by neurofeedback
training usually are smaller than this inter-individual variance which
makes the task of proving statistical pre-post QEEG difference rather diffi-
cult but not impossible providing an appropriate study design was selected
(see Chapter 15 in this book).
However, ERPs parameters are more sensitive to neurofeedback train-
ing. In contrast to EEG spectra they reflect stages of information flow in
the brain. When continuous performance tasks (such as GO/NO-GO)
are implemented, ERPs are shown to be reliable markers of the executive
system of the brain.
In our recent study (Kropotov et al., 2005) we used relative beta as a
neurofeedback parameter for modulation behavior of ADHD children.
The neurofeedback parameter was defined as a ratio of EEG power in a
–6
18
16
14
12
10
8
6
4
2
0
–2
–4–4 –2 0 2 4 6 8 10 12 14 16 18 20 22
Action suppression
Sal
ien
ce d
etec
tio
n
NormADHD
24 26
Figure 3.7 Scattergram of action suppression vs. working memory components inADHD (triangles) and healthy subjects (circles). X-axis: amplitude of the action sup-pression component averaged over 100�700 ms time interval. Y-axis: amplitude ofthe working memory component averaged over 50�500 ms time interval.
67ERP-Based Endophenotypes: Application in Diagnosis and Neurotherapy

beta frequency band (15�18 Hz) and EEG power in the remainder of the
EEG band, i.e., in 4�14 Hz and 19�30 Hz frequency bands. The EEG
was recorded bipolar from C3 and Fz electrodes in the standard 10�20
system. A typical training session included 20 minutes of relative beta
training. The biofeedback procedure consisted of the following computa-
tions: power spectrum was calculated for a 1-second epoch every 250 ms
using Fast Fourier Transformation. Visual feedback was provided by a bar
against a background on a computer screen. The height of the bar fol-
lowed the dynamics of the biofeedback parameter. The participant’s task
was to keep the bar above a threshold determined at the pre-training
2 minute interval.
In addition to the simple visual feedback, a so-called video mode was
used. In this mode, the biofeedback parameter controlled the level of a
noise generated by a separate electronic unit called a Jammer (the unit was
designed specifically for this purpose in our laboratory). The amplitude of
the noise was maximal if the biofeedback parameter was minimal, and
decreased gradually up to zero while the parameter approached a thresh-
old. The noise was mixed with the video-signal of a video-player and was
fed to a TV-set. Thus the patient actually also controlled the quality of the
picture on the screen by his/her brainwaves, i.e., when the biofeedback
parameter was higher than the threshold, the picture on the screen was
clear, otherwise the TV picture was blurred by the noise.
Usually during the first five to eight sessions, patients performed train-
ing in the simple visual mode with the bar to be able to get a feeling for
the procedure. Then training in the video mode started. The patient was
instructed about the rationale of the procedure, as well as about the
dependence of the biofeedback signal on the brain activity and attention.
Before the procedure, the patient tried to relax, decrease muscular ten-
sion, and maintain regular diaphragmatic breath. The patient was asked to
assess his or her own internal state and feelings when the biofeedback
parameter surpassed the threshold and to reproduce this state. Different
patients used different strategies with a common denominator of concen-
trating on a particular external object. The number of training sessions for
each patient depended on several factors such as age, type of ADHD,
learning curves, and parent reports, and varied from 15 to 22 (mean 17).
The termination criteria were: (1) stabilization of training performance
during the last three to five sessions, and (2) stabilization of patient’s
behavior according to parents’ reports. Sessions were administrated two to
five times per week for 5�8 weeks. The dynamics of the biofeedback
68 Juri D. Kropotov et al.

parameter (training curve) was obtained for each patient and for each
session.
It should be noted that not all patients were able to reliably elevate the
relative beta activity even after 10�20 sessions. The quality of patient’s
performance, i.e., the ability of a patient to increase the neurofeedback
parameter during training periods, was assessed. We considered the train-
ing session to be successful if a patient was able to increase the biofeed-
back parameter during training periods in more than 25% of sessions in
comparison to resting periods. Patients were referred to as “good perfor-
mers” if they were successful in more than 60% of sessions. Seventy-one
patients (82.5%) were assigned to the “good” performance group. Those
patients who had less than 60% successful training sessions were referred
to as “bad performers”. Fifteen patients (17.5%) were assigned to the
“bad” performance group. This group was considered as a control group
in the following data analysis.
To test functioning of the executive system, ERPs in the auditory
two-stimulus GO/NO-GO task were recorded before and after all ses-
sions of neurofeedback. ERPs to NO-GO cues superimposed on each
other in “before” and “after” recordings are presented in Figure 3.8a.
One can see enhancement of the positive component at the frontal leads
after 20 sessions of the relative beta training.
The grand average ERPs differences and their maps computed by
subtraction of the ERPs made before any interventions from those made
after 20 sessions of the relative beta neurofeedback are presented in
Figure 3.8b,c. A statistically significant increase of ERPs in response to
NO-GO cues was found in the group of good performers, but not in the
group of bad performers (not shown in Figure 3.8). It should be noted
that the relative beta training did not change early (with latencies of
80�180 ms) components of ERPs, but induced significant enhancement
of later positive components. Thus, our data indicate that this type of rela-
tive beta training does not effect auditory information processing in the
human brain, while significantly changing the functioning of the execu-
tive system reflected in later ERP components.
Theoretically, our protocol differs from conventional protocols, because
elevation of the biofeedback parameter in our study could be achieved by
increasing beta power, and/or by decreasing theta as well as alpha power.
However, as the results of our study indicate, the application of this relative
beta protocol turns out to be as effective as conventional protocols. Indeed,
80% of our patients were able to significantly increase their neurofeedback
69ERP-Based Endophenotypes: Application in Diagnosis and Neurotherapy

parameters in more than 60% of sessions. Moreover, according to parents’
assessment by the SNAP-IV, neurofeedback significantly improved behav-
ior as reflected in changes of inattention and impulsivity.
ERPs AS INDEX OF tDCS EFFECT
tDCS � transcranial direct current stimulation � is a technique of neuro-
modulation that applies direct current (i.e., a flow of electric charge that
does not change direction and value) to the brain by means of electrodes
placed on the head. Only 10% of the electric current passes through the
Fz-Ref
Post
Fz-Ref
Differencepost-pre
(b)
(c)
6.000
–6.000
6
4
2
0
PreCz-Ref
Pz-Ref
(a)
µV
Figure 3.8 ERPs in the two-stimulus auditory GO/NO-GO task recorded before andafter 20 sessions of relative beta training. (a) Grand average ERPs in response to NO-GO stimuli in the two-stimulus auditory GO/NO-GO test for the group of good perfor-mers before and after 20 sessions of the relative beta training. Thin line: ERPs takenbefore training; thick line: ERPs taken after 20 sessions of training. (b) ERPs differ-ences induced by 20 sessions of neurofeedback in the group of good performers. (c)Map of the ERP changes induced by 20 sessions of neurofeedback. (Adapted fromKropotov et al., 2005.)
70 Juri D. Kropotov et al.

cortex. However, this current seems to be enough to induce substantial
changes in excitability of cortical neurons. Experiments indicate that
anodal stimulation (at least as applied to electrodes located above the
motor cortex) increases excitability of neurons while the cathodal stimula-
tion has an opposite effect (Nitsche & Paulus, 2000).
The first report of ERP changes during tDCS in humans was made by
a group from the University of Goettingen, Germany (Antal, Kincses,
Nitsche, Bartfai, & Paulus, 2004). They found that cathodal polarization
induced a mild facilitatory after-effect on P100 whereas anodal polariza-
tion induced no after-effect. Later, a group from University of Rome
“La Sapienza” (Italy) found that tDCS at 1 mA induced changes in ERPs
that persist after polarization ends. tDCS was applied through surface
electrodes placed over the occipital scalp (polarizing) and over the anterior
or posterior neck-base (Accornero, Li Voti, La Riccia, & Gregori, 2007).
tDCS was applied at two durations, 3 and 10 min and both polarities.
Visual evoked potentials were obtained with black-and-white pattern-
reversal checkerboards (two cycles per degree), at two levels of contrast.
To avoid habituation owing to a constant checkerboard-reversal rate, pat-
terns were reversed at a frequency of 2 Hz 620%.
In this study anodal polarization reduced VEP-P100 amplitude
whereas cathodal polarization significantly increased amplitude; but both
polarities left latency statistically unchanged (Figure 3.9). These changes
persisted for some minutes after polarization ended depending on the
duration of tDCS and on the contrast level of visual stimuli, with lower
contrast exhibiting higher effect.
In a pilot study with ERPs obtained in a GO/NO-GO task we
attempted to find effects of anodal polarization on cognitive ERPs com-
ponents. The anodal stimulation was 0.2�0.4 mA with 20 min duration.
ERPs in the two-stimulus GO/NO-GO task described above were
recorded before and after tDCS. In order to obtain reliable ERPs in each
subject, 200 trials were presented in each condition. Seven healthy sub-
jects (students from St Petersburg State University) participated in this
pilot study. Some results are shown in Figure 3.10. As one can see, anodal
stimulation at the area located between Pz, P3, and Cz induced changes
in the N2 component, likely produced by altering excitability of neurons
in the cingulate cortex.
We can conclude that in contrast to spontaneous EEG reflecting neu-
ronal mechanisms of cortical self-regulation, ERPs are associated with
stages of information flow within the cortex. ICA provides a powerful
71ERP-Based Endophenotypes: Application in Diagnosis and Neurotherapy

tool for decomposing ERPs into functionally meaningful components.
The independent components of the two-stimulus GO/NO-GO are gen-
erated in distinct cortical areas and show different time dynamics. These
components index different psychological operations in sensory systems
(such as detecting salience of the visual stimulus) and the executive system
of the brain (such as action suppression and conflict monitoring). Two
of those components (salience and action suppression components) signi-
ficantly differ between ADHD and healthy populations. They can be
considered as endophenotypes (biological markers) of ADHD. The
Polarization
1(a)
(b)
CathodalAnodal
2
3
4
5
6
7
8
9
90%
70%
50%
30%
10%
Baseline
P10
0 am
plitu
de %
cha
nges
*
*
* *
**
*
***
* * *
*
Recovery
–10%
–30%
–50%
–70%
–90%1 2 3 4 5
Minutes
Cathodal, low contrastAnodal, low contrast
Cathodal, high contrastAnodal, high contrast
6 7 8 9
+–
2 uv100 msec
Figure 3.9 Effect of tDCS on visual evoked potential (VEP). (a) VEP modulation in arepresentative subject: each trace is an average of 60 visual stimuli sampled sequen-tially a minute. tDCS was applied for 3 minutes. (b) Grand average VEP P100 ampli-tude modulation induced by tDCS. (Adapted from Accornero et al., 2007.)
72 Juri D. Kropotov et al.

independent components of ERPs can be used as a diagnostic tool for
defining functional impairment in a particular patient’s brain as well as for
defining effects of tDCS and neurofeedback in healthy subjects and
patients.
REFERENCESAccornero, N., Li Voti, P., La Riccia, M., & Gregori, B. (2007). Visual evoked potentials
modulation during direct current cortical polarization. Experimental Brain Research,178(2), 261�266.
4µV
0200
post
pre
Fz
Cz
Pz
(a) (b)
(c)
(d)
(e)t = 350 ms
–4.5
4.5µV
+ –
Continue
L R
RL
A P
(Z)
(Y)
+5
–5
–10
0
(Z)
(Y)
+5
–5
0
+5
–5
–5 0 +5 cm (X) –5 0 +5 cm
+5 0 –5 –10 cm
(X)
RL (Z)
+5
–5
0
–5 0 +5 cm (X)
0
Discontinue
400 ms
ms
Pz
Figure 3.10 ERP to the first stimulus in the two-stimulus GO/NO-GO paradigm. ERPswere recorded before (thin line) and after (thick line) 20 minutes of tDCS. Electrodeswere placed between Pz, P3, and Cz for anode and on the right mastoid for cathode.(a) ERPs in common reference montage to the first stimulus (Continue condition)before (pre, thin line) and after (post, thick line). (b) ERP differences (post�pre) forboth Continue and Discontinue conditions. (c) Schematic presentation of electrodeplacement. (d) Maps of ERP differences (post�pre) taken at 350 ms after the firststimulus for Continue and Discontinue conditions. (e) sLORETA image of generatorsof the tDCS effect.
73ERP-Based Endophenotypes: Application in Diagnosis and Neurotherapy

Antal, A., Kincses, T. Z., Nitsche, M. A., Bartfai, O., & Paulus, W. (2004). Excitabilitychanges induced in the human primary visual cortex by transcranial direct currentstimulation: Direct electrophysiological evidence. Investigative Ophthalmology and VisualScience, 45(2), 702�707.
Arns, M., de Ridder, S., Strehl, U., Breteler, M., & Coenen, A. (2009). Efficacy of neuro-feedback treatment in ADHD: The effects on inattention, impulsivity and hyperactiv-ity: A meta-analysis. Clinical EEG and Neuroscience, 40(3), 180�189.
Barkley, R. A. (1997). Behavioral inhibition, sustained attention, and executive functions:Constructing a unifying theory of ADHD. Psychological Bulletin, 121, 65�94.
Bekker, E. M., Kenemans, J. L., & Verbaten, M. N. (2005). Source analysis of the N2 in acued Go/NoGo task. Brain Research: Cognitive Brain Research, 22, 221�231.
Bokura, H., Yamaguchi, S., & Kobayashi, S. (2001). Electrophysiological correlates forresponse inhibition in a Go/NoGo task. Clinical Neurophysiology, 112, 2224�2232.
Botvinick, M. M. (2007). Conflict monitoring and decision making: Reconciling twoperspectives on anterior cingulate function. Cognitive Affective & Behavioral Neuroscience,7(4), 356�366.
Bugli, C., & Lambert, P. (2007). Comparison between principal component analysis andindependent component analysis in electroencephalograms modeling. BiometricalJournal, 49(2), 312�327.
Clarke, J. M., Halgren, E., & Chauvel, P. (1999). Intracranial ERPs in humans during alateralized visual oddball task: II. Temporal, parietal, and frontal recordings. ClinicalNeurophysiology, 110(7), 1226�1244.
Cohen, J. (1988). Statistical power analysis for the behavioral sciences (2nd ed.). Hillsdale, NJ:Lawrence Erlbaum.
Congedo, M., Gouy-Pailler, C., & Jutten, C. (2008). On the blind source separation ofhuman electroencephalogram by approximate joint diagonalization of second orderstatistics. Clinical Neurophysiology, 119(12), 2677�2686.
Curtin, LL. (1984). The Yerkes�Dodson law. Nursing Management, 15(5), 7�8.Debener, S., Makeig, S., Delorme, A., & Engel, A. K. (2005). What is novel in the nov-
elty oddball paradigm? Functional significance of the novelty P3 event-related poten-tial as revealed by independent component analysis. Brain Research: Cognitive BrainResearch, 22(3), 309�321.
Dien, J., Spencer, K. M., & Donchin, E. (2003). Localization of the event-related poten-tial novelty response as defined by principal components analysis. Brain Research:Cognitive Brain Research, 17(3), 637�650.
Dietl, T., Dirlich, G., Vogl, L., Lechner, C., & Strian, F. (1999). Orienting response andfrontal midline theta activity: A somatosensory spectral perturbation study. ClinicalNeurophysiology, 110(7), 1204�1209.
Donchin, E. (1981). Surprise! Surprise! Psychophysiology, 18(5), 493�513.Donchin, E., Miller, G. A., & Farwell, L. A. (1986). The endogenous components of the
event-related potential � a diagnostic tool? Progress in Brain Research, 70, 87�102.Duncan, C. C., Barry, R. J., Connolly, J. F., Fischer, C., Michie, P. T., Naatanen, R., et al.
(2009). Event-related potentials in clinical research: Guidelines for eliciting, recording,and quantifying mismatch negativity, P300, and N400. Clinical Neurophysiology, 120(11),1883�1908.
Escera, C., Alho, K., Winkler, I., & Naatanen, R. (1998). Neural mechanisms of involun-tary attention to acoustic novelty and change. Journal of Cognitive Neuroscience, 10(5),590�604.
Escera, C., Yago, E., & Alho, K. (2001). Electrical responses reveal the temporal dynamicsof brain events during involuntary attention switching. Europe Journal of Neuroscience,14, 877�883.
74 Juri D. Kropotov et al.

Goldstein, A., Spencer, K. M., & Donchin, E. (2002). The influence of stimulus devianceand novelty on the P300 and novelty P3. Psychophysiology, 39, 781�790.
Gordon, E., Cooper, N., Rennie, C., Hermens, D., & Williams, L. M. (2005). Integrativeneuroscience: The role of a standardized database. Clinical EEG and Neuroscience, 36(2),64�75.
Gottesman, I. I., & Gould, T. D. (2003). The endophenotype concept in psychiatry:Etymology and strategic intentions. American Journal of Psychiatry, 160(4), 636�645.
Hillyard, S. A., & Anllo-Vento, L. (1998). Event-related brain potentials in the study ofvisual selective attention. Proceedings of the National Academy of Sciences of thee U S A,95(3), 781�787.
Ikeda, A., Luders, H. O., Burgess, R. C., & Shibasaki, H. (1993). Movement-relatedpotentials associated with single and repetitive movements recorded from human sup-plementary motor area. Electroencephalography and Clinical Neurophysiology, 89(4),269�277.
Ikeda, A., Yazawa, S., Kunieda, T., Ohara, S., Terada, K., Mikuni, N., et al. (1999).Cognitive motor control in human pre-supplementary motor area studied by subduralrecording of discrimination/selection-related potentials. Brain, 122, 915�931.
Inanaga, K. (1998). Frontal midline theta rhythm and mental activity. Psychiatry andClinical Neurosciences, 52(6), 555�566.
Itier, R. J., & Taylor, M. J. (2004a). N170 or N1? Spatiotemporal differences betweenobject and face processing using ERPs. Cerebral Cortex, 14, 132�142.
Itier, R. J., & Taylor, M. J. (2004b). Source analysis of the N170 to faces and objects.Neuroreport, 15(8), 1261�1265.
James, C. J., & Hesse, C. W. (2005). Independent component analysis for biomedical sig-nals. Physiological Measurement, 26(1), R15�39.
Jodo, E., & Kayama, Y. (1992). Relation of a negative ERP component to response inhibitionin a Go/No-Go task. Electroencephalography and Clinical Neurophysiology, 82, 477�482.
John, E. Roy (1977). Neurometrics: Clinical applications of quantitative electrophysiology.Hillsdale, NJ: Lawrence Erlbaum Associates.
John, E. Roy (1990). Principles of neurometrics. American Journal of EEG Technology, 30,251�266.
Johnstone, J., Gunkelman, J., & Lunt, J. (2005). Clinical database development:Characterization of EEG phenotypes. Clinical EEG and Neuroscience, 36, 99�107.
Jung, T. P., Makeig, S., Humphries, C., Lee, T. W., McKeown, M. J., Iragui, V., et al.(2000). Removing electroencephalographic artifacts by blind source separation.Psychophysiology, 37(2), 163�178.
Kiefer, M., Marzinzik, F., Weisbrod, M., Scherg, M., & Spitzer, M. (1998). The timecourse of brain activations during response inhibition: Evidence from event-relatedpotentials in a Go/No Go task. NeuroReport, 9, 765�770.
Kropotov, J. D. (2009). Quantitative EEG, event related potentials and neurotherapy San Diego,CA: Academic Press, Elsevier.
Kropotov, J. D., Grin-Yatsenko, V. A., Ponomarev, V. A., Chutko, L. S., Yakovenko, E. A., &Nikishena, I. S. (2005). ERPs correlates of EEG relative beta training in ADHD children.International Journal of Psychophysiology, 55(1), 23�34.
Kropotov, J. D., & Ponomarev, V. A. (1991). Subcortical neuronal correlates of componentP300 in man. Electroencephalography and Clinical Neurophysiology, 78, 40�49.
Liu, J., Kiehl, K. A., Pearlson, G., Perrone-Bizzozero, N. I., Eichele, T., & Calhoun, V. D.(2009). Genetic determinants of target and novelty-related event-related potentials inthe auditory oddball response. Neuroimage, 46(3), 809�816.
Loo, S. K., & Barkley, R. A. (2005). Clinical utility of EEG in attention deficit hyperactiv-ity disorder. Applied Neuropsychology, 12(2), 64�76.
75ERP-Based Endophenotypes: Application in Diagnosis and Neurotherapy

Makeig, S., Bell, A. J., Jung, T. -P., & Sejnowski, T. J. (1996). Independent componentanalysis of electroencephalographic data. Advances in Neural Information ProcessingSystems, 8, 145�151.
Makeig, S., Delorme, A., Westerfield, M., Jung, T. P., Townsend, J., Courchesne, E., et al.(2004). Electroencephalographic brain dynamics following manually responded visualtargets. PLoS Biology, 2(6), 747�762.
Makeig, S., Westerfield, M., Jung, T. P., Covington, J., Townsend, J., Sejnowski, T. J.,et al. (1999). Functionally independent components of the late positive event-relatedpotential during visual spatial attention. Journal of Neuroscience, 19, 2665�2680.
Makeig, S., Westerfield, M., Jung, T. P., Enghoff, S., Townsend, J., Courchesne, E.,et al. (2002). Dynamic brain sources of visual evoked responses. Science, 295,690�694.
Mehta, J., Jerger, S., Jerger, J., & Martin, J. (2009). Electrophysiological correlates of wordcomprehension: Event-related potential (ERP) and independent component analysis(ICA). International Journal of Audiology, 48(1), 1�11.
Naatanen, R. (1992). Attention and brain function. Hillsdale, NJ: Lawrence ErlbaumAssociates.
Nieuwenhuis, S., Yeung, N., van den Wildenberg, W. K., & Ridderinkhof, W. W. (2003).Electrophysiological correlates of anterior cingulate function in a Go/No-Go task:Effects of response conflict and trial type frequency. Cognitive Affective & BehavioralNeuroscience, 3, 17�26.
Nitsche, M. A., & Paulus, W. (2000). Excitability changes induced in the human motorcortex by weak transcranial direct current stimulation. Journal of Physiology, 527,633�639.
Olbrich, H. M., Maes, H., Valerius, G., Langosch, J. M., & Feige, B. (2005). Event-related potential correlates selectively reflect cognitive dysfunction in schizophrenics.Journal of Neural Transmission, 112(2), 283�295.
Onton, J., & Makeig, S. (2006). Information-based modeling of event-related braindynamics. Progress in Brain Research, 159, 99�120.
Pascual-Marqui, R. D. (2002). Standardized low-resolution brain electromagnetic tomo-graphy (sLORETA): Technical details. Methods and Findings in Experimental ClinicalPharmacology, 24(Suppl D), 5�12.
Paz-Caballero, M. D., & Garcıa-Austt, E. (1992). ERP components related to stimulusselection processes. Electroencephalography and Clinical Neurophysiology, 82(5), 369�376.
Pfefferbaum, A., Ford, J. M., Weller, B. J., & Kopell, B. S. (1985). ERPs to response pro-duction and inhibition. Electroencephalography and Clinical Neurophysiology, 60,423�434.
Polich, J. (2007). Updating P300: An integrative theory of P3a and P3b. Journal of ClinicalNeurophysiology, 118(10), 2128�2148.
Prichep, L. S., John, E. R., Ferris, S. H., Reisberg, B., Almas, M., Alper, K., et al. (1994).Quantitative EEG correlates of cognitive deterioration in the elderly. Neurobiology andAging, 15(1), 85�90.
Rossion, B., Caldara, R., Seghier, M., Schuller, A. M., Lazeyras, F., & Mayer, E. (2003).A network of occipito-temporal face-sensitive areas besides the right middle fusiformgyrus is necessary for normal face processing. Brain, 126, 2381�2395.
Sauseng, P., Hoppe, J., Klimesch, W., Gerloff, C., & Hummel, F. C. (2007). Dissociationof sustained attention from central executive functions: Local activity and interregionalconnectivity in the theta range. European Journal of Neuroscience, 25(2), 587�593.
Schall, J. D., Stuphorn, V., & Brown, J. W. (2002). Monitoring and control of action bythe frontal lobes. Neuron, 36(2), 309�322.
Silver, M. A., & Kastner, S. (2009). Topographic maps in human frontal and parietal cor-tex. Trends in Cognitive Science, 13, 488�495.
76 Juri D. Kropotov et al.

Simmonds, D. J., Pekar, J. J., & Mostofsky, S. H. (2008). Meta-analysis of Go/No-gotasks demonstrating that fMRI activation associated with response inhibition is task-dependent. Neuropsychologia, 46(1), 224�232.
Tereshchenko, E. P., Ponomarev, V. A., Kropotov, J. D., & Muller, A. (2009). Comparativeefficiencies of different methods for removing blink artifacts in analyzing quantitativeelectroencephalogram and event-related potentials. Human Physiology, 35(2), 241�247.
Thatcher, R. W., Moore, N., John, E. R., Duffy, F., Hughes, J. R., & Krieger, M. (1999).qEEG and traumatic brain injury: Rebuttal of the American Academy ofNeurology 1997 report by the EEG and Clinical Neuroscience Society. ClinicalElectroencephalography, 30(3), 94�98.
van Veen, V., & Carter, C. S. (2002). The anterior cingulate as a conflict monitor: fMRIand ERP studies. Physiology & Behavior, 77(4-5), 477�482.
Verleger, R. (1988). Event related potentials and cognition: A critique of context updatinghypothesis and alternative interpretation of P3. Behavioral Brain Science, 11, 343�427.
Vigario, R. N. (1997). Extraction of ocular artefacts from EEG using independent com-ponent analysis. Electroencephalography and Clinical Neurophysiology, 103(3), 395�404.
Zeman, P. M., Till, B. C., Livingston, N. J., Tanaka, J. W., & Driessen, P. F. (2007).Independent component analysis and clustering improve signal-to-noise ratio for statis-tical analysis of event-related potentials. Clinical Neurophysiology, 118(12), 2591�2604.
77ERP-Based Endophenotypes: Application in Diagnosis and Neurotherapy

This page intentionally left blank

CHAPTER44EEG Vigilance and Phenotypesin Neuropsychiatry: Implicationsfor InterventionMartijn Arns1, Jay Gunkelman2, Sebastian Olbrich3,Christian Sander3, and Ulrich Hegerl31Research Institute Brainclinics, Nijmegen, and Utrecht University, Department of ExperimentalPsychology, Utrecht, The Netherlands2Q-Pro Worldwide, Crockett, California, USA3University of Leipzig, Leipzig, Germany
Contents
Introduction 79Personalized Medicine: “Prognostics” Rather than “Diagnostics” 81
History of EEG Research in ADHD and Depression 83ADHD 83Depression 89Conclusion: Averaged Group Data vs. Individual Client Data 93Influence of Vigilance/Arousal 94
EEG and qEEG: Models and Theory 94EEG Vigilance Model 95
EEG-Vigilance Algorithm� “VIGALL” 95Validation of EEG Vigilance 97EEG-Vigilance Regulation in Psychiatric Disorders 98
EEG Phenotype Model 105Inter-rater Reliability 107Prevalence of EEG Phenotypes in ADHD and Depression 109
EEG Phenotype vs. EEG Vigilance: Towards a Coherent Model? 112Similarities Between EEG Phenotypes and EEG Vigilance 113Unique Contributions of Both Methods 114
Acknowledgments 115References 115
INTRODUCTION
Since the discovery of EEG by Hans Berger in 1929 (Berger, 1929) much
research has been dedicated to measuring EEG under different conditions as
well as measuring EEG in a variety of disorders ranging from neurological to
79Neurofeedback and Neuromodulation Techniques and ApplicationsDOI: 10.1016/B978-0-12-382235-2.00004-4
© 2011 Elsevier Inc.All rights reserved.

psychiatric disorders. In the early years EEG was mainly inspected visually
until equipment became available that made possible Fourier analysis on
EEG data to extract the spectral content of a signal. This eventually enabled
the field of quantitative EEG (qEEG) as we know it today. In the simplest
form one speaks of qEEG when the EEG is submitted to spectral analysis
(Niedermeyer & Da Silva, 2004). In this respect some prefer to speak of
“normative EEG” to clarify that the EEG should not only be submitted to
spectral analysis but also compared to a control group and/or normative
database (Kaiser, personal communication).
The group led by Ross Adey at the UCLA Brain Research Institute in
the period 1961�1974 pioneered the first developments of qEEG. They
were the first to use digital computers in the analysis of EEG with the
production of brain maps and developed the first normative library of
brain maps. See Figure 4.1 for photos of the first equipment developed to
measure EEG in outer space and during driving. As part of the Space
Figure 4.1 A photo from 1963 showing the equipment developed by Adey et al. tomeasure EEG in space. Ross Adey�who pioneered qEEG� is on the right in the top-left picture. (Courtesy of the Computer History Museum.)
80 Martijn Arns et al.
Biology Laboratory they studied the effects of outer space and space travel
on the brain, to determine whether prolonged space flight would be pos-
sible for the human body. As part of this NASA program Graham and
Dietlein were the first to coin the term “normative EEG” (Kaiser, per-
sonal communication; Graham & Dietlein, 1965).
In the last 20 years, due to the increasing availability of affordable
computer equipment, the field of qEEG has expanded even further and
has become available for clinicians. Along with this, several different nor-
mative databases have also been developed and are available to most clini-
cians. Examples of such databases are Neuroguide (Thatcher), Brain
Resource International Brain Database (Gordon), Neurometrics (John
et al., 1992), SKIL (Sterman), NeuroRep (Hudspeth) and Eureka3
(NovaTech). For a description and comparison of these databases also see
Johnstone et al. ( Johnstone, Gunkelman, & Lunt, 2005).
In this chapter, where we speak of qEEG we focus on normative EEG, or
qEEG data that are compared to a control group or normative database.
Furthermore, in this chapter we will limit the application of qEEG to neuro-
psychiatric conditions and will not focus on more strictly neurological appli-
cations that fall beyond the scope of the chapter. Where we report on EEG
power measures we will only report on absolute EEG unless stated otherwise.
Relative EEG power measures often obscure findings making it unclear what
is actually going on in the EEG, e.g., if the total absolute alpha power is
decreased, it could show up as an increased “relative” beta and theta power.
Personalized Medicine: “Prognostics” Ratherthan “Diagnostics”Current conventional treatment methods in psychiatry are based on
behavioral interventions and medication (“systemic” approach). Recent
large-scale studies increasingly often are showing the limitations of these
conventional treatments (both behavioral and drug treatment) in psychia-
try. The largest trial to date in over 3000 depressive patients investigating
treatment effects in depression (the STAR*D trial) demonstrated limited
clinical efficacy of antidepressants and cognitive behavior therapy (CBT)
in the treatment of depression with remission rates of 36.8% per single
treatment and 33% treatment resistance after four cumulative treatments
(Rush et al., 2006). Some methodological issues potentially limit the
generalizability of these results, such as a selection bias (the fact that most
participants in this trial had no health insurance), lack of a placebo
control, and not checking lithium levels. However, these and other studies
81EEG Vigilance and Phenotypes in Neuropsychiatry: Implications for Intervention

(Keller et al., 2000; Kirsch et al., 2008) do demonstrate there is a need for
improved efficacy in depression treatment. A similar initiative investigating
the effects of different treatment approaches in attention deficit hyper-
activity disorder (ADHD) (the NIMH-MTA trial) also clearly showed a
lack of long-term effects for stimulant medication, multicomponent
behavior therapy, and multimodal treatment (Molina et al., 2009).
Furthermore, in general, response rates to stimulant medication in
ADHD are estimated to be 70% (see Hermens, Rowe, Gordon, &
Williams, 2006 for an overview). New drug developments in psychiatry
are not demonstrating major breakthroughs, but rather “refinements”, i.e.
showing fewer side effects, but not a drastically improved efficacy rate.
Recently it was also announced that two major pharmaceutical companies
(GSK and AstraZeneca) will no longer develop psychiatric medications
(Nierenberg, 2010). So what do these developments mean?
These developments suggest something might be wrong with the cur-
rent approach to psychiatric treatments. Rather than blaming this on the
industry, it seems more likely that something is wrong with our defini-
tions of psychiatric disorders and hence the DSM-IV. Brain surgeons who
want to remove a tumor from the brain first make sure they exactly pin-
point the location of this tumor by employing brain-imaging techniques.
Of course they do not simply rely on behavior to undertake such surgery.
So why do we still mainly use behavior in psychiatry to guide our treat-
ments? Engaging in a direct interaction with the brain (e.g., medication,
neurofeedback, rTMS) requires knowledge about the current status of
the brain. A new development along these lines is the development of
Personalized Medicine. In this area the goal is to prescribe the right
treatment, for the right person at the right time as opposed to the current
one-size-fits-all treatments. Genotypic and phenotypic information or
“Biomarkers” lie at the basis of Personalized Medicine. Usually in this
context genetic markers are considered that can predict effects of medica-
tion, such as the classical example of herceptin. Herceptin is a drug used for
breast cancer treatment, but only for patients showing an over-expression
for a specific protein better known as human epidermal growth factor
receptor 2 (HER2) (Piccart-Gebhart et al., 2005). This drug only works
well with this specific sub-group of patients, who are easily distinguished by
a genetic test where HER2 is considered the biomarker. Given there is no
psychiatric disorder that is completely genetically determined (Hyman,
2007), a strictly genetic approach to Personalized Medicine for psychiatry
seems therefore less plausible.
82 Martijn Arns et al.

In this context Gordon (2007) proposed the term “neuromarker”, and
Johnstone et al. (2005) the term “EEG phenotype”’ as examples of biomar-
kers. In another context EEG-vigilance regulation has also been proposed
as a state-dependent trait (Hegerl, Olbrich, Schonknecht, & Sander, 2008).
The underlying idea behind these concepts is that neuroimaging data such
as EEG, fMRI, PET scans etc. can be considered stable phenotypes incor-
porating both the effects of nature and nurture. This potentially makes such
markers ideal candidates as biomarkers, which could predict treatment out-
come for treatments such as antidepressants or stimulants, but also for other
treatments such as neurofeedback. These developments, currently subsumed
under the umbrella term “Personalized Medicine”, are not completely new.
The quest for biomarkers to predict treatment outcome has a long history.
For example, Satterfield et al. (Satterfield, Cantwell, Saul, Lesser, & Podosin,
1973; Satterfield, Lesser, & Podosin, 1971) were the first to investigate
the potential use of EEG in predicting treatment outcome to stimulant
medication, and Roth, Kay, Shaw, & Green (1957) investigated barbiturate-
induced EEG changes (delta increase) and found this predicted to some
degree the long-term outcome (3�6 months) to ECT in depression. In this
development the focus is hence more on “prognostics” rather than “diagnos-
tics”. In this chapter we will review the history of EEG and qEEG findings
in ADHD and depression and their limitations for this Personalized
Medicine approach. Thereafter, we will present two more “theoretically”
driven models, which have recently been investigated in more detail
and show promise for the further development of EEG-based Personalized
Medicine.
HISTORY OF EEG RESEARCH IN ADHD AND DEPRESSION
ADHDConsiderable research has been carried out investigating the neurophysi-
ology of ADHD. The first report describing EEG findings in “behavior
problem children” stems from 1938 (Jasper, Solomon, & Bradley, 1938).
In those early days Jasper et al. (1938) already described an EEG pattern
we now call the Frontal Slow EEG: “There were occasionally two or
three waves also in the central or frontal regions at frequencies below
what is considered the normal alpha range, that is, at frequencies of
5�6/sec ...” ( Jasper et al., 1938, p. 644). The most predominant feature
in the group of children resembling most closely the current diagnosis of
83EEG Vigilance and Phenotypes in Neuropsychiatry: Implications for Intervention

ADHD (hyperactive, impulsive, highly variable) were the occurrence of
slow waves from one or more regions and an “abnormal EEG” in 83% of
the cases. Most older studies investigating the EEG in Minimal Cerebral
Dysfunction (MCD) or Minimal Brain Damage (MBD) (the earlier diag-
nosis for ADHD) reported incidences of around 50% “abnormal EEG” as
compared to control groups showing, on average, 15% abnormal EEGs
(for an overview see: Capute, Niedermeyer, & Richardson, 1968; Hughes,
DeLeo, & Melyn, 2000; Stevens, Sachdev, & Milstein, 1968). However, it
is to be noted that Stevens et al. (1968) earlier stated that the presence or
absence of an “abnormal EEG” alone is of little value in predicting clinical
or etiological features.
Capute et al. (1968) reported that the most common “abnormality” in
MBD was excessive bilateral posterior slowing, which is similar to a
slowed alpha peak frequency. In this regard it is also interesting to note
that Cohn & Nardini (1958) described an EEG pattern of bi-occipital slow
activity, which they related to aggressive clinical behavior. They stated that
this activity “is sometimes sensitive, in a way similar to that of the occipital
alpha output, to opening and closing the eyelids ... has a distribution that
corresponds grossly to that of the occipital alpha activity.” This suggests
they also observed a slowed alpha peak frequency (APF) rather than a true
slow occipital rhythm. Stevens et al. (1968) correlated different EEG
abnormalities to behavioral profiles and found that slowing of EEG fre-
quencies (occipital) was related to hyperactivity, difficulty with labeling
and poor figure�ground discrimination. Furthermore, no clear behavioral
syndrome was associated with predominant, frontal EEG abnormalities,
suggesting that core problems such as hyperactivity are more related to a
slowed alpha peak frequency rather than to frontal excess slow activity.
Paroxysmal EEG AbnormalitiesPart of the above mentioned “abnormal EEG findings” consist of the so-
called “paroxysmal” or “epileptiform discharges”. The estimated inci-
dences of paroxysmal EEG in some ADHD groups were around 12�13%(Capute et al., 1968; Satterfield et al., 1973) to approximately 30%
(Hughes et al., 2000), which are high as compared to 1�2% in normal
populations (Goodwin, 1947; Richter, Zimmerman, Raichle, & Liske,
1971). Note that these people did not suffer from epilepsy, but simply
exhibited a paroxysmal EEG in the absence of seizures. The exact impli-
cations of such EEG activity in subjects without overt signs of epilepsy are
not very well understood and many neurologists will see no need to treat
84 Martijn Arns et al.

these subjects as epileptics. In a very large study among jet fighter pilots,
Lennox-Buchthal, Buchthal, and Rosenfalck (1960) classified 6.4% as
“marked and paroxysmally abnormal”. Moreover, they found that pilots
with such EEGs were three times more likely to have their plane crashed
due to pilot error, indicating that even though these people are not
“epileptic” their brains are “not normal” and hence the presence of par-
oxysmal EEG continues to be an exclusion criterion for becoming a pilot.
This at least suggests such an EEG pattern might have implications for
behavior; however, more research is required to investigate that.
The Era of Computerized EEG AnalysisWith the introduction of qEEG and computerized EEG analysis many
more studies have been carried out investigating the neurophysiology of
ADHD. The introduction of computerized EEG made EEG analysis much
easier since many analyses could be performed in an automated fashion.
“Excess Theta” and “Theta/Beta Ratio”The most consistent findings reported in the literature are those of
increased absolute power in theta (Bresnahan, Anderson, & Barry, 1999;
Chabot & Serfontein, 1996; Clarke, Barry, McCarthy, & Selikowitz,
1998;1 Clarke, Barry, McCarthy, & Selikowitz, 2001c; DeFrance, Smith,
Schweitzer, Ginsberg, & Sands, 1996; Janzen, Graap, Stephanson,
Marshall, & Fitzsimmons, 1995; Lazzaro et al., 1999; Lazzaro et al., 1998;
Mann, Lubar, Zimmerman, Miller, & Muenchen, 1992; Matsuura et al.,
1993), and sometimes increased absolute delta EEG power (Bresnahan
et al., 1999; Clarke et al., 2001c; Kuperman, Johnson, Arndt, Lindgren, &
Wolraich, 1996; Matsuura et al., 1993).
Lubar in 1991 laid the foundation for the concept of the theta/beta
power ratio as a measure that could discriminate “normal” children from
children with ADD, learning disorders and ADHD (Lubar, 1991). This
measure was investigated further by many others, with the clearest replica-
tion from Monastra et al. (1999) who demonstrated in a multicenter study
in 482 subjects and a single electrode location (Cz) they could classify
with an accuracy of 88% children with ADHD based on the theta/beta
power ratio. Since these initial findings by Lubar many groups have fur-
ther investigated the EEG in ADHD, mainly using computerized power
1 Clarke et al., 1998 and Clarke et al. (2001c) excluded an “excess beta group” from their analysis,
which means that they excluded about 20% of children with ADHD thereby potentially biasing
their results.
85EEG Vigilance and Phenotypes in Neuropsychiatry: Implications for Intervention

spectral EEG analysis (FFT) and coherence. Furthermore, Boutros,
Fraenkel, & Feingold (2005), using a meta-analysis incorporating more
than 1100 subjects with ADHD/ADD, concluded that increased theta
activity in ADHD is a robust enough finding to warrant further develop-
ment as a diagnostic test or biomarker for ADHD, with data suggesting
that relative theta power is an even stronger predictor.
In contrast to the results described in the previous section, almost
none of the recent studies reports on alpha peak frequency, but only on
spectral power measures in ADHD, whereas from this old research clear
relations have been reported between the slowing of this APF and behav-
ioral measures such as hyperactivity (Stevens et al., 1968). As indicated by
Steriade, Gloor, Linas, Lopes de Silva, and Mesulam (1990), theta may be
a slowing down of alpha activity, suggesting that perhaps the often-
reported excess theta consists of both a slowed alpha peak frequency and
real excess slow activity. In Figure 4.2, this is illustrated in detail. This
Figure 4.2 (See Color Plate Section) This figure clearly shows that the sub-group with aslowed alpha peak frequency (bottom), present parietally, also show elevated “thetaEEG power” at frontal sites. However, this is not true “frontal slow”, but simply the effectof the slowed alpha peak frequency. This demonstrates that a raised theta/beta ratio atleast also includes the slow APF sub-group, which neurophysiologically is a differentgroup, as demonstrated later with respect to treatment outcome to stimulant medica-tion. (From Arns, Gunkelman, Breteler, & Spronk (2008); reproduced with permission.)
86 Martijn Arns et al.
FzFrontal slow: Fz
Slow alpha peak frequency: Fz
PzFrontal slow: Pz
ADHD
ADHD ‘Normal EEG’ControlControl ‘Normal EEG’
Slow alpha peak frequency: Pz
100
10
1
0.1
100
10
1
0.1
100
10
1
0.1
100
10
1
0.11 3 5 7 9 11 13 15 17
Frequency (Hz)19 21 23 25
APF-ADHD APF-Control APF-‘Normal EEG’
27 29 1 3 5 7 9 11 13 15 17Frequency (Hz)
19 21 23 25 27 29

figure shows the spectral content of ADHD children and data from a con-
trol group for both frontal (Fz) and parietal (Pz) locations. The dotted
lines reflect the groups with a “normal EEG” and the solid lines show the
spectral power of the sub-groups with a “Frontal Slow” (top) or “Slowed
Alpha Peak Frequency” (bottom). As can be seen, the spectral content for
the frontal slow group is increased in the theta frequency range, mainly at
Fz, as would be expected. However, the ADHD group with the slowed
APF at Pz showed an average APF of 7.5 Hz. In the frontal locations this
also shows up as an “increased theta EEG power” whereas this obviously
is due to the excessive slowing of the APF.
In another study by Lansbergen, Arns, van Dongen-Boomsma,
Spronk, & Buitelaar (in press) this was further tested. They calculated the
theta/beta ratio in a group 49 ADHD children and 49 matched controls
using both fixed frequency bands and also using individualized EEG fre-
quency bands based on the approach suggested by Klimesch (1999). In
this study a significantly deviating theta/beta ratio was only found for the
“fixed” EEG frequency bands, but there was no significant difference
when the individualized EEG frequency bands were employed, further
demonstrating that most of the above-reported studies have indeed been
picking up both real elevated theta, but also patients with a slow APF
which are two neurophysiologically very different groups. Therefore,
although the theta/beta ratio and the “excess theta” can discriminate a
group of children with ADHD very well from healthy controls, this mea-
sure is probably not a specific measure since they incorporate different sub-
types of ADHD. So from a Personalized Medicine approach this is not
optimal, since it is expected that these sub-types respond differentially to
medication as well, which will be clearly demonstrated later.
Increased or Decreased Beta?The literature is less consistent about the decreased absolute beta in
ADHD (Callaway, Halliday, & Naylor, 1983; Dykman, Ackerman,
Oglesby, & Holcomb, 1982; Mann et al., 1992; Matsuura et al., 1993).
This was not found in several other studies (Barry, Clarke, Johnstone, &
Brown, 2009; Clarke et al., 2001c; Lazzaro et al., 1999; Lazzaro et al.,
1998) and was found actually to be increased in one study (Kuperman
et al., 1996). Furthermore, some studies have also reported a specific sub-
group in ADHD with excess beta ranging from 13% (Chabot, Merkin,
Wood, Davenport, & Serfontein, 1996) to 20% (Clarke et al., 1998;
Clarke, Barry, McCarthy & Selikowitz, 2001b), and most prevalent in
87EEG Vigilance and Phenotypes in Neuropsychiatry: Implications for Intervention

males with ADHD. Clarke et al. (2001a) also reported that about 10% of
the excess beta group showed beta spindles, and Arns et al. reported that
16% had beta spindles (Arns et al., 2008). In summary, several studies
point to the existence of an ADHD sub-group with excess beta.
In general, minor differences have been found in studies between the
DSM-IV TR (DSM) ADHD and ADD diagnosis, mainly showing a less
severe pattern of deviation in the ADD group as compared to the ADHD
group (Barry, Clarke & Johnstone, 2003; Chabot et al., 1996).
EEG as a Prognostic Tool: Treatment Prediction in ADHDSatterfield and colleagues (1971, 1973) were the first to investigate the
potential use of EEG in predicting treatment outcome to stimulant medi-
cation. They found that children with excess slow wave activity and large
amplitude evoked potentials were more likely to respond to stimulant
medication (Satterfield et al., 1971) or more generally that abnormal EEG
findings could be considered a predictor for positive treatment outcome
(Satterfield et al., 1973). Chabot et al. (Chabot, diMichele, Prichep, &
John, 2001; Chabot, Orgill, Crawford, Harris, & Serfontein, 1999) found
that ADHD and ADD children with excess relative alpha or beta power
were likely to show behavioral improvement, whereas the relative excess
theta group showed a lower response and a higher probability of a nega-
tive response to medication. Their group exhibiting this “excess theta”
was described as: “generalized excess of theta absolute and relative power,
decreased alpha mean frequency, and frontal theta hypercoherence (emphasis
added)”. Note the mention of decreased alpha mean frequency, suggesting
that in fact they were looking at a combined group of excess theta and
slowed APF.
In contrast, Clarke, Barry, McCarthy, & Selikowitz (2002a, 2002b)
and Suffin and Emory (1995) showed that in ADHD and ADD good
responders to stimulant medication were characterized by increased theta
and theta/beta ratios. Clarke et al. (2003), however, showed that an excess
beta group also responded well to stimulants, in agreement with Chabot
et al. (1999). They noted, however, that there were few EEG normaliza-
tions. In line with this, Hermens et al. (2005) showed that increased beta
was related to better treatment outcome in ADHD.
As pointed out earlier and demonstrated in Figure 4.2, Arns et al.
(2008) separated a frontal slow wave group from a slowed alpha peak fre-
quency group, but most importantly demonstrated that only the frontal
slow group responded to stimulant medication, whereas the slowed alpha
88 Martijn Arns et al.

peak frequency group did not respond (Arns et al., 2008). These results
further demonstrate that many of the previous studies reporting on frontal
theta have mixed up frontal slow and slowed alpha peak frequency groups,
as illustrated in Figure 4.3. Furthermore, this finding also helps explain the
above contradictory findings between Chabot et al. (1999, 2001) versus
the results from Clarke et al. (2002a, 2002b) and Suffin and Emory (1995).
DepressionIn 1973 d’Elia & Perris were the first to investigate parietal alpha power
asymmetry in depression (psychotic depression in this case) and reported
that the left to right ratio correlated to the depression score both before
and after ECT (d’Elia & Perris, 1973). Furthermore, the treatment effects
of ECTwere mainly reflected in left hemisphere changes.
In 1983 a group led by Davidson started publishing pioneering work on
frontal alpha asymmetry in depression. They reported a relative hyperactiva-
tion of the right frontal cortex which was not found for the parietal cortex
(Schaffer, Davidson, & Saron, 1983). In their 1990 paper Henriques and
Davidson laid a further foundation for the concept of frontal alpha asymme-
try in depression, where they consider “approach” and “withdrawal” as the
Figure 4.3 (See Color Plate Section) The averaged brain activity of 275 ADHD patientscompared to a matched control group. The figure left shows the increased theta(p ,0.0001) and right the decreased relative beta power (p ,0.0001). Note the fronto-central localization. The graph on the right shows that when inspecting the individualdata sets only 25% of children with ADHD (red) indeed exhibit “real frontal slow”or frontal theta. Finally, about the same percentage exhibit a slow APF pattern, whichafter filtering will show up as “theta” but in fact is alpha, as explained below.
89EEG Vigilance and Phenotypes in Neuropsychiatry: Implications for Intervention
Absolute “theta” EEG power Relative “beta” EEG power
40%
35%
30%
25%
20%
15%
10%
5%
0%
Norm
al EEG
Fron
tal s
low
Slow A
PF
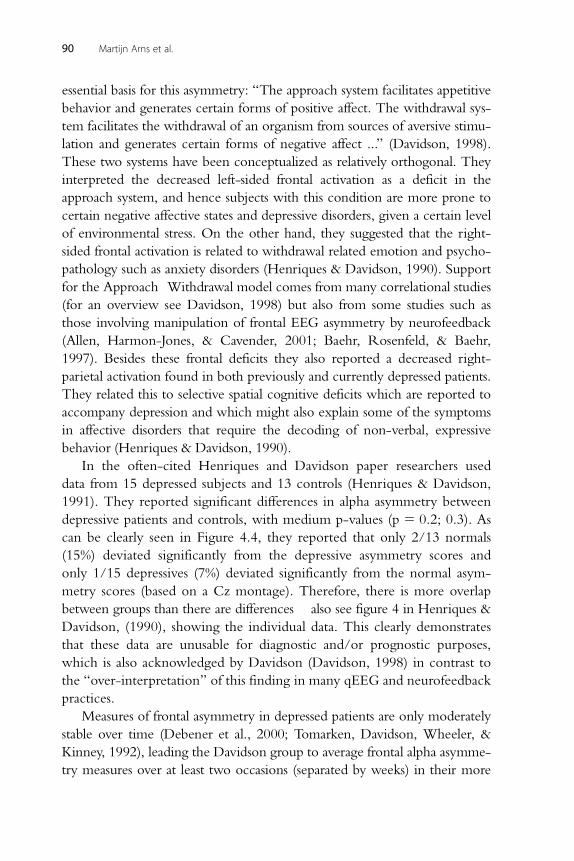
essential basis for this asymmetry: “The approach system facilitates appetitive
behavior and generates certain forms of positive affect. The withdrawal sys-
tem facilitates the withdrawal of an organism from sources of aversive stimu-
lation and generates certain forms of negative affect ...” (Davidson, 1998).
These two systems have been conceptualized as relatively orthogonal. They
interpreted the decreased left-sided frontal activation as a deficit in the
approach system, and hence subjects with this condition are more prone to
certain negative affective states and depressive disorders, given a certain level
of environmental stress. On the other hand, they suggested that the right-
sided frontal activation is related to withdrawal related emotion and psycho-
pathology such as anxiety disorders (Henriques & Davidson, 1990). Support
for the Approach�Withdrawal model comes from many correlational studies
(for an overview see Davidson, 1998) but also from some studies such as
those involving manipulation of frontal EEG asymmetry by neurofeedback
(Allen, Harmon-Jones, & Cavender, 2001; Baehr, Rosenfeld, & Baehr,
1997). Besides these frontal deficits they also reported a decreased right-
parietal activation found in both previously and currently depressed patients.
They related this to selective spatial cognitive deficits which are reported to
accompany depression and which might also explain some of the symptoms
in affective disorders that require the decoding of non-verbal, expressive
behavior (Henriques & Davidson, 1990).
In the often-cited Henriques and Davidson paper researchers used
data from 15 depressed subjects and 13 controls (Henriques & Davidson,
1991). They reported significant differences in alpha asymmetry between
depressive patients and controls, with medium p-values (p 5 0.2; 0.3). As
can be clearly seen in Figure 4.4, they reported that only 2/13 normals
(15%) deviated significantly from the depressive asymmetry scores and
only 1/15 depressives (7%) deviated significantly from the normal asym-
metry scores (based on a Cz montage). Therefore, there is more overlap
between groups than there are differences� also see figure 4 in Henriques &
Davidson, (1990), showing the individual data. This clearly demonstrates
that these data are unusable for diagnostic and/or prognostic purposes,
which is also acknowledged by Davidson (Davidson, 1998) in contrast to
the “over-interpretation” of this finding in many qEEG and neurofeedback
practices.
Measures of frontal asymmetry in depressed patients are only moderately
stable over time (Debener et al., 2000; Tomarken, Davidson, Wheeler, &
Kinney, 1992), leading the Davidson group to average frontal alpha asymme-
try measures over at least two occasions (separated by weeks) in their more
90 Martijn Arns et al.

recent work (Davidson, 1998). Furthermore, eyes-open and eyes-closed data
are also averaged (weighted average) in order to obtain more stable estimates
of EEG asymmetry (Henriques & Davidson, 1991). The finding that this
measure is only moderately stable over time has led some authors to question
the “stable trait” status of alpha asymmetry (Debener et al., 2000).
Most studies investigating the frontal alpha asymmetry did not find any
correlation between alpha asymmetry and measures of mood such as
depression severity (Debener et al., 2000; Henriques & Davidson, 1991).
Log
R-lo
g L
alph
a po
wer
1.0
0.8
0.6
0.4
0.2
0.0
–0.2
–0.4
–0.6
Control Depressed
Figure 4.4 This figure shows the initial results from the Henriques and Davidsonpaper (1990) demonstrating the differences in “frontal alpha asymmetry” betweenhealthy controls and depressed subjects. Note the large overlap between these twogroups. They reported that 2/15 normals and 1/15 depressive differed significantlyfrom the other group. These findings demonstrate that alpha asymmetry is not likelyto be of clinical use when applied to individual patients, but only useful in group-averaged data. (From Henriques & Davidson, 1990; reproduced with permission.)
91EEG Vigilance and Phenotypes in Neuropsychiatry: Implications for Intervention

A deviating alpha asymmetry is also found in previously depressed patients
no longer meeting criteria for depression (Henriques & Davidson, 1990),
suggesting that frontal alpha asymmetry could be considered a stable trait
rather than a state-marker for depression. (Or, more specifically as Davidson
phrased it: “that individual differences in prefrontal asymmetry are most
appropriately viewed as diatheses that bias a person’s affective style, and then
in turn modulate an individual’s vulnerability to develop depression ...”
[Davidson, 1998].) On the other hand, some have suggested that resting
frontal alpha asymmetry reflects the joint contribution of a trait that is
superimposed on state-like factors (Tomarken et al., 1992). This was sup-
ported empirically by Hagemann, Naumann, & Thayer (2001), who found
that about 60% of the variance was explained by a latent trait and about
40% was due to state-like fluctuations. Allen, Urry, Hitt, & Coan (2004)
showed that about 60% of the variance in alpha asymmetry is stable across
time, despite substantial clinical improvements over time. Finally, several
studies have demonstrated that alpha asymmetry was also influenced by
differences in cranial and brain parenchymal asymmetries in bone thickness
(Myslobodsky, Bar-Ziv, van Praag, & Glicksohn, 1989) and different EEG
montages (Hagemann et al., 2001; Hagemann, Naumann, Becker, Maier &
Bartussek, 1998; Reid, Duke, & Allen, 1998), whereas, Henriques and
Davidson (1990) found the effects to be consistent across different referenc-
ing procedures. In an excellent review of methodological problems with
frontal alpha asymmetry measures by Hagemann (2004) many other con-
founding factors are discussed, such as the effect of situational factors (e.g.,
sex of the experimenter in relation to the sex of the subject, montages, etc.)
and for a review of structural skull deviations and their potential of con-
founding frontal alpha asymmetry variables, see Myslobodsky, Coppola, &
Weinberger (1991).
Alpha power is traditionally seen as an occipital-parietal EEG rhythm,
and is most often maximal at these locations. As Hagemann et al. (2001)
suggest, the above-mentioned contradictory validity ratings also may be
explained in terms of signal-to-noise ratios. Since alpha activity is not
maximal at frontal sites and sometimes there is little to no alpha at those
sites, the signal of interest � alpha � can be too low to result into a reli-
able measurement of alpha asymmetry. Finally, EEG vigilance could also
play a role in some of the contradictory findings since studies measuring
short EEG segments (2�3 min) more often find alpha asymmetry as
compared to studies measuring longer EEG segments (e.g., 8 minutes)
(Davidson, 1998; Reid et al., 1998).
92 Martijn Arns et al.

EEG as a Prognostic Tool: Treatment Prediction in DepressionOne of the first attempts at using the EEG as a prognostic tool in depres-
sion stems from 1957. Roth et al. (1957) investigated barbiturate-induced
EEG changes (delta increase) and found this predicted to some degree the
long-term outcome (3�6 months) of ECT in depression. In 2001 Bruder
et al. investigated the use of alpha asymmetry and dichotic listening tasks
to predict treatment outcomes to SSRIs (selective serotonin reuptake inhi-
bitors) and found that non-responders showed more right-frontal activa-
tion as compared to responders which seemed to be a gender specific effect
(for females only). Few, if any other studies have been reported on the
prognostic use of alpha asymmetry in depression. Other authors have used
EEG-derived measures such as EEG cordance (Leuchter et al., 2009) and
ERP-derived measures (loudness intensity dependence [LDAEP]) (Hegerl,
Gallinat & Juckel, 2001) to predict treatment outcome to antidepressants;
however these are beyond the scope of this chapter. In general, there are
no reliable EEG-based predictors that can predict treatment outcome to
antidepressants based on pre-treatment EEG and most likely for this pur-
pose an integrative approach is required using data from multiple domains
such as EEG, ERP, neuropsychology, and genetics as a recent pilot-study
demonstrated (Spronk, Arns, Barnett, Cooper, & Gordon, 2010).
A relatively new treatment approach for depression, which is largely
based on the frontal asymmetry hypothesis, is rTMS or repetitive transcranial
magnetic stimulation. This treatment usually focuses on “stimulating” the
left frontal cortex or “inhibiting” the right frontal cortex. For a full overview
of details also see Chapter 10 by Spronk, Arns, and Fitzgerald in this volume.
Conclusion: Averaged Group Data vs. Individual Client DataAs has been clearly shown above, both the excess theta and the theta/beta
ratio in ADHD and the frontal alpha asymmetry in depression, show a
good correspondence to their respective DSM diagnosis, i.e., in groups of
patients with the disorder these markers are usually found. However, it
was also clearly shown that these measures have limited use for individual-
ized or personalized approaches when the goal is to personalize treatment
given their (a) non-specificity (“theta” EEG power comprised of two dis-
tinct sub-types, namely slow APF and frontal slow) or their (b) under-
representation on the individual level (only 1 in 15 depressives differing
significantly on their frontal alpha asymmetry as compared to a control
group).
93EEG Vigilance and Phenotypes in Neuropsychiatry: Implications for Intervention

Influence of Vigilance/ArousalIn the above sections on the theta/beta ratio and alpha asymmetry there is
another aspect, not yet addressed, which deserves more attention. Many
studies use different lengths of EEG recordings. In the ADHD studies
the recording lengths for EEG data vary between 2 minutes to over
20 minutes. All studies from the group of Adam Clarke (Clarke et al.,
1998; Clarke et al., 2001a, 2001b, 2001d; Clarke et al., 2002a, 2002b), for
example, have collected 20 minutes of eyes-closed EEG and selected a
1-minute EEG from these 20 minutes for final analysis (Clarke, personal
communication). The studies by Chabot also consisted of 20�30 minutes
eyes-closed EEG, whereas others have shorter recording times only dur-
ing eyes-open (e.g. Bresnahan et al., 1999; Lazzaro et al., 1998, 1999).
Furthermore, for frontal alpha asymmetry it was reported that studies
measuring short EEG segments (2�3 min) more often find the expected
alpha asymmetry as compared to studies measuring longer EEG segments
(e.g. 8 min) (Davidson, 1998; Reid et al., 1998). Bruder et al. (2001)
stated:
One possibility is that hemispheric asymmetry differences between fluoxetineresponders and non-responders may depend upon level of arousal. Eyes closedduring resting EEG is the least arousing condition, whereas eyes open leads to anincrease in arousal and dichotic listening requires active task performance ...
thus hinting at a potential role of vigilance.
In all these studies the “EEG dynamics” have not been investigated, but
accumulated EEG power across a full record has been used. Therefore, we
will now address the EEG Vigilance model (Bente, 1964) in more detail to
demonstrate potential value of studying EEG dynamics during eyes closed
conditions. This might help explain some of the contradictory findings,
and, perhaps above all, provide a more coherent and personalized frame-
work for the discovery and interpretation of EEG findings with prognostic
value.
EEG AND qEEG: MODELS AND THEORY
In the following sections we will explain in more detail the EEG Vigilance
model, which is a theory-driven approach, and one that has been around
since the first reports by Dieter Bente (1964). It has roots in the writings of
Loomis, Harvey, and Hobart (1937) and was modified by Roth (1961).
94 Martijn Arns et al.

After that we will address a more recently published and employed qEEG
model, namely the EEG Phenotype model by Johnstone, Gunkelman, &
Lunt (2005).
EEG VIGILANCE MODEL
The regulation of vigilance and its flexible adaptation to internal and
environmental needs are of fundamental importance for all higher organ-
isms. Vigilance has to be adapted to the respective environmental situa-
tion, ensuring a high vigilance level in situations of danger and a reduced
vigilance level during times of recreation. However, the interplay between
environment and vigilance regulation also works the other way around:
The environment actively created by a person can also depend on vigi-
lance regulation. If the capacity of the brain to maintain a high vigilance
level is reduced, a person will normally feel sleepy and thus seek an envi-
ronment with low external stimulation and a chance to sleep. However,
under certain circumstances such an unstable vigilance regulation can also
induce a compensatory behavioral pattern termed here as vigilance auto-
stabilization behavior. Hyperactivity, sensation-seeking, and other behavioral
patterns create a highly stimulating environment. The resulting increase
in external stimulation counteracts the impending vigilance decline and
leads to a stabilization of vigilance. An everyday example would be the
hyperactive, “high-spirited” behavior of overtired children. Related to
this, mania has been described as sensation-seeking gone out of control.
By contrast, in times of a tonically high vigilance level, a person might
avoid additional external stimulation and withdraw as an autoregulatory
behavior. The proposed concept of vigilance autostabilization behavior
is related to earlier theories of brain function (Bente, 1964; Ulrich &
Frick, 1986; Wundt, 1874), personality (Eysenck, 1990) and sensation-
seeking (Zuckerman, 1985).
EEG-Vigilance Algorithm� “VIGALL”In parallel to the transition from active wakefulness to deep sleep the
human brain takes on different global functional states. These functional
states are reflected in the spectral composition and topography of the
electroencephalogram (EEG) and have been termed vigilance stages.
These states correspond to different levels of alertness at the behavioral
level. Several stages can be separated during the transition from tense to
relaxed wakefulness and further on to drowsiness until sleep onset.
95EEG Vigilance and Phenotypes in Neuropsychiatry: Implications for Intervention

In 1937, Loomis et al. (later modified by Roth (1961), Bente et al.
(1964), and others [e.g., Klimesch, 1999; Ulrich & Frick, 1986]) proposed
classifications for vigilance stages occurring during transition from active
wakefulness to sleep onset. They are based on the following EEG phe-
nomena during eyes-closed, which have been confirmed by research:
• Posterior alpha mostly seen after eye-closing with a frequency of
8�12 Hz and an occipital focus. This oscillation has been referred to
as “idling rhythm” (Niedermeyer, 1997) because it marks a state of
relaxed wakefulness, corresponding to vigilance stage A1 according to
Bente (1964) and Loomis (1937).
• Alpha power anteriorization occurs increasingly after several minutes
of relaxed wakefulness. Alpha peak frequency shows a slight decrease.
This phenomenon is reported to occur during transition to drowsiness
(Broughton & Hasan, 1995; Connemann et al., 2005; De Gennaro,
Ferrara, Curcio, & Cristiani, 2001; De Gennaro et al., 2004; De
Gennaro et al., 2005; Pivik & Harman, 1995) and corresponds to vigi-
lance stage A2 and A3 (Bente, 1964; Loomis et al., 1937).
• Low voltage EEG is increasingly observed during lower vigilance
stages. The alpha rhythm disappears (alpha drop-out) and beta power
increases (De Gennaro, Ferrara & Bertini, 2001; Merica & Fortune,
2004; Tanaka, Hayashi, & Hori, 1996, 1997). This EEG pattern corre-
sponds to vigilance stage B1 (Roth, 1961). The EEG in this state is
similar to the EEG during intense mental activity and eyes-open
condition.
• Increased delta and theta activity is observed in parallel with increasing
subjective drowsiness (Strijkstra, Beersma, Drayer, Halbesma, & Daan,
2003; Tanaka et al., 1996, 1997), corresponding to vigilance stages B2
and B3 (Roth, 1961).
• The occurrence of K-complexes and sleep spindles mark the begin-
ning of definite sleep (Cash et al., 2009; De Gennaro & Ferrara, 2003;
Tanaka et al., 1997).
Based on these EEG features a computer-based algorithm has been
created for separating different EEG-vigilance stages (Figure 4.5) for conse-
cutive EEG segments. The first version of the algorithm “VIGALL”
(Vigilance Algorithm Leipzig) was based upon the Fast Fourier-derived
power of the four main EEG frequency bands alpha, beta, delta, and theta
during 2-second segments of continuous EEG data at different sites. An
improved second version of the algorithm now takes into account the intra-
cortical source power (derived by low resolution tomography, LORETA) of
96 Martijn Arns et al.

different regions of interest (ROIs). The segment length is technically not
restricted to a minimum duration because the power is computed by com-
plex demodulation instead of Fourier transformation with its reciprocal rela-
tionship between segment length and usable frequency resolution.
Validation of EEG VigilanceEEG Vigilance and the Autonomous Nervous SystemFurther evidence for the validity of the EEG-vigilance concept comes
from results of studies concerning the functional level of the autonomic
nervous system (ANS). Its two counteracting parts, the sympathetic and
the parasympathetic branch, regulate homeostatic processes for adapting
the organism to actual needs, e.g. increased blood flow and sweating dur-
ing a fight-or-flight reaction in case of danger (increased sympathetic
tone) or decreased breathing frequency and increased metabolic activity
Figure 4.5 EEG-vigilance stages on the continuum from high to low vigilance levels(left column). The main criteria of the EEG-vigilance classification algorithm are givenfor six distinct EEG-vigilance stages (middle columns). Examples of native two-secondEEG curves are presented in the right column.
97EEG Vigilance and Phenotypes in Neuropsychiatry: Implications for Intervention
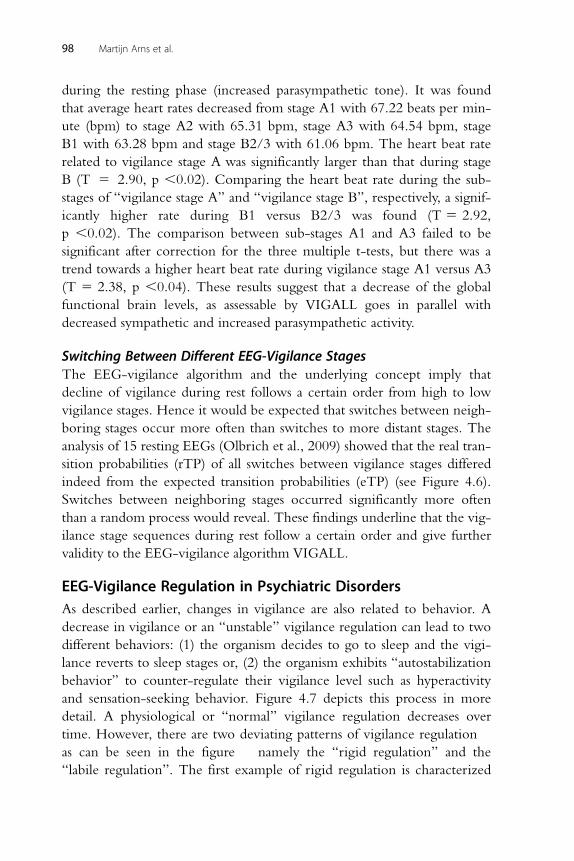
during the resting phase (increased parasympathetic tone). It was found
that average heart rates decreased from stage A1 with 67.22 beats per min-
ute (bpm) to stage A2 with 65.31 bpm, stage A3 with 64.54 bpm, stage
B1 with 63.28 bpm and stage B2/3 with 61.06 bpm. The heart beat rate
related to vigilance stage A was significantly larger than that during stage
B (T 5 2.90, p ,0.02). Comparing the heart beat rate during the sub-
stages of “vigilance stage A” and “vigilance stage B”, respectively, a signif-
icantly higher rate during B1 versus B2/3 was found (T 5 2.92,
p ,0.02). The comparison between sub-stages A1 and A3 failed to be
significant after correction for the three multiple t-tests, but there was a
trend towards a higher heart beat rate during vigilance stage A1 versus A3
(T 5 2.38, p ,0.04). These results suggest that a decrease of the global
functional brain levels, as assessable by VIGALL goes in parallel with
decreased sympathetic and increased parasympathetic activity.
Switching Between Different EEG-Vigilance StagesThe EEG-vigilance algorithm and the underlying concept imply that
decline of vigilance during rest follows a certain order from high to low
vigilance stages. Hence it would be expected that switches between neigh-
boring stages occur more often than switches to more distant stages. The
analysis of 15 resting EEGs (Olbrich et al., 2009) showed that the real tran-
sition probabilities (rTP) of all switches between vigilance stages differed
indeed from the expected transition probabilities (eTP) (see Figure 4.6).
Switches between neighboring stages occurred significantly more often
than a random process would reveal. These findings underline that the vig-
ilance stage sequences during rest follow a certain order and give further
validity to the EEG-vigilance algorithm VIGALL.
EEG-Vigilance Regulation in Psychiatric DisordersAs described earlier, changes in vigilance are also related to behavior. A
decrease in vigilance or an “unstable” vigilance regulation can lead to two
different behaviors: (1) the organism decides to go to sleep and the vigi-
lance reverts to sleep stages or, (2) the organism exhibits “autostabilization
behavior” to counter-regulate their vigilance level such as hyperactivity
and sensation-seeking behavior. Figure 4.7 depicts this process in more
detail. A physiological or “normal” vigilance regulation decreases over
time. However, there are two deviating patterns of vigilance regulation �as can be seen in the figure � namely the “rigid regulation” and the
“labile regulation”. The first example of rigid regulation is characterized
98 Martijn Arns et al.

A2 A3EEG-vigilance stages
Switches from A1 to stageA2 vs. B1*A2 vs. B2/3*A3 vs. B1*A3 vs. B2/3*
40
20
0
–20
Diff
eren
ces
real
TP
–exp
ecte
d T
P [%
]
–40
–60
B1 B2/3
Figure 4.6 The differences between real (rTP) and expected (eTP) transition probabili-ties for stage A1 were significantly higher for switches to stages A2 and A3 than forswitches to stages B1 and B2/3. This indicates that vigilance decline is a more or lesshomogeneous process with switches between neighboring EEG-vigilance stages occur-ring more often than switches between distant vigilance stages. (After Olbrich et al.,2009.)
Sle
ep o
nset
Wak
eful
ness Rigid regulation
Physiological regulation
Labile regulation
Time
A1
A2
A3
B2/3
Figure 4.7 The different modes of vigilance regulation, namely the rigid regulation,a physiological or “normal” regulation, and a labile vigilance regulation.
99EEG Vigilance and Phenotypes in Neuropsychiatry: Implications for Intervention

by an inability to downregulate one’s vigilance level and such individuals
might avoid additional external stimulation and withdraw themselves as
autoregulatory behavior. This is a behavioral pattern that is also often seen
in depression. In contrast to this, individuals characterized by a labile regu-
lation have an inability to maintain their vigilance level and/or exhibit
unstable vigilance regulation. This type of vigilance regulation could induce
a vigilance autostabilization behavior characterized by hyperactivity, sensa-
tion-seeking, and other behavioral patterns to create a highly stimulating
environment. The resulting increase in external stimulation counteracts the
impending vigilance decline and leads to a stabilization of vigilance. An
everyday example would be the hyperactive, “high-spirited” behavior of
overtired children. This behavioral pattern matches the behavior also seen
in ADHD and mania.
Mania and DepressionManic patients do not appear to be sleepy or tired. When evaluating EEG
recordings of such patients, one would expect to find signs of a cortical
hyperarousal. However, when studied under resting conditions with eyes
closed, acutely manic patients consistently show rapid declines in vigilance
within the first minute of EEG recording (Bschor, Muller-Oerlinghausen &
Ulrich, 2001; Ulrich, 1994; Van Sweden, 1986); a sub-group (19%) even
shows signs of micro sleeps (defined as abrupt intrusion of sleep spindles)
within the first 10 seconds (Small, Milstein, & Medlock, 1997). This find-
ing generally has been neglected in theories on the pathophysiology of
mania and is difficult to incorporate into current concepts. It does not
appear to be a mere consequence of the sleep deficits often occurring
within manic episodes. Instead, a causal role of the vigilance impairment
in the pathomechanism of mania is suggested by the fact that sleep deficits
can trigger or worsen hypomanic and/or manic syndromes in patients
with bipolar disorders (Barbini, Bertelli, Colombo & Smeraldi, 1996;
Wehr, 1992). Some symptoms of mania can be interpreted as autoregula-
tory reactions of the organism aimed to counteract the vigilance instability
by increasing the level of external stimulation (Hegerl et al., 2008). While
this might lead to vigilance stabilization, in many cases a vicious circle is
initiated since this behavioral syndrome and the associated lack of sleepi-
ness may aggravate the sleep deficit as well as the instability of vigilance
regulation resulting in a vicious circle. According to this concept, most
publications on treatment of mania using vigilance stabilizing agents such
as psychostimulants reported an improvement within one or two hours of
100 Martijn Arns et al.

first dose (Beckmann & Heinemann, 1976; Brown & Mueller, 1979;
Bschor et al., 2001).
In contrast to the unstable vigilance regulation in mania, a hyperstable
vigilance regulation may be observed during depressive episodes (Ulrich,
1994). This goes in parallel with a difficulty falling asleep, an inner restlessness,
and a hyperactivity of the hypothalamic-pituitary�adrenal axis often found in
depressed patients. One could hypothesize that depressive symptomatology
with sensation avoidance and withdrawal may serve an autoregulatory func-
tion to counteract a hyperstable vigilance regulation. Also see Figure 4.8 for a
case example of a bipolar patient recorded in his manic episode (top) and
depressive episode (bottom) and the obtained EEG-vigilance stages. This
example clearly shows that� within subject� a labile vigilance regulation is
associated with the manic phase, whereas a rigid vigilance regulation is associ-
ated with the depressive phase of the disorder.
Vigilance Regulation in Attention Deficit HyperactivityDisorder (ADHD)Support for an unstable vigilance regulation in ADHD is provided by the
fact that this disorder is associated with sleepiness and shortened mean sleep
latency in the Multiple Sleep Latency Test, a finding that is not explained
by differences in preceding nocturnal sleep (Golan, Shahar, Ravid, &
Pillar, 2004). Furthermore, there is convincing empirical evidence that
Manic episode,17.01.2008YMRS 23
Depressive episode,14.02.2008HAMD 22
A1A2A3
B1B2/3
A1A2A3
B1B2/3
Figure 4.8 Time course of EEG-vigilance stages for consecutive 2-second segments ofa 10-minute resting EEG in a patient with bipolar affective disorder during a manic epi-sode (top: Young Mania Rating Scale 23) and during depression (bottom: HamiltonDepression Score 22). Labile vigilance regulation is found during the manic state whileduring depression the vigilance level does not drop to low vigilance stages. Verticallines mark segments with artifacts.
101EEG Vigilance and Phenotypes in Neuropsychiatry: Implications for Intervention

disorders affecting sleep quality (e.g. restless legs syndrome, periodic limb
movement syndrome) are associated with pediatric ADHD or increased
ADHD severity (e.g. Chervin et al., 2002). Also, ADHD-like behavior can
be induced in children by sleep restriction (Fallone, Acebo, Arnedt, Seifer, &
Carskadon, 2001; Golan et al., 2004) and improved by reducing sleep deficits
(Dahl, Pelham, &Wierson, 1991).
Taken together, these data suggest that a labile vigilance regulation is a
pathogenetic factor in ADHD. Some symptoms of ADHD can be seen as a
direct result of the unstable vigilance regulation (deficits in sustained attention,
distractibility), while other symptoms (e.g. hyperactivity, “sensation-seeking”)
can be interpreted as vigilance stabilizing syndrome, as is summarized in
Figure 4.9. Therefore, the well-documented effectiveness of psychostimulants
in pediatric ADHD (Pliszka, 2007) could be explained by their vigilance stabi-
lizing property.
In another study Sander et al. (2010), using the same data as Arns et al.
(2008), directly investigated EEG-vigilance regulation in children with
ADHD, and its relationship to treatment outcome after stimulant medica-
tion. In Figure 4.10 the amount of time spent per vigilance stage is plotted.
As hypothesized, the results show that ADHD patients spent significantly
less time in A1-stages than controls, and compared to controls tended to
remain longer in A2-stages, suggesting children with ADHD indeed showed
lower EEG vigilance. Comparable results were found when age was included
as a covariate. Furthermore, when comparing the percentage rate of stage-
switches (corrected for switches into, between, and out of segments
Attention deficit hyperactivity disorder
Vigilance autostabilizationsyndrome
(e.g., hyperactivity, sensationseeking, talkativeness)
Cognitive deficits(e.g., impaired sustained
attention)
Unstable vigilance regulation (trait-like)
Combined subtypeHyperactive subtype Inattentive subtype
Figure 4.9 Overview of the relation between an unstable vigilance regulation andthe behavioral symptoms of ADHD. (Adapted from Hegerl, Sander, Olbrich, &Schoenknecht, 2009.)
102 Martijn Arns et al.

containing artifacts), ADHD patients were shown to switch between differ-
ent vigilance stages more often than controls (ADHD: 26.02%; Controls:
19.09%), indicating a less stable vigilance regulation in ADHD.
Subjects were also classified according to their “predominant EEG
vigilance stage” over the entire recording period. Thirty-eight subjects in
the ADHD group (77.6%) and 43 subjects in the control group (89.6%)
were classified as “A1-type”, 10 ADHD patients (20.4%) and 4 controls
(8.3%) as “B2/3-type”, and 1 subject from both groups was classified as
“B1-type”. Although the trends were in the expected direction (higher
percentage of ADHD children with lower EEG vigilance), no significant
differences between the ADHD and control group were found. The rela-
tionship between the “predominant EEG vigilance stage” and treatment
outcome after stimulant medication was investigated as can be seen in
Figure 4.11. The “low vigilance” group consisted of the ADHD children
with predominantly B stages in their EEG whereas the “high vigilance”
group consisted of the ADHD children with predominantly A stages in
the EEG. The “low vigilance” group achieved worse pre-treatment
results as compared to the “high vigilance” group on all continuous per-
formance test (CPT) scores (slower mean reaction time with less standard
deviation, more false positives, false negatives, and total errors) and, after
100 **
*
90
80
70
60
50
Occ
urre
nce
of v
igila
nce
stag
e (%
)
40
30
20
10
0A1 A2 A3 B1 B2/3
ADHD (N = 49) Controls (N = 48)
Figure 4.10 Percentage occurrence of vigilance stages A1, A2, and B2/3 in ADHD-patients (black) compared to healthy controls (white) during 2 minutes of restingEEG with closed eyes. The ADHD patients showed more A2 and less A1 stages, sug-gesting an unstable or labile vigilance regulation. (After Sander et al., 2010.)
103EEG Vigilance and Phenotypes in Neuropsychiatry: Implications for Intervention

stimulant medication, improved most on all scores, resulting in better
post-treatment performance as compared to the “high vigilance” group
(see Figure 4.11). However, repeated measurement ANOVAs showed a
main effect of time (pre- vs. post-treatment) for all CPT results besides
the reaction times, but no significant main effect of vigilance group. For
total errors, there was a tendency for a vigilance 3 time interaction.
In this study it was confirmed that ADHD patients spent less time in
stages of higher vigilance (A1) and demonstrated more fluctuations in vigi-
lance levels, seen as a higher number of stage switches. In general, those
ADHD patients who at baseline demonstrated more signs of an unstable
vigilance achieved numerically worse results on the CPT during the baseline
condition. After 4 weeks of medication with methylphenidate or dexamphet-
amine they tended to improve better than patients who had demonstrated a
High vigilance group(ADHD patients withpredominant A1-stage during resting EEG)
Low vigilance group(ADHD patients withpredominant B2/3-stage during resting EEG)
Reaction time
550
575
600
625
650
pre-medication
post-medication
False positive errors (commission)
2
3
4
5
6
7
8
Num
ber
of e
rror
sR
eact
ion
time
(in m
sec)
RT
sta
ndar
d de
viat
ion
(in m
sec)
Num
ber
of e
rror
s
pre-medication
post-medication
False negative errors(omission)
2
3
4
5
6
7
8
Num
ber
of e
rror
s
pre-medication
post-medication
Total errors
2
3
4
5
6
7
8
pre-medication
post-medication
Standard deviation
150
175
200
225
250
275
300
pre-medication
post-medication
Figure 4.11 Results of the ADHD group on the continuous performance test (CPT).Subjects performed the CPT in non-medicated state (pre-treatment) and after at least4 weeks of medication with stimulants (methylphenidate, dexamphetamine). Shownseparately are the results of those ADHD patients whose resting EEG showed signs ofan unstable vigilance (low vigilance group, N5 10), resulting in a greater proportionof time spent in lower vigilance stages, compared to those ADHD patients whoexhibited predominantly higher A1-stages during the 2 minutes of resting EEG (highvigilance group, N5 30). (After Sander et al., 2010.)
104 Martijn Arns et al.

higher vigilance level at baseline. The fact that these differences did not reach
statistical significance, suggests that the study might have been underpowered
concerning this aspect. However, findings suggest that EEG vigilance level is
related to initial performance on the CPT, and tends to also predict treatment
outcome numerically on most measures.
One important limitation of this study was the brevity of the available
EEG data. In usual practice, EEG-vigilance classification is based on
recordings of 10 minutes or longer, since differences in vigilance regula-
tion manifest themselves only after sufficient time. By analyzing vigilance
during 2 minutes of resting EEG only slight differences could be detected
between ADHD patients and healthy controls. Assuming that ADHD
patients do generally present with trait-like vigilance instability, one has to
argue that it may have been easier to distinguish patients with more or
less severe vigilance instability if longer EEG recordings had been
available.
EEG PHENOTYPE MODEL
Classifying disorders as being “subtypes” of specific disorders where the sub-
types match the various EEG patterns seen in the disorder is a seductive exer-
cise. Though the clustering of EEG patterns together as subtypes may expand
our understanding of client response to therapy, it still remains attached to
diagnosis based on the Diagnostic and Statistical Manual of Mental Disorders
(DSM), which is based not on physiology, but on behavior. Unfortunately,
DSM classification frequently does not predict therapeutic response by indivi-
duals within the DSM grouping (as was explained above in the Personalized
Medicine section).
Endophenotypes are an intermediate step between genetics and behav-
ior, which represent the expression or lack of expression of the genetics.
In 2005 the second author (J.G.) and associates submitted a paper propos-
ing a set of EEG patterns as “phenotypes” where the genetic links were
known, and as “candidate phenotypes” where the linkage to genetics
remained unknown (Johnstone et al., 2005). These proposed EEG-based
phenotypes are semi-stable states of neurophysiological function, and can
be identified from the raw EEG waveforms.
The authors proposed a framework that permitted researchers and
clinicians to describe much of the observed EEG variance with a small
number of categories of phenotypical divergence. These groupings are
not identical to the DSM groupings, and they are observed to cut across
105EEG Vigilance and Phenotypes in Neuropsychiatry: Implications for Intervention

the DSM categories. Unlike the DSM, these phenotypes were observed
to predict an individual’s response to both neurofeedback and medication
approaches to therapy.
Past research involving statistical analysis of electroencephalography
(EEG) has documented groupings of EEG/qEEG features within psychi-
atric populations (John, Prichep, & Almas, 1992). And, extensive experi-
ence with clinical EEGs and QEEG across the last four decades has shown
that a limited set of EEG patterns characterize the majority of the variance
seen in the EEG. The proposed phenotype approach to EEG/qEEG
groupings considers phenotypes as an intermediate step between genetics
and behaviors, involving expression of both genetic and environmental
factors. They are seen as reliable indices of brain function which can help
predict response to therapy, whether with medications or with neuro-
modulation techniques such as neurofeedback.
Any single phenotype may be seen in a wide variety of DSM group-
ings, from post-traumatic encephalopathy, to affective- and attentional-
related DSM groupings, like depression or ADHD. The very concept of
an EEG pattern’s being a “subtype” of a specific disorder seems fatally
flawed due to the lack of specificity of any of these patterns for any single
DSM classification (as was demonstrated above in the examples of excess
theta, theta/beta ratio, and frontal alpha asymmetry). It is our opinion that
transcending the limited perspective of the DSM through the use of the
EEG phenotypes will result in improved outcomes. Of course, this will
need to be validated by results of research and clinical practice.
The literature on medication response prediction suggests that a pheno-
typic perspective may help enhance efficacy when prescribing medication,
as seen in the work by Suffin & Emory (1995), showing attentional and
affective disorders to respond better to medication related to their EEG
pattern than to behavior. Improved outcomes may also be seen in neuro-
feedback, as demonstrated in the clinical outcome improvement reported
by Wright and Gunkelman (1998) when they added the EEG phenotype
approach to guide neurofeedback.
EEG patterns known to be genetically linked provide a databased start
for a proposed initial list of EEG phenotypic patterns. The low-voltage fast
pattern was shown to have genetic correlates in a recently published study of
the EEG in alcoholism (Enoch, White, Harris, Rohrbaugh, & Goldman,
2002), and by others who have identified the genetic link to gene 4’s regula-
tion over gamma amino butyric acid (GABA-A) receptors (Bierut et al.,
2002) and the serotonergic HTR3B gene (Ducci et al., 2009). Furthermore,
106 Martijn Arns et al.

a clear relationship was recently reported between the COMT gene and
alpha peak frequency, where the Val/Val genotype showed a 1.4 Hz slower
APF as compared to the Met/Met group (Bodenmann et al., 2009).
Another genetically linked EEG pattern was identified in idiopathic epi-
lepsy (Haug et al., 2003). The paroxysmal epileptiform bursts seen in the
EEG in these clinical cases may occasionally exceed 400�600 microvolts,
with spikes and slow components emerging from a relatively normal back-
ground EEG. In a paper surveying genetic factors in epilepsy, Kaneko,
Iwasa, Okada, and Hirose (2002) showed that the most common human
genetic epilepsies display a complex pattern of inheritance and that the iden-
tities of the specific genes are largely unknown, despite recent advances in
genetics. They showed the genetic markers associated with certain types of
epilepsy, including those with neurodegenerative characteristics and some
familial idiopathic epilepsies (Haug et al., 2003). A similar pattern is seen in a
group of subjects with benign childhood epilepsy with centro-temporal
spikes, found in a small number of cases with de novo terminal deletions of
a portion of chromosome 1q. This suggests that this chromosomal
location could be a potential site for a candidate gene (Vaughn, Greenwood,
Aylsworth, & Tennison, 1996).
The listing in Table 4.1 of the candidate phenotype patterns is pre-
sented for the reader’s convenience, though a reading of the original 2005
article ( Johnstone et al., 2005) is advised for more detail regarding impli-
cations for neurofeedback or medication response prediction.
One critical point must be remembered when viewing the listing: the
various phenotypes may coexist. The various combinations and permutations
of the phenotypes are too numerous to be handled completely in this lim-
ited chapter presentation. Thus, this list should not be construed as a
replacement for professional assistance in designing a neurofeedback inter-
vention or in prescribing medication, nor in any way can this be used to
fully characterize an individual’s EEG/qEEG.
Inter-rater ReliabilityIn Arns et al. (2008) the inter-rater reliability for rating the EEG pheno-
types between two raters (MA & JG) were investigated in children with
ADHD and a matched control group. The inter-rater reliabilities were
found to be generally high, as can be seen in Table 4.2. This suggests that
these EEG phenotypes can be reliably identified by two well-trained
raters, with most Kappa values around 0.90 or better. However, persistent
107EEG Vigilance and Phenotypes in Neuropsychiatry: Implications for Intervention

eyes-open alpha and frontal alpha phenotypes had lower inter-rater reli-
ability. Table 4.2 shows the number of subjects per EEG phenotype sub-
group, together with the exact Kappa values. For ADHD the phenotype
ratings were not blind to diagnosis, which could have affected the ratings.
However, given the small differences between the ADHD and control
group in prevalence of EEG phenotypes, this most likely did not have a
Table 4.1 A summary of the EEG phenotypes
Low-voltage fast: Low-voltage EEG with relative beta dominating
Epileptiform: Transient spike/wave, sharp waves, paroxysmal EEG
Diffuse slow
activity:
Increased delta and theta (1�7 Hz) with or without
slower alpha
Focal abnormalities: Focal slow activity or focal lack of EEG power
Mixed fast and slow: Increased slower activity, lack of organized alpha,
increased beta
Frontal lobe
hypoperfusion:
Frontal theta, slow alpha, or alpha activity
Frontal
asymmetries:
Frontal asymmetry (generally measured at F3, F4)
Excess temporal
lobe alpha:
Increased temporal alpha activity (Kappa)
Faster alpha
variants:
Alpha peak frequency greater than 11�12 Hz parietally
Spindling excessive
beta:
Rhythmic beta with a spindle morphology (beware of
medication effects, especially benzodiazepines)
Persistent eyes-open
alpha:
Alpha does not attenuate by at least 50% with eyes open
as compared to eyes closed
Table 4.2 Number of subjects in the different EEG phenotype groups and theinter-rater reliabilities for the different EEG phenotypes
ADHD (N) Controls (N) Inter-rater reliability
“Normal EEG” 5 11 Kappa: 0.90; p ,0.000
Frontal slow 13 9 Kappa: 0.94; p ,0.000
Low APF 13 5 Kappa: 0.90; p ,0.000
Frontal beta spindles 8 10 Kappa: 0.97; p ,0.000
Low voltage 6 1 Kappa: 0.93; p ,0.000
Frontal alpha 8 4 Kappa: 0.47; p ,0.000
Persistent alpha EO 7 5 Kappa: 0.64; p ,0.000
Temporal alpha 5 6 Kappa: 0.89; p ,0.000
High APF 3 5 Kappa: 0.94; p ,0.000
108 Martijn Arns et al.

dramatic effect. For the depression EEG phenotype data the rating was
performed blinded to diagnosis and similar effects are found, suggesting
that blinding probably did not affect the ratings.
Prevalence of EEG Phenotypes in ADHD and DepressionFigure 4.12 shows the prevalence of the different EEG phenotypes in
ADHD (top) and depression (bottom) and in matched normal controls.
The depression data are unpublished and are from a group of 113 unmed-
icated Depressed patients and 121 matched controls and the ADHD data
are from Arns et al. (2008). Note that these EEG phenotypes deviate
slightly from the originally published phenotypes and that the presence of
mu rhythm was also included, whereas this was not part of the original
EEG phenotypes and this is in principal considered a normal variant type
EEG.
The ADHD group tended to show a higher occurrence of frontal
slow, slow APF, and low voltage EEG as compared to the control group.
However, the Mann�Whitney test found a significant difference only
between the ADHD and control group for the low APF (p 5 0.038;
Z 5 22.076) and a near significant difference for the low voltage EEG
(p 5 0.051; Z 5 21.951). The difference for frontal slow was not signifi-
cant (p 5 0.335). This lack of effect is probably due to the low subject
numbers per sub-group.
For depression, the Mann�Whitney test results showed that only the
prevalence for frontal alpha (p 5 0.017; Z5 22.385) and mu at C4
(p 5 0.020; Z 5 21.707) were significant between groups. Furthermore,
One-Way ANOVA revealed no difference for age. There also was a signifi-
cant difference in frontal alpha peak frequency (p 5 0.025; F 5 5.089;
DF 5 1, 214) between the depressed (9.62 Hz) and non-depressed groups
(9.27 Hz), which was not different for Pz (p 5 0.632; F 5 0.231; DF 5 1,
225), indicating the depressed clients had a faster APF at frontal sites.
It is an interesting finding that the prevalence of the different EEG phe-
notypes is comparable for the ADHD, depression, and control groups,
demonstrating that, in principle there are no large fundamental and qualita-
tive differences in the brain activity of these disorders. However, as was
already shown in Figure 4.2, the expression of a given EEG phenotype is
more deviant for the ADHD group as compared to the control group,
indicating the differences have to be sought in the quantitative deviation
within a respective phenotype, i.e. it is not the “eye color” but the intensity
109EEG Vigilance and Phenotypes in Neuropsychiatry: Implications for Intervention

50%
P = .335
P = .017
P = .020
P = .038 P = .051
45%
40%
35%
30%
25%
20%
15%
10%
5%
0%
60.00%
50.00%
40.00%
30.00%
Per
cent
age
(%)
Per
cent
age
(%)
20.00%
10.00%
0.00%
Norm
al EEG
Norm
al EEG
Fron
tal s
low
Slow A
PF
Fron
tal b
eta
spind
les
Mu
rhyth
m
Low vo
ltage
Fron
tal a
lpha
Persis
tent
alph
a EO
Tem
pora
l alph
a
High A
PF
Parox
ysm
al
Fron
tal s
low
Fron
tal a
lpha
Fron
tal b
eta
spind
les
Centra
l bet
a sp
indles
Low vo
ltage M
u
Persis
tent
alph
a EO
Tem
pora
l alph
a
High A
PF
Low A
PF
Parox
ysm
al
ADHDControl
DepressedControls
Figure 4.12 The occurrence of the different EEG phenotypes for ADHD (top), depres-sion (bottom) and matched control groups (black). Note the higher occurrence offrontal slow, slow alpha peak frequency, and low voltage EEG in the ADHD group.For depression note the lower prevalence of frontal alpha and the higher prevalenceof mu rhythm. Also note that the control group has similar prevalences of most ofthe EEG phenotypes and for all groups between 2 and 4% display a paroxysmal EEG.
110 Martijn Arns et al.

14False positive errors on CPT
Pre-treatment
Post-treatment *12
10
8
6
4
2
0
Reaction time during CPT750
700
650
Rea
ctio
n tim
e (m
s.)
600
550
500Normal
EEGFrontalslow
SlowAPF
Frontalalpha
Frontal betaspindles
False negative errors on CPT
*7
6
5
4
Num
ber
of e
rror
sN
umbe
r of
err
ors
3
2
1
100%
90%
80%
70%
60%
50%
40%
30%
20%
10%
0%
Treatment response to antidepressants (SSRI & SNRI) per EEGpheotype
Persalpha
Lowvoltage
Frontalalpha
Centr. betaspindles
FastAPF
SlowAPF
Temporalalpha
Average Frontalslow
NormalEEG
Percentage50%30%
NormalEEG
Frontalslow
SlowAPF
Frontalalpha
Frontal betaspindles
NormalEEG
Frontalslow
SlowAPF
Frontalalpha
Frontal betaspindles
Figure 4.13 Pre-treatment and post-treatment performance for the ADHD (CPT measures: left) and depression (HAM-Dmeasures: right) for EEG phenotypes (ADHD: N5 45; depression N5 27). (* p ,0.05). (ADHD figures from Arns et al., 2008.)
111EEG
Vigilanceand
Phenotypesin
Neuropsychiatry:Im
plicationsfor
Intervention

of the eye color that makes the distinction between normal and pathologi-
cal. Furthermore, as was also demonstrated in Arns et al. (2008), and
shown in Figure 4.13, these phenotypes do predict treatment outcome to
stimulant medication in ADHD. The group with frontal slow EEG and the
group with frontal alpha both responded to stimulant medication, whereas
the other groups did not. The frontal slow group also performed worst ini-
tially suggesting a relation between their frontal slow EEG and inattention
during intake. Importantly, these data also clearly demonstrate that the slo-
wed APF group does not respond to stimulant medication, thereby further
emphasizing the need to separate the slow APF from the frontal slow group
(as noted above in the theta/beta ratio discussion).
In regard to depression, only a limited sub-sample of 27 subjects’ post-
treatment HAM-D scores were available. These data are currently pub-
lished in the Journal of Affective Disorders (Spronk et al., 2010) and data
suggest for this group an integrative approach employing neuropsychologi-
cal data, genetic data, and ERP data predicted treatment outcome best. In
Figure 4.13 the EEG phenotypes showing the largest decrease in HAM-D
scores due to antidepressant medication are shown. Although results have
to be treated with caution due to very low subject numbers, these data sug-
gest that the frontal alpha phenotype (a reasonably large sub-group of
N 5 10) does not predict treatment outcome well (in contrast to what
would be expected based on work of Suffin & Emory [1995] and others).
EEG PHENOTYPE VS. EEG VIGILANCE: TOWARDS ACOHERENT MODEL?
In this chapter we have reviewed the history of EEG findings in ADHD
and depression and presented some new data employing the EEG
Vigilance model and the EEG Phenotype model. We have pointed out
that some of the older concepts such as excess theta, theta/beta ratio, and
frontal alpha asymmetry have many limitations such as low specificity and
low predictive validity and hence their use in predicting treatment out-
come or guiding treatment is limited. Both the EEG Vigilance approach
and EEG Phenotype approach have shown some promise in predicting
treatment outcome, but have also shown some limitations. Below we dis-
cuss the presented data in a somewhat more detailed way and strive to
incorporate these results in a more coherent framework with Personalized
Medicine as the goal in mind.
112 Martijn Arns et al.

Similarities Between EEG Phenotypes and EEG VigilanceFrom the previous two sections it should be clear that there are similarities
among the qualitatively different EEG phenotypes on one hand and the EEG
vigilance stages on the other hand. In the EEG Vigilance model, several
“phenotypes” are seen as involving state changes related to vigilance, such as
the frontal alpha being similar to vigilance stage A3, or the frontal slow similar
to vigilance stage B3. At first sight, this appears to be contradictory; pheno-
types are by definition regarded as stable � trait like � biomarkers, which
should not be susceptible to state changes. However, the EEG Vigilance
model has shown that several of these EEG phenotypes can occur within the
same subject as time progresses with corresponding probabilities of switching
from stage A1 to stage A2 vigilance. On the other hand Hegerl also proposed
EEG-vigilance regulation as a state-dependent trait (Hegerl et al., 2008), suggest-
ing the EEG Vigilance approach is not just state-related. Given these similari-
ties in these models we propose that the “EEG phenotype” in this respect can
be interpreted as the “predominant vigilance” state of a given person. Below
we will demonstrate this further based on the data presented in the previous
sections.
In the EEG Phenotype studies, what was classified as a “normal EEG”
was in reality an EEG that could not be classified in any of the EEG phe-
notypes, often consisting of regular and well-developed parieto-occipital
alpha, or stage A1 in EEG Vigilance terms.
ADHDADHD was characterized by an increased incidence of frontal slow (not sig-
nificant) and low voltage EEG. Furthermore, there was a tendency for
increased frontal alpha and decreased “normal EEG” in ADHD. These
results are all in line with the EEG Vigilance results, suggesting a labile vigi-
lance regulation (frontal slow 5 B3; low voltage 5 B1; frontal alpha 5 A3)
and normal controls demonstrated higher EEG vigilance (more “normal”
EEG 5 A1). Furthermore, the EEG phenotypes characterized by this
“lower vigilance” level (frontal slow 5 B3 and frontal alpha 5 A3) also were
the only groups responding to stimulant medication.
DepressionDepression was characterized by a lower occurrence of the frontal alpha
EEG phenotype and a higher occurrence of a “normal” EEG (not signifi-
cant) suggesting less A3 and more A1 EEG-vigilance stages. These results
113EEG Vigilance and Phenotypes in Neuropsychiatry: Implications for Intervention

hence support a rigid vigilance regulation in depression (Ulrich, 1994).
This goes in parallel with a difficulty falling asleep, an inner restlessness,
and a hyperactivity of the hypothalamic�pituitary�adrenal axis often
found in depressed patients. In line with the EEG vigilance and the auto-
stabilization concept it is understandable that depressive symptomatology
with sensation avoidance and withdrawal may have the autoregulatory
function to counteract the hyperstable vigilance regulation.
Unique Contributions of Both MethodsThe unique contribution from the EEG Phenotype model is the identifi-
cation of a slow APF group, which was shown to be a group that does
not respond to stimulant medication. In the EEG Vigilance model APF
does not play a role. As a matter of fact the algorithm “personalizes” EEG
frequency bands based on the individual APF, thereby ensuring the indi-
vidual APF does not contaminate the data. Therefore, in ADHD there is
a large sub-group of children with a slow APF, who do not respond
well to treatment with stimulant medication. Their symptomatology can-
not be explained by a labile vigilance regulation and autostabilization
behavior. Therefore, it is important that future studies investigate what
treatments are best suited for treating this sub-group of ADHD.
Neurofeedback in the treatment of ADHD has shown great promise
(Arns et al., 2009) but at this moment it is not known if children with a
slow APF are also among the children who respond well to neurofeed-
back. Several studies have employed rTMS at or above the APF with
good results in schizophrenia (Jin et al., 2006), in healthy people to
improve cognitive function (Klimesch, Sauseng, & Gerloff, 2003) but
without an improved effect in depression (Arns, Spronk, & Fitzgerald,
2010). It is obvious that more research is required to find appropriate
treatment for patients with a slowed APF.
Some specific EEG phenotypes have not been covered extensively in
this chapter, but do deserve further study. For example the beta-spindle or
beta excess sub-group � which has been observed in ADHD (Arns et al.,
2008; Chabot et al., 1996; Clarke et al., 1998; Clarke et al., 2001b) �rarely has been investigated. And, in depression research cited earlier, it
was shown that a very large proportion of the depressive patients (.30%)
exhibited beta spindles at Cz and these also tended to respond unfavorably
to antidepressant medication (see Figure 4.13). Finally, from many studies
114 Martijn Arns et al.

it has become clear that a small sub-group with paroxysmal EEG is found
in both patient populations as well as control groups. Although these can-
not be considered as status epilepticus, there is some evidence suggesting
this brain pattern has behavioral implications (Lennox-Buchtal et al.,
1960) and may require a different treatment approach such as anticonvul-
sants or SMR/SCP neurofeedback.
Whereas the EEG phenotype approach is based on visual inspection of
the EEG and hence subject to interpretation, the biggest advantage of the
EEG Vigilance approach is that it is a quantified approach using a com-
puter algorithm, and hence may be considered more objective. However,
there are no reliable norms or cut-off scores available yet to classify EEG
vigilance stages into “normal” or “deviating” values. Furthermore, with
the EEG Vigilance approach it is very hard to distinguish the true B1
(alpha drop-out, low-voltage beta stage) stage from a desynchronized
EEG due to cognitive processing.
At this time there is no single framework, theory or approach that can
be used to interpret all EEG and qEEG findings. In this chapter we
attempted to explain a small part of the large spectrum of related findings,
and provide a theoretical framework based on the Vigilance model, and
its relationship to EEG and behaviors. Obviously, much more research is
required to understand the role of psychophysiology (EEG, ERPs) in the
future of Personalized Medicine.
ACKNOWLEDGMENTS
We wish to acknowledge the data used from the Brain Resource International
Database (BRID), Werner van den Bergh for fruitful discussions on this topic,
and Pim Drinkenburg and Leon Kenemans for the great collaboration, which
will hopefully evolve the concepts of Personalized Medicine further.
REFERENCESAllen, J. J., Harmon-Jones, E., & Cavender, J. H. (2001). Manipulation of frontal EEG
asymmetry through biofeedback alters self-reported emotional responses and facialEMG. Psychophysiology, 38(4), 685�693.
Allen, J. J., Urry, H. L., Hitt, S. K., & Coan, J. A. (2004). The stability of resting frontalelectroencephalographic asymmetry in depression. Psychophysiology, 41(2), 269�280.
Arns, M., de Ridder, S., Strehl, U., Breteler, M., & Coenen, A. (2009). Efficacy of neuro-feedback treatment in ADHD: The effects on inattention, impulsivity and
115EEG Vigilance and Phenotypes in Neuropsychiatry: Implications for Intervention

hyperactivity: A meta-analysis. Clinical EEG and Neuroscience: Official Journal of theEEG and Clinical Neuroscience Society (ENCS), 40(3), 180�189.
Arns, M., Gunkelman, J., Breteler, M., & Spronk, D. (2008). EEG phenotypes predicttreatment outcome to stimulants in children with ADHD. Journal of IntegrativeNeuroscience, 7(3), 421�438.
Arns, M., Spronk, D., & Fitzgerald, P. B. (2010). Potential differential effects of 9 HzrTMS and 10 Hz rTMS in the treatment of depression. Brain Stimulation, 3, 124�126.
Baehr, E., Rosenfeld, J. P., & Baehr, R. (1997). The clinical use of an alpha asymmetryprotocol in the neurofeedback treatment of depression: Two case studies. Journal ofNeurotherapy, 2(3), 10�23.
Barbini, B., Bertelli, S., Colombo, C., & Smeraldi, E. (1996). Sleep loss, a possible factorin augmenting manic episode. Psychiatry Research, 65(2), 121�125.
Barry, R. J., Clarke, A. R., & Johnstone, S. J. (2003). A review of electrophysiology inattention-deficit/hyperactivity disorder: I. Qualitative and quantitative electroenceph-alography. Clinical Neurophysiology, 114(2), 171�183.
Barry, R. J., Clarke, A. R., Johnstone, S. J., & Brown, C. R. (2009). EEG differences inchildren between eyes-closed and eyes-open resting conditions. Clinical Neurophysiology,120(10), 1806�1811.
Beckmann, H., & Heinemann, H. (1976). Proceedings: D-Amphetamine in manic syn-drome (authors trans.). Arzneimittel-Forschung, 26(6), 1185�1186.
Bente, D. (1964). Die insuffizienz des vigilitatstonus. Thesis, Habilitationsschrift, Erlangen.Berger, H. (1929). Uber das Elektrenkephalogramm des Menschen. Archiv fur Psychiatrie und
Nervenkranlcheiten, 87, 527�570.Bierut, L. J., Saccone, N. L., Rice, J. P., Goate, A., Foroud, T., Edenberg, H., et al.
(2002). Defining alcohol-related phenotypes in humans. The collaborative study onthe genetics of alcoholism. Alcohol Research and Health, 26(3), 208�213.
Bodenmann, S., Rusterholz, T., Durr, R., Stoll, C., Bachmann, V., Geissler, E., et al.(2009). The functional val158met polymorphism of COMT predicts interindividualdifferences in brain alpha oscillations in young men. Journal of Neuroscience, 29(35),10 855�10 862.
Boutros, N., Fraenkel, L., & Feingold, A. (2005). A four-step approach for developingdiagnostic tests in psychiatry: EEG in ADHD as a test case. Journal of Neuropsychiatryand Clinical Neurosciences, 17(4), 455�464.
Bresnahan, S. M., Anderson, J. W., & Barry, R. J. (1999). Age-related changes in quantita-tive EEG in attention-deficit/hyperactivity disorder. Biological Psychiatry, 46(12),1690�1697.
Broughton, R., & Hasan, J. (1995). Quantitative topographic electroencephalographicmapping during drowsiness and sleep onset. Journal of Clinical Neurophysiology: OfficialPublication of the American Electroencephalographic Society, 12(4), 372�386.
Brown, W. A., & Mueller, B. (1979). Alleviation of manic symptoms with catecholamineagonists. American Journal of Psychiatry, 136(2), 230�231.
Bruder, G. E., Stewart, J. W., Tenke, C. E., McGrath, P. J., Leite, P., Bhattacharya, N., et al.(2001). Electroencephalographic and perceptual asymmetry differences betweenresponders and nonresponders to an SSRI antidepressant. Biological Psychiatry, 49(5),416�425.
Bschor, T., Muller-Oerlinghausen, B., & Ulrich, G. (2001). Decreased level of EEG-vigilancein acute mania as a possible predictor for a rapid effect of methylphenidate: A case study.Clinical EEG (Electroencephalography), 32(1), 36�39.
Callaway, E., Halliday, R., & Naylor, H. (1983). Hyperactive children’s event-related poten-tials fail to support underarousal and maturational-lag theories. Archives of GeneralPsychiatry, 40(11), 1243�1248.
116 Martijn Arns et al.

Capute, A. J., Niedermeyer, E. F. L., & Richardson, F. (1968). The electroencephalogramin children with minimal cerebral dysfunction. Pediatrics, 41(6), 1104.
Cash, S. S., Halgren, E., Dehghani, N., Rossetti, A. O., Thesen, T., Wang, C., et al.(2009). The human k-complex represents an isolated cortical down-state. Science (NewYork, NY), 324(5930), 1084�1087.
Chabot, R. J., di Michele, F., Prichep, L., & John, E. R. (2001). The clinical role of comput-erized EEG in the evaluation and treatment of learning and attention disorders inchildren and adolescents. Journal of Neuropsychiatry and Clinical Neurosciences, 13(2),171�186.
Chabot, R. J., Merkin, H., Wood, L. M., Davenport, T. L., & Serfontein, G. (1996).Sensitivity and specificity of qEEG in children with attention deficit or specific devel-opmental learning disorders. Clinical EEG (Electroencephalography), 27(1), 26�34.
Chabot, R. J., Orgill, A. A., Crawford, G., Harris, M. J., & Serfontein, G. (1999).Behavioral and electrophysiologic predictors of treatment response to stimulants inchildren with attention disorders. Journal of Child Neurology, 14(6), 343.
Chabot, R. J., & Serfontein, G. (1996). Quantitative electroencephalographic profiles ofchildren with attention deficit disorder. Biological Psychiatry, 40(10), 951�963.
Chervin, R. D., Archbold, K. H., Dillon, J. E., Pituch, K. J., Panahi, P., Dahl, R. E., et al.(2002). Associations between symptoms of inattention, hyperactivity, restless legs, andperiodic leg movements. Sleep, 25(2), 213�218.
Clarke, A. R., Barry, R. J., McCarthy, R., & Selikowitz, M. (1998). EEG analysis in atten-tion-deficit/hyperactivity disorder: A comparative study of two subtypes. PsychiatryResearch, 81(1), 19�29.
Clarke, A. R., Barry, R. J., McCarthy, R., & Selikowitz, M. (2001a). Age and sex effects inthe EEG: Differences in two subtypes of attention-deficit/hyperactivity disorder. ClinicalNeurophysiology: Official Journal of the International Federation of Clinical Neurophysiology, 112(5), 815�826.
Clarke, A. R., Barry, R. J., McCarthy, R., & Selikowitz, M. (2001b). EEG-defined sub-types of children with attention-deficit/hyperactivity disorder. Clinical Neurophysiology,112(11), 2098�2105.
Clarke, A. R., Barry, R. J., McCarthy, R., & Selikowitz, M. (2001c). Electroencephalogramdifferences in two subtypes of attention-deficit/hyperactivity disorder. Psychophysiology,38(02), 212�221.
Clarke, A. R., Barry, R. J., McCarthy, R., & Selikowitz, M. (2001d). Excess beta activityin children with attention-deficit/hyperactivity disorder: An atypical electrophysiolog-ical group. Psychiatry Research, 103(2-3), 205�218.
Clarke, A. R., Barry, R. J., McCarthy, R., & Selikowitz, M. (2002a). Children with atten-tion-deficit/hyperactivity disorder and comorbid oppositional defiant disorder: AnEEG analysis. Psychiatry Research, 111(2-3), 181�190.
Clarke, A. R., Barry, R. J., McCarthy, R., & Selikowitz, M. (2002b). EEG analysis ofchildren with attention-deficit/hyperactivity disorder and comorbid reading disabil-ities. Journal of Learning Disabilities, 35(3), 276.
Clarke, A. R., Barry, R. J., McCarthy, R., Selikowitz, M., Clarke, D. C., & Croft, R. J.(2003). EEG activity in girls with attention-deficit/hyperactivity disorder. ClinicalNeurophysiology: Official Journal of the International Federation of Clinical Neurophysiology,114(2), 319�328.
Cohn, R., & Nardini, J. E. (1958). The correlation of bilateral occipital slow activity inthe human EEG with certain disorders of behavior. American Journal of Psychiatry, 115(1), 44�54.
Connemann, B. J., Mann, K., Lange-Asschenfeldt, C., Ruchsow, M., Schreckenberger, M.,Bartenstein, P., et al. (2005). Anterior limbic alpha-like activity: A low resolution
117EEG Vigilance and Phenotypes in Neuropsychiatry: Implications for Intervention

electromagnetic tomography study with lorazepam challenge. Clinical Neurophysiology:Official Journal of the International Federation of Clinical Neurophysiology, 116(4), 886�894.
Dahl, R. E., Pelham, W. E., & Wierson, M. (1991). The role of sleep disturbances in attentiondeficit disorder symptoms: A case study. Journal of Pediatric Psychology, 16(2), 229�239.
Davidson, R. J. (1998). Anterior electrophysiological asymmetries, emotion, and depres-sion: Conceptual and methodological conundrums. Psychophysiology, 35(5), 607�614.
Debener, S., Beauducel, A., Nessler, D., Brocke, B., Heilemann, H., & Kayser, J. (2000).Is resting anterior EEG alpha asymmetry a trait marker for depression? Findings forhealthy adults and clinically depressed patients. Neuropsychobiology, 41(1), 31�37.
DeFrance, J. F., Smith, S., Schweitzer, F. C., Ginsberg, L., & Sands, S. (1996).Topographical analyses of attention disorders of childhood. International Journal ofNeuroscience, 87(1-2), 41�61.
d’Elia, G., & Perris, C. (1973). Cerebral functional dominance and depression. An analysisof EEG amplitude in depressed patients. Acta Psychiatrica Scandinavica, 49(3), 191.
Ducci, F., Enoch, M. A., Yuan, Q., Shen, P. H., White, K. V., Hodgkinson, C., et al.(2009). HTR3B is associated with alcoholism with antisocial behavior and alpha EEGpower � an intermediate phenotype for alcoholism and co-morbid behaviors. Alcohol,43(1), 73�84.
Dykman, R. A., Ackerman, P. T., Oglesby, D. M., & Holcomb, P. J. (1982). Autonomicresponsivity during visual search of hyperactive and reading-disabled children.Pavlovian Journal of Biological Science, 17(3), 150�157.
Enoch, M. A., White, K. V., Harris, C. R., Rohrbaugh, J. W., & Goldman, D. (2002).The relationship between two intermediate phenotypes for alcoholism: Low voltagealpha EEG and low P300 ERP amplitude. Journal of Studies on Alcohol, 63(5),509�517.
Eysenck, H. J. (1990). Biological dimensions of personality. In L. A. Pervin (Ed.),Handbook of personality: Theory and research (pp. 244�276). New York: Guilford.
Fallone, G., Acebo, C., Arnedt, J. T., Seifer, R., & Carskadon, M. A. (2001). Effects ofacute sleep restriction on behavior, sustained attention, and response inhibition inchildren. Perceptual and Motor Skills, 93(1), 213�229.
De Gennaro, L., & Ferrara, M. (2003). Sleep spindles: An overview. Sleep MedicineReviews, 7(5), 423�440.
De Gennaro, L., Ferrara, M., & Bertini, M. (2001). The boundary between wakefulnessand sleep: Quantitative electroencephalographic changes during the sleep onsetperiod. Neuroscience, 107(1), 1�11.
De Gennaro, L., Ferrara, M., Curcio, G., & Cristiani, R. (2001). Antero-posterior EEGchanges during the wakefulness�sleep transition. Clinical Neurophysiology: OfficialJournal of the International Federation of Clinical Neurophysiology, 112(10), 1901�1911.
De Gennaro, L., Vecchio, F., Ferrara, M., Curcio, G., Rossini, P. M., & Babiloni, C.(2004). Changes in fronto-posterior functional coupling at sleep onset in humans.Journal of Sleep Research, 13(3), 209�217.
De Gennaro, L., Vecchio, F., Ferrara, M., Curcio, G., Rossini, P. M., & Babiloni, C.(2005). Antero-posterior functional coupling at sleep onset: Changes as a function ofincreased sleep pressure. Brain Research Bulletin, 65(2), 133�140.
Golan, N., Shahar, E., Ravid, S., & Pillar, G (2004). Sleep disorders and daytime sleepinessin children with attention-deficit/hyperactive disorder. Sleep, 27(2), 261�266.
Goodwin, J. E. (1947). The significance of alpha variants in the EEG, and theirrelationship to an epileptiform syndrome. American Journal of Psychiatry, 104(6),369�379.
Gordon, E. (2007). Integrating genomics and neuromarkers for the era of brain-relatedPersonalized Medicine. Personalized Medicine, 4(2), 201�215.
118 Martijn Arns et al.

Graham, M. A., & Dietlein, L. F. (1965). Technical details of data acquisition for norma-tive EEG reference library. Analysis of central nervous system and cardiovascular datausing computer methods. NASA SP, 72, 433.
Hagemann, D. (2004). Individual differences in anterior EEG asymmetry: Methodologicalproblems and solutions. Biological Psychology, 67(1-2), 157�182.
Hagemann, D., Naumann, E., Becker, G., Maier, S., & Bartussek, D. (1998). Frontal brainasymmetry and affective style: A conceptual replication. Psychophysiology, 35(4),372�388.
Hagemann, D., Naumann, E., & Thayer, J. F. (2001). The quest for the EEG referencerevisited: A glance from brain asymmetry research. Psychophysiology, 38(5), 847�857.
Haug, K., Warnstedt, M., Alekov, A. K., Sander, T., Ramırez, A., Poser, B., et al. (2003).Mutations in CLCN2 encoding a voltage-gated chloride channel are associated withidiopathic generalized epilepsies. Nature Genetics, 33(4), 527�532.
Hegerl, U., Gallinat, J., & Juckel, G. (2001). Event-related potentials. Do they reflect cen-tral serotonergic neurotransmission and do they predict clinical response to serotoninagonists? Journal of Affective Disorders, 62(1-2), 93�100.
Hegerl, U., Olbrich, S., Schonknecht, P., & Sander, C. (2008). Manic behavior as anautoregulatory attempt to stabilize vigilance. Der Nervenarzt, 79(11), 1283�1284,1286-1290.
Hegerl, U., Sander, C., Olbrich, S., & Schoenknecht, P. (2009). Are psychostimulants atreatment option in mania? Pharmacopsychiatry, 42(5), 169�174.
Hegerl, U., Stein, M., Mulert, C., Mergl, R., Olbrich, S., Dichgans, E., et al. (2008).EEG-Vigilance differences between patients with borderline personality disorder,patients with obsessive-compulsive disorder and healthy controls. European Archives ofPsychiatry and Clinical Neuroscience, 258(3), 137�143.
Henriques, J. B., & Davidson, R. J. (1990). Regional brain electrical asymmetries discrim-inate between previously depressed and healthy control subjects. Journal of AbnormalPsychology, 99(1), 22�31.
Henriques, J. B., & Davidson, R. J. (1991). Left frontal hypoactivation in depression.Journal of Abnormal Psychology, 100(4), 535�545.
Hermens, D. F., Cooper, N. J., Kohn, M., Clarke, S., & Gordon, E. (2005). Predictingstimulant medication response in ADHD: Evidence from an integrated profile ofneuropsychological, psychophysiological and clinical factors. Journal of IntegrativeNeuroscience, 4(1), 107�121.
Hermens, D. F., Rowe, D. L., Gordon, E., & Williams, L. M. (2006). Integrative neurosci-ence approach to predict ADHD stimulant response. Expert Review of Neurotherapeutics,6(5), 753�763.
Hughes, J. R., DeLeo, A. J., & Melyn, M. A. (2000). The electroencephalogram in atten-tion deficit-hyperactivity disorder: Emphasis on epileptiform discharges. Epilepsy &Behavior: E&B, 1(4), 271�277.
Hyman, S. E. (2007). Can neuroscience be integrated into the DSM-V? Nature ReviewsNeuroscience, 8(9), 725�732.
Janzen, T., Graap, K., Stephanson, S., Marshall, W., & Fitzsimmons, G. (1995).Differences in baseline EEG measures for ADD and normally achieving preadolescentmales. Biofeedback and Self-Regulation, 20(1), 65�82.
Jasper, H. H., Solomon, P., & Bradley, C. (1938). Electroencephalographic analyses ofbehavior problem children. American Journal of Psychiatry, 95(3), 641.
Jin, Y., Potkin, S. G., Kemp, A. S., Huerta, S. T., Alva, G., Thai, T. M., et al. (2006).Therapeutic effects of individualized alpha frequency transcranial magnetic stimulation(alpha TMS) on the negative symptoms of schizophrenia. Schizophrenia Bulletin, 32(3),556�561.
119EEG Vigilance and Phenotypes in Neuropsychiatry: Implications for Intervention

John, E. R., Prichep, L. S., & Almas, M. (1992). Subtyping of psychiatric patients by clus-ter analysis of QEEG. Brain Topography, 4(4), 321�326.
Johnstone, J., Gunkelman, J., & Lunt, J. (2005). Clinical database development:Characterization of EEG phenotypes. Clinical EEG and Neuroscience: Official Journal ofthe EEG and Clinical Neuroscience Society (ENCS), 36(2), 99�107.
Kaneko, S., Iwasa, H., Okada, M., & Hirose, S. (2002). Autosomal dominant nocturnalfrontal lobe epilepsy (ADNFLE). Ryoikibetsu Shokogun Shirizu, 37 Pt 6, 315�317.
Keller, M. B., McCullough, J. P., Klein, D. N., Arnow, B., Dunner, D. L., Gelenberg, A. J.,et al. (2000). A comparison of nefazodone, the cognitive behavioral-analysis system of psy-chotherapy, and their combination for the treatment of chronic depression. New EnglandJournal of Medicine, 342(20), 1462�1470.
Kirsch, I., Deacon, B. J., Huedo-Medina, T. B., Scoboria, A., Moore, T. J., & Johnson, B. T.(2008). Initial severity and antidepressant benefits: A meta-analysis of data submitted tothe food and drug administration. PLoS Medicine, 5(2), e45.
Klimesch, W. (1999). EEG alpha and theta oscillations reflect cognitive and memory per-formance: A review and analysis. Brain Research Brain Research Reviews, 29(2-3),169�195.
Klimesch, W., Sauseng, P., & Gerloff, C. (2003). Short Communication: Enhancing cog-nitive performance with repetitive transcranial magnetic stimulation at human individ-ual alpha frequency. European Journal of Neuroscience, 17, 1129�1133.
Kuperman, S., Johnson, B., Arndt, S., Lindgren, S., & Wolraich, M. (1996). QuantitativeEEG differences in a nonclinical sample of children with ADHD and undifferentiatedADD. Journal of the American Academy of Child and Adolescent Psychiatry, 35(8), 1009�1017.
Lansbergen, M., Arns, M., van Dongen-Boomsma, M., Spronk, D., & Buitelaar, J. K.(in press). The increase in theta/beta ratio on resting state EEG in boys withattention-deficit/hyperactivity disorder is medicated by slow alpha peak frequency.Progress in Neuro-Psychopharmacology and Biological Psychiatry.
Lazzaro, I., Gordon, E., Li, W., Lim, C. L., Plahn, M., Whitmont, S., et al. (1999).Simultaneous EEG and EDA measures in adolescent attention deficit hyperactivity dis-order. International Journal of Psychophysiology: Official Journal of the InternationalOrganization of Psychophysiology, 34(2), 123�134.
Lazzaro, I., Gordon, E., Whitmont, S., Plahn, M., Li, W., Clarke, S., et al. (1998).Quantified EEG activity in adolescent attention deficit hyperactivity disorder. ClinicalEEG (Electroencephalography), 29(1), 37�42.
Lennox-Buchthal, M., Buchthal, F., & Rosenfalck, P. (1960). Correlation of electro-encephalographic findings with crash rate of military jet pilots. Epilepsia, 1,366�372.
Leuchter, A. F., Cook, I. A., Marangell, L. B., Gilmer, W. S., Burgoyne, K. S., Howland,R. H., et al. (2009). Comparative effectiveness of biomarkers and clinical indicatorsfor predicting outcomes of SSRI treatment in major depressive disorder: Results ofthe BRITE-MD study. Psychiatry Research, 169(2), 124�131.
Loomis, A. L., Harvey, E. N., & Hobart, G. A. (1937). Cerebral states duringsleep as studied by human brain potentials. Jouranl of Experimental Psychology, 21,127�144.
Lubar, J. F. (1991). Discourse on the development of EEG diagnostics and biofeedback forattention-deficit/hyperactivity disorders. Applied Psychophysiology and Biofeedback, 16(3),201�225.
Mann, C. A., Lubar, J. F., Zimmerman, A. W., Miller, C. A., & Muenchen, R. A. (1992).Quantitative analysis of EEG in boys with attention-deficit-hyperactivity disorder:Controlled study with clinical implications. Pediatric Neurology, 8(1), 30�36.
Matsuura, M., Okubo, Y., Toru, M., Kojima, T., He, Y., Hou, Y., et al. (1993). A cross-national EEG study of children with emotional and behavioral problems: A
120 Martijn Arns et al.

WHO collaborative study in the Western Pacific region. Biological Psychiatry, 34(1-2),59�65.
Merica, H., & Fortune, R. D. (2004). State transitions between wake and sleep, andwithin the ultradian cycle, with focus on the link to neuronal activity. Sleep MedicineReviews, 8(6), 473�485.
Molina, B. S., Hinshaw, S. P., Swanson, J. M., Arnold, L. E., Vitiello, B., Jensen, P. S.,et al. (2009). The MTA at 8 years: Prospective follow-up of children treated for com-bined-type ADHD in a multisite study. Journal of the American Academy of Child andAdolescent Psychiatry, 48(5), 484�500.
Monastra, V. J., Lubar, J. F., Linden, M., VanDeusen, P., Green, G., Wing, W., et al.(1999). Assessing attention deficit hyperactivity disorder via quantitative electroen-cephalography: An initial validation study. Neuropsychology, 13(3), 424�433.
Myslobodsky, M. S., Bar-Ziv, J., van Praag, H., & Glicksohn, J. (1989). Bilateral alpha dis-tribution and anatomic brain asymmetries. Brain Topography, 1(4), 229�235.
Myslobodsky, M. S., Coppola, R., & Weinberger, D. R. (1991). EEG laterality in the eraof structural brain imaging. Brain Topography, 3(3), 381�390.
Niedermeyer, E. (1997). Alpha rhythms as physiological and abnormal phenomena.International Journal of Psychophysiology: Official Journal of the International Organization ofPsychophysiology, 26(1-3), 31�49.
Niedermeyer, E., & Da Silva, F. H. L. (2004). Electroencephalography: Basic principles, clinicalapplications, and related fields. Philadelphia, PA: Lippincott Williams & Wilkins.
Nierenberg, A. A. (2010). The perfect storm: CNS drug development in trouble. CNSSpectrums, 15(5), 282�283.
Olbrich, S., Mulert, C., Karch, S., Trenner, M., Leicht, G., Pogarell, O., et al. (2009).EEG-Vigilance and BOLD effect during simultaneous EEG/fMRI measurement.Neuroimage, 45(2), 319�332.
Piccart-Gebhart, M. J., Procter, M., Leyland-Jones, B., Goldhirsch, A., Untch, M., Smith, I.,et al. (2005). Trastuzumab after adjuvant chemotherapy in her2-positive breast cancer.New England Journal of Medicine, 353(16), 1659�1672.
Pivik, R. T., & Harman, K. (1995). A reconceptualization of EEG alpha activity as anindex of arousal during sleep: All alpha activity is not equal. Journal of Sleep Research,4(3), 131�137.
Pliszka, S. R. (2007). Pharmacologic treatment of attention-deficit/hyperactivitydisorder: Efficacy, safety and mechanisms of action. Neuropsychology Review, 17(1),61�72.
Reid, S. A., Duke, L. M., & Allen, J. J. (1998). Resting frontal electroencephalographicasymmetry in depression: Inconsistencies suggest the need to identify mediating fac-tors. Psychophysiology, 35(4), 389�404.
Richter, P. L., Zimmerman, E. A., Raichle, M. E., & Liske, E. (1971). Electroencephalogramsof 2,947 united states air force academy cadets (1965-1969). Aerospace Medicine, 42(9),1011�1014.
Roth, B. (1961). The clinical and theoretical importance of EEG rhythms correspondingto states of lowered vigilance. Electroencephalography and Clinical Neurophysiology, 13,395�399.
Roth, M., Kay, D. W., Shaw, J., & Green, J. (1957). Prognosis and pentothal inducedelectroencephalographic changes in electro-convulsive treatment; an approach to theproblem of regulation of convulsive therapy. Electroencephalography and ClinicalNeurophysiology, 9(2), 225�237.
Rush, A. J., Trivedi, M. H., Wisniewski, S. R., Nierenberg, A. A., Stewart, J. W.,Warden, D., et al. (2006). Acute and longer-term outcomes in depressed outpatientsrequiring one or several treatment steps: A STARD report. American Journal ofPsychiatry, 163(11), 1905�1917.
121EEG Vigilance and Phenotypes in Neuropsychiatry: Implications for Intervention
Sander, C., Arns, M., Olbrich, S., & Hegerl, U. (2010). EEG-Vigilance and response tostimulants in paediatric patients with attention deficit/hyperactivity disorder. ClinicalNeurophysiology, 121(9), 1511�1518.
Satterfield, J. H., Cantwell, D. P., Saul, R. E., Lesser, L. I., & Podosin, R. L. (1973).Response to stimulant drug treatment in hyperactive children: Prediction fromEEG and neurological findings. Journal of Autism and Childhood Schizophrenia, 3(1),36�48.
Satterfield, J. H., Lesser, L. I., & Podosin, R. L. (1971). Evoked cortical potentials inhyperkinetic children. California Medicine, 115(3), 48.
Schaffer, C. E., Davidson, R. J., & Saron, C. (1983). Frontal and parietal electroencepha-logram asymmetry in depressed and nondepressed subjects. Biological Psychiatry, 18(7),753�762.
Small, J. G., Milstein, V., & Medlock, C. E. (1997). Clinical EEG findings in mania.Clinical EEG (Electroencephalography), 28(4), 229�235.
Spronk, D., Arns, M., Barnett, K. J., Cooper, N. J., & Gordon, E. (2010). An investiga-tion of EEG, genetic and cognitive markers of treatment response to antidepressantmedication in patients with major depressive disorder: A pilot study. Journal of AffectiveDisorders, doi:10.1016/j.jad.2010.06.021.
Steriade, M., Gloor, P., Llinas, R. R., Lopes de Silva, F. H., & Mesulam, M. M. (1990).Report of IFCN committee on basic mechanisms. Basic mechanisms ofcerebral rhythmic activities. Electroencephalography and Clinical Neurophysiology, 76(6),481�508.
Stevens, J. R., Sachdev, K., & Milstein, V. (1968). Behavior disorders of childhood andthe electroencephalogram. Archives of Neurology, 18(2), 160.
Strijkstra, A. M., Beersma, D. G., Drayer, B., Halbesma, N., & Daan, S. (2003).Subjective sleepiness correlates negatively with global alpha (8-12 hz) and positivelywith central frontal theta (4�8 hz) frequencies in the human resting awake electroen-cephalogram. Neuroscience Letters, 340(1), 17�20.
Suffin, S. C., & Emory, W. H. (1995). Neurometric subgroups in attentional and affectivedisorders and their association with pharmacotherapeutic outcome. Clinical EEG(Electroencephalography), 26(2), 76�83.
Tanaka, H., Hayashi, M., & Hori, T. (1996). Statistical features of hypnagogic EEG mea-sured by a new scoring system. Sleep (New York, NY), 19(9), 731�738.
Tanaka, H., Hayashi, M., & Hori, T. (1997). Topographical characteristics and principalcomponent structure of the hypnagogic EEG. Sleep, 20(7), 523�534.
Tomarken, A. J., Davidson, R. J., Wheeler, R. E., & Kinney, L. (1992). Psychometricproperties of resting anterior EEG asymmetry: Temporal stability and internal consis-tency. Psychophysiology, 29(5), 576�592.
Ulrich, G. (1994). Psychiatrische Elektroenzephalographie Jena: Gustav Fischer Verlag.Ulrich, G., & Frick, K. (1986). A new quantitative approach to the assessment of stages of
vigilance as defined by spatiotemporal EEG patterning. Perceptual and Motor Skills,62(2), 567�576.
Van Sweden, B. (1986). Disturbed vigilance in mania. Biological Psychiatry, 21(3), 311�313.Vaughn, B. V., Greenwood, R. S., Aylsworth, A. S., & Tennison, M. B. (1996).
Similarities of EEG and seizures in del (1q) and benign rolandic epilepsy. PediatricNeurology, 15(3), 261�264.
Wehr, T. A. (1992). Improvement of depression and triggering of mania by sleep depriva-tion. JAMA, 267(4), 548�551.
122 Martijn Arns et al.

Wright, C. & Gunkelman, J. (1998). QEEG evaluation doubles the rate of clinical success.Series data and case studies. Austin, TX, Society for the Study of NeuronalRegulation, 6th Annual Conference.
Wundt, W. M. (1874). Grundzuge der physiologischen Psychologie Leipzig: W. Engelman.Zuckerman, M. (1985). Sensation seeking, mania, and monoamines. Neuropsychobiology,
13(3), 121�128.
123EEG Vigilance and Phenotypes in Neuropsychiatry: Implications for Intervention

This page intentionally left blank

PARTTwoTwoEndogenousNeuromodulationStrategies

This page intentionally left blank

CHAPTER55Neurofeedback with Childrenwith Attention DeficitHyperactivity Disorder:A Randomized Double-BlindPlacebo-Controlled StudyRoger J. deBeus1 and David A. Kaiser21Department of Psychiatry and Behavioral Sciences, Quillen College of Medicine, East Tennessee StateUniversity, Johnson City, Tennessee, USA2Wavestate Inc., Marina Del Ray, California, USA
Contents
Introduction 128Established Treatments for ADHD 128Use of Neurofeedback for Management of ADHD 130
Method 132Participants 132Design 133Treatments 134Diagnostic Assessment 137Outcome Measures 137Data Analysis 138
Results 139Sample Characteristics 139NF Learners vs. Placebo 139
Discussion 141Neurofeedback Learners vs. Nonlearners 144Parent, Teacher, and Children Outcomes 145Limitations of the Study 147
Conclusions 148Acknowledgments 148References 148
127Neurofeedback and Neuromodulation Techniques and ApplicationsDOI: 10.1016/B978-0-12-382235-2.00005-6
© 2011 Elsevier Inc.All rights reserved.

INTRODUCTION
Attention deficit hyperactivity disorder (ADHD) is the most common
childhood mental health disorder, with an estimated prevalence of 7% to
10% in boys and 3% in girls aged 4�11 years (Sgrok, Roberts, Grossman, &
Barozzine, 2000). ADHD is characterized by inattention, distractibility,
hyperactivity, or excessive impulsivity, symptoms that cause impairment in
more than one setting and cannot be explained by another disorder such as
brain injury, a mood disorder, or an anxiety disorder (American Psychiatric
Association [DSM-IV-TR], 2000). As many as 4 out of 5 children diagnosed
with this disorder continue to suffer from attention problems in adolescence
and adulthood (Monastra, 2005).
Anatomically, in terms of brain organization, many of these children
exhibit immature development of frontostriatal circuitry (Clarke, Barry,
McCarthy, & Selikowitz, 2001) along with other structural and func-
tional brain disturbances including the cerebellum and parietal cortices
(Cherkasova & Hechtman, 2009). There are also physiological components
to ADHD that have been measured using quantitative electroencephalograph
(qEEG). An elevated theta-to-beta power ratio, where theta exceeds beta
activity many times over, has been used as an index of attentional dysregula-
tion for more than 20 years (Barry, Clarke, Johnstone, McCarthy, &
Selikowitz, 2009; Lubar, 1991; Lubar & Lubar, 1984; Satterfield, Schell,
Backs, & Hidaka, 1984). Many ADHD children show variations of excessive
slow-wave and fast-wave activity over the frontal cortex (Clarke et al., 2001).
Chabot & Serfontein (1996) identified ADHD children’s qEEG profiles con-
sisting of: (1) increased focal theta localized within frontal and/or midline
regions 92% of the time; (2) increased alpha localized within posterior and/or
midline regions 84.1% of the time; (3) increased beta occurred in 13.1%
localized in frontal and/or posterior regions.
Established Treatments for ADHDThe best documented and most widely used treatment for ADHD is stim-
ulant medication. These studies show a robust effect in group data, with
placebo-controlled effect sizes (Cohen’s d ) from 0.7 to 1.5 on parent and
teacher ratings of attention and behavior (Arnold, 2004). Unfortunately,
the response rate at the individual patient level is often less than satisfac-
tory. An example of this can be gleaned from the 579-subject NIMH
Multimodal Treatment Study of Children with ADHD (the MTA, MTA
128 Roger J. deBeus and David A. Kaiser

Cooperative Group, 1999). This study randomly assigned rigorously
diagnosed children aged 7�9 to one of four treatment conditions: (1)
intensive medication management (MedMgt); (2) intensive behavioral
treatment (Beh); (3) combination of intensive medication and behavioral
treatments (Comb); (4) community-care comparison (CC), 2/3 of whom
obtained stimulant medication from their community physician. Swanson
et al. (2001) re-analyzed the MTA data to determine the percentage with
satisfactory (near-normal) outcome after 14 months of treatment. These
authors reported the following success rates for each group: MedMgt
(56%), Beh (34%), Comb (68%), CC (25%). Even with the combination
treatment, not available in most communities, almost 1/3 in the MTA
study and 3/4 in the community were still left with less than completely
optimal results.
Side effects of methylphenidate (Ritalin), one of the most popular
psychostimulants used to mask or reduce ADHD symptoms in children,
are the following: loss or delay of height (Faraone, Biederman, Morley, &
Spencer, 2008); diminished sleep (Galland, Tripp, & Taylor, 2009); appetite
problems (Sonuga-Barke, Coghill, Wigal, DeBacker, & Swanson, 2009);
increased risk of suicide in pre-adolescents, aged 11�14 years (McCarthy,
Cranswick, Potts, Taylor, & Wong, 2009); nervousness, headaches, and
tachycardia (Klein-Schwartz, 2002). Further, in a study examining medica-
tion adherence in a subset of the MTA study, parents’ reports were not
consistent with saliva assays in almost half of the cases (Pappadopulos et al.,
2009), indicating that compliance was not consistent with what the parents
were reporting. Findings also indicated that non-adherence produced
greater deleterious effects in children in the MedMgt condition compared
with those receiving both medication and behavioral treatment. The com-
bination of less than optimal outcomes, side effects and parents’ or care-
takers’ failures to give medications suggests that behavioral methods play an
important role in the treatment of ADHD.
Behavioral treatments can also be effective at treating this disorder
(e.g., Pelham & Fabiano, 2008; Reeves & Anthony, 2009). Behavioral
treatments include instructional programs to assist parents and teachers in
identifying and assisting children with attention problems, and training
programs where children are taught to take responsibility for monitoring
and managing their own behavior (DuPaul & Stoner, 2003). Nearly two
years after MTA’s behavioral treatment finished, there had been no loss in
its effectiveness and the majority of children who received it were still
unmedicated ( Jensen et al., 2007).
129Neurofeedback with Children with Attention Deficit Hyperactivity Disorder

Use of Neurofeedback for Management of ADHDNeurofeedback (NF) refers to operant conditioning of electroencephalo-
graphic (EEG) rhythms: healthy, age-appropriate brainwave activity is
rewarded with visual, auditory, or even tactile stimulation, and undesirable
activity is ignored or punished (Sterman, 1996). Neurofeedback to reduce
ADHD symptoms has been studied for nearly 35 years (Lubar & Bahler,
1976; Lubar & Shouse, 1976). As a person becomes successful in regulat-
ing his or her own brain electrical activity, improvements in cognition
and behaviors usually follow (Nash, 2000).
Using an ABA single-case design, Lubar and Shouse (1976) determined
that rewarding the sensorimotor rhythm (SMR; 12�14 Hz) decreased
hyperactive symptoms in a hyperkinetic child, whereas inhibiting the same
SMR rhythm led to increased hyperactivity. Since this report, more than 60
scientific publications by dozens of investigators have examined the effective-
ness of using neurofeedback in lieu of or adjunct to behavioral and/or
pharmacological interventions for this disorder. Studies have included obser-
vational case studies, controlled trials, and randomized controlled trials
(RCT). Much of the research has focused on enhancing beta activity
(12�21 Hz) and suppressing theta (4�8 Hz) (Lubar & Shouse, 1976; see
Monastra, 2005 for a review), although recent research has included slow
cortical potential (SCP) training (e.g., Heinrich, Gevensleben, Freisleder,
Moll, & Rothenberger, 2004).
Observational studies have separated subjects on a variety of factors
including NF treatment effects (Lubar & Shouse, 1976), identifying respon-
ders versus non-responders (Lubar, Swartwood, Swartwood, & O’Donnell,
1995; Kropotov et al., 2005), and differences between completers and non-
completers of treatment (e.g., Heywood & Beale, 2003). Controlled stud-
ies, non-randomized and RCTs, have compared NF to a comparative
group such as wait-list controls (Carmody, Radvanski, Wadhwani, Sabo, &
Vergara, 2001 [RCT]; Heinrich et al., 2004; Levesque, Beauregard, &
Mensour, 2006 [RCT]); Linden, Habib, & Radojevic, 1996 [RCT]), sti-
mulants (Fuchs, Birbaumer, Lutzenberger, Gruzelier, & Kaiser, 2003;
Rossiter, 2004; Rossiter & LaVaque, 1995), group therapy (Doehnert,
Brandeis, Straub, Steinhausen, & Drechsler, 2008 [RCT]; Drechsler et al.,
2007 [RCT]), electromyographic biofeedback (Bakhshayesh, 2007
[RCT]), computerized attention or cognitive training (Gevensleben et al.,
2009a [RCT]; Holtmann et al., 2009 [RCT]), or comprehensive clinical
care consisting of medication, parent training, and school consultation
(Monastra, Monastra, & George, 2002).
130 Roger J. deBeus and David A. Kaiser

Collectively, these studies suggest that NF treatment reduces the cardi-
nal symptoms of ADHD as noted by a multitude of outcomes. In some
studies parents and teachers reported improved attention and decreased
hyperactivity and impulsivity (e.g., Dreschler et al., 2007; Fuchs et al.,
2003; Gevensleben et al., 2009a; Leins et al., 2007; Monastra et al., 2002).
Some studies have shown improvements in cognitive variables such as
attention as measured with continuous performance tests (e.g., Fuchs
et al., 2003; Heinrich et al., 2004; Kaiser & Othmer, 2000; Monastra et al.,
2002), and/or in IQ (e.g., Lubar et al., 1995; Thompson & Thompson,
1998). Alhambra, Fowler, and Alhambra (1995) demonstrated that a reduc-
tion or discontinuation of stimulant medications was feasible, while
others showed equivalency of NF effects to those of stimulants (e.g., Fuchs
et al., 2003; Rossiter & LaVaque, 1995). In some studies qEEG variables
changed as a function of treatment (e.g., Gevensleben et al., 2009b;
Kropotov et al., 2005; Lubar et al., 1995; Monastra et al., 2002), and parti-
cipants were able to maintain EEG (SCP) changes six months (Strehl et al.,
2006) and two years after treatment (Gani, Birbaumer, & Strehl, 2008).
Finally, recent research has included functional magnetic resonance imaging
(fMRI) indices of change resulting from NF, the “gold standard” in neuro-
psychiatric and related research. For example, Levesque et al. (2006) dem-
onstrated a normalization of key neural substrates of selective attention and
response inhibition as noted in changes of the anterior cingulate cortex,
caudate, and substantia nigra. In summarizing NF research relating to
ADHD, Monastra (2005) noted that significant clinical improvement was
reported in nearly 75% of the patients treated with NF. And a recent meta-
analysis concluded that NF was an efficacious treatment of ADHD, with a
large effect size for inattention and impulsivity and a medium effect size for
hyperactivity (Arns, de Ridder, Strehl, Breteler, & Coenen, 2009).
Despite the clinical success NF has shown, it is still not a widely
accepted treatment for ADHD children. It seems the medical community
will not accept this technique unless even clearer and more objective evi-
dence can be documented. To this end, NF research may benefit from the
methodology common in pharmacological studies, incorporating ran-
domized control group designs, such as a placebo condition (Holtmann &
Stadler, 2006). Monastra (2005) summarized the main flaws found in
extant NF studies in ADHD: lack of adequate controls, especially sham/
placebo; failure to control for treatment preference bias; confounding of
several different treatments; lack of diagnostic rigor; absence of blinding;
lack of randomization.
131Neurofeedback with Children with Attention Deficit Hyperactivity Disorder

The most notable study to date that has addressed such NF research
shortcomings was conducted by Gevensleben and colleagues (2009a).
Their study was an RCT with participants assigned to a NF (theta/beta
combined with SCP training) or computerized attention skills program.
The rate of positive response, as identified by 25% improvement in the
total ADHD score completed by parents, was 52% for the NF group and
29% for the attention training group. In attempting to explain the rela-
tively low response rate in the NF group, the authors noted possible con-
founds such as participants’ expectations and effort, specificity of training
effects, and non-blind design. While this study shows clinical effectiveness
of NF compared to an active control group, there remain specific effects
of NF that can be addressed with blinded, placebo-controlled designs
involving RCT.
The current study addresses the absence of blinded, placebo-controlled,
RCT research in the NF literature. A crossover design was implemented
to help in enrollment and prevent attrition, giving each participant an
equal chance of receiving NF and placebo. In an effort to include a repre-
sentative clinical sample, children with primary ADHD and co-occurring
diagnoses were permitted as well as those using only stimulant medication.
Based on previous reports outlining the importance of considering partici-
pants who effectively “learn” NF, versus those who do not learn
(Doehnert et al., 2008; Dreschler et al., 2007; Lubar et al., 1995; Lubar,
1997; Kropotov et al., 2005; Monastra et al., 2002; Strehl et al., 2006), we
identified learners and non-learners using pre- and post-session EEG data.
Our primary hypothesis was that participants in the NF intervention who
learned to change their EEG would improve in functioning compared to
the placebo condition. Functioning was measured with Conners’ parent
and teacher ratings of DSM-IV ADHD symptoms (Conners, 2002a,
2002b), and participant’s performance on the IVA CPT (Integrated Visual
and Auditory Continuous Performance Test: Response Control and
Attention Quotients).
METHOD
ParticipantsChildren were recruited from flyer advertisements, and from two elemen-
tary schools and two clinic settings. One school was a public school and
the other a private school specializing in serving children with ADHD
and/or learning disabilities. The first clinic was in a hospital setting and
132 Roger J. deBeus and David A. Kaiser

the second was a neuropsychology clinic housed at a medical school.
The intervention was conducted at these four facilities. After meeting
inclusion/exclusion criteria, participants and primary caregiver(s) signed
informed consent. The study and informed consent were approved by the
Institutional Review Boards of the respective agencies. Parent(s) gave
signed written informed consents, and each child was required to assent
to the study in order to participate.
Inclusion CriteriaCriteria for inclusion were: (1) age 7�11 years; (2) meet DSM-IV criteria
for an ADHD diagnosis by: (a) having a parent endorse six of nine symptoms
of ADHD in a single category of either Inattention or Hyperactivity or in
both categories (Combined), and (b) having a licensed clinical psychologist
confirm the diagnosis on the basis of a structured clinical interview and for-
mal testing; (3) the child’s prescribing doctor and parent(s) have agreed for
any stimulant medication (e.g., Ritalin, Concerta, Dexedrine, or Adderall)
to be removed for at least 48 hours prior to being evaluated during the initial
diagnostic work-up, prior to testing mid-way through the study, and again
at the time of final testing; (4) the child has been in residence with the same
primary caretaker for the previous six months or longer; (5) the child’s par-
ent(s) or guardian(s) expressed a willingness to transport and escort the child
to the intake procedure, all 40 sessions, and to pre-, mid-, and post-testing
sessions.
Exclusion CriteriaCriteria on which children were excluded from the study were: (1) below
average intellectual ability, as defined by an IQ score below 80; (2) a history
of any previous or present serious mental illness other than ADHD (e.g.,
mood disorder, anxiety disorder, psychotic disorder) for which the child has
taken medications other than stimulant medications prescribed for ADHD;
(3) any history of neurological disease, including seizures or head injury
with loss of consciousness; (4) any known chronic medical illness or condi-
tion; (5) the use of any daily medication that is likely to significantly affect
the child’s concentration, affect, and activity level (other than stimulant
medication � e.g., Ritalin, Dexedrene, Concerta, Adderall).
DesignThis study used a randomized double-blind crossover design, allowing
participants to serve as their own controls. Phases of the study included
133Neurofeedback with Children with Attention Deficit Hyperactivity Disorder

diagnostic work-up, baseline assessment, 20 sessions, mid-assessment,
20 sessions, and post-assessment. Upon completion of the baseline assess-
ment, participants were randomized to receive either neurofeedback or
placebo conditions. Children were randomized into each of the groups by
computer generated random numbers and assigned by an administrative
assistant not involved with either the assessments or interventions. Each
group participated in their assigned procedure for 10 weeks. After a one-
week washout period, the participants were crossed over to receive the
other condition. Sessions occurred at the average rate of two times per
week. Children, parents, and teachers were not required to do any supple-
mental behavior management techniques for the study. The investigators,
families, subjects, and teachers were blind to the randomization order
throughout the study period. Evaluation of the effectiveness of blinding
was not done (Margraf et al., 1991).
TreatmentsSetup of SessionsParticipants in both conditions were exposed to identical setups. The interface
consisted of playing off-the-shelf Sony PlayStation video racing games (rated
E) chosen by the child. Each child had his or her own memory card so game
progress could be saved. Three electrodes were positioned on the child’s head:
active lead at the frontal midline (FZ) site (International 10�20 System), with
ground on the right ear and reference lead on the left ear. Sensor sites were
abraded with NuPrep and EEG paste was used to secure the sensors to the
head. Impedances were below 10 kOhms for each site. Children in both con-
ditions were given the same instructions on how the game interface worked.
Once the electrodes were placed and equipment powered on, each child
played the videogame for about 30 minutes per session.
All technicians were trained and supervised by a BCIA EEG-certified
licensed clinical psychologist. There were two technicians delivering the
intervention to maintain blindness to conditions at each location. Technician
A applied the sensors and helped the child as needed to stay focused on the
playing the games. Simple reward statements were made to the child that
included: “try to be calm,” “you’re doing great,” “good job,” etc. Technician
A did not know the condition the child was in. Technician B controlled the
computers capturing the EEG information, and did know what condition
the child was in. The only communication permitted between Technician A
and B was for A to inform B that the child was ready to start, and for B to
134 Roger J. deBeus and David A. Kaiser

inform A when the child had completed the session. The child and
Technician A were separated by a divider from Technician B. See Figure 5.1
for a visual representation of the session setup.
Active NeurofeedbackThe active neurofeedback condition used the neurofeedback training
device developed by CyberLearning Technology, LLC (CLT). The tech-
nology behind the CLT neurofeedback device was tested and developed at
NASA in research related to monitoring and training the engagement of
pilots during flight deck operations, and has been further examined with
Child-1
Child-2
PS
PS
Technician A
Computer
Computer
EEG
Technician B
EEG
GC
GC
CLT
BioExplorer
BioGraph
Placebo
Divider
Pro-Comp
Figure 5.1 Session setup. Note: PS5 Portable Sony PlayStation-1 with video screen;GC5 game controller; EEG5 electroencephalogram from child’s head with sensorplaced at FZ; Placebo5 noncontingent feedback device; CLT5CyberLearningTechnologies video game modulation unit; BioGraph software and ProComp ampli-fier from Thought Technology; BioExplorer software from CyberEvolution; Computerswere Dell laptops.
135Neurofeedback with Children with Attention Deficit Hyperactivity Disorder

ADHD children (Palsson et al., 2001). The CLT neurofeedback device
works through an interface that modulates the input to the video game
controller based upon measured EEG activity. The trainee uses the game
controller for normal game play functions. The sensitivity or responsive-
ness of the game controller is controlled by real-time EEG activity in two
ways: speed of the race car and steering control. Normally, while playing a
race car game, the player presses the ‘X’ button on the game controller to
accelerate the car. With the CLT EEG interface, speed is controlled by a
beta (12�20 Hz) to theta1 alpha (4�12 Hz) ratio known as the
Engagement Index (EI) developed at NASA. Lower ratios of engagement
(more theta1 alpha and less beta) cause the car to slow down or even stop,
while higher ratios (less theta1 alpha and more beta) allow the car to
maintain full speed. Additionally the trainee received tactile feedback via
the vibrator rumble function of the game controller. The rumble is typi-
cally activated when the car hits a wall, but in the CLT interface, this rum-
ble function was disconnected from video game play and was connected as
feedback based on sensorimotor rhythm (SMR: 12�15 Hz) amplitude
thresholds. If the trainee’s SMR amplitude was too low, the game control-
ler vibrated as a warning. When the vibration continued non-stop for four
seconds, steering control was lost. Steering control was regained when
SMR amplitudes returned above threshold.
In summary, all active-treatment subjects received training to suppress
slow wave theta1 alpha (8�12 Hz) and enhance beta (12�20 Hz), includ-
ing SMR (12�15 Hz) in the special way described above. Active sensor
placement was the frontal midline (FZ) based on the International 10�20
System, with ground on the right ear and reference on the left ear. For
each session, a 3-minute baseline was obtained for average EI ratio and
SMR amplitudes to set thresholds. Thresholds were set at 70% reward for
both the EI and SMR and were not changed during the session (i.e., no
auto-thresholds were implemented). Additional equipment used was
BioExplorer software (Version 1.0, CyberEvolution) to monitor integrity
of the brainwave activity, and for later analysis of the data.
Placebo NeurofeedbackThe placebo condition was identical to the active neurofeedback in all
aspects: game choices, sensors placements, duration of sessions, and inter-
action with Technician A. The only difference was that there was a separ-
ate random feedback interface module controlled by Technician B. In
order to mimic the effects of feedback on the EEG as in the active NF,
136 Roger J. deBeus and David A. Kaiser

the interface module had three buttons to control game feedback:
(1) slowing down the speed of the car, (2) vibrating the hand controller,
and (3) turning off steering control. Technician B followed a set schedule
to press one of the three buttons for a predetermined length of time (1 to
5 seconds) once a minute during feedback. This non-contingent feedback
occurred at the rate of 5%. Equipment used to monitor EEG for the
placebo condition was ProComp1 amplifiers and Biograph software
(Version 3, Thought Technology).
Diagnostic AssessmentThe diagnostic procedure consisted of a structured clinical interview, IQ,
and achievement screening, and parent rating scales. For the structured
clinical interview, the computerized Diagnostic Interview for Children
and Adolescents-IV, Parent Version (DICA-IV: Reich, Leacock, &
Shanfeld, 1997) was used to identify ADHD and other co-occurring disor-
ders, and the diagnoses were confirmed by a licensed clinical psychologist.
The ADHD diagnosis was further confirmed by using the Conners’ Parent
Rating Scales - Revised (CPRS-R: Conners, 2002a) DSM-IV ADHD
Inattentive and Hyperactivity-Impulsive scales and requiring T-scores of 65
or higher on one or both scales.
Intellectual functioning (IQ) was estimated using the Wechsler
Abbreviated Scale of Intelligence (WASI: Wechsler, 1999). It yields a Full-
Scale IQ (FSIQ), Verbal IQ (VIQ), and Performance IQ (PIQ). Academic
achievement was estimated with the Wechsler Individual Achievement
Test � Abbreviated (WIAT-II-A: Psychological Corporation, 2001). The
WIAT-II-A is a brief measure of academic skills in Word Reading, Spelling,
and Numerical Operations.
Outcome MeasuresMajor assessments occurred at baseline, mid-assessment (after completion
of first 20 sessions), and post-assessment (after the second 20 sessions). The
primary outcome measure used was the DSM-IVADHD Total scale of the
Conners’ teacher rating scales. This was because parents typically over-
report responses to placebo in ADHD research (Grizenko et al., 2004).
Conners’ Parent/Teacher Rating Scales-Revised: Long Version(CPRS-R:L/CTRS-R:L)The CPRS-R:L and CTRS-R:L (Conners, 2002a, 2002b) are broadband
rating scales of childhood psychopathology. Each item is rated on a four-point
137Neurofeedback with Children with Attention Deficit Hyperactivity Disorder

scale (not at all5 0, just a little5 1, pretty much5 2, and very much5 3).
Raw scores for each scale are transformed by age and gender into T scores,
with a mean of 50 and an SD of 10. The DSM-IV ADHD Inattentive
(ADHDin), DSM-IV ADHD Hyperactive-Impulsive (ADHDhyp), and
ADHD Total (ADHDtotal) scales for both parent and teacher were used as
outcome measures. The teacher ADHD Total score was the primary out-
come while the remaining scales were secondary outcomes. The CPRS-R:L
and CTRS-R:L were given at baseline, mid- and post-assessment points.
The Integrated Visual and Auditory ContinuousPerformance Test (IVA)The IVA (Turner & Sandford, 1995) is a computerized test that lasts
approximately 13 minutes and presents 500 trials of the numbers 1 or 2
for 500 msec, with an interstimulus interval of 1500 msec. Numbers are
presented through headphones and on a computer monitor in a pseudo-
random pattern requiring the shifting of sets between the visual and audi-
tory modalities. The subject is required to click the mouse only when he
sees or hears a 1 and to inhibit clicking when he sees or hears a 2. During
various segments of the IVA test, response sets change inviting more
errors of commission, or impulsivity, and more errors of omission, or
inattention. Raw scores for each scale are transformed by age into quo-
tient scores, with a mean of 100 and SD of 15. The full scale Response
Control Quotient (RCQ; commission), and full scale Attention Quotient
(AQ; omission) scales were used as outcome measures. The IVA was
administered at baseline, mid- and post-assessments.
Data AnalysisBased on previous findings indicating different response or learning rates
to NF (Kropotov et al., 2005; Lubar et al., 1995; Monastra et al., 2002;
Strehl et al., 2006), participants were first classified into learners and non-
learners based on information from the active NF intervention. To do
this, the Engagement Index (EI: beta/theta1 alpha) at FZ from the first
three sessions were averaged and compared to the average of the last three
sessions. Participants with EI baseline-to-post increases (improved engage-
ment) greater than one-half standard deviation from the average baseline
EI were classified as learners and all others were classified as nonlearners
(Norman, Sloan, & Wyrwich, 2003).
All outcome measures were converted to change scores (post-training
minus pre-training) for analysis. Then the magnitudes of the effects of
138 Roger J. deBeus and David A. Kaiser

active NF to placebo were compared with two-tailed t-tests. Effect sizes
(ES), Cohen’s d, were calculated using change scores divided by the base-
line pooled SD of that measure. Pearson product moment correlations
were calculated to examine possible mechanisms of change regarding rela-
tionships between the primary outcome measure (CTRS-R ADHDtotal)
and EI change scores. All statistical analyses were conducted using the
Statistica analysis program (Version 9.1, StatSoft, 2010), and analyses were
considered significant if p ,0.05.
RESULTS
Sample CharacteristicsA total of 92 children were recruited. Fifty-six were randomized into the
study and three children (5%) did not complete the first 20 sessions. Forty-
seven (84% of 56) children completed the NF intervention and 45 (80%)
completed the placebo condition. However, only 42 children completed
both conditions. Rate of dropout was not significant between the two con-
ditions (χ2-test: p5 0.52). Participation attrition rates were 5% from
baseline to mid-assessment, 20% from mid- to post-assessment, and 25%
from baseline to completion. Missing data resulted from school or teacher
changes, lack of compliance, or compromise of the blinded administration
of sessions. These occurred at random and did not differ significantly
between the two groups (χ2-test: p5 0.48). Final analyses were based on
the 42 children who completed the entire study that was conducted from
2002 to 2004. See Table 5.1 for study sample characteristics.
NF Learners vs. PlaceboAs described above, NF learners (NF-L) were identified by examining the
active NF pre- and post-EEG session data for improved levels of engage-
ment using the Engagement Index (EI: beta/theta1 alpha). EI improvement
was operationalized as an increase of one-half SD from pre- to post-active
NF sessions. Children who did not meet this criterion were considered NF
non-learners (NF-NL). Out of the 42 children completing the study,
31 (74%) were able to increase the EI ratio by one-half SD after 20 sessions
[t(45)5 5.94, p ,0.001. CI(95%): 0.57, 0.28, ES5 1.63].
The baseline parent and teacher ratings of the NF-L versus the NF-
NL comparison indicated that the parents rated children more severely
symptomatic overall than the teachers; and the NF-L group started with
139Neurofeedback with Children with Attention Deficit Hyperactivity Disorder

lower scores than the NF-NL group (see Figure 5.2). Further analyses of
the NF-L indicated a significant correlation for the active NF condition
between the CTRS-R ADHDtotal and EI change scores (r25 0.498,
p5 0.01) whereas the placebo condition did not show this effect
(r25 0.02, n.s.). See Figures 5.3 and 5.4 for correlation results of placebo
and active NF conditions.
CTRS-RSignificant treatment effects were noted for ADHDtotal (primary outcome
measure) indicating NF-L were superior to placebo t(50)5 22.97,
p ,0.005, CI(95%): 28.6, 21.7, ES5 0.50. Significant treatment effects
were also noted on the ADHDin and ADHDhyp sub-scales. See Table 5.2
for change score results.
Table 5.1 Sample characteristics
Males (%) 13 (31%)
Females (%) 29 (69%)
Age M (SD)
Males 8.93 (1.36)
Females 8.67 (1.44)
Ethnicity
Caucasian 38
African American 3
Hispanic 1
DSM-IV ADHD diagnoses
Inattentive type 18 (43%)
Combined type 24 (57%)
Co-occurring diagnoses
Oppositional defiant 17 (40%)
Dysthymia 7 (17%)
Anxiety spectrum 14 (33%)
Medication status
Yes: Male/Female 18/6
No: Male/Female 11/7
IQ/Achievement (M, (SD))
VIQ 107.6 (17.11)
PIQ 107.3 (17.01)
FSIQ 108.4 (16.75)
Reading (Std. Score) 106.1 (14.29)
Math (Std. Score) 101.1 (19.34)
Spelling (Std. Score) 102.3 (14.31)
140 Roger J. deBeus and David A. Kaiser

CPRS-RFor parents’ ratings, no treatment effects were found on any of the three
CPRS-R scales. Post-hoc analyses indicated all CPRS-R measures showed
improvement at the mid-assessment over the post-assessment point regardless
of treatment [e.g., ADHD total: t(62)5 23.71, p ,0.001, CI(95%): 29.4,
22.8, ES5 0.49].
IVAFor the RCQ, there were significant treatment effects favoring NF-L
over placebo [t(59)5 3.09, p5 0.003, CI(95%): 5.0, 23.2, ES5 0.63).
For the AQ there were significant treatment effects for NF-L over placebo
(t(59)5 3.25, p5 0.002, CI(95%): 5.3, 22.2, ES5 0.60].
DISCUSSION
In the present study we analyzed the effects of neurofeedback (NF) train-
ing compared to an identically administered placebo condition. We also
NF-LNF-NL
P-ADHDinP-ADHDhyp
P-ADHDtotalT-ADHDin
T-ADHDhypT-ADHDtotal
40
45
50
55
60
65
70
75
80T-
scor
esp = .05p = .07p = .11
p = .04p = .06 p = .06
Figure 5.2 Baseline CPRS-R and CTRS-R ADHD scales of neurofeedback learners (NF-L)compared to neurofeedback nonlearners (NF-NL). Note: P is for parent ratings and T forteacher ratings on the Conners’ DSM-IV ADHD rating scales (mean5 50, SD5 10):ADHDin5 Inattentive, ADHDhyp5Hyperactive/Impulsive, ADHDtotal5 Total score.
141Neurofeedback with Children with Attention Deficit Hyperactivity Disorder

Placebo: Correlation: r = –0.02, n.s.
–20 –10 0 10 20
CTRS-R ADHDtotal change scores
–1.2
–0.8
–0.4
0.0
0.4
0.8
1.2E
I (be
ta/th
eta
+ al
pha)
cha
nge
scor
es
Figure 5.3 Correlations of CTRS-R ADHD Total and EI change scores for NF learners(NF-L) from the placebo condition. Note: EI (Engagement Index) is expressed as aratio of beta/theta+alpha averaged from first and last three sessions and convertedto change scores (post minus pre training). Improvements from baseline to endpointsare noted with positive scores. Teacher’s Conners’ rating scales (CTRS-R) DSM-IVADHD Total (ADHDtotal) scale are expressed in T-score changes. Negative numbersindicate improvement from baseline to endpoints.
NF-L: Correlation: r = –0.498, p = 0.01
–20 –10 0 10 20CTRS-R ADHDtotal change scores
–1.2
–0.8
–0.4
0.0
0.4
0.8
1.2
EI (
beta
/thet
a +
alph
a) c
hang
e sc
ores
Figure 5.4 Correlations of CTRS-R ADHD Total and EI change scores for NF learners(NF-L) from the active NF condition. See Note to Figure 5.3 for explanations.
142 Roger J. deBeus and David A. Kaiser

Table 5.2 NF learners’ (NF-L) comparisons of active NF vs. placebo conditions (N5 31). Teachers and parents behavior T-score changesand IVA quotient changes (mean values and SD)Measures NF-L Placebo Difference (95%CI) T-test (p) ES
Baseline Change Baseline Change
CTRS-R Total score 57.9 (10.7) 23.68 (6.9) 60.0 (9.3) 1.47 (5.5) 25.15 (28.6,21.7) 0.005 0.50
Inattentive 57.7 (9.9) 22.82 (5.1) 59.3 (9.0) 1.53 (6.6) 24.35 (27.7,20.9) 0.01 0.41
Hyperactive�Impulsive 56.7 (12.7) 23.96 (9.0) 59.4 (12.3) 0.60 (5.0) 24.6 (28.5,20.6) 0.02 0.37
CTRS-R Total score 68.3 (10.7) 23.93 (7.7) 70.9 (13.0) 22.36 (6.5) 21.56 (25.1, 1.9) 0.37
Inattentive 65.7 (11.0) 22.24 (8.3) 67.8 (12.9) 21.97 (7.2) 20.27 (24.1, 3.6) 0.89
Hyperactive�Impulsive 68.4 (14.5) 25.28 (9.0) 71.1 (13.5) 22.64 (7.0) 22.6 (26.6, 1.3) 0.19
Response control 86.2 (21.7) 12.81 (20.4) 91.6 (19.8) 21.29 (15.2) 14.10 (5.0, 23.2) 0.003 0.63
Attention 85.3 (25.2) 10.12 (17.4) 86.8 (20.9) 23.60 (15.4) 13.72 (5.3, 22.1) 0.002 0.60
Note: Change scores are post-training minus baseline. Improvements are indicated with negative changes for teacher and parent ratings and positive changes forIVA quotients. ES5Effect size. ES was only reported for significant findings.
143Neurofeedback
with
Children
with
Attention
Deficit
Hyperactivity
Disorder

identified NF learners (NF-L) from session EEG data and compared the
active and placebo conditions. The primary hypothesis proposed signifi-
cant positive treatment effects for teacher and parent rating scales and IVA
quotients for successful NF-L. The results provided support for the
teacher ratings and IVA quotients, but not for the parent ratings.
Neurofeedback Learners vs. NonlearnersBecause there were distinct differences in results between those who
responded to NF training and those who did not, only those whose
showed response were included in our analysis. That is, participants had
to increase their EI (Engagement Index: beta/theta1 alpha [12�20 Hz/
4�12 Hz]) by one-half standard deviation after 20 training sessions to be
included in our analysis. This is considered a modest requirement given
that participants received 10 hours of operant conditioning that rewarded
this exact measure (EI ratio). Participants whose EI did not change in
response to EEG operant conditioning were judged non-compliant or
“non-learners” (NF-NL) and excluded from analysis. One would not
expect symptom change in individuals who could (or would) not make
brain-behavior change in spite of many hours of training. Of 42 partici-
pants who completed the study, 31 (74%) changed their brainwave activity
sufficiently to meet our criteria for NF-L. NF-L success was further sup-
ported by an identifiable mechanism of change correlating the primary
outcome (CTRS-R, ADHDtotal) with EI changes.
Other researchers have reported using various EEG outcome measures
to identify NF learners with successful treatment outcomes. For example,
Kropotov and colleagues (2005) reported 72.5% good performers identi-
fied as those having increased beta 25% from baseline within session in
60% of 15�22 sessions. Monastra, Monastra, and George (2002) reported
100% participant improvement where the criterion for learner was nor-
malization (within one SD of normal) of the theta/beta ratio in three
consecutive sessions (average sessions5 43, range5 34�50). In studies of
slow cortical potential (SCP) NF, transfer of learning of negativation
(increasing cortical activation) without feedback has been used to separate
good from bad performers. Doehnert et al. (2008) reported 50% good
performers while Dreschler et al. (2007) reported 47% with both groups
completing 30 sessions.
That a quarter of participants were unable to improve their EI signifi-
cantly may indicate either that there are one or more ADHD subtypes
144 Roger J. deBeus and David A. Kaiser

intrinsically resistant to EEG rhythm changes, or require different operant
conditioning techniques or tools to achieve such brain function changes.
Although we used “broad” reward/inhibit NF training, we did not cus-
tomize training based on baseline EEG parameters as done by Monastra
et al. (2002). Rather, our study consisted of a broad range of EEG sub-
types, some of which may be amenable to more specific training protocols
and/or more sessions. Future research should address identification of
EEG signature(s) specific to those resistant to EI training and/or other
protocols. A comparison of our NF-L and NF-NL groups indicated that
successful learners presented with lower (more normal) rating scale scores
by both parents and teachers, significantly for the ADHD Total scores.
Although we would expect the more severe cases to have more room for
improvement, our results suggest and we hypothesize that the more severe
cases would benefit from more sessions while the moderate cases
improved with less sessions. Our operant conditioning involved using
Sony PlayStation games which on the surface seem likely to be very
engaging for children. However, some of our participants appeared to be
more worried about “winning the game” itself leading them to ignore
the feedback versus using the feedback to win the game (i.e., the more
focused they were, the faster the race car would go, resulting in a win).
This type of situation is where a therapist or technician could intervene
and redirect the child with metacognitive strategies (Thompson &
Thompson, 1998). Although we kept redirections to a minimum in an
effort to reduce confounding variables, appropriate engagement or moti-
vation levels of participants is an important factor in the success of NF
especially with ADHD children.
Parent, Teacher, and Children OutcomesAs expected, individuals’ ability to change their brainwave activity (“lear-
ners”) improved significantly in behavioral ratings by teachers and in their
own attention test scores compared to placebo. However, there was little
or no change in parental ratings. This unexpected finding of parents’
ratings is inconsistent with most ADHD NF studies that did not use a
placebo design.
Parental ratings improved regardless of whether a child was a learner or
a placebo participant, suggesting an expectancy bias that teachers did not
have. This may have been due in part to the energy put forth in helping
their children complete three major assessments and 40 sessions, regardless
145Neurofeedback with Children with Attention Deficit Hyperactivity Disorder

of the type of session (to which they were blind). Such perceived improve-
ment is not unusual in non-NF studies. For example, parental placebo
response has also been documented in ADHD crossover studies using
methylphenidate when completing Conners’ scales (Grizenko et al., 2004).
Expectancy bias posits that the key factor involved in the placebo effect is
cognitive; that is, what the patient (parent in this case) thinks or expects to
happen as a result of treatment (Kirsch, 1985, 1997). Unfortunately, our
study was not designed to measure the various aspects of the placebo
response or expectancy bias noted in parents’ ratings.
Some NF researchers have found no effects of parents’ attitudes towards
treatment, motivation of children, and identifying treatment assignment
when comparing NF (SCP and theta/beta) to computerized attention skills
groups (Gevensleben et al., 2009a). Leins et al. (2007) found a difference
with parents’ attitudes favoring SCP over a theta/beta group, possibly due
to SCP treatment providers being more qualified than the theta/beta provi-
ders. However, since teachers reported similar behavioral improvements in
both treatment groups and were not biased, Leins et al. stated “the efficacy
of treatment protocols is equivalent and that expectancies of parents have
no significant impact on the effects of neurofeedback” (p. 87). Dreschler
et al. (2007) examined parental support (compliance with study homework
assignments) and found no mediating factors related to good versus bad
performance groups. However, Monastra et al. (2002) reported that a sys-
tematic parenting style was a mediating factor with behavioral improve-
ments at home on or off medication.
Compared to previous studies we seem to have captured a different
type of parental expectancy which can be attributed to a placebo condi-
tion that impacted the results in multiple ways. First, when the placebo-
first group later completed the active NF sessions as their second phase of
the study, there was little room for parent ratings to show improvement.
Second, when the NF-first group completed the placebo condition as
their second phase of the study, scores had a tendency to return to near
baseline levels. This pattern was also noted in the teachers’ ratings and
IVA quotients. These findings suggests that treatment lengths may need to
be longer than the 20 sessions used in the study in order for treatment
effects to maintain stability. Finally, because parents’ expectancies may
overestimate the actual response to NF, we suggest future studies use
ancillary teacher behavior rating scales to supplement outcomes, and/or
use objective measures such as EEG changes and continuous performance
tests to confirm outcomes.
146 Roger J. deBeus and David A. Kaiser
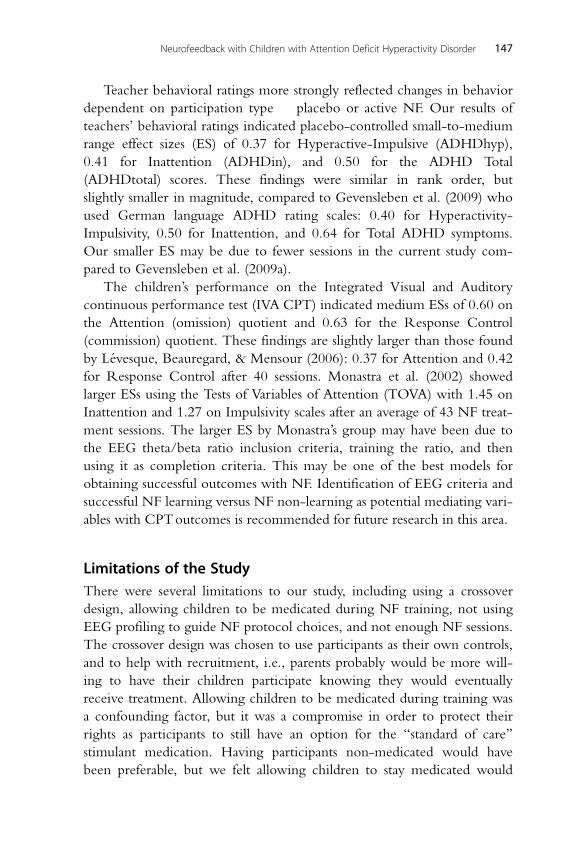
Teacher behavioral ratings more strongly reflected changes in behavior
dependent on participation type � placebo or active NF. Our results of
teachers’ behavioral ratings indicated placebo-controlled small-to-medium
range effect sizes (ES) of 0.37 for Hyperactive-Impulsive (ADHDhyp),
0.41 for Inattention (ADHDin), and 0.50 for the ADHD Total
(ADHDtotal) scores. These findings were similar in rank order, but
slightly smaller in magnitude, compared to Gevensleben et al. (2009) who
used German language ADHD rating scales: 0.40 for Hyperactivity-
Impulsivity, 0.50 for Inattention, and 0.64 for Total ADHD symptoms.
Our smaller ES may be due to fewer sessions in the current study com-
pared to Gevensleben et al. (2009a).
The children’s performance on the Integrated Visual and Auditory
continuous performance test (IVA CPT) indicated medium ESs of 0.60 on
the Attention (omission) quotient and 0.63 for the Response Control
(commission) quotient. These findings are slightly larger than those found
by Levesque, Beauregard, & Mensour (2006): 0.37 for Attention and 0.42
for Response Control after 40 sessions. Monastra et al. (2002) showed
larger ESs using the Tests of Variables of Attention (TOVA) with 1.45 on
Inattention and 1.27 on Impulsivity scales after an average of 43 NF treat-
ment sessions. The larger ES by Monastra’s group may have been due to
the EEG theta/beta ratio inclusion criteria, training the ratio, and then
using it as completion criteria. This may be one of the best models for
obtaining successful outcomes with NF. Identification of EEG criteria and
successful NF learning versus NF non-learning as potential mediating vari-
ables with CPToutcomes is recommended for future research in this area.
Limitations of the StudyThere were several limitations to our study, including using a crossover
design, allowing children to be medicated during NF training, not using
EEG profiling to guide NF protocol choices, and not enough NF sessions.
The crossover design was chosen to use participants as their own controls,
and to help with recruitment, i.e., parents probably would be more will-
ing to have their children participate knowing they would eventually
receive treatment. Allowing children to be medicated during training was
a confounding factor, but it was a compromise in order to protect their
rights as participants to still have an option for the “standard of care”
stimulant medication. Having participants non-medicated would have
been preferable, but we felt allowing children to stay medicated would
147Neurofeedback with Children with Attention Deficit Hyperactivity Disorder

also be more amenable to parents. Our initial intent was to use EEG pro-
filing using quantitative EEG database comparisons to guide treatment
protocols. However, due to equipment restrictions and start up delays this
was not implemented. We can only speculate that this may have helped
improve outcomes. Finally, we felt that children would have benefited
from more sessions, especially the more severe cases, to help optimize the
learning potential and improve stability of outcomes.
CONCLUSIONS
Our findings are consistent with many prior studies and expand scientific
understanding of the unique effects of NF treatment. Using a placebo-
controlled design we have shown that many children diagnosed with
ADHD who learn to modulate cortical activity can profit from NF, effec-
tively improving behavioral symptoms as noted by teachers, and perform-
ing better on a continuous performance test. Children who present with
higher levels of ADHD symptoms may require more sessions in order to
benefit from NF. An unexpected finding was a parent expectancy bias
exhibited in the placebo condition which made it appear there were no
significant changes in behavioral improvements from the NF. We hope
these findings will help in planning future studies of NF, especially in
regard to the need to consider the variables of success (or lack thereof) in
learning of control of brain electrical activity, parental expectations, and
use of multiple outcome measure of success.
ACKNOWLEDGMENTS
This research was supported by grants from the Virginia Commonwealth
Health Research Board in Richmond, Virginia, and Riverside Healthcare
Foundation in Newport News, Virginia. The authors would like to thank
Edwin Joseph and Alan Pope for their endless encouragement and support,
and all the technicians who worked long hours delivering sessions and assess-
ments. Finally, a special thanks for the schools and teachers who worked
with us, and for the parents and children who participated in the study.
REFERENCESArnold, L. E. (2004). Contemporary diagnosis and management of ADHD (3rd ed.).
Newtown, PA: Handbooks in Health Care Co.
148 Roger J. deBeus and David A. Kaiser

Arns, M., de Ridder, S., Strehl, U., Breteler, M., & Coenen, A. (2009). Efficacy of neuro-feedback treatment in ADHD: The effects on inattention, impulsivity and hyperactiv-ity: A meta-analysis. Clinical Electroencephalography and Neuroscience, 40(3), 180�189.
Bakhshayesh, A. R. (2007). Die wirksamkeit von neurofeedback im vergleich zum EMGbiofeedback bei der behandlung von ADHS-Kindern. PhD thesis, Universitat Potsdam,Germany.
Barry, R. J., Clarke, A. R., Johnstone, S. J., McCarthy, R., & Selikowitz, M. (2009).Electroencephalogram theta/beta ratio and arousal in attention-deficit/hyperactivitydisorder: Evidence of independent processes. Biological Psychiatry, 66, 398�401.
Carmody, D. P., Radvanski, D. C., Wadhwani, S., Sabo, M. J., & Vergara, L. (2001). EEGbiofeedback training and attention-deficit/hyperactivity disorder in an elementaryschool setting. Journal of Neurotherapy, 43(3), 5�27.
Chabot, R. J., & Serfontein, G. (1996). Quantitative electroencephalographic profiles ofchildren with attention deficit disorder. Biological Psychiatry, 40, 951�963.
Cherkasova, M. V., & Hechtman, L. (2009). Neuroimaging in attention-deficit hyper-activity disorder: Beyond the frontostriatal circuitry. Canadian Journal of Psychiatry, 54,651�664.
Clarke, A. R., Barry, R. J., McCarthy, R., & Selikowitz, M. (2001). EEG-defined sub-types of children with attention-deficit/hyperactivity disorder. Clinical Neurophysiology,112(11), 2098�2105.
Conners, C. K. (2002a). Conners’ Parent Rating Scale-Revised (CPRS-R) Toronto, ON:Multi-Health Systems Inc.
Conners, C. K. (2002b). Conners’ Teacher Rating Scale-Revised (CTRS-R) Toronto, ON:Multi-Health Systems Inc.
Doehnert, M., Brandeis, D., Straub, M., Steinhausen, H., & Drechsler, R. (2008). Slowcortical potential neurofeedback in attention deficit hyperactivity disorder: Is thereneurophysiological evidence for specific effects? Journal of Neural Transmission, 115(10),1445�1456.
Drechsler, R., Straub, M., Doehnert, M., Heinrich, H., Steinhausen, H., & Brandeis, D.(2007). Controlled evaluation of a neurofeedback training of slow cortical potentialsin children with ADHD. Behavioral and Brain Functions, 3, 35.
DuPaul, G. J., & Stoner, G. (2003). ADHD in schools: Assessment and intervention strategies(2nd ed.). New York: Guilford Press.
Faraone, S. V., Biederman, J., Morley, C. P., & Spencer, T. J. (2008). Effect of stimulantson height and weight: A review of the literature. Journal of the American Academy ofChildren and Adolescent Psychiatry, 47, 994�1009.
Fuchs, T., Birbaumer, N., Lutzenberger, W., Gruzelier, J. H., & Kaiser, J. (2003).Neurofeedback treatment for attention-deficit/hyperactivity disorder in children:A comparison with methylphenidate. Applied Psychophysiology and Biofeedback, 28(1),1�12.
Galland, B. C., Tripp, E. G., & Taylor, B. J. (2009). The sleep of children with attentiondeficit hyperactivity disorder on and off methylphenidate: A matched case-controlstudy. Journal of Sleep Research, doi: 10.1111/j.1365-2869.2009.00795.x.
Gani, C., Birbaumer, N., & Strehl, U. (2008). Long term effects after feedback of slowcortical potentials and of theta-beta-amplitudes in children with attention-deficit/hyperactivity disorder (ADHD). International Journal of Bioelectromagnetism, 10(4),209�232.
Gevensleben, H., Holl, B., Albrecht, B., Schlamp, D., Kratz, O., Studer, P., et al. (2009a).Distinct EEG effects related to neurofeedback training in children with ADHD:A randomized controlled trial. International Journal of Psychophysiology, 74, 149�157.
Gevensleben, H., Holl, B., Albrecht, B., Vogel, C., Schlamp, D., Kratz, O., et al. (2009b).Is neurofeedback an efficacious treatment for ADHD? A randomised controlled
149Neurofeedback with Children with Attention Deficit Hyperactivity Disorder

clinical trial. Journal of Child Psychology and Psychiatry, doi:10.1111/j.1469-7610.2008.02033.x.
Grizenko, N., Lachance, M., Collard, V., Lageix, P., Baron, C., Amor, L. B., et al. (2004).Sensitivity of tests to assess improvement in ADHD symptomatology. Canadian Childand Adolescent Psychiatry Review, 13(2), 36�40.
Heinrich, H., Gevensleben, H., Freisleder, F. J., Moll, G. H., & Rothenberger, A. (2004).Training of slow cortical potentials in attention-deficit/hyperactivity disorder:Evidence for positive behavioral and neurophysiological effects. Biological Psychiatry,55, 772�775.
Heywood, C., & Beale, I. (2003). EEG biofeedback vs. placebo treatment for attention-deficit/hyperactivity disorder: A pilot study. Journal of Attention Disorders, 7(1), 43�55.
Holtmann, M., Grassmann, D., Cionek-Szpak, E., Hager, V., Panzer, N., Beyer, A.,et al. (2009). Spezifische wirksamkeit von neurofeedback auf die impulsivitat beiADHS � Literaturuberblick und ergebnisse einer prospective, kontrollierten studie.Kindheit und Entwicklung, 18, 95�104.
Holtmann, M., & Stadler, C. (2006). Electroencephalograhic biofeedback for the treat-ment of attention-deficit hyperactivity disorder in childhood and adolescence. ExpertReview of Neurotherapeutics, 6(4), 533�540.
Jensen, P. S., Arnold, L. E., Swanson, J. M., Vitiello, B., Abikoff, H. B., Greenhill, L. L.,et al. (2007). 3-year follow-up of the NIMH MTA study. Journal of the AmericanAcademy of Child and Adolescent Psychiatry, 46, 989�1002.
Kaiser, D. A., & Othmer, S. (2000). Effects of neurofeedback on variables of attention in alarge multi-center trial. Journal of Neurotherapy, 4(1), 5�15.
Kirsch, I. (1985). Response expectancy as a determinant of experience and behavior.American Psychologist, 40, 1189�1202.
Kirsch, I. (1997). Specifying nonspecifics: Psychological mechanisms of placebo effects.In A. Harrington (Ed.), The placebo effect. An interdisciplinary exploration. Cambridge,MA: Harvard University Press.
Klein-Schwartz, W. (2002). Abuse and toxicity of methylphenidate. Current Opinion inPediatrics, 14, 219�223.
Kropotov, J. D., Grin-Yatsenko, V. A., Pomarev, V. A., Chutko, L. S., Yakovenko, E. A., &Nikishena, I. S. (2005). ERPs correlates of EEG relative beta training in ADHDchildren. International Journal of Psychophysiology, 55, 23�34.
Leins, U., Goth, G., Hinterberger, T., Klinger, C., Rumpf, N., & Strehl, U. (2007).Neurofeedback for children with ADHD: A comparison of SCP and theta/beta pro-tocols. Applied Psychophysiology and Biofeedback, 32, 73�88.
Levesque, J., Beauregard, M., & Mensour, B. (2006). Effect of neurofeedback training onthe neural substrates of selective attention in children with attention-deficit/hyperac-tivity disorder: A functional magnetic resonance imaging study. Neuroscience Letters,394, 216�221.
Linden, M., Habib, T., & Radojevic, V. (1996). A controlled study of the effects of EEGbiofeedback on cognition and behavior of children with attention deficit disorder andlearning disabilities. Biofeedback & Self-Regulation, 21(1), 35�49.
Lubar, J. F. (1991). Discourse on the development of EEG diagnostics and biofeedbackfor attention-deficit/hyperactivity disorders. Biofeedback & Self-Regulation, 16,201�225.
Lubar, J. F. (1997). Neocortical dynamics: Implications for understanding the role ofneurofeedback and related techniques for the enhancement of attention. AppliedPsychophysiology and Biofeedback, 22, 111�126.
Lubar, J. F., & Bahler, W. W. (1976). Behavioral management of epileptic seizures follow-ing EEG biofeedback training of the sensorimotor rhythm. Biofeedback & Self-Regulation, 1, 77�104.
150 Roger J. deBeus and David A. Kaiser

Lubar, J. O., & Lubar, J. F. (1984). Electroencephalographic biofeedback of SMR and betafor treatment of attention deficit disorders in a clinical setting. Biofeedback & SelfRegulation, 9(1), 1�23.
Lubar, J. F., & Shouse, M. N. (1976). EEG and behavioural changes in a hyperkineticchild concurrent with training of the sensorimotor rhythm (SMR): A preliminaryreport. Biofeedback & Self-Regulation, 3, 293�306.
Lubar, J. F., Swartwood, M. O., Swartwood, J. N., & O’Donnell, P. H. (1995). Evaluationof the effectiveness of EEG neurofeedback training for ADHD in a clinical setting asmeasured by changes in T.O.V.A. scores, behavioural ratings, and WISC-R perfor-mance. Biofeedback and Self Regulation, 20, 83�99.
Margraf, J., Ehlers, A., Roth, W. T., Clark, D. B., Sheikh, J., Agras, W. S., et al. (1991).How “blind” are double-blind studies? Journal of Consultant and Clinical Psychology, 59,184�187.
McCarthy, S., Cranswick, N., Potts, L., Taylor, E., & Wong, I. C. (2009). Mortality asso-ciated with attention-deficit hyperactivity disorder (ADHD) drug treatment: A retro-spective cohort study of children, adolescents and young adults using the generalpractice research database. Drug Safety, 32, 1089�1096.
Monastra, V. J. (2005). Electroencephalographic biofeedback (neurotherapy) as a treatmentfor attention deficit hyperactivity disorder: Rationale and empirical foundation. Childand Adolescent Psychiatric Clinics of North America, 14, 55�82.
Monastra, V. J., Monastra, D. M., & George, S. (2002). The effects of stimulant therapy,EEG biofeedback and parenting style on the primary symptoms of attention deficit/hyperactivity disorder. Applied Psychophysiology and Biofeedback, 27(4), 231�249.
Nash, J. K. (2000). Treatment of attention deficit hyperactivity disorder with neurother-apy. Clinical Electroencephalography, 31(1), 30�37.
Norman, G. R., Sloan, J. A., & Wyrwich, K. W. (2003). Interpretation of changes inhealth-related quality of life: The remarkable universality of half a standard deviation.Medical Care, 41, 582�592.
Palsson, O. S., Pope, A. T., Ball, J. D., Turner, M. J., Nevin, S., & deBeus, R. (2001,March). Neurofeedback videogame ADHD technology: Results of the first conceptstudy. Presented at annual meeting of Association for Applied Psychophysiology &Biofeedback, Research Triangle Park, NC.
Pappadopulos, E., Jensen, P. S., Chait, A. R., Arnold, L. E., Swanson, J. M., Greenhill, L.L., et al. (2009). Medication adherence in the MTA: Saliva methylphenidate samplesversus parent report and mediating effect of concomitant behavioral treatment. Journalof the American Academy of Child and Adolescent Psychiatry, 48(5), 501�510.
Pelham, W. E., Jr., & Fabiano, G. A. (2008). Evidence-based psychosocial treatments forattention-deficit/hyperactivity disorder. Journal of Clinical Child and AdolescentPsychology, 37, 184�214.
Reeves, G., & Anthony, B. (2009). Multimodal treatments versus pharmacotherapy alonein children with psychiatric disorders: Implications of access, effectiveness, and con-textual treatment. Paediatric Drugs, 11, 165�169.
Reich, W., Leacock, N., & Shanfeld, K. (1997). DICA-IV Diagnostic interview for childrenand adolescents-IV [Computer software] Toronto, Ontario: Multi-Health Systems, Inc.
Rossiter, T. R., & LaVaque, T. J. (1995). A comparison of EEG biofeedback and psychos-timulants in treating attention deficit/hyperactivity disorders. Journal of Neurotherapy, 1,48�59.
Rossiter, T. R. (2004). The effectiveness of neurofeedback and stimulant drugs in treatingAD/HD: Part II. Replication. Applied Psychophysiology and Biofeedback, 29(4), 233�243.
Satterfield, J. H., Schell, A. M., Backs, R. W., & Hidaka, K. C. (1984). A cross-sectionaland longitudinal study of age effects of electrophysiological measures in hyperactiveand normal children. Biological Psychiatry, 19, 973�990.
151Neurofeedback with Children with Attention Deficit Hyperactivity Disorder

Sgrok, M., Roberts, W., Grossman, S., & Barozzine, T. (2000). School board survey ofattention deficit/hyperactivity disorder: Prevalence of diagnosis and stimulant medica-tion therapy. Pediatric Child Health, 5, 12�23.
Sterman, M. B. (1996). Physiological origins and functional correlates of EEG rhythmicactivities: Implications for self-regulation. Biofeedback & Self-Regulation, 21, 3�33.
Strehl, U., Leins, U., Goth, G., Klinger, C., Hinterberger, T., & Birbaumer, N. (2006).Self-regulation of slow cortical potentials: A new treatment for children with atten-tion-deficit/hyperactivity disorder. Pediatrics, 118, 1530�1540.
Sonuga-Barke, E. J., Coghill, D., Wigal, T., DeBacker, M., & Swanson, J. (2009). Adversereactions to methylphenidate treatment for attention-deficit/hyperactivity disorder:Structure and associations with clinical characteristics and symptom control. Journal ofChild and Adolescent Psychopharmacology, 19, 683�690.
Swanson, J. M., Kraemer, H. C., Hinshaw, S. P., Arnold, L. E., Conners, C. K., Abikoff,H. B., et al. (2001). Clinical relevance of the primary findings of the MTA: Successrates based on severity of ADHD and ODD symptoms at the end of treatment. Journalof the American Academy of Child & Adolescent Psychiatry, 40, 168�179.
Thompson, L., & Thompson, M. (1998). Neurofeedback combined with training inmetacognitive strategies: Effectiveness in students with ADD. Applied Psychophysiologyand Biofeedback, 23(4), 243�263.
Turner, A. & Sandford, J. A. (1995). A normative study of IVA: Integrated visual and auditorycontinuous performance test. Presented at the Annual Convention of the AmericanPsychological Association, New York, USA.
Wechsler, D. (1999). Wechsler Abbreviated Scale of Intelligence San Antonio, TX: ThePsychological Corporation.
152 Roger J. deBeus and David A. Kaiser

CHAPTER66Emerging Empirical EvidenceSupporting Connectivity-GuidedNeurofeedback for AutisticDisordersRobert Coben and Lori A. WagnerNeurorehabilitation and Neuropsychological Services, Massapequa Park, New York, USA
Contents
Introduction 153Major Treatments for ASD: An Overview 155
Applied Behavior Analysis 156Pharmacological Treatments 158Diet and Diet-Related Treatments 161Vitamin Supplements and Enzymes 162Chelation 165Hyperbaric Oxygen Therapy (HBOT) 167
Neurofeedback for ASD 168qEEG Evaluation and ASD 170
Neurofeedback: Case Studies, Case Series, Group Pilot Studies 171Controlled Group Studies of Neurofeedback for ASD 172Efficacy of Connectivity-Guided Neurofeedback for ASD 174
Discussion 175References 176
INTRODUCTION
Autistic spectrum disorders (ASD) are a heterogeneous group of pervasive
developmental disorders including Autistic Disorder, Rett Disorder,
Childhood Disintegrative Disorder, Pervasive Developmental Disorder-Not
Otherwise Specified (PDD-NOS), and Asperger Disorder. Children with
ASD demonstrate impairment in social interaction, verbal and nonverbal
communication, and behaviors or interests (DSM-IV-TR: APA, 2000).
153Neurofeedback and Neuromodulation Techniques and ApplicationsDOI: 10.1016/B978-0-12-382235-2.00006-8
© 2011 Elsevier Inc.All rights reserved.

ASD may be comorbid with sensory integration difficulties, mental
retardation or seizure disorders. Children with ASD may have severe
sensitivity to sounds, textures, tastes, and smells. Cognitive deficits are
often associated with impaired communication skills (National Institute of
Mental Health; NIMH, 2006). Repetitive stereotyped behaviors,
perseveration, and obsessionality, common in ASD, are associated with
executive deficits. Executive dysfunction in inhibitory control and set
shifting have been attributed to ASD (Schmitz et al., 2006). Seizure disor-
ders may occur in one out of four children with ASD; frequently begin-
ning in early childhood or adolescence (National Institute of Mental
Health; NIMH, 2006).
Autistic Disorder includes the following triad of symptoms: (1)
impaired social interaction, failure to develop peer relationships, or lack of
initiating spontaneous activities; (2) deficits in communication, including
delay in or lack of spoken language, inability to initiate or sustain conversa-
tion with others, stereotyped repetitive use of language or idiosyncratic
language; and (3) restricted repetitive and stereotyped behavior, interests,
inflexible adherence to routines or rituals, and repetitive motor patterns
(e.g., hand or finger flapping or twisting) (DSM-IV-TR; APA, 2000).
Individuals with Asperger Disorder frequently have high levels of cogni-
tive functioning, engage in literal pedantic speech, experience difficulty
comprehending implied meaning, exhibit problems with fluid movement,
and manifest inappropriate social interactions. Pervasive Developmental
Disorder-Not Otherwise Specified (PDD-NOS) reflects deficits in language
and social skills, which do not meet the criteria of other disorders. In con-
trast, persons with Childhood Disintegrative Disorder and Rett Disorder
both have normal periods of early development followed by loss of previ-
ously acquired skills. Common features among all these conditions include
communication and social skill deficits. There is considerable variability in
terms of onset and severity of symptomatology within the Autistic Spectrum
of Disorders (Attwood, 1998; Hamilton, 2000; McCandless, 2005; Sicile-
Kira, 2004; Siegel, 1996).
Research reviewing the epidemiology of autism (Center for Disease
Control and Prevention; CDC, 2009) reported between 1 in 80 to 1 in
240 children in the United States diagnosed with the disorder. In fact,
their most recent report (CDC, 2009) suggests a prevalence of 1 in 110,
and as high as 1 in 70 boys. According to Blaxill (2004), the rates of ASD
were reported to be ,3 per 10,000 children in the 1970s and rose to
.30 per 10,000 in the 1990s. This rise in the rate of ASD constituted a
154 Robert Coben and Lori A. Wagner

ten-fold increase over a 20-year interval in the United States. With
increased prevalence comes a need to design and empirically validate
effective treatments for those impacted by autistic disorders.
Research studies utilizing electroencephalogram (EEG) and single pho-
ton emission computed tomography (SPECT) have provided evidence for a
neuropathological basis of ASD. A review of numerous EEG studies
reported the rate of abnormal EEGs in autism ranged from 10% to 83%,
while the mean incidence was 50%. Atypical EEGs often predict poor out-
comes for intelligence, speech, and educational achievement (Hughes &
John, 1999). In a more recent review of research, Rippon, Brock, Brown,
and Boucher (2007) proposed a model of reduced connectivity between
specialized local neural networks and overconnectivity within isolated neu-
ral assemblies in autism. Disordered connectivity may be associated with an
increased ratio of excitation/inhibition in key neural systems. Anomalies in
connectivity may be linked to abnormalities in information integration. In
SPECT scans of children with autism, abnormal regional cerebral blood
flow in the medial prefrontal cortex and anterior cingulate gyrus was related
to impaired communication and social interaction, while altered perfusion
in the right medial temporal lobe was associated with the obsessive desire
for sameness (Ohnishi et al., 2000). Children with autism commonly
display executive functioning deficits in planning, cognitive flexibility, and
inhibition. These executive deficits are associated with dysfunctional inte-
gration of the frontal lobes with other brain regions, and thus also impact
upon social, behavioral, and cognitive function (Hill, 2004).
Functional neuroimaging has also linked social cognition dysfunction
and language deficits in autism studies to neural substrates (Pelphrey,
Adolphs, & Morris, 2004; Welchew et al., 2005). During a sentence com-
prehension test, individuals with autism showed less functional connectivity
between Broca’s and Wernicke’s areas relative to a control group, suggesting
a lower degree of information organization, and neural synchronization dur-
ing language tasks ( Just, Cherkassy, Keller, & Minshew, 2004). A review of
neuroimaging studies has found key brain structures including the amygdala,
superior temporal sulcus region, and fusiform gyrus to function differently
in individuals with autism than in controls (McAlonan et al., 2004).
MAJOR TREATMENTS FOR ASD: AN OVERVIEW
Parents of children with ASD select many different methods of treatment,
with an average of seven different therapies being utilized (Green, Pituch,
155Connectivity-Guided Neurofeedback for Autistic Disorders

Itchon, Choi, O’Reilly, & Sigafoos, 2006). Speech therapy (70% of par-
ents) was the most commonly selected treatment, followed by psycho-
pharmacological treatment (52% of parents). Other treatments included
visual schedules (43%), sensory integration (38%), and applied behavior
analysis (36%). Special diets were implemented by 27% of parents and
43% utilized vitamin supplements. While there may be some benefit to
these treatments, many do not lead to long-lasting changes and/or have
risks associated with their implementation. The potential benefits and
risks of the major treatments for ASD are summarized below.
Applied Behavior AnalysisApplied behavior analysis (ABA), a form of behavior modification, is the
method of treatment with the most empirical support for treating ASD.
The goal of this therapy is to improve social interaction, behavior, and
communication (Bassett, Green, & Kazanjian, 2000). ABA is firmly based
on the principles of operant conditioning and measures small units of
behavior to build more complex and adaptive behaviors through rein-
forcement. Typically, imitation, attention, motivation, and compliance are
targeted early (Couper, 2004).
The first program that utilized this technique was the Young Autism
Project (YAP), which was developed in 1970 by O. Ivar Lovaas (Lovaas,
Koegel, Simmons, & Long, 1973). This intensive, highly structured behavioral
program was delivered on a one-to-one basis requiring several hours a day.
Their findings indicated that therapy delivered with 40 or more hours per
week for two or more years showed increased cognitive and academic function
(47% of the treatment group versus 2% of controls) (Lovaas, 1987). Follow-up
research of these children into late childhood and adolescence reported
improved cognitive function and education in regular classrooms (47% of the
treatment group versus 0% of controls) (McEachin, Smith, & Lovaas, 1993).
Other studies that measured outcomes of ABA treatment in autism
found less promising results than those of Lovaas (1987). Anderson, Avery,
DiPietro, Edwards, and Christian (1987) conducted home-based ABA on
14 children for between 15 and 25 hours per week. While modest gains
were made in mental ages scores and communication skills, the most
impaired children failed to make progress, and none of the children were
able to be integrated into regular classrooms following treatment.
Project TEACCH (Treatment and Education of Autistic and Related
Communication Handicapped Children), developed by Eric Schopler and
156 Robert Coben and Lori A. Wagner

colleagues (Schopler & Reichler, 1971) at the University of North
Carolina at Chapel Hill, differs from ABA, but utilizes behavioral princi-
ples to maximize the skills of children who are autistic (Herbert, Sharp, &
Gaudiano, 2002). Ozonoff and Cathcart (1998) investigated the effective-
ness of a home-based TEACCH treatment program for children with
autism. Children who received the TEACCH treatment from their par-
ents showed significant improvement over the control group on tests of
imitation, fine and gross motor, nonverbal conceptual skills, and overall
PEP-R scores. Progress was three to four times greater on all outcome
tests in the treatment group as compared to the control group.
Ben-Itzchak and Zachor (2007) investigated the effects of intellectual
functioning and severity of autistic symptoms on outcome following inten-
sive behavioral intervention. Groups were formed based on IQ scores (high
.70 vs. low ,70), level of social interaction (high vs. low), and communi-
cation deficits (high vs. low) using the Autism Diagnostic Observation
Schedule (ADOS; Lord, Rutter, DiLavore, & Risi, 1999), all of which
were assessed prior to treatment. After one year of intervention provided
one-on-one by a behavioral therapist for at least 35 hours per week, signifi-
cant improvements were noted in all domains measured by the ADOS,
which include imitation, receptive and expressive language, nonverbal com-
munication skills, play skills, and stereotyped behaviors. Children with
higher cognitive levels and those with fewer social interaction deficits were
more apt to acquire developmental skills post-treatment, particularly in the
areas of play skills and receptive and expressive language skills. Play skills
progress was more related to the child’s cognitive level while progress in
expressive language abilities was more related to social abilities.
In their clinical practice guidelines report, the New York State
Department of Health Early Intervention Program recommended that ABA
and other behavioral interventions be included in the treatment of autism.
They specify that intensive behavioral programs should include a minimum
of 20 hours of intervention with a therapist per week. Furthermore, the
guidelines state that parents should be included in the intervention, and that
they be trained in the use of behavioral techniques to provide additional
instruction at home with regular therapist consultation. Although promising,
intensive behavioral programs are costly and require extensive time on the
part of the therapist as well as the family, and debates are ongoing about who
should pay for such services (Couper, 2004).
Although behavior therapy improves social, cognitive and language
skills, a year or more of intensive training has been used in most research
157Connectivity-Guided Neurofeedback for Autistic Disorders

studies that have demonstrated improvement. Furthermore, a strong com-
mitment by parents to complete therapeutic programs is necessary to
achieve positive outcomes. While behavioral treatment methods show the
most empirical support to date, there remains a need for additional thera-
pies, which may be more easily administered and used in conjunction
with the behavioral methods described. It is important to note that,
though research has been promising, there has been great variability
between studies in their results and outcome measures have often been
questionable (e.g., IQ scores, returning to regular classrooms). And, this
approach appears to be more effective with those who are higher func-
tioning (i.e., higher IQ), meaning that lower functioning individuals are
often left out, even though they are perhaps in greatest need of treatment.
Pharmacological TreatmentsPharmacological and biomedical interventions have also been utilized to
treat individuals with ASD. A study conducted at the Yale Child Study
Center found that 55% of a group of 109 individuals with a PDD were tak-
ing psychotropic medication, with 29.3% taking more than one medication
(Martin, Scahill, Klin, & Volkmar, 1999). The most common medications
were antidepressants (32.1%), followed by stimulants (20.2%), and neurolep-
tics (16.5%). The objectives of psychopharmacological treatment for autism
include: decreasing the core symptoms of autism; decreasing anxiety and
overfocus, improving social skills, reducing aggressive self-injurious behav-
ior; increasing the effects of other interventions, and improving the quality
of life for the child and their family. There is no single medication known
to be beneficial to all children with ASD, nor that has specifically been
developed for individuals with Autistic Spectrum Disorder.
Psychostimulant medications are often used with children who are
autistic due to its success in the treatment of ADHD (Jensen et al., 2007).
Despite this, stimulant use in children who are autistic remains controversial
and largely unproven in terms of efficacy. In the Research Units on
Pediatric Psychopharmacology Methylphenidate study (RUPP, 2005b),
49% of the sample were considered positive responders, leaving a significant
percentage as non-responders; and there was an 18% side effect rate overall.
Neuroleptics such as haloperidol and thioridazine have been utilized
to reduce dysfunctional behaviors associated with ASD. The adverse side
effects of sedation, irritability, and extrapyramidal dyskinesias limit the use
of these medications, however.
158 Robert Coben and Lori A. Wagner

A newer class of neuroleptic, referred to as atypical anti-psychotics,
reportedly improves social interaction and decreases aggression, irritability,
agitation, and hyperactivity (Barnard, Young, Pearson, Geddes, & Obrien,
2002). They have fewer extrapyramidal adverse side effects than haloperi-
dol and thioridazine. However, most children experience a substantial
weight gain within the first months of treatment (Committee on Children
with Disabilities, 2001). Risperidone is the only drug that has been
approved by the FDA to treat the symptoms (irritability) of autism. A
recent meta-analysis of three randomized controlled trials found that the
drug was effective in treating the symptoms of irritability and aggression
( Jesner, Aref-Adib, & Coren, 2007). The authors concluded that although
risperidone may be beneficial, its use must be weighed against its adverse
effects, most notably weight gain, and that long-term follow-up is needed
prior to determining its efficacy in clinical practice. Risperidone’s long-
term benefits were studied by the RUPP Autism Network (RUPP, 2005a)
in a two-part study. Part one was a 4 month, open-label trial, which was
followed by an 8 week randomized, double-blind, placebo substitution
study of risperidone withdrawal in those who were considered “respon-
ders”. Participants whose medication levels were gradually reduced
showed a greater return of aggression, temper outbursts, and self-injurious
behaviors than those who continued the medication, for whom over 80%
maintained their improvements and showed “very good tolerability”.
Although not a randomized controlled trial, this provided evidence to
suggest that risperidone may be effective for time periods of up to one
year (Zuddas, Di Martino, Muglia, & Cichetti, 2000). The relapse rate for
those maintained on this medication has ranged from 12.5 to 25% (RUPP,
2005a; Troost et al., 2005). Santangelo and Tsatsanis (2005) reported that
there are currently no drugs that produce major improvement in the core
social or pragmatic language deficits in autism, although several have lim-
ited effects on the behavioral features of the disorder.
Repetitive stereotypical and perseverative behaviors have been shown to
be characteristic of both obsessive�compulsive disorder (OCD) and autism
(McDougle et al., 1995). The overlap between these disorders and the suc-
cess of selective serotonin reuptake inhibitors (SSRIs) in treating OCD
(Geller et al., 2001) has led to the use of SSRIs in treating symptoms of
autism. One of the first trials of the SSRI Prozac (fluoxetine) found that
doses ranging from 20 to 80 mg per day were effective based on Clinical
Global Impressions in 15 of 23 individuals with autism (Cook, Rowlett, &
Jaselskis, 1992). However, 6 out of the 23 experienced significant side
159Connectivity-Guided Neurofeedback for Autistic Disorders

effects such as restlessness, hyperactivity, agitation, increased appetite, and
insomnia. A more rigorous 20 week placebo-controlled crossover study
found that fluoxetine significantly reduced repetitive behaviors compared
to placebo (Hollander et al., 2005). Although there were no significant
side effects, there also were no significant improvements in measures of
speech or social interaction. DeLong, Ritch, and Burch (2002) reported a
69% positive response rate for fluoxetine in children, aged 2�8, who were
autistic. Treatment parameters were quite variable, with treatment duration
ranging from 5 to 76 months and doses ranging from 4 mg/day to
40 mg/day.
A 12 week, double-blind, placebo-controlled study of fluoxetine
reported this drug to be efficacious (McDougle et al., 1996). Eight out of 15
adult subjects were rated as “responders”, with improvements occurring for
repetitive thoughts and behaviors, maladaptive behaviors, and repetitive lan-
guage use. Side effects were noted to be mild and included sedation and
nausea. However, a more recent study by McDougle, Kresch, and Posey
(2000) with children and adolescents found only 1 of 18 responded to the
drug, with common side effects including insomnia, hyperactivity, agitation,
and aggression. Martin, Koenig, Anderson, and Scahill (2003) found similar
results in children, reporting only 3 out of 18 subjects to be responsive to
fluvoxamine.
At least four other SSRIs have been reported to have at least some
beneficial effect, although none have demonstrated efficacy through
placebo-controlled studies. Zoloft (sertraline) was found to be effective
for aggression and repetitive behavior in 42 adults with PDD, including
adults with autism, Asperger’s, and PDD-NOS, though 3 of the subjects
dropped out of the study due to either agitation or anxiety (McDougle
et al., 1998). Social relatedness did not appear to improve. The researchers
found sertraline to be more effective for those with autism and PDD-
NOS than for those with Asperger’s.
Very limited support has been reported for the SSRI Paxil (parox-
etine). Two retrospective studies of the SSRI Celexa (citalopram) have
reported improvement in some of the symptoms of autism. Couturier and
Nicolson (2002) found improvement in 10 out of 17 children in aggres-
sion, anxiety, stereotypies, and preoccupations, though not in social inter-
actions and communication. In addition, four children developed adverse
side effects such as increased agitation and insomnia causing their treat-
ment to be stopped. Namerow, Thomas, Bostic, Prince, & Monuteaux
(2003) found similar improvements in children and adolescents in
160 Robert Coben and Lori A. Wagner

repetitive behavior, mood, and anxiety. Mild side effects were reported in
one-third of their sample, two of whom discontinued treatment due to
side effects.
The fourth SSRI that has been studied to treat the symptoms of PDD
is Lexapro (escitalopram). In an open-label design of children and adoles-
cents with autism, Asperger’s, or PDD-NOS, Owley and colleagues
(2005) found significant improvement in 17 of 28 patients based on ratings
from the Aberrant Behavior Checklist Irritability subscale (Aman,
Singh, & Stewart, 1985). There was wide variability in dose response,
which could not be accounted for by weight or age. Due to the limited
research on this drug, more rigorously controlled trials are suggested.
Based on the research cited, it appears that the limited benefits of psycho-
pharmacology come at the cost of side effects and rebound of aggressive
behavior when medication is discontinued. Furthermore, these drugs appear
to be only treating certain symptoms, and typically not the core symptoms of
ASD. Many children require multiple medications to improve their symptoms,
and often the benefits do not outweigh the side effects. In addition to patients
responding to highly variable doses, the majority of studies reviewed indicate
that not all children with ASD respond to these various medications, and there
is no good explanation for why some are considered responders and some are
not. In summary, the research published thus far suggests that some medica-
tions may be helpful in managing some of the behavioral disturbances seen in
autism.
Diet and Diet-Related TreatmentsResearch has suggested that individuals with autism may not properly
metabolize the proteins in casein (dairy) and gluten (wheat and related
grains), resulting in an opioid effect on the brain as they enter the blood-
stream (Reichelt, 2001). Autism may be comorbid with metabolic anom-
alies including: (1) failure of the digestive tract to fully metabolize casein
and gluten into amino acids; and (2) “leaky gut” syndrome which allows
undigested peptides to pass into the bloodstream (Reichelt, 2001). Cade
and colleagues (1999) reported that following a gluten�casein-free diet,
children with autism experienced an 81% improvement in symptoms
within three months based on parent and physician ratings of severity on a
Likert scale. It was also noted, qualitatively, that the mothers of four of the
children in this study reported seizure frequency had significantly
decreased in three children and had ceased completely in the fourth.
161Connectivity-Guided Neurofeedback for Autistic Disorders

Knivsberg, Reichelt, Hoien, and Nodland (2002) conducted a randomized
single-blind controlled study of 10 children with autism on the gluten-
free/casein-free (GFCF) diet. At 1 year follow-up, the experimental group
had showed significantly greater improvement in autistic behavior, non-
verbal cognitive ability, and motor problems. In a 4 year longitudinal sin-
gle-blind controlled pair-wise study of children with autism, following a
GFCF diet resulted in significant improvement on outcome measures of
cognitive function, language, and social skills (Reichelt & Knivsberg,
2003). More recently, Elder, Shankar, Shuster, Theriaque, Burns, and
Sherrill (2006) conducted a rigorous double-blinded controlled trial of
the GFCF diet in autism. Fifteen (12 boys, 3 girls) children with ASD
between the ages of 2 and 16 were studied over the course of 12 weeks.
The researchers reported no significant differences between groups on
their primary measure, the Childhood Autism Rating Scale, while parents
reported improvement in their children. The researchers noted that the
children were quite heterogeneous (which may have masked any group
differences), and noted the relatively small sample size.
An obvious limitation to this type of treatment is the lack of strict
control over the diet of these children. When immunoglobulin A anti-
gliadin and antiendomysium antibodies were measured to assess compli-
ance, some studies indicated that roughly only half strictly follow dietetic
prescriptions (Paolo et al., 1998). It may be difficult for parents to know
which foods should be restricted, and some children may respond more
slowly than others, requiring greater effects to be noticed. One of the
major problems with the GFCF diet is that it may lead to reduced bone
cortical thickness (Hediger et al., 2008). Indeed, in this study boys
between the ages of 4 and 8 who were autistic showed a 18.9% deviation
in metacarpal bone cortical thickness, which was nearly twice that of boys
on minimally restricted or non-restricted diets. Furthermore, the GFCF
diet may induce nutritional imbalances by limiting the foods that may be
eaten. It has also been shown to increase the risk of becoming over-
weight/obese (Paolo et al., 1998).
Vitamin Supplements and EnzymesOne supplement that has generated a great deal of interest as a treatment
for autism is the gastrointestinal hormone secretin. After receiving intra-
venous administration of secretin for upper gastrointestinal (GI) endoscopy,
there was improvement in the gastrointestinal symptoms of three children
162 Robert Coben and Lori A. Wagner

with ASD (Horvath et al., 1998). In addition, within 5 weeks of the secre-
tin administration the children’s parents noticed behavioral improvements
as evidenced by improved eye contact, alertness, and increased expressive
language. The authors suggested that these clinical observations may indi-
cate an association between GI functioning and brain functioning in
autism. However, these behavioral observations were incidental and not an
expected outcome in the procedure. As a result, there was no control
group utilized and the non-experimental nature of the procedure precludes
drawing any firm conclusions about its use in treating autistic behaviors.
However, in October 1998, Horvath et al.’s (1998) results were reported
on national television on NBC’s Dateline, which likely sparked the
demand and sharp increase in price that followed (NIH News Alert, 1999).
Anecdotal reports followed, with some parents reporting dramatic
improvements in their children, and others reporting no change (NIH
News Alert, 1999). The National Institutes of Child Health and Human
Development (NICHD) soon funded a study to investigate the use of
secretin in the treatment of autism (Sandler et al., 1999). In the double-
blind placebo-controlled study the researchers found no difference on any
of the standardized behavioral measures utilized between the secretin and
placebo groups. Commenting on the results of this study, the director of
the NICHD, Duane Alexander stated, “These findings strongly suggest
that secretin should not be recommended to treat autism until the results of
our other ongoing studies are known” (NIH News Alert, 1999). Similarly,
the American Academy of Child and Adolescent Psychiatry released a
policy statement on the use of secretin in treating autism: “the available
evidence does not suggest that secretin is a useful treatment for children
with autism” (American Academy of Child and Adolescent Psychiatry
Policy Statement, 1999).
Roberts et al. (2001) investigated the effects of repeated doses of intra-
venous secretin on 64 children diagnosed with autism in a randomized,
placebo-controlled study. Outcome measures included assessment of cog-
nitive, social, language, and gastrointestinal function. Following treatment,
receptive and expressive language skill improvement occurred to the same
extent in the secretin and placebo groups. However, parents anecdotally
reported sleep improvement, toilet training success shortly after the injec-
tion, and more connectedness. Untoward side effects of secretin were evi-
dent for some of the children; 21% had generalized flushing in the neck,
face, or chest following injection; 6.25% experienced irritability and
hyperactivity; and 4.68% had an increase in aggression. Although no
163Connectivity-Guided Neurofeedback for Autistic Disorders

significant effects were reported for secretin, parent reports of improve-
ment suggest there is a small subgroup of autistic children with GI symp-
toms who may benefit from treatment with secretin (Roberts et al.,
2001). However, it is important to note that repeated use has not been
approved by the FDA, and there is the possibility of an allergic reaction
with multiple doses (Hirsch, 1999). Thus, extreme caution must be taken
when using secretin in this manner.
A comprehensive review of research studies utilizing secretin to treat
autism was conducted by Esch and Carr (2004). Seventeen quantitative stud-
ies were reviewed, encompassing approximately 600 children aged 2�15,
and 12 adults with ASD. Only one of the studies reviewed found a causal
relationship between secretin administration and amelioration of autistic
symptoms across various treatment variables (type of secretin, dosage
potency, frequency), observation times, and participant characteristics (e.g.,
GI status, severity of ASD, age, history of medication use). Twelve of the 13
placebo-controlled studies reviewed obtained negative results. Despite the
lack of empirical support for secretin, parents of autistic children continue to
seek out secretin treatment from their physicians (Esch & Carr, 2004). The
reviewers attempted to explain this by the media attention that secretin
received early on, coupled with the fact that parents of these children are
often desperate to find a treatment for this debilitating condition.
In addition to secretin, it has been suggested that the consumption of
omega-3 fatty acids may have a positive effect on the symptoms of autism
(Amminger et al., 2007). These highly unsaturated fatty acids are essential
for normal brain development and functioning (Wainright, 2002), and
some studies have found fatty acid deficiencies in children who are autistic
(Bell et al., 2004; Bell, Sargent, Tocher, & Dick, 2000; Vancassel et al.,
2001). Amminger and colleagues (2007) recently completed a double-
blind, randomized controlled trial of omega-3 fatty acid supplementation
in children who were autistic. They found that with administration of
1.5 g/day, the treatment group showed no significant change in hyper-
active behaviors including disobedience, distractibility, and impulsivity,
relative to the control group. Potential limitations to this study include
that it was conducted with only 12 subjects, and pre-selection of these
subjects was based on high irritability scores based on the Aberrant
Behavior Checklist (Aman et al., 1985).
Anecdotal reports that methyl-B12 (methylcobalamin) injections may
improve the symptoms of autism have been plentiful; however, there have
been very few controlled research studies to support the efficacy of this
164 Robert Coben and Lori A. Wagner

treatment. In May of 2002, Dr James Neubrander discovered (reportedly
accidentally) the effects of this coenzyme. He reported that following injec-
tions of methyl-B12 in a child with autism he had been treating, the mother
reported dramatic improvements in the child’s behavior (Neubrander,
2005). He then began using the treatment on his other patients, again,
anecdotally reporting dramatic improvements by the parents. He has
reported that in his practice, “94% of children have been found to respond
to methyl-B12 therapy”. He has reported that executive functioning
improved in 90% of children, speech and language improved in 80%
of children, and “socialization/emotion” improved in 70% of children
(Neubrander, 2005). Richard Deth (2004) reported his results on the
administration of 75 µg/kg of methyl-B12, given every three days, in 85
children, between the ages of 3 and 11, who were autistic. A “parental
questionnaire” demonstrated improvements in speech and language in 71%,
cognitive function in 52%, and socialization/emotional stability in 35% of
the children. He also reported that stopping treatment resulted in a worsen-
ing of symptoms, which reversed upon reinstatement of the injections.
The only published study found by the authors was an open trial of
methyl-B12 conducted in Japan with 13 children with autism, ranging
from 2 to 18 years of age (Nakano et al., 2005). Dosages of 25�30 g/kg/
day were administered for between 6 and 25 months. The authors found
a significant increase in the intelligence and developmental quotients, as
well as improvement on the Childhood Autism Rating Scale (Schopler,
Reichler, DeVellis, & Daly, 1980). Even after the children were allocated
into subgroups based on age and intelligence, these effects did not dimin-
ish. This was not a controlled study, however. In contrast, a preliminary
report of a double-blind crossover study presented at the American
Academy of Child and Adolescent Psychiatry conference revealed no sig-
nificant benefits in the 14 patients in their study after three months
(Deprey et al., 2006). Specifically, there were no differences between the
methyl-B12 injections and the placebo on the Clinical Global Impression
Scale Improvement, Peabody Picture Vocabulary Test, or Social
Communication Questionnaire verbal results.
ChelationA controversial theory to explain the increase in incidence of ASDs over
the past 30 years is that it is related to environmental factors such as ex-
posure to heavy metals (Bradstreet, Geier, Kartzinel, Adams, & Geier, 2003),
165Connectivity-Guided Neurofeedback for Autistic Disorders
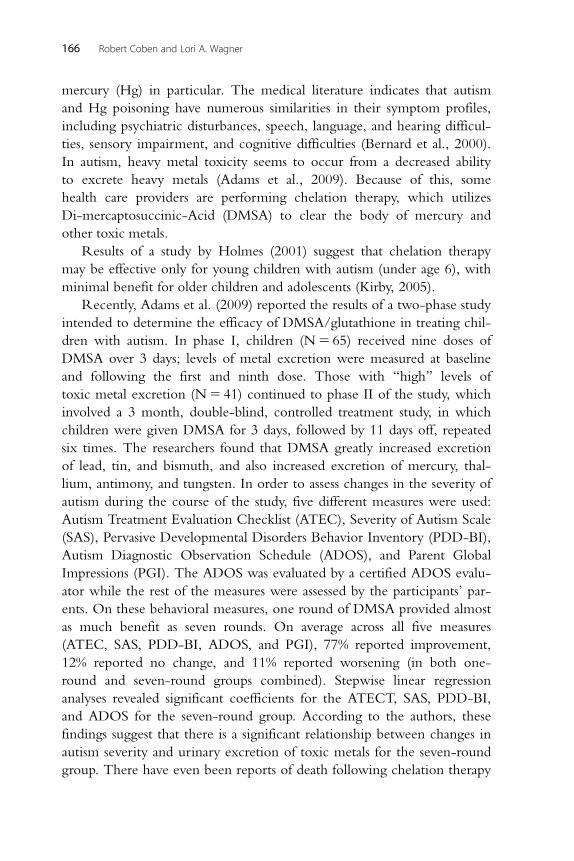
mercury (Hg) in particular. The medical literature indicates that autism
and Hg poisoning have numerous similarities in their symptom profiles,
including psychiatric disturbances, speech, language, and hearing difficul-
ties, sensory impairment, and cognitive difficulties (Bernard et al., 2000).
In autism, heavy metal toxicity seems to occur from a decreased ability
to excrete heavy metals (Adams et al., 2009). Because of this, some
health care providers are performing chelation therapy, which utilizes
Di-mercaptosuccinic-Acid (DMSA) to clear the body of mercury and
other toxic metals.
Results of a study by Holmes (2001) suggest that chelation therapy
may be effective only for young children with autism (under age 6), with
minimal benefit for older children and adolescents (Kirby, 2005).
Recently, Adams et al. (2009) reported the results of a two-phase study
intended to determine the efficacy of DMSA/glutathione in treating chil-
dren with autism. In phase I, children (N5 65) received nine doses of
DMSA over 3 days; levels of metal excretion were measured at baseline
and following the first and ninth dose. Those with “high” levels of
toxic metal excretion (N5 41) continued to phase II of the study, which
involved a 3 month, double-blind, controlled treatment study, in which
children were given DMSA for 3 days, followed by 11 days off, repeated
six times. The researchers found that DMSA greatly increased excretion
of lead, tin, and bismuth, and also increased excretion of mercury, thal-
lium, antimony, and tungsten. In order to assess changes in the severity of
autism during the course of the study, five different measures were used:
Autism Treatment Evaluation Checklist (ATEC), Severity of Autism Scale
(SAS), Pervasive Developmental Disorders Behavior Inventory (PDD-BI),
Autism Diagnostic Observation Schedule (ADOS), and Parent Global
Impressions (PGI). The ADOS was evaluated by a certified ADOS evalu-
ator while the rest of the measures were assessed by the participants’ par-
ents. On these behavioral measures, one round of DMSA provided almost
as much benefit as seven rounds. On average across all five measures
(ATEC, SAS, PDD-BI, ADOS, and PGI), 77% reported improvement,
12% reported no change, and 11% reported worsening (in both one-
round and seven-round groups combined). Stepwise linear regression
analyses revealed significant coefficients for the ATECT, SAS, PDD-BI,
and ADOS for the seven-round group. According to the authors, these
findings suggest that there is a significant relationship between changes in
autism severity and urinary excretion of toxic metals for the seven-round
group. There have even been reports of death following chelation therapy
166 Robert Coben and Lori A. Wagner

in autism (Sinha, Silove, & Williams, 2006), making it one of the more
risky forms of intervention.
Hyperbaric Oxygen Therapy (HBOT)Among other brain abnormalities that have been identified, numerous
studies using PET and SPECT have shown cerebral hypoperfusion in
autism (George, Costa, Kouris, Ring, & Ell, 1992; Mountz, Tolbert, Lill,
Katholi, & Liu, 1995; Ohnishi et al., 2000; Starkstein et al., 2000;
Zilbovicius et al., 2000), leading to the hypothesis that hyperbaric oxygen
therapy (HBOT) may be beneficial in the treatment of autism (Rossignol &
Rossignol, 2006). HBOT involves the inhalation of 100% oxygen in a
pressurized chamber, usually above one atmosphere absolute (ATA). It
has been shown that HBOT can lead to improved functioning in vari-
ous neurological populations that show cerebral hypoperfusion including
stroke (Nighoghossian, Trouillas, Adeleine, & Salord, 1995), cerebral
palsy (Montgomery et al., 1999), chronically brain injured (Golden
et al., 2002), and even a teenage male with Fetal Alcohol Syndrome
(Stoller, 2005). It has been suggested that the increased oxygen delivered
by HBOT could counteract the hypoxia caused by hypoperfusion, and
lead to a reduction in symptoms of autism.
In a retrospective case study of six children with autism who had under-
gone low-pressure HBOT at 1.3 ATA and 28�30% oxygen over the course
of 3 months, Rossignol and Rossignol (2006) found an average improve-
ment of 22.1% based on ratings from the ATEC. An average improvement
of 12.1% was reported based on the CARS, and a 22.1% improvement on
the SRS. All children in this study, however, continued all other therapies
they were previously receiving, and were also able to initiate new therapies
during the study. Furthermore, the study was retrospective, parents were
not blinded to the treatment, and there was no control group.
Rossignol, Rossignol, James, Melnyk, and Mumper (2007) treated
18 children with autism with 40 sessions of HBOT at either 1.5 atm at
100% oxygen, or at 1.3 atm and 24% oxygen. They reported a trend toward
improvement in C-reactive protein measurements (a marker of inflamma-
tion) and no significant increase in oxidative stress. Parental reports revealed
statistically significant improvements in irritability, social withdrawal, hyper-
activity, motivation, speech, and sensory/cognitive awareness. However,
parents were not blinded as to the type of therapy their children were receiv-
ing and there was no placebo or control group. These results remain
167Connectivity-Guided Neurofeedback for Autistic Disorders

preliminary and further studies are needed with more rigorous experimental
designs (blinded, placebo-controlled, randomized). This study does suggest,
however, that it is a relatively safe treatment, as no adverse events were
reported and all children were able to complete the 40 treatment sessions.
In summary, this review of the autism treatment literature reveals there
are no treatments, except possibly behavior therapy, that have been well
validated or that have exhibited favorable long term results. In addition,
many forms of intervention include the possibility of adverse effects,
require long-term use, or were not developed specifically for Autistic
Spectrum Disorders. Neurofeedback represents an alternative that may
have the potential to decrease symptomatology on a long-term basis with
little risk of harm.
NEUROFEEDBACK FOR ASD
Neurofeedback is designed to use sophisticated computer technology to
train individuals to improve poorly regulated brainwave patterns. In EEG
Biofeedback, information regarding brainwave activity is fed to a com-
puter that converts this information into game-like displays that can be
auditory, visual, or both. During a typical session, EEG electrodes (which
measure brainwaves) are placed on the scalp and ear lobe(s). Individuals
instantly receive feedback about the amplitude and/or synchronization of
their brainwaves and learn to improve their brainwave functioning. An
example of a typical set-up is displayed in Figure 6.1.
Figure 6.1 Example of neurofeedback set-up.
168 Robert Coben and Lori A. Wagner

The only way to succeed at the games involved is for children to con-
trol and improve their brainwave patterns (following an operant condi-
tioning paradigm). In research and clinical treatment for children with
ADHD, this conditioning process has resulted in improvements that have
persisted for up to 5�10 years or more (e.g., Lubar, 1995).
Individuals who participate in EEG biofeedback learn to inhibit brainwave
frequencies that may produce negative symptoms and enhance specific fre-
quencies that produce positive results. Table 6.1 displays the typical EEG
brainwave frequency bands and lists their normal occurrences and respective
significance [information adapted from resources contained in Demos (2005)
and Thompson and Thompson (2003a,b)]. Within these general frequency
bands there may also be more detailed breakdowns of EEG activity. For exam-
ple, mu rhythm abnormalities are associated with excesses in the alpha fre-
quency band and have a characteristic morphologic and topographic
distribution (Coben & Hudspeth, 2006). Subdivisions of beta power have also
been presented and related to clinical characteristics (Rangaswamy et al.,
2002).
Table 6.1 EEG frequency bandsName Frequency Normal occurrence Significance
Delta 0.5�3.5 Hz Deep sleep and infants Sign of significant brain
dysfunction, lethargy/
drowsiness or cognitive
impairment
Theta 4�7.5 Hz Young children,
drowsiness, some
aspects of learning
Slowing often related to
attention/cognitive
impairments, internal focus
Alpha 8�13 Hz Eyes closed, relaxation,
self awareness
Excessive alpha during
demand states can be a sign
of difficulties with learning,
emotional stability, relating
to the environment or
others
Beta 13�30 Hz Fast activity associated
with alertness and
activity
Excessive beta is often
associated with anxiety,
irritability and poor
integration
Gamma Greater
than
30 Hz
May be associated with
problem-solving and
memory consolidation
Unknown
Adapted from Demos (2005) and Thompson and Thompson (2003b).
169Connectivity-Guided Neurofeedback for Autistic Disorders

Individuals with poorly regulated cortical activity can learn to develop a
fluid shift in brainwaves to meet task demands utilizing neurofeedback.
Through the process of operant conditioning, this treatment modality can
result in improvement of brainwave patterns as well as behavior. These
changes in EEG patterns have been shown to be associated with regulation of
cerebral blood flow, metabolism, and neurotransmitter function (Lubar, 1997).
Neurofeedback is a non-invasive treatment with no known significant or
lasting negative side effects that has been shown to enhance neuroregulation
and metabolic function in ASD (Coben & Padolsky, 2007). Positive neuro-
feedback treatment outcomes are often achieved over the course of several
months, in contrast to behavior therapy, which often takes a year or more
of intensive training. Furthermore, the therapeutic treatment outcomes of
neurofeedback training with individuals with ADHD (increased attention,
reduced impulsivity and hyperactivity) have been reported to be maintained
over time and not reverse after treatment is withdrawn, as in drug therapy
and diet therapy (Linden, Habib, & Radojevic, 1996; Lubar, Swartwood,
Swartwood, & O’Donnell, 1995; Monastra et al., 2005; Tansey, 1993).
Over 30 years of research on using neurofeedback to treat ADHD has
consistently shown that it leads to improvements in attention, impulsivity,
hyperactivity, and IQ (see Monastra et al., 2005, for a review and analysis).
This success was the foundation for the emergence of using neurofeed-
back with ASD.
qEEG EVALUATION AND ASD
Quantitative electroencephalographic (qEEG) evaluation or mapping is an
assessment procedure designed to pinpoint anomalies in brain function
(Hammond, 2005). qEEG analyses measure abnormalities, instabilities, or
lack of proper communications pathways (connectivity) necessary for opti-
mal brain functioning. qEEG Maps, collected using 19 electrodes based on
the International 10�20 system ( Jasper, 1958), reflect quantitative analyses
of EEG characteristics of frequency, amplitude and coherence during vari-
ous conditions or tasks. These data can be statistically compared to an age-
matched normative database to reveal a profile of abnormalities. Such
regions and aspects of dysfunctional neurophysiology may then be targeted
specifically through individualized neurofeedback protocols.
qEEG analyses are conducted to assess underlying neurophysiological
patterns related to the symptoms and challenges of children with ASD. In
addition, assessment of the raw EEG can be used to evaluate neurological
170 Robert Coben and Lori A. Wagner

abnormalities such as seizure disorders, which are common in children
with autism. qEEG data are important for developing the most individual-
ized, specific, and successful neurofeedback protocols for patients with
ASD (Coben & Padolsky, 2007; Linden, 2004).
Linden (2004) identified four qEEG patterns of autism and two of
Asperger’s based on 19-channel EEG recordings and analysis of raw EEG,
absolute power, relative power, and multivariate connectivity. The four
autism qEEG subtype patterns are: (1) High Beta activity, which corresponds
to obsessing, overfocusing, and anxiety; (2) High Delta/Theta activity, which
corresponds to cortical slowing and inattention, impulsivity, and hyperactiv-
ity; (3) Abnormal EEG/Seizure activity; and (4) Metabolic/Toxic pattern of
lower overall EEG activity (voltage). The High Beta subtype was the most
common subtype, occurring in approximately 50�60% of the subjects with
ASD. The Delta/Theta subtype occurred in 30�40%, the Abnormal EEG
subtype in 33% and the Metabolic/Toxic subtype in 10%. In addition,
coherence abnormalities were usually present in the qEEG profiles.
The qEEG patterns of subjects with Asperger’s primarily occurred in the
right temporal and parietal regions, sites involved in social and emotional
recognition mechanisms. The qEEG patterns of those with Asperger’s were:
(1) high theta/alpha slowing in the right temporal/parietal areas and (2) low
coherence between right temporal/parietal brain regions and other regions.
More than one qEEG subtype pattern was frequently present in the students
with ASD.
Coben, Hirshberg, and Chabot (2010) identified five relative power sub-
types in individuals with autism. However, they noted that many types of
dysfunction overlap in people with autism and most reveal a combination of
findings. In over 83% of the individuals with autism, connectivity anomalies
could be identified when compared to the normative group. Coben and
Myers (2008) used qEEG multivariate connectivity data to develop a typol-
ogy of autism connectivity patterns including: (1) patterns of hyperconnec-
tivity across bilateral frontotemporal regions and between left hemisphere
locations, and (2) hypoconnectivity involving orbitofrontal, frontal to poster-
ior, right posterior or left hemisphere sites. A pattern of hypoconnectivity
that underlies a mu rhythm complex was identified as well.
Neurofeedback: Case Studies, Case Series, Group Pilot StudiesThere have been numerous case and group pilot studies conducted with
clients diagnosed with autistic spectrum disorders. In general, these studies
171Connectivity-Guided Neurofeedback for Autistic Disorders

have shown that neurofeedback improved symptomatology and these
improvements were maintained at follow-up. For a more thorough review
of these, see Coben, Linden, and Myers (2009).
Controlled Group Studies of Neurofeedback for ASDIn 2007, Coben and Padolsky published a study investigating the effects of
neurofeedback treatment for autistic disorders. The study included 49
children on the autistic spectrum, with 37 participants receiving qEEG
connectivity-guided neurofeedback and 12 participants in a wait-list con-
trol group. Treatment included 20 sessions performed twice per week.
The control group was matched for age, gender, race, handedness, other
treatments, and severity of ASD. According to the parents, there was an
89% success rate for neurofeedback and an average of 40% reduction in
core ASD symptomatology. There were significant improvements on
neuropsychological measures of attention, visual-perceptual skills, lan-
guage functions, and executive functioning. Importantly, reduced cerebral
hyperconnectivity was associated with positive clinical outcomes and in all
cases of reported improvement, positive outcomes were supported by
neurophysiological and neuropsychological assessment.
Mu rhythm abnormalities are a sign of mirror neuron dysfunction,
which is thought to be impaired in many children with autism (Oberman
et al., 2005). In two studies focused on reducing abnormal mu rhythms in
children with autism, Pineda et al. (2008) found that, according to parents,
participants showed a small but significant reduction in symptoms but
increased ratings of sensory-cognitive awareness. In another study related to
mu rhythms, Coben and Hudspeth (2006) studied 14 children with ASD
who were identified as having significantly high levels of mu activity and a
failure to suppress mu during observational activity. They all received assess-
ment guided neurofeedback, with a strong focus on aspects of mu power
and connectivity. The participants were non-randomly assigned to an inter-
hemispheric bipolar training (N5 7) or a coherence training (N5 7) group
designed to increase connectivity between central regions and the periph-
eral frontal cortex. All patients were given neurobehavioral, neuropsycho-
logical testing, and qEEG assessment. Both groups of patients improved
significantly on neurobehavioral and neuropsychological measures.
However, only in the coherence training treatment group was mu activity
significantly reduced. Increased coherence was associated with diminished
mu and improved levels of social functioning.
172 Robert Coben and Lori A. Wagner

Lastly, Coben (2007) conducted a controlled neurofeedback study
focused on intervention for prominent social skill deficits based on a
facial/emotional processing model. Fifty individuals with autism were
included in these analyses and all had previously had some neurofeedback
training. All patients underwent pre- and post-neuropsychological, qEEG,
and parent rating scale assessments. Twenty-five individuals were assigned
to either an active neurofeedback or a wait list control group, in a ran-
domized fashion. The two groups were matched for age, gender, race,
handedness, medication usage, autistic symptom severity, social skill rat-
ings, and visual-perceptual impairment levels. Neurofeedback training was
qEEG connectivity-guided and included coherence training (along with
amplitude inhibits) between maximal sights of hypocoherence over the
right posterior hemisphere. The group that received the coherence train-
ing showed significant changes in symptoms of autism, social skills, and
visual-perceptual abilities such that all improved. Regression analyses
showed that changes in visual-perceptual abilities significantly predicted
improvements in social skills. EEG analyses were also significant, showing
improvements in connectivity and source localization of theta power
related to brain regions (fusiform gyrus, superior temporal sulcus) associ-
ated with enhanced visual/facial/emotional processing.
In the five controlled group studies that have been completed, a total
of 180 individuals with autism have been studied and positive results
reported in each study. These findings have included positive changes as
evidenced by parental report, neuropsychological findings, and changes in
the EEG (Coben, 2007). Both Coben and Padolsky (2007) and Yucha
and Montgomery (2008) have viewed these data as demonstrating a level
of efficacy of “possibly efficacious” based on the standards put forth by
the Association for Applied Psychophysiology and Biofeedback (AAPB,
2006). Added to these initial findings of efficacy is preliminary evidence
that the effects of neurofeedback on the symptoms of autism are long-
lasting (1�2 years) (Coben, 2009; Kouijzer, DeMoor, Gerrits, Buitelaar, &
van Schie, 2009). While these findings are initially encouraging, there are
many limitations that prevent firm conclusions to be drawn from the data
collected thus far.
First, these studies have largely included non-randomized samples. It is
possible that an unknown selection bias exists which could have impacted
the findings. Second, none of these studies have included participants or
therapists/experimenters who were blind to the condition. Knowledge of
group placement could have impacted the findings such that those in
173Connectivity-Guided Neurofeedback for Autistic Disorders

treatment (and their parents) would be prone to report significant
changes. Third, there has been no attempt to control for placebo effects,
attention from a caring professional or expectations of treatment benefit.
A randomized, double-blinded, placebo-controlled study is clearly needed
to further demonstrate efficacy.
In terms of generalization of these findings to the larger population of
individuals who are autistic, very young children and adults have not been
well represented in these group studies. Lastly, there is the question of
whether neurofeedback may be applicable to persons who are lower func-
tioning or who have more severe symptoms associated with autism. These
populations also should be the focus of future investigations.
Efficacy of Connectivity-Guided Neurofeedback for ASDCoben (2009) has presented a study of the effects of an entire course of
connectivity-guided neurofeedback treatment on autistic children. This
included 110 subjects on the autistic spectrum, with 85 in the experimen-
tal and 25 in the control (wait list) group. The mean age of these subjects
was 9.7 years (range5 4�20). Seventy-seven percent of these subjects
were not on medication at the time, while 14% were on one medication,
7% on two medications, and 1% on three medications. The mean IQ of
this group was 93 (range5 50�130). The mean ATEC score was 50
(range5 40�170). There were no significant differences between the
experimental and control groups for age, gender, handedness, race, medi-
cations, IQ, or ATEC scores.
The experimental group underwent an average of 74 neurofeedback ses-
sions. They were assessed using qEEG, neuropsychological testing, and par-
ent rating scales before treatment and then again after treatment. In order to
evaluate the efficacy of neurofeedback treatment for reducing ASD symp-
tomatology, the subjects’ scores on the ATEC and neuropsychological testing
were compared before and after treatment. A univariate analysis of variance
(ANOVA) revealed that ATEC scores changed significantly after treatment
(F5 117.213; p5 7.3570e-018; see Figure 6.2). Furthermore, 98.8% of par-
ents reported a reduction in ASD symptoms on the ATEC after treatment
On objective neuropsychological testing, 100% of subjects demonstrated
some degree of improvement. An ANOVA revealed improvements on tests
of visual-perceptual skills (F5 53.6, p5 1.6074e-010), language abilities
(F5 31.24, p5 1.2653e-006), attentional skills (F5 54.04, p5 7.1610e-011),
and executive functioning (F5 15.65, p5 0.00015). In fact, visual-perceptual
174 Robert Coben and Lori A. Wagner

skills improved 43%, language abilities improved 47%, attentional skills improved
56%, and executive functioning improved 48%.
Once it was determined that the therapy was efficacious, the next
question investigated was whether it had greater efficacy depending on
level of functioning or severity of autistic symptoms. We investigated the
effects of pre-treatment ATEC and IQ scores on treatment outcome by
dividing the groups into quartiles based on ATEC and IQ scores and
re-analyzing the data. There were no significant differences for any of
these analyses. This revealed that: (1) ASD symptomatology improved
with treatment regardless of IQ and (2) severity of ASD symptoms did
not affect treatment outcomes. These results suggest that neurofeedback is
an effective treatment regardless of the child’s intellectual ability or sever-
ity of symptoms, at least within the parameters of the subjects that were
included in this study.
DISCUSSION
There are few interventions with proven efficacy for children with autism.
Behavioral modification interventions currently have the most empirical
support, while pharmacologic interventions, hyperbaric oxygen, and vita-
min supplementation have shown some potential. It is our opinion that
neurofeedback is in a similar position with respect to efficacy for ASD,
but more research is needed.
Neurofeedback is an intervention that may prove to be efficacious in
the treatment of symptoms of autism. At present, it should be viewed as
0
10
20
30
40
50
60
ATEC total
pre-exp
post-exp
pre-control
post-control
57%
Figure 6.2 Pre-and post-treatment ATEC scores.
175Connectivity-Guided Neurofeedback for Autistic Disorders

possibly efficacious with potential, as is the case with most interventions
used with this population. Measuring brain-related changes that may occur
as a result of neurofeedback is one way of demonstrating its efficacy and
mechanism of action. Additional well-designed, more rigorous studies, and
longer follow-up periods should be included in the future to measure the
efficacy of neurofeedback in treating children on the autistic spectrum.
REFERENCESAAPB (Association for Applied Psychophysiology & Biofeedback). (2006). Efficacy: How
we rate the efficacy of our treatments or how to know if our treatments actuallywork. Retrieved February 22, 2006 from ,www.aapb.org/i4a/pages/index.cfm?pageid53336..
Adams, J. B., Baral, M., Geis, E., Mitchell, J., Ingram, J., Hensley, A., et al. (2009). Safetyand efficacy of oral DMSA therapy for children with autism spectrum disorders: PartA � Medical results. BMC Clinical Pharmacology, 9, 16.
Aman, M. G., Singh, N. N., & Stewart, A. W. (1985). The Aberrant Behavior Checklist:A behavior rating scale for the assessment of treatment effects. American Journal ofMental Deficiency, 5, 485�491.
American Academy of Child & Adolescent Psychiatry. (1999, March 3). Secretin in thetreatment of autism. [Policy statement]. Retrieved March 19, 2010 from: www.aacap.org/cs/root/policy_statements/secretin_in_the_treatment_of_autism.
American Psychiatric Association. (2000). Diagnostic and statistical manual of mental disorders,fourth edition-text revision (DSR-IV-TR) Washington, DC: Author.
Amminger, G. P., Berger, G. E., Schafer, M. R., Klier, C., Friedrich, M. H., & Feucht, M.(2007). Omega-3 fatty acids supplementation in children with autism: A double-blindrandomized, placebo-controlled study. Biological Psychiatry, 61, 551�553.
Anderson, S. R., Avery, D. L., DiPietro, E. K., Edwards, G. L., & Christian, W. P. (1987).Intensive home-based early intervention with autistic children. Education and Treatmentof Children, 10, 352�366.
Attwood, T. (1998). Asperger’s syndrome: A guide for parents and professionals. London: JessicaKingsley.
Barnard, A. L., Young, A. H., Pearson, A. D. J., Geddes, J., & Obrien, G. (2002). A system-atic review of the use of atypical antipsychotics in autism. Journal of Psychopharmacology,16, 93�102.
Bassett, K., Green, C. J., & Kazanjian, A. (2000). Autism and Lovaas treatment: A systematicreview of effectiveness evidence. British Columbia Office of Health Technology Assessment,The University of British Columbia, Vancouver, BC.
Bell, J. G., MacKinlay, E. E., Dick, J. R., MacDonald, D. J., Boyle, R. M., & Glen, A. C.(2004). Essential fatty acids and phospholipase A2 in autistic spectrum disorders.Prostoglandins, Leukotrienes, and Essential Fatty Acids, 71, 201�204.
Bell, J. G., Sargent, J. R., Tocher, D. R., & Dick, J. R. (2000). Red blood cell fatty acidcompositions in a patient with autistic spectrum disorder: A characteristic abnormalityin neurodevelopmental disorders? Prostaglandins, Leukorienes, and Essential Fatty Acids,63(1-2), 21�25.
Ben-Itzchak, E., & Zachor, D. A. (2007). The effects of intellectual functioning andautism severity on outcome of early intervention for children with autism. Research inDevelopmental Disabilities, 28, 287�303.
176 Robert Coben and Lori A. Wagner

Bernard, S., Enayati, A., Binstock, T., Roger, H., Redwood, L., & McGinnis, W. (2000).Autism: A unique type of mercury poisoning ARC Research. Available from the AutismResearch Institute.
Blaxill, M. F. (2004). What’s going on? The question of time trends in autism. PublicHealth Reports, 119, 536�551.
Bradstreet, J., Geier, B. A., Kartzinel, J. J., Adams, J. B., & Geier, M. R. (2003). A case-control study of mercury burden in children with autistic spectrum disorders. Journalof American Physicians and Surgeons, 8(3), 76�79.
Cade, R., Privette, M., Fregley, M., Rowland, N., Sun, Z., Zele, V., et al. (1999). Autismand schizophrenia: Intestinal disorders. Nutritional Neuroscience, 3, 57�72.
Center for Disease Control and Prevention (2009). Prevalence of the Autism SpectrumDisorders � Autism and Developmental Disabilities Monitoring Network, UnitedStates, 2006. Morbidity and Mortality Weekly Report, 58 (SS10; 1-20).
Coben, R. (2007, September). Autistic spectrum disorder: A controlled study of EEGcoherence training targeting social skill deficits. Presented at the 15th annual confer-ence of the International Society for Neurofeedback and Research, San Diego, CA.
Coben, R. (2009). Efficacy of connectivity-guided neurofeedback for Autistic SpectrumDisorder: Controlled analysis of 75 cases with a 1 to 2 year follow-up. Journal ofNeurotherapy, 13(1), 81.
Coben, R., Hirshberg, L.M., & Chabot, R. (2010). EEG discriminant power and subtypesin Autistic Spectrum Disorder. (submitted for publication).
Coben, R., & Hudspeth, W. (2006, September). Mu-like rhythms in Autistic SpectrumDisorder: EEG analyses and neurofeedback. Presented at the 14th annual conferenceof the International Society for Neuronal Regulation, Atlanta, GA.
Coben, R., Linden, M., & Myers, T. E. (2009). Neurofeedback for Autistic SpectrumDisorder: A review of the literature. Applied Psychophysiology and Biofeedback, 35(1),83�105.
Coben, R., & Myers, T. E. (2008). Connectivity theory of Autism: Use of connectivitymeasures in assessing and treating Autistic Disorders. Journal of Neurotherapy, 12(2-3),161�179.
Coben, R., & Padolsky, I. (2007). Assessment guided neurofeedback for autistic spectrumdisorder. Journal of Neurotherapy, 11(3), 5�18.
Committee on Children with Disabilities. (2001). Technical report: The pediatrician’s rolein the diagnosis and management of autistic spectrum disorder in children. Pediatrics,107(5), 1�35.
Cook, E. H., Rowlett, R., & Jaselskis, C. (1992). Fluoxetine treatment of children andadults with autistic disorder and mental retardation. Journal of the American Academy ofChild and Adolescent Psychiatry, 31, 739�745.
Couper, J. (2004). Who should pay for intensive behavioural intervention in autism? Aparent’s view. Journal of Paediatrics and Child Health, 40(9-10), 559�561.
Couturier, J. L., & Nicolson, R. (2002). A retrospective assessment of citalopram in chil-dren and adolescents with pervasive developmental disorders. Journal of Child andAdolescent Psychopharmacology, 12, 243�248.
DeLong, G. R., Ritch, C. R., & Burch, S. (2002). Fluoxetine response in children withautistic spectrum disorders: Correlation with familial major affective disorder andintellectual achievement. Developmental Medicine and Child Neurology, 44, 652�659.
Demos, J. N. (2005). Getting started with neurofeedback. New York: W. W. Norton &Company.
Deth, R.C. (2004, October) Methylcobalamin for Autistic Children. Presented at the34th annual meeting of the Society for Neuroscience, San Diego, CA.
Deprey, L.J., Brule, N., Widjaja, F., Sepheri, S., Blank, J., Neubrander, J., et al. (2006,October). Double-blind placebo-controlled, cross-over trial of subcutaneous
177Connectivity-Guided Neurofeedback for Autistic Disorders

methylcobalamin in children with Autism: Preliminary results. Poster presented at theannual meeting of the American Academy of Child and Adolescent Psychiatry, SanDiego, CA.
Elder, J. H, Shankar, M., Shuster, J., Theriaque, D., Burns, S., & Sherrill, L. (2006). Thegluten-free, casein-free diet in autism: Results of a preliminary double blind clinicaltrial. Journal of Autism and Developmental Disorders, 36, 413�420.
Esch, B. E., & Carr, J. E. (2004). Secretin as a treatment for Autism: A review of the evi-dence. Journal of Autism and Developmental Disorders, 34, 543�556.
Geller, D. A., Hoog, S. L., Heiligenstein, J. H., Ricardi, R. K., Tamura, R., Kluszynski, S.,et al. (2001). Fluoxetine treatment for obsessive compulsive disorder in children andadolescents: A placebo controlled clinical trial. Journal of the American Academy of Childand Adolescent Psychiatry, 40, 739�773.
George, M. S., Costa, D. C., Kouris, K., Ring, H. A., & Ell, P. J. (1992). Cerebral bloodflow abnormalities in adults with infantile autism. Journal of Nervous and Mental Disease,180, 413�417.
Golden, Z. L., Neubauer, R., Golden, C. J., Greene, L., Marsh, J., & Mleko, A. (2002).Improvement in cerebral metabolism in chronic brain injury after hyperbaric oxygentherapy. International Journal of Neuroscience, 112, 119�131.
Green, V. A., Pituch, K. A., Itchon, J., Choi, A., O’Reilly, M., & Sigafoos, J. (2006).Internet survey of treatments used by parents of children with autism. Research inDevelopmental Disabilities, 27, 70�84.
Hamilton, L. (2000). Facing autism: Giving parents reasons for hope and guidance for helpColorado Springs, CO: WaterBrook Press.
Hammond, D. C. (2005). What is neurofeedback? Retrieved July 25, 2006 from ,www.isnr.org/pubarea/whatisnfb.pdf..
Hediger, M. L., England, L. J., Molloy, C. A., Yu, K. F., Manning-Courtney, P., & Mills, J. L.(2008). Reduced bone cortical thickness in boys with autism or autism spectrum disor-der. Journal of Autism and Developmental Disorders, 38, 848�856.
Herbert, J. D., Sharp, I. R., & Gaudiano, B. A. (2002). Separating fact from fiction in theetiology and treatment of autism. A scientific review of the evidence. The ScientificReview of Mental Health Practice, 1(1). Accessed online at: http://www.srmhp.org/0101/autism.html
Hill, E. L. (2004). Executive dysfunction in autism. Trends in Cognitive Sciences, 8(1),26�32.
Hollander, E., Phillips, A., Chaplin, W., Zagursky, K., Novotny, S., Wasserman, S., et al.(2005). A placebo controlled crossover trial of liquid fluoxetine on repetitive behaviorsin childhood and adolescent autism. Neuropsychopharmacology, 30, 582�589.
Holmes, A. (2001). Autism treatments: Chelation of mercury. Retrieved March 30, 2010,from http://www.healing-arts.org/children/holmes.htm.
Horvath, K., Stefanatos, G., Sokolski, K. N., Wachtel, R., Nabors, L., & Tildon, J. T.(1998). Improved social and language skills after secretin administration in patients withautistic spectrum disorders. Journal of the Association for Academic Minority Physicians, 9,9�15.
Hughes, J. R., & John, E. R. (1999). Conventional and quantitative electroencephalogra-phy in psychiatry. Journal of Neuropsychiatry and Clinical Neurosciences, 11, 190�208.
Hirsch, D. (1999). Secretin in the treatment of autism. The Exceptional Parent, 29, 94.Jasper, H. (1958). The ten-twenty electrode system of the International Federation.
Electroencephalography and Clinical Neurophysiology, 10, 371�375.Jensen, P. S., Arnold, L. E., Swarson, J. M., Vitiello, B., Abikoff, H. B., Greenhill, L. L.,
et al. (2007). 3-Year follow-up of the NIMH MTA study. Journal of the AmericanAcademy of Child and Adolescent Psychiatry, 46(8), 989�1002.
178 Robert Coben and Lori A. Wagner

Jesner, O.S., Aref-Adib, M., & Coren, E. (2007). Risperidone for autism spectrum disor-der. Cochrane Database of Systematic Reviews, 1(CD005040). Retrieved July 18,2008, from Cochrane Database of Systematic Reviews database.
Just, M. A., Cherkassy, V. L., Keller, T. A., & Minshew, N. J. (2004). Cortical activationand synchronization during sentence comprehension in high-functioning autism:Evidence of underconnectivity. Brain, 127, 1811�1821.
Kirby, D. (2005). Evidence of harm: Mercury in vaccines and the autism epidemic: A medical con-troversy New York: St Martin’s Press.
Knivsberg, A. M., Reichelt, K. L., Hoien, T., & Nodland, M. (2002). A randomized,controlled study of dietary intervention in autistic syndromes. Nutritional Neuroscience,5, 251�261.
Kouijzer, M. E. J., de Moor, J. M. H., Gerrits, B. J. L., Buitelaar, J. K., & van Schie, H. T.(2009). Long-term effects of neurofeedback treatment in autism. Research in AutismSpectrum Disorders, 3(2), 496�501.
Linden, M. (2004, August). Case studies of qEEG mapping and neurofeedback with autism.Presented at the 12th annual conference of the International Society for NeuronalRegulation, Fort Lauderdale, FL.
Linden, M., Habib, T., & Radojevic, V. (1996). A controlled study of the effects of EEGbiofeedback on cognition and behavior of children with attention deficit disorder andlearning disabilities. Biofeedback and Self-Regulation, 21, 35�50.
Lord, C., Rutter, M., DiLavore, P. C., & Risi, S. (1999). Autism diagnostic observation sched-ule-WPS (ADOS-WPS). Los Angeles, CA: Western Psychological Services.
Lovaas, O. I. (1987). Behavioral treatment and normal educational and intellectual func-tioning in young autistic children. Journal of Consulting and Clinical Psychology, 55, 3�9.
Lovaas, O. I., Koegel, R., Simmons, J. Q., & Long, J. S. (1973). Some generalization andfollow-up measures on autistic children in behavior therapy. Journal of Applied BehaviorAnalysis, 6(1), 131�165.
Lubar, J. F. (1995). Neurofeedback for the management of attention-deficit/hyperactivity dis-orders. In M. S. Schwartz (Ed.), Biofeedback: A practitioner’s guide (3rd ed., pp. 493�522).New York: Guilford.
Lubar, J. F. (1997). Neurobiological foundation for neurofeedback treatment of attentiondeficit hyperactivity disorder (ADD/HD). Biofeedback, 25(10), 4�23.
Lubar, J. F., Swartwood, M. O., Swartwood, J. N., & O’Donnell, P. H. (1995). Evaluationof the effectiveness of EEG training for ADHD in a clinical setting as measured byTOVA scores, behavioral ratings, and WISC-R performance. Biofeedback and Self-Regulation, 20, 83�99.
Martin, A., Koenig, K., Anderson, G., & Scahill, L. (2003). Low dose fluvoxamine treat-ment of children and adolescents with pervasive developmental disorders: A prospec-tive, open-label study. Journal of Autism and Developmental Disorders, 33(1), 77�85.
Martin, A., Scahill, L., Klin, A., & Volkmar, F. R. (1999). Higher functioning pervasivedevelopmental disorders: Rates and patterns of psychotropic drug use. Journal of theAmerican Academy of Child and Adolescent Psychiatry, 38, 923�931.
McAlonan, G. M., Cheung, V., Cheung, C., Suckling, J., Lam, G. Y., Tai, K. S., et al.(2004). Mapping the brain in autism: A voxel-based MRI study of volumetric differ-ences and intercorrelations in autism. Brain, 128(Pt 2), 268�276.
McCandless, J. (2005). Children with starving brains: A medical treatment guide for autism spec-trum disorder. Putney, VT: Bramble Books.
McDougle, C. J., Brodkin, E. S., Naylor, S. T., Carlson, D. C., Cohen, D. J., & Price, L. H.(1998). Sertraline in adults with pervasive developmental disorders: A prospective,open-label investigation. Journal of Clinical Psychopharmacology, 18, 62�66.
McDougle, C. J., Kresch, L. E., Goodman, W. K., Naylor, S. T., Volkmar, F. R., Cohen,D. J., et al. (1995). A case-controlled study of repetitive thoughts and behavior in
179Connectivity-Guided Neurofeedback for Autistic Disorders

adults with autistic disorder and obsessive�compulsive disorder. American Journal ofPsychiatry, 152, 772�777.
McDougle, C. J., Kresch, L. E., & Posey, D. J. (2000). Repetitive thoughts and behaviorin pervasive developmental disorders: Treatment with serotonin reuptake inhibitors.Journal of Autism and Developmental Disorders, 30, 427�435.
McDougle, C. J., Naylor, S. T., Cohen, D. J., Volkmar, F. R., Heninger, G. R., & Price,L. H. (1996). A double-blind, placebo controlled study of fluvoxamine in adults withautistic disorder. Archives of General Psychiatry, 53, 1001�1008.
McEachin, J. J., Smith, T., & Lovaas, O. I. (1993). Long-term outcome for children withautism who received early intensive behavioral treatment. American Journal of MentalRetardation, 97, 359�372.
Monastra, V. J., Lynn, S., Linden, M., Lubar, J. F., Gruzelier, J., & LaVaque, T. J. (2005).Electroencephalographic biofeedback in the treatment of attention-deficit/hyperactiv-ity disorder. Applied Psychophysiology and Biofeedback, 30, 95�114.
Montgomery, D., Goldberg, J., Amar, M., Lacroix, V., Lecomte, J., Venasse, M., et al.(1999). Effects of hyperbaric oxygen therapy on children with spastic diplegic cerebralpalsy: A pilot project. Undersea and Hyperbaric Medicine, 26, 235�242.
Mountz, J. M., Tolbert, L. C., Lill, D. W., Katholi, C. R., & Liu, H. G. (1995).Functional deficits in autistic disorder: Characterization by technetium-99m-HMPAOand SPECT. Journal of Nuclear Medicine, 36, 1156�1162.
Nakano, K., Noda, N., Tachikawa, E., Urano, M., Takazawa, M., Nakayama, T., et al.(2005). A preliminary study of methylcobalamin therapy in autism. Journal of TokyoWomen’s Medical University, 75(3/4), 64�69.
Namerow, L. B., Thomas, P., Bostic, J. Q., Prince, J., & Monuteaux, M. C. (2003). Useof citalopram in pervasive developmental disorders. Journal of Developmental andBehavioral Pediatrics, 24(2), 104�108.
National Institute of Child Health and Human Development. (1999, December 8).[National Institutes of Health News Alert]. Study shows secretin fails to benefit chil-dren with autism. Retrieved March 8, 2010, from www.nichd.nih.gov/news/releases/secretin.cfm.
National Institute of Mental Health (2006). Autism Spectrum Disorders (Pervasive DevelopmentalDisorders). Retrieved February 12, 2010, from www.nimh.nih.gov/health/publications/autism/complete-index.shtml.
Neubrander, J.A. (2005, May). Methyl-B12: Making it work for you! Presented at theAutism One Conference, Chicago, IL.
Nighoghossian, N., Trouillas, P., Adeleine, P., & Salord, F. (1995). Hyperbaric oxygen inthe treatment of acute ischemic stroke. Stroke, 26, 1369�1372.
Oberman, L. M., Hubbard, E. M., McCleery, J. P., Altschuler, E. L., Ramachandran, V. S.,& Pineda, J. A. (2005). EEG evidence for mirror neuron dysfunction in autism spec-trum disorders. Cognitive Brain Research, 24, 190�198.
Ohnishi, T., Matsuda, H., Hashimoto, T., Kunihiro, T., Nishikawa, M., Uema, T., &Sasaki, M. (2000). Abnormal regional cerebral blood flow in childhood autism. Brain,123, 1838�1844.
Ozonoff, S., & Cathcart, K. (1998). Effectiveness of a home program intervention foryoung children with autism. Journal of Autism & Developmental Disorders, 28, 25�32.
Owley, T., Walton, L., Salt, J., Guter, S. J., Winnega, M., Leventhal, B. L., et al. (2005).An open-label trial of escitalopram in pervasive developmental disorders. Journal of theAmerican Academy of Child and Adolescent Psychiatry, 44, 343�348.
Paolo, M., Viti, M. G., Montouri, M., LaVecchia, A., Cipolletta, E., Calvani, L., et al.(1998). The gluten-free diet: A nutritional risk factor for adolescents with celiac dis-ease? Journal of Pediatric Gastroenterology and Nutrition, 27, 519�523.
180 Robert Coben and Lori A. Wagner

Pelphrey, K., Adolphs, R., & Morris, J. P. (2004). Neuroanatomical substrates of socialcognition dysfunction in autism. Mental Retardation and Developmental DisabilitiesResearch Reviews, 10, 259�271.
Pineda, J. A., Brang, D., Hecht, E., Edwards, L., Carey, S., Bacon, M., et al. (2008).Positive behavioral and electrophysiological changes following neurofeedback trainingin children with autism. Research in Autism Spectrum Disorders, 2(3), 557�581.
Ramachandran, V. S., & Pineda, J. A. (2005). EEG evidence for mirror neuron dysfunc-tion in autism spectrum disorders. Cognitive Brain Research, 24, 190�198.
Rangaswamy, M., Porjesz, B., Chorlian, D. B., Wang, K., Jones, K. A., Bauer, L. O.,et al. (2002). Beta power in the EEG of alcoholics. Biological Psychiatry, 52,831�842.
Reichelt, K. (2001, October). Opioid peptides. Paper presented at the Defeat AutismNow Conference, San Diego, CA.
Reichelt, K., & Knivsberg, A.M. (2003, October). Why use the gluten-free and casein-free diet in autism and what the results have shown so far: Peptides and autism. Paperpresented at the Defeat Autism Now Conference, Portland, OR.
Rippon, G., Brock, J., Brown, C., & Boucher, J. (2007). Disordered connectivity in theAutistic brain: Challenges for the “new psychophysiology”. International Journal ofPsychophysiology, 63(2), 164�172.
Roberts, W., Weaver, L., Brian, J., Bryson, S., Emelianova, S., Griffiths, A. M., et al.(2001). Repeated doses of porcine secretin in the treatment of autism: A randomized,placebo-controlled trial. Pediatrics, 107(5), 71�80.
Rossignol, D. A., & Rossignol, L. W. (2006). Hyperbaric oxygen therapy may improvesymptoms in autistic children. Medical Hypotheses, 67, 216�228.
Rossignol, D. A., Rossignol, L. W., James, S. J., Melnyk, S., & Mumper, E. (2007). Theeffcts of hyperbaric oxygen therapy on oxidative stress, inflammation, and symptomsin children with autism: An open-label pilot study. BMC Pediatrics, 7, 36�49.
RUPP (Research Units on Pediatric Psychopharmacology Autism Network). (2005a).Risperidone treatment of autistic disorder: Longer-term benefits and blinded discon-tinuation after 6 months. American Journal of Psychiatry, 162, 1361�1369.
RUPP (Research Units on Pediatric Psychopharmacology Autism Network). (2005b).Randomized, controlled, crossover trial of methylphenidate in pervasive developmen-tal disorders with hyperactivity. Archives of General Psychiatry, 62(11), 1266�1274.
Sandler, A. D., Sutton, K. A., DeWeese, J., Girardi, M. A., Sheppard, V., & Bodfish, J. W.(1999). Lack of benefit of a single dose of synthetic human secretin in the treatmentof autism and pervasive developmental disorder. New England Journal of Medicine, 341,1801�1806.
Santangelo, S. L., & Tsatsanis, K. (2005). What is known about autism: Genes, brain, andbehavior. American Journal of Pharmacogenomics, 5(2), 71�92.
Schopler, E., & Reichler, R. J. (1971). Parents as cotherapists in the treatment of psychoticchildren. Journal of Autism and Childhood Schizophrenia, 1, 87�102.
Schopler, E., Reichler, R. J., DeVellis, R. F., & Daly, K. (1980). Toward objective classifi-cation of childhood autism: Childhood Autism Rating Scale (CARS). Journal ofAutism and Developmental Disorders, 10(1), 91�103.
Schmitz, N., Rubia, K., Daly, E., Smith, A., Williams, S., & Murphy, D. G. (2006).Neural correlates of executive function in autistic spectrum disorders. BiologicalPsychiatry, 59(1), 7�16.
Sicile-Kira, C. (2004). Autism spectrum disorders: The complete guide to understanding autism,Asperger’s syndrome, pervasive developmental disorder, and ASDs. New York: The BerkleyPublishing Group.
Siegel, B. (1996). The world of the autistic child: Understanding and treating autistic spectrum dis-orders. New York: Oxford University Press.
181Connectivity-Guided Neurofeedback for Autistic Disorders

Sinha, Y., Silove, N., & Williams, K. (2006). Chelation therapy and autism. British MedicalJournal, 333(7571), 756.
Starkstein, S. E., Vazquez, S., Vrancic, D., Nanclares, V., Manes, F., Piven, J., et al. (2000).SPECT findings in mentally retarded autistic individuals. Journal of Neuropsychiatry andClinical Neurosciences, 12, 370�375.
Stoller, K. P. (2005). Quantification of neurocognitive changes before, during, and after hyper-baric oxygen therapy in a case of fetal alcohol syndrome. Pediatrics, 116(4), e586�591.
Tansey, M. A. (1993). Ten-year stability study of EEG biofeedback results for a hyperactiveboy who failed a fourth grade perceptually impaired class. Biofeedback and Self-Regulation, 18(1), 33�44.
Thompson, L., & Thompson, M. (2003a, March). Neurofeedback treatment for AutisticSpectrum Disorders: Review of 60 cases � principles and outcome. Citation paper pre-sented at the 34th Annual Meeting of the Association for Applied Psychophysiologyand Biofeedback, Jacksonville, FL.
Thompson, M., & Thompson, L. (2003b). The neurofeedback book: An introduction to basicconcepts in applied psychophysiology. Wheat Ridge, CO: Association for AppliedPsychophysiology and Biofeedback.
Troost, P. W., Lahuis, B. E., Steenhuis, M. P., Ketelaars, C. E., Buitelaar, J. K., vanEngeland, H., et al. (2005). Long-term effects of risperidone in children with autismspectrum disorders: A placebo discontinuation study. Journal of the American Academy ofChild & Adolescent Psychiatry, 44(11), 1137�1144.
Vancassel, S., Durand, G., Barthelemy, C., Lejeune, B., Martineau, J., Guilloteau, D., et al.(2001). Plasma fatty acid levels in autistic children. Prostaglandins, Leukotrienes, andEssential Fatty Acids, 65(1), 1�7.
Wainright, P. E. (2002). Dietary essential fatty acids and brain function: A developmentalperspective on mechanisms. Proceedings of the Nutrition Society, 61, 61�69.
Welchew, D. E., Ashwin, C., Berkouk, K., Salvador, R., Suckling, J., Baron-Cohen, S.,et al. (2005). Functional disconnectivity of the medial temporal lobe in asperger’s syn-drome. Biological Psychiatry, 57, 991�998.
Yucha, C., & Montgomery, D. (2008). Evidence-based practice in biofeedback and neurofeedback.Wheat Ridge, CO: Association for Applied Psychophysiology and Biofeedback.
Zilbovicius, M., Boddaert, N., Belin, P., Poline, J. B., Remy, P., Mangin, J. F., et al.(2000). Temporal lobe dysfunction in childhood autism: A PET study. AmericanJournal of Psychiatry, 157, 1988�1993.
Zuddas, A., Di Martino, A., Muglia, P., & Cichetti, C. (2000). Long-term risperidone forpervasive developmental disorder: Efficacy, tolerability, and discontinuation. Journal ofChild and Adolescent Psychopharmacology, 10, 79�90.
182 Robert Coben and Lori A. Wagner

CHAPTER77Neurofeedback and EpilepsyGabriel Tan1,2, D. Corydon Hammond3, Jonathan Walker4,Ellen Broelz5, and Ute Strehl51Michael E. DeBakey Veterans Affairs Medical Center, Houston, Texas, USA2Baylor College of Medicine, Houston, Texas, USA3University of Utah School of Medicine, Salt Lake City, Utah, USA4Neurotherapy Center of Dallas, Texas, USA5Institute of Medical Psychology and Behavioral Neurobiology, University of Tubingen,Tubingen, Germany
Contents
Introduction 183Research Synopsis 184Clinical Protocols 186
Reinforcing SMR, Inhibiting Theta 186Inhibiting Theta, Reinforcing 15�18 Hz 186SCP Self-Regulation Training 187
Individualizing Neurofeedback Based on qEEG Findings 187Low Energy Neurofeedback System (LENS) 198Observations and Implications for Future Direction 200References 201
INTRODUCTION
Nearly 50 million people currently suffer from epilepsy; 0.8% of the gen-
eral population, according to the World Health Organization (2009).
Medication successfully controls seizures in two-thirds of cases, but poten-
tial side effects and health risks associated with long-term usage of anti-
epileptics remain a concern. When medications fail, neurosurgery is
another treatment option, but it has limited success (Witte, Iasemidis, &
Litt, 2003). All told, about one in three epilepsy patients will continue to
experience the disability of uncontrollable seizures throughout their life-
time (Iasemidis, 2003).
The use of neurofeedback to reduce intractable seizures has been under
serious investigation for 40 years, beginning with cats (Sterman, Wyrwicka, &
183Neurofeedback and Neuromodulation Techniques and ApplicationsDOI: 10.1016/B978-0-12-382235-2.00007-X
© 2011 Elsevier Inc.All rights reserved.

Roth, 1969; Wyrwicka & Sterman, 1968), monkeys (Sterman, Goodman, &
Kovalesky, 1978), and humans (Sterman & Friar, 1972). Although EEG
rhythm training has been associated with clinical improvement as well
as electroencephalographic (EEG) normalization of seizure patients (see
Sterman, 2000, for a review), few neurologists and epileptologists have
adopted this approach to help treat seizure disorder.
This chapter will briefly summarize the published research on neuro-
feedback and epilepsy, followed by a description of the clinical protocols
typically used and illustrated with case examples when appropriate. Then,
the use of qEEG to improve outcome will be described. The chapter will
conclude with some observations and implications for future directions.
RESEARCH SYNOPSIS
Research in the United States has emphasized sensorimotor rhythm
(SMR) up-training (i.e., increasing 12�15 Hz activity at motor strip)
(Lubar et al., 1981; Sterman, 2000; Sterman, Macdonald, & Stone, 1974)
with or without simultaneous downtraining of slow rhythms (e.g.,
decreasing 4�7 Hz activity) (Cott, Pavloski, & Black, 1979; Hansen,
Trudeau, & Grace, 1996; Lantz & Sterman, 1988; Tozzo, Elfner, & May,
1988). Research in Europe, on the other hand, has focused principally on
slow cortical potentials (SCP), which last several hundred milliseconds
and reflect the level of excitability of underlying cortex. Negative SCP-
shifts are observed before and during seizures and positive shifts appear
after their abatement (Ikeda et al., 1996). To prevent seizure onset,
patients learn to suppress negativity (excitation) by producing positive
shifts (inhibition).
The research on neurofeedback and epilepsy has historically been lim-
ited (of necessity) to small sample sizes and only a single group for which
pre- and post-treatment effects are determined. One exception was a
study using SCP which was a controlled study with between-group com-
parisons (Kotchoubey et al., 2001). Despite these limitations, results have
been consistent across studies, generally suggesting that neurofeedback
leads to reduction in seizures. For example, one study found that over
80% of 83 patients achieved control over seizures when a combination of
interventions was used, including identifying precursors and triggers for
seizures, diaphragmatic breathing, and SMR biofeedback (Andrews &
Schonfeld, 1992).
184 Gabriel Tan et al.

Finally, learned alterations in EEG patterns with neurofeedback are neither
necessarily conscious nor voluntary, as indicated by associated changes and
related clinical shifts during the unconscious state of sleep. As SMR increases,
nocturnal epileptiform activity decreases (Sterman, 1982; Sterman & Shouse,
1980; Whitsett, Lubar, Holder, Pamplin, & Shabsin, 1982).
Sterman (2000) summarized peer-reviewed neurofeedback epilepsy
research from 1972 to 1996 and determined that four out of every five
patients enrolled in these various studies improved clinically (142 of 174
patients, or 82%), and most (66% of reported cases) exhibited
“contingency-related EEG changes and a shift towards EEG normaliza-
tion” (Sterman, 2000, p. 52).
Studies utilizing SCP training, though not as numerous, also show
positive outcomes. Kotchoubey et al. (2001) found decreased seizure inci-
dence following SCP training, which was correlated to SCP amplitude.
Rockstroh et al. (1993) reported significant seizure reductions, with six
participants having longer seizure-free periods. Finally, Holzapfel, Strehl,
Kotchoubey, and Birbaumer (1998) also found reductions in seizure
rate following SCP training in an individual experiencing generalized
clonic�tonic seizure despite taking anticonvulsant medications and after
an anterior callosotomy.
While results reported in these and other studies are promising, any
study alone is insufficient to determine whether neurofeedback is effica-
cious for treating epilepsy. Consequently, a meta-analysis was recently
published (Tan et al., 2009). In this study, every EEG biofeedback study
indexed in MedLine, PsychInfo, and PsychLit databases between 1970
and 2005 on epilepsy which provided seizure frequency change in
response to feedback was included. Sixty-three published studies were
identified, 10 of which provided enough outcome information to be
included in a meta-analysis. All studies consisted of patients whose seizures
were not controlled by medical therapies, which is a very important factor
to keep in mind when interpreting results. Nine of 10 studies reinforced
SMR while one study trained SCP. All studies reported an overall mean
decreased seizure incidence following treatment and 64 out of 87 patients
(74%) reported fewer weekly seizures in response to EEG biofeedback.
Treatment effect was mean log (post/pre) where pre and post represent
number of seizures per week prior to treatment and at final evaluation,
respectively. Due to prevalence of small groups, Hedges’s g was computed
for effect size. As sample heterogeneity was possible (Q test, p5 0.18),
random effects were assumed and the effect of intervention was 20.233,
185Neurofeedback and Epilepsy

SE5 0.057, z524.11, p ,0.001. The meta-analysis concluded that:
“EEG operant conditioning was found to produce a significant reduction
on seizure frequency. This finding is especially noteworthy given that the
patients treated with neurotherapy often consisted of individuals who had
been unable to control their seizures with medical treatment” (Tan et al.,
2009, p. 173).
CLINICAL PROTOCOLS
There are several different approaches utilizing neurofeedback that have
reported successful outcomes with uncontrolled epilepsy: (1) reinforcing
SMR, inhibiting theta; (2) inhibiting theta, reinforcing 15�18 Hz; (3) SCP
self-regulation training; (4) the Low Energy Neurofeedback System
(LENS); and (5) QEEG-guided neurofeedback. Each of these will be
reviewed briefly.
Reinforcing SMR, Inhibiting ThetaIn the recent meta-analytic review, Tan et al. (2009) found that the largest
volume of controlled research with documented positive effects for treat-
ment of uncontrolled epilepsy involved reinforcing SMR (most com-
monly defined as 12�15 Hz over the sensorimotor strip), while inhibiting
theta activity (3 or 4�7 Hz). Most of the studies identified used a bipolar
(sequential) montage; however, today some clinicians use this protocol
with monopolar training (one active electrode site on the head, referenced
to an earlobe, usually in the same hemisphere).
Inhibiting Theta, Reinforcing 15�18 HzAyers (1988, 1995) reported successfully treating cases of uncontrolled epi-
lepsy using bipolar (sequential) montage training at T3�C3 (or T7�C1)
for 15 minutes, followed by 15 minutes of training at T4�C4 (or
T8�C2), which inhibited 4�7 Hz while mildly reinforcing 15�18 Hz
(e.g., with the reward threshold at only 0.4 µV). Following improvement
and greater normalization of the EEG at these sites, Ayers would then per-
form the same training at T3�F7 and T4�F8 if head trauma was involved,
or at T4�F4 and T3�F3 when migraine was involved (Ayers, 2000). Ayers
asserted that inhibiting theta activity was most important in neurofeedback
treatment, and that significantly reinforcing beta activity may risk adverse
effects. Based on clinical experience, Ayers also asserted that if the
186 Gabriel Tan et al.

practitioner only provides treatment in the hemisphere with a seizure focus
(e.g., at T4�C4), in some cases the seizure focus would shift to the other
hemisphere � something that Hughes, Taber, and Fino (1991) describe as
the mirror phenomenon. Thus, the Ayers approach is to provide treatment
at homologous sites in both hemispheres (Ayers, 2000).
SCP Self-Regulation TrainingTraining of SCP is usually accomplished with one electrode at Cz refer-
enced against the mastoids. Kotchoubey et al. (2001) conducted the largest
study utilizing this method involving 41 patients. All their recommenda-
tions on how to conduct a SCP session are based on the experience gained
in this study. During about 35 sessions of SCP-feedback patients learn to
produce electrically negative as well as electrically positive shifts. Within
each session 120�140 trials comprising both types of tasks are presented
with and without feedback. Trials without feedback are believed to help to
transfer self-regulation skills from the clinical setting to everyday life. In
addition to SCP, training patients receive behavior therapy in a behavior
medicine framework. Here, patients learn to identify stimuli or situations
that elicit seizures. In addition they were instructed to apply SCP self-
regulation in these situations as well as in moments when seizures are
developing. Finally, contingency management helps to reduce seizure fre-
quency. See patient history examples in Examples 7.1 and 7.2.
INDIVIDUALIZING NEUROFEEDBACK BASED ONqEEG FINDINGS
Early studies using neurofeedback for epilepsy were done without the
benefit of qEEG (reviewed by Sterman, 2000). In the 1970s and 1980s,
normative databases were collected and analyzed and became commer-
cially available ( John, Prichep, & Easton, 1987). The goal of qEEG-
guided training for epilepsy is to normalize the EEG activity.
Nuwer (1988) was the first to look at qEEG power abnormalities in
epileptic patients, but he did not look for coherence abnormalities.
Walker (2008) described the power and coherence abnormalities in
patients with intractable epilepsy (Tables 7.1 and 7.2).
Walker and Kozlowski (2005) were the first to use power and coher-
ence training to normalize the qEEGs of patients with intractable epilepsy.
An excess power in any given frequency band was trained down and a
187Neurofeedback and Epilepsy

���
Example 7.1 Patient AB
General HistoryPatient AB is 35 years old and lives with his wife and his two children. He is currentlyretraining in an academic education. He experienced his first epileptic seizure at the ageof 20, and according to the doctor’s diagnosis he suffers from epilepsy with simple focal,complex focal, and rare generalized seizures. The attacks occur during the day as well asduring the night, and their frequency varies between three and eight attacks per month.Currently he is taking two types of epilepsy medication: carbamazepine and lamotrigine.Up to the start of treatment he did not keep track of his attacks and due to blood-levelchecks by the doctor, it is assumed that he does not regularly take his medication. TheEEG was evaluated by a neurologist as rather normal with some slowing underhyperventilation.
Patient AB had meningitis during his childhood and spent one year in the hospital.In his childhood, he was always over-protected and thus severely limited. He complainedthat he never had the opportunity to live out his potential and develop his talentsfurther.
Behavioral AnalysisAt the start of an attack, AB feels a queasy sweetish sensation crawling up from hisstomach.
AntecedentsHis wife observes an increasing irritability in the days preceding an attack. He is restlessand talks more than usual. He discusses abstruse topics and immediately before theattack his breathing changes, he holds his breath and during the attack switches to pant-ing and flat breathing. Further antecedents and triggers are alcohol consumption, fatigue,imperative urinary urgency, time pressure, fear of failure and other fear-occupiedthoughts, anger, listening to specific classical music, dealing with tricky situations.
ConsequencesAB feels exhausted, dizzy, experiences headaches, unpleasant taste but also relief. Lightattacks make him feel “activated”, while after heavy attacks he sleeps. Functionally he pro-crastinates making decisions; he avoids strenuous activities and uses the epilepsy as a jus-tification for not being able to exploit his full potential.
DiagnosticsAbove average intelligence and logical thinking, but reduced attention and below aver-age visual memory. Very good frontal lobe performance (Wisconsin Card Sorting Test;Nelson, 1976). Results of the BDI (Beck-Depression Inventory; Hautzinger, Bailer, Worall, &Keller, 1994) and MMPI (Minnesota Multiphasic Personality Inventory; Gehring & Blaser,1993) are noteworthy; i.e., the scores for depression, hypochondria and hysteria are ele-vated. The FLL (Questionnaire about life goals and life satisfaction; Kraak & Nord-Rüdiger,1989) revealed low life satisfaction. The patient also has low self-esteem and an external
188 Gabriel Tan et al.

locus of control, according to the FKK scores (questionnaire regarding attributions andlocus of control; Krampen, 1991). Further, AB is tentatively diagnosed as a narcissistic per-sonality. Crucial for the therapeutic success is the patient’s presumption that the epilepsyprevents him from living out his great potential. He also believes that he will finish hiseducation despite bad grades and will not find a job because of his epilepsy.
Course of Therapy NotesDuring the first biofeedback training sessions AB learns to differentiate the two tasks buthe produces positive shifts (deactivates) when he is supposed to produce negative shifts(activate) and vice versa. Attempts to switch the strategies show only small effects. Laterin the course of treatment AB is more successful and in the last training session the hit-score and differentiation between both tasks are nearly perfect. The first therapy sessionsaccompanying the biofeedback training are mostly concerned with the analysis andreduction of cognitive misperceptions and dysfunctional affects, in order to counteractthe positive avoidance function of the seizure attacks. Later, the main focus is on how totransfer the self-regulation strategies into daily life. Emphasized are the antecedents. Inmoments of great fatigue (after exhausting tasks at work, during work breaks, when AB isdriven home, when he is sitting down at the table for meals) AB is supposed to counter-act cortical activation or lower it by applying self-regulation.
The biofeedback itself is done while the classical music, which is listed as an anteced-ent above, is played. The wife is asked to remind him to use his strategies for less con-scious events preceding an attack, like urinary urgency, increased talking, and shallowbreathing.
Results
BiofeedbackAB learns to differentiate between the cortically activated and deactivated states; thissplitting becomes statistically significant in phase 2 of the treatment.
AttacksThe frequency of attacks continuously declines from four per month during baseline, totwo attacks during the first follow-up and one in the second follow-up period. From thediary data we know that some of these attacks occur on days on which AB does not takethe complete daily dose of his anti-epileptic medicine.
Test Data and Life EventsAlmost all tests show improved scores (memory, MMPI, depression, satisfaction with life,locus of control) at the end of therapy and follow up. The emotional stress reaction (UBV,testing the ability to deal with stress; Reicherts & Perez, 1993) also normalizes.
After finishing his education, AB achieves a temporary contract in his desired profes-sion, which is first extended and later changed to an unlimited contract. The family situa-tion is further stabilizing and the family is moving from a flat into their own house.
(Continued)
189Neurofeedback and Epilepsy

���
Example 7.1 (Continued)
CommentaryMany patients suffer from psychological problems as a result of epilepsy. These issues(depressive moods, lack of social competence, fears, etc.) should also be treated duringthe epilepsy therapy, although the focus remains on acquiring (cortical) self-control. Inthis case with a probability of a personality disorder, whose onset may date back to atime when AB had no epilepsy, a differential diagnosis in order to exclude psychogenicepilepsy is crucial. Although a personality disorder cannot be sufficiently treated in thegiven setting, it must at the same time be taken into account, in order to establish anadequate therapeutic relationship.
In the case of patient AB, despite the positive development, it cannot be assumedthat along with the reduction in attack frequency, a complete remission of the personal-ity disorder was achieved. However, this case demonstrates that despite other disorders,the neurofeedback treatment of epilepsy can successfully be conducted. In order to doso, a detailed clinical diagnosis and the consideration of additional diagnoses during thetherapeutic process are mandatory.
Outcomes (Follow-Up 8 Years After)Immediately after the end of NFT, patient AB reported the successful use of strategieslearned during training in his daily life. He also described a reduction in seizure frequencyto one per month. At the 8 year follow-up, AB experienced on average two simple focalseizures monthly. He also claimed still to use the strategies for activation and deactivationand occasionally managed to suppress an attack. He is still taking carbamazepine andlamotrigine.
BiofeedbackAB achieved varying results in the three refresher training sessions at follow-up andreached a hit-score of 88% for activation. Overall the patient showed better performancefor activating than deactivating.
Test ResultsThe IQ was 112, attention test score was slightly below average performance, while mem-ory was above average. Scores for depression (BDI) were subclinical; MMPI scores werewithin the normal range, except hypochondriasis and hysteria, which were elevated.
EEGAB showed normal alpha rhythms, with a slight dysrhythmia but no epileptic focus, andno changes under hyperventilation.
MRITests showed discrete signs of cortical atrophy, especially in the occipital lobe and intemporo-basal areas. Also, the patient showed a slight hemispheric difference in hippo-campus size (distinctly more narrow on the right side). This difference extends to theamygdala.
190 Gabriel Tan et al.

���
Example 7.2 Patient EB
General HistoryPatient EB, a 28-year-old university student in a long-term relationship, suffered herfirst epileptic seizure at the age of 13. According to the diagnosis, the seizures werepredominantly simple focal, rarely complex focal, and only a few were generalizedattacks. The epileptic seizure occurrence varied between one and four per week.During the baseline phase (12 weeks before treatment) EB experienced on averagethree to four seizures weekly. This frequency dropped to about one or two weekly inthe following 12 weeks of treatment. At the beginning of NFT, patient EB was takingthree different anti-seizure medications: carbamazepin, lamotrigine, and gabapentin.Her EEG showed a slight overall alteration. A tendency toward paroxysmal dysrhyth-mia as well as a discrete non-specific epilepsy focus on the right parieto-occipitaljunction was seen by the neurologist.
Social AspectsThe patient generally perceived her studies as “going well”. During the week she had aregular study and sleep rhythm. EB had a large social network and applied herself in asupervised study group for students. Despite this, EB felt rather “uncomfortable” in townand often longed for the nature surrounding her parents’ residence.
Her father seemed calm and had a relaxing influence on the situation; while hermother often blamed herself for her daughter’s epilepsy and pushed EB to increase hermedication dosage every time she had a more severe seizure. The mother also worriedthat studying was harmful to EB. EB was planning to get married to her long-term boy-friend after the end of exams. Her boyfriend viewed the epilepsy as unproblematic but,like her mother, was worried that her condition might worsen. Conflicts and fightsbetween the two often ended unfinished because EB sometimes experienced seizures inthese situations.
Behavioral Analysis
Clinical CourseEB described her early seizures as a “wave”, a somersault under water, a fast elevator ordriving over a bump in the road. However, with the outset of larger attacks, EB reportedno longer perceiving them as “fun” but became afraid of future episodes. Complexseizures were accompanied by drooling and cramping of the left arm. Falls were rare.
AntecedentsFights with EB’s mother or boyfriend were sometimes followed by attacks. Half a daybefore seizure onset, EB often felt irritable, unsatisfied, and restless.
TriggersLack of sleep, stress (high workload or aiming to understand theoretical concepts), socialconflicts (not feeling accepted, doubting herself, fights with her boyfriend), higher tem-peratures or elevated ozone levels, and hormonal fluctuations.
(Continued)
191Neurofeedback and Epilepsy

���
Example 7.2 (Continued)
DiagnosisEB showed average to above-average scores on neuropsychological (WMS 82�98% rank)and intelligence (IQ B120) measures. Over the course of the biofeedback training her IQimproved by one standard deviation. The UBV (testing the ability to deal with the stressof treatment) showed normal scores. The MMPI scores were also normal, although EBwas reserved, even defensive toward the test.
Course of Therapy
BiofeedbackEB was very successful in the biofeedback training and learned to differentiate betweenstrategies for activation (negative shifts) and deactivation (positive shifts). In order toavoid seizures the patient practiced both strategies learned during the training severaltimes a day. By using these strategies she even sometimes managed to suppress com-plex focal seizures. However, she showed an increasing number of simple focal seizures.
Other Therapeutic ApproachesEB also practiced relaxation training, taking the instructions home to practice the tech-nique and sharing this therapeutic approach with her friends. EB also learned to dealwith stressful situations both in theory and in practice (e.g., for exam situations, timeswhen she felt unjustifiably criticized, or when she felt neglected). She also learned tocope with anger. In order to prepare for exams, EB was taught how to positively presentherself and how to handle difficult situations. EB needed to find support actively, notonly in her escape to her parents’ house on the weekends but also during the week.
Outcomes (Follow-Up 8 Years After)
BiofeedbackEB was still able to differentiate the strategies for activation and deactivation and evenreached a hit-ratio of 100%. Overall the patient showed better performance in activationthan deactivation. An example of a transfer trial (self-regulation without feedback) isgiven in Figure 7.1.
Seizure Frequency and EEGAt the beginning of the study, EB reported 15 simple focal/complex focal seizures permonth on average. After completing the biofeedback training, the seizure frequencydropped to 11 per month. At the 8 year follow-up, the authors found that EB experi-enced only eight seizures (simple and complex focal) on average every month. A slightoverall alteration in the EEG was found by her neurologist and there was no certain indi-cation of an epileptic focus.
Social AspectsAfter the patient took her exams and graduated from university, she married her boy-friend and gave birth to two children. EB still uses the strategies she learned during thebiofeedback training and succeeds in suppressing seizures.
192 Gabriel Tan et al.

deficient power in a given frequency band was trained up. Decreased
coherences were trained up and excessive coherences were trained down.
Usually one or two sites or combination of sites in coherence were
trained, one at a time. Subsequently, a total of 110 patients have been
trained with this approach and followed for 1 to 5 years. Ninety-two
patients (84%) of them became seizure-free and have remained so.
The remainder experienced a sustained reduction in seizure frequency.
Eighty-five patients (77%) were off all drugs and remain seizure-free.
20060722162027.EEG
–2 0 2 4Time in s
–60
–40
–20
0
Tran
sfer
in µ
V
20
40
60
6 8 10
TR+ 11 of 12 Trials –> MW: 5–8 s = 32.3043 µVTR– 6 of 8 Trials –> MW: 5–8 s = –44.3887 µV
Figure 7.1 Averaged slow cortical potentials shift (negativity: darker line; positivity:lighter line) at 8 year follow-up evaluation.
Table 7.1 Power spectral frequency abnormalities in 25 patients withintractable seizuresPower abnormality (1 or more foci) Incidence (% of patients)
Excess absolute theta 75
Excess relative theta 33
Deficient relative beta 33
Deficient absolute delta 25
Excessive absolute alpha 18
Deficient absolute alpha 18
Excess absolute beta 18
Excess relative beta 18
Deficient absolute beta 18
193Neurofeedback and Epilepsy

No significant side effects were observed, and there have been no
complications.
An added advantage of neurofeedback is the remediation of comorbid
conditions in many patients (Table 7.3). These include ADD/ADHD,
chronic anxiety, oppositional defiant disorder, migraine, dyslexia, dysgra-
phia, dyscalculia, and post-traumatic stress disorder.
Neurofeedback training offers many advantages over traditional treat-
ments for patients with drug-resistant epilepsy. It usually eliminates or
reduces seizure frequency in these most complex seizure patients, where
drugs have failed to do so. It is holistic, promoting normalization of brain
activity. It is non-invasive. It is much less expensive than epilepsy surgery,
and may succeed where surgery has failed. There is a greater success rate
(.90% in the author J.W.’s experience). It can remediate comorbid condi-
tions. It is successful in patients who are not candidates for surgery (no
foci or multiple foci).
Table 7.2 Coherence abnormalities in 25 patients with intractable seizuresCoherence abnormality (1 or more) Incidence (percent of patients)
Decreased theta coherence 75
Decreased beta coherence 50
Increased beta coherence 50
Increased theta coherence 50
Decreased alpha coherence 42
Increased alpha coherence 33
Decreased delta coherence 25
Increased delta coherence 0
No coherence abnormalities 16
Table 7.3 Comorbid conditions remediated by neurofeedback in90 intractable epilepsy patientsCondition Number with condition Number remediated
Clinical depression 7 7
ADD/ADHD 6 6
Chronic anxiety 5 5
Oppositional defiant disorder 4 4
Migraine 4 4
Dyslexia 4 4
Dysgraphia 4 4
Dyscalculia 4 4
PTSD 4 4
194 Gabriel Tan et al.

The disadvantages of qEEG-guided neurofeedback are that different
equipment may need to be purchased, and the epileptologist must be
trained in qEEG analysis and neurofeedback technique. It requires training
and experience for best results.
Recent developments in qEEG and neurofeedback strategies bode
well for even better results in the future. In particular, Thatcher, Biver,
and North (2007) and Collura (2010) (see also Collura, Guan, Tarrant,
Bailey, & Starr, 2010) have developed “live Z-score training”, whereby
four sites may be simultaneously trained to normalize power, coher-
ence, phase, asymmetry, and/or ratios. Early experience indicates that
fewer neurofeedback sessions are usually required, with comparable or
better results than with one- or two-site training of power and/or
coherence only. See patient history examples in Examples 7.3, 7.4, 7.5,
and 7.6.
���
Example 7.3 Patient History: Example of qEEG-Guided IndividualizedTraining Inhibiting Beta
A new patient provided the following history. He began having petit mal seizures at age10, was put on an anti-epileptic medication and his seizures remained completely con-trolled until age 45. At that time he began having liver toxicity from his many years onthe medication and his physicians discontinued it and began trying other medicationsand combinations of medications. During the following two years they were unable tocontrol his seizures and he had remained unemployable. Although he was on three epi-lepsy medications, he was still having an estimated 100 absence seizures daily, and twoor more grand mal seizures a week. In fact, he appeared for our intake appointment withone of his legs in a complete leg cast from having broken his leg in two places during agrand mal seizure the previous week. The neurologist was now recommending neuro-surgery and the implantation of a vagal nerve stimulator. When the patient and his wifeinquired about the possibility of neurofeedback as another treatment option, the author(D.C.H.) suggested they ask the neurosurgeon what the success rate was of the implantin significantly reducing seizures. They were told 40%, after which they decided to try aless invasive treatment approach before further considering surgery.
Previous clinical EEGs had not revealed a seizure focus. The author did a qEEG andduring data-gathering the patient experienced a seizure with classic spike and waveactivity, which, when separately analyzed, showed a focus of 3 Hz activity at Fz�Cz (andspreading into F3 and F4) in both absolute and relative power, as well as in the delta/theta ratio. LORETA localized this 3 Hz activity as originating in Brodmann area 10 of themedial frontal gyrus. In eyes-closed and eyes-open conditions, however, when he wasnot experiencing a seizure, the most prominent activity was excess beta on the frontal
(Continued)
195Neurofeedback and Epilepsy

���
Example 7.3 (Continued)
midline (Fz�Cz) and there was a deficit in absolute power activity from 1�4 Hz, particu-larly along the midline. This beta excess would generally be considered a sign of corticalirritability.
Although the author (D.C.H.) was tempted to follow the traditional protocol of rein-forcing SMR while inhibiting theta (and extending it down to 3 Hz), it was troubling that13�15 Hz activity was also excessive in the qEEG in central and midline areas. Therefore,it was decided to base training on the qEEG findings and we began training him toinhibit 20�34 Hz, eyes closed, at Fz (with no reinforcement band). Feedback consisted ofhearing the sound of the ocean when he reduced the beta below a threshold. The dayprior to the first neurofeedback session, he experienced two grand mal seizures.Interestingly, at the time of the second neurofeedback session, he reported that in theprevious four days he “felt a lot better” and that there had been fewer absence seizures.Seven days later, as he came for his third neurofeedback session, he reported a 90%reduction in seizure rate. Due to limited finances, the patient only received 12 neurofeed-back sessions over a 4 month period of time. During this time when we would haveanticipated from his pre-treatment base rate that he may have had 32�48 grand malseizures, he had only three such seizures and he and his wife labeled his progress as“phenomenal.” His absence seizures had been reduced to only 1�4/day, which had beenmaintained at his 2 month follow-up, at which time he was starting job training throughstate vocational rehabilitation. He moved soon after the 2 month post-treatment contactand was lost to further follow-up. This case illustrates the potential added value of basingtreatment on a qEEG assessment to facilitate the individualization of treatment.
���
Example 7.4 Patient History: Example 1 of Seizure Remediation
A 3-year-old male patient had a correction of situs inversus and an appendectomy at10 days of age. He had the onset of partial complex seizures at 11 months of age. Hewas initially treated with carbamazepine which decreased the frequency of the seizures,but made him drowsy. The carbamazepine dosage was decreased and levetiracetamwas added. Avoidance of gluten and sugar decreased the frequency of the seizures.Levetiractam made him irritable and aggressive. When he presented to our clinic atage 3 he was having two seizures per month. An MRI of the brain was normal at oneyear of age. He was considered to be a candidate for epilepsy surgery. He was not partic-ularly hyperactive, but he was impulsive. He was learning his letters and numbers andcould repeat words correctly. Walking and running were normal. A typical seizure beganwith staring into space and blinking repeatedly and being unresponsive, lasting about2 minutes. He would rarely have jerking movements of the arms and fall to the ground.He would usually sleep for about 2 hours afterwards. He was diagnosed as having partialcomplex seizures with occasional secondary generalized seizures.
His EEG revealed diffuse 4�5 Hz activity with frequent sharp-and-slow complexes atO1. His qEEG revealed multiple areas of excess focal slow activity (1�10 Hz range) includ-ing O1, O2, T5, P3, Pz, T4, C4, P4, T6, F7, T3, FP2, Fp1, C3, Cz, and Fz. There was an excess
196 Gabriel Tan et al.

of 30 Hz activity at P4. There was a decrease in delta coherence in five pairs on the left,an increase in delta coherence in three pairs on the left, a decrease in theta coherence intwo pairs on the left, and a decrease in alpha coherence in one pair on the left.
The patient had five sessions to downtrain 1�10 Hz and uptrain 15�18 Hz at eachof the following sites (dual training):
O11O2T51 P3T41 PZC41 P4F71 T6F11 F2C31 CZT31 FZ
The patient experienced a decline in his seizures as the neurofeedback training pro-gressed. His last seizure occurred after the 30th session. He has had no further seizures(18 months at this point). After neurofeedback training he was paying attention normallyand was no longer impulsive, irritable, or aggressive. He no longer requires medicationfor seizures.
���
Example 7.5 Patient History: Example 2 of Seizure Remediation
This young man began having seizures at age 15. He had hit his head several times inmotor vehicle accidents (sprint cars) and one bicycle accident at age 7. At age 15 he fellhard on his tailbone, and developed a severe headache. The next morning he had hisfirst grand mal seizure, with a second seizure that afternoon. An EEG was normal, as wasan MRI of the brain. He was started on Depakotes, which prevented further seizures,but his headache persisted and he became angry and gained weight. He was switchedto Tegretols, which prevented daytime seizures, but he continued to have one to twonocturnal seizures per month. His pre-existing attention difficulty worsened onTegretols. A sleep-deprived EEG revealed a sharp wave abnormality in the right poster-ior temporal area. He was experiencing initial and terminal insomnia. A continuous per-formance test was consistent with ADD. He complained of poor memory. His raw EEG onadmission to our clinic revealed sharp wave discharges at T5, Cz, T6, and Oz. His QEEGrevealed excess slow activity (in the 1�10 Hz range) in the following areas: O1, O2, F8,Pz, P4, T6, FP1, and FPZ. There was a decrease in alpha coherence in two pairs on theleft, a decrease in beta coherence in two pairs on the left and one pair on the right. Hehad neurofeedback training, five sessions to reduce 1�10 Hz and increase 17 Hz for eachof the following locations (dual training):
011O2F81 PzP41 T6
(Continued)
197Neurofeedback and Epilepsy

LOW ENERGY NEUROFEEDBACK SYSTEM (LENS)
The Low Energy Neurofeedback System (LENS; Hammond, 2007; Larsen,
2006; Ochs, 2007) is a passive form of neurofeedback which produces its
effects through feedback that involves a very tiny electromagnetic field which
has field strength of 10-18 watts/cm2 (less than the output of a watch battery).
The feedback is delivered in one second intervals down electrode wires
while the patient remains motionless, with the feedback being adjusted
16 times per second to remain a certain number of cycles per second faster
than the dominant EEG frequency at the electrode site being trained. LENS
treatment is traditionally done by providing feedback at all 19 standards
���
Example 7.5 (Continued)
F11 F2T51 C3F31 F4P31 Pz
His last seizure occurred after the 30th session of neurofeedback. After the 35th ses-sion he tapered and stopped the Tegretols, with no recurrence of seizures (for20 months so far). He began to do very well in school � improving from a GPA of 2.5 inhigh school to a 4.0 in his first year in college.
���
Example 7.6 Patient History: Example of qEEG Assistance inRecognition of a Tumor
Several years ago one of the authors (D.C.H.) was asked by a physician to use neurofeed-back to treat his son’s uncontrolled epilepsy. A qEEG (Figure 7.2) revealed some focaldelta at electrode site F8. It was recommended to the 21-year-old patient and his fatherthat this could potentially be associated with a lesion which an MRI could rule out. Thefather indicated that his son had an MRI two years prior, as well as another clinical EEG inrecent months, and that he wanted us to simply proceed with treatment. As neurofeed-back was performed the seizure frequency mildly decreased and then reached a plateau.After a dozen sessions it was suggested to the father that an MRI might still be a goodidea, and particularly since the university had just obtained a new MRI unit that had twoand a half times the resolution of the old one. The MRI revealed a tumor beneath thiselectrode site, and on closer examination of the older MRI they could perceive the fainterimage of the tumor, which did not appear to have increased in size. A month later thepatient underwent neurosurgery and on 6 year contact had never experienced anotherseizure. This case illustrates the importance of thorough medical evaluation and in havingqualified individuals interpret EEG and qEEG findings.
198 Gabriel Tan et al.

electrode sites proceeding systematically from where the amplitude of the
EEG and variability are the least toward electrode sites where the amplitude
and variability are greatest. Many anecdotal reports have been made of suc-
cessful treatment of uncontrolled epilepsy using LENS, including several
treated by one of the authors (D.C.H.). Advantages often cited for the use of
Figure 7.2 (See Color Plate Section) qEEG � Example 7.6.
199Neurofeedback and Epilepsy
15 Hz
1 Hz
–3 30 –3 30 –3 30 –3 30 –3 30
–3 30 –3 30 –3 30 –3 30 –3 30
–3 30 –3 30 –3 30 –3 30 –3 30
–3 30 –3 30 –3 30 –3 30 –3 30
–3 30 –3 30 –3 30 –3 30 –3 30
2 Hz 3 Hz 4 Hz 5 Hz
6 Hz 7 Hz 8Hz 9 Hz 10 Hz
11 Hz 12 Hz 13 Hz 14 Hz
16 Hz 17 Hz 18 Hz 19 Hz 20 Hz
21 Hz 22 Hz 23 Hz 24 Hz 25 Hz
Montage: Laplacian
Z transformed relative power FFT color maps
EEG ID:

LENS include the fact that it can be used with very young patients and indi-
viduals without the impulse control or stamina to do traditional neurofeed-
back and that treatment length often appears to be shortened by 35�40%.
See patient history example in Example 7.7.
OBSERVATIONS AND IMPLICATIONS FORFUTURE DIRECTION
This chapter has reviewed and provided an update on the state of the art
on neurotherapy and epilepsy. The meta-analysis published in 2009 con-
cluded that: “EEG operant conditioning was found to produce a signifi-
cant reduction in seizure frequency. This finding is especially noteworthy
given that the patients treated with neurotherapy often consisted of indivi-
duals who had been unable to control their seizures with medical treat-
ment” (Tan et al., 2009, p. 173).
Since then, there have been exciting new developments, including the
use of coherence training, the use of qEEG to guide the neurotherapy,
and the use of the Low-Energy Neurofeedback System. Particularly note-
worthy is the observation that neurotherapy has been able to help indivi-
duals who have been resistant to traditional pharmacotherapy.
Furthermore, the value of neurotherapy for epilepsy should be considered
from the perspective that this treatment has had minimal side effects as
compared to standard pharmacotherapy.
Despite its value, neurotherapy has not been widely accepted and
incorporated into the practice of mainstream medicine for the treatment
���
Example 7.7 Patient History: Example of Successful LENS Treatment
A 6-year-old male was brought for treatment of uncontrolled epilepsy and harsh dailyheadaches. He was on very significant doses of two anti-seizure medications and yet hewas still having an average of 10 absence seizures daily and a grand mal seizure onceevery 6�12 weeks. His eyes-closed qEEG showed excess 8�9 Hz activity that was mostprominent in the left hemisphere, particularly in fronto-temporal areas. He also demon-strated excess 18�30 Hz activity in frontal (F3�Fz�F4) and central areas. After two LENSsessions he reported “I hardly had any headaches” in the previous five days and he hadnot experienced any seizures. A total of 22 LENS sessions was done during which hislevel of seizure medication was reduced, and after the second session there were no fur-ther absence seizures observed and he was having only about one mild headache (thatdid not require medication) every 3�4 weeks. Improvements were stable at 3 monthfollow-up.
200 Gabriel Tan et al.

of epilepsy. More well-designed and large scale studies involving control
groups are clearly indicated. Comparative efficacy and cost�benefit analy-
sis research could help to further assess its value vis-a-vis traditional phar-
macotherapy. In this scenario, neurofeedback would be provided to
individuals as an alternative to pharmacotherapy rather than as a second
line treatment after pharmacotherapy has failed.
Future research should use qEEG to individualize and guide the selec-
tion of neurofeedback protocol, much as how it is being done in the treat-
ment of other medical conditions such as closed head injury. In the latter
case, a normative database has been developed to guide future treatment.
REFERENCESAndrews, D. J., & Schonfeld, W. H. (1992). Predictive factors for controlling seizures using
a behavioural approach. Seizure, 1(2), 111�116. doi:10.1016/1059-1311(92)90008-O.Ayers, M. E. (1988). Long-term clinical treatment follow-up of EEG neurofeedback for
epilepsy. Epilepsy Support Program Newsletter, 3(2), 8�9.Ayers, M. E. (1995). Long-term follow-up of EEG neurofeedback with absence seizures.
Biofeedback & Self-Regulation, 20(3), 309�310.Ayers, M.E. (2000). Personal communication.Collura, T. F. (2010). Advanced Brainmaster EEG Neurofeedback Practicum [DVD]. USA:
Future Health. Retrieved from www.futurehealth.org/populum/pageproduct.php?f=Advanced-BrainMaster-EEG-N-by-Futurehealth-081113-616.html#cartchoices.
Collura, T. F., Guan, J., Tarrant, J., Bailey, J., & Starr, F. (2010). EEG biofeedback casestudies using live Z-scores and a normative database. Journal of Neurotherapy, 14(1),22�46.
Cott, A., Pavloski, R. P., & Black, A. H. (1979). Reducing epileptic seizures throughoperant conditioning of central nervous system activity: Procedural variables. Science,203(4375), 73�75. doi:10.1126/science.758682.
Gehring, A., & Blaser, A. (1993). MMPI � Minnesota Multiphasic Personality Inventory.Deutsche Kurzform fur Handauswertung. 2. Aufl. Berne, Gottingen, Toronto, Seattle:Hans Huber.
Hammond, D. C. (2007). LENS: The low energy neurofeedback system. New York: HaworthPress.
Hansen, L. M., Trudeau, D. L., & Grace, D. L. (1996). Neurotherapy and drug therapy incombination for adult ADHD, personality disorder, and seizure disorder: A casereport. Journal of Neurotherapy, 2(1), 6�14. doi:10.1300/J184v02n01.
Hautzinger, M., Bailer, M., Worall, H., & Keller, F. (1994). Beck-Depressions-Inventar(Bearbeitung der deutschen Ausgabe). Berne: Hans Huber.
Holzapfel, S., Strehl, U., Kotchoubey, B., & Birbaumer, N. (1998). Behavioral psycho-physiological intervention in a mentally retarded epileptic patient with brain lesion.Applied Psychophysiology and Biofeedback, 23(3), 189�202. Retrieved from www.aapb.org/aapb_journal.html.
Hughes, J., Taber, J., & Fino, J. (1991). The effect of spikes and spike-free epochs ontopographic brain maps. Clinical EEG (Electroencephalography), 22(3), 150�160.
Iasemidis, I. D. (2003). Epileptic seizure prediction and control. IEEE Transactions onBiomedical Engineering, 50, 549�558. Retrieved from www.ieee.org/portal/site/iportals?WT.mc_id5tu_hp.
201Neurofeedback and Epilepsy

Ikeda, A., Terada, K., Mikuni, N., Burgess, R. C., Comair, Y., Taki, W., et al. (1996).Subdural recording of ictal DC shifts in neocortical seizures in humans. Epilepsia, 37(7),662�674. Retrieved from http://www.epilepsia.com/.
John, E. R., Prichep, L. S., & Easton, P. (1987). Normative databanks and neurometrics:Basic concepts, methods and results of norm construction. In A. Remond (Ed.),Handbook of electroencephalography and clinical neurophysiology (pp. 449�495).Amsterdam: Elsevier.
Kotchoubey, B., Strehl, U., Uhlmann, C., Holzapfel, S., Konig, M., Froscher, W., et al.(2001). Modification of slow cortical potentials in patients with refractory epilepsy:A controlled outcome study. Epilepsia (Series 4), 42(3), 406�416. Retrieved fromwww.epilepsia.com/.
Kraak, B., & Nord-Rudiger, D. (1989). Fragebogen zu Lebenszielen und zur LebenszufriedenheitGottingen, Toronto, Zurich: Hogrefe.
Krampen, G. (1991). Fragebogen zu Kompetenz- und Kontrolluberzeugungen. Gottingen,Toronto, Zurich: Hogrefe.
Lantz, D., & Sterman, M. B. (1988). Neuropsychological assessment of subjects withuncontrolled epilepsy: Effects of EEG feedback training. Epilepsia, 29(2), 163�171.Retrieved from www.epilepsia.com/.
Larsen, S. (2006). The healing power of neurofeedback: The revolutionary LENS technique forrestoring optimal brain function. Rochester, VT: Healing Arts Press.
Lubar, J. F., Shabsin, H. S., Natelson, S. E., Holder, G. S., Whitsett, S. F., Pamplin, W. E.,et al. (1981). EEG operant conditioning in intractable epileptics. Archives of Neurology,38(11), 700�704. Retrieved from http://archneur.ama-assn.org/.
Nelson, H. E. (1976). A modified card sorting test sensitive to frontal lobe defects. Cortex,12, 313�324.
Nuwer, M. R. (1988). Frequency analysis and topographic mapping of EEG and evokedpotentials in epilepsy. Electroencephalography & Clinical Neurophysiology, 69(2), 118�126.
Ochs, L. (2007). The low energy neurofeedback system (LENS): Theory, background,and introduction. Journal of Neurotherapy, 10(2-3), 5�39. doi:10.1300/J184v10n02.
Reicherts, M., & Perez, M. (1993). Fragebogen zum Umgang mit Belastung im Verlauf-UBV.Berne, Gottingen, Toronto, Seattle: Hans Huber.
Rockstroh, B., Elbert, T., Birbaumer, N., Wolf, P., Duchting-Roth, A., Reker, M., et al.(1993). Cortical self-regulation in patients with epilepsies. Epilepsy Research, 14(1),63�72.
Sterman, M. B. (1982). EEG biofeedback in the treatment of epilepsy: An overview circa1980. In L. White, & B. Tursky (Eds.), Clinical biofeedback: Efficacy and mechanisms(pp. 311�330). New York: Guilford Press.
Sterman, M. B. (2000). Basic concepts and clinical findings in the treatment of seizure dis-orders with EEG operant conditioning. Clinical Electroencephalography, 31(1), 45�55.Retrieved from www.ecnsweb.com/images/articles2000.htm#JANUARY%202000,%20Volume%2031.
Sterman, M. B., & Friar, L. (1972). Suppression of seizures in an epileptic following senso-rimotor EEG feedback training. Electroencephalography & Clinical Neurophysiology, 33(1),89�95. doi:10.1016/0013-4694(72)90028-4.
Sterman, M. B., Goodman, S. J., & Kovalesky, R. A. (1978). Effects of sensorimotor EEGfeedback training on seizure susceptibility in the rhesus monkey. ExperimentalNeurology, 62(3), 735�747. doi:10.1016/0014-4886(78)90281-9.
Sterman, M. B., Macdonald, L. R., & Stone, R. K. (1974). Biofeedback training of the sen-sorimotor electroencephalogram rhythm in man: Effects on epilepsy. Epilepsia, 15(3),395�416. Retrieved from www.epilepsia.com/.
202 Gabriel Tan et al.

Sterman, M. B., & Shouse, M. N. (1980). Quantitative analysis of training, sleep EEG andclinical response to EEG operant conditioning in epileptics. Electroencephalography andClinical Neurophysiology, 49(5-6), 558�576. doi:10.1016/0013-4694(80)90397-1.
Sterman, M. B., Wyrwicka, W., & Roth, S. R. (1969). Electrophysiological correlates andneural substrates of alimentary behavior in the cat. Annals of the New York Academy ofSciences, 157(2), 723�739. doi:10.1111/j.1749-6632.1969.tb12916.x.
Tan, G., Thornby, J., Hammond, D. C., Strehl, U., Canady, B., Arnemann, K., et al.(2009). Meta-analysis of EEG biofeedback in treating epilepsy. Clinical EEG andNeuroscience: Official Journal of the EEG and Clinical Neuroscience Society (ENCS), 40(3),173�179.
Thatcher, R. W., Biver, C. J., & North, D. M. (2007). Z-score EEG biofeedback:Technical foundations. Applied Neuroscience, Retrieved from http://www.appliedneur-oscience.com/Z%20Score%20Biofeedback.pdf.
Tozzo, C. A., Elfner, L. F., & May, J. G. (1988). EEG biofeedback and relaxation trainingin the control of epileptic seizures. International Journal of Psychophysiology, 6(3),185�194. doi:10.1016/0167-8760(88)90004-9.
Walker, J. E. (2008). Power spectral frequency and coherence abnormalities in patientswith intractable epilepsy and their usefulness in long-term remediation of seizuresusing neurofeedback. Clinical EEG & Neuroscience, 39(4), 203�205.
Walker, J. E., & Kozlowski, G. P. (2005). Neurofeedback treatment of epilepsy. Child& Adolescent Psychiatric Clinics of North America, 14(1), 163�176. doi:10.1016/j.chc.2004.07.009.
Witte, H., Iasemidis, L. D., & Litt, B. (2003). Special issue on epileptic seizureprediction. IEEE Transactions on Biomedical Engineering, 50, 537�539. doi:10.1109/TBME.2003.810708.
World Health Organization. (2009). Epilepsy: Etiology, epidemiology and prognosis. Retrievedfrom www.who.int/mediacentre/factsheets/fs999/en/index.html.
Wyrwicka, W., & Sterman, M. B. (1968). Instrumental conditioning of sensorimotor cor-tex EEG spindles in the walking cat. Physiology & Behavior, 3(5), 703�707.doi:10.1016/0031-9384(68)90139-X.
203Neurofeedback and Epilepsy

This page intentionally left blank

CHAPTER88Feedback of Slow CorticalPotentials: Basics, Application,and EvidenceSarah Wyckoff and Ute StrehlInstitute of Medical Psychology and Behavioral Neurobiology, University of Tubingen, Tubingen, Germany
Contents
Basics 206Technical and Training Requirements 209
Amplifiers 209Artifacts 210Electrode Application 211Training Protocol 211Introduction to SCP Feedback 214
Diagnosis and Evaluation 215Evidence Base and Indications 217
Epilepsy 217Attention Deficit Hyperactivity Disorder (ADHD) 219Migraines 220Other Applications 221
Conclusion 222References 222
Although it has been studied over the last 50 years, the investigation and
application of slow cortical potentials (SCP) as a method of brainwave
feedback has largely been restricted to the European neurofeedback com-
munity. The development of reliable and valid equipment and publication
of several meta-analyses demonstrating the clinical efficacy of SCP feed-
back has spurred new interest in this training modality. This chapter will
briefly discuss the origins of SCP activity, followed by a description of the
technical requirements. Then feedback, diagnosis, and evaluation require-
ments will be addressed. Finally, the chapter will conclude with a review
205Neurofeedback and Neuromodulation Techniques and ApplicationsDOI: 10.1016/B978-0-12-382235-2.00008-1
© 2011 Elsevier Inc.All rights reserved.

of the published research of SCP feedback and epilepsy, attention deficit/
hyperactivity disorder (ADHD), migraines, and beyond.
BASICS
The electrical activity of the brain has been under investigation for more
than a century. Canton (1875) first reported observing electrical currents
from the exposed brain surface of live animals with a galvanometer. Fifty
years later, Berger (1929) published his discovery of rhythmic alpha brain-
wave activity during the first known electroencephalographic recording of
a human subject. In their early experiments, both researchers reported dis-
tinct changes in electrical current during eyes-open, eyes-closed, and sleep
conditions. Electroencephalography (EEG), or monitoring and recording
of electrical brain activity with an electronic monitoring device, is cur-
rently used as a neurological diagnostic procedure and assessment tool in
cognitive behavioral and psychophysiological research. EEG activity
reflects the summation of excitatory and inhibitory postsynaptic potentials
in the pyramidal cells of the upper layers of the cerebral cortex, with
some contribution of granular and glial activity (for reviews, see Lopes da
Silva, 1991; Speckmann & Elger, 1999). Large field potentials, which can
be recorded on the scalp, are generated from the synchronous extracellular
current flow of neurons that have similar spatial orientation, radial to the
scalp, as well as by glial sources (Fellin et al., 2009).
EEG wave patterns are classified as synchronized or desynchronized
and are linked to specific recording tasks and distinct behavioral states.
According to Steriade, Gloor, Llinas, Lopes da Silva, and Mesulam (1990)
synchronized EEG activity reflects the occurrence of high-amplitude
oscillations of slow frequencies measured during a relaxed, eyes-closed
condition. According to their physiological model of rhythmic activity,
the intrinsic electrophysiological properties of thalamocortical neurons
allows them to oscillate within different frequency spectra; however, they
are subject to the controlling influence of the reticular thalamic nucleus
that unites individual discharges into simultaneous volleys within the
1�20 Hz frequency range. Desynchronized EEG activity signals the
replacement of synchronized rhythms with lower-amplitude oscillations of
faster frequencies measured during visual attention, eyes-open conditions.
The braking action of the reticular thalamic nucleus is mediated by
cholinergic projections from the brain stem to the thalamus and basal
forebrain. During desynchronization, acetylcholine is responsible for the
206 Sarah Wyckoff and Ute Strehl

direct excitation of thalamic relay neurons and the synaptic decoupling in
the thalamic generation of spindle activity, allowing neuronal ensembles
to fire freely (acceleration) in response to specific processing demands.
Spontaneous EEG rhythms are traditionally defined within conven-
tional frequency bands called delta (0.5�4 Hz), theta (4�7 Hz), alpha
(8�12 Hz), sensorimotor rhythm or SMR (12�15 Hz), beta (13�30 Hz),
and gamma (30�100 Hz). Direct current (DC) shifts of less than 1 Hz are
referred to as SCPs. Although embedded in oscillatory EEG activity, SCPs
do not occur spontaneously and belong to the family of event-related
potentials. DC potentials were observed by Canton (1875), but until
recently, the assessment of SCP was limited to only a few research labs in
Europe. Historically, most DC and low frequency activity have been
selectively omitted from EEG recordings, as they existed below the low
frequency cut-off of a majority of amplifiers. However, technological
advance has led to accessibility of DC-amplifiers capable of monitoring
frequencies as low as 0.01 Hz, renewing interest in SCP acquisition and
feedback.
As stated previously, SCPs belong to the family of event-related poten-
tials (ERPs). The common feature of brain potentials subsumed under
this category is that they are time-locked to a specific event. These events
may be external or internal and include physical stimuli, behavioral
responses, and cognitive and emotional processes. In order to detect these
deflections within the raw EEG, averaging techniques are required. The
timing of these responses reflects diverse aspects of brain communication
and information processing. ERPs can be observed from B50 to
1000 msec after the onset of a stimulus, and sub-divided into early and
late components on the basis of their latency and direction of deviance
(positive or negative). Early components occur at or before 100 msec, are
less sensitive to cognitive variables, and are determined by the physical
qualities of the stimulus including intensity and duration. The late com-
ponents, including the P300, occur after 200 msec and are influenced by
endogenous factors such as information processing.
SCPs are negative and positive polarizations in the EEG that last from
B300 ms to several seconds and the amplitudes may vary from several
microvolts (μV) to more than 100 μV (e.g., during seizures). The negative
polarizations of SCPs have received many labels depending upon the experi-
mental context in which they are observed. Walter and colleagues developed
a paradigm to elicit contingent negative variation (CNV; Walter, 1964;
Walter, Cooper, Aldridge, McCallum, & Winter, 1964). The CNV is a
207Feedback of Slow Cortical Potentials

wide and prolonged negative deflection, evoked by a GO/NO-GO para-
digm, contingent on an individual’s conscious perception of a warning stim-
ulus (S1) preceding another imperative stimulus (S2) that requires a specific
response. This activity is hypothesized to play a critical role in the prepara-
tory distribution of sensory, motor, and attentional resources.
In the late 1970s, Birbaumer and colleagues at the University of
Tubingen began developing a physiological model in which SCPs of EEG
reflected the threshold regulation mechanism of cortical activation and
inhibition. In simple terms, negative SCP shifts increase the firing proba-
bilities of a cell assembly, while positive SCP shifts inhibit this activity.
The exact mechanisms generating these slow potentials are still a matter of
controversy. Negative surface SCPs are hypothesized to result from a sink
caused by synchronous slow excitatory postsynaptic potentials in the apical
dendrites of layer I in the cortex with a source being located in layers IV
and V, while positive fluctuations are understood as an inhibition or abate-
ment of negativities reflecting the activity of large cell assemblies (review,
see Birbaumer, Elbert, Canavan, & Rockstroh, 1990). However, current
data suggest that the modulation of SCPs relies on the coordinated activ-
ity of neuronal and glial cell systems (Fellin et al., 2009). Astrocytes have
been found to modulate slow cortical oscillations by regulating, simulta-
neously inhibiting, NMDA and A1 synaptic receptor functions. Inhibition
of cortical synapses in NMDA receptors produces excitatory activity, or
hypofunction of postsynaptic receptors, thereby shortening the up-state
duration of cortical neurons (negativity). Conversely, the inhibition of A1
receptors results in the reduction of extracellular adenosine and loss of
tonic suppression of cortical synapses (positivity).
Regardless of the mechanism in charge of producing these slow corti-
cal oscillations, significant diurnal variation has been observed in animal
research suggesting that DC potentials fluctuate during the day in relation
to changes in arousal (Shinba, 2009). DC potentials recorded in the fron-
tal areas of the cerebral cortex referenced to the cerebellum were found
to be more positive during light periods (8am�8pm) than dark periods.
Spectral correlation and coherence analysis of resting-stated magnetoen-
cephalography (MEG) recordings revealed that ultraslow (,0.1 Hz) spon-
taneous power modulations are synchronous over large spatial distances,
mimicking the temporal-spatial properties of functional magnetic reso-
nance imaging (fMRI) signals (Liu, Fukunaga, de Zwart, & Duyn, 2010).
Dominant low frequency (,0.1 Hz) power fluctuations were observed in
both gamma (.30 Hz) and sub-gamma (,30 Hz) rhythms and were
208 Sarah Wyckoff and Ute Strehl

noticeably stronger during light sleep eyes-closed periods than during
awake eyes-open or eyes-closed conditions. These findings are in line
with the data indicating that negative SCP shifts, such as the
“Bereitschafts potential” (Kornhuber & Deecke, 1965) or the CNV
(Walter et al., 1964), indicate local excitatory mobilization, while positive
potentials indicate disfacilitation.
Several studies have found a consistent relationship between cortical
negativity and reaction time, signal detection, and short-term memory
performance (review, see Birbaumer et al., 1990; Birbaumer, 1999).
Therefore, SCPs have been conceptualized as a tuning mechanism in atten-
tional regulation, and the self-regulation of SCPs hypothesized as a plausible
treatment for disorders characterized by impaired excitation thresholds. In a
series of experiments, the ability to self-regulation SCP shifts was investi-
gated. Findings indicated that both healthy and clinical patient populations
were able to learn self-regulation of negative and positive SCP shifts over
central electrode sites (Birbaumer, Roberts, Lutzenberger, Rockstroh, &
Elbert, 1992; Holzapfel, Strehl, Kotchoubey, & Birbaumer, 1998;
Schneider, Heimann, Mattes, Lutzenberger, & Birbaumer, 1992; Schneider,
Rockstroh et al., 1992; Siniatchkin, Kropp, & Gerber, 2000) as well as
demonstrate simultaneous control over right�left-hemispheric differences
(Birbaumer et al., 1988; Gruzelier, Hardman, Wild, & Zaman, 1999).
TECHNICAL AND TRAINING REQUIREMENTS
As stated earlier, accessibility of devices capable of recording, analyzing,
and providing feedback of SCPs signals has been limited to a handful of
research labs for the past few decades. However, recent advancements in
DC amplifiers, electrodes, signal processing, and artifact controls have
improved the recording quality of very slow EEG signals. The next sec-
tion presents the common technical standards and training procedures
necessary for SCP feedback.
AmplifiersHistorically, frequencies in the range of zero to 1�2 Hz have been omitted
from EEG recordings as the result of high-pass low frequency filtration in
an effort to minimize the impact of physiological, mechanical, electrical,
and chemical artifacts. However, the recording of SCPs requires a high-
pass filter that allows the registration of very low frequencies (,0.01 Hz).
209Feedback of Slow Cortical Potentials

Because SCP shifts are very slow, a time constant of at least 10 seconds and
a data sampling rate of 128 Hz (cycles per second) or greater is required.
DC amplifiers do not omit any of these ultra-low frequencies and are ideal
for capturing SCP data. Nevertheless, it is important to note that, to date,
the majority of SCP research conducted has employed low frequency AC
amplifiers with a low frequency cutoff of 0.01 Hz.
ArtifactsThe inclusion of DC components in EEG recordings results in several
challenges, as slow cortical activity is highly susceptible to artifact contam-
ination from a variety of sources. EEG artifacts consist of potential shifts
that do not originate from the brain, although some activity can easily be
mistaken for legitimate EEG. Therefore artifact control is paramount in
the acquisition of “clean” and “noise-free” data. Artifacts can be mini-
mized in a variety of ways.
Eye blinks and horizontal or vertical movements are among the most
common and recognizable artifacts occurring in EEG recordings. Because
the eye acts as a dipole and produces a significant source of artifact in
SCP signals, measurement of electromyography (EOG) components are
essential. Eye movements lead to changes in polarity as the result of elec-
trical potentials generated in the neurons of the retina. In fact, eye posi-
tion alone produces DC signals that influence baseline EEG values;
upward gazes shift the baseline upward and downward gazes shift the
baseline down (Saab, 2009). During blinks, the eyelid picks up the posi-
tive charge of the cornea and generates a positive potential. These artifacts
negatively impact the EEG recording, with frontal electrode sites being
the most susceptible to contamination. To control these artifacts, reduce
signal distortion, and limit inaccurate feedback, several EOG electrodes
are placed around the eye. For the detection of horizontal eye-movements
electrodes are attached 1.5 cm lateral to the outer canthus of each eye.
Two additional electrodes are applied to detect vertical eye-movement
and attached 3 mm above the middle of the left eyebrow and 1.5 cm
below the middle of the left lower eye-lid. Online correction of ocular
potentials can then be subtracted from the EEG signal through the use of
several different algorithms (Kubler, Winter, & Birbaumer, 2003;
Schlegelmilch, Markert, Berkes, & Schellhorn, 2004).
Body movement is another source of artifact in EEG recordings.
Swallowing, tongue movements, and respiration may produce slow
210 Sarah Wyckoff and Ute Strehl

low-frequency artifacts while postural changes, muscle contractions, and
tension may produce high-frequency artifacts. In order to reduce artifact,
patients are instructed to relax, minimize movements, and breathe at a
consistent rate and volume. Despite this, artifacts originating from the
frontalis, orbicularis, and temporalis muscles may still be present. To pre-
vent reinforcement of physiological or muscle induced SCP shifts, thresh-
old detection algorithms may be applied to identify “invalid” training
trials generating amplitudes of 200 μVor greater.
Finally, DC drifts may be produced by changes in skin resistance caused
by perspiration and electrode polarization. Electrode polarization reflects
the electro-chemical reaction of the electrode, conductive medium, and the
scalp. Once the electrodes are attached to the scalp, ions move across the
conductive boundary and accumulate a charge. Electrode voltage stabilizes
after a few minutes and should be similar across all electrode sites.
Variability in electrode voltage generates an unstable signal, with slow
potentials derived from artifacts, which are recorded along with the EEG.
These DC drifts can be minimized through thorough cleansing and prepa-
ration of the electrode site, use of special electrodes, and development of a
light and temperature control assessment environment.
Electrode ApplicationIn neurofeedback paradigms, SCPs are recorded at the vertex (Cz) and
referenced to one or both mastoids depending on device requirements. In
addition to the active and reference electrodes, a ground sensor and two
to four EOG electrodes are used. An impedance of 5�10 kΩ can be
obtained by prepping the skin with alcohol, acetone, and/or abrasive
creams to remove excess oils, hair, and dead skin. To avoid DC drift, sin-
tered Ag/AgCl (silver/silver chloride) electrodes should be attached firmly
with an ample amount of conductive electrode paste containing sodium
chloride as the electrolyte.
Training ProtocolDuring SCP training sessions, patients are seated in a comfortable chair in
front of a notebook or desktop computer, with or without the clinician
present in the training room. Training of SCP self-regulation requires the
monitoring of two different brain states. The patients are cued by a
graphic symbol to “activate” or “deactivate” their brain (see Figure 8.1).
Each trial period lasts approximately 8 sec and is preceded by a 2 sec pas-
sive “resting” phase. The passive phase allows the patient to prepare for
211Feedback of Slow Cortical Potentials
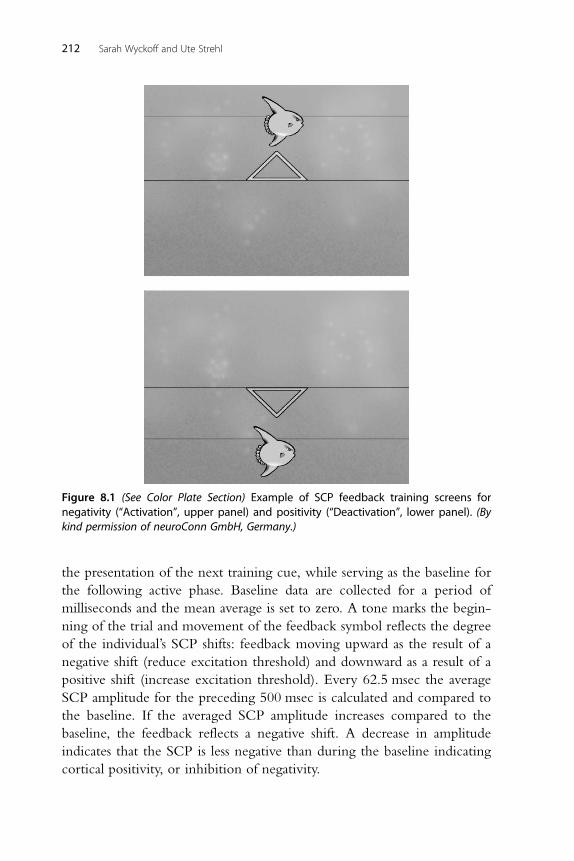
the presentation of the next training cue, while serving as the baseline for
the following active phase. Baseline data are collected for a period of
milliseconds and the mean average is set to zero. A tone marks the begin-
ning of the trial and movement of the feedback symbol reflects the degree
of the individual’s SCP shifts: feedback moving upward as the result of a
negative shift (reduce excitation threshold) and downward as a result of a
positive shift (increase excitation threshold). Every 62.5 msec the average
SCP amplitude for the preceding 500 msec is calculated and compared to
the baseline. If the averaged SCP amplitude increases compared to the
baseline, the feedback reflects a negative shift. A decrease in amplitude
indicates that the SCP is less negative than during the baseline indicating
cortical positivity, or inhibition of negativity.
Figure 8.1 (See Color Plate Section) Example of SCP feedback training screens fornegativity (“Activation”, upper panel) and positivity (“Deactivation”, lower panel). (Bykind permission of neuroConn GmbH, Germany.)
212 Sarah Wyckoff and Ute Strehl

Unlike traditional neurofeedback protocols that reward the regulation
of specific frequencies or ratios in one direction, SCP training rewards the
bi-directional regulation of two tasks, production of negative or positive
shifts. The capacity to train shifts in one direction is limited due to the
long time constant of SCP shifts and use of a relative baseline. For example,
patients may have an easier time producing a negative shift if the relative
baseline was already more positive. Therefore, it would be increasingly dif-
ficult to shift a potential into the same direction over a series of identical
tasks unless the patient was producing a shift in the opposite direction dur-
ing the baseline phase. For this reason, the distribution of required negative
and positive shifts is randomly set. During initial training blocks the task
distribution is set to 50/50. In advanced training phases the task distribu-
tion is adjusted to 30/70 according to the patient’s pathology and treatment
goals. Every train (1 to 3�4 trials) of identical tasks is followed by the
opposite task in random order. In addition to the immediate feedback suc-
cessful activation and deactivation is indicated with a visual reward (see
Figure 8.2). To generalize newly acquired regulation skills to everyday life
situations, 25% of all trials serve as “transfer trials” in which no feedback is
presented during the active phase but level of success is indicated with the
visual reward system following the trial (see Figure 8.2).
Feedback trials are grouped into three to five training blocks, each
followed by a short break. A typical session lasts one hour and consists of
100 to 120 trials. In research settings, the total number of SCP sessions is
typically 25 to 35, and training appointments are generally scheduled in
several blocks of intensive daily sessions (weekends off ), followed by a
Figure 8.2 (See Color Plate Section) Example of SCP transfer training screen fornegativity�activation task (left panel). Example of SCP visual feedback rewardfor successful activation or deactivation (right panel). (By kind permission ofneuroConn GmbH, Germany.)
213Feedback of Slow Cortical Potentials

4 week break every 10 sessions. During breaks patients practice SCP self-
regulation in everyday situations. To facilitate home training and generali-
zation of SCP regulation, patients are instructed to imagine producing the
positive and negative shifts and assisted with a visual of the training screen
via cue card or DVD. For example, ADHD children are encouraged to
focus on producing negative shifts to promote attention and focus while
working on homework, whereas individuals with epilepsy are urged to
practice self-regulation skills in the wake of seizure activity by trying to
shift their brain in an electrically positive direction. Current investigations
of SCP training in ADHD populations at the University of Tubingen are
examining the efficacy of a biweekly training schedule. Independent clini-
cians report that such “non-intensive” training schedules also facilitate
mastery of SCP self-regulation skills and behavior changes in their clients
in a clinical setting.
Introduction to SCP FeedbackAs with other neurofeedback and biofeedback modalities, the first session
focuses less on training techniques and regulation strategies and typically
serves as an information session and introduction to EEG. Patients are
provided with basic information on SCP training, the rational for treat-
ment specific to their pathology, and an explanation of the session proce-
dures. The training equipment is explained, and patients are invited to
handle the electrodes, touch the prepping gels and conductive pastes, and
customize the feedback options. In order to minimize the production of
artifacts in subsequent training session, once all the training electrodes and
EOG sensors are connected, patients are given the opportunity to view
and manipulate their physiological activity. Within a matter of moments,
patients begin to discover that their eye and tongue movements, muscle
contractions, and teeth clenching impact the EEG signal. During these
“experiments” the clinician explains how artifacts may produce the
desired SCP shifts but keep the patient from acquiring brain-driven self-
regulation skills.
Following the exercise in what “not” to do during the session, patients
are encouraged to relax their posture, minimize movement artifact, and
attempt to regulate their SCPs. Because the self-regulation of SCPs is
more difficult than the self-regulation of EEG frequencies, particularly
during early session blocks, the clinician should coach the patient and
provide as much positive reinforcement as possible. Patients are prompted
214 Sarah Wyckoff and Ute Strehl

to focus on the SCP shift during each trial and search for conscious strate-
gies that produce shifts in the desired direction. The goal is to help the
patient connect states of mental activation to positive and negative SCP
shift. In many patients, negative shifts are associated with activating
images, whereas positive shifts are associated with relaxation, disengage-
ment, and boredom. However, these strategies may not be effective in all
patients. Clinician assistance during the process of trial and error can be
realized by using a secondary screen and intercom system if the patient is
training in an adjacent room. Shaping procedures may be implemented to
facilitate the process of learning. Training thresholds can be utilized to
increase or decrease the degree of SCP shifts required for a successful trial.
Typically training sessions begin with minimal or no threshold. Once a
training strategy is identified and a patient builds self-regulation skills it
may be useful to increase thresholds during advanced sessions.
DIAGNOSIS AND EVALUATION
As previously stated, the self-regulation of SCPs is theorized as a plausible
treatment for disorders characterized by impaired excitation thresholds.
Apart from assessment procedures required for confirmatory diagnosis, no
specific evaluation of the EEG is necessary to begin SCP training.
However, documentation of pre-/post- core symptoms (e.g., behavioral,
personality variables, attention, seizure incidence, etc.) and changes in
cognitive processing are encouraged. Additionally, a continuous perfor-
mance test (CPT) can be implemented to assess changes in the latency
and amplitude of event-related potentials.
The training method is identical for all patients; only the task distribu-
tion is altered according to patient pathology and training goals. Review
of the session data following each session facilitates learning and develop-
ment of self-regulation strategies (see Figure 8.3). Variables of interest
include signal amplitudes, hit rates for task-specific trials, and differences
between negativities and positivities for both active feedback and transfer
conditions. Analysis of hit rate statistics indicates the percentages of time
patients are able to produce the required positive or negative shifts. The
hit rate distribution is less important than the differentiation between the
shifts of both tasks. For example, a patient may demonstrate good task dif-
ferentiation but be more successful in producing negative shifts rather
than positive shifts (see Figure 8.4). Conversely, a patient may demonstrate
a hit rate percentage of zero but demonstrate good differentiation. In this
215Feedback of Slow Cortical Potentials
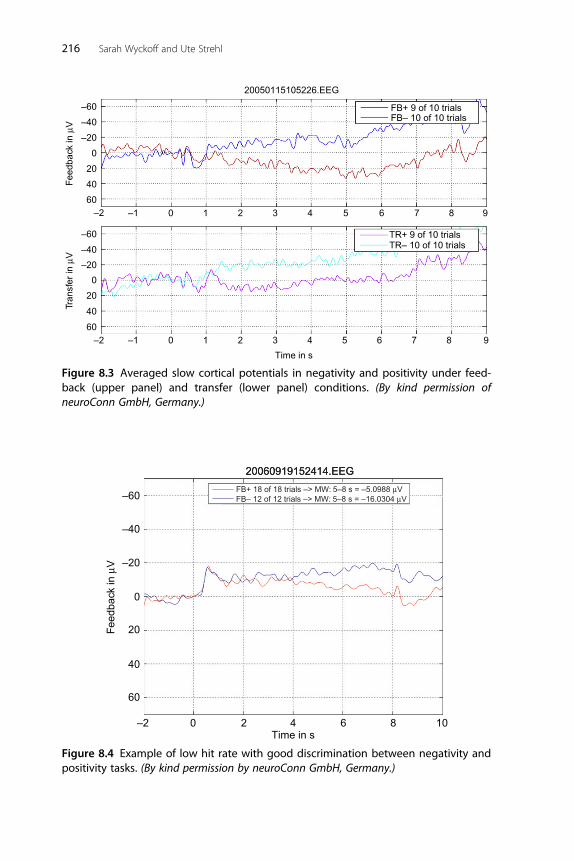
–60
20050115105226.EEG
FB+ 9 of 10 trialsFB– 10 of 10 trials
TR+ 9 of 10 trialsTR– 10 of 10 trials
–40
–20
Feed
back
in µ
VTr
ansf
er in
µV
0
20
40
60
–60
–40
–20
0
20
40
60
–2 –1 0 1 2 3 4 5 6 7 8 9
–2 –1 0 1 2 3 4 5 6 7 8 9
Time in s
Figure 8.3 Averaged slow cortical potentials in negativity and positivity under feed-back (upper panel) and transfer (lower panel) conditions. (By kind permission ofneuroConn GmbH, Germany.)
–2
–60
20060919152414.EEG
Feed
back
in µ
V
–40
–20
0
20
40
60
0 2 4Time in s
6 8 10
20060919152414.EEG
FB+ 18 of 18 trials –> MW: 5–8 s = –5.0988 µVFB– 12 of 12 trials –> MW: 5–8 s = –16.0304 µV
Figure 8.4 Example of low hit rate with good discrimination between negativity andpositivity tasks. (By kind permission by neuroConn GmbH, Germany.)
216 Sarah Wyckoff and Ute Strehl

case, the task differentiation is in the opposite training direction as the result
of the patient producing negativities when they are prompted to produce
positivities and vice versa (see Figure 8.5). This finding indicates that the
patient is capable of producing bi-directional shift changes, but requires
additional coaching and training to reverse the activation reactions.
EVIDENCE BASE AND INDICATIONS
Because SCP shifts reflect the threshold regulation mechanism of cortical
activation and inhibition, it has been applied as a treatment for disorders
characterized by impaired excitation thresholds. A majority of SCP feed-
back research has focused on treatment of epilepsy, ADHD, and migraine
populations. The next section presents the rationale for use of SCP feed-
back in these populations, as well as the major research findings to date.
EpilepsyIn patients with epilepsy, negative SCP shifts have been observed preceding
and during ictal discharges and positive SCP shifts following seizure termi-
nation (Ikeda et al., 1997). These and other findings from animal research
led researchers to conceptualize epilepsy as a problem in restraining the
20060705101556.EEG
–60
Feed
back
in µ
V
–40
–20
20
0
40
60
–2 0 2 4Time in s
6 8 10
FB+ 25 of 25 –> MW: 5–8 s = –10.4093 µVFB– 14 of 14 trials –> MW: 5–8 s = 17.1732 µV
Figure 8.5 Example of low hit rate for both tasks with good differentiation in theopposite training direction. (By kind permission of neuroConn GmbH, Germany.)
217Feedback of Slow Cortical Potentials

hyperactivation of neurons in which increased cortical negativity decreases
an individual’s threshold for paroxysmal activity. Therefore, it was hypothe-
sized that training epileptic patients to suppress negative SCPs (i.e., to pro-
duce positive shifts) would attenuate epileptic discharges resulting in
seizure frequency reduction (Birbaumer et al., 1991). To date, two multi-
center studies have shown that patients with epilepsy are able to learn self-
regulation of SCPs and as a result have significantly decreased incidence of
seizures (Kotchoubey et al., 2001; Rockstroh et al., 1993).
Rockstroh and colleagues (1993) investigated 25 patients with drug-
refractory epilepsies that participated in 28 sessions of SCP feedback in
which modulation of SCPs in both positive and negative directions was
rewarded. Eighteen patients continued to monitor seizure frequency dur-
ing a 1-year follow-up period, revealing that, compared to baseline levels,
seizure incidence was significantly lower during the follow-up period
(p ,0.01). Six patients reported post-treatment seizure frequency below
the 8 week median baseline values, seven showed seizure frequency
reductions, and five did not report changes in seizure incidence.
Kotchoubey and colleagues (2001) compared the impact of SCP feedback,
respiration training, and anticonvulsive medication treatment on seizure
frequency. Thirty-four patients participated in 35 sessions of SCP feed-
back in which modulation of positive and negative shifts were randomly
distributed. Cortical positivity was required in 50% of trials for the first
20 sessions and 67% for the last 15 sessions. Overall, significant seizure
reduction was reported for the SCP (p,0.05) and medication conditions
but not for the respiration training. For the SCP training group the over-
all seizure frequency rate decreased by one-third, the rate of simple partial
seizures decreased by one-half, and some patients became seizure-free.
Stability of SCP self-regulation was observed at 6 month follow-up and
seizure reduction was maintained at 12 month follow-up (Kotchoubey
et al., 2001; Strehl, Kotchoubey, Trevorrow, & Birbaumer, 2005).
In a meta-analysis of EEG biofeedback studies, indexed in online
research databases between 1970 and 2005, data on seizure frequency
changes related to treatment were assessed. The results indicated that
EEG operant conditioning of sensorimotor rhythm (SMR) or SCPs pro-
duced a significant (p,0.005) reduction in seizure frequency for patients
with treatment-resistant epilepsy (Tan et al., 2009). Following treatment,
an overall mean decreased seizure incidence was reported in all studies
and 74% of patients reported fewer weekly seizures in response to
neurofeedback.
218 Sarah Wyckoff and Ute Strehl

Attention Deficit Hyperactivity Disorder (ADHD)Rockstroh, Elbert, Lutzenberger, and Birbaumer (1990) observed impaired
regulation of SCPs in children with attentional problems. Children with
attention issues were only able to self-regulate SCPs during feedback trials
and showed reduced negativities in anticipation of a task. In a series of stud-
ies, Helps and colleagues investigated the distribution and function of very
low frequency networks (VLF; ,0.1 Hz) during resting state and rest-task
transitions in adolescents with and without ADHD. In DC-EEG record-
ings, ADHD children exhibited decreased resting state VLF power and
attenuated power during rest-task transitions, and this was significantly
different from controls (Helps et al., 2010). Attenuation of power was nega-
tively correlated with task performance, whereby participants who attenu-
ated least made more errors, had greater variability, and slower reaction
times. ADHD participants with high self-reported inattention showed sig-
nificantly less power in 0.06�0.2 Hz and 0.5�1.5 Hz frequency bands then
participants with low inattention and healthy controls (Helps, James,
Debener, Karl, & Sonuga-Barke, 2008). These findings support the
conceptualization of ADHD symptoms as the consequences of impaired
excitation threshold regulation, characterized by decreased cortical negativ-
ity. Therefore, it was hypothesized that training ADHD patients to augment
negative SCPs would increase the capacity to produce cortical activation
necessary for concentration and cognitive tasks.
Heinrich, Gevensleben, Freidsleder, Moll, and Rothenberger (2004)
investigated the neurophysiologic effects of SCP training in 13 children
(7�13 years old) with ADHD and 9 ADHD wait-listed controls.
Following 25 sessions of SCP training, participants had a 25% reduction in
ADHD symptomatology, a decrease of impulsivity errors and increase of
CNV during CPTassessment. Strehl, Leins, Goth, Klinger, and Birbaumer
(2006) proved that children with ADHD were able to regulate negative
shifts during feedback and transfer trials. Following 30 sessions of SCP
training the 23 participants (8�13 years old) had significant improvements
in behavioral, attention, and IQ scores, which remained stable over a
6 month follow-up. At a 2-year follow-up of these patients, all improve-
ments in behavior and attention remained stable and an additional signifi-
cant reduction of core ADHD symptoms and attention improvement were
observed (Gani, Birbaumer, & Strehl, 2008). SCP self-regulation skills
were preserved and half of the children no longer met criteria for ADHD.
In a controlled evaluation of SCP neurofeedback compared to group
treatment for ADHD, the 17 participants (M5 10.5 years old) in the SCP
219Feedback of Slow Cortical Potentials

training group underwent 30 sessions and showed greater improvement
on parent and teacher rating scales in areas of cognition and attention
than their group therapy peers (Drechsler et al., 2007). The group therapy
program was based on the principles of cognitive behavioral therapy and
comprised components of social skill training, self-management, metacog-
nitive skill training, and enhancement of self-awareness. Investigation of
specific and non-specific factors influencing the behavioral improvements
revealed that effective parental support and the ability to self-regulate
SCPs in transfer conditions had moderate effects on positive training out-
comes. Gevensleben et al. (2009) compared a combined neurofeedback
training protocol to a computerized attention skills training program
within an ADHD population (M5 9.1 years old). The 59 participants in
the combined neurofeedback condition participated in counter balanced
blocks of theta/beta and SCP training sessions (36 sessions total).
Comparable effects were observed for both neurofeedback protocols dur-
ing intermediate and post-training assessment, both indicating improve-
ments in parent and teacher behavior ratings scales compared to the
computerized attention skills training group. In a meta-analysis of research
focused on neurofeedback treatment of ADHD in child populations, a
large effect size was found for training (both frequency and SCP training)
on impulsivity and inattention in controlled studies and those using pre-
and post-designs (Arns, de Ridder, Strehl, Breteler, & Coenen, 2009).
MigrainesWelch and Ramadan (1995) hypothesized that disordered mitochondrial
oxidative phosphorylation and decreased intracellular free magnesium in
the brain and body tissue of migraine patients produce instability of neu-
ronal functions due to neuronal hyperexcitability. Migraines patients
appear to produce increased CNV amplitudes and reduced habituation
compared to healthy controls (review, see Kropp, Siniatchkin, & Gerber,
2002). Stronger negativity of the CNV apparently results in greater gen-
eral allocation of attentional and mental resources to tasks in a migraine
population. Therefore, it was hypothesized that training migraine patients
to suppress negative SCPs (i.e., to produce positive shifts) would attenuate
cortical excitation resulting in a reduction of migraine frequency and
intensity.
Siniatchkin, Hierundar and colleagues (2000) investigated the clinical
efficacy of SCP training in children with migraines. Ten children suffering
220 Sarah Wyckoff and Ute Strehl

with migraines were compared with 10 healthy controls and 10 wait-listed
migraine sufferers. During the initial two sessions, migraine sufferers dem-
onstrated an impaired ability to regulate negative shifts, especially during
the transfer trails. However, following 10 sessions of SCP feedback no sig-
nificant difference in self-regulation mastery was observed compared to
healthy controls, and the migraine patients showed a significant reduction
in CNV amplitudes and reported significant reductions in the number of
days with migraine or other headache activity.
Other ApplicationsAlthough there are no treatment studies of SCP feedback in other clinical
conditions, there are several studies that indicate other clinical populations
are capable of learning to self-regulate SCP activity. Accordingly, clini-
cians may wish to use the SCP protocol with other conditions that are
characterized by impaired regulation of excitation thresholds. Gruzelier
et al. (1999) and Schneider, Rockstroh et al. (1992) demonstrated that
although schizophrenic patients showed impaired regulation of SCPs dur-
ing initial feedback sessions, they were able to reduce negative SCP shifts
simultaneously over right�left hemispheres and central electrode sites fol-
lowing 10 to 20 treatment sessions. Additional research by Schneider and
colleagues indicated that male inpatients with alcohol dependence (1993),
bipolar disorder, and major depression (Schneider, Heimann et al., 1992)
also were able to regulate required negativity and negativity suppression
following 5 to 20 SCP treatment sessions. Independent SCP clinicians
also have reported positive treatment outcomes with Gilles de la Tourette’s
syndrome, autism, and dyslexia. These case reports and findings are encour-
aging; however, further research is needed.
Patients suffering from diseases leading to severe or total motor paraly-
sis and loss of communication ability may also benefit from SCP training.
Patients who are completely paralyzed but maintain sensory and cognitive
functions are said to have “locked-in syndrome”. The locked-in state may
result from stroke, brain lesions and tumors, brain injuries, or degenerative
neuromuscular diseases such as amyotrophic lateral sclerosis (ALS) or Lou
Gehrig’s disease. Self-regulation of positive and negative SCP shifts can be
used to control a cursor on a computer screen required to select letters or
words, and is often referred to as “brain�computer communication”
(Kubler et al., 2001). This area of SCP research focuses on maintenance
221Feedback of Slow Cortical Potentials

of communication and enhanced quality of life for patients with total
paralysis.
CONCLUSION
In conclusion, there is a growing interest in SCP feedback due to devel-
opments in DC-EEG recording equipment and analysis software. SCPs
are very slow shifts of brain activity with a time constant of up to several
seconds. These shifts are either positive or negative and reflect regulation
of cortical excitation thresholds. Management of DC-EEG specific arti-
facts and strict training requirements are necessary to ensure the acquisi-
tion of valid SCP data and to maximize the clinical outcomes. Research
findings and clinical application of SCP feedback in epilepsy, ADHD, and
migraine populations have been positive and demonstrated efficacy.
Reported side effects are similar to those encountered with other neuro-
feedback and biofeedback modalities and include headache, fatigue, spaci-
ness, and feelings of agitation or irritability (Hammond & Kirk, 2008).
These feelings are generally transient and pass shortly following training
sessions. Proper training and supervision, adherence to standards of prac-
tice, and an open patient�clinician dialogue can help to reduce these neg-
ative training effects. Additional clinical trials and controlled studies now
are needed to validate SCP feedback as a treatment method for an even
broader range of conditions and populations.
REFERENCESArns, M., de Ridder, S., Strehl, U., Breteler, M., & Coenen, A. (2009). Efficacy of neuro-
feedback treatment in ADHD: The effects on inattention, impulsivity and hyperacti-vity: A meta-analysis. Clinical EEG and Neuroscience, 40(3), 180�189.
Berger, H. (1929). Uber das Elektrenkephalogramm des Menschen, 1st report. Archiv furPsychiatrie und Nervenkrankheiten, 87, 527�570.
Birbaumer, N. (1999). Slow cortical potentials: Plasticity, operant control, and behavioraleffects. The Neuroscientist, 5, 74�78.
Birbaumer, N., Elbert, T., Canavan, A., & Rockstroh, B. (1990). Slow potentials of thecerebral cortex and behavior. Physiological Reviews, 70, 1�41.
Birbaumer, N., Elbert, T., Rockstroh, B., Daunm, I., Wolf, P., & Canavan, A. (1991).Clinical-psychological treatment of epileptic seizures: A controlled study. In A. Ehlers(Ed.), Perspectives and promises in clinical psychology (pp. 81�96). New York: PlenumPress.
Birbaumer, N., Lang, P., Cook, E., Elbert, T., Lutzenberger, W., & Rockstroh, B. (1988).Slow brain potentials, imagery and hemispheric differences. International Journal ofNeuroscience, 39, 101�116.
222 Sarah Wyckoff and Ute Strehl

Birbaumer, N., Roberts, L., Lutzenberger, W., Rockstroh, B., & Elbert, T. (1992). Area-specific self-regulation of slow cortical potentials on the sagittal midline and its effectson behavior. Electroencephalography and Clinical Neurophysiology, 84, 353�361.
Canton, R. (1875). The electric currents of the brain. British Medical Journal, 2, 278.Drechsler, R., Straub, M., Doehnert, M., Heinrich, H., Steinhausen, H. C., & Brandeis, D.
(2007). 1 Controlled evaluation of a neurofeedback training of slow cortical potentials inchildren with attention deficit/hyperactivity disorder (ADHD). Behavioral and BrainFunctions, 3, 35.
Fellin, T., Halassa, M. M., Terunuma, M., Succol, F., Takano, H., Frank, M., et al. (2009).Endogenous nonneuronal modulators of synaptic transmission control cortical slowoscillations in vivo. Proceedings of the National Academy of Sciences of the United States ofAmerica, 106(35), 15037�15042.
Gani, C., Birbaumer, N., & Strehl, U. (2008). Long-term effects after feedback of slowcortical potentials and of theta-beta-amplitudes in children with attention-deficit/hyperactivity disorder (ADHD). International Journal of Bioelectromagnetism, 10(4),209�232.
Gevensleben, H., Holl, B., Albrecht, B., Vogel, C., Schlamp, D., Kratz, O., et al. (2009).Is neurofeedback an efficacious treatment for ADHD? A randomized controlled clini-cal trial. Journal of Child Psychology and Psychiatry, 50(7), 780�789.
Gruzelier, J., Hardman, E., Wild, J., & Zaman, R. (1999). Learned control of slowpotential interhemispheric asymmetry in schizophrenia. International Journal ofPsychophysiology, 34, 341�348.
Hammond, D. C., & Kirk, L. (2008). First, do no harm: Adverse effects and the need forpractice standards in neurofeedback. Journal of Neurotherapy, 12(1), 79�88.
Heinrich, H., Gevensleben, H., Freidsleder, F. J., Moll, G. H., & Rothenberger, A.(2004). Training of slow cortical potentials in ADHD: Evidence for positive behav-ioral and neurophysiological effects. Biological Psychiatry, 55, 772�775.
Helps, S. K., Broyd, S. J., James, C. J., Karl, A., Chen, W., & Sonuga-Barke, E. J. (2010).Altered spontaneous low frequency brain activity in attention deficit/hyperactivitydisorder. Brain Research, 31(1322), 134�143.
Helps, S. K., James, C., Debener, S., Karl, A., & Songura-Barke, E. J. S. (2008). Very lowfrequency EEG oscillations and the resting brain in young adults: A preliminary studyof localization, stability and association with symptoms of inattention. Journal of NeuralTransmission, 115, 279�285.
Holzapfel, S., Strehl, U., Kotchoubey, B., & Birbaumer, N. (1998). Behavioral psycho-physiological intervention in a mentally retarded epileptic patient with a brain lesion.Applied Psychophysiology and Biofeedback, 23, 189�202.
Ikeda, A., Yazawa, S., Kunieda, T., Araki, K., Aoki, T., Hattori, H., et al. (1997). Scalp-recorded, ictal focal DC shift in a patient with tonic seizure. Epilepsia, 38(12),1350�1354.
Kornhuber, H., & Deecke, L. (1965). Hirnpotentilanderungen bei Willkurbewegungenund passiven Bewegungen de Menschen. Bereitschaftspotential und reafferente Potentiale,Pflugers Archiv, 284, 1�17.
Kotchoubey, B., Strehl, U., Uhlmann, C., Holzapfel, S., Konig, M., Froscher, W., et al.(2001). Modulation of slow cortical potentials in patients with refractory epilepsy:A controlled outcome study. Epilepsia, 42(3), 406�416.
Kropp, P., Siniatchkin, M., & Gerber, W. D. (2002). On the pathophysiology ofmigraine � links for “empirically based treatment” with neurofeedack. AppliedPsychophysiology and Biofeedback, 27(3), 203�213.
Kubler, A., Neumann, N., Kaiser, J., Kotchoubey, B., Hinterberger, T., & Birbaumer, N. P.(2001). Brain-computer communication: Self-regulation of slow cortical potentials forverbal communication. Archives of Physical and Medical Rehabilitation, 82(11), 1533�1539.
223Feedback of Slow Cortical Potentials

Kubler, A., Winter, S., & Birbaumer, N. (2003). The thought translation device: Slowcortical potential biofeedback for verbal communication in paralyzed patients. In M.Schwartz, & F. Andrasik (Eds.), Biofeedback: A practitioner’s guide (3rd ed.,pp. 471�481). New York: Guilford.
Liu, Z., Fukunaga, M., de Zwart, J. A., & Duya, J. H. (2010). Large scale spontaneousfluctuations and correlates in brain electrical activity observed with magnetoencepha-lography. Neuroimage, 51(1), 102�111.
Lopes da Silva, F. (1991). Neural mechanism underlying brain waves: From neural mem-branes to networks. Electroencephalography and Clinical Neurophysiology, 79, 81�93.
Rockstroh, B., Elbert, T., Birbaumer, N., Wolf, P., Duchting-Roth, A., Reker, M., et al.(1993). Cortical self-regulation in patients with epilepsies. Epilepsy Research, 14,63�72.
Rockstroh, B., Elbert, T., Lutzenberger, W., & Birbaumer, N. (1990). Biofeedback:Evaluation and therapy in children with attentional dysfunctions. In A. Rothenberger(Ed.), Brain and behavior in child psychiatry (pp. 345�355). Berlin: Springer.
Saab, M. (2009, January). DC-EEG in psychophysiology applications: A technical andclinical overview. NeuroConnections Newsletter, 7�18.
Schlegelmilch, F., Markert, S., Berkes, S., & Schellhorn, K. (2004). Online ocular artifactremoval for DC-EEG-signals: Estimation of DC-level. Biomedizinische Technik,Efganzungsband 2, Band, 49, 340�341.
Schneider, F., Heimann, H., Mattes, R., Lutzenberger, W., & Birbaumer, N. (1992). Self-regulation of slow cortical potentials in psychiatric patients: Depression. BiofeedbackSelf Regulation, 17(3), 203�214.
Schneider, F., Rockstroh, B., Heimann, H., Lutzenberger, W., Mattes, R., Elbert, T.,et al. (1992). Self-regulation of slow cortical potentials in psychiatric patients:Schizophrenia. Biofeedback Self Regulation, 17(4), 277�292.
Shinba, T. (2009). 24-h profiles of direct current brain potential fluctuation in rats.Neuroscience Letters, 465, 104�107.
Siniatchkin, M., Hierundar, A., Kropp, P., Kuhnert, R., Gerber, W. D., & Stephani, U.(2000). Self-regulation of slow cortical potentials in children with migraine: Anexploratory study. Applied Psychophysiology and Biofeedback, 25(1), 12�32.
Siniatchkin, M., Kropp, P., & Gerber, W. D. (2000). Neurofeedback � The significance ofreinforcement and the search for an appropriate strategy for the success of self-regulation. Applied Psychophysiology and Biofeedback, 25(3), 167�175.
Speckmann, E. J., & Elger, C. E. (1999). Introduction to the neurophysiological basis ofthe EEG and DC potentials. In E. Niedermeyer, & F. Lopes da Silva (Eds.),Electroencephalography: Basic principles, clinical applications, and related fields (4th ed.,pp. 13�27). Baltimore, MD: Williams & Wilkins.
Steriade, M., Gloor, P., Llinas, R. R., Lopes da Silva, F., & Mesulam, M. M. (1990). Basicmechanisms of cerebral rhythmic activities. Electroencephalography and ClinicalNeurophysiology, 76, 481�508.
Strehl, U., Kotchoubey, B., Trevorrow, T., & Birbaumer, N. (2005). Predictors of seizurereduction after self-regulation of slow cortical potentials as a treatment of drug-resistant epilepsy. Epilepsy & Behavior, 6, 156�166.
Strehl, U., Leins, U., Goth, G., Klinger, C., & Birbaumer, N. (2006). Physiological regula-tion of slow cortical potentials-a new treatment for children with ADHD. Pediatrics,118(5), 1530�1540.
Tan, G., Thornby, D., Hammond, D. C., Strehl, U., Canady, B., Arnemann, K., et al.(2009). Meta-analysis of EEG biofeedback in treating epilepsy. Clinical EEG andNeuroscience, 40(3), 173�179.
Walter, W. G. (1964). The contingent negative variation: An electrical sign of significantassociation in the human brain. Science, 146, 434.
224 Sarah Wyckoff and Ute Strehl

Walter, W. G., Cooper, R., Aldridge, V. J., McCallum, W. C., & Winter, A. L. (1964).Contingent negative variation: An electric sign of sensorimotor association and expec-tancy in the human brain. Nature, 203, 380�384.
Welch, K. M. A., & Ramadan, N. M. (1995). Mitochondria, magnesium and migraine.Journal of Neurological Sciences, 134, 9�14.
225Feedback of Slow Cortical Potentials

This page intentionally left blank
CHAPTER99Real-Time Regulation andDetection of Brain States fromfMRI SignalsRanganatha Sitaram1, Sangkyun Lee1,2, Sergio Ruiz1,2,4, andNiels Birbaumer1,31Institute of Medical Psychology and Behavioral Neurobiology, University of Tubingen, Tubingen,Germany2Graduate School of Neural and Behavioral Sciences, International Max Planck Research School,Tubingen, Germany3Ospedale San Camillo, Istituto di Ricovero e Cura a Carattere Scientifico, Venezia � Lido, Italy4Department of Psychiatry, Faculty of Medicine, Pontificia Universidad Catolica de Chile, Santiago, Chile
Contents
Introduction 227Historical Development of Real-Time fMRI 228Overview of the fMRI�BCI system 232
Signal Acquisition 232Pre-processing 233Signal Analysis 234Feedback Generation 237
fMRI�BCI in Research and Clinical Treatment 238fMRI�BCI Studies in Healthy Populations 238fMRI�BCI Studies in Clinical Populations 244
Conclusions 248References 249
INTRODUCTION
Functional magnetic resonance imaging (fMRI) allows non-invasive
assessment of brain function with high spatial resolution and whole brain
coverage, by measuring changes of the blood oxygenation level-
dependent (BOLD) signal. Although the BOLD response is an indirect
measure of neural activity, there is accumulating evidence suggesting the
close coupling between BOLD and electrical activity of the neurons
227Neurofeedback and Neuromodulation Techniques and ApplicationsDOI: 10.1016/B978-0-12-382235-2.00009-3
© 2011 Elsevier Inc.All rights reserved.

(Logothetis, 2008). It is postulated that the combined effect of increases
and decreases in deoxygenated hemoglobin content resulting from
changes in cerebral blood volume, cerebral blood flow, and oxygen
metabolism following neural firing results in the BOLD signal (Buxton,
Uludag, Dubowitz, & Liu, 2004). fMRI data typically consist of time-
series of several hundred 3D images across the brain over a period of
time, with each image acquired every few seconds. fMRI usability and
applications have been somewhat limited by the offline mode of data anal-
ysis, due to the large size of the data, very intensive computation involved
in preprocessing and analysis of fMRI images. Fortunately, innovations in
high-performance magnetic resonance scanners and computers, combined
with developments in techniques for faster acquisition, processing, and
analysis of MR images, have burgeoned a fresh round of developments in
fMRI methodology for scientific research and clinical treatment. Real
time fMRI (rtfMRI) permits simultaneous measurement and observation
of brain activity during an ongoing task. Online single subject preproces-
sing and statistical analysis of functional data is now possible within a single
repetition time (TR), of 1.5�2 s. Novel applications based on rtfMRI have
been developed in the last decade, including fMRI data quality assessment,
neurosurgical monitoring, and neurofeedback for self-regulation of brain
activity. Adding to the above developments are more recent advances in
multivariate pattern classification of fMRI signals based on which brain
activations in a whole neural network, rather than just a single brain region,
could be potentially decoded and modulated (LaConte et al., 2007; Sitaram
et al., 2010). Here, we first review historical developments in rtfMRI, fol-
lowed by an overview of a fMRI Brain�Computer Interface (fMRI�BCI)
system for enabling decoding and self-regulation of brain activity, and finally
discuss the results of several studies on healthy individuals and patient popu-
lations for clinical treatment of neuropsychological disorders.
HISTORICAL DEVELOPMENT OF REAL-TIME fMRI
Functional imaging experiments typically follow a serial procedure in
which fMRI images are first acquired from one or more participants per-
forming the tasks under investigation, followed by an offline procedure of
signal preprocessing of the images and statistical mapping that may take
several days. This sequential processing approach has initially developed
due to the large size of data generated in neuroimaging experiments,
228 Ranganatha Sitaram et al.

whose processing and analyses incurred high computational costs.
However, it is to be admitted that lack of online implementation of fMRI
preprocessing and analysis could limit its applicability and usability in sev-
eral ways.
First, experimenters cannot monitor data quality during scanning in
the absence of online processing. Considering the high cost of MRI scan-
ning, a system for monitoring of data quality is useful for saving the costs
and efforts to obtain good quality data. If an investigator can detect arti-
facts correlated to the stimulus in real-time, such as head motion or other
physiological artifacts, it enables him or her to re-acquire the data imme-
diately. Furthermore, in the absence of online analysis, it is hard to modify
an experimental design based on the physiological and behavioral changes
of the participant. These limitations were first overcome by the pioneer-
ing work of Cox and colleagues.
Cox and colleagues (Cox, Jesmanowicz & Hyde, 1995) first proposed
a method to analyze brain activation in real-time by computing correla-
tion between a voxel’s BOLD signal and a reference time-series of the
experimental design in a recursive manner to reduce the computational
demands. Statistical maps of the brain were obtained in real-time by col-
oring voxels that show higher correlations than a user-specified threshold.
However, this method did not yet correct for non-specific noise originat-
ing in the scanning instrument. Voyvodic (1999) reported an approach to
improve the flexibility of the experimental paradigm with a software pro-
gram for accurate, real-time paradigm control and online fMRI analysis.
The paradigm control included simultaneous presentation of stimuli, auto-
matic synchronization to an fMRI scanner, and monitoring of a variety of
physiological and behavioral responses. The online analysis performed
MR image reconstruction, head motion correction in the translational
motion, and statistical tests for block or event-related design. Since then,
many studies have improved the image acquisition process in terms of
data quality, speed, and statistical power (Gao and Posse, 2003; Posse et al.,
1999, 2001, 2003; Weiskopf et al., 2005; Yoo et al., 1999) and algorithms
(Bagarinao et al., 2003; Cox & Savoy, 2003; Cox et al., 1995; Cox &
Jesmanowicz, 1999; Gao & Posse 2003; Gembris, Taylor, Schor, Frings,
Suter, & Posse, 2000; LaConte et al., 2007; Sitaram et al., 2010; Smyser
et al., 2001; Voyvodic, 1999).
Further developments in multiecho echo-planar imaging (mEPI)
increased the functional contrast-to-noise ratio (CNR) by sampling multi-
ple echoes in a single shot of radio frequency (RF) pulse (Posse et al.,
229Real-Time Regulation and Detection of Brain States from fMRI Signals

1999). This method is suitable for rtfMRI as it allows the detection of
small signal changes within each echo (of 30�40 ms in a 3T scanner).
Adaptive multi-resolution EPI (Panych & Jolesz, 1994) achieved high spa-
tial and/or temporal resolution in regions of functional activations distrib-
uted throughout the brain by selectively detecting those regions with RF
encoding in multiple stages. Such a method can zoom into the regions of
activations while ignoring quiescent regions. Yoo and his colleagues (Yoo
et al., 1999) implemented a real-time adaptive acquisition system with a
multi-resolution EPI to extract signals from cortex and allow more effi-
cient data acquisition time.
Another notable improvement in imaging was in removing magnetic
susceptibility artifacts. Due to the differences in magnetic susceptibilities
of different imaged parts, such as air, bone, different brain tissues, the
static magnetic field is not homogenous near borders of two brain regions.
Particularly, in air�tissue interfaces such as the regions of the basal brain
and frontal sinuses greater geometric distortions occur. When one radio-
frequency excitation pulse is applied to a slice in single-shot imaging and
a read-out time (TRO) of about 10�40 ms is used to encode the slice, the
inhomogeneities cause local shifts near the air�tissue interfaces (the mis-
alignment of the functional images to wrong anatomical structure) in the
resonance frequency (1/TRO5 25�100 Hz). Several methods (Andersson,
Hutton, Ashburner, Turner, & Friston, 2001; Jezzard & Balaban, 1995;
Kybic et al., 2000; Studholme, Constable, & Duncan, 2000; Zaitsev,
Hennig, & Speck, 2004) have been suggested to reduce the geometric dis-
tortion. However, not every one of these methods may be suitable for
real-time applications as they require additional reference scans and
computational time. Weiskopf and colleagues (Weiskopf et al., 2005)
developed a real-time method to allow for simultaneous acquisition and
distortion correction of functional images contributing further to the
development of real-time fMRI.
Taken together, many different algorithms have been developed for
the acquisition and real-time processing of fMRI signals. To improve the
sensitivity of functional imaging, correction of head movement artifacts is
a challenging problem. According to Cox and Jesmanowicz (1999), if two
neighboring voxels differ in intrinsic brightness by 20%, then a motion of
10% of a voxel dimension can result in a 2% signal change � comparable
to the BOLD signal change at 1.5T (Bandettini et al., 1992; Cox &
Jesmanowicz, 1999). In addition, if movement correlates with a given
task/stimuli, it can elicit false activations (Hajnal et al., 1994). If movement
230 Ranganatha Sitaram et al.
is not correlated with the task/stimuli, signal changes due to the move-
ment can change or reduce the actual activation in functional images
(Cox & Jesmanowicz 1999). Cox and his colleagues (1999) reported an
online method for head-movement correction by an algorithm for three-
dimensional (3D) image rotation and shifting (a rigid body model; since
the head moves as a whole, it is assumed that motion of the head can be
estimated in three directions for translation and three directions for rota-
tion) by generalizing the shears factorization directly to three dimensions.
However, this approach is not suitable for real-time applications as the
time needed for realignment of 80 images is estimated to be several min-
utes. Mathiak and Posse (2001) reported a real-time method of head
motion correction in which rigid body (from six parameters including
three for translation and three for rotation) transformation was applied in
the interval between acquisitions of two functional images. Besides
improving the performance of realignment of the functional images, an
error (indicating potentially noise or artifact) added by the realignment
process also would need to be considered. Mathiak and Posse (2001) pro-
posed that at least three slices with an image matrix of 643 64 would be
required to reduce the error in the estimated movement parameters to less
than 1% of the voxel size.
Further concerning realignment, a variety of real-time pre-processing
techniques for the corrections of respiration artifacts, spatial smoothing
(Posse et al., 2003) and spatial normalization to stereotactic space (Gao &
Posse, 2003) have been developed. To identify significant voxels in online
analysis, methods such as correlation (Cox et al., 1995), general linear
model (Caria et al., 2007, 2010; Rota et al., 2009; Ruiz et al., 2008;
Smyser et al., 2001; Weiskopf, Veit, Wilhelm, & Elena, 2003), and t-tests
(Voyvodic, 1999) have been used.
The above technical advances in rtfMRI enabled the development of
fMRI-BCI systems (see the following sections) for self-regulation of brain
activity with neurofeedback to study plasticity and functional reorganiza-
tion. Neurofeedback is based on the psychological theory of instrumental
learning, i.e., training in the presence of contingent reward (Skinner,
1938; Weiskopf et al., 2004). Studies have reported different methods for
the generation of reward. Yoo and Jolesz (2002) used the statistical map of
brain activations as visual feedback. Posse et al. (2003) gave participants
verbal feedback of the BOLD signal change in the amygdala at intervals of
60 s. Weiskopf et al. (2003) introduced real-time feedback by showing
two time courses of the BOLD signal in two circumscribed brain regions,
231Real-Time Regulation and Detection of Brain States from fMRI Signals
namely, rostral�ventral and dorsal anterior cingulate cortex, which were
updated at an interval of 2 s. DeCharms, Christoff, Glover, Pauly,
Whitfield, & Gabrieli (2004) built an fMRI-BCI system to guide self-
regulation of the somatomotor cortex with visual feedback of three differ-
ent time courses, in the target ROI, in a background ROI (irrelevant to
the task performance), and difference between the two ROIs. Recent
studies (Caria et al., 2007, 2010; deCharms et al., 2004, 2005; Rota et al.,
2009) have used visual feedback in the interval of 1�2 s.
OVERVIEW OF THE fMRI�BCI SYSTEM
fMRI�BCI could be defined as a closed loop system that extracts brain
signals from regions of interest and/or classifies patterns of brain activity
from a whole neural network in real-time, so that this information can be
provided to the subject as contingent feedback to enable him to volitionally
control the brain activity. In general, an fMRI�BCI system is comprised
of the following subsystems: (1) the subject, (2) signal acquisition, (3) pre-
processing, (4) signal analysis, and (5) feedback generation. Depending on
the purpose of the experiment, the subject would be instructed and trained
to perform mental tasks guided by the feedback information. Here, we
describe the last four subsystems mainly based on the fMRI�BCI system
built in the Institute of Medical Psychology and Behavioral Neurobiology,
University of Tubingen, Germany. The word real-time in the following
sections implies that signal processing is performed within a single TR (for
example, 1.5 s).
Signal AcquisitionExperiments are conducted on a 3Twhole body scanner using a standard
12 channel head coil (Siemens Magnetom Trio Tim, Siemens, Erlangen,
Germany). In principle, scanners from other manufacturers and with
other field strengths could be used for fMRI�BCI development. Whole
brain images of the subject are acquired using an EPI pulse sequence
which is modified to export functional images to the host computer of
the scanner. Pulse sequence parameters used for signal acquisition in our
experiments were as follows: repetition time TR5 1.5 seconds, echo
time TE5 45 msec, flip angle5 70 degree, number of slices5 16, band-
width5 1.3 KHz/pixel, FOVPE/RO5 210, image matrix5 643 64, voxel
size5 33 33 5mm3. These parameters could be modified keeping in
mind, however, the trade-off between signal-difference to noise ratio, also
232 Ranganatha Sitaram et al.

called the contrast-to-noise ratio (CNR), and the spatio-temporal resolu-
tion. Intrinsic parameters that modify the inherent signal produced by a
volumetric element (voxel) of the tissue, such as TR, TE, and flip angle
affect the CNR. Extrinsic parameters do not affect the measured tissue,
but influence the mechanics of the data collection, e.g., spatio-
temporal resolution (Brown & Semelka, 1999). In the setup of the para-
meters for real-time signal acquisition, a suitable compromise must be
made between spatial resolution, i.e., FOV, image matrix and slice
thickness, number of slices, and temporal resolution, i.e., TR. In our
fMRI�BCI experiments, the repetition time was reduced to 1.5 seconds
(compared to 2�3 s in a conventional fMRI experiments) to increase the
temporal resolution of BOLD signal, while the number of slices was
reduced to 16 (from 25�30 slices in conventional fMRI measurement)
and slice thickness was increased to 5 mm. With these parameters, ade-
quate spatial and temporal resolutions for functional image acquisition
were provided. However, the older MRI operating software provided by
manufacturers (e.g., Syngo, version VB13 and before, Siemens Medical
Solutions, Erlangen, Germany) did not have a provision for online export
of functional images. To retrieve images in real-time for online processing,
a generalized image reconstruction module was inserted into the conven-
tional EPI sequence provided by Siemens (Caria et al., 2007, 2010; Rota
et al., 2009; Sitaram et al., 2010; Weiskopf et al., 2003). This module
receives EPI k-space raw data from the MRI scanner hardware, recon-
structs whole brain images before start of the next volume of the brain,
and stores them in a pre-specified directory that could be immediately
accessed for another program to perform online preprocessing and analysis.
Fortunately, recent versions of scanner operating software (e.g., Siemens
Syngo version VB15, VB17 and VA30) have provided a standard option to
enable real-time export of functional images, simplifying and standardizing
the future development of real-time fMRI.
Pre-processingAfter the acquisition of each volume of EPI images, various online
pre-processing steps could be performed for artifact removal and noise
reduction. To prevent artifactual signals caused by head movement, head
padding and bite bars could be used. In addition, through a head-motion
correction step, we could monitor how much the participants move in
6 directions (3 translations and 3 rotations) in real-time, and instruct them
233Real-Time Regulation and Detection of Brain States from fMRI Signals

to avoid such movement. Head movement can be inferred by monitoring
the time courses of the head movement parameters. Patients could then
be reminded to avoid moving if excessive head movement is observed. In
addition to this motion correction, pre-processing also includes spatial
smoothing to reduce the effect of noise, and de-trending to remove linear
trends in the BOLD time-series.
Signal AnalysisAfter completion of pre-processing steps, whole-brain images are used for
statistical analysis and generation of functional maps. For real-time statisti-
cal analysis, a variety of algorithms that perform subtraction of two differ-
ent conditions, correlation analysis, or general linear model could be
used. Real-time statistical analysis is usually performed either by analyzing
recent time samples of data extracted from a sliding window or by incre-
mentally analyzing all data acquired up to a given time point. The sliding-
window method is superior in reflecting the current brain state as it uses
the most recent information. However, this method is not statistically
powerful because a limited number of samples are used in the statistical
test. In contrast, the incremental method provides more robust informa-
tion by using all the data acquired up to a given time point.
Studies (Caria et al., 2007, 2010; deCharms et al., 2004; Rota et al.,
2009) have also used the subtraction method of determining activation
maps where signals in the baseline condition are subtracted from the acti-
vation condition in a sliding window to provide feedback information in
the ROIs. The correlation method (Cox et al., 1995; Gembris et al.,
2000; Posse et al., 2001) is applied by computing the correlation coeffi-
cient between the time-series of the measured BOLD signal at each voxel
and the reference (or design) time-series representing the change in the
task conditions, and assessing the coefficients with a specified threshold.
The correlation method can be used in either a sliding-window fashion
or an incremental fashion.
General Linear Model (GLM) is now a standard method of analysis of
functional images to estimate the parameters that fit the measured time-
series of BOLD signal at each voxel, with a linear summation of multiple
experimental and confounding effects weighted by the corresponding
parameters. A GLM for two different conditions and one confounding
effect produces three parameters to best fit the measured time-series of
BOLD signal at a voxel. These parameters are computed independently
234 Ranganatha Sitaram et al.

for all the voxels of the brain and then used for statistical tests such as the
t-test and the F-test. As an example, the t-test can be applied on the first
parameter values over all the brain voxels, where the parameter magni-
tudes correspond to involvement of each voxel in the first condition.
These statistical tests identify the voxels that are significant (i.e., activated
solely in the corresponding condition) in the tests. However, since the
number of samples (i.e., scanned images) is limited in real-time applica-
tions, Bagarinao et al. (2003) developed a method of real-time GLM by
updating the parameters in GLM as new data become available. Similarly,
the commercially available real-time fMRI analysis software, Turbo Brain
Voyager (TBV, Brain Innovations, Maastricht, Netherlands) used in our
fMRI�BCI setup (Caria et al., 2007, 2010; Rota et al., 2009; Ruiz et al.,
2008; Weiskopf et al. 2003) uses real-time GLM by applying the recursive
least squares regression algorithm (Pollock, Green, & Nguyen, 1999) to
update GLM estimation incrementally.
All of the above methods are univariate methods as all the statistical
tests are separately performed at each voxel. In contrast, multivariate
methods can recognize spatial and temporal patterns of activity from mul-
tiple distributed voxels in the brain. Multivariate methods accumulate
weak information available at multiple locations to jointly decode cogni-
tive states although information at any single location cannot differentiate
between the states (Haynes & Rees, 2006). Recent studies (Cox & Savoy,
2003; Haynes & Rees, 2006; Haynes, Sakai, Rees, Gilbert, Frith, &
Passingham, 2007; Harrison & Tong 2009; Kamitani & Tong, 2005; Lee
et al., 2010; Mitchell et al., 2003) have applied multivariate methods to
increase sensitivity of fMRI analysis. Laconte and his colleagues (2007)
developed an fMRI�BCI system by employing a multivariate pattern
classification method called support vector machines (SVM). While most
fMRI�BCI studies to date have investigated self-regulation of brain activ-
ity at one or two ROIs using univariate analysis, multivariate methods
allow for real-time feedback of a whole network of brain activity pertain-
ing to a task.
We have recently implemented a real-time classification method for
automatically recognizing multiple emotional brain states from fMRI sig-
nals (Sitaram et al., 2010; see Figure 9.1). In our study, participants were
instructed to recall two (happy and disgust) or three (happy, disgust, and
sad) salient emotional episodes in a block design paradigm. While partici-
pants performed emotional imagery, whole brain images were acquired
and pre-processed in real-time to correct for head-motion artifacts and
235Real-Time Regulation and Detection of Brain States from fMRI Signals

spatially smoothed to improve signal-to-noise ratio. As the number of
voxels in the brain images is too large (tens of thousands, depending on
the scanning parameters) for a pattern classifier to handle efficiently, a
computational method called feature selection needs to be carried out to
reduce the data size and improve the efficacy of classification. We have
developed a novel method of feature selection called effect mapping (Lee
et al., 2010). In practice, the emotion classifier is first trained for each par-
ticipant on a set of initial data taken out of two sessions of the experi-
ment. The trained classifier is then used to recognize online (at intervals
of 1.5 s) the states of emotion, namely, happy, disgust or sad, as the partici-
pant engages in emotional imagery. In our study, participants were pro-
vided real-time visual feedback of the state of their brain based on the
Scanner
Participant Visual feedback fMRI-BCIComputer
H
Scanner host computer
Real-timeechoplaner
imagingsequence
Brainimages
Perl script fortransferring images
to fMRI-BCI
–Preprocessing–Feature selection
–Brain state classification–Feedback generation
Figure 9.1 The Tübingen real-time fMRI brain state classification system is comprisedof the following subsystems: an image acquisition subsystem, which is a modifiedversion of the standard echo-planar imaging (EPI) sequence written in C and exe-cuted on the scanner host computer; and an fMRI�BCI subsystem, which performsimage preprocessing, brain state classification and visual feedback, implemented in Cand Matlab scripts (Mathworks, Natwick, MA) and executed on a 64-bit Windowsdesktop. A Perl-script on the scanner host transfers the acquired images after everyscan (at an interval of 1.5s) to the fMRI-BCI computer. (Reproduced from Sitaram et al.,with permission.)
236 Ranganatha Sitaram et al.
classifier output. Our study, performed on 18 healthy individuals, showed
that fMRI�BCIs built using a pattern classifiers can robustly decode mult-
iple brain states (average classification accuracy .80%) in real time and
provide feedback of the states.
Feedback GenerationAs explained earlier, the results of real-time signal analysis in the ROI or
in the network determined by the pattern classifier can be transformed to
generate contingent feedback to the participant. Recent studies have
shown the usefulness of feedback in learning to regulate the BOLD signal
in one or more regions of the brain with fMRI�BCI (Caria et al., 2007,
2010; deCharms et al., 2004, 2005; Posse et al., 2003; Rota et al., 2009;
Ruiz et al., 2008). In addition, Lee and his colleagues (2008) reported the
effects of neurofeedback in self-regulation training by showing that insula-
regulation training with feedback leads to cerebral reorganization in the
brain regions relevant to emotion processing (Lee, Sitaram, Ruiz, &
Birbaumer, 2008). In studies with rtfMRI (Caria et al., 2007, 2010;
deCharms et al., 2004, 2005; Posse et al., 2003; Rota et al., 2009; Ruiz
et al., 2008), different forms of feedback have been used. Except for one
study that used verbal feedback (Posse et al., 2003), most studies to date
(Caria et al., 2007; deCharms et al., 2004, 2005; Rota et al., 2009; Ruiz
et al., 2008) have used visual feedback. Hinterberger et al. (2004) showed
that visual feedback compared to auditory feedback leads to better learn-
ing in self-regulation of slow cortical potential (SCP; change of cortical
potential below 1 Hz) using an EEG-BCI. As fMRI experiments gener-
ally have more acoustic background noise, visual feedback is presumably
more effective. Visual feedback has been provided in a variety of forms
such as time courses of BOLD activity in target areas updated in real-
time, functional maps based on online statistical analysis, and virtual reality
based animation. Using the conventional univariate method of analysis,
feedback can be based on one or more ROIs by combining them in the
form of additive or subtractive contrasts. The subtraction of BOLD signals
of the reference area from that of the ROI can result in more robust feed-
back as the BOLD activity in the reference area reflects the global change
of brain due to head movements, swallowing and systemic changes in
BOLD. More sophisticated methods of feedback computation could
potentially include correlational analysis between time-series of BOLD
activations in the ROIs, bivariate or multivariate methods of functional
connectivity computation using Granger causality modelling (GCM), and
237Real-Time Regulation and Detection of Brain States from fMRI Signals
multivariate pattern classification (Laconte et al., 2007; Sitaram et al.,
2010). Future developments in the adaptation of existing brain signal anal-
ysis methods to real-time requirements will dictate how well these meth-
ods could be used in fMRI-BCI applications.
fMRI�BCI IN RESEARCH AND CLINICAL TREATMENT
In the last decades, neurofeedback based on electrical brain signals has
been successfully applied to train subjects to self-regulate different compo-
nents of the electroencephalogram, leading to measurable behavioral
changes. EEG neurofeedback has been therapeutically applied to neuro-
logical and psychiatric disorders, such us intractable epilepsy, stroke,
locked-in syndrome and amyotrophic lateral sclerosis (Birbaumer, 2006;
Fuchs, Birbaumer, Lutzenberger, Gruzelier, & Kaiser, 2003; Kotchoubey
et al., 2001; Kubler, Kotchoubey, Kaiser, Wolpaw, & Birbaumer, 2001;
Murase, Duque, Mazzocchio, & Cohen, 2004; Strehl et al., 2006). For its
part, the development of real-time fMRI and fMRI�BCI has been more
recent. In the next sections, we will review the studies that have been
conducted so far with this new technique on healthy subjects, and the
attempts to implement this methodology on clinical populations.
fMRI�BCI Studies in Healthy PopulationsRegulation of Brain Regions of EmotionThe modulation of brain areas related to emotional processing has been of
particular interest for fMRI�BCI research. Posse and colleagues (Posse
et al., 2003) used rtfMRI and feedback of amygdala activation to reinforce
mood induction. Amygdala modulation can be of special importance due
to its role in emotion processing and learning, and due to its involvement
in several neuropsychiatric disorders (Buchanan, 2007; Lawrie, Whalley,
Job, & Johnstone, 2003; Pause, Jungbluth, Adolph, Pietrowsky, & Dere,
2010). A group of six healthy subjects performed a paradigm of self-
induction of mood to alternate between neutral and sad affective states
while in the scanner. After each trial, subjects received verbal feedback of
the signal change of BOLD activation in the amygdala. Subjects success-
fully achieved sad induction, and their self-mood ratings correlated with
the level of activity in the amygdala. Therefore, this study showed that
real-time fMRI could be used to monitor the activations of a particular
brain area, and suggested that feedback may influence perceived mood.
However, as both the task of self-induction and BCI feedback were
238 Ranganatha Sitaram et al.

presented simultaneously, it was not possible to ascertain whether amyg-
dala self-regulation was actually achieved due to the BCI feedback.
Weiskopf and colleagues from our group (Weiskopf et al., 2003) inves-
tigated whether fMRI�BCI could be applied to achieve self-regulation of
the anterior cingulate cortex (ACC). The ACC is part of the limbic sys-
tem and is subdivided into a dorsal “cognitive division” (ACcd), and a
rostral-ventral “affective division” (Acad) (Bush, Luu, & Posner, 2000). A
healthy subject was instructed to upregulate the activations of these areas,
presented to him as a continuously updated visual feedback (delay ,2 s),
introducing the concept of “immediate feedback” of the BOLD signal.
Using imagery of landscapes, sports, and social interaction in many train-
ing sessions, the subject achieved a significant increase of the BOLD signal
between up-regulation and baseline blocks. Additionally, the signal in the
affective ACC increased across the sessions of training, suggesting a
“learning effect”. Although it was not possible to correlate the BOLD sig-
nal change with any behavioral measurement, the participant rated the
valence and arousal of his affective state as more positive for regulation
blocks compared to baseline blocks. Hence, this single subject study was
one of the first that convincingly showed that BOLD signal of circum-
scribed brain regions can be self-regulated using fMRI�BCI, and that
self-regulation by fMRI�BCI training might lead to affective modifica-
tions. Studies have shown (Caria et al., 2007, 2010) that a robust ability to
self-regulate a brain region can be learned with contingent feedback, and
not with sham feedback, nor with mental imagery without feedback.
Further to this study, our group investigated whether healthy subjects can
voluntarily gain control over anterior insular activity using fMRI�BCI
(Caria et al., 2007). The insula cortex is an anatomically complex mesocorti-
cal structure, part of the paralimbic system that plays a central role in sensory
integration, emotion, and cognition, including such functions as olfaction,
gustation, autonomic functions, temperature and pain perception, and self-
awareness (for reviews see Augustine, 1996; Craig, 2009; Ture, Yasargil,
Al-Mefty, & Yasargil, 1999). Modulation of the insular activity with
fMRI�BCI training might be relevant for treatment of different psychiatric
diseases as social phobia, antisocial behavior, schizophrenia, and addictive
disorders (Nagai, Kishi, & Kato, 2007; Naqvi & Bechara, 2009). In this
study, nine healthy subjects were trained to voluntarily control the BOLD
signal of the anterior insular cortex, using fMRI�BCI in four feedback ses-
sions. The visual feedback was the normalized and continuously updated
average BOLD signal from the right anterior insula, presented to the subjects
239Real-Time Regulation and Detection of Brain States from fMRI Signals

by means of thermometer bars. All participants were able to successfully reg-
ulate the BOLD signal, and training resulted in a significantly increased acti-
vation cluster in the anterior portion of the right insula across sessions.
However, self-regulation could not be achieved by a control group trained
with sham feedback, suggesting that successful self-regulation is achieved by
contingent fMRI feedback. This work was the first group study that showed
that volitional control of emotionally relevant brain areas can be attained by
fMRI�BCI training.
Given this, can learned self-regulation produce a measurable behav-
ioral modification? In a later study, Caria and colleagues (Caria et al.,
2010) explored the relationship between brain self-regulation and emo-
tional behavior using fMRI�BCI. Healthy participants underwent four
fMRI�BCI scanning sessions to modulate the BOLD response in the left
anterior insula guided by visual feedback (as in the previous study). After
each modulation block of self-regulation and baseline, participants were
presented with either an emotionally negative or a neutral picture taken
from the International Affective Picture System (IAPS; Lang, Bradley, &
Cuthbert, 1997). Immediately after presentation, participants were required
to rate the picture using the Self-Assessment Manikin (Lang, 1980).
Participants learned to increase and decrease the BOLD response signifi-
cantly in the anterior insula guided by contingent feedback, and behavioral
data showed a significant difference of valence ratings of the aversive
pictures in the last session. These results demonstrate that fMRI�BCI
manipulation of paralimbic regions such as insula is possible and can modu-
late a specific emotional response.
A question that arises from these studies is whether, in addition to
behavioral modification, self-regulation of circumscribed brain areas also
leads to cerebral reorganization. In a further analysis of our data reported
in Caria et al. (2007), we investigated (Lee et al., 2008) changes in brain
connections associated with anterior insula self-regulation. We used mul-
tivariate support pattern analysis and effective connectivity analysis
with Granger causality modeling (Seth, 2009). Our analyses revealed
changes in the neural network of emotion regulation represented by an
inverted U-curve of connectivity densities across the sessions of self-
regulation. Feedback training resulted in an initial increase of the density
of the connections among regions such as the left and right insula, ACC,
medial prefrontal cortex, dorsolateral prefrontal cortex, and amygdala.
Further training seemed to indicate pruning of presumably redundant
connections and strengthening of potentially relevant connections. This
240 Ranganatha Sitaram et al.

effect can be of special importance as it shows that BCI might be used to
build a more efficient neural pathway, especially for conditions in which
abnormal neural connectivity is implied (as in autism and schizophrenia).
In a very recent study, Hamilton and colleagues (Hamilton et al.,
2010) tested whether healthy individuals can downregulate the activity of
the subgenual anterior cingulate (sACC) cortex with fMRI�BCI. Studies
have shown that downregulation of this region produced by deep brain
stimulation led to a sustained antidepressive effect in patients with
treatment-resistant depression, suggesting that endogenous modulation by
BCI might be used as a therapeutic approach (Lozano et al., 2008;
Mayberg et al., 2005). Using “positive affect strategies” and visual contin-
gent feedback of the BOLD signal, eight healthy women were able to
downregulate the BOLD signal from sACC. The learned downregulation,
however, did not persist in a subsequent session where subjects were not
provided with feedback. However, the study included a psychophysiologi-
cal interaction (PPI) analysis of functional connectivity (Friston et al.,
1997) which showed that BCI training was associated with a decreased
correlation (connectivity) between sACC and posterior cingulate cortex.
Similar to the study performed by Lee and colleagues (2008), this finding
indicates that fMRI�BCI training leads to changes in the effective con-
nectivity of a network subserving a task.
Prediction of emotional states from brain activity constitutes a major
scope of affective neuroscience. It could solve several pressing clinical pro-
blems such as the assessment of affect in verbally incompetent people with
dementia, minimally conscious state, and locked-in-syndrome, and the
detection of deception. Recent advances in multivariate pattern classifica-
tion of functional magnetic resonance imaging (fMRI) signals are espe-
cially important due to the high spatial resolution, whole brain coverage,
and non-invasiveness of fMRI. As mentioned earlier, in a recent study
(Sitaram et al., 2010) we showed that an online support vector machine
(SVM) can be built to recognize two discrete emotional states, such as
happiness and disgust, from fMRI signals in healthy individuals instructed
to recall emotionally salient episodes from their lives. The classifier also
showed robust prediction rates in decoding three discrete emotional states
(happiness, disgust, and sadness) in an extended group of participants.
Subjective reports collected from participants ascertained that they per-
formed emotion imagery, and that the online classifier decoded emotions
and not arbitrary states of the brain. This study also showed a relationship
between the participants’ affect scores as measured by positive and
241Real-Time Regulation and Detection of Brain States from fMRI Signals

negative affect scores (PANAS) and the subjective ratings of their perfor-
mance in the emotion imagery task, indicating that participants who
report greater negative affect rate themselves relatively lower in their abil-
ity to perform the imagery task. Offline whole-brain classification (see
Figure 9.2) as well as region-of-interest classification in 24 brain areas pre-
viously implicated in emotion processing revealed that the frontal cortex
was critically involved in emotion induction by imagery. Finally, we dem-
onstrated an adaptive pattern classifier-based real-time feedback system
with which subjects were trained to enhance the functional network of
emotion regulation by repeated training.
Figure 9.2 (See Color Plate Section) Exemplary brain activation maps generated froma single subject whole brain SVM classification showing discriminating voxels for: (a)happy vs. disgust classification, (b) happy vs. sad classification, and (c) disgust vs. sadclassification. Brain regions: oMFC, orbital medial frontal cortex; arMFC, anterior ros-tral MFC (based on Amodio & Frith, 2006); OFC, orbitofrontal cortex; ACC, anterior cin-gulate cortex; PCC, posterior cingulate cortex.
242 Ranganatha Sitaram et al.
oMFCACC
ACC
ACC
PCC
oMFC
BA44/45
insula
arMFC
(a)
(b)
(c)
oMFC
arMFC
Visualcortex
PCC
min max0

Motor SystemIn one of the earliest fMRI�BCI studies, Yoo and Jolesz (2002) tested
whether subjects could self-regulate the activity of motor areas by fMRI
neurofeedback. Brain activations from sensorimotor regions produced by
a simple finger-tapping task were extracted by fMRI, in five healthy parti-
cipants. Through sessions of regulation, participants were asked to adapt
their hand motor strategies in order to expand the functional activations
in the motor cortex, guided by the brain activations maps provided as
visual feedback, at the end of each block of regulation. After a few trials
of training, all participants were able to adapt their motor strategies to
successfully expand their brain activations in the ROI.
DeCharms and colleagues (deCharms et al., 2004) used a hand motor
imagery task in six participants who were instructed to optimize their strat-
egies in order to increase the activations in the somatomotor cortex, while
receiving ongoing real-time fMRI visual feedback of the level of activa-
tions in these brain regions. A significant monotonic activation increase in
the ROI across training was also found. Furthermore, a control group of
subjects who were trained in the scanner in an identical task, but without
valid rtfMRI information (sham feedback), did not achieve self-regulation.
Other studies have attempted to use fMRI�BCI technology to translate
brain activity into direct control of computers and robots. Yoo and collea-
gues (Yoo et al., 2004) used fMRI to decode brain activities associated with
four distinct covert functional tasks (mental calculation, mental speech gen-
eration, and motor imagery of sequential finger position of right and left
hand), and subsequently translated these activations into predetermined
computer commands for moving four directional cursors. Three healthy
participants were able to make a cursor navigate in a 2D maze demonstrat-
ing “spatial navigation by thought”. The same group (Lee, Ryu, Jolesz,
Cho, & Yoo, 2009), later explored the use of fMRI�BCI to control a
robotic arm. The BOLD signal extracted from primary motor areas (M1)
of right and left hemispheres were used to adjust vertical and horizontal
coordinates of this external device. Three healthy subjects attempted to
move the robotic arm using motor imagery to activate M1 with the help of
visual feedback to adjust the level of cortical activation. With different
degrees of success, participants were able to gain voluntary control of two-
dimensional movement of the robotic device. These preliminary studies can
be of crucial importance for future therapeutic attempts in patients with
motor dysfunctions due to stroke, brain or spinal injury, or degenerative
disorders.
243Real-Time Regulation and Detection of Brain States from fMRI Signals

Auditory SystemYoo and colleagues tested the feasibility of using fMRI neurofeedback for
the regulation of cortical activations related to auditory attention (Yoo
et al., 2006). Eleven healthy participants passively received auditory stimu-
lation in the scanner to determine the auditory areas as regions of interest.
During the regulation sessions, participants were instructed to engage in
an attentional task (listening to the auditory stimuli) in order to increase
the volume of activation within the ROI. Between scanner sessions, ver-
bal feedback of the activation of auditory areas was given to the subjects.
The experimental group successfully increased the BOLD signal in left
auditory areas and other extra-temporal areas. A control group that was
not given feedback of the activations in the auditory cortex did not
achieve consistent increase in activations in the region, indicating the
importance of feedback in self-regulation.
Language ProcessingIn an experiment conducted by our team, fMRI�BCI was used to train
subjects to achieve self-control of right inferior frontal gyrus (BA 45), and
to measure whether this voluntary increase of the BOLD signal would
modulate language processing (Rota et al., 2009). All seven subjects of the
experimental group achieved voluntary self-regulation of the activation-
level recorded in the target ROI, with a progressive increase of the level
of activation in the right BA 45 across training sessions. Short-term
behavioral effects of self-regulation with regard to language processing
were explored by comparing accuracy levels and reaction times before
and after feedback training in prosodic and syntactic tasks. During the
self-regulation of BA 45, experimental subjects significantly improved
their accuracy for the identification of affective prosodic stimuli (but not
for syntactic stimuli), confirming the role of inferior frontal gyrus in the
processing of emotional information. These results pointed out that self-
regulation of prefrontal cortical areas by fMRI�BCI is possible, and could
be explored as a means to normalize dysfunctional cortical networks to
enhance cognitive and/or behavioral disturbances associated with clinical
disorders.
fMRI�BCI Studies in Clinical PopulationsThe studies described above showed that fMRI�BCI can enable healthy
subjects to achieve voluntary control of circumscribed brain areas. Some
244 Ranganatha Sitaram et al.

of these studies have also shown behavioral changes and cerebral changes
due to fMRI�BCI practice. The next paragraphs describe how far we
have gone in the applications of fMRI�BCI with neurological and psy-
chiatric disorders.
Pain PerceptionChronic pain is a major health problem causing untold suffering for mil-
lions of patients, and economic burden worldwide. DeCharms and collea-
gues (deCharms et al., 2005) focused on the use of self-regulation of
rostral ACC (rACC) to investigate the modulation of pain perception.
This area, among others, is involved in mediating the conscious percep-
tion of pain (Mackey & Maeda, 2004; Petrovic & Ingvar, 2002; Wager
et al., 2004). The results of fMRI�BCI training in a group of healthy
subjects showed that is it possible to gain deliberate control of the rACC
activation aided by contingent fMRI feedback, and that self-regulation is
significantly associated with changes in the perception of pain caused by a
noxious thermal stimulus. Going one step further, they demonstrated that
similar self-regulation can be achieved by a group of chronic pain patients
who reported decrease in the level of ongoing pain after the fMRI�BCI
training. It remains to be seen if such behavioral changes persist in the
long term.
Stroke RehabilitationIn recent work by our group, Sitaram and colleagues (2010) assessed the
feasibility of fMRI�BCI feedback training for enabling healthy indivi-
duals and stroke patients to regulate the ventral premotor cortex (PMv),
an area involved in observation, imagery, and execution of movement
(Grezes & Decety, 2001). The authors hypothesized that upregulation of
the BOLD signal in the PMv would facilitate motor cortical output from
primary motor cortex (M1). Each fMRI�BCI feedback session consisted
of four runs of self-regulation training. Results showed that training
enabled participants to learn to upregulate the BOLD response of PMv.
To measure behavioral effects of self-regulation, the authors used paired
pulses of transcranial magnetic stimulation (TMS) to induce intracortical
inhibition and facilitation, and simultaneously measured motor evoked
potential (MEP) on the participant’s finger. Results showed evidence for
reduction in intracortical inhibition after feedback training compared to
the same situation before feedback training, and even further reduction
during self-regulation of PMv.
245Real-Time Regulation and Detection of Brain States from fMRI Signals

Tinnitus TreatmentTinnitus, the perception of sound in the absence of an auditory stimulus,
is a common chronic disorder with limited treatment options that can
adversely impact the quality of life of the patients. Current views of
its neural basis include an over-activation of the auditory network
(Eggermont, 2005; Kleinjung et al., 2005). Six patients with chronic tin-
nitus were examined by Haller, Birbaumer, & Veit (2010). After localizing
the primary auditory cortex, patients were instructed to downregulate the
BOLD activity of this area aided by contingent visual feedback. Most of
the patients learned to downregulate their activations in the auditory
ROI. Furthermore, a linear decrease in the auditory activations was
detected over training sessions. After a single day of BCI training there
was a decrease of the subjective report of tinnitus in two of six partici-
pants. This preliminary data suggests that fMRI�BCI potentially could
produce beneficial effects for the treatment of this disorder.
Mental DisordersSo far, two chronic and irreversible mental disorders have been the focus
of interest in our group: psychopathy and schizophrenia. Psychopathy is a
severe personality disorder often considered untreatable. Studies by our
group have shown that persons diagnosed with psychopathy fail to activate
prefrontal cortex and limbic regions (including insula cortex, cingulate
cortex, left amygdala, and orbitofrontal cortex) during a fear-conditioning
task (Birbaumer et al., 2005; Veit et al., 2002). Therefore, we hypothe-
sized that upregulation of these areas could facilitate the acquisition of
aversive conditioning, potentially modifying the behavioral manifestations
of the disorder. Using a similar paradigm as Caria et al. (2007), we trained
individuals with criminal psychopathy to self-regulate anterior insula cor-
tex with fMRI�BCI. Preliminary results showed for the first time that
such persons can learn self-regulation of left anterior insula. Furthermore,
self-regulation led to an increase in the effective connectivity of the brain
network involved in emotional processing.
In a second study, we made the first attempt to apply fMRI�BCI
with schizophrenic patients (Ruiz et al., 2008; full article in press). The
first aims of this study were to evaluate whether schizophrenic subjects
can achieve volitional regulation of anterior insula cortex activity by
fMRI�BCI training, and to explore the relationship between the capabil-
ity to self-regulate and other aspects of their symptomatology. Insula cor-
tex was chosen as the ROI based on the increasing evidence that insula
246 Ranganatha Sitaram et al.

dysfunction might be critically involved in different aspects of schizo-
phrenic psychopathology. Secondly, we explored whether self-regulation
is associated with a behavioral modification of facial emotion recognition.
Finally, we studied whether learned self-regulation can modulate the fun-
ctional connectivity of the emotional brain network (measured by
Granger causality modelling). Nine chronic schizophrenic patients, mod-
erately symptomatic and under antipsychotic medication, were recruited.
The training consisted of twelve sessions of fMRI-BCI during which
patients were trained using online visual feedback of bilateral anterior
insula activity. Our results showed that after a few sessions of training,
patients learned to self-regulate the BOLD response in the insula cortex
(see Figure 9.3). Self-regulation was not achieved, however, in a later ses-
sion conducted without fMRI-feedback (transfer session).
The capability to self-regulate was negatively correlated with the
severity of negative symptoms and the duration of the illness. After
learned insula self-regulation, patients detected significantly more disgust
faces, in line with the extensive evidence of the role of insula in face dis-
gust recognition. However, for reasons that need more exploration,
0.350.3
0.25
Fis
her
scor
e
0.20.150.1
0.050
1 2 3 4 5 6 7
Session #
8 9 10 11 12 13
0.40.350.3
0.25
0.15
0.5
Fis
her
scor
e
0.2
0.1
01 2 3 4 5 6 7
Session #
8 9 10 11 12 13
Left insula
Rightt insula
Figure 9.3 Group analysis of self-regulation in the left and right anterior insula. Graybars represent the Fisher score (as a measure of signal change in the ROI) and stan-dard error across training sessions. The black bars represent the mean and standarderror for the transfer session.
247Real-Time Regulation and Detection of Brain States from fMRI Signals

patients detected less happy faces during self-regulation. Volitional control
of insula was also associated with a modulation of the perception of emo-
tion intensity. Finally, volitional self-regulation led to a significant enhance-
ment of the effective connectivity arising from the insula cortex on both
hemispheres, and of the emotional network in general.
These results showed that with adequate training these schizophrenic
subjects were able to learn volitional regulation of the insula cortex by
fMRI�BCI. Learned self-regulation led to changes in the perception of
emotional faces, one of the hallmarks of schizophrenic dysfunction, thus
providing evidence that behavioral modulation by this new technique in
schizophrenia is possible. The enhancement of the connectivity in brain
emotional network suggests that fMRI�BCI may be useful in “re-
connecting” abnormal neural connections in schizophrenia.
CONCLUSIONS
New developments in computer and device technology, and signal pro-
cessing have brought fresh enthusiasm and interest in real-time neuro-
imaging. Several new applications of this technique, most significantly led
by research in brain�computer interfaces, are being developed and tested.
rtfMRI has inspired a promising new approach to cognitive neuroscience.
There is growing evidence that learned control of the local brain activity
through rtfMRI can be used as an independent variable to observe its
effects on behavior. fMRI�BCI has enabled anatomically specific control
of subcortical and cortical areas (some of them not accessible to electro-
physiological methods), such as amygdala, insular regions, cingulate regions,
and sensorimotor cortex. Encouraged by the behavioral modifications fol-
lowing self-regulation training, there have been several new attempts to
apply this methodology to neuropsychiatric disorders.
The above studies and novel developments of BCI methodology
can open up opportunities for studies in psychiatric populations and possi-
ble future therapeutic applications. However, before the full clinical appli-
cation of fMRI�BCI, some important aspects have to be addressed and
explored by further studies. fMRI�BCI is an expensive and difficult to
implement technology. Furthermore, to date none of the mentioned stud-
ies has convincingly shown that self-regulation can be generalized “out of
the scanner setting”, without the help of on-going contingent feedback.
Whether the behavioral changes produced by fMRI�BCI are more than
a short-term effect has yet to be explored.
248 Ranganatha Sitaram et al.

Finally, these findings have opened a fundamental question, that is,
“How does learned regulation of the BOLD signal in the brain influence
behavior?” A clearer understanding of the neural mechanisms underlying
the BOLD response perhaps will lead us to answer this question. Perhaps
fMRI�BCI will, itself, be employed to help understand the relationships
between neural activity, the BOLD response, and behavior.
REFERENCES
Andersson, J. L., Hutton, C., Ashburner, J., Turner, R., & Friston, K. J. (2001). Modelinggeometric deformations in EPI time series. Neuroimage, 13(5), 903�919.
Augustine, J. R. (1996). Circuitry and functional aspects of the insular lobe in primatesincluding humans. Brain Research Brain Research Reviews, 22, 229�244.
Bagarinao, E., Matsuo, K., Nakai, T., & Sato, S. (2003). Estimation of general linearmodel coefficients for real-time application. Neuroimage, 19(2 Pt 1), 422�429.
Bandettini, P. A., Wong, E. C., Hinks, R. S., et al. (1992). Time course EPI of humanbrain function during task activation. Magnetic Resonance in Medicine, 25(2), 390�397.
Birbaumer, N. (2006). Breaking the silence: Brain�computer interfaces (BCI) for com-munication and motor control. Psychophysiology, 43, 517�532.
Birbaumer, N., Veit, R., Lotze, M., Erb, M., Hermann, C., Grodd, W., et al. (2005).Deficient fear conditioning in psychopathy: A functional magnetic resonance imagingstudy. Archives of General Psychiatry, 62, 799�805.
Brown, M. A., & Semelka, R. C. (1999). MRI basic principles and applications. Hoboken,NJ: Wiley�Blackwell.
Buchanan, T. W. (2007). Retrieval of emotional memories. Psychology Bulletin, 133, 761�779.Bush, G., Luu, P., & Posner, M. I. (2000). Cognitive and emotional influences in anterior
cingulate cortex. Trends in Cognitive Sciences, 4, 215�222.Buxton, R. B., Uludag, K., Dubowitz, D. J., & Liu, T. T. (2004). Modeling the hemo-
dynamic response to brain activation. Neuroimage, 23(Suppl 1), S220�S233.Caria, A., Sitaram, R., Veit, R., Begliomini, C., & Birbaumer, N. (2010). Volitional con-
trol of anterior insula activity modulates the response to aversive stimuli: A real-timefunctional magnetic resonance imaging study. Biological Psychiatry, June 4. Epub aheadof print.
Caria, A., Veit, R., Sitaram, R., Lotze, M., Weiskopf, N., Grodd, W., et al. (2007).Regulation of anterior insular cortex activity using real-time fMRI. Neuroimage, 35,1238�1246.
Cox, D. D., & Savoy, R. L. (2003). Functional magnetic resonance imaging (fMRI) brainreading: Detecting and classifying distributed patterns of fMRI activity in humanvisual cortex. Neuroimage, 19(2 Pt 1), 261�270.
Cox, R. W., & Jesmanowicz, A. (1999). Real-time 3D image registration for functionalMRI. Magnetic Resonance in Medicine, 42(6), 1014�1018.
Cox, R. W., Jesmanowicz, A., & Hyde, J. S. (1995). Real-time functional magnetic reso-nance imaging. Magnetic Resonance in Medicine, 33(2), 230�236.
Craig, A. D. (2009). How do you feel � now? The anterior insula and human awareness.Nature Reviews Neuroscience, 10, 59�70.
deCharms, R. C., Christoff, K., Glover, G. H., Pauly, J. M., Whitfield, S., & Gabrieli, J. D.(2004). Learned regulation of spatially localized brain activation using real-time fMRI.Neuroimage, 21, 436�443.
249Real-Time Regulation and Detection of Brain States from fMRI Signals
deCharms, R. C., Maeda, F., Glover, G. H., Ludlow, D., Pauly, J. M., Soneji, D., et al.(2005). Control over brain activation and pain learned by using real-time functionalMRI. Proceedings of the National Academy of Sciences of the U S A, 102, 18 626�18 631.
Eggermont, J. J. (2005). Tinnitus: Neurobiological substrates. Drug Discovery Today, 10,1283�1290.
Friston, K. J., Buechel, C., Fink, G. R., Morris, J., Rolls, E., & Dolan, R. J. (1997).Psychophysiological and modulatory interactions in neuroimaging. Neuroimage, 6,218�229.
Fuchs, T., Birbaumer, N., Lutzenberger, W., Gruzelier, J. H., & Kaiser, J. (2003).Neurofeedback treatment for attention-deficit/hyperactivity disorder in children:A comparison with methylphenidate. Applied Psychophysiology and Biofeedback, 28, 1�12.
Gao, K., & Posse, S. (2003). TurboFIRE: Real-time fMRI with automated spatial normal-ization and Talairach Daemon database [Abstract]. 9th Annual Meeting of theOHBM, New York, USA.
Gembris, D., Taylor, J. G., Schor, S., Frings, W., Suter, D., & Posse, S. (2000).Functional magnetic resonance imaging in real-time (FIRE), sliding-window corre-lation analysis and reference-vector optimization. Magnetic Resonance in Medicine, 43(2), 259�268.
Grezes, J., & Decety, J. (2001). Functional anatomy of execution, mental simulation,observation, and verb generation of actions: A meta-analysis. Human Brain Mapping,12, 1�19.
Haller, S., Birbaumer, N., & Veit, R. (2010). Real-time fMRI feedback training mayimprove chronic tinnitus. European Radiology, 20, 696�703.
Hajnal, J. V., Myers, R., Oatridge, A., Schwieso, J. E., Young, I. R., & Bydder, G. M.(1994). Artifacts due to stimulus correlated motion in functional imaging of the brain.Magnetic Resonance in Medicine, 31(3), 283�291.
Hamilton, P., Glover, G. H., Hsu, J., & Johnson, R. (2010). Modulation of subgenual ante-rior congulate cortex activity with real-time neurofeedback. Human Brain Mapping,May 10. Online publication.
Harrison, S. A., & Tong, F. (2009). Decoding reveals the contents of visual working mem-ory in early visual areas. Nature, 458(7238), 632�635.
Haynes, J. D., & Rees, G. (2006). Decoding mental states from brain activity in humans.Nature Reviews Neuroscience, 7(7), 523�534.
Haynes, J. D., Sakai, K., Rees, G., Gilbert, S., Frith, C., & Passingham, R. E. (2007).Reading hidden intentions in the human brain. Current Biology, 17(4), 323�328.
Jezzard, P., & Balaban, R. S. (1995). Correction for geometric distortion in echo planarimages from B0 field variations. Magnetic Resonance in Medicine, 34(1), 65�73.
Kamitani, Y., & Tong, F. (2005). Decoding the visual and subjective contents of thehuman brain. Nature Neuroscience, 8(5), 679�685.
Kleinjung, T., Eichhammer, P., Langguth, B., Jacob, P., Marienhagen, J., Hajak, G.,et al. (2005). Long-term effects of repetitive transcranial magnetic stimulation(rTMS) in patients with chronic tinnitus. Otolaryngology Head and Neck Surgery,132, 566�569.
Kotchoubey, B., Strehl, U., Uhlmann, C., Holzapfel, S., Konig, M., Froscher, W., et al.(2001). Modification of slow cortical potentials in patients with refractory epilepsy:A controlled outcome study. Epilepsia, 42, 406�416.
Kubler, A., Kotchoubey, B., Kaiser, J., Wolpaw, J. R., & Birbaumer, N. (2001).Brain�computer communication: Unlocking the locked in. Psychology Bulletin, 127,358�375.
Kybic, J., Thevenaz, P., Nirkko, A., & Unser, M. (2000). Unwarping of unidirectionallydistorted EPI images. IEEE Transactions on Medical Imaging, 19(2), 80�93.
250 Ranganatha Sitaram et al.

LaConte, S. M., Peltier, S. J., & Maciuba, A. (2007). Real-time fMRI using brain-stateclassification. Human Brain Mapping, 28(10), 1033�1044.
Lang, P. J. (Ed.), (1980). Behavior treatment and bio-behavioral assessment: Computerapplications. Technology in Mental Health Care Delivery Systems. Norwood, NJ: Ablex.
Lang, P. J., Bradley, M. M., & Cuthbert, B. N. (Eds.), (1997). International Affective PictureSystem (IAPS): Technical manual and effective ratings. The Center for Research inPsychophysiology. Gainesville, FL: University of Florida.
Lawrie, S. M., Whalley, H. C., Job, D. E., & Johnstone, E. C. (2003). Structural and func-tional abnormalities of the amygdala in schizophrenia. Annals of the New York Academyof Sciences, 985, 445�460.
Lee, S., Halder, S., et al. (2010). Effective functional mapping of fMRI data with support-vector machines. Human Brain Mapping, [Epub ahead of print].
Lee, J. H., Ryu, J., Jolesz, F. A., Cho, Z. H., & Yoo, S. S. (2009). Brain-machine interfacevia real-time fMRI: Preliminary study on thought-controlled robotic arm. NeuroscienceLetters, 450, 1�6.
Lee, S., Sitaram, R., Ruiz, S., & Birbaumer, N. (2008). Measure of neurofeedback effectsin an fMRI Brain�Computer Interface with support vector machine and Grangercausality model. Xth International Conference on Cognitive Neuroscience, Bodrum,Turkey.
Logothetis, N. K. (2008). What we can do and what we cannot do with fMRI (Review).Nature, 453, 869�878.
Lozano, A. M., Mayberg, H. S., Giacobbe, P., Hamani, C., Craddock, R. C., & Kennedy,S. H. (2008). Subcallosal cingulate gyrus deep brain stimulation for treatment-resistantdepression. Biological Psychiatry, 64, 461�467.
Mackey, S. C., & Maeda, F. (2004). Functional imaging and the neural systems of chronicpain. Neurosurgery Clinics of North America, 15, 269�288.
Mathiak, K., & Posse, S. (2001). Evaluation of motion and realignment for functional mag-netic resonance imaging in real time. Magnetic Resonance Medicine, 45(1), 167�171.
Mayberg, H. S., Lozano, A. M., Voon, V., McNeely, H. E., Seminowicz, D., Hamani, C.,et al. (2005). Deep brain stimulation for treatment-resistant depression. Neuron, 45,651�660.
Mitchell, T. M., Hutchinson, R., et al. (2003). Classifying instantaneous cognitive statesfrom FMRI data. AMIA Annual Symposium Proceedings: 465�9.
Murase, N., Duque, J., Mazzocchio, R., & Cohen, L. G. (2004). Influence of interhemi-spheric interactions on motor function in chronic stroke. Annals of Neurology, 55,400�409.
Nagai, M., Kishi, K., & Kato, S. (2007). Insular cortex and neuropsychiatric disorders:A review of recent literature. European Psychiatry, 22, 387�394.
Naqvi, N. H., & Bechara, A. (2009). The hidden island of addiction: The insula. Trends inNeuroscience, 32, 56�67.
Panych, L. P., & Jolesz, F. A. (1994). A dynamically adaptive imaging algorithm forwavelet-encoded MRI. Magnetic Resonance in Medicine, 32(6), 738�748.
Pause, B. M., Jungbluth, C., Adolph, D., Pietrowsky, R., & Dere, E. (2010). Inductionand measurement of episodic memories in healthy adults. Journal of NeuroscientificMethods, 189(1), 88�96.
Petrovic, P., & Ingvar, M. (2002). Imaging cognitive modulation of pain processing. Pain,95, 1�5.
Pollock, D. S. G., Green, R. C., & Nguyen, T. (1999). Handbook of Time Series Analysis,Signal Processing, and Dynamics. San Diego, CA: Academic Press.
Posse, S., Binkofski, F., Schneider, F., Gembris, D., Frings, W., et al. (2001). A newapproach to measure single-event related brain activity using real-time fMRI:
251Real-Time Regulation and Detection of Brain States from fMRI Signals

Feasibility of sensory, motor, and higher cognitive tasks. Human Brain Mapping, 12(1),25�41.
Posse, S., Fitzgerald, D., Gao, K., Habel, U., Rosenberg, D., Moore, G. J., et al. (2003).Real-time fMRI of temporolimbic regions detects amygdala activation during single-trial self-induced sadness. Neuroimage, 18(3), 760�768.
Posse, S., Wiese, S., Gembris, D., Mathiak, K., Kessler, C., Grosse-Ruyken, B., et al.(1999). Enhancement of BOLD-contrast sensitivity by single-shot multi-echo func-tional MR imaging. Magnetic Resonance in Medicine, 42(1), 87�97.
Rota, G., Sitaram, R., Veit, R., Erb, M., Weiskopf, N., Dogil, G., et al. (2009). Self-regulation of regional cortical activity using real-time fMRI: The right inferior frontalgyrus and linguistic processing. Human Brain Mapping, 30, 1605�1614.
Ruiz, S., Sitaram, R., Sangyun, L., Caria, A., Soekadar, S., Veit, R., et al. (2008).Learned control of insular activity and functional connectivity changes using a fMRIBrain Computer Interface in Schizophrenia. 38th annual meeting of the Society forNeuroscience. Washington. Schizophrenia Research 102/1-3, 92 [full print version inpress].
Seth, A. K. (2009). A MATLAB toolbox for Granger causal connectivity analysis. Journalof Neuroscience Methods, 186(2), 262�273.
Sitaram, R., Lee, S., et al. (2010). Real-time support vector classification and feedback ofmultiple emotional brain states. Neuroimage, in press.
Skinner, B. F. (1938). The behavior of organisms: An experimental analysis. New York:Appleton-Century-Crofts.
Smyser, C., Grabowski, T. J., Frank, R. J., Haller, J. W., & Bolinger, L. (2001). Real-timemultiple linear regression for fMRI supported by time-aware acquisition and proces-sing. Magnetic Resonance in Medicine, 45(2), 289�298.
Strehl, U., Leins, U., Goth, G., Klinger, C., Hinterberger, T., & Birbaumer, N. (2006).Self-regulation of slow cortical potentials: A new treatment for children with atten-tion-deficit/hyperactivity disorder. Pediatrics, 118, e1530�1540.
Studholme, C., Constable, R. T., & Duncan, J. S. (2000). Accurate alignment of func-tional EPI data to anatomical MRI using a physics-based distortion model. IEEETransactions on Medical Imaging, 19(11), 1115�1127.
Ture, U., Yasargil, D. C., Al-Mefty, O., & Yasargil, M. G. (1999). Topographic anatomy ofthe insular region. Journal of Neurosurgery, 90, 720�733.
Veit, R., Flor, H., Erb, M., Hermann, C., Lotze, M., Grodd, W., et al. (2002). Brain cir-cuits involved in emotional learning in antisocial behavior and social phobia inhumans. Neuroscience Letters, 328, 233�236.
Voyvodic, J. T. (1999). Real-time fMRI paradigm control, physiology, and behavior com-bined with near real-time statistical analysis. Neuroimage, 10(2), 91�106.
Wager, T. D., Rilling, J. K., Smith, E. E., Sokolik, A., Casey, K. L., Davidson, R. J., et al.(2004). Placebo-induced changes in FMRI in the anticipation and experience of pain.Science, 303, 1162�1167.
Weiskopf, N., Klose, U., Birbaumer, N., & Mathiak, K. (2005). Single-shot compensationof image distortions and BOLD contrast optimization using multi-echo EPI for real-time fMRI. Neuroimage, 24(4), 1068�1079.
Weiskopf, N., Mathiak, K., Bock, S. W., Scharnowski, F., Veit, R., Grodd, W., et al.(2004). Principles of a brain-computer interface (BCI) based on real-time functionalmagnetic resonance imaging (fMRI). IEEE Transactions on Biomedical Engineering,51(6), 966�970.
Weiskopf, N., Scharnowski, F., Veit, R., Goebel, R., & Birbaumer, N. (2004). Self-regulation of local brain activity using real-time functional magnetic resonance imag-ing (fMRI). Journal of Physiology Paris, 98(4-6), 357�373.
252 Ranganatha Sitaram et al.

Weiskopf, N., Veit, R., Erb, M., Mathiak, K., Grodd, W., & Goebel, R. (2003).Physiological self-regulation of regional brain activity using real-time functional mag-netic resonance imaging (fMRI), methodology and exemplary data. Neuroimage, 19,577�586.
Yoo, S. S., Fairneny, T., Chen, N. K., Choo, S. E., Panych, L. P., Park, H., et al. (2004).Brain-computer interface using fMRI: Spatial navigation by thoughts. Neuroreport, 15,1591�1595.
Yoo, S. S., Guttmann, C. R., Zhao, L., & Panych, L. P. (1999). Real-time adaptive func-tional MRI. Neuroimage, 10(5), 596�606.
Yoo, S. S., & Jolesz, F. A. (2002). Functional MRI for neurofeedback: Feasibility study ona hand motor task. Neuroreport, 13, 1377�1381.
Yoo, S. S., O’Leary, H. M., Fairneny, T., Chen, N. K., Panych, L. P., Park, H., et al.(2006). Increasing cortical activity in auditory areas through neurofeedback functionalmagnetic resonance imaging. Neuroreport, 17, 1273�1278.
Zaitsev, M., Hennig, J., Speck, O., et al. (2004). Point spread function mapping with par-allel imaging techniques and high acceleration factors: Fast, robust, and flexiblemethod for echo-planar imaging distortion correction. Magnetic Resonance in Medicine,52(5), 1156�1166.
253Real-Time Regulation and Detection of Brain States from fMRI Signals

This page intentionally left blank

PARTThreeThreeExogenousNeuromodulationStrategies

This page intentionally left blank

CHAPTER1010Repetitive Transcranial MagneticStimulation in Depression:Protocols, Mechanisms, andNew DevelopmentsDesirée Spronk1, Martijn Arns1,2, and Paul B. Fitzgerald31Research Institute Brainclinics, Nijmegen, The Netherlands2Utrecht University, Department of Experimental Psychology, Utrecht, The Netherlands3Monash Alfred Psychiatry Research Center (MAPrc), The Alfred and Monash University, School ofPsychology and Psychiatry, Melbourne, Victoria, Australia
Contents
Introduction 257Protocols 261
Stimulation Frequency 261Stimulation Location 266Stimulation Intensity, Trains, and Sessions 268
Mechanisms of rTMS Treatment in Depression 270Neuroimaging 271Neurochemical Effects: Neurotransmitters and Neuroendocrinology 273Neurotrophins 275Genetics 276
New Developments 277Progress in Protocols 277Technical Progress 278Optimizing Treatment 279
Acknowledgments 282References 283
INTRODUCTION
TMS (transcranial magnetic stimulation) is a non-invasive neuromodulation
technique. Nevertheless, it has a very direct influence on brain physiology.
The basic principle of TMS is the application of short magnetic pulses over
the scalp of a subject with the aim of inducing electrical currents in the neu-
rons of the cortex. A typical TMS device consists of a stimulator that can
257Neurofeedback and Neuromodulation Techniques and ApplicationsDOI: 10.1016/B978-0-12-382235-2.00010-X
© 2011 Elsevier Inc.All rights reserved.

generate a strong electrical current, and a coil in which the fluctuating elec-
trical current generates magnetic pulses. If the magnetic pulses are delivered
in the proximity of a conductive medium, e.g. the brain, a secondary current
in the conductive material (e.g., neurons) is induced (Figure 10.1). In the
practice of TMS, a subject is seated in a chair and an operator positions
the coil above the scalp of the subject, tunes the stimulation parameters of
the stimulator, and applies the TMS pulses.
Anthony Barker and his colleagues at the University of Sheffield were
the first to develop a TMS device, introducing a new neuromodulatory
technique in neuroscience. The first application, demonstrated first by
these researchers, was the induction of a motor evoked potential (e.g.,
activating the muscles abducting the thumb) by means of applying a TMS
pulse over the motor cortex (Barker, Jalinous, & Freeston, 1985).
Initially, TMS was used mainly in studies on motor conductivity
through investigating the temporal aspects and amplitude of the evoked
Magneticfield
TMS coil
Electric current
Skull
Figure 10.1 Visual illustration of the induction of electrical currents in the brainthrough the magnetic pulses (dashed lines) applied by means of the coil (8-shapedfigure) positioned above the head. (Adapted from Ridding and Rothwell, 2007.)
258 Desirée Spronk et al.

motor responses after stimulating the motor cortex. Continuing progress
on the technical aspects of TMS devices soon made it possible to deliver
multiple pulses within a short time period, i.e., repetitive TMS (rTMS).
With the development of rTMS, researchers were able to induce changes
that outlasted the stimulation period (Pascual-Leone et al., 1999). This
has led to a considerable extension of the possible applications of TMS.
Currently, rTMS is used for an increasing variety of applications such as
the study of pathophysiology of diseases, the investigation of the contribu-
tion of certain brain regions to particular cognitive functions and, most
relevant for this chapter, the treatment of psychiatric diseases.
The potential of repetitive TMS in the treatment of psychiatric disor-
ders was suggested for the first time relatively soon after the development
of the first TMS device in 1985. In a study on motor conductivity,
changes in mood in several normal volunteers who received single pulses
over the motor cortex were described (Bickford, Guidi, Fortesque, &
Swenson, 1987). Following this initial observation, the technical progress
and the increasing availability of TMS devices has led to the opportune
investigation of rTMS in the treatment of depression. Apart from being
the first investigated psychiatric application, it is also the most investigated
psychiatric application in many centers all around the world. In addition,
a TMS device has been approved by the FDA in late 2008, and a growing
number of private outpatient as well as hospitalized patients with depres-
sion are treated in clinical settings (approximately 150 US centers in the
middle of 2010).
Major depression is a common disorder, with millions of sufferers
around the world and a lifetime prevalence of about 13% in men and 21%
in women (Blazer et al., 1994). The World Health Organization has pre-
dicted that depression will globally become the second largest burden of dis-
ease by 2020, following cardiovascular conditions (Murray & Lopez, 1997).
Individuals with depression experience a wide range of symptoms, includ-
ing a loss of interest or pleasure, feelings of sadness, guilt, low self-esteem,
disturbances in sleep and appetite, poor concentration and suicidal ideations
(DSM-IV, American Psychiatric Association, 1994). It is obvious that major
depression has a disabling effect on daily activity, indicating that effective
treatment is crucial. Treatment with antidepressant medication is the most
common and first line treatment for many individuals. However, a signifi-
cant percentage of patients do not sufficiently respond to antidepressant
medication (Keller et al., 2000; Kirsch et al., 2008; Rush et al., 2006) and
some of the patients proceed to electroconvulsive therapy (ECT). Despite
259Repetitive Transcranial Magnetic Stimulation in Depression
some remarkable clinical results (Husain et al., 2004), ECT is a controversial
and unpopular treatment option due to the required induction of a seizure
and associated side-effects such as memory loss (Robertson & Pryor, 2006).
Following initial positive results with depression, and due to its painless and
non-invasive administration, rTMS has been proposed as a “better” alterna-
tive to ECT (Paus & Barrett, 2004) or as an alternative for patients who
may not be willing to undergo ECT, or for whom ECT may not be suit-
able. In order to compare efficacy of these treatments, rTMS and ECT have
been jointly investigated in several studies (Eranti et al., 2007; Rosa et al.,
2006). Of the several studies performed, Eranti et al., (2007) observed a
great advantage for ECT. However, others (Grunhaus et al., 2003;
Pridmore et al., 2000; Rosa et al., 2006) found comparable efficacy rates for
ECT and rTMS in the treatment of depression. Notably, studies that have
reported an advantage of ECT have compared an unlimited number of usu-
ally flexibly administered (unilateral or bilateral) ECT treatments to a fixed
number of only one type of rTMS, potentially biasing the results of these
studies. In addition, Eranti et al. (2007) included patients with psychotic
depression whereas the other studies only involved non-psychotic depres-
sion (Grunhaus et al., 2003; Pridmore et al., 2000; Rosa et al., 2006), sug-
gesting that rTMS might not be the best treatment option for the treatment
of depression with psychotic features.
The early reports of rTMS as an antidepressant treatment modality
consisted of pilot studies with a small number of subjects. In these early
studies arbitrary stimulation parameters over various and non-specific
brain regions were applied (Hoflich et al., 1993; Kolbinger et al., 1995).
A report by George et al. (1995) showed robust improvements in depres-
sive symptoms in two out of six patients. This study marked the start of
the serious pursuit of rTMS as a potential treatment option for depressed
patients. Subsequently, a reasonably large number of open-label as well as
randomized sham-controlled studies were performed. Most studies found
a moderately favorable treatment effect for rTMS using various designs
(Avery et al., 2006; Fitzgerald, Huntsman, Gunewardene, Kulkarni, &
Daskalakis, 2006; Fitzgerald et al., 2003; George et al., 2010; Mogg et al.,
2008; O’Reardon et al., 2007; Padberg et al., 1999; Rossini et al., 2005),
which has recently been confirmed by several meta-analyses (Schutter,
2009; Schutter, 2010). However, some researchers could not replicate
these findings and found no differences between sham and active treat-
ment conditions (Loo et al., 2003; Nahas, Kozel, Li, Anderson, &
George, 2003).
260 Desirée Spronk et al.

After 15 years of research, the general consensus is that rTMS treat-
ment in depression has potential, but has not yet fully lived up to initial
expectations. In large part this is due to limited understanding of the
mechanisms underlying the clinical treatment effect. A substantial research
effort, already in progress, may elucidate the mechanisms of the beneficial
effects of rTMS in depressed patients. Hopefully, results of this effort will
lead to continued improvements in treatment protocols, and provide
patients with the best possible treatment of their depression.
In this chapter, a comprehensive overview of rTMS in the treatment of
depression will be provided. In the first section various rTMS protocols
will be reviewed in terms of the different stimulation parameters that are of
interest. Subsequently, some potential physiological mechanisms that are
associated with antidepressant outcome will be reviewed. In regard to this,
we present an overview of rTMS-induced effects found in imaging studies,
pharmacological studies, and genetic studies. Finally, we will address new
developments in the field.
PROTOCOLS
The behavioral effects of rTMS have been found to depend on the fre-
quency, intensity, and duration of stimulation (e.g. Avery et al., 2006;
Fitzgerald et al., 2006b; O’Reardon et al., 2007; Padberg et al., 2002). The
most important parameters that rTMS protocols in depression can be dis-
tinguished on are the stimulation frequency and the stimulation location.
These will be discussed at length by reviewing literature that used diverse
choices for these parameters. Some other relevant parameters (intensity,
number of trains, inter-train interval, and number of sessions) will be
briefly described. In Figure 10.2, some of the characteristics of an rTMS
stimulation protocol are illustrated.
Progress in the development of technical aspects of TMS devices and
advancing insights have led to a continuing progression of experimental
and innovative protocols. Some more recently developed protocols investi-
gated in the treatment of depression, such as theta burst stimulation and
deep TMS stimulation, are discussed in the section “New Developments”.
Stimulation FrequencyThe stimulation frequency refers to the number of pulses delivered per
second, as can be programmed on the TMS device. Examination of these
rTMS studies in depression reveals that, at first glance, two types of studies
261Repetitive Transcranial Magnetic Stimulation in Depression

can be discerned: studies performing high-frequency (also referred to as
fast) rTMS (HF-rTMS) and studies in which low frequency (also referred
to as slow) rTMS (LF-rTMS) parameters are applied. HF-rTMS usually
includes frequency parameters of 5Hz or above, whilst LF-rTMS incor-
porates stimulation frequencies of 1Hz or below. HF-rTMS is usually
applied over the left prefrontal cortex, whilst LF-rTMS is mostly applied
over the right prefrontal cortex (see “Stimulation Location” below for a
more elaborate review). In addition to studies applying solely HF-rTMS
or LF-rTMS, combined approaches have been proposed.
High-Frequency rTMSMost rTMS studies in depression to date have been performed by means
of applying high-frequency stimulation (Avery et al., 2006; George et al.,
2010; O’Reardon et al., 2007). HF-rTMS protocols have mostly used
stimulation frequencies of 10 Hz (but this has varied from 5 to 20 Hz).
10 s
1 Hz
1 s 10 s
5 Hz
1 s
2 s (40 pulses)
20 Hz
2 s (40 pulses)
1 s
28 s
10 Hz
Figure 10.2 Examples of 10 s of rTMS at 1 Hz (first trace) and at 5 Hz (second trace);1 s of rTMS at 10 Hz and an example of 20 Hz application (trains of 2 s interleaved bya pause of 28 s). (Adapted from Rossi, Hallett, Rossini, Pascual-Leone, & The Safety ofTMS Consensus Group, 2009.)
262 Desirée Spronk et al.

In the largest study to date, O’Reardon et al. (2007) reported significantly
better clinical results in an active rTMS group in comparison to the sham
group, as measured by the Hamilton Rating Scale for Depression
(HAM-D) and the Montgomery Asberg Depression Rating Scale
(MADRS). This was a randomized study in which 301 medication-free
patients were treated with 10 Hz stimulation frequency. In a recent non-
industry sponsored trial, George and colleagues (2010) demonstrated that
10 Hz HF-rTMS yielded a remission rate of 14% in the active group as
compared to 5% in the sham. The total number of intention-to-treat
patients was 190, a group that was characterized by a highly treatment-
resistant depression. Apart from these large multi-center studies, numerous
single site studies applying stimulation frequencies of 10 Hz have been
performed. These have showed response (more than 50% decrease on the
depression scale) rates between 30 and 50% (Avery et al., 2006; Garcia-
Toro et al., 2001; George et al., 2010; Mogg et al., 2008; O’Reardon
et al., 2007; Padberg et al., 1999; Rossini et al., 2005). Most of these
studies have been performed in treatment-resistant patients. A few trials
that have applied frequencies of 5, 17, or 20 Hz have been reported
(Fitzgerald et al., 2006b; Luborzewski et al., 2007). In Fitzgerald’s study
(Fitzgerald et al., 2006b), patients who did not respond to a protocol with
frequencies of 1 or 2 Hz (LF-rTMS see below) were assigned to either 5 Hz
or 10 Hz HF-rTMS protocol. No significant differences in response to 5 or
10 Hz were shown. In addition, Luborzewski and colleagues (2007) have
shown beneficial treatment effects in patients who had received 10 sessions
of 20 Hz rTMS. Due to the limited number of studies no definitive conclu-
sions can be drawn, but results suggest that 5, 17 or 20 Hz stimulation
frequencies do at least have antidepressant effects. However, some reports
have shown differential effects of different stimulation parameters, including
a report of 9 Hz rTMS tending to be less beneficial than 10 Hz (Arns,
Spronk, & Fitzgerald, 2010). To summarize, it is not yet known which exact
frequencies appear to be the most beneficial in HF-rTMS, but 10 Hz rTMS
has been investigated best and is often used.
Low-Frequency rTMSIn addition to the HF-rTMS studies in the treatment of depression, sev-
eral LF-rTMS studies have been performed (Fitzgerald et al., 2003; Januel
et al., 2006; Klein et al., 1999). For example, Klein et al. (1999) showed
in a large sham-controlled study that 1 Hz rTMS, in which 70 patients
were randomly assigned to sham or active treatment, yielded a response
263Repetitive Transcranial Magnetic Stimulation in Depression

rate of 49% in the active treatment as compared to 25% in the sham. This
study also showed a significant larger improvement in depression scores in
the active as compared to the sham group. In the largest controlled study
on LF-rTMS in depression, 130 patients were initially assigned to a stimu-
lation protocol of either 1 or 2 Hz (Fitzgerald et al., 2006b). Of the 130
patients enrolled, approximately 51% could be classified as responders after
10 days of treatment. Interestingly the response rates between the 1 Hz
and 2 Hz did not significantly differ. Although LF-rTMS is a more
recently developed protocol and is less well studied, it appears to have
beneficial effects comparable to HF-rTMS.
In order to systematically investigate if HF or LF-rTMS is more benefi-
cial, protocols were directly compared (Fitzgerald et al., 2003; Fitzgerald,
Hoy, Daskalakis, & Kulkarni, 2009; Isenberg et al., 2005). In a double-
blind, randomized, sham-controlled study, 60 treatment-resistant patients
were allocated into three groups; one received HF-rTMS trains to the left
prefrontal cortex at 10 Hz, the second group received LF-rTMS trains at
1 Hz to the right prefrontal cortex and the third group received sham treat-
ment. The clinical results showed that the groups treated with HF-rTMS
and LF-rTMS had a similar reduction in depressive symptoms, and for
both groups, treatment response was better than within the sham group
(Fitzgerald et al., 2003). In another study with a similar aim, 27 subjects
were assigned to either HF-rTMS (10Hz) or LF-rTMS (1Hz) rTMS. It
was concluded that both treatment modalities appeared to be equally effi-
cacious (Fitzgerald et al., 2009a). Schutter (2010), based on a meta-analysis
of all randomized controlled LF-rTMS studies in depression, suggested
that LF-rTMS might even be more beneficial than HF-rTMS. However,
direct comparisons of the effect sizes of HF and LF-rTMS did not show a
statistically significant difference. More research with larger samples is
required to confirm these findings and demonstrate if LF-rTMS and HF-
rTMS are similarly efficacious, or if LF-rTMS is more efficacious than
HF-rTMS. Aside from the comparison of clinical effects, it appears that LF-
rTMS is better tolerated, i.e., patients reported less headaches. It may also
minimize the risk of inducing adverse events like seizures (Schutter, 2010).
Although the vast majority of studies have focused on low-frequency
stimulation applied to the right and high-frequency stimulation applied to
the left prefrontal cortex, it is to be noted that in a few studies parameters
have varied from these traditional sites. Some have suggested that low fre-
quency stimulation applied to the left may also have antidepressant effects,
thus questioning the traditional model of laterality in depression.
264 Desirée Spronk et al.

Combined HF and LF-rTMS protocolsThese aforementioned studies demonstrate evidence that active HF-rTMS
and LF-rTMS are more effective in the treatment of depression as com-
pared to sham. However, HF-rTMS and LF-rTMS are not necessarily
incompatible with each other. In recent years, add-on, bilateral-sequential,
and priming protocols have been postulated and investigated.
Add-on protocols concern the combination of one protocol with
another protocol, e.g., when patients do not respond to LF-rTMS after
several sessions, they can proceed to HF-rTMS treatment. In the afore-
mentioned study by Fitzgerald et al. (2006b) in which LF-rTMS was
investigated, non-responders to the low frequency protocol subsequently
were treated with HF-rTMS. A subset of these LF-rTMS non-responders
did respond to HF-rTMS. Hence, it is likely that different protocols act
through different mechanisms and that different patient groups are suscep-
tible to different approaches. It could also be argued that subjects in the
add-on protocol received more sessions, and possibly needed longer to
respond to treatment. Thus, the full extent of the increase in response rate
might not solely be attributable to the change in stimulation frequency.
A second variant is the sequential stimulation protocol in which within
one session both HF-rTMS and LF-rTMS are applied. This protocol was
examined in a double-blind study that included 50 patients with depres-
sion. Half of the group received 1 Hz rTMS over the right prefrontal cor-
tex, followed by HF-rTMS over the left prefrontal cortex in the same
session, for a period of 4�6 weeks. The other half of the patients received
sham stimulation in the same protocol. The higher response rates in the
treatment group (44% vs. 8% in sham) suggested that a within-session LF/
HF combination protocol might be more effective than applying either
protocol alone (Fitzgerald et al., 2006a). However, this hypothesis could
not be confirmed by a recent study by Pallanti et al. (2010) in which a
sequential combination protocol was compared with unilateral LF-rTMS
and sham. Of the three groups, patients who were treated with the unilat-
eral LF-rTMS protocol benefited most from treatment. The authors
propose that these results, in contrast to the findings of Fitzgerald et al.
(2006a), suggest that a “simple” unilateral protocol is the first treatment of
choice. Nevertheless, the authors believe that it remains relevant to further
explore combination protocols and compare them to traditional unilateral
protocols.
A third option is the unilateral combination of high and low frequency
stimulation in a protocol referred to as “priming” stimulation. This involves
265Repetitive Transcranial Magnetic Stimulation in Depression

the application of low intensity high-frequency trains (usually 6 Hz) followed
by standard low frequency stimulation. Basic neurophysiological studies have
shown that priming stimulation results in greater suppression of cortical
excitability than low-frequency stimulation applied alone (Iyer, Schleper, &
Wassermann, 2003). A single clinical study has compared such priming stim-
ulation to 1 Hz TMS (both applied to the right side) and shown a greater
clinical effect in the priming group compared to the sham group (Fitzgerald
et al., 2008).
Stimulation LocationThe dorsolateral prefrontal cortex (DLPFC) has been the primary area of
interest for stimulation (see Figure 10.3). The motivation behind choosing
this brain area stems from various imaging studies that indicated depression
is associated with regional brain dysfunction in, among other regions, the
DLPFC (Cummings, 1993). Other researchers have not only proposed an
“underactivated” L-DLPFC, but suggested an imbalance between frontal
regions. For example, the “frontal asymmetry hypothesis” of depression
states that in depression there is an imbalance in left vs. right frontal brain
activation (Henriques & Davidson, 1990; but also see Chapter 4 in this
volume). In addition, of all brain regions known to be related to the patho-
physiology of depression (e.g., prefrontal, cingulate, parietal, and temporal
cortical regions, as well as parts of the striatum, thalamus, and hypothala-
mus) the DLPFC is regarded as most accessible for treatment with rTMS
(Wassermann & Lisanby, 2001). On the basis of such previous theories and
Dorsolateral prefrontalcortex
Figure 10.3 Image of the location of the (left) dorsolateral prefrontal cortex in thebrain.
266 Desirée Spronk et al.

findings, the supposedly activating/HF-rTMS protocols are applied over
the left DLPFC and supposedly inhibiting/LF-rTMS protocols are applied
over the right DLPFC. The choice of the stimulation frequency is thus
closely linked to the stimulation location.
In most studies, localizing the DLPFC has been performed by means
of the “5 cm rule”. The hand area of the primary motor cortex (M1)
(which elicits a contralateral motor response of the thumb when stimu-
lated), is taken as the detectable reference point. From there, the coil is
moved 5 cm anteriorly, in a sagittal direction. Positioning the coil at that
location during treatment is assumed to target the DLPFC. It can be
argued that this literal “rule of thumb” has some flaws and may result in
inconsistent results between sessions within subjects. Moreover, it may
not target the DLPFC at all due to differences in head size and shape
across individuals and � even more relevant � in the folding patterns of
the cortex. In order to solve this problem, technical advances have
enabled structural MRI-based neuronavigation systems. In neuronaviga-
tion, an MRI of a patient’s brain is acquired before treatment. A series of
software co-registrations are made between real anatomical points on the
head (which are fixed in location) and the corresponding anatomical points
in a three-dimensional reconstruction of the patient’s MRI scan. This
allows one to establish the scalp point that corresponds to a location on the
brain scan that becomes the proposed target for TMS treatment. A more
complicated process can also allow the position and orientation of the coil
relative to the corresponding brain region to be monitored in real time. In
a study by Herwig et al. (2001) the reliability of the “5 cm rule” was inves-
tigated by means of comparing the target area defined by the “5 cm rule”
with the target defined by DLPFC neuronavigation. Of the total 22 sub-
jects, the targets corresponded in only seven. In a similar study, it was found
that the true DLPFC was in general located more anteriorly to the site
traditionally identified by the “5 cm rule” (Fitzgerald et al., 2009b).
Together, these studies suggest that clinical efficacy may be improved
by means of more precise targeting methods. This has been directly tested
in one study with 52 patients who were randomized to stimulation local-
ized by the “5 cm rule” or neuronavigation (Fitzgerald et al., 2009b).
Neuronavigationally targeted treatment resulted in a statistically significant
greater response in depression scores than treatment targeted by the tradi-
tional method.
Despite the fact that the majority of the studies target the DLPFC,
some authors have argued that it has never been experimentally proven
267Repetitive Transcranial Magnetic Stimulation in Depression

that the DLPFC is the most effective target for rTMS treatment of depres-
sion. In addition, the pathophysiology of depression is certainly not limited
to the DLPFC (Drevets, Price, & Furey, 2008). Investigation of antidepres-
sant effects of rTMS applied to other brain regions has therefore been
explored (Schutter, Laan, van Honk, Vergouwen, & Koerselman, 2009).
Schutter and colleagues (2009) applied 2 Hz rTMS at 90% of the motor
threshold (see next section) to the right parietal cortex in a group of
patients with depression for a period of 10 sessions. Their findings did not
show statistically significant changes between the active and sham group.
However, comparison of both groups on a partial response outcome (at
least a 30% reduction in HAM-D score) showed a significantly higher
response in the active rTMS group as compared to the sham group. This
result suggests that targeting the right parietal cortex with 2 Hz rTMS may
have antidepressant properties, although the effects were not as strong as
compared to frontal HF or LF-rTMS. Although these findings need to be
replicated in larger studies, they are encouraging regarding searching for
other cortical targets in the treatment of depression with rTMS.
Stimulation Intensity, Trains, and SessionsFor rTMS to be effective, the magnetic field has to induce currents in the
neurons of the cortex. The intensity of the magnetic field that induces
this current is referred to as the stimulation intensity. This is usually
expressed as a percentage of the motor threshold (MT). The MT is usu-
ally determined prior to each session by applying the TMS coil over the
“thumb” area of the motor cortex. Single pulses are applied by stepwise
variation of the output intensity of the device. The minimal output inten-
sity which yields a motor response (moving of the thumb) in at least half
of the applied trials is determined to be the MT. So if the intensity of a
TMS protocol is 100% MT, then it is the same as the output intensity of
the device which was determined to be MT. All other intensity values are
reflected as a percentage of this MT, e.g., if the MT is at an output inten-
sity of the device of 60%, then an intensity of 110% MT means that the
output intensity is 66%. Although this determination of stimulation inten-
sity may seem arbitrary, it takes individual differences in motor cortex
excitability (and therefore excitability of other brain regions) into account.
This contributes to a safer administration of TMS pulses to an individual.
In depression protocols reported to date, the lowest stimulation intensity
used was 80% MT (George et al., 1995) and the maximal intensity used
268 Desirée Spronk et al.

was 120% MT (O’Reardon et al., 2007; Rumi et al., 2005). The majority
of the depression protocols use stimulation intensities of 100% MT or
110% MT. In a study by Padberg et al. (2002), in which the relation
between treatment efficacy and stimulation intensity was investigated,
patients who were treated with a HF-rTMS (10 Hz) protocol at 100%
MT showed a 30% decrease in depressive symptoms as measured by the
HAM-D, as compared to a 15% decrease for patients who were treated
with the same protocol but at 90% MT. This result, among others, sug-
gests more beneficial outcomes for higher stimulation intensities. Therefore,
more recent studies have used intensities of 110% and 120% MT
(O’Reardon et al., 2007; Rumi et al., 2005), in contrast to earlier research
where intensities between 80% and 100% MTwere more common (George
et al., 1997; Kimbrell et al., 1999).
In most rTMS protocols the stimulation is delivered in pulse trains
(see Figure 10.2). That is, pulses are delivered in series separated by cer-
tain time intervals � the inter-train interval (ITI). This is done for two
reasons. First, the effect of TMS pulses is cumulative in the brain (Hallett,
2007; Ridding & Rothwell, 2007), and this summation causes an increase
of the likelihood of the induction of a seizure (the most serious potential
side effect associated with rTMS). In several reports, safety guidelines in
which maximum recommended values of stimulus parameters like stimu-
lus intensity, train duration, number of trains, and ITI are provided for the
safety of the patients (Rossi et al., 2009; Wassermann, 1998). Secondly,
the repetitive release of strong electrical pulses causes heating of the elec-
tronics of the TMS device. The ITI between trains allows the device to
partially cool down. Due to safety reasons for the subject and protection
of the device, all devices are manufactured to automatically turn off as
soon as a certain heat-limit has been reached. Newer TMS devices are
designed with better cooling systems (e.g., air- or fluid-cooled coils),
which reduce the likelihood of overheating. However, the overheating of
the device is still possible when multiple sessions are performed within a
short period, or if a highly demanding (e.g., high rate of pulse delivery)
protocol is performed. Train durations in HF-rTMS protocols are usually
between 2 and 10 seconds with an ITI between 20 and 60 seconds. In
LF-rTMS protocols often continuous stimulation is used.
In studies performed thus far, the number of sessions applied has been
highly variable, ranging from five sessions (Manes et al., 2001; Miniussi
et al., 2005) to up to or greater than 30 sessions (Fitzgerald et al., 2006b;
O’Reardon et al., 2007). However, to date, the majority of studies have
269Repetitive Transcranial Magnetic Stimulation in Depression

involved a total of 10 sessions (for example, Fitzgerald et al., 2003; Garcia-
Toro et al., 2001; Koerselman et al., 2004; Poulet et al., 2004). Based on
more recent studies, a general trend towards a greater number of sessions
(.10) is associated with continuing improvement in depression scores
(Fitzgerald et al., 2006b; Rumi et al., 2005). Schutter (2009) suggested that
similar to antidepressant medication, rTMS treatment may involve a delayed
therapeutic onset. Investigation of the number of sessions optimally required
is important for gaining information about the temporal course of the anti-
depressant effect.
The variety of protocols discussed above indicate that rTMS is an active
field of research. Treatment outcome has been shown to vary with proto-
cols, but some protocols have proven their efficacy. However, it has been
argued that it is unlikely that the current combinations of stimulation para-
meters potentiate optimum clinical effects. It is likely that there is much
room for improvement, and studies directly addressing the question of
optimal stimulation parameters are urgently required. This statement is fur-
ther supported by the finding that early rTMS depression protocols have
shown less favorable results compared to relatively newer, more promising
protocols (Gross et al., 2007). Increasing knowledge about the mechanisms
underlying treatment efficacy � the topic of the next section � may result
in new protocols with closer to optimal treatment effects.
MECHANISMS OF rTMS TREATMENT IN DEPRESSION
With rTMS the goal is to modulate brain activity, with a resultant reduc-
tion of depressive symptoms. Although clinical results appear promising,
mechanisms explaining the symptomatic reduction are unknown. In order
to optimize rTMS for therapeutic use, it is necessary to gain a better
understanding of possible neurobiological mechanisms underlying the clin-
ical response. This is currently a topic of active interdisciplinary research.
Knowledge of neurobiological mechanisms to date is derived from
neuroimaging studies, studies on neurotransmitter and neuroendocrinolo-
gic systems, and from gene expression research. Together, these efforts
will hopefully explain the substrate of the antidepressant effects of rTMS.
In the following paragraphs, studies in each of the fields mentioned above
on rTMS-induced changes will be reviewed. The neurophysiology of rTMS
at the neuronal level in general is outside the scope of this review. However,
the interested reader is referred to an excellent review by Wassermann and
colleagues on this topic (Wassermann et al., 2008).
270 Desirée Spronk et al.

NeuroimagingThe combination of rTMS with neuroimaging research provides a unique
opportunity to elucidate the underlying mechanisms of rTMS in the
treatment of depression. Most imaging studies to date have used positron
emission tomography (PET) or single-proton emission computed tomog-
raphy (SPECT) to identify brain regions with altered blood flow or glu-
cose metabolism as a result of rTMS. These modalities have lower temporal
resolution compared to functional magnetic resonance imaging (fMRI), and
therefore not much is known about the time course of brain activation in
response to rTMS. Recently, however, some studies using near-infrared
spectroscopy (NIRS) have been performed (Aoyama et al., 2009; Hanaoka,
2007; Kozel et al., 2009).
As discussed in the “Protocols” section, in most depression protocols
rTMS is applied over the left or right DLPFC. Several neuroimaging
studies have indeed demonstrated rTMS-induced changes within the
DLPFC. HF-rTMS over the left DLPFC of depressed patients induces a
local increase in regional cerebral blood flow (rCBF) as indicated by
SPECT (Catafau et al., 2001; Loo et al., 2003; Kito et al., 2008a; Speer
et al., 2000) and fMRI BOLD response (Cardoso et al., 2008). In con-
trast, imaging studies of LF-rTMS over the right DLPFC showed a local
decrease in rCBF (Kito, Fujita, & Koga, 2008; Loo et al., 2003; Speer
et al., 2000). It should be noted, however, that in an fMRI study
Fitzgerald and colleagues (2007) could not replicate the local decrease in
BOLD response following LF-rTMS. Instead, a bilateral frontal reduction
in BOLD response was observed.
In early studies using PET/SPECT it was shown that changes in brain
activation induced by rTMS were not limited to the stimulated area
(Paus, Jech, Thompson, Comeau, Peters, & Evans, 1997). A single TMS
pulse can lead to effects in more distal brain areas within the same net-
work as the stimulated area (Siebner et al., 2009). In a similar vein,
rTMS-induced changes in brain activity in depression may not necessarily
be limited to the DLPFC; remote regions are often in good accordance
with areas known to be associated with the pathophysiology of depression
(reviewed in Fitzgerald et al., 2006c). In support of this theory, imaging
studies cited above have also found changes in blood flow in remote/sub-
cortical brain regions following rTMS (Baeken et al., 2009; Loo et al.,
2003; Speer et al., 2000). Other brain regions that have been reported to
show a change in rCBF after HF-rTMS over the left DLPFC are the
271Repetitive Transcranial Magnetic Stimulation in Depression

ventrolateral prefrontal cortex, right-dominant orbitofrontal cortex, the
anterior cingulate, the left subgenual cingulate, the anterior insula, and
the right putamen/pallidum (Kito et al., 2008a). Of clinical relevance, it
was demonstrated that increases in rCBF in the L-DLPFC are related to
significant improvement in clinical outcomes, and that increases in the
R-DLPFC and subcortical regions mentioned above are negatively corre-
lated with the change in depressive symptoms (Kito et al., 2008b).
One neuroimaging study has directly compared the effects of high fre-
quency stimulation applied to the left side with low frequency stimulation
applied to the right (Fitzgerald et al., 2007). This study, using fMRI record-
ings during a cognitive task, found that low frequency stimulation produced
a bilateral reduction in neural activity whereas high frequency stimulation
had the opposite effect. The direction of these effects was in keeping with
traditional models of the effect of low and high frequency TMS. However,
the fact that changes were produced bilaterally when both groups improved
clinically to a similar degree, is not consistent with laterality models of
depression, such as that proposed by Henriques and Davison (1990).
Event-related potentials (ERPs), and especially late ERPs, are related
to cognitive processes such as attention, stimulus evaluation, and early visual
detection. Similar to other psychiatric disorders, a reduced P300 amplitude
is often observed in depression (Blackwood, Whalley, Christie, Blackburn,
St Clair, & McInnes, 1987; Himani, Tandon, & Bhatia, 1999). In a study
by Moller et al. (Moller, Hjaltason, Ivarsson, Stefansson, 2006) it was dem-
onstrated that active TMS was associated with a significant increase in the
P300 amplitude after 5 daily HF-rTMS sessions over the left DLPFC. In a
study by our own group it was shown that using an auditory oddball para-
digm, patients who were treated with HF-rTMS over left DLPFC showed
localized changes on N1, P2, N2, and P300 amplitudes over left frontal
areas, but not over the right frontal region. These results were interpreted
as an increased positivity in the ERP which was localized to the stimulated
area only (Spronk et al., 2008).
These findings demonstrate specific and selective alterations induced
by repeated rTMS, which are distinct from those induced by other anti-
depressant treatments. The rTMS induced effects on neuroanatomical
functions are commensurate with some known abnormalities in depres-
sion, e.g., decreased rCBF and metabolism values shown in a number of
imaging studies (Baxter et al., 1989; Biver et al., 1994). Additionally, other
research has shown similar changes in rCBF and metabolism relating to
improvement of depression either after spontaneous recovery (Bench,
272 Desirée Spronk et al.
Frackowiak, & Dolan, 1995) or after treatment with antidepressant medi-
cation (Kennedy et al., 2001).
Neurochemical Effects: Neurotransmittersand NeuroendocrinologyApart from altering rCBF in stimulated regions and connected networks,
rTMS also has an effect on the neuroendocrinologic (Post & Keck, 2001)
and neurotransmitter systems (Ben-Shachar, Belmaker, Grisaru & Klein,
1997; Strafella, Paus, Barrett & Dagher, 2001). Many lines of research on
antidepressant mechanisms have focused on monoaminergic neurotransmis-
sion, i.e., through dopamine, norepinephrine and serotonin. Depression is
thought to be associated with deficiencies in monoaminergic neurotransmis-
sion, and antidepressant medication is thought to act through enhancement
of monoamines. These three neurotransmitter systems have also been investi-
gated in relation to rTMS treatment (Ben-Shachar et al., 1997; Keck et al.,
2000), and most studies support a role for the dopaminergic system. By
means of microdialysis techniques in animal models, it was demonstrated
that HF-rTMS induced an increase in the release of dopamine in the hippo-
campus (Ben-Shachar et al., 1997; Keck et al., 2000; Keck et al., 2002), the
nucleus accumbens (Keck et al., 2002; Zangen & Hyodo, 2002) and dorsal
striatum (Keck et al., 2002). It should be noted, however, that there are
many methodological issues making interpretations from animal rTMS
research difficult, such as the size of the head in relation to the coil size.
A few years later rTMS-induced changes in dopamine were investi-
gated for the first time in human subjects. Strafella et al. (2001) found an
increased dopamine release after HF-rTMS over the left DLPFC in the
ipsilateral nucleus accumbens of healthy subjects by use of PET imaging
(Strafella et al., 2001). The observation that increased dopamine levels
were found only in the ipsilateral striatal area (site of stimulation) was par-
ticularly interesting, because it suggests that the increased release was
exerted through cortico-striatal projections from the targeted DLPFC
(Strafella et al., 2001). Taking this one step further, Pogarell and colleagues
also found an increased striatal dopamine release in a small group of depressive
patients after HF-rTMS over the left DLPFC by using SPECT (Pogarell
et al., 2006; Pogarell et al., 2007). In these two studies, no correlation
between the binding factors reflecting dopamine release and clinical out-
come could be demonstrated. This needs to be investigated further in larger
controlled studies (Pogarell et al., 2006).
273Repetitive Transcranial Magnetic Stimulation in Depression

In the study performed by Keck and colleagues (2002), a rTMS-
induced effect on dopamine was found by using intracerebral microdialy-
sis, but no effects on norepinephrine and serotonin were found. This
finding suggests that rTMS mainly targets the dopamine system. Nevertheless,
there are some indications that rTMS might modulate serotonergic neuro-
transmission. For instance, Juckel et al. (1999) showed that electrical stimula-
tion of the prefrontal cortex of the rat resulted in an increased serotonin
level in the amygdala and hippocampus; a similar pattern of release may
occur after stimulation by rTMS. In addition, studies on serotonergic
receptors and binding sites (which indirectly provide a measure of availabil-
ity of certain neurotransmitters in the brain) after a single TMS session in a
rat model showed an increase in serotonergic binding sites (Kole et al.,
1999), and downregulation of receptors in cortical as well as subcortical
areas (Ben-Shachar et al., 1999; Gur, Lerer, Dremencov, & Newman,
2000). With the exception of Keck et al. (2000) who found no effects on
serotonin, no rTMS research has been conducted on the serotoninergic
system in depression models, or in human depressed patients. This makes
claims about TMS-induced changes on serotonin release highly specula-
tive. Similarly speculative are claims regarding the effects of rTMS on the
third member of the monoaminergic group, noradrenalin (norepineph-
rine). Limited studies are available and the findings are heterogeneous.
Keck et al. (2000) found no changes on noradrenalin. Conversely, a study
in mice found increased levels of monoaminergic transporter mRNA after
a 20-day rTMS course. That was also associated with the binding and
uptake of noradrenalin (Ikeda, Kurosawa, Uchikawa, Kitayama, & Nukina,
2005).
Another possible mechanism through which rTMS exerts its antidepressant
effect involves the modulation of GABA and glutamate, which, respectively,
are the main inhibitory and excitatory neurotransmitters. Both neurotransmit-
ters are known to be associated with the pathology of depression and change
with clinical improvement in depression (Petty et al., 1992). So far, only a few
studies have directly addressed rTMS-induced changes in GABAergic neu-
rotransmission. In an animal model, GABAergic levels were increased in
hippocampal regions and striatum, and reduced in hypothalamic regions
after 15 days of LF-rTMS stimulation (Yue, Xiao-Lin, & Tao, 2009). The
same authors looked at glutamatergic changes and found similar results: an
increase in glutamate in striatal and hippocampal regions, but a decrease in
the hypothalamus (Yue et al., 2009). Additionally, in an in vivo study of
depressed patients with a specific focus on the nucleus accumbens, changes
274 Desirée Spronk et al.

in glutamate levels were observed after successful treatment of 10 HF-rTMS
sessions (Luborzewski et al., 2007). Interestingly, the pre-treatment baseline
level was related to treatment effects. Responders showed lower pre-
treatment glutamate levels, and showed the highest increase in glutamate
after successful treatment (see also later section on “Optimizing
Treatment”). This suggests that in at least some of the patients, a reduction
of depressive symptoms may happen through a restoration of relative gluta-
mate levels (Luborzewski et al., 2007).
Repetitive TMS is known to exert changes in excitability thresholds
on a neuronal level. It is known that LF-rTMS in particular induces pro-
longed decreases in motor cortex excitability (Chen et al., 1997), while
HF-rTMS induces an increase in motor cortex excitability (Pascual-Leone,
Valls-Sole, Wassermann, & Hallett, 1994). Cortical excitability is thought
to be maintained by a balance of neurotransmitter levels of GABA and
glutamate. It can be hypothesized that glutamate and GABA in this animal
model is mediated by excitability levels. To the best of the author’s
knowledge, only Luborzewski’s study (2007) investigated rTMS-induced
changes in levels of glutamate in depressed patients. More research on
the release of GABA and glutamate by means of using in vivo techniques
is needed to better specify the involvement of these neurotransmitters.
In addition, future studies should specifically address the relationships
between GABA/glutamate, treatment, and outcome.
NeurotrophinsAnother candidate as a mechanism for the rTMS treatment effect in
depression is the modulation and release of neurotrophins. BDNF is a
neurotrophin, which plays a role in survival of neuronal cells and in syn-
aptic plasticity and connectivity (Bath & Lee, 2006). In patients with
depression, abnormal expression of BDNF has been observed (Shimizu
et al., 2003) and, moreover, an upregulation as a result of antidepressant
medication (Angelucci, Brene, & Mathe, 2005; Shimizu et al., 2003) has
been demonstrated. Since there is extensive literature that indicates a rela-
tion between BDNF and depression (and related outcomes), BDNF
became another likely candidate to investigate in relation to the antide-
pressant treatment response to rTMS.
BDNF serum and plasma levels have, in fact, been investigated in sev-
eral rTMS studies (Angelucci et al., 2004; Yukimasa et al., 2006; Zanardini
et al., 2006). In a preliminary study by Lang et al. (2006) no changes in
275Repetitive Transcranial Magnetic Stimulation in Depression

BDNF serum level were observed after 10 sessions of HF-rTMS treatment.
However, other studies on HF-rTMS-induced effects in treatment of
depression yielded different findings (Yukimasa et al., 2006; Zanardini
et al., 2006). In one study, BDNF serum levels were assessed before and
after a series of five rTMS sessions and considered in relation to treatment
outcome as rated by the HAM-D. Half of the participants (N5 8) were
treated with a LF-rTMS design, while the other half (N5 8) were treated
with a HF-rTMS design. Results showed that BDNF serum levels signifi-
cantly increased over the treatment period. Interestingly, no changes
between the HF and LF group were found, i.e. both showed equal
increases in BDNF levels (Zanardini et al., 2006). In a study by Yukimasa
et al. (2006) a similar relationship between treatment response and BDNF
plasma levels was observed in a group of 26 patients who were treated with
HF-rTMS. BDNF plasma levels increased at the end of the treatment
period, but solely in patients who could be classified as responders (.50%
decrease in depressive symptoms as measured on the HAM-D scale) or par-
tial responders (.25% decrease in depressive symptoms). Together, these
findings suggest that rTMS is indeed able to induce effects on BDNF
levels. The finding that BDNF levels were changed only in the responder
group suggests that the BDNF level is related to the clinical outcome, rather
than simply a physiological effect. This is further supported by the finding
that responses to HF and LF-rTMS appear to be similar.
GeneticsIn the above-mentioned studies, several likely candidates associated with
(and perhaps responsible for) an rTMS-induced antidepressant response
were discussed. Another group of candidates includes genetic effects. As
discussed in the “Neurotrophin” section, the modulation of the expression
of brain-derived neurotrophic factors (BDNF) is a likely modulating factor
through which treatment response is exerted. Hence, it is not surprising,
that some of the genetic studies have focused on BDNF mRNA expression
(Muller, Toschi, Kresse, Post, & Keck, 2000). Muller and colleagues inves-
tigated BDNF mRNA expression in an animal model involving applying
55 HF-rTMS sessions over a period of 11 weeks. They found significant
increases in BDNF mRNA expression in the hippocampus (CA3 region)
and parietal and piriform cortices. In addition, in an animal model of
vascular dementia, mRNA expression in the hippocampal CA1 area was
investigated in two groups of rats; one group received LF-rTMS and the
276 Desirée Spronk et al.

other group received HF-rTMS for a period of six weeks. Both groups
showed an increase in mRNA protein expressions of BDNF (Wang et al.,
2010). However, in yet another genetics study, no rTMS induced effects
on BDNF mRNA expression could be demonstrated (Hausmann, Weis,
Marksteiner, Hinterhuber, & Humpel, 2000), possibly due to a relatively
small number of sessions. Further limitations are that effects were not
shown in a specific animal model of depression in any of these three stud-
ies. Also, the number of studies in this area is limited. For a discussion on
genetic polymorphisms and treatment outcome in human patients see the
section on “Optimizing Treatment”.
NEW DEVELOPMENTS
As a new and dynamic field, rTMS is the topic of a considerable research
and innovative developments are numerous. These developments are of a
diverse nature, including technological progress in equipment and soft-
ware, protocol innovations and optimizations, and advances in the under-
standing of long-term effects. Some examples are the investigation of
applicability of theta burst stimulation (the delivery of bursts of 50 Hz
pulses usually at a rate of 5 Hz) and new equipment such as the H-coil for
deeper brain stimulation.
Progress in ProtocolsIn addition to the “traditional” LF and HF frequency studies, a newly
developed theta-burst stimulation (TBS) protocol has been proposed;
referred to as “patterned TMS”. This has been put forward as a technique
that could have important implications for the treatment of conditions such
as epilepsy, depression, and Parkinson’s disease (Paulus, 2005). TBS usually
involves short bursts of 50 Hz rTMS applied at a rate of 5 Hz (hence the
name theta burst stimulation). In fact there are two frequencies within one
train of stimuli; the inter-burst frequency of 50 Hz (e.g., 3 pulses at a rate
of 50 Hz) and the frequency of delivery of the number of bursts within one
second which is at a rate of 5 per second (5 Hz). TBS can be applied as
either a continuous (cTBS), or intermittent (iTBS) train (Huang, Edwards,
Rounis, Bhatia, & Rothwell, 2005). See Figure 10.4 for an illustration of
both types of TBS protocols.
Until recently, this rapid delivery of pulses as happens in a TBS proto-
col was not possible due to technical limitations of older stimulators. TBS
has therefore only been investigated since 2005 (Huang et al., 2005).
277Repetitive Transcranial Magnetic Stimulation in Depression

In the years after its introduction, it has been shown that TBS induces
changes in cortical excitability that may last longer than traditional TMS
protocols (Huang et al., 2009; Ishikawa et al., 2007). In regard to the
observation of the more sustained effect, Chistyakov, Rubicsek, Kaplan,
Zaaroor, & Klein (2010) suggested that TBS might be more effective than
traditional HF and LF-rTMS in the treatment of depression. They
assigned 33 patients to different types of TBS-TMS treatment protocols
over either left or right DLPFC. Despite the relatively high response rate,
these findings should be regarded as preliminary and non-specific since no
changes between different types of protocols were observed. To the
authors’ knowledge, this is the only study that has investigated the antide-
pressant effect of TBS-TMS in the treatment of depression. However,
since the TBS protocols are assumed to be more capable of inducing
long-lasting effects, it is likely that their application in rTMS depression
treatment will increase in coming years.
Technical ProgressIn response to limitations of currently used coils, a new type of coil “the
H-coil” (Brainsway) was developed. The coils that are in current use
(figure of eight/circular coils) are thought to penetrate underlying brain
tissue only to a depth of 1.5�2 cm and are not capable of directly
20 s (5 Hz)
160 ms
200 ms (3 pulses - 50Hz)
2 s 2 s
1 s
8 s 8 s
Figure 10.4 Examples of the two most common TBS protocols: continuous TBS (firsttrace) and intermittent TBS (second trace). (Adapted from Rossi et al., 2009.)
278 Desirée Spronk et al.

targeting deeper brain regions (Zangen et al., 2005). H-coils, on the other
hand, are capable of stimulating deeper brain regions (Zangen et al.,
2005). To date, there are several reports in which it has been presented
that brain stimulation by means of the H-coil is safe and that there is
potential for use of the coil in clinical applications (Levkovitz et al., 2007;
Zangen et al., 2005). The application of the H-coil in the treatment of
depression is currently under investigation in a multi-site trial.
Optimizing TreatmentA better understanding of the neurophysiological and clinical features of
depressed patients who respond to rTMS, together with clarity on the
neurobiological mechanisms of the induced effect of rTMS treatment in
depression, will contribute to the development of more effective forms of
rTMS. The field involved in identifying such features is referred to as
Personalized Medicine: a research towards establishing patient’s characteris-
tics (clinical, physiological or parametric variables) related to (better) clini-
cal outcome. Especially relevant to the rTMS area is the research on
identifying objective markers of clinical response. Several studies have focused
on addressing this question by investigating specific clinical features. Negative
predictors for treatment outcome identified so far are age (Brakemeier,
Luborzewski, Danker-Hopfe, Kathmann, & Bajbouj, 2007; Fregni et al.,
2006) and therapy resistance (Brakemeier et al., 2007; Brakemeier et al.,
2008; Fregni et al., 2006). These results suggest that elderly patients and
patients with a greater number of prior treatment failures are less likely to
benefit from rTMS. However, this has not been confirmed by all studies in
this area (Fitzgerald et al., 2006b). In contrast, a shorter duration of the
depressive episode and a high severity of sleep disturbance are predictive of
better treatment outcome (Brakemeier et al., 2007).
A different group of potential predictors can be obtained from the neuro-
physiological data. One study indicated that some patients with depression
responded better to LF-rTMS, while others improved only after treatment
with HF-rTMS (Kimbrell et al., 1999). These two patient groups differed
on pre-treatment baseline regional cerebral blood flow. Patients with a rela-
tively low level of rCBF generally responded better to HF-rTMS (20 Hz),
whereas patients displaying relatively high baseline rCBF levels showed a
better response to LF-rTMS (Kimbrell et al., 1999). Baeken et al. (2009)
showed that higher bilateral baseline metabolic activity in the DLPFC
and anterior cingulate cortex correlated with better treatment outcome.
279Repetitive Transcranial Magnetic Stimulation in Depression

In addition, Speer et al. (2009) correlated treatment outcome after 2 weeks
of LF or HF-rTMS with pre-treatment baseline perfusion measures. Baseline
hypo-perfusion was associated with a more beneficial effect of HF-rTMS
compared to LF-rTMS (Speer et al., 2009).
While EEG measures have been relatively well studied in the predic-
tion of treatment response to antidepressant medication (Bruder et al.,
2008; Cook et al., 1999; Spronk et al., 2010), their potential in predicting
response to rTMS treatment is generally considered limited but promising.
In the search for physiological markers for treatment response to rTMS,
Price and colleagues (Price, Lee, Garvey, & Gibson, 2008) investigated
alpha EEG activity measures, i.e., individual alpha power and frequency,
and asymmetry index in 39 patients with treatment resistant depression.
None of the measures was found to be a promising candidate for response
prediction. Recently Daskalakis, Fitzgerald, Greenwald, and Devlin (2008)
were the first to report the potential predictive value of an EEG biomarker
initially developed for prediction of treatment response to antidepressant
medication. This biomarker (labeled antidepressant treatment response
(ATR) index) is measured from frontal electrode positions and is based on
the proportion of relative and absolute theta power. In Daskalakis’ study it
was shown that subjects who could be classified as “responders” after 6
weeks of treatment scored higher on this ATR index. As these early reports
indicate, current knowledge of the utility of EEG in the prediction of anti-
depressant treatment outcome is limited. It has, however, been proposed as
having great potential for predicting response to rTMS in the treatment of
depression. For example, it has been suggested that rTMS can potentially
interact with specific EEG frequency patterns (Funk & George, 2008). In
accordance with this notion, Jin, O’Halloran, Plon, Sandman, and Potkin
(2006) compared different rTMS stimulation frequencies in the treatment
of patients suffering from schizophrenia; two groups received treatment
with conventional frequencies, but one group was treated with a stimula-
tion frequency identical to their individualized frontal alpha peak frequency.
The group who received the individualized frequency showed a higher
reduction in negative symptoms in comparison to the patients who were
treated with standard stimulation frequencies. In a report by Arns et al.
(2010) a similar approach was taken in the treatment of depression.
However, in this study subjects were treated with a stimulation frequency
of one Hz above their individualized alpha peak frequency. The results
demonstrated this type of individualized stimulation frequency was not
280 Desirée Spronk et al.

beneficial. In contrast, this study suggested that there could be differential
effects of different TMS stimulation frequencies; more specifically, 9 Hz
yielded different effects compared to 10 Hz TMS. Furthermore, the study
by Arns et al. (2010) demonstrated a clear relation of an individual alpha
peak frequency to clinical outcome, where a low alpha peak frequency
(7�8 Hz) was associated with lower clinical efficacy. This was also shown in
a study by Conca and colleagues (2000) who found that non-responders to
rTMS had a slower alpha peak frequency. Clearly, more studies are needed
to further explore this.
In addition to demographical and physiological markers, genetic mar-
kers may have potential in the prediction of treatment outcome. Several
genetic polymorphisms have been investigated in relation to antidepressant
treatment outcome in medication studies, for example, BDNF, COMT,
and serotonin-related candidate genes (Benedetti, Colombo, Pirovano,
Marino & Smeraldi, 2009; Peters et al., 2009; Zou, Ye, Feng, Su, Pan, &
Liao, 2010). However, genetics as potential biomarkers for susceptibility to
antidepressant medications is still a relatively novel concept, and only a limi-
ted amount of research has been conducted. This holds also for the investi-
gation of genetic predictors of rTMS treatment outcome. As discussed
previously in this chapter, several studies show treatment-induced changes
on BDNF. To date, in respect to the rTMS treatment of depression several
genetic polymorphisms have been proposed to be related to treatment out-
come. Among them are the genetic polymorphisms associated with BDNF
expression, the BDNF Val66Met (Bocchio-Chiavetto et al., 2008; Cheeran
et al., 2008) and candidate genes related to expression of serotonin
(Bocchio-Chiavetto et al., 2008; Zanardi et al., 2007) (for a discussion of
BDNF and serotonin release, see “Mechanisms” above).
Bocchio-Chiabetto and colleagues (2008) demonstrated in their study
that carriers of the LL variant of the 5-HTTLPR gene showed significantly
greater decreases in depressive symptoms following rTMS (as reflected by
percentage decrease on the HAM-D), in comparison to carriers of the
S allele. The serotonin-related polymorphisms SERTPR and 5-HT(1A)
have also been investigated in relation to depression treatment outcome
(Zanardi et al., 2007). Results indicated that polymorphisms related to both
genes were to some extent related to treatment outcome, but carriers of the
5HT(1A) C/C gene specifically received more benefit from active rTMS
than sham rTMS. This was in contrast to polymorphism carriers of the
SERTPR gene, who showed response to treatment outcome regardless of
the treatment condition (active or sham).
281Repetitive Transcranial Magnetic Stimulation in Depression

In addition to their finding on the relation of the 5-HTTLPR with treat-
ment outcome, Bocchio-Chiabetto and colleagues (2008) demonstrated in
the same study that BDNF Val/Val homozygotes were better responders
than carriers of the Met allele (carriers of MET/METor MET/VAL). These
outcomes can be linked to the study results of Cheeran et al. (2008), who
compared differences in excitability measures between Val/Val carriers and
carriers of the Met allele. Subjects were investigated using two TBS proto-
cols; a cTBS protocol which is thought to suppress excitability and an iTBS
protocol which is known to generally cause an increase in excitability.
Change in amplitude measures of the motor evoked potential was taken as
an outcome measure reflecting excitability. The results showed that
Met allele carriers had less (or no) rTMS-induced changes in excitability; in
both TBS protocols no changes in excitability in either direction were evi-
dent. Highly speculatively, it can be argued that these results potentially indi-
cate that this same group of Met carriers are less receptive to rTMS-induced
clinical improvement. However, it must be emphasized that iTBS and cTBS
TMS protocols are very different from traditional HF and LF rTMS depres-
sion protocols.
In summary, although rTMS is a relative newcomer among the treatment
options for depression, the investigation of “individual characteristics”
related to treatment response appears to be progressing rather rapidly.
Developments to date seem to mainly focus on fMRI and PET imaging
studies and to a lesser extent on genetic polymorphism and EEG parameters.
Possibly this is due to the observed direct and indirect interactions with
underlying brain regions, and the fact that PET and fMRI imaging are espe-
cially effective for highlighting induced changes in regional blood flow and
metabolism. The utility of genetic polymorphism in relation to predicting
treatment response, in particular the BDNF gene, has potential. TMS
devices now allow for a fairly extended choice in treatment parameters (e.g.,
stimulation intensity, location, frequency etc.). The application of physiolog-
ical predictors may better guide the parameters to be selected in the future.
Evidence for considerable clinical efficacy is required if rTMS is to become
accepted as a regular treatment option for depression.
ACKNOWLEDGMENTS
The authors would like to thank Michiel Kleinnijenhuis for reading the
manuscript and providing valuable comments.
282 Desirée Spronk et al.

REFERENCESAmerican Psychiatric Association. (1994). Diagnostic and statistical manual of mental disorders
(4th ed.) (DSM-IV). Washington, DC: Author.Angelucci, F., Brene, S., & Mathe, A. A. (2005). BDNF in schizophrenia, depression and
corresponding animal models. Molecular Psychiatry, 10(4), 345�352.Angelucci, F., Oliviero, A., Pilato, F., Saturno, E., Dileone, M., Versace, V., et al. (2004).
Transcranial magnetic stimulation and BDNF plasma levels in amyotrophic lateral scle-rosis. Neuroreport, 15(4), 717�720.
Aoyama, Y., Hanaoka, N., Kameyama, M., Suda, M., Sato, T., Song, M., et al. (2009).Stimulus intensity dependence of cerebral blood volume changes in left frontal lobeby low-frequency rtms to right frontal lobe: A near-infrared spectroscopy study.Neuroscience Research, 63(1), 47�51.
Arns, M., Spronk, D., & Fitzgerald, P. B. (2010). Potential differential effects of 9 HzrTMS and 10 Hz rTMS in the treatment of depression. Brain Stimulation, 3, 124�126.
Avery, D. H., Holtzheimer, P. E., Fawaz, W., Russo, J., Neumaier, J., Dunner, D. L., et al.(2006). A controlled study of repetitive transcranial magnetic stimulation in medica-tion-resistant major depression. Biological Psychiatry, 59(2), 187�194.
Baeken, C., De Raedt, R., Van Hove, C., Clerinx, P., De Mey, J., & Bossuyt, A. (2009).HF-rTMS treatment in medication-resistant melancholic depression: Results from18FDG-PET brain imaging. CNS Spectrums, 14(8), 439�448.
Barker, A. T., Jalinous, R., & Freeston, I. L. (1985). Non-invasive magnetic stimulation ofhuman motor cortex. Lancet, 1(8437), 1106�1107.
Bath, K. G., & Lee, F. S. (2006). Variant BDNF (Val66Met) impact on brain structure andfunction. Cognitive and Affective Behavioral Neuroscience, 6(1), 79�85.
Baxter, L. R., Schwartz, J. M., Phelps, M. E., Mazziotta, J. C., Guze, B. H., Selin, C. E.,et al. (1989). Reduction of prefrontal cortex glucose metabolism common to threetypes of depression. Archives of General Psychiatry, 46(3), 243�250.
Ben-Shachar, D., Belmaker, R. H., Grisaru, N., & Klein, E. (1997). Transcranial magneticstimulation induces alterations in brain monoamines. Journal of Neural Transmission(Vienna, Austria), 104(2�3), 191�197.
Ben-Shachar, D., Gazawi, H., Riboyad-Levin, J., & Klein, E. (1999). Chronic repetitivetranscranial magnetic stimulation alters beta-adrenergic and 5-HT2 receptor character-istics in rat brain. Brain Research, 816(1), 78�83.
Bench, C. J., Frackowiak, R. S., & Dolan, R. J. (1995). Changes in regional cerebralblood flow on recovery from depression. Psychological Medicine, 25(2), 247�261.
Benedetti, F., Colombo, C., Pirovano, A., Marino, E., & Smeraldi, E. (2009). The catechol-o-methyltransferase val(108/158)met polymorphism affects antidepressant response to parox-etine in a naturalistic setting. Psychopharmacology, 203(1), 155�160.
Bickford, R. G., Guidi, M., Fortesque, P., & Swenson, M. (1987). Magnetic stimulationof human peripheral nerve and brain: Response enhancement by combined magne-toelectrical technique. Neurosurgery, 20(1), 110�116.
Biver, F., Goldman, S., Delvenne, V., Luxen, A., De Maertelaer, V., Hubain, P., et al.(1994). Frontal and parietal metabolic disturbances in unipolar depression. BiologicalPsychiatry, 36(6), 381�388.
Blackwood, D. H., Whalley, L. J., Christie, J. E., Blackburn, I. M., St, Clair, D. M., &McInnes, A. (1987). Changes in auditory P3 event-related potential in schizophre-nia and depression. British Journal of Psychiatry: Journal of Mental Science, 150,154�160.
Blazer, D. G., Kessler, R. C., McGonagle, K. A., & Swartz, M. S. (1994). The prevalenceand distribution of major depression in a national community sample: The nationalcomorbidity survey. American Journal of Psychiatry, 151(7), 979�986.
283Repetitive Transcranial Magnetic Stimulation in Depression

Bocchio-Chiavetto, L., Miniussi, C., Zanardini, R., Gazzoli, A., Bignotti, S., Specchia, C.,et al. (2008). 5-HTTLPR and BDNF val66met polymorphisms and response to rTMStreatment in drug resistant depression. Neuroscience Letters, 437(2), 130�134.
Brakemeier, E. L., Luborzewski, A., Danker-Hopfe, H., Kathmann, N., & Bajbouj, M.(2007). Positive predictors for antidepressive response to prefrontal repetitive transcra-nial magnetic stimulation (rtms). Journal of Psychiatric Research, 41(5), 395�403.
Brakemeier, E. L., Wilbertz, G., Rodax, S., Danker-Hopfe, H., Zinka, B., Zwanzger, P.,et al. (2008). Patterns of response to repetitive transcranial magnetic stimulation(rTMS) in major depression: Replication study in drug-free patients. Journal of AffectiveDisorders, 108(1-2), 59�70.
Bruder, G. E., Sedoruk, J. P., Stewart, J. W., McGrath, P. J., Quitkin, F. M., & Tenke, C. E.(2008). EEG alpha measures predict therapeutic response to an SSRI antidepressant: Preand post treatment findings. Biological Psychiatry, 63(12), 1171.
Cardoso, E. F., Fregni, F., Martins Maia, F., Boggio, P. S., Luis Myczkowski, M., Coracini, K.,et al. (2008). rTMS treatment for depression in Parkinson’s Disease increases BOLDresponses in the left prefrontal cortex. International Journal of Neuropsychopharmacology/Official Scientific Journal of the Collegium Internationale Neuropsychopharmacologicum (CINP), 11(2), 173�183.
Catafau, A. M., Perez, V., Gironell, A., Martin, J. C., Kulisevsky, J., Estorch, M., et al.(2001). SPECT mapping of cerebral activity changes induced by repetitive transcranialmagnetic stimulation in depressed patients. A pilot study. Psychiatry Research, 106(3),151�160.
Cheeran, B., Talelli, P., Mori, F., Koch, G., Suppa, A., Edwards, M., et al. (2008). A com-mon polymorphism in the brain-derived neurotrophic factor gene (BDNF) modulateshuman cortical plasticity and the response to rTMS. Journal of Physiology, 586(Pt 23),5717�5725.
Chen, R., Gerloff, C., Classen, J., Wassermann, E. M., Hallett, M., & Cohen, L. G. (1997).Safety of different inter-train intervals for repetitive transcranial magnetic stimulationand recommendations for safe ranges of stimulation parameters. Electroencephalographyand Clinical Neurophysiology, 105(6), 415�421.
Chistyakov, A. V., Rubicsek, O., Kaplan, B., Zaaroor, M., & Klein, E. (2010). Safety, tol-erability and preliminary evidence for antidepressant efficacy of theta-burst transcranialmagnetic stimulation in patients with major depression. International Journal ofNeuropsychopharmacology/Official Scientific Journal of the Collegium InternationaleNeuropsychopharmacologicum (CINP), 1�7.
Conca, A., Swoboda, E., Konig, P., Koppi, S., Beraus, W., Kunz, A., et al. (2000).Clinical impacts of single transcranial magnetic stimulation (sTMS) as an add-on ther-apy in severely depressed patients under SSRI treatment. Human Psychopharmacology,15(6), 429�438.
Cook, I. A., Leuchter, A. F., Witte, E., Abrams, M., Uijtdehaage, S. H., Stubbeman, W.,et al. (1999). Neurophysiologic predictors of treatment response to fluoxetine in majordepression. Psychiatry Research, 85(3), 263�273.
Cummings, J. L. (1993). The neuroanatomy of depression. Journal of Clinical Psychiatry, 54(Suppl), 14�20.
Daskalakis, Z., Fitzgerald, P., Greenwald, S., & Devlin, P. (2008). EEG ATR measuresclinical response to rTMS treatment in MDD. Brain Stimulation, 1(3), 268.
Drevets, W. C., Price, J. L., & Furey, M. L. (2008). Brain structural and functional abnor-malities in mood disorders: Implications for neurocircuitry models of depression. BrainStructure & Function, 213(1�2), 93�118.
Eranti, S., Mogg, A., Pluck, G., Landau, S., Purvis, R., Brown, R. G., et al. (2007). A ran-domized, controlled trial with 6-month follow-up of repetitive transcranial magnetic
284 Desirée Spronk et al.

stimulation and electroconvulsive therapy for severe depression. American Journal ofPsychiatry, 164(1), 73�81.
Fitzgerald, P. B., Benitez, J., de Castella, A., Daskalakis, Z. J., Brown, T. L., & Kulkarni, J.(2006a). A randomized, controlled trial of sequential bilateral repetitive transcranialmagnetic stimulation for treatment-resistant depression. American Journal of Psychiatry,163(1), 88�94.
Fitzgerald, P. B., Brown, T. L., Marston, N. A. U., Daskalakis, Z. J., de Castella, A., &Kulkarni, J. (2003). Transcranial magnetic stimulation in the treatment of depression:A double-blind, placebo-controlled trial. Archives of General Psychiatry, 60(10), 1002.
Fitzgerald, P. B., Hoy, K., Daskalakis, Z. J., & Kulkarni, J. (2009a). A randomized trial ofthe anti-depressant effects of low- and high-frequency transcranial magnetic stimula-tion in treatment-resistant depression. Depression and Anxiety, 26(3), 229�234.
Fitzgerald, P. B., Hoy, K., McQueen, S., Herring, S., Segrave, R., Been, G., et al. (2008).Priming stimulation enhances the effectiveness of low-frequency right prefrontal cor-tex transcranial magnetic stimulation in major depression. Journal of ClinicalPsychopharmacology, 28(1), 52�58.
Fitzgerald, P. B., Hoy, K., McQueen, S., Maller, J. J., Herring, S., Segrave, R., et al.(2009b). A randomized trial of rTMS targeted with MRI based neuro-navigation intreatment-resistant depression. Neuropsychopharmacology, 34(5), 1255�1262.
Fitzgerald, P. B., Huntsman, S., Gunewardene, R., Kulkarni, J., & Daskalakis, Z. J.(2006b). A randomized trial of low-frequency right-prefrontal-cortex transcranial mag-netic stimulation as augmentation in treatment-resistant major depression. InternationalJournal of Neuropsychopharmacology/Official Scientific Journal of the Collegium InternationaleNeuropsychopharmacologicum (CINP), 9(6), 655�666.
Fitzgerald, P. B., Oxley, T. J., Laird, A. R., Kulkarni, J., Egan, G. F., & Daskalakis, Z. J.(2006c). An analysis of functional neuroimaging studies of dorsolateral prefrontal cor-tical activity in depression. Psychiatry Research, 148(1), 33�45.
Fitzgerald, P. B., Sritharan, A., Daskalakis, Z. J., de Castella, A. R., Kulkarni, J., & Egan, G.(2007). A functional magnetic resonance imaging study of the effects of low frequencyright prefrontal transcranial magnetic stimulation in depression. Journal of ClinicalPsychopharmacology, 27(5), 488�492.
Fregni, F., Marcolin, M. A., Myczkowski, M., Amiaz, R., Hasey, G., Rumi, D. O., et al.(2006). Predictors of antidepressant response in clinical trials of transcranial magneticstimulation. International Journal of Neuropsychopharmacology/Official Scientific Journal ofthe Collegium Internationale Neuropsychopharmacologicum (CINP), 9(6), 641�654.
Funk, A. P., & George, M. S. (2008). Prefrontal EEG asymmetry as a potential biomarkerof antidepressant treatment response with transcranial magnetic stimulation (TMS): Acase series. Clinics in EEG Neuroscience, 39(3), 125�130.
Garcia-Toro, M., Pascual-Leone, A., Romera, M., Gonzalez, A., Mico, J., Ibarra, O., et al.(2001). Journal of Neurology, Neurosurgery, and Psychiatry, 71(4), 546�548.
George, M. S., Wassermann, E. M., Kimbrell, T. A., Little, J. T., Williams, W. E.,Danielson, A. L., et al. (1997). Mood improvement following daily left prefrontalrepetitive transcranial magnetic stimulation in patients with depression: Aplacebo-controlled crossover trial. American Journal of Psychiatry, 154(12),1752�1756.
George, M. S., Wassermann, E. M., Williams, W. A., Callahan, A., Ketter, T. A., Basser, P.,et al. (1995). Daily repetitive transcranial magnetic stimulation (rTMS) improves moodin depression. Neuroreport, 6(14), 1853�1856.
George, M. S., Lisanby, S. H., Avery, D., McDonald, W. M., Durkalski, V., Pavlicova, M.,et al. (2010). Daily left prefrontal transcranial magnetic stimulation therapy for majordepressive disorder: A sham-controlled randomized trial. Archives of General Psychiatry,67(5), 507�516.
285Repetitive Transcranial Magnetic Stimulation in Depression

Gross, M., Nakamura, L., Pascual-Leone, A., & Fregni, F. (2007). Has repetitive transcra-nial magnetic stimulation (rTMS) treatment for depression improved? A systematicreview and meta-analysis comparing the recent vs. the earlier rTMS studies. ActaPsychiatrica Scandinavica, 116(3), 165�173.
Grunhaus, L., Schreiber, S., Dolberg, O. T., Polak, D., & Dannon, P. N. (2003). A ran-domized controlled comparison of electroconvulsive therapy and repetitive transcranialmagnetic stimulation in severe and resistant nonpsychotic major depression. BiologicalPsychiatry, 53(4), 324�331.
Gur, E., Lerer, B., Dremencov, E., & Newman, M. E. (2000). Chronic repetitive transcra-nial magnetic stimulation induces subsensitivity of presynaptic serotonergic autorecep-tor activity in rat brain. Neuroreport, 11(13), 2925�2929.
Hallett, M. (2007). Transcranial magnetic stimulation: A primer. Neuron, 55(2), 187�199.Hanaoka, N., Aoyama, Y., Kameyama, M., Fukuda, M., & Mikuni, M. (2007).
Deactivation and activation of left frontal lobe during and after low-frequency repeti-tive transcranial magnetic stimulation over right prefrontal cortex: A near-infraredspectroscopy study. Neuroscience Letters, 414(2), 99�104.
Hausmann, A., Weis, C., Marksteiner, J., Hinterhuber, H., & Humpel, C. (2000).Chronic repetitive transcranial magnetic stimulation enhances c-Fos in the parietalcortex and hippocampus. Brain Research Molecular Brain Research, 76(2), 355�362.
Henriques, J. B., & Davidson, R. J. (1990). Regional brain electrical asymmetries discrim-inate between previously depressed and healthy control subjects. Journal of AbnormalPsychology, 99(1), 22�31.
Herwig, U., Padberg, F., Unger, J., Spitzer, M., & Schonfeldt-Lecuona, C. (2001).Transcranial magnetic stimulation in therapy studies: Examination of the reliability of“standard” coil positioning by neuronavigation. Biological Psychiatry, 50(1), 58�61.
Himani, A., Tandon, O. P., & Bhatia, M. S. (1999). A study of p300-event related evokedpotential in the patients of major depression. Indian Journal of Physiology and Pharmacology,43(3), 367�372.
Hoflich, G., Kasper, S., Hufnagel, A., Ruhrmann, S., & Moller, H. J. (1993). Applicationof transcranial magnetic stimulation in the treatment of drug-resistant major depres-sion: A report of two cases. Human Psychopharmacology, 8, 361�365.
Huang, Y. Z., Edwards, M. J., Rounis, E., Bhatia, K. P., & Rothwell, J. C. (2005). Thetaburst stimulation of the human motor cortex. Neuron, 45(2), 201�206.
Huang, Y. Z., Rothwell, J. C., Lu, C. S., Wang, J., Weng, Y. H., Lai, S. C., et al. (2009).The effect of continuous theta burst stimulation over premotor cortex on circuits inprimary motor cortex and spinal cord. Clinical Neurophysiology, 120(4), 796�801.
Husain, M. M., Rush, A. J., Fink, M., Knapp, R., Petrides, G., Rummans, T., et al.(2004). Speed of response and remission in major depressive disorder with acute elec-troconvulsive therapy (ECT): A consortium for research in ECT (CORE) report.Journal of Clinical Psychiatry, 65(4), 485�491.
Ikeda, T., Kurosawa, M., Uchikawa, C., Kitayama, S., & Nukina, N. (2005). Modulationof monoamine transporter expression and function by repetitive transcranial magneticstimulation. Biochemical and Biophysical Research Communications, 327(1), 218�224.
Isenberg, K., Downs, D., Pierce, K., Svarakic, D., Garcia, K., Jarvis, M., et al. (2005).Low frequency rTMS stimulation of the right frontal cortex is as effective as high fre-quency rTMS stimulation of the left frontal cortex for antidepressant-free, treatment-resistant depressed patients. Annals of Clinical Psychiatry, 17(3), 153�159.
Ishikawa, S., Matsunaga, K., Nakanishi, R., Kawahira, K., Murayama, N., Tsuji, S., et al.(2007). Effect of theta burst stimulation over the human sensorimotor cortexon motor and somatosensory evoked potentials. Clinical Neurophysiology, 118(5),1033�1043.
286 Desirée Spronk et al.

Iyer, M. B., Schleper, N., & Wassermann, E. M. (2003). Priming stimulation enhances thedepressant effect of low-frequency repetitive transcranial magnetic stimulation. Journalof Neuroscience, 23(34), 10867�10872.
Januel, D., Dumortier, G., Verdon, C. M., Stamatiadis, L., Saba, G., Cabaret, W., et al.(2006). A double-blind sham controlled study of right prefrontal repetitive transcranialmagnetic stimulation (rTMS): Therapeutic and cognitive effect in medication freeunipolar depression during 4 weeks. Progress in Neuro-Psychopharmacology & BiologicalPsychiatry, 30(1), 126�130.
Jin, Y., O’Halloran, J. P., Plon, L., Sandman, C. A., & Potkin, S. G. (2006). Alpha EEGpredicts visual reaction time. International Journal of Neuroscience, 116(9), 1035�1044.
Juckel, G., Mendlin, A., & Jacobs, B. L. (1999). Electrical stimulation of rat medial pre-frontal cortex enhances forebrain serotonin output: Implications for electroconvulsivetherapy and transcranial magnetic stimulation in depression. Neuropsychopharmacology,21(3), 391�398.
Keck, M. E., Sillaber, I., Ebner, K., Welt, T., Toschi, N., Kaehler, S. T., et al. (2000).Acute transcranial magnetic stimulation of frontal brain regions selectively modulatesthe release of vasopressin, biogenic amines and amino acids in the rat brain. EuropeanJournal of Neuroscience, 12(10), 3713�3720.
Keck, M. E., Welt, T., Muller, M. B., Erhardt, A., Ohl, F., Toschi, N., et al. (2002).Repetitive transcranial magnetic stimulation increases the release of dopamine in themesolimbic and mesostriatal system. Neuropharmacology, 43(1), 101�109.
Keller, M. B., McCullough, J. P., Klein, D. N., Arnow, B., Dunner, D. L., Gelenberg, A.J., et al. (2000). A comparison of nefazodone, the cognitive behavioral-analysis systemof psychotherapy, and their combination for the treatment of chronic depression. NewEngland Journal of Medicine, 342(20), 1462�1470.
Kennedy, S. H., Evans, K. R., Kruger, S., Mayberg, H. S., Meyer, J. H., McCann, S., et al.(2001). Changes in regional brain glucose metabolism measured with positron emissiontomography after paroxetine treatment of major depression. American Journal ofPsychiatry, 158(6), 899�905.
Kimbrell, T. A., Little, J. T., Dunn, R. T., Frye, M. A., Greenberg, B. D., Wassermann, E.M., et al. (1999). Frequency dependence of antidepressant response to left prefrontalrepetitive transcranial magnetic stimulation (rTMS) as a function of baseline cerebralglucose metabolism. Biological Psychiatry, 46(12), 1603�1613.
Kirsch, I., Deacon, B. J., Huedo-Medina, T. B., Scoboria, A., Moore, T. J., & Johnson, B. T.(2008). Initial severity and antidepressant benefits: A meta-analysis of data submitted tothe food and drug administration. PLoS Med, 5(2), e45.
Kito, S., Fujita, K., & Koga, Y. (2008a). Changes in regional cerebral blood flow after repet-itive transcranial magnetic stimulation of the left dorsolateral prefrontal cortex in treat-ment-resistant depression. Journal of Neuropsychiatry and Clinical Neurosciences, 20(1),74�80.
Kito, S., Fujita, K., & Koga, Y. (2008b). Regional cerebral blood flow changes after low-frequency transcranial magnetic stimulation of the right dorsolateral prefrontal cortexin treatment-resistant depression. Neuropsychobiology, 58(1), 29�36.
Klein, E., Kreinin, I., Chistyakov, A., Koren, D., Mecz, L., Marmur, S., et al. (1999).Therapeutic efficacy of right prefrontal slow repetitive transcranial magnetic stimula-tion in major depression: A double-blind controlled study. Archives of GeneralPsychiatry, 56(4), 315�320.
Koerselman, F., Laman, D. M., van Duijn, H., van Duijn, M. A., & Willems, M. A.(2004). A 3-month, follow-up, randomized, placebo-controlled study of repetitivetranscranial magnetic stimulation in depression. Journal of Clinical Psychiatry, 65(10),1323�1328.
287Repetitive Transcranial Magnetic Stimulation in Depression

Kolbinger, H. M., Hoflich, G., Hufnagel, A., Moller, H. J., & Kasper, S. (1995).Transcranial magnetic stimulation (TMS) in the treatment of major depression�a pilotstudy. Human Psychopharmacology, 10, 305�310.
Kole, M. H., Fuchs, E., Ziemann, U., Paulus, W., & Ebert, U. (1999). Changes in 5-HT1A and NMDA binding sites by a single rapid transcranial magnetic stimulationprocedure in rats. Brain Research, 826(2), 309�312.
Kozel, F. A., Tian, F., Dhamne, S., Croarkin, P. E., McClintock, S. M., Elliott, A., et al.(2009). Using simultaneous repetitive transcranial magnetic stimulation/functional nearinfrared spectroscopy (rTMS/fNIRS) to measure brain activation and connectivity.Neuroimage, 47(4), 1177�1184.
Lang, U. E., Bajbouj, M., Gallinat, J., & Hellweg, R. (2006). Brain-derived neurotrophicfactor serum concentrations in depressive patients during vagus nerve stimulation andrepetitive transcranial magnetic stimulation. Psychopharmacology, 187(1), 56�59.
Levkovitz, Y., Roth, Y., Harel, E. V., Braw, Y., Sheer, A., & Zangen, A. (2007). A ran-domized controlled feasibility and safety study of deep transcranial magnetic stimula-tion. Clinical Neurophysiology, 118(12), 2730�2744.
Loo, C. K., Sachdev, P. S., Haindl, W., Wen, W., Mitchell, P. B., Croker, V. M., et al.(2003). High (15 Hz) and low (1 Hz) frequency transcranial magnetic stimulation havedifferent acute effects on regional cerebral blood flow in depressed patients.Psychological Medicine, 33(06), 997�1006.
Luborzewski, A., Schubert, F., Seifert, F., Danker-Hopfe, H., Brakemeier, E. L.,Schlattmann, P., et al. (2007). Metabolic alterations in the dorsolateral prefrontal cor-tex after treatment with high-frequency repetitive transcranial magnetic stimulation inpatients with unipolar major depression. Journal of Psychiatric Research, 41(7), 606�615.
Manes, F., Jorge, R., Morcuende, M., Yamada, T., Paradiso, S., & Robinson, R. G.(2001). A controlled study of repetitive transcranial magnetic stimulation as a treat-ment of depression in the elderly. International Psychogeriatrics, 13(2), 225�231.
Miniussi, C., Bonato, C., Bignotti, S., Gazzoli, A., Gennarelli, M., Pasqualetti, P., et al.(2005). Repetitive transcranial magnetic stimulation (rTMS) at high and low frequency:An efficacious therapy for major drug-resistant depression? Clinical Neurophysiology, 116(5), 1062�1071.
Mogg, A., Pluck, G., Eranti, S. V., Landau, S., Purvis, R., Brown, R. G., et al. (2008). Arandomized controlled trial with 4-month follow-up of adjunctive repetitive transcra-nial magnetic stimulation of the left prefrontal cortex for depression. PsychologicalMedicine, 38(3), 323�333.
Moller, A. L., Hjaltason, O., Ivarsson, O., & Stefansson, S. B. (2006). The effects of repet-itive transcranial magnetic stimulation on depressive symptoms and the P(300) event-related potential. Nordic Journal of Psychiatry, 60(4), 282�285.
Murray, C. J., & Lopez, A. D. (1997). Global mortality, disability, and the contribution ofrisk factors: Global burden of disease study. Lancet, 349(9063), 1436�1442.
Muller, M. B., Toschi, N., Kresse, A. E., Post, A., & Keck, M. E. (2000). Long-termrepetitive transcranial magnetic stimulation increases the expression of brain-derivedneurotrophic factor and cholecystokinin mRNA, but not neuropeptide tyrosinemRNA in specific areas of rat brain. Neuropsychopharmacology, 23(2), 205�215.
Nahas, Z., Kozel, F. A., Li, X., Anderson, B., & George, M. S. (2003). Left prefrontaltranscranial magnetic stimulation (TMS) treatment of depression in bipolar affectivedisorder: A pilot study of acute safety and efficacy. Bipolar Disorders, 5(1), 40�47.
O’Reardon, J. P., Solvason, H. B., Janicak, P. G., Sampson, S., Isenberg, K. E., Nahas, Z.,et al. (2007). Efficacy and safety of transcranial magnetic stimulation in the acute treat-ment of major depression: A multisite randomized controlled trial. Biological Psychiatry,62(11), 1208�1216.
288 Desirée Spronk et al.

Padberg, F., di Michele, F., Zwanzger, P., Romeo, E., Bernardi, G., Schule, C., et al.(2002). Plasma concentrations of neuroactive steroids before and after repetitive tran-scranial magnetic stimulation (rTMS) in major depression. Neuropsychopharmacology, 27(5), 874�878.
Padberg, F., Zwanzger, P., Thoma, H., Kathmann, N., Haag, C., Greenberg, B. D., et al.(1999). Repetitive transcranial magnetic stimulation (rTMS) in pharmacotherapy-refractory major depression: Comparative study of fast, slow and sham rTMS.Psychiatry Research, 88(3), 163�171.
Padberg, F., Zwanzger, P., Keck, M. E., Kathmann, N., Mikhaiel, P., Ella, R., et al. (2002).Repetitive transcranial magnetic stimulation (rTMS) in major depression: Relationbetween efficacy and stimulation intensity. Neuropsychopharmacology, 27(4), 638�645.
Pallanti, S., Bernardi, S., Rollo, A. D., Antonini, S., & Quercioli, L. (2010). Unilaterallow frequency versus sequential bilateral repetitive transcranial magnetic stimulation: Issimpler better for treatment of resistant depression? Neuroscience, 167(2), 323�328.
Pascual-Leone, A., Tarazona, F., Keenan, J., Tormos, J. M., Hamilton, R., & Catala, M. D.(1999). Transcranial magnetic stimulation and neuroplasticity. Neuropsychologia, 37(2),207�217.
Pascual-Leone, A., Valls-Sole, J., Wassermann, E. M., & Hallett, M. (1994). Responses torapid-rate transcranial magnetic stimulation of the human motor cortex. Brain, 117(4),847�858.
Paulus, W. (2005). Toward establishing a therapeutic window for rTMS by theta burststimulation. Neuron, 45(2), 181�183.
Paus, T., & Barrett, J. (2004). Transcranial magnetic stimulation (TMS) of the human fron-tal cortex: Implications for repetitive TMS treatment of depression. Journal ofPsychiatry and Neuroscience, 29(4), 268.
Paus, T., Jech, R., Thompson, C. J., Comeau, R., Peters, T., & Evans, A. C. (1997).Transcranial magnetic stimulation during positron emission tomography: A newmethod for studying connectivity of the human cerebral cortex. Journal of Neuroscience,17(9), 3178�3184.
Peters, E. J., Slager, S. L., Jenkins, G. D., Reinalda, M. S., Garriock, H. A., Shyn, S. I., et al.(2009). Resequencing of serotonin-related genes and association of tagging SNPS tocitalopram response. Pharmacogenetics and Genomics, 19(1), 1�10.
Petty, F., Kramer, G. L., Gullion, C. M., & Rush, A. J. (1992). Low plasma gamma-aminobutyric acid levels in male patients with depression. Biological Psychiatry, 32(4),354�363.
Pogarell, O., Koch, W., Popperl, G., Tatsch, K., Jakob, F., Mulert, C., et al. (2007). Acuteprefrontal rTMS increases striatal dopamine to a similar degree as d-amphetamine.Psychiatry Research, 156(3), 251�255.
Pogarell, O., Koch, W., Popperl, G., Tatsch, K., Jakob, F., Zwanzger, P., et al. (2006).Striatal dopamine release after prefrontal repetitive transcranial magnetic stimulation inmajor depression: Preliminary results of a dynamic [123I] IBZM SPECT study. Journalof Psychiatric Research, 40(4), 307�314.
Post, A., & Keck, M. E. (2001). Transcranial magnetic stimulation as a therapeutic tool inpsychiatry: What do we know about the neurobiological mechanisms? Journal ofPsychiatric Research, 35(4), 193�215.
Poulet, E., Brunelin, J., Boeuve, C., Lerond, J., D’Amato, T., Dalery, J., et al. (2004).Repetitive transcranial magnetic stimulation does not potentiate antidepressant treat-ment. European Psychiatry, 19(6), 382�383.
Price, G. W., Lee, J. W., Garvey, C., & Gibson, N. (2008). Appraisal of sessional EEG fea-tures as a correlate of clinical changes in an rTMS treatment of depression. ClinicalEEG and Neuroscience, 39(3), 131�138.
289Repetitive Transcranial Magnetic Stimulation in Depression

Pridmore, S., Bruno, R., Turnier-Shea, Y., Reid, P., & Rybak, M. (2000). Comparison ofunlimited numbers of rapid transcranial magnetic stimulation (rTMS) and ECT treatmentsessions in major depressive episode. International Journal of Neuropsychopharmacology/Official Scientific Journal of the Collegium Internationale Neuropsychopharmacologicum(CINP), 3(2), 129�134.
Ridding, M. C., & Rothwell, J. C. (2007). Is there a future for therapeutic use of transcra-nial magnetic stimulation? Nature Reviews Neuroscience, 8(7), 559�567.
Robertson, H., & Pryor, R. (2006). Memory and cognitive effects of ECT: Informingand assessing patients. Advances in Psychiatric Treatment, 12(3), 228�237.
Rosa, M. A., Gattaz, W. F., Pascual-Leone, A., Fregni, F., Rosa, M. O., Rumi, D. O., et al.(2006). Comparison of repetitive transcranial magnetic stimulation and electroconvul-sive therapy in unipolar non-psychotic refractory depression: A randomized, single-blind study. International Journal of Neuropsychopharmacology/Official Scientific Journal of theCollegium Internationale Neuropsychopharmacologicum (CINP), 9(6), 667�676.
Rossi, S., Hallett, M., Rossini, P. M., & Pascual-Leone, A.The Safety of TMS ConsensusGroup. (2009). Safety, ethical considerations, and application guidelines for the use oftranscranial magnetic stimulation in clinical practice and research. Clinical Neurophysiology,120(12), 2008�2039.
Rossini, D., Lucca, A., Zanardi, R., Magri, L., & Smeraldi, E. (2005). Transcranial mag-netic stimulation in treatment-resistant depressed patients: A double-blind, placebo-controlled trial. Psychiatry Research, 137(1�2), 1�10.
Rumi, D. O., Gattaz, W. F., Rigonatti, S. P., Rosa, M. A., Fregni, F., Rosa, M. O., et al.(2005). Transcranial magnetic stimulation accelerates the antidepressant effect of ami-triptyline in severe depression: A double-blind placebo-controlled study. BiologicalPsychiatry, 57(2), 162�166.
Rush, A. J., Trivedi, M. H., Wisniewski, S. R., Nierenberg, A. A., Stewart, J. W.,Warden, D., et al. (2006). Acute and longer-term outcomes in depressed outpatientsrequiring one or several treatment steps: A STARD report. American Journal of Psychiatry,163(11), 1905�1917.
Schutter, D. J. (2009). Antidepressant efficacy of high-frequency transcranial magneticstimulation over the left dorsolateral prefrontal cortex in double-blind sham-controlleddesigns: a meta-analysis. Psychological Medicine, 39(1), 65�75.
Schutter, D. J. (2010). Quantitative review of the efficacy of slow-frequency magneticbrain stimulation in major depressive disorder. Psychological Medicine, doi: 7,10.1017/S003329171000005X.
Schutter, D. J., Laman, D. M., van Honk, J., Vergouwen, A. C., & Koerselman, G. F.(2009). Partial clinical response to 2 weeks of 2 Hz repetitive transcranial magneticstimulation to the right parietal cortex in depression. International Journal ofNeuropsychopharmacology, 12(5), 643�650.
Shimizu, E., Hashimoto, K., Okamura, N., Koike, K., Komatsu, N., Kumakiri, C., et al.(2003). Alterations of serum levels of brain-derived neurotrophic factor (BDNF) indepressed patients with or without antidepressants. Biological Psychiatry, 54(1), 70�75.
Siebner, H. R., Bergmann, T. O., Bestmann, S., Massimini, M., Johansen-Berg, H.,Mochizuki, H., et al. (2009). Consensus paper: Combining transcranial stimulationwith neuroimaging. Brain Stimulation, 2(2), 58�80.
Speer, A. M., Benson, B. E., Kimbrell, T. K., Wassermann, E. M., Willis, M. W., Herscovitch, P.,et al. (2009). Opposite effects of high and low frequency rTMS on mood indepressed patients: Relationship to baseline cerebral activity on PET. Journal of AffectiveDisorders, 115(3), 386�394.
Speer, A. M., Kimbrell, T. A., Wassermann, E. M., D’Repella, J., Willis, M. W., Herscovitch, P.,et al. (2000). Opposite effects of high and low frequency rTMS on regional brain activity indepressed patients. Biological Psychiatry, 48(12), 1133�1141.
290 Desirée Spronk et al.

Spronk, D., Arns, M., Barnett, K. J., Cooper, N. J., & Gordon, E. (2010). An investiga-tion of EEG, genetic and cognitive markers of treatment response to antidepressantmedication in patients with major depressive disorder: A pilot study. Journal of AffectiveDisorders, doi:10.1016/j.jad.2010.06.021.
Spronk, D., Arns, M., Bootsma, A., van Ruth, R., & Fitzgerald, P. B. (2008). Long-termeffects of left frontal rTMS on EEG and ERPs in patients with depression. ClinicalEEG and Neuroscience, 39(3), 118�124.
Strafella, A. P., Paus, T., Barrett, J., & Dagher, A. (2001). Repetitive transcranial magneticstimulation of the human prefrontal cortex induces dopamine release in the caudatenucleus. Journal of Neuroscience, 21(15), RC157.
Wassermann, E. M. (1998). Risk and safety of repetitive transcranial magnetic stimulation:Report and suggested guidelines from the international workshop on the safety ofrepetitive transcranial magnetic stimulation. Electroencephalography and Clinical Neurophysiology,108(1), 1�16.
Wassermann, E. M., Epstein, C. M., & Ziemann, U. (2008). The Oxford handbook of tran-scranial stimulation. New York: Oxford University Press.
Wassermann, E. M., & Lisanby, S. H. (2001). Therapeutic application of repetitive tran-scranial magnetic stimulation: A review. Clinical Neurophysiology, 112(8), 1367�1377.
Yue, L., Xiao-Lin, H., & Tao, S. (2009). The effects of chronic repetitive transcranial mag-netic stimulation on glutamate and gamma-aminobutyric acid in rat brain. Brain Research,1260(C), 94�99.
Yukimasa, T., Yoshimura, R., Tamagawa, A., Uozumi, T., Shinkai, K., Ueda, N., et al.(2006). High-frequency repetitive transcranial magnetic stimulation improves refrac-tory depression by influencing catecholamine and brain-derived neurotrophic factors.Pharmacopsychiatry, 39(2), 52�59.
Zanardi, R., Magri, L., Rossini, D., Malaguti, A., Giordani, S., Lorenzi, C., et al. (2007).Role of serotonergic gene polymorphisms on response to transcranial magnetic stimu-lation in depression. European Neuropsychopharmacology, 17(10), 651�657.
Zanardini, R., Gazzoli, A., Ventriglia, M., Perez, J., Bignotti, S., Rossini, P. M., et al. (2006).Effect of repetitive transcranial magnetic stimulation on serum brain derived neurotrophicfactor in drug resistant depressed patients. Journal of Affective Disorders, 91(1), 83�86.
Zangen, A., & Hyodo, K. (2002). Transcranial magnetic stimulation induces increases inextracellular levels of dopamine and glutamate in the nucleus accumbens. Neuroreport,13(18), 2401�2405.
Zangen, A., Roth, Y., Voller, B., & Hallett, M. (2005). Transcranial magnetic stimulation ofdeep brain regions: Evidence for efficacy of the H-coil. Clinical Neurophysiology, 116(4),775�779.
Zou, Y. F., Ye, D. Q., Feng, X. L., Su, H., Pan, F. M., & Liao, F. F. (2010). Meta-analysisof BDNF val66met polymorphism association with treatment response in patientswith major depressive disorder. European Neuropsychopharmacology, 20(8), 535�544.
291Repetitive Transcranial Magnetic Stimulation in Depression

This page intentionally left blank

CHAPTER1111Transcranial MagneticStimulation for TinnitusBerthold Langguth1 and Dirk de Ridder21Department of Psychiatry and Psychotherapy and Tinnitus Clinic, University of Regensburg,Regensburg, Germany2TRI Tinnitus Clinic, BRAI2N and Department of Neurosurgery, University of Antwerp,Antwerp, Belgium
Contents
Tinnitus: Introduction 293Transcranial Magnetic Stimulation 296
Rationale for the Use of Neuromodulation in Investigation, Diagnosis, andTreatment of Tinnitus 297Single Sessions of rTMS 299Repeated Sessions of rTMS in Tinnitus 303Methodological Considerations 310Safety Aspects 311
Conclusion 311References 312
TINNITUS: INTRODUCTION
Tinnitus refers to a condition in which a patient has a hearing percept
that can take the form of ringing, buzzing, roaring or hissing (among
others) in the absence of an external sound (Eggermont, 2007; A. R.
Moller, 2007b). Tinnitus can be classified as being either objective or sub-
jective. In the objective form, which is rare, a real sound is generated by
an internal biological source, reaching the ear through conduction in
body tissues. The source can be vascular turbulence, pulsations or spasm
of the muscles in the middle ear, Eustachian tube or soft palate. Unlike
subjective tinnitus, an observer, using a stethoscope, can often hear objec-
tive tinnitus. Subjective tinnitus refers to a phantom auditory sensation for
which no objective sound can be identified and only the person who has
the tinnitus can hear it. Some patients perceive the phantom sound as
293Neurofeedback and Neuromodulation Techniques and ApplicationsDOI: 10.1016/B978-0-12-382235-2.00011-1
© 2011 Elsevier Inc.All rights reserved.

coming from inside the ear, others report that the phantom sound is
located inside the head, while a few perceive the phantom sound as com-
ing from outside the head. Some patients experience bilateral tinnitus,
while others hear it in just one ear. Subjective tinnitus is by far more
prevalent than objective tinnitus and is the subject of this present chapter.
Subjective tinnitus is often associated with a lesion of the peripheral
auditory system, such as presbyacusis, Meniere’s disease, noise trauma, sud-
den deafness or drug-related ototoxicity (Eggermont, 2007). However
these pathologies are not directly causing tinnitus. Rather the neuroplastic
changes that occur in the brain as reaction to sensory deafferentation repre-
sent the neural correlate of tinnitus (A. R. Moller, 2007a). Thus, the
mechanisms involved in tinnitus generation share similarities with those
responsible for phantom pain after limb amputation (A. R. Moller, 2007a).
With a prevalence of 10% in the adult population, tinnitus is a very com-
mon symptom (Axelsson & Ringdahl, 1989). Approximately 1 percent of
the population is severely affected by tinnitus with major negative impacts
on quality of life (Axelsson & Ringdahl, 1989). Severe tinnitus is frequently
associated with depression, anxiety, and insomnia (Cronlein, Langguth,
Geisler, & Hajak, 2007; Dobie, 2003; Langguth et al., 2007) and is very diffi-
cult to treat (Dobie, 1999). The most frequently used therapy techniques
consist of auditory stimulation and cognitive behavioral treatment that
improve habituation and coping strategies. However, more causally oriented
treatment strategies are missing. Therefore, new treatment strategies need to
be developed, which directly act on the pathophysiological mechanisms that
cause the auditory phantom perception phenomenon.
Even if the pathophysiology of the different forms of tinnitus is still
incompletely understood, there is growing consensus in the neuroscien-
tific community that chronic tinnitus as an auditory phantom perception
might be the correlate of maladaptive attempts of the brain at reorganiza-
tion due to distorted sensory input (A. R. Moller, 2007a).
In animal models a large variety of neuroplastic changes have been
demonstrated after sensory deafferentation, including an increased neuro-
nal firing rate, increased neural synchronicity, and alterations of the tono-
topic map (Eggermont, 2007). These findings are paralleled by results
from functional imaging and electrophysiological studies in tinnitus
patients where functional and structural alterations in the central auditory
system have been observed. Both positron emission tomography (PET)
(Arnold, Bartenstein, Oestreicher, Romer, & Schwaiger, 1996; Giraud
et al., 1999; Lanting, de Kleine, & van Dijk, 2009; Lockwood et al.,
294 Berthold Langguth and Dirk de Ridder

1999; Lockwood et al., 2000) and functional magnetic resonance imaging
(fMRI) (Lanting et al., 2009; Melcher, Sigalovsky, Guinan, & Levine,
2000; Smits et al., 2007) have demonstrated changes of neuronal activity
in central auditory pathways in tinnitus patients. Electroencephalography
(EEG) and magnetoencephalography (MEG) data have shown a reduction
of alpha power and an increase in slow waves and in gamma activity in
auditory areas (Llinas, Ribary, Jeanmonod, Kronberg, & Mitra, 1999;
Lorenz, Muller, Schlee, Hartmann, & Weisz, 2009; van der Loo et al.,
2009; Weisz et al., 2007). The model of thalamocortical dysrhythmia,
which has been elaborated by Llinas and colleagues (Llinas, Urbano,
Leznik, Ramirez, & van Marle, 2005; Llinas et al., 1999), provides an
explanation for the findings in tinnitus patients. According to this model,
thalamic deafferentiation from auditory input, e.g. due to hearing loss,
may produce slow theta-frequency oscillations in thalamocortical ensem-
bles due to changes in firing patterns of thalamic relay cells. As a conse-
quence, reduced lateral inhibition at the cortical level is thought to
generate high-frequency activity in the gamma band that could be the
neuronal correlate of the tinnitus percept (Llinas et al., 2005, 2009). This
increased synchronized firing in the gamma band together with decreased
lateral inhibition after deafferentation may induce cortical reorganization
via a simple Hebbian mechanisms (Eggermont & Roberts, 2004) and
neural plasticity which finally results in alterations of the tonotopic map.
Such a shift in the tonotopic map has been demonstrated at the tinnitus
frequency by magnetic source imaging (Muhlnickel, Elbert, Taub, & Flor,
1998).
However, imaging studies in patients with impaired consciousness
clearly demonstrate that activity in the auditory cortex is not sufficient for
conscious auditory perception (Boly et al., 2004). Persisting connectivity
with frontal and temporoparietal areas is required for conscious auditory
processing. Increased activity in frontal and temporoparietal areas has been
identified by functional imaging studies in tinnitus patients (Andersson
et al., 2000; Giraud et al., 1999; Lockwood et al., 1998; Mirz et al., 2000;
Plewnia, Reimold, Najib, Brehm et al., 2007). Based on the clinical anal-
ogies between tinnitus distress and pain distress and based on neuroimag-
ing data it is tempting to speculate that the tinnitus distress network and
the pain matrix involve similar brain structures (Moisset & Bouhassira,
2007). Unpleasantness of pain activates the anterior cingulate (Price,
2000) and orbitofrontal cortices, amygdala, hypothalamus, posterior insula,
primary motor cortex, and frontal pole (Kulkarni et al., 2005). One may
295Transcranial Magnetic Stimulation for Tinnitus
further speculate that the perception of tinnitus and pain intensity could be
related to auditory and somatosensory cortex activation, respectively, but
that the distress associated with its perception might be related to activation
of a common general non-specific “distress network”. This notion is sup-
ported by a recent study which demonstrates activation of this distress net-
work during unpleasant symptoms in a somatoform disorder, even in
the absence of a real physical stimulus (Landgrebe, Barta et al., 2008).
Furthermore, distress due to dyspnoea in asthma activates the same net-
work (von Leupoldt et al., 2009).
Even though no specific studies have been performed for selectively iden-
tifying neural activation underlying tinnitus distress, PET studies comparing
tinnitus patients and healthy controls have demonstrated activation of brain
areas such as anterior cingulate (ACC) (Plewnia, Reimold, Najib, Reischl,
Plontke, & Gerloff, 2007) or the anterior insula (Lockwood et al., 1998).
Synchronization analysis based on MEG data has shown that functional
connectivity between ACC and right frontal lobe is correlated to tinnitus
intrusiveness, a measure of tinnitus distress (Schlee, Weisz, Bertrand,
Hartmann, & Elbert, 2008). A recent MEG study looking at phase-locked
connectivity in the tinnitus network suggests that the tinnitus network
changes over time (Schlee, Hartmann, Langguth, & Weisz, 2009). In patients
with a tinnitus history of less than 4 years, the left temporal cortex was pre-
dominant in the gamma network whereas in patients with tinnitus duration
of more than 4 years the gamma network was more widely distributed,
including more frontal and parietal regions (Schlee, Hartmann et al., 2009).
Even if the central auditory system has been the primary focus of inter-
est of neurobiological tinnitus research, theoretical considerations, patho-
physiological models of tinnitus (Jastreboff, 1990; Jastreboff, Brennan, &
Sasaki, 1988; Moller, 1994, 2003) and neuroimaging data (Giraud et al.,
1999; Lockwood et al., 1998, 1999; Mirz et al., 2000; Plewnia, Reimold,
Najib, Brehm et al., 2007) all support critical involvement of non-auditory
brain areas in the pathophysiology of chronic tinnitus.
TRANSCRANIAL MAGNETIC STIMULATION
In 1985 Barker and colleagues demonstrated that it is possible to depolar-
ize neurons in the brain using external magnetic stimulation (Barker,
Jalinous, & Freeston, 1985).
The stimulator delivers a short-lasting (100�300 µs) high current pulse
in an insulated coil of wire, which is placed above the skull over the region
296 Berthold Langguth and Dirk de Ridder

of particular interest. This induces a magnetic field (1.5�2 Tesla) perpendic-
ular to the coil which penetrates the scalp and brain with little impedance.
An electrical field is induced perpendicular to the magnetic field resulting in
neuronal depolarization of the underlying brain area. Magnetic coils can
have different shapes. Round coils are relatively powerful. Figure-eight-
shaped coils are more focal with a maximal current at the intersection of the
two round components (Ridding & Rothwell, 1997). Due to the strong
decline of the magnetic field with increasing distance from the coil, direct
stimulation effects are limited to superficial cortical areas. However, stimula-
tion effects can be propagated to functionally connected remote areas.
Whereas single magnetic pulses do not seem to have longer-lasting
effects, the application of multiple pulses in rhythmic sessions, called
repetitive transcranial magnetic stimulation (rTMS), can have effects that
outlast the stimulation period. These effects resemble those seen in animal
experiments where repeated stimulation of many pathways has been
shown to produce changes in the effectiveness of synapses in the same cir-
cuits (Post & Keck, 2001). Low frequency (#1 Hz) rTMS has been
repeatedly shown to result in a decrease in cortical excitability (Hallett,
2000; Hoffman & Cavus, 2002), whereas high-frequency (5�20 Hz)
rTMS results in an increase in excitability (Pascual-Leone, Grafman, &
Hallett, 1994). Low-frequency and high-frequency TMS of the auditory
cortex have been linked to long-term potentiation and long-term depres-
sion (LTP and LTD) respectively (Wang, Wang, & Scheich, 1996), which
are thought to be important in learning and memory (Wang et al., 1996).
rTMS can also be used to transiently disturb on-going neural activity
in the stimulated cortical area, thus creating a transient functional
lesion. Such an approach can help to identify whether a given brain area
is critically involved in a specific behavioral task.
Because of these unique and powerful features, rTMS became increas-
ingly popular in various fields, including cognitive neuroscience and clini-
cal application (for review see Simons & Dierick, 2005; Walsh &
Rushworth, 1999). However, despite its utility, the exact mechanisms of
how rTMS stimulates neurons and interferes with neural functions are still
incompletely understood (Ridding & Rothwell, 1997).
Rationale for the Use of Neuromodulation in Investigation,Diagnosis, and Treatment of TinnitusAs described before, the phantom perception of sound seems to be a con-
sequence of altered activity in the central nervous system. An increasing
297Transcranial Magnetic Stimulation for Tinnitus

number of animal and human studies have contributed to a more and
more detailed identification of the neural correlate of tinnitus. In short,
alterations of neural firing and oscillatory activity (Llinas et al., 1999,
2005; van der Loo et al., 2009; Weisz et al., 2007), alterations of neural
synchrony (Seki & Eggermont, 2003) and changes in the tonotopic maps
(Muhlnickel et al., 1998) have been observed. These changes are not
restricted to one specific brain area. Rather they can be conceived as
alterations of a network involving auditory and non-auditory brain areas
(Schlee et al., 2008; Schlee, Hartmann et al., 2009; Schlee, Mueller,
Hartmann, Keil, Lorenz, & Weisz, 2009). These changes of neural activity
seem to arise from dysfunctional plastic responses to altered sensory input,
which is auditory deprivation in most cases (Norena, Micheyl, Chery-
Croze, & Collet, 2002; Norena & Eggermont, 2005, 2006). Frontal and
parietal brain areas seem to have an important modulatory role (Lockwood
et al., 1998; Schlee, Hartmann et al., 2009). However, neuroimaging stud-
ies represent only a correlative approach with its inherent limitations. Thus
it remains unclear whether the observed alterations are critically involved
in the pathophysiology or whether they represent epiphenomena.
Interfering with neural activity in these regions with single sessions of
rTMS can be used as a non-invasive test to probe their relevance for the
pathophysiology of tinnitus (Plewnia, Bartels, & Gerloff, 2003). This
method can potentially also be further developed as a diagnostic test to dif-
ferentiate pathophysiologically distinct forms of tinnitus.
Any causally oriented therapy of tinnitus should aim at normalizing
the tinnitus-related disturbed neuronal network activity. In principle there
are two possibilities. The first approach consists of restoring the disturbed
auditory input to the auditory cortex. This can be done indirectly by
hearing aids (Moffat et al., 2009), cochlear (Brackmann, 1981; Van de
Heyning et al., 2008), auditory nerve (Holm, Staal, Mooij, & Albers,
2005), and brainstem implants (Soussi & Otto, 1994) which have all been
shown to improve tinnitus in selected patients. Another option is to sup-
ply the missing information directly to the auditory cortex (De Ridder &
Van de Heyning, 2007) or to interfere with the distributed “tinnitus
network” directly. This can be done at the auditory cortex by implanted
electrodes (De Ridder, De Mulder, Menovsky, Sunaert, & Kovacs, 2007;
De Ridder, De Mulder, Verstraeten et al., 2007; De Ridder et al., 2006;
De Ridder et al., 2004; Friedland et al., 2007; Seidman et al., 2008),
tDCS (Fregni et al., 2006; Vanneste et al., 2010) or rTMS (De Ridder
et al., 2005; Khedr, Rothwell, & El-Atar, 2009; Kleinjung et al., 2005;
298 Berthold Langguth and Dirk de Ridder

Londero, Langguth, De Ridder, Bonfils, & Lefaucheur, 2006) or potentially
at other hubs of the distributed “tinnitus network” (Schlee, Hartmann et al.,
2009; Schlee, Mueller et al., 2009), or combined (Kleinjung, Vielsmeier,
Landgrebe, Hajak, & Langguth, 2008). Also neurofeedback has been pro-
posed to normalize pathological oscillatory activity directly (EEG-based)
(Dohrmann, Weisz, Schlee, Hartmann, & Elbert, 2007) or indirectly (fMRI-
based) (Haller, Birbaumer, & Veit, 2010). Whereas stimulation by implanted
electrodes or pharmacotherapy can be performed permanently, rTMS, tDCS
or neurofeedback can only be applied for a limited amount of time.
Nevertheless these methods hold therapeutic potential, since all of them can
induce plastic changes which outlast the treatment period (Allen, Pasley,
Duong, & Freeman, 2007; Wang et al., 1996). These long-lasting effects
with limited treatment time can be either explained by learning-like effects,
or by the disruption of dysfunctional networks, which then allow the
re-establishment of a more physiological state.
Single Sessions of rTMSWithin the last years several studies with single sessions of rTMS have
been performed with the goal to transiently reduce tinnitus perception
(see Table 11.1). In these types of studies, results were largely based on
the administration of high-frequency rTMS (10�20 Hz). In a pilot trial,
stimulation of the left temporoparietal cortex with high-frequency rTMS
(10 Hz) resulted in a transient reduction of tinnitus in 57% of the partici-
pants (Plewnia et al., 2003). This result has been confirmed in a large
series of 114 patients with unilateral tinnitus (De Ridder et al., 2005).
rTMS at frequencies between 1 and 20 Hz was applied over the auditory
cortex contralateral to the site of tinnitus perception. Better tinnitus sup-
pression was achieved with higher stimulation frequencies and shorter tin-
nitus duration, indicating the potential of TMS as a diagnostic tool for
differentiating different forms of chronic tinnitus. Single TMS sessions
have also been used as a screening method to select patients for surgical
implantation of cortical electrodes (De Ridder, De Mulder, Menovsky
et al., 2007; De Ridder et al., 2006; De Ridder, De Mulder, Verstraeten
et al., 2007).
Two studies (Folmer, Carroll, Rahim, Shi, & Hal Martin, 2006;
Fregni et al., 2006) confirmed the result of transient tinnitus reduction
after high-frequency stimulation of the left temporoparietal cortex,
299Transcranial Magnetic Stimulation for Tinnitus
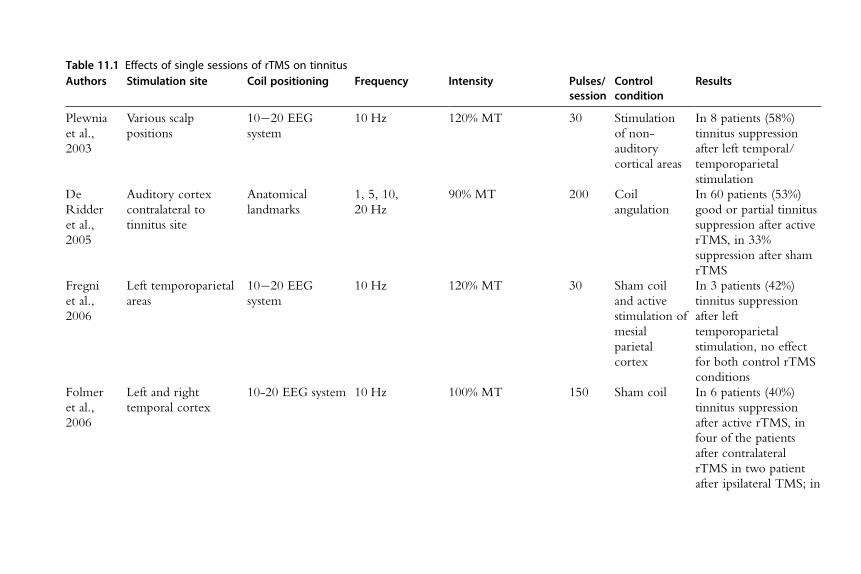
Table 11.1 Effects of single sessions of rTMS on tinnitusAuthors Stimulation site Coil positioning Frequency Intensity Pulses/
sessionControlcondition
Results
Plewnia
et al.,
2003
Various scalp
positions
10�20 EEG
system
10 Hz 120% MT 30 Stimulation
of non-
auditory
cortical areas
In 8 patients (58%)
tinnitus suppression
after left temporal/
temporoparietal
stimulation
De
Ridder
et al.,
2005
Auditory cortex
contralateral to
tinnitus site
Anatomical
landmarks
1, 5, 10,
20 Hz
90% MT 200 Coil
angulation
In 60 patients (53%)
good or partial tinnitus
suppression after active
rTMS, in 33%
suppression after sham
rTMS
Fregni
et al.,
2006
Left temporoparietal
areas
10�20 EEG
system
10 Hz 120% MT 30 Sham coil
and active
stimulation of
mesial
parietal
cortex
In 3 patients (42%)
tinnitus suppression
after left
temporoparietal
stimulation, no effect
for both control rTMS
conditions
Folmer
et al.,
2006
Left and right
temporal cortex
10-20 EEG system 10 Hz 100% MT 150 Sham coil In 6 patients (40%)
tinnitus suppression
after active rTMS, in
four of the patients
after contralateral
rTMS in two patient
after ipsilateral TMS; in

2 patients suppression
after sham rTMS
Londero
et al.,
2006
Contralateral
auditory cortex
fMRI-guided
neuronavigation
1, 10 Hz 120% MT 30 Stimulation
over non-
auditory
cortical areas
8 patients were
stimulated over the
auditory cortex with
1 Hz ; in 5 of them
(62.5%) tinnitus
suppression; no
suppression after 1 Hz
rTMS of non-auditory
targets; no suppression
after 10 Hz, in 2
patients suppression
after stimulation of a
control position
Plewnia
et al.,
2007
Area of maximum
tinnitus-related PET
activation
(temporoparietal
cortex),
Neuronavigational
system, based on
H2O PETwith
and without
lidocaine
1 Hz 120% MT 300,
900,
1800
Control
position
(occipital
cortex)
In 6 patients (75%)
tinnitus reduction after
active rTMS, better
suppression with more
pulses
De
Ridder
et al.,
2007
Auditory cortex
contralateral to
tinnitus site
Anatomical
landmarks
5, 10, 20 Hz
tonic; 5, 10,
20 Hz burst
90% MT 200 Coil
angulation
14 placebo-negative
patients were analyzed:
In those with narrow
band/white noise
tinnitus burst TMS was
more effective in
tinnitus suppression as
compared to tonic
(Continued)
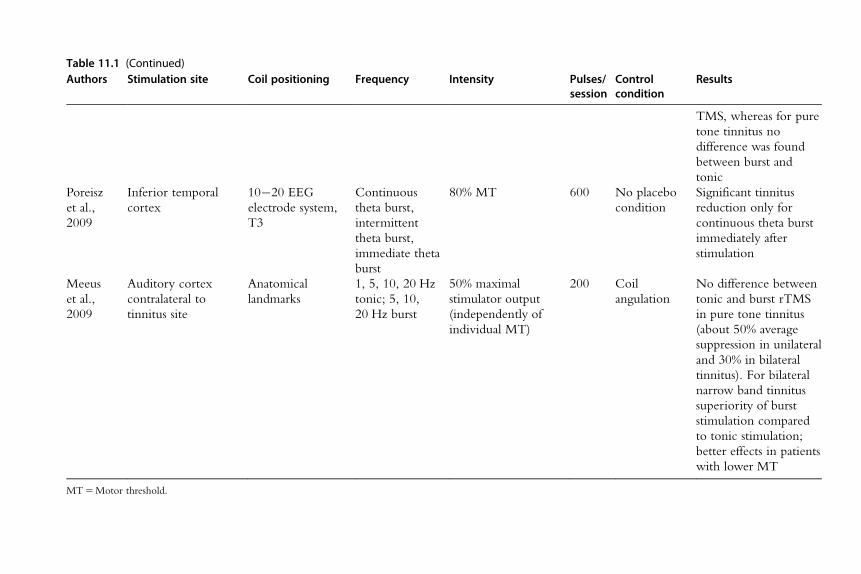
Table 11.1 (Continued)Authors Stimulation site Coil positioning Frequency Intensity Pulses/
sessionControlcondition
Results
TMS, whereas for pure
tone tinnitus no
difference was found
between burst and
tonic
Poreisz
et al.,
2009
Inferior temporal
cortex
10�20 EEG
electrode system,
T3
Continuous
theta burst,
intermittent
theta burst,
immediate theta
burst
80% MT 600 No placebo
condition
Significant tinnitus
reduction only for
continuous theta burst
immediately after
stimulation
Meeus
et al.,
2009
Auditory cortex
contralateral to
tinnitus site
Anatomical
landmarks
1, 5, 10, 20 Hz
tonic; 5, 10,
20 Hz burst
50% maximal
stimulator output
(independently of
individual MT)
200 Coil
angulation
No difference between
tonic and burst rTMS
in pure tone tinnitus
(about 50% average
suppression in unilateral
and 30% in bilateral
tinnitus). For bilateral
narrow band tinnitus
superiority of burst
stimulation compared
to tonic stimulation;
better effects in patients
with lower MT
MT5Motor threshold.

whereas one study (Londero et al., 2006) demonstrated reliable tinnitus
suppression in only 1 out of 13 subjects after a single session of high fre-
quency rTMS. Additionally, in one small study it has been shown that the
participants with significant tinnitus reduction after rTMS also had good
response to anodal transcranial direct current stimulation (tDCS) (Fregni
et al., 2006). In order to try to improve TMS results, PET scans have
been used to determine the stimulation target, based on changes of cere-
bral blood flow before and after lidocaine injection (Plewnia, Reimold,
Najib, Brehm et al., 2007): single sessions of low frequency (1 Hz) rTMS
with the coil navigated to the individually determined areas in the
temporoparietal cortex resulted in tinnitus reduction in 6 out of 8 patients
lasting up to 30 minutes.
Repeated Sessions of rTMS in TinnitusThe application of low-frequency rTMS in repeated sessions was moti-
vated by positive results of 1 Hz rTMS in the treatment of auditory hallu-
cinations and other neuropsychiatric disorders characterized by focal
hyperexcitability (Hoffman & Cavus, 2002). In the temporal cortex of
rodents the induction of LTD- and LTP-like effects had been demon-
strated (Wang et al., 1996) and in humans low-frequency rTMS reliably
reduced cortical excitability in the motor cortex (Chen et al., 1997) and
in the frontal cortex (Speer et al., 2001). Based on these data, low-
frequency rTMS has been proposed for achieving longer-lasting improve-
ment of tinnitus complaints by reducing auditory cortex hyperactivity
(Eichhammer, Langguth, Marienhagen, Kleinjung, & Hajak, 2003;
Langguth et al., 2003). An increasing amount of studies using this
approach as a treatment for tinnitus have been published (Table 11.2).
Most rTMS treatment studies applied low-frequency rTMS in long trains
of 1200�2000 pulses repeatedly over 5�10 days. In all controlled studies
a statistically significant improvement of tinnitus complaints has been
documented. However, the quantity of improvement and also the dura-
tion of treatment effects varied across studies, probably due to differences
in study design, stimulation parameters and patient populations.
Repetitive TMS has been applied over temporal or temporoparietal
areas. In the first clinical study to verify whether low-frequency rTMS
could induce long-lasting effects, [18F]deoxyglucose (FDG) PETwas per-
formed in 14 patients and a neuronavigational system allowed the posi-
tioning of the TMS coil exactly over the site of maximum activation in
303Transcranial Magnetic Stimulation for Tinnitus

Table 11.2 Effects of repeated sessions of rTMS in tinnitus patientsAuthors Stimulation site Coil positioning Frequency Intensity Sessions Pulses/
sessionDesign Control
conditionResults
Kleinjung
et al., 2005
Area of maximum
PET activation in
the temporal
cortex (12 left, 2
right)
Neuro-navigational
system, based on
FDG-PET
1 Hz 110%
MT
5 2000 Sham-
controlled,
crossover
Sham coil Significant reduction of
tinnitus after active rTMS
as compared to sham
rTMS; lasting tinnitus
reduction (6 months)
Langguth
et al., 2006
Left auditory
cortex,
10�20 EEG system 1 Hz 110%
MT
10 2000 Open No control
condition
Significant reduction of
tinnitus until end of
follow-up (3 months)
Plewnia
et al., 2007
Area of maximum
tinnitus related
PET activation
(temporoparietal
cortex; 3 left,
3 right)
Neuro-navigational
system, based on
H2O PETwith and
without lidocaine
1 Hz 120%
MT
10 1800 Sham-
controlled,
crossover
Occipital
cortex
Significant reduction of
tinnitus after active rTMS,
as compared to the
control condition; no
lasting effects
Kleinjung
et al., 2007
Left auditory
cortex
Neuro-navigational
system, based on
structural MRI
1 Hz 110%
MT
10 2000 Open No control
condition
Significant tinnitus
reduction after rTMS,
lasting up during follow-
up period (3 months)
responders were
characterized by shorter
tinnitus duration and less
hearing impairment
Rossi
et al., 2007
Left secondary
auditory cortex
8 patients:
neuronavigational
system 8 patients:
according to
10�20 EEG
system, halfway
1 Hz 120%
MT
5 1200 Sham-
controlled,
crossover
Coil
angulation1electrical
stimulation
of facial
nerve
Significant reduction of
tinnitus after active rTMS,
as compared to the
control condition, no
lasting effects

between T3 and
C3/T5
Smith
et al., 2007
Area of maximal
PET activation in
the temporal
cortex,
neuronavigational
system
Neuro-navigational
system, based on
FDG-PET
1 Hz 110%
MT
5 1800 Sham-
controlled,
crossover
Coil
angulation
Modest response to active
treatment in 3 patients
(75%)
Khedr
et al., 2008
Left
temporoparietal
cortex
10�20 EEG system 1 Hz,
10 Hz,
25 Hz
100%
MT
10 1500 Sham-
controlled,
parallel group
design
Occipital
cortex
Significant reduction of
tinnitus after all three
active rTMS conditions,
as compared to the
control condition; tinnitus
reduction lasting during
follow-up period
(4 months and 12
months)
Langguth
et al., 2008
Left auditory
cortex
Neuro-navigational
system, based on
structural MRI
1 Hz,
6 Hz11 Hz
110%
MT
(90%
MT for
6 Hz
rTMS)
10 2000 Randomization
between two
active treatment
conditions,
parallel group
design
No sham
control
condition
Significant improvement
for both stimulation
conditions, no difference
between conditions, no
lasting effects
Lee et al.,
2008
Left
temporoparietal
cortex
?? 0.5 Hz 100%
MT
5 600 Open study No control
condition
No
significant
reduction of
tinnitus
10 2000
(Continued)

Table 11.2 (Continued)Authors Stimulation site Coil positioning Frequency Intensity Sessions Pulses/
sessionDesign Control
conditionResults
Kleinjung
et al., 2008
Left auditory
cortex; left
dorsolateral
prefrontal cortex
Neuro-navigational
system, based on
structural MRI
1 Hz,
20 Hz
(DLPFC)
1 1 Hz
110%
MT
Two active
treatment
conditions,
parallel group
design
No sham
control
condition
Directly after stimulation
significant improvement
for both stimulation
conditions, at 3 month
follow-up significantly
better results for the
combined frontal and
temporal stimulation
Kleinjung
et al., 2009
Left auditory
cortex
Neuro-navigational
system, based on
structural MRI
1 Hz,
1 Hz1Levodopa
110%
MT
10 2000 Randomization
between two
active treatment
conditions,
parallel group
design
No sham
control
condition
Significant improvement
for both stimulation
conditions, no difference
between conditions, no
lasting effects
Marcondes
et al., 2010
Left
temporoparietal
cortex
10�20 EEG system 1 Hz 110%
MT
5 1020 Sham
controlled,
parallel group
design
Sham coil Significant improvement
after active rTMS but not
after sham rTMS,
beneficial treatment
effects still detectable at 6
months follow-up
Frank
et al., 2010
Left temporal 10�20 EEG system 1 Hz 110%
MT
10 2000 Open No control
condition
Significant tinnitus
reduction after rTMS in
patients with unilateral
leftsided and bilateral
tinnitus, but not in
rightsided tinnitus, effects
lasting up during follow-
up period (3 months)
MT5Motor threshold.

the auditory cortex (Kleinjung et al., 2005). After active treatment, a sig-
nificant decrease in the score of the Tinnitus Questionnaire was observed,
whereas sham treatment showed no effect. Treatment effects were still
detectable 6 months after treatment. Another study investigated the effects
of 2 weeks of rTMS applied over the area of maximum lidocaine-related
activity change as determined by [15O]H2O PET (Plewnia, Reimold,
Najib, Brehm et al., 2007). This approach also resulted in moderate, but
significant effects after active stimulation. Since PET scans are not readily
available, easier applicable techniques have been proposed for determining
coil localization, based on the 10�20 EEG coordinate system. This
approach also has resulted in a significant reduction of tinnitus severity
after 10 sessions of 1 Hz rTMS (Langguth et al., 2006). Beneficial effects
of low frequency rTMS have been confirmed by several further controlled
studies (Marcondes et al., 2010; Rossi et al., 2007; Smith et al., 2007).
One study (Rossi et al., 2007) used peripheral electrical stimulation as a
control condition and thus demonstrated that the reduction of tinnitus is
not mediated by somatosensory afferents, but by cortical stimulation.
Subsequently a study was performed using functional imaging (FDG
PET) before and after rTMS (Smith et al., 2007). They demonstrated in
their small sample that a clinical reduction after rTMS was paralleled by
reduced metabolic activity in the stimulated area. Changes of brain activ-
ity also were demonstrated after rTMS in another study (Marcondes et al.,
2010), but these changes were not exactly in the stimulated area, rather in
the left inferior temporal lobe, a sensory integration area. Interestingly,
this study revealed 6 months’ long-lasting effects after only five stimulation
sessions, which might be due to the fact that only tinnitus patients with
normal audiograms were included, as it has been demonstrated that severe
hearing loss worsens rTMS results (Kleinjung et al., 2007).
While some studies demonstrated effects that outlasted the stimulation
period up to 6 or 12 months (Khedr et al., 2009; Kleinjung et al., 2005;
Marcondes et al., 2010), others were not able to observe prolonged effects
(Plewnia, Reimold, Najib, Reischl et al., 2007; Smith et al., 2007). The
total amount of rTMS sessions may be an important variable in achieving
long-term effects in tinnitus patients (Langguth et al., 2003), analogous to
what has been observed in other rTMS applications such as depression
(Gershon, Dannon, & Grunhaus, 2003) and auditory hallucinations
(Hoffman et al., 2005).
A recent case report showed that it is possible to use maintenance
rTMS to manage chronic tinnitus (Mennemeier et al., 2008). In this
307Transcranial Magnetic Stimulation for Tinnitus

patient, tinnitus could be improved each time it re-occurred, by applying
one to three maintenance rTMS sessions. After three maintenance rTMS
sessions it finally stabilized on a low level. The positive effect of this
maintenance stimulation could also be confirmed by reduced cerebral
metabolism in PET imaging after treatment. The rationale for using
rTMS for maintenance treatment of tinnitus relies on the fact that those
patients who respond once to rTMS treatment also experience positive
effects from a second series of rTMS (Langguth, Landgrebe, Hajak, &
Kleinjung, 2008).
The concept of specific effects of low-frequency rTMS for reducing
focal hyperexcitability has been challenged by a recent study which
compared effects of 1 Hz, 10 Hz, and 25 Hz rTMS (Khedr, Rothwell,
Ahmed, & El-Atar, 2008). Whereas sham rTMS treatment had no effect,
active stimulation over the left temporoparietal cortex resulted in a reduc-
tion of tinnitus irrespective of the stimulation frequency. Follow-up assess-
ment one year after treatment demonstrated a trend for higher efficiency
of 10 and 25 Hz as compared to 1 Hz (Khedr et al., 2009). Experimental
data from motor cortex stimulation in healthy subjects indicates that
LTD-like effects induced by low-frequency rTMS can be enhanced
by high-frequency priming stimulation (Iyer, Schleper, & Wassermann,
2003). However, in a clinical study high-frequency priming stimulation
failed to enhance the therapeutic efficacy of low-frequency rTMS for the
treatment of tinnitus (Langguth, Kleinjung et al., 2008), further indicating
that the mechanisms by which rTMS affects tinnitus differ from those
LTD-like effects observed after motor cortex stimulation.
Repetitive TMS can be applied in a tonic and a burst mode. The burst
stimulation technique has been proposed for enhancing rTMS effects. It
consists of bursts of three pulses at a frequency of 50 Hz, applied every
200 ms (5 Hz, theta burst) (Huang, Edwards, Rounis, Bhatia, &
Rothwell, 2005). Burst TMS has been shown to induce more pronounced
and longer-lasting effects on human motor cortex than tonic stimulation
(Huang et al., 2005). Single sessions of continuous theta burst stimulation
over the temporal cortex in tinnitus patients resulted in short-lasting
reduction of tinnitus loudness compared to effects achieved with single
sessions of tonic stimulation and other theta burst protocols had no effect
at all (Poreisz, Paulus, Moser, & Lang, 2009). In two other studies single
sessions of burst stimulation were compared with tonic stimulation (De
Ridder, van der Loo et al., 2007a, 2007b). Burst stimulation yielded simi-
lar efficacy as tonic stimulation in patients with pure tone tinnitus, but was
308 Berthold Langguth and Dirk de Ridder

superior in patients with noise-like tinnitus. A possible explanation for
this finding is that pure tone tinnitus may be related to increased neuronal
activity in the classical (lemniscal) auditory pathways, which mainly fire
tonically, whereas noise-like tinnitus may be the result of increased activity
in the non-classical (extra-lemniscal) pathways, which is characterized by
burst firing. A follow-up study of the same group replicated this result for
bilateral tinnitus, but not for unilateral tinnitus (Meeus, Blaivie, Ost, De
Ridder, & Van de Heyning, 2009). Furthermore, results of this study sug-
gested that higher stimulation intensity may result in slightly better tinni-
tus suppression.
The neurobiology of chronic tinnitus suggests that neuronal changes
are not limited to the auditory pathways (Lockwood et al., 1998; Schlee,
Hartmann et al., 2009; Schlee, Mueller et al., 2009). Recent progress in
consciousness research has demonstrated that hyperactivity within primary
sensory areas alone is not sufficient for conscious tinnitus perception.
Rather, synchronized co-activation of frontal and parietal areas seems to
be necessary (Boly et al., 2004). This suggests that tinnitus might be an
emergent property of a network, rather than just an expression of hyper-
activity in the auditory cortex. Therefore it may be better to modulate
more than one area involved in the tinnitus network. In one pilot study
32 patients received either low-frequency temporal rTMS or a combina-
tion of high-frequency prefrontal and low-frequency temporal rTMS
(Kleinjung, Eichhammer et al., 2008). Immediately after therapy there
was an improvement of the Tinnitus Questionnaire score for both groups
but no differences between groups. However, after 3 months a remarkable
advantage for combined prefrontal and temporal rTMS treatment was
noted. These data indicate that modulation of both frontal and temporal
cortex activity might represent a promising enhancement strategy for
improving TMS effects in tinnitus patients.
Combination of rTMS with pharmacologic intervention also has been
suggested for potentiating rTMS effects, analogous to what has been
described for tDCS (Nitsche et al., 2006; Terney et al., 2008). It is known
from animal experiments that neuronal plasticity can be enhanced by
dopaminergic receptor activation (Otani, Blond, Desce, & Crepel, 1998).
However, in a clinical pilot study the administration of 100 mg Levodopa
before rTMS was not successful in enhancing rTMS effects in tinnitus
patients (Kleinjung et al., 2009).
There are few prognostic factors that determine the rTMS outcome
for tinnitus. Several studies reported that shorter tinnitus duration was
309Transcranial Magnetic Stimulation for Tinnitus

related to better treatment outcome (De Ridder et al., 2005; Khedr et al.,
2008; Kleinjung et al., 2007; Plewnia, Reimold, Najib, Brehm et al.,
2007). Normal hearing was also suggested as a positive clinical predictor
for good treatment response (Kleinjung et al., 2007; Marcondes et al.,
2010). Interestingly, short tinnitus duration and normal hearing have been
demonstrated to be positive predictors in other treatment options for tin-
nitus as well (De Ridder et al., 2010; M. B. Moller, Moller, Jannetta, &
Jho, 1993; Ryu, Yamamoto, Sugiyama, & Nozue, 1998).
Methodological ConsiderationsEvaluation of treatment efficacy requires adequate methodology for con-
trol of unspecific treatment and placebo effects. The majority of con-
trolled studies published to date have used placebo treatment in cross-over
designs. Potential shortcomings of this approach include carry-over effects
and missed long-term effects due to limited observation periods. Different
methods have been reported to control for placebo effects. Besides the
sham coil system (Kleinjung et al., 2005), which mimics the sound of the
active coil without generating a magnetic field, an angulation of an active
coil tilted 45� (Smith et al., 2007) or 90� (De Ridder et al., 2005; Rossi
et al., 2007) to the skull surface, and stimulation of non-auditory brain
areas (Plewnia, Reimold, Najib, Brehm et al., 2007) have been described.
Another option is to use two coils, with the inactive coil positioned on
the target and the active coil 90� perpendicular to and on top of it
(Meeus, De Ridder, & Van de Heyning, 2009). This has the advantage
that the sensory perception of the coil is the same (apart from the muscle
contractions). Finding an optimal control condition for treatment studies
is difficult due to limitations in blinding of patient and operator to differ-
ent stimulus conditions, and due to the fact that TMS itself results in audi-
tory and somatosensory stimulation in addition to its brain stimulation
activity. One possible solution is a control condition that involves electrical
stimulation of the facial nerve (Rossi et al., 2007). But even this method
has to be considered with care as modulating the motor system can alter
tinnitus perception. This has become clear with the tinnitus modulating
effects of ventral intermedius nucleus stimulation performed in the setting
of movement disorders (Shi, Burchiel, Anderson, & Martin, 2009).
In most studies validated tinnitus questionnaires and visual analogue
scales serve as primary outcome measurements due to the lack of objec-
tive parameters. The improvement in tinnitus rating after stimulation is
310 Berthold Langguth and Dirk de Ridder

associated with a reduction of metabolic activity on PET scan (Smith
et al., 2007). Therefore functional imaging might evolve as an objective
marker of treatment effects in the future.
Safety AspectsAn extensive body of literature demonstrates that rTMS is a safe and well
tolerated technique (Rossi, Hallett, Rossini, & Pascual-Leone, 2009), at
least if stimulation is performed according to published safety guidelines
(Rossi et al., 2009; Wassermann, 1998). Most data are available from
rTMS studies in depressed subjects. In an analysis of 10 000 cumulative
rTMS sessions performed for depression no deaths or seizures were
encountered (Janicak et al., 2008). Most adverse events in this analysis
were mild to moderate in intensity. Transient headaches and scalp discom-
fort were the most common adverse events. Auditory threshold and cog-
nitive function did not change. There was a low discontinuation rate
(4.5%) due to adverse events during acute treatment (Janicak et al., 2008).
Another study demonstrated that after 2�4 weeks of daily prefrontal
rTMS there was no sign of structural MRI changes (Nahas et al., 2000),
no significant changes in auditory thresholds and no significant electro-
encephalogram abnormalities (Loo et al., 2001). It is essential that contra-
indications such as electronic implants (e.g. cardiac pacemakers, cochlea
implants), intracranial pieces of metal or previous epileptic seizures are
considered.
CONCLUSION
Available literature converges in the finding that rTMS seems to be a
promising tool for investigating the pathophysiology of tinnitus. Data also
indicate its diagnostic potential for differentiating pathophysiologically
distinct forms of tinnitus.
An increasing number of clinical studies also suggest a therapeutic
potential for rTMS. Even though there are now six placebo-controlled
studies from six different centers, all demonstrating a beneficial effect of
rTMS in equal percentages of responders, these results must be considered
preliminary, due to small sample sizes, methodological hetereogeneity, and
high inter-subject variability. The duration of treatment effects remains
inconclusive. Effects outlasted the stimulation period up to 12 months in
some studies whereas others could not demonstrate any after-effects.
Replication in multicenter trials with a large number of patients and
311Transcranial Magnetic Stimulation for Tinnitus

long-term follow-up are needed before further conclusions can be drawn
(Landgrebe, Binder et al., 2008). Further clinical research is needed to
define those subgroups of patients which benefit most from rTMS. Better
understanding of the pathophysiology of the different forms of tinnitus on
one side and the neurobiological effects of rTMS on the other side will
be critical for optimizing and individualizing treatment protocols.
REFERENCESAllen, E. A., Pasley, B. N., Duong, T., & Freeman, R. D. (2007). Transcranial magnetic
stimulation elicits coupled neural and hemodynamic consequences. Science, 317(5846),1918�1921.
Andersson, G., Lyttkens, L., Hirvela, C., Furmark, T., Tillfors, M., & Fredrikson, M.(2000). Regional cerebral blood flow during tinnitus: A PET case study with lido-caine and auditory stimulation. Acta Otolaryngology, 120(8), 967�972.
Arnold, W., Bartenstein, P., Oestreicher, E., Romer, W., & Schwaiger, M. (1996). Focalmetabolic activation in the predominant left auditory cortex in patients suffering fromtinnitus: A PET study with [18F]deoxyglucose. ORL: Journal of Otorhinolaryngology andRelated Specialties, 58(4), 195�199.
Axelsson, A., & Ringdahl, A. (1989). Tinnitus � a study of its prevalence and characteris-tics. British Journal of Audiology, 23(1), 53�62.
Barker, A. T., Jalinous, R., & Freeston, I. L. (1985). Non-invasive magnetic stimulation ofhuman motor cortex. Lancet, 1(8437), 1106�1107.
Boly, M., Faymonville, M. E., Peigneux, P., Lambermont, B., Damas, P., Del Fiore, G.,et al. (2004). Auditory processing in severely brain injured patients: Differencesbetween the minimally conscious state and the persistent vegetative state. Archives ofNeurology, 61(2), 233�238.
Brackmann, D. E. (1981). Reduction of tinnitus in cochlear-implant patients. Journal ofLaryngology and Otology, 4(Suppl), 163�165.
Chen, R., Classen, J., Gerloff, C., Celnik, P., Wassermann, E. M., Hallett, M., et al.(1997). Depression of motor cortex excitability by low-frequency transcranial mag-netic stimulation. Neurology, 48(5), 1398�1403.
Cronlein, T., Langguth, B., Geisler, P., & Hajak, G. (2007). Tinnitus and insomnia.Progress in Brain Research, 166, 227�233.
De Ridder, D., De Mulder, G., Menovsky, T., Sunaert, S., & Kovacs, S. (2007). Electricalstimulation of auditory and somatosensory cortices for treatment of tinnitus and pain.Progress in Brain Research, 166, 377�388.
De Ridder, D., De Mulder, G., Verstraeten, E., Seidman, M., Elisevich, K., Sunaert, S.,et al. (2007). Auditory cortex stimulation for tinnitus. Acta Neurochirurgica, Suppl 97(Pt 2), 451�462.
De Ridder, D., De Mulder, G., Verstraeten, E., Van der Kelen, K., Sunaert, S., Smits, M.,et al. (2006). Primary and secondary auditory cortex stimulation forintractable tinnitus. ORL: Journal of Otorhinolaryngology and Related Specialties, 68(1),48�54, discussion 54-45
De Ridder, D., De Mulder, G., Walsh, V., Muggleton, N., Sunaert, S., & Moller, A.(2004). Magnetic and electrical stimulation of the auditory cortex forintractable tinnitus. Case report. Journal of Neurosurgery, 100(3), 560�564.
De Ridder, D., & Van de Heyning, P. (2007). The Darwinian plasticity hypothesis for tin-nitus and pain. Progress in Brain Research, 166, 55�60.
312 Berthold Langguth and Dirk de Ridder

De Ridder, D., van der Loo, E., Van der Kelen, K., Menovsky, T., van de Heyning, P., &Moller, A. (2007a). Do tonic and burst TMS modulate the lemniscal and extralemnis-cal system differentially? International Journal of Medical Science, 4(5), 242�246.
De Ridder, D., van der Loo, E., Van der Kelen, K., Menovsky, T., van de Heyning, P., &Moller, A. (2007b). Theta, alpha and beta burst transcranial magnetic stimulation:Brain modulation in tinnitus. International Journal of Medical Science, 4(5), 237�241.
De Ridder, D., Vanneste, S., Adriaenssens, I., Lee, A. P., Plazier, M., Menovsky, T., et al.(2010). Microvascular decompression for tinnitus: Significant improvement for tinnitusintensity without improvement for distress. A 4-year limit. Neurosurgery, 66(4),656�660.
De Ridder, D., Verstraeten, E., Van der Kelen, K., De Mulder, G., Sunaert, S., Verlooy, J.,et al. (2005). Transcranial magnetic stimulation for tinnitus: Influence of tinnitus dura-tion on stimulation parameter choice and maximal tinnitus suppression. Otology andNeurotology, 26(4), 616�619.
Dobie, R. A. (1999). A review of randomized clinical trials in tinnitus. Laryngoscope,109(8), 1202�1211.
Dobie, R. A. (2003). Depression and tinnitus. Otolaryngology Clinics of North America,36(2), 383�388.
Dohrmann, K., Weisz, N., Schlee, W., Hartmann, T., & Elbert, T. (2007). Neurofeedbackfor treating tinnitus. Progress in Brain Research, 166, 473�485.
Eggermont, J. J. (2007). Pathophysiology of tinnitus. Progress in Brain Research, 166,19�35.
Eggermont, J. J., & Roberts, L. E. (2004). The neuroscience of tinnitus. Trends inNeuroscience, 27(11), 676�682.
Eichhammer, P., Langguth, B., Marienhagen, J., Kleinjung, T., & Hajak, G. (2003).Neuronavigated repetitive transcranial magnetic stimulation in patients with tinnitus:A short case series. Biological Psychiatry, 54(8), 862�865.
Folmer, R. L., Carroll, J. R., Rahim, A., Shi, Y., & Hal Martin, W. (2006). Effectsof repetitive transcranial magnetic stimulation (rTMS) on chronic tinnitus. ActaOtolaryngology, 556(Suppl), 96�101.
Fregni, F., Marcondes, R., Boggio, P. S., Marcolin, M. A., Rigonatti, S. P., Sanchez, T. G.,et al. (2006). Transient tinnitus suppression induced by repetitive transcranial magneticstimulation and transcranial direct current stimulation. European Journal of Neurology,13(9), 996�1001.
Friedland, D. R., Gaggl, W., Runge-Samuelson, C., Ulmer, J. L., & Kopell, B. H. (2007).Feasibility of auditory cortical stimulation for the treatment of tinnitus. Otology andNeurotology, 28(8), 1005�1012.
Gershon, A. A., Dannon, P. N., & Grunhaus, L. (2003). Transcranial magnetic stimulationin the treatment of depression. American Journal of Psychiatry, 160(5), 835�845.
Giraud, A. L., Chery-Croze, S., Fischer, G., Fischer, C., Vighetto, A., Gregoire, M. C.,et al. (1999). A selective imaging of tinnitus. Neuroreport, 10(1), 1�5.
Haller, S., Birbaumer, N., & Veit, R. (2010). Real-time fMRI feedback training mayimprove chronic tinnitus. European Radiology, 20(3), 696�703.
Hallett, M. (2000). Transcranial magnetic stimulation and the human brain. Nature,406(6792), 147�150.
Hoffman, R. E., & Cavus, I. (2002). Slow transcranial magnetic stimulation, long-termdepotentiation, and brain hyperexcitability disorders. American Journal of Psychiatry,159(7), 1093�1102.
Hoffman, R. E., Gueorguieva, R., Hawkins, K. A., Varanko, M., Boutros, N. N., Wu, Y. T.,et al. (2005). Temporoparietal transcranial magnetic stimulation for auditory hallucina-tions: Safety, efficacy and moderators in a fifty patient sample. Biological Psychiatry, 58(2), 97�104.
313Transcranial Magnetic Stimulation for Tinnitus

Holm, A. F., Staal, M. J., Mooij, J. J., & Albers, F. W. (2005). Neurostimulation as a newtreatment for severe tinnitus: A pilot study. Otology and Neurotology, 26(3), 425�428;discussion 428.
Huang, Y. Z., Edwards, M. J., Rounis, E., Bhatia, K. P., & Rothwell, J. C. (2005). Thetaburst stimulation of the human motor cortex. Neuron, 45(2), 201�206.
Iyer, M. B., Schleper, N., & Wassermann, E. M. (2003). Priming stimulation enhances thedepressant effect of low-frequency repetitive transcranial magnetic stimulation. Journalof Neuroscience, 23(34), 10867�10872.
Janicak, P. G., O’Reardon, J. P., Sampson, S. M., Husain, M. M., Lisanby, S. H., Rado, J. T.,et al. (2008). Transcranial magnetic stimulation in the treatment of major depressivedisorder: A comprehensive summary of safety experience from acute exposure,extended exposure, and during reintroduction treatment. Journal of Clinical Psychiatry,69(2), 222�232.
Jastreboff, P. J. (1990). Phantom auditory perception (tinnitus): Mechanisms of generationand perception. Neuroscience Research, 8(4), 221�254.
Jastreboff, P. J., Brennan, J. F., & Sasaki, C. T. (1988). An animal model for tinnitus.Laryngoscope, 98(3), 280�286.
Khedr, E. M., Rothwell, J. C., Ahmed, M. A., & El-Atar, A. (2008). Effect of dailyrepetitive transcranial magnetic stimulation for treatment of tinnitus: Comparison ofdifferent stimulus frequencies. Journal of Neurology, Neurosurgery and Psychiatry, 79(2),212�215.
Khedr, E. M., Rothwell, J. C., & El-Atar, A. (2009). One-year follow up of patients withchronic tinnitus treated with left temporoparietal rTMS. European Journal of Neurology,16(3), 404�408.
Kleinjung, T., Eichhammer, P., Landgrebe, M., Sand, P., Hajak, G., Steffens, T., et al.(2008). Combined temporal and prefrontal transcranial magnetic stimulation for tinnitustreatment: A pilot study. Otolaryngology, Head and Neck Surgery, 138(4), 497�501.
Kleinjung, T., Eichhammer, P., Langguth, B., Jacob, P., Marienhagen, J., Hajak, G., et al.(2005). Long-term effects of repetitive transcranial magnetic stimulation (rTMS) inpatients with chronic tinnitus. Otolaryngology, Head and Neck Surgery, 132(4),566�569.
Kleinjung, T., Steffens, T., Landgrebe, M., Vielsmeier, V., Frank, E., Hajak, G., et al.(2009). Levodopa does not enhance the effect of low-frequency repetitive transcranialmagnetic stimulation in tinnitus treatment. Otolaryngology Head and Neck Surgery, 140(1), 92�95.
Kleinjung, T., Steffens, T., Sand, P., Murthum, T., Hajak, G., Strutz, J., et al. (2007).Which tinnitus patients benefit from transcranial magnetic stimulation? Otolaryngology,Head and Neck Surgery, 137(4), 589�595.
Kleinjung, T., Vielsmeier, V., Landgrebe, M., Hajak, G., & Langguth, B. (2008).Transcranial magnetic stimulation: A new diagnostic and therapeutic tool for tinnituspatients. International Tinnitus Journal, 14(2), 112�118.
Kulkarni, B., Bentley, D. E., Elliott, R., Youell, P., Watson, A., Derbyshire, S. W., et al.(2005). Attention to pain localization and unpleasantness discriminates the functions ofthe medial and lateral pain systems. European Journal of Neuroscience, 21(11), 3133�3142.
Landgrebe, M., Barta, W., Rosengarth, K., Frick, U., Hauser, S., Langguth, B., et al.(2008). Neuronal correlates of symptom formation in functional somatic syndromes:A fMRI study. Neuroimage, 41(4), 1336�1344.
Landgrebe, M., Binder, H., Koller, M., Eberl, Y., Kleinjung, T., Eichhammer, P., et al.(2008). Design of a placebo-controlled, randomized study of the efficacy of repetitivetranscranial magnetic stimulation for the treatment of chronic tinntius. BMCPsychiatry, 8, 23.
314 Berthold Langguth and Dirk de Ridder

Langguth, B., Eichhammer, P., Wiegand, R., Marienhegen, J., Maenner, P., Jacob, P.,et al. (2003). Neuronavigated rTMS in a patient with chronic tinnitus. Effects of4 weeks treatment. Neuroreport, 14(7), 977�980.
Langguth, B., Kleinjung, T., Fischer, B., Hajak, G., Eichhammer, P., & Sand, P. G. (2007).Tinnitus severity, depression, and the big five personality traits. Progress in BrainResearch, 166, 221�225.
Langguth, B., Kleinjung, T., Frank, E., Landgrebe, M., Sand, P., Dvorakova, J., et al.(2008). High-frequency priming stimulation does not enhance the effect oflow-frequency rTMS in the treatment of tinnitus. Experimental Brain Research, 184(4),587�591.
Langguth, B., Landgrebe, M., Hajak, G., & Kleinjung, T. (2008). Re: Maintenance repeti-tive transcranial magnetic stimulation can inhibit the return of tinnitus. Laryngoscope,118(12), 2264; author reply 2264-2265.
Langguth, B., Zowe, M., Landgrebe, M., Sand, P., Kleinjung, T., Binder, H., et al.(2006). Transcranial magnetic stimulation for the treatment of tinnitus: A new coilpositioning method and first results. Brain Topography, 18(4), 241�247.
Lanting, C. P., de Kleine, E., & van Dijk, P. (2009). Neural activity underlying tinnitusgeneration: Results from PET and fMRI. Hearing Research, 255(1-2), 1�13.
Llinas, R., Urbano, F. J., Leznik, E., Ramirez, R. R., & van Marle, H. J. (2005).Rhythmic and dysrhythmic thalamocortical dynamics: GABA systems and the edgeeffect. Trends in Neuroscience, 28(6), 325�333.
Llinas, R. R., Ribary, U., Jeanmonod, D., Kronberg, E., & Mitra, P. P. (1999).Thalamocortical dysrhythmia: A neurological and neuropsychiatric syndrome charac-terized by magnetoencephalography. Proceedings of the National Academy of Sciences of theU S A, 96(26), 15 222�15 227.
Lockwood, A. H., Salvi, R. J., Burkard, R. F., Galantowicz, P. J., Coad, M. L., & Wack,D. S. (1999). Neuroanatomy of tinnitus. Scandinavian Audiology, 51(Suppl), 47�52.
Lockwood, A. H., Salvi, R. J., Coad, M. L., Towsley, M. L., Wack, D. S., & Murphy, B. W.(1998). The functional neuroanatomy of tinnitus: Evidence for limbic system links andneural plasticity. Neurology, 50(1), 114�120.
Londero, A., Langguth, B., De Ridder, D., Bonfils, P., & Lefaucheur, J. P. (2006).Repetitive transcranial magnetic stimulation (rTMS): A new therapeutic approach insubjective tinnitus? Neurophysiology Clinics, 36(3), 145�155.
Loo, C., Sachdev, P., Elsayed, H., McDarmont, B., Mitchell, P., Wilkinson, M., et al.(2001). Effects of a 2- to 4-week course of repetitive transcranial magnetic stimulation(rTMS) on neuropsychologic functioning, electroencephalogram, and auditory thresh-old in depressed patients. Biological Psychiatry, 49(7), 615�623.
Lorenz, I., Muller, N., Schlee, W., Hartmann, T., & Weisz, N. (2009). Loss of alpha poweris related to increased gamma synchronization-A marker of reduced inhibition intinnitus? Neuroscience Letters, 453(3), 225�228.
Marcondes, R. A., Sanchez, T. G., Kii, M. A., Ono, C. R., Buchpiguel, C. A., Langguth, B.,et al. (2010). Repetitive transcranial magnetic stimulation improve tinnitus in normalhearing patients: A double-blind controlled, clinical and neuroimaging outcome study.European Journal of Neurology, 17(1), 38�44.
Meeus, O., Blaivie, C., Ost, J., De Ridder, D., & Van de Heyning, P. (2009). Influence oftonic and burst transcranial magnetic stimulation characteristics on acute inhibition ofsubjective tinnitus. Otology and Neurotology, 30(6), 697�703.
Meeus, O. M., De Ridder, D., & Van de Heyning, P. H. (2009). Transcranial magneticstimulation (TMS) in tinnitus patients. B-ENT, 5(2), 89�100.
Melcher, J. R., Sigalovsky, I. S., Guinan, J. J., Jr., & Levine, R. A. (2000). Lateralized tin-nitus studied with functional magnetic resonance imaging: Abnormal inferior collicu-lus activation. Journal of Neurophysiology, 83(2), 1058�1072.
315Transcranial Magnetic Stimulation for Tinnitus

Mennemeier, M., Chelette, K. C., Myhill, J., Taylor-Cooke, P., Bartel, T., Triggs, W.,et al. (2008). Maintenance repetitive transcranial magnetic stimulation can inhibit thereturn of tinnitus. Laryngoscope, 118(7), 1228�1232.
Mirz, F., Gjedde, A., Ishizu, K., & Pedersen, C. B. (2000). Cortical networks subservingthe perception of tinnitus � a PET study. Acta Otolaryngology, 543(Suppl), 241�243.
Moffat, G., Adjout, K., Gallego, S., Thai-Van, H., Collet, L., & Norena, A. J. (2009).Effects of hearing aid fitting on the perceptual characteristics of tinnitus. HearingResearch, 254(1-2), 82�91.
Moisset, X., & Bouhassira, D. (2007). Brain imaging of neuropathic pain. Neuroimage,37(Suppl 1), S80�88.
Moller, A. (1994). Tinnitus. In R. Jackler, & D. Brackmann (Eds.), Neurotology(pp. 153�166). St Louis, MO: Mosby.
Moller, A. R. (2003). Pathophysiology of tinnitus. Otolaryngology Clinics of North America,36(2), 249�266, v-vi
Moller, A. R. (2007a). The role of neural plasticity in tinnitus. Progress in Brain Research,166, 37�45.
Moller, A. R. (2007b). Tinnitus: Presence and future. Progress in Brain Research, 166,3�16.
Moller, M. B., Moller, A. R., Jannetta, P. J., & Jho, H. D. (1993). Vascular decompressionsurgery for severe tinnitus: Selection criteria and results. Laryngoscope, 103(4 Pt 1),421�427.
Muhlnickel, W., Elbert, T., Taub, E., & Flor, H. (1998). Reorganization of auditory cor-tex in tinnitus. Proceedings of the National Academy of Sciences of the U S A, 95(17),10 340�10 343.
Nahas, Z., DeBrux, C., Chandler, V., Lorberbaum, J. P., Speer, A. M., Molloy, M. A.,et al. (2000). Lack of significant changes on magnetic resonance scans before and after2 weeks of daily left prefrontal repetitive transcranial magnetic stimulation for depres-sion. Journal of ECT, 16(4), 380�390.
Nitsche, M. A., Lampe, C., Antal, A., Liebetanz, D., Lang, N., Tergau, F., et al. (2006).Dopaminergic modulation of long-lasting direct current-induced cortical excitabilitychanges in the human motor cortex. European Journal of Neuroscience, 23(6),1651�1657.
Norena, A. J., & Eggermont, J. J. (2005). Enriched acoustic environment after noisetrauma reduces hearing loss and prevents cortical map reorganization. Journal ofNeuroscience, 25(3), 699�705.
Norena, A. J., & Eggermont, J. J. (2006). Enriched acoustic environment after noisetrauma abolishes neural signs of tinnitus. Neuroreport, 17(6), 559�563.
Norena, A., Micheyl, C., Chery-Croze, S., & Collet, L. (2002). Psychoacoustic character-ization of the tinnitus spectrum: Implications for the underlying mechanisms of tinni-tus. Audiology and Neurootology, 7(6), 358�369.
Otani, S., Blond, O., Desce, J. M., & Crepel, F. (1998). Dopamine facilitates long-termdepression of glutamatergic transmission in rat prefrontal cortex. Neuroscience, 85(3),669�676.
Pascual-Leone, A., Grafman, J., & Hallett, M. (1994). Modulation of cortical motor out-put maps during development of implicit and explicit knowledge. Science, 263(5151),1287�1289.
Plewnia, C., Bartels, M., & Gerloff, C. (2003). Transient suppression of tinnitus by tran-scranial magnetic stimulation. Annals of Neurology, 53(2), 263�266.
Plewnia, C., Reimold, M., Najib, A., Brehm, B., Reischl, G., Plontke, S. K., et al.(2007). Dose-dependent attenuation of auditory phantom perception (tinnitus) byPET-guided repetitive transcranial magnetic stimulation. Human Brain Mapping, 28(3),238�246.
316 Berthold Langguth and Dirk de Ridder

Plewnia, C., Reimold, M., Najib, A., Reischl, G., Plontke, S. K., & Gerloff, C. (2007).Moderate therapeutic efficacy of positron emission tomography-navigated repetitivetranscranial magnetic stimulation for chronic tinnitus: A randomised, controlled pilotstudy. Journal of Neurology, Neurosurgery and Psychiatry, 78(2), 152�156.
Poreisz, C., Paulus, W., Moser, T., & Lang, N. (2009). Does a single session of theta-bursttranscranial magnetic stimulation of inferior temporal cortex affect tinnitus percep-tion? BMC Neuroscience, 10, 54.
Post, A., & Keck, M. E. (2001). Transcranial magnetic stimulation as a therapeutic tool inpsychiatry: What do we know about the neurobiological mechanisms? Journal ofPsychiatric Research, 35(4), 193�215.
Price, D. D. (2000). Psychological and neural mechanisms of the affective dimension ofpain. Science, 288(5472), 1769�1772.
Ridding, M. C., & Rothwell, J. C. (1997). Stimulus/response curves as a method ofmeasuring motor cortical excitability in man. Electroencephalography Clinics ofNeurophysiology, 105(5), 340�344.
Rossi, S., De Capua, A., Ulivelli, M., Bartalini, S., Falzarano, V., Filippone, G., et al.(2007). Effects of repetitive transcranial magnetic stimulation on chronic tinnitus:A randomised, crossover, double blind, placebo controlled study. Journal of Neurology,Neurosurgery and Psychiatry, 78(8), 857�863.
Rossi, S., Hallett, M., Rossini, P. M., & Pascual-Leone, A. (2009). Safety, ethical consid-erations, and application guidelines for the use of transcranial magnetic stimulation inclinical practice and research. Clinical Neurophysiology, 120(12), 2008�2039.
Ryu, H., Yamamoto, S., Sugiyama, K., & Nozue, M. (1998). Neurovascular compressionsyndrome of the eighth cranial nerve. What are the most reliable diagnostic signs? ActaNeurochirurgica (Wien), 140(12), 1279�1286.
Schlee, W., Hartmann, T., Langguth, B., & Weisz, N. (2009). Abnormal resting-state cor-tical coupling in chronic tinnitus. BMC Neuroscience, 10, 11.
Schlee, W., Mueller, N., Hartmann, T., Keil, J., Lorenz, I., & Weisz, N. (2009). Mappingcortical hubs in tinnitus. BMC Biology, 7, 80.
Schlee, W., Weisz, N., Bertrand, O., Hartmann, T., & Elbert, T. (2008). Using auditorysteady state responses to outline the functional connectivity in the tinnitus brain. PLoSONE, 3(11), e3720.
Seidman, M. D., Ridder, D. D., Elisevich, K., Bowyer, S. M., Darrat, I., Dria, J., et al.(2008). Direct electrical stimulation of Heschl’s gyrus for tinnitus treatment.Laryngoscope, 118(3), 491�500.
Seki, S., & Eggermont, J. J. (2003). Changes in spontaneous firing rate and neural syn-chrony in cat primary auditory cortex after localized tone-induced hearing loss.Hearing Research, 180(1-2), 28�38.
Shi, Y., Burchiel, K. J., Anderson, V. C., & Martin, W. H. (2009). Deep brain stimulationeffects in patients with tinnitus. Otolaryngology Head and Neck Surgery, 141(2),285�287.
Simons, W., & Dierick, M. (2005). Transcranial magnetic stimulation as a therapeutic toolin psychiatry. World Journal of Biology and Psychiatry, 6(1), 6�25.
Smith, J. A., Mennemeier, M., Bartel, T., Chelette, K. C., Kimbrell, T., Triggs, W., et al.(2007). Repetitive transcranial magnetic stimulation for tinnitus: A pilot study.Laryngoscope, 117(3), 529�534.
Smits, M., Kovacs, S., de Ridder, D., Peeters, R. R., van Hecke, P., & Sunaert, S.(2007). Lateralization of functional magnetic resonance imaging (fMRI) activationin the auditory pathway of patients with lateralized tinnitus. Neuroradiology, 49(8),669�679.
Soussi, T., & Otto, S. R. (1994). Effects of electrical brainstem stimulation on tinnitus.Acta Oto-Laryngologica, 114(2), 135�140.
317Transcranial Magnetic Stimulation for Tinnitus

Speer, A. M., Repella, J. D., Figueras, S., Demian, N. K., Kimbrell, T. A., Wasserman, E.M., et al. (2001). Lack of adverse cognitive effects of 1 Hz and 20 Hz repetitive tran-scranial magnetic stimulation at 100% of motor threshold over left prefrontal cortex indepression. J ECT, 17(4), 259�263.
Terney, D., Bergmann, I., Poreisz, C., Chaieb, L., Boros, K., Nitsche, M. A., et al. (2008).Pergolide increases the efficacy of cathodal direct current stimulation to reduce theamplitude of laser-evoked potentials in humans. Journal of Pain Symptom Management,36(1), 79�91.
Van de Heyning, P., Vermeire, K., Diebl, M., Nopp, P., Anderson, I., & De Ridder, D.(2008). Incapacitating unilateral tinnitus in single-sided deafness treated by cochlearimplantation. Annals of Otology, Rhinology and Laryngology, 117(9), 645�652.
van der Loo, E., Gais, S., Congedo, M., Vanneste, S., Plazier, M., Menovsky, T., et al.(2009). Tinnitus intensity dependent gamma oscillations of the contralateral auditorycortex. PLoS ONE, 4(10), e7396: 7391-7395.
Vanneste, S., Plazier, M., Ost, J., van der Loo, E., Van de Heyning, P., & De Ridder, D.(2010). Bilateral dorsolateral prefrontal cortex modulation for tinnitus by transcranialdirect current stimulation: A preliminary clinical study. Experimental Brain Research,204(2), 283�287.
von Leupoldt, A., Sommer, T., Kegat, S., Baumann, H. J., Klose, H., Dahme, B., et al.(2009). Dyspnea and pain share emotion-related brain network. Neuroimage, 48(1),200�206.
Walsh, V., & Rushworth, M. (1999). A primer of magnetic stimulation as a tool for neuro-psychology. Neuropsychologia, 37(2), 125�135.
Wang, H., Wang, X., & Scheich, H. (1996). LTD and LTP induced by transcranial mag-netic stimulation in auditory cortex. Neuroreport, 7(2), 521�525.
Wassermann, E. M. (1998). Risk and safety of repetitive transcranial magnetic stimulation:Report and suggested guidelines from the International Workshop on the Safetyof Repetitive Transcranial Magnetic Stimulation. Electroencephalography and ClinicalNeurophysiology, 108(1), 1�16.
Weisz, N., Muller, S., Schlee, W., Dohrmann, K., Hartmann, T., & Elbert, T. (2007).The neural code of auditory phantom perception. Journal of Neuroscience, 27(6),1479�1484.
318 Berthold Langguth and Dirk de Ridder

CHAPTER1212Neurophysiological Effects ofTranscranial Direct CurrentStimulationJay S. Reidler1, Soroush Zaghi1,2, and Felipe Fregni1,21Laboratory of Neuromodulation, Spaulding Rehabilitation Hospital, Harvard Medical School, Boston,Massachusetts, USA2Berenson-Allen Center for Noninvasive Brain Stimulation, Beth Israel Deaconess Medical Center, HarvardMedical School, Boston, Massachusetts, USA
Contents
Introduction 319The Growing Field of Brain Stimulation 320Electrophysiology of tDCS 323
Historical Perspective 323TMS as a Tool for Measuring the Effects of tDCS 324Transcranial Delivery of Current 326Current Density 327Stimulation Duration 328Stimulation Polarity 329Stimulation Site 331Neurophysiological Effects of tDCS as Indexed by Cortical Excitability 332
Neurochemistry of tDCS 337Ion Channel Conductance and NMDA-Receptors 338Neurotransmitters Involved: GABA, Glutamate, and Dopamine 339Changes to Oxyhemoglobin Concentration 339Alterations to Membrane Phospholipids 340
Safety Considerations for tDCS 340Conclusions and Future Directions 341Acknowledgment 344References 344
INTRODUCTION
Transcranial direct current stimulation (tDCS) is a technique of brain
stimulation that has been increasingly investigated as a clinical tool for the
319Neurofeedback and Neuromodulation Techniques and ApplicationsDOI: 10.1016/B978-0-12-382235-2.00012-3
© 2011 Elsevier Inc.All rights reserved.

treatment of neuropsychiatric disorders. The growing interest in this
technique underscores the importance of elucidating its underlying
neurophysiology. Here we provide a review of research on the neurophys-
iological effects of tDCS. Studies from electrophysiology and transcranial
magnetic stimulation have shown that tDCS can modulate cortical-
excitability in a polarity-dependent fashion. Generally, anodal stimulation
increases cortical excitability, while cathodal stimulation decreases it.
Furthermore, these changes in cortical excitability are dependent on cur-
rent density and stimulation duration. tDCS has been shown to modulate
activity in both the motor and visual cortices, and more recently has been
shown to directly influence excitability of the spinal cord. Anodal tDCS
has been shown to increase intracortical facilitation and diminish intracor-
tical inhibition, while cathodal tDCS has been shown to have the reverse
effect. tDCS has also been shown to modulate transcallosal inhibition and
may be a promising tool for enhancing the effects of paired-associative
stimulation. Neuropharmacological studies suggest that the immediate
effects of tDCS are due to modulation of neuronal membrane potentials
at subthreshold levels, thus increasing or decreasing the rate of action
potential firing. Long-term effects, lasting for periods well beyond the
time of stimulation, likely involve NMDA-receptor dependent mechan-
isms. Future research should utilize alternative experimental techniques,
study the neurophysiology underlying the clinical effects of tDCS, investi-
gate improved tDCS technology and parameters of stimulation, and
examine whether the neurophysiological effects of tDCS vary in popula-
tions with neuropsychiatric conditions.
THE GROWING FIELD OF BRAIN STIMULATION
Applications of brain stimulation have been rapidly growing in the neuro-
logical sciences. Deep brain stimulation allows for the precise stimulation
of deep neural structures such as thalamic, subthalamic, and pallidal nuclei.
Such interventions are used clinically, for example, in the treatment of
advanced Parkinson’s disease, providing excellent results in controlling
dystonias and tremors (Limousin & Martinez-Torres, 2008) and holding
some promise for the treatment of mood disorders (Mayberg et al., 2005)
and obsessive�compulsive disorder (Lakhan & Callaway, 2010). At the
level of the cortex, electrodes placed in the epidural area above the motor
cortex are used for motor cortex stimulation, a clinical treatment shown to
assuage many forms of chronic neuropathic pain (Lima & Fregni, 2008).
320 Jay S. Reidler et al.

While these methods of brain stimulation have demonstrated remarkable
progress, one limitation is the need for surgical penetration of the skull
and brain, an expensive procedure that carries considerable risk.
Due to the downsides of surgical approaches, methods of neurofeed-
back and transcranial brain stimulation have become substantially more
appealing for their capacity to safely modulate brain activity in a manner
that is both more accessible and affordable. Neurofeedback is a method of
endogenous neuromodulation in which the subject responds to real-time
measurements of brain activity such as electroencephalography (Egner &
Sterman, 2006; Gevensleben et al., 2010). In recent years, two external
neuromodulatory techniques have been revisited that stimulate the human
brain through the intact scalp: transcranial magnetic stimulation (TMS)
and low-intensity transcranial electrical stimulation. Substantial research
has been devoted to TMS, a method of brain stimulation that involves
using a large, rapidly changing magnetic field to induce electrical stimulat-
ing currents in the brain. However, growing evidence suggests that
transcranial electrical stimulation, which has different mechanisms of
action, may also be a powerful and cost-effective approach to neuromodu-
lation (Priori, Hallett, & Rothwell, 2009; Zaghi, Heine, & Fregni, 2009).
Increased understanding of the neurophysiology underlying transcranial
direct current stimulation (tDCS), a form of low-intensity transcranial
electrical stimulation, has further stimulated research into clinical applica-
tions of this technology.
Among the various techniques of brain stimulation, tDCS stands
out as one of the simplest in design. tDCS involves the administration of
direct current through the scalp. A battery-powered current generator
capable of delivering small currents (usually less than 10 mA) is attached
to two sponge-based electrodes. The sponge electrodes are soaked, applied
over the hair to the scalp, and held in place by a non-conducting rubber
band affixed around the head. Current is injected through the scalp and
skull to change the membrane potentials of neurons in the underlying
cortex, resulting in real-time neurophysiological effects (see Figure 12.1).
Importantly, tDCS only modulates neuronal activity and does not actually
stimulate action potentials.
tDCS has been valuable in exploring the effects of cortical modulation
on various neural networks implicated in language (Floel, Rosser, Michka,
Knecht, & Breitenstein, 2008), sensory perception (Boggio, Zaghi,
Lopes, & Fregni, 2008), decision-making (Fecteau et al., 2007), memory
(Fregni, Boggio, Nitsche et al., 2005), and emotional pain (Boggio, Zaghi, &
321Neurophysiological Effects of Transcranial Direct Current Stimulation

Fregni, 2009), among other cognitive processes. tDCS has also been intro-
duced as an effective tool to alleviate chronic pain. Preliminary small sample-
size studies and case reports with tDCS have shown initial positive results in
modulating chronic pain in patients with terminal cancer (Silva et al., 2007),
fibromyalgia (Fregni, Gimenes et al., 2006), and traumatic spinal cord injury
(Fregni, Boggio, Lima et al., 2006). Recent studies suggest that tDCS may
also facilitate motor and working memory rehabilitation following stroke,
showing significant effects lasting two weeks (Boggio, Nunes et al., 2007;
Jo et al., 2009; Nowak, Grefkes, Ameli, & Fink, 2009). Additionally, tDCS
might be an interesting tool for modulating mood and other cognitive pro-
cesses such as craving in substance abuse (Boggio, Bermpohl et al., 2007;
Boggio, Sultani et al., 2008; Fregni et al., 2008). (For review of clinical appli-
cations of tDCS, see Zaghi, Acar, Hultgren, Boggio, & Fregni, 2010.)
Although these recent studies show encouraging results in the clinical
arena, it is critical that we understand the underlying neurophysiology of
tDCS so that we can optimize the parameters of stimulation and use of
this technique. The field of neurophysiology includes the study of nervous
system function with a scope that ranges from effects on membranes and
cells to systems and behavior. Here we provide an up-to-date review of
Figure 12.1 Transcranial direct current stimulation. In tDCS, two sponge-enclosedrubber electrodes are soaked in saline and applied to the scalp. Small wires attachthe electrodes to a battery-powered direct current (DC) generator. In series with theDC generator, there is an amperemeter, which allows the tDCS operator to alter theinternal resistance of the device with a dial to reach a target current ranging from0.5 mA to 2.0 mA. Stimulation diffuses through the scalp and skull, resulting in real-time neurophysiological effects.
322 Jay S. Reidler et al.

current research on the neurophysiological effects of tDCS and provide
directions for future research in the field.
ELECTROPHYSIOLOGY OF tDCS
Historical PerspectiveThe utilization of low-intensity electrical stimulation likely had its origins
in the eighteenth century, with studies of galvanic (i.e., direct) current
in animals and humans by Giovanni Aldini and Alexandro Volta
(Goldensohn, 1998; Priori, 2003). Yet because such stimulation induced
variable results, or sometimes none at all, the use of low-intensity direct
current was progressively abandoned in the first half of the 20th century
with the introduction of neuropsychiatric drugs and other forms of brain
stimulation such as electroconvulsive therapy (Priori, 2003), which involves
transcranial stimulation at substantially higher intensities (.500 mA).
At the turn of the millennium, increasing interest in TMS, which was
first developed in 1985 (Barker, Jalinous, & Freeston, 1985), revitalized
interest in other forms of transcranial brain stimulation such as tDCS. Using
TMS-induced motor evoked potentials as a marker of motor cortex excit-
ability, Nitsche and Paulus (2000) demonstrated the possibility of modulat-
ing cortical excitability with tDCS. They found that weak direct current
applied to the scalp was associated with excitability changes of up to 40%
that lasted several minutes to hours after the end of stimulation (Nitsche &
Paulus, 2000). Importantly, in this initial seminal study, they showed that
electrode montage was essential for determining the effects of tDCS. A
mathematical model then showed that while around half of the tDCS cur-
rent diffuses across the scalp, the current distribution penetrating the scalp
and skull is indeed sufficient to modify the transmembrane neuronal poten-
tial and influence the excitability of individual neurons without actually
eliciting an action potential (Miranda, Lomarev, & Hallett, 2006; Wagner,
Valero-Cabre, & Pascual-Leone, 2007). As our understanding of the neuro-
physiology of tDCS has improved over the past decade, we can now in
hindsight appreciate the mixed results produced in studies on the effects of
tDCS that took place in the mid-twentieth century (Murphy, Boggio, &
Fregni, 2009).
TMS is a method of neurostimulation and neuromodulation that has
been central to the investigation of the neurophysiological effects of tDCS,
as it provides a measure of cortical excitability. We therefore begin our dis-
cussion of the electrophysiology of tDCS with a brief discussion of TMS.
323Neurophysiological Effects of Transcranial Direct Current Stimulation

TMS as a Tool for Measuring the Effects of tDCSTMS was introduced about 25 years ago by Barker et al. (1985) who
showed that it is possible to activate the corticospinal tract by applying a
short-lasting magnetic field over the intact scalp in awake human subjects
(Barker et al., 1985). TMS is a technique of brain stimulation that uses
the principle of electromagnetic induction to induce currents in the brain.
A coil of copper wire encased in plastic is placed on the subject’s scalp
overlying the region of the brain to be stimulated. As current passes
through the coil, a magnetic field is generated in a plane perpendicular to
the coil. The current passed is strong but extremely brief, producing a
magnetic field that changes rapidly in time, reaching 2 Tesla in about 50
µs and decaying back to 0 Tesla in the same amount of time. For single
pulse stimulators, magnetic fields of 1-4 Tesla in strength and durations of
approximately 1 millisecond are typically used. The quickly changing
magnetic field penetrates the skin and skull of the subject unimpeded,
without causing discomfort, and induces a secondary electrical current in
the subject’s brain that is strong enough to depolarize cellular membranes
and induce neuronal activity (Fregni, Boggio, Valle et al., 2006; Zaghi
et al., 2009) (see Figure 12.2).
When TMS is applied to the motor cortex at suprathreshold intensity,
it generates electrical currents in the motor cortex, which are observed as
a contraction of muscles on the contralateral side of the body. TMS does
not activate corticospinal neurons directly, but instead activates interneur-
ons as demonstrated by research showing that TMS induces a cortico-
spinal volley with indirect waves rather than direct waves. It is possible
then to measure the latency and amplitude of the evoked potentials in
electromyographic (EMG) signal recordings from the muscles, referred to
as motor evoked potentials or MEPs as a measure of general corticospinal
excitability. Since MEPs measure cortical excitability at any given moment
in time, valuable information about the electrophysiology of the corti-
cospinal tract can be acquired using this method (Ilmoniemi et al., 1997;
Petersen, Pyndt, & Nielsen, 2003). Similarly, TMS can be employed to
evoke the perception of visual phosphenes (sensation of light due to a
stimulus other than light rays) when pulses are applied to the occipital
cortex.
TMS can be used to study other aspects of motor cortex function such
as intracortical facilitation and inhibition (ICF and ICI, respectively) and
bihemispheric interactions via transcallosal inhibition using paired pulse
324 Jay S. Reidler et al.

TMS. Paired-pulse stimulation involves administration of two consecutive
stimuli using the same coil for ICF and ICI, or two coils for transcallosal
inhibition. Additionally, when a TMS pulse is administered to the occipi-
tal cortex during the presentation of a visual stimulus, it is possible to
record changes in the waveform and topography of visual evoked poten-
tials (VEP) in electroencephalography (EEG) recordings. It is also possible
to measure cortical potentials induced by TMS using EEG (Miniussi &
Thut, 2010). This combination of TMS and high-resolution EEG pro-
vides a remarkably powerful tool for the assessment of corticocortical and
interhemispheric functional connections (Thut, Ives, Kampmann, Pastor, &
Pascual-Leone, 2005). Moreover, the mapping and localization of neuronal
responses to TMS stimulation of motor and visual cortices are substantially
affected by baseline cortical excitability, execution of neuropsychological
tasks, and medication use (Fregni, Boggio, Valle et al., 2006). Thus, TMS
Figure 12.2 Transcranial magnetic stimulation. In TMS, a coil of copper wire encasedin plastic is rested on the subject’s scalp overlying the area of the brain to be stimu-lated. As current is delivered through the coil, a magnetic field reaching 2 Tesla isgenerated in a plane perpendicular to the coil. This rapidly changing magnetic fieldpenetrates the skin and skull of the subject unimpeded and induces a secondaryelectrical current in the subject’s brain that is strong enough to depolarize cellularmembranes and induce neuronal activity.
325Neurophysiological Effects of Transcranial Direct Current Stimulation

can be used to study the electrophysiological properties of transcranial
direct current stimulation (Fregni, Boggio, Valle et al., 2006; Thut et al.,
2005).
Transcranial Delivery of CurrentThe first consideration in understanding the neurophysiology of tDCS is
to appreciate how currents applied with tDCS might affect neuronal
activity. That is, how does direct current applied at the scalp translate into
modulation of neuronal excitability? The central idea is that the current
applied at the scalp produces an extracellular voltage gradient at the level
of the cortex that alters the potential difference across neuronal mem-
branes. A step-by-step, detailed explanation follows.
In tDCS, two (or more) relatively large anode and cathode sponge-
enclosed rubber electrodes are applied to the scalp. The sponge electrodes
usually measure about 20�35 cm2 in area. Small wires attach the electro-
des to a battery-powered direct current (DC) generator. The DC genera-
tor can be powered with as little as two AA batteries (B3 volts) or a
single 9-volt battery. In series with the DC generator, there is an ampere-
meter, which allows the tDCS operator to alter the internal resistance of
the device with a dial to reach a target current. In tDCS, target currents
usually range from 0.5 mA to 2.0 mA.
The objective of tDCS is for low amplitude direct currents to pene-
trate the skull and enter the brain. However, because current will flow in
the path of least resistance, there is substantial shunting of current at the
scalp. In this context, the current density plays an important role in deter-
mining the extent to which the applied current actually penetrates the
skull to enter the brain.
By means of a magnetic resonance imaging (MRI)-derived finite ele-
ment model specific to tDCS, Wagner et al. (2007) tested various elec-
trode montages to analyze the role that tissue heterogeneity and
anatomical variations played on the final current density distribution along
the scalp and at the cortex (Wagner, Fregni et al., 2007). In one modeling
experiment, the electrode area was varied from 1 to 49 cm2 while main-
taining fixed electrode placement (anode over the right M1 and cathode
over the left supraorbital area) and non-variable constant current flow of
1 mA. Although the applied current densities (i.e. current intensity/elec-
trode size) ranged from 10 A/m2 (for the 1 cm2 electrode) to 0.21 A/m2
(for the 49 cm2 electrodes), the shunting (i.e., the flow of current along
326 Jay S. Reidler et al.

the scalp surface as opposed to the cortex) effects were considerably larger
for the 1 cm2 electrodes compared to the other montages. Current densi-
ties in the skin were as much as 86 times greater than those seen in the
cortex for the 1 cm2 electrodes compared to a factor of approximately 9
for the 49 cm2 electrodes. In other terms, 98.8% of the current was
shunted through the skin vs. the cortex with use of the small 1 cm2, but
only 89.5% of the current was shunted through the skin with use of the
larger 49 cm2 electrodes. This shows that roughly 1.2% of the 10 A/m2
(or 0.12 A/m2) and 10.5% of the 0.21 A/m2 current density (or 0.021 A/m2)
does penetrate to the level of the cortex with the use of small and large
electrodes, respectively. Essentially, greater shunting occurs with smaller
electrode areas, although a greater final cortical current density can be
achieved. According to the study, the maximum local cortical current
densities in this experiment ranged from 0.081 to 0.141 A/m2, which
were distributed in a non-linear fashion reflective of the relative hetero-
geneous anatomical and geometrical properties of the brain tissue. With
varying electrode placement and constant current source (1 mA/35 cm2
surface electrode area, or 0.29 A/m2), the maximum local cortical current
densities ranged from 0.077 to 0.20 A/m2, with current densities of oppo-
site polarity underlying the cathode and anode electrodes. Scalp current
densities ranged from 8.85 to 17.25 times larger in magnitude than the
cortical current densities (89.8% to 94.5% shunting rate).
The above discussion underscores the fact that low amplitude current
applied at the scalp can indeed penetrate to the level of the cortex. It is
important to keep in mind that this current flow is reflective of an electric
potential (or voltage gradient) which allows for the flow of ions between
the two electrodes. On a cellular level, the voltage gradient establishes
opposing polarities at either end of the neurons affected by the electric field.
This creates a difference in the transmembrane potential along the neuronal
membrane and so causes current to flow across the membrane and along the
inside of the neuron according to the resistances presented by properties of
the neuronal membrane and intracellular space (Jefferys, Deans, Bikson, &
Fox, 2003). This current flow modulates the neuronal membrane potential
and therefore results in changes to spontaneous neuronal activity.
Current DensityNeurons and other excitable cells produce two types of electrical poten-
tial. The first is a non-propagated local potential called an electrotonic
potential, which is due to a local change in ionic conductance (e.g.,
327Neurophysiological Effects of Transcranial Direct Current Stimulation

synaptic activity that engenders a local current). When it spreads along a
stretch of membrane, the electrotonic potential decrements to become
exponentially smaller. The second form of electric potential is a propa-
gated impulse called an action potential. Electrotonic potentials represent
changes to the neuron’s membrane potential that do not lead directly to
the generation of new current by action potentials. Neurons that are small
in relation to their length (such as some neurons in the brain) have only
electrotonic potentials; longer neurons utilize electrotonic potentials to
trigger the action potential.
This discussion becomes important as we continue to appreciate how
tDCS affects neuronal excitability. In contrast to TMS, which can both
induce action potentials (neurostimulation) and modulate neuronal activ-
ity by influencing electrotonic potentials (neuromodulation) or inducing
secondary synaptic changes, tDCS is strictly a neuromodulatory tech-
nique. tDCS does not induce action potentials because of limitations in
cortical current density. As a reference point, cortical current density
magnitudes are far lower than action potential thresholds: 0.079 to
0.20 A/m2 induced by tDCS as compared to 22 to 275 A/m2 required to
trigger an action potential (Tehovnik, 1996). Thus, the effects of tDCS
on cortical neurons are transmitted as electrotonic potentials only, which
spread along the neuron, altering the likelihood with which that neuron
may reach an action potential via temporal and spatial summation with
other electrotonic synaptic inputs. This underscores the point that the
magnitude of the current density has important implications in the neuro-
modulatory outcome of stimulation. Indeed, it has been shown that larger
current densities result in stronger effects of tDCS (Boggio et al., 2006;
Iyer et al., 2005; Nitsche & Paulus, 2000), while lower current densities
(less than 0.24 A/m2) for a few minutes do not induce any significant bio-
logical changes (Paulus, 2004).
Stimulation DurationInterestingly, depending on the duration of stimulation, the effects of
tDCS may outlast the stimulation period. In a study by Nitsche and Paulus
(2000), it was shown that a stimulus duration of at least 3 minutes at 1 mA
(35 cm2 surface electrode area, 0.29 A/m2) or an intensity of 0.6 mA
(35 cm2 surface electrode area, 0.17 A/m2) for 5 minutes could induce
measurable after-effects in cortical excitability (Nitsche & Paulus, 2000).
Using TMS-induced MEPs as a measure of cortical excitability, Nitsche
328 Jay S. Reidler et al.

and Paulus (2000) demonstrated a clear increase of MEP amplitude and
endurance of the effect with rising stimulus duration and intensity. Indeed,
the duration of stimulation plays a significant role in determining: (1) the
occurrence and (2) the duration of after-effects in humans and animals
(Bindman, Lippold, & Redfearn, 1964; Nitsche, Nitsche et al., 2003;
Nitsche & Paulus, 2000; Nitsche & Paulus, 2001). For example, whereas
5- and 7-minute tDCS results in after-effects lasting for no longer than
5 minutes, 9- to 13-minute tDCS results in after-effects lasting from 30 to
90 minutes, respectively (Nitsche & Paulus, 2001). Therefore, when we
discuss electrophysiological effects of tDCS it is important to distinguish
between: (1) immediate effects (e.g., anodal tDCS as excitatory, cathodal
tDCS as inhibitory); and (2) the after-effects of stimulation (e.g., facilita-
tion vs. inhibition of activity) as they may be related to different mechan-
isms of action (e.g., membrane vs. synaptic mechanisms).
While the above neurophysiological studies only examined variation
in duration of a single session of tDCS, behavioral evidence suggests that
repeating sessions of tDCS over several consecutive days can enhance the
effects of tDCS as well (Boggio, Nunes et al., 2007). Boggio et al. (2007)
examined improvement of motor performance in stroke patients follow-
ing four weekly sessions of tDCS and five consecutive daily sessions of
tDCS. In both experimental paradigms, they found significant motor
function improvement after either cathodal tDCS of the unaffected hemi-
sphere or anodal tDCS of the affected hemisphere when compared to
sham tDCS. Importantly, while they did not find a significant cumulative
effect associated with weekly sessions of tDCS, consecutive daily sessions
of tDCS were associated with significant improvement over time that was
sustained for 2 weeks after treatment. Future neurophysiological studies
should confirm whether the neuromodulatory effects of tDCS could
indeed be enhanced by consecutive daily sessions.
Stimulation PolarityDirect current appears to modulate spontaneous neuronal activity in a
polarity-dependent fashion. For example, anodal tDCS applied over the
motor cortex increases the excitability of the underlying motor cortex,
while cathodal tDCS applied over the same area decreases it (Nitsche &
Paulus, 2001; Wassermann & Grafman, 2005). Similarly, anodal tDCS
applied over the occipital cortex produces short-lasting increases in visual
cortex excitability (Antal, Kincses, Nitsche, & Paulus, 2003; Lang et al.,
329Neurophysiological Effects of Transcranial Direct Current Stimulation

2007). Purpura and McMurtry (1965) showed in an animal model
that upon anodal stimulation membranes are depolarized at a subthresh-
old level, whereas upon cathodal stimulation they are hyperpolarized
(Purpura & McMurtry, 1965). Hence, tDCS is believed to deliver its
effects by polarizing brain tissue, and while anodal stimulation generally
increases excitability and cathodal stimulation generally reduces excitabil-
ity, the direction of polarization depends strictly on the orientation of
axons and dendrites in the induced electric field.
In vitro experiments with slices of tissue from mammalian hippocam-
puses show that electric fields applied to brain tissue affect cellular proper-
ties in a predictable fashion (Jefferys et al., 2003). Specifically, the electric
fields hyperpolarize the ends of cells closest to the negative part of
the field (cathode), and depolarize the ends closest to the positive part
(anode). In the case of neurons, this change in excitability results from
alterations in the capacitance of the neuronal membrane. Indeed, changes
to the capacitance are induced by an accumulation of charges along the
conducting surface of the neuronal membrane due to the presence of the
applied electric field. As charge builds on the outer surface of the neuro-
nal membrane, charges of opposite polarity build up on the inner surface
of the neuronal membrane, and the charges are separated by the insulating
lipid bilayer. In this way, the neuronal membrane functions as an electric
capacitor (by storing and separating charges) creating an electric field that
in turn induces a directional capacitative current within the neuron. The
polarity-dependent storage of charges along the neuronal membrane and
the resulting current are at the heart of the depolarizing and hyperpolariz-
ing differences between anodal and cathodal tDCS.
How these changes in transmembrane potential are distributed depends
on the length, size, and geometry of the neuron, in addition to the
pattern of dendritic arborization and relative orientation of axons, den-
drites, and soma in the applied electric field. Although such properties of
the neurons vary widely across the nervous system, a recent experiment by
Radman et al. (2009) in rat cortical neurons suggests that the soma of layer
V pyramidal cells are individually most sensitive to polarization by opti-
mally oriented subthreshold fields. Moreover, Radman et al. (2009) also
reveal that cortical layer V/VI neurons had the lowest absolute action
potential thresholds. This suggests that while the electric field induced by
tDCS likely has sensitizing effects at the dendrites of neurons in all six cor-
tical layers (Radman, Datta, Ramos, Brumberg, & Bikson, 2009), it is
the soma of the neurons in layers V and VI that are most susceptible to the
330 Jay S. Reidler et al.

polarizing and excitability modulating effects of tDCS (Radman, Ramos,
Brumberg, & Bikson, 2009).
Importantly, anatomical changes due to pathology can significantly
alter the current distribution induced by tDCS. For instance, in subjects
with stroke, the affected cortical area is usually replaced by cerebrospinal
fluid, which has a high conductance, and current can accumulate on the
edges of cortical stroke lesions (Wagner, Fregni et al., 2007). Therefore, in
cases of pathologies that affect neuroanatomy, such as stroke or traumatic
brain injury, individual modeling might be recommended before tDCS
application.
Stimulation SiteThe location of the electrode placement in tDCS is critically important
because placement of the electrodes in different areas will result in distri-
bution of current density to those respective areas of the brain. Indeed,
imaging studies confirm that the polarizing effects of tDCS are generally
restricted to the area under the electrodes (Nitsche, Liebetanz et al., 2003;
Nitsche, Niehaus et al., 2004). Stimulation of motor cortex (M1), occipi-
tal cortex (V1), somatosensory cortices, and dorsolateral prefrontal cortex
all have been shown to deliver site-specific and differential effects on a
gamut of cognitive, behavioral, psychosomatic, and electrophysiological
tests (Zaghi et al., 2010). (It is worth noting that the position of the
reference electrode is as important as the stimulating electrode for induc-
ing the proper amount of current under the stimulating electrode.)
Additionally, some evidence suggests that tDCS can have highly focal
effects. In a study examining the combined effects of tDCS and peripheral
nerve stimulation, Uy and Ridding (2003) optimized (using TMS) the
site of tDCS for the first dorsal interosseous muscle and observed signifi-
cant excitability changes for this muscle, but not the nearby abductor digi-
ti minimi and flexor carpi ulnaris muscles (Uy & Ridding, 2003). A
recent modeling study, however, has suggested that electric current might
actually have its peak between the two electrodes (Datta et al., 2009).
While the polarizing effects of tDCS are generally confined to the areas
under and surrounding the electrodes, the functional effects appear to per-
petuate beyond the immediate site of stimulation. That is, tDCS induces dis-
tant effects that go beyond the direct application of current, likely via the
influence of a stimulated region on other neural networks. For example,
anodal tDCS of premotor cortex increases the excitability of the ipsilateral
331Neurophysiological Effects of Transcranial Direct Current Stimulation

motor cortex (Boros, Poreisz, Munchau, Paulus, & Nitsche, 2008), and
stimulation of the primary motor cortex has inhibitory effects on contralat-
eral motor areas (Vines, Cerruti, & Schlaug, 2008). This supports the notion
that tDCS has a functional effect not only on the underlying corticospinal
excitability but also on distant neural networks (Nitsche et al., 2005).
Indeed, fMRI studies reveal that although tDCS has the most activating
effect on the underlying cortex (Kwon et al., 2008), the stimulation pro-
vokes sustained and widespread changes in other regions of the brain as well
(Lang et al., 2005). EEG studies support these findings, showing that stimu-
lation of a particular area (e.g., frontal cortex) induces changes to oscillatory
activity that are synchronous throughout the brain (Ardolino, Bossi,
Barbieri, & Priori, 2005; Marshall, Molle, Hallschmid, & Born, 2004).
Hence, this evidence suggests that the effects of DC stimulation are
site-specific but not site-limited. That is, stimulation of one area will
likely have effects on other areas, most probably via networks of inter-
neuronal circuits (Lefaucheur, 2008). This phenomenon is not surprising
given the neuroanatomic complexity of the brain, but it raises interesting
questions as to: (1) how the effects are transmitted; and (2) whether the
observed clinical effects (e.g., pain alleviation) are mediated primarily
through the area of the cortex being stimulated or secondarily via activa-
tion or inhibition of other cortical or sub-cortical structures (Boggio,
Zaghi, & Fregni, 2009; Boggio, Zaghi, Lopes et al., 2008). For instance,
Roche et al. (2009) demonstrated that anodal tDCS of the motor cortex
modifies excitability at the level of the spinal cord by showing that tDCS
increases reflexive inhibition directed from the extensor carpi radialis to
flexor carpi radialis, which is mediated by inhibitory interneurons located
in the spinal cord (Roche, Lackmy, Achache, Bussel, & Katz, 2009).
Therefore, observed clinical effects from tDCS might be explained by
changes to several possible regions in the central nervous system (see
Table 12.1 for a summary of the effects of varying parameters of tDCS).
Neurophysiological Effects of tDCS as Indexed by CorticalExcitabilityJust as changes to motor evoked potentials and motor thresholds as meas-
ured by TMS provide insight into the excitability level of corticospinal
neurons, so too changes to intracortical inhibition (ICI) and intracortical
facilitation (ICF) as measured by TMS can provide helpful insight into
the effects of tDCS on cortical interneurons. First we discuss the measure-
ment of ICI and ICF, and then we describe the effect of tDCS on these
332 Jay S. Reidler et al.

Table 12.1 Varying parameters of tDCSParameter Standard range Effect
Electrode size 20 cm2�35 cm2 Smaller electrode size results in
greater final cortical current
density, but also greater shunting
to the scalp. Unipolar stimulation
can be achieved through a small
electrode by enlarging the area of
the other electrode
Current
intensity
1.0 mA�2.0 mA A current intensity of 0.6 mA is
necessary to observe after-effects.
Larger current intensity results in
greater amplitude of effect (as
measured by MEPs) and longer-
lasting effects
Current
density on
scalp
surface
24 µA/cm2�29 µA/cm2 Larger current densities result in
stronger effects of tDCS. Lower
current densities (less than
24 µA/cm2) for a few minutes do
not induce any significant effects.
(This is the ratio of current
intensity and electrode size)
Stimulation
duration
5 min�30 min Longer duration results in longer-
lasting effects. Whereas 5- and
7-minute tDCS results in after-
effects lasting for no longer than
5 minutes, tDCS from 9 to 13
minutes result in after-effects
lasting from 30 to 90 minutes,
respectively
Stimulation
polarity
Anodal or cathodal
(applied to cortical
region of interest)
Effect depends strictly on the
orientation of axons and
dendrites in the induced electrical
field. Generally, anodal tDCS
increases the excitability of the
underlying cortex by depolarizing
neuronal membranes to
subthreshold levels, while
cathodal tDCS applied over the
same area decreases it by
hyperpolarizing neuronal
membranes
(Continued)
333Neurophysiological Effects of Transcranial Direct Current Stimulation

measures. We then discuss the effects of tDCS on transcallosal inhibition,
cortical silent period, and paired-associative stimulation.
Intracortical Inhibition and FacilitationIntracortical inhibition and facilitation are measured using a particular
technique of TMS known as paired-pulse TMS. In this technique, the
TMS device is used to produce two back-to-back stimuli separated by a
range of inter-stimulus intervals (ISIs).
In the measurement of short interval intracortical inhibition (SICI), a
sub-threshold conditioning stimulus precedes a supra-threshold stimulus
by a short interval of 1 to 6 ms in time. Interestingly, the preceding condi-
tioning pulse suppresses the amplitude of the MEP induced by the supra-
threshold stimulus. In SICI, the subthreshold stimulus inhibits the effect
of the supra-threshold pulse by activating low-threshold GABAA-
dependent inhibitory circuits (via inhibitory post-synaptic potentials, or
IPSPs). In long interval intracortical inhibition (LICI), two TMS pulses
are delivered at supra-threshold intensities at intervals of 50�200 ms.
LICI is mediated by long-lasting GABAB-dependent IPSPs and activation
of pre-synaptic GABAB receptors on inhibitory interneurons, but this
measurement is not frequently used. In intracortical facilitation, the
amplitude of a test MEP can be enhanced if it is accompanied by a sub-
threshold conditioning pulse applied 10�25 ms earlier. Glutamatergic
Table 12.1 (Continued)Parameter Standard range Effect
Stimulation
site
M1, V1, somatosensory
cortex, dorsolateral
prefrontal cortex
Site-specific and differential effects
on a gamut of cognitive,
behavioral, psychosomatic, and
electrophysiological tests. While
the polarizing effects of tDCS are
generally confined to the areas
under the electrodes, the
functional effects appear to
perpetuate beyond the immediate
site of stimulation. Anodal tDCS
of the premotor cortex, for
instance, increases the excitability
of the ipsilateral motor cortex and
inhibition of the contralateral
motor areas
334 Jay S. Reidler et al.

interneurons at the level of M1 are likely to be involved in ICF since it is
reduced by NMDA antagonists such as dextromethorphan. ICF is
believed to result from the net facilitation of inhibitory and excitatory
mechanisms mediated by GABAA and NMDA receptors, respectively.
Nitsche et al. (2005) used paired-pulse TMS techniques to examine
the effects of tDCS on ICF, SICI, and LICI (Nitsche et al., 2005). They
employed a protocol that included ISIs of 2, 3, and 4 ms to examine
inhibitory effects and ISIs of 10 and 15 ms to examine facilitatory effects.
Using TMS-induced MEPs as a measure, they tested for intra-tDCS
excitability changes, short-lasting after-effects (5�10 minutes after stimu-
lation) and long-lasting after-effects (up to 35 minutes after stimulation).
With regard to intra-tDCS excitability changes, they found that anodal
tDCS did not induce cortical inhibition or facilitation, while cathodal
tDCS reduced facilitation. For the short-lasting after-effects, they found
that anodal tDCS reduced inhibition and enhanced facilitation, while
cathodal tDCS enhanced inhibition and reduced facilitation. Finally, for
the long-lasting after-effects anodal tDCS decreased inhibition for ISIs of
3 ms, while cathodal tDCS increased inhibition at ISIs of 2 ms and 5 ms.
Though for long-lasting effects the ISI of 15 ms condition did not show
modified facilitation, anodal tDCS increased facilitation at ISI of 10 ms,
while cathodal tDCS reduced facilitation.
These results suggest that intracortical inhibition and facilitation can
be modified by tDCS. For the short-lasting and long-lasting effects,
anodal tDCS can increase facilitation and decrease inhibition, while cath-
odal tDCS can produce the opposite effect. While intra-tDCS facilitatory
effects are not observed for anodal stimulation, they are decreased for
cathodal stimulation.
Transcallosal InhibitionIn transcallosal inhibition, the two motor cortices are stimulated with a
delay of 10 ms. The first pulse (the conditioning pulse) is applied over the
primary motor cortex and the second pulse (the test pulse) is applied after
a delay of 10 ms in the contralateral primary motor cortex. It has been
shown that the second pulse is associated with a significant inhibition in
the MEP characteristics.
Transcallosal inhibition induced by tDCS has been explored for
clinical use in rehabilitating motor function following stroke. Following
stroke, the brain compensates for motor loss by increasing activity in
the unaffected hemisphere and limb. Transcallosal inhibition from this
335Neurophysiological Effects of Transcranial Direct Current Stimulation

cortical region can decrease activity in the affected hemisphere. Fregni
et al. (2005) investigated whether reduction of activity in the unaffected
hemisphere by cathodal tDCS would result in improved motor perfor-
mance due to decreased transcallosal inhibition. Indeed, they found that
cathodal stimulation of the unaffected hemisphere, as well as anodal
stimulation of the affected hemisphere, significantly improved motor
performance compared to sham tDCS (Fregni, Boggio, Mansur et al.,
2005). In a recent study of healthy subjects, Williams, Pascual-Leone,
and Fregni (2010) combined bilateral motor cortex tDCS with contra-
lateral hand restraint of the dominant hand. When comparing active
stimulation to sham stimulation, they found a decrease in cortical excit-
ability in the dominant hemisphere and a decrease in transcallosal
inhibition from the dominant hemisphere to the non-dominant hemi-
sphere. The decrease in transcallosal inhibition correlated with motor
performance enhancement in the non-dominant hand (Williams et al.,
2010).
These findings therefore suggest that tDCS not only effects the proxi-
mal area of stimulation, but can have effects on more distal areas of the
brain, which may have substantial implications for clinical treatments such
as rehabilitation of motor function following stroke.
Cortical Silent PeriodAnother common phenomenon induced by transcranial stimulation that
has been used as a measure of intra-cortical inhibition is known as cortical
silent period (Hallett, 1995; Tergau et al., 1999). Similar to a refractory
period, cortical silent period refers to an inhibitory response observed
through electromyography following administration of TMS in which
there is a period following the stimulation of the motor cortex during
which a second stimulus would be ineffective. This period of depressed
activity appears to be important for maintaining motor control as well as
averting seizures. While cortical silent period has mainly been studied in
TMS research, we expect that future investigation of this phenomenon
following tDCS might yield comparable results due to the similar
neuromodulatory effects tDCS can have when compared to TMS.
Furthermore, evidence suggests that cortical silent period may also serve
as a tool to index GABA activity, and may therefore be useful in confirm-
ing whether cathodal tDCS inhibits cortical excitability via a GABA-
dependent pathway (McDonnell, Orekhov, & Ziemann, 2006; Ziemann,
Lonnecker, Steinhoff, & Paulus, 1996).
336 Jay S. Reidler et al.

Paired-Associative StimulationClassic theories of associative neuroplasticity predict that coactivation of
two synaptic inputs modifies synaptic strength, having strong implications
for learning processes. Paired-associative stimulation (PAS) has been pro-
posed as a technique to explore the mechanisms by which this occurs
(Classen et al., 2004). PAS refers to the administration of two stimuli at
once or in close proximity so as to lead the subject to associate them.
Wolters et al. (2003) showed that PAS increases or decreases motor cortical
excitability (as measured by MEPs) when the interval between peripheral
nerve stimulation and subsequent TMS pulse is 25 ms and 10 ms, respec-
tively. This PAS-induced plasticity appears to be NMDA-receptor depen-
dent and has been shown to influence motor learning (Stefan et al., 2006;
Wolters et al., 2003; Ziemann, Ilic, Pauli, Meintzschel, & Ruge, 2004).
Nitsche et al. (2007) explored whether tDCS-induced background
network activity changes effect PAS-induced plasticity. They hypothesized
according to homeostatic plasticity theory that the effect of PAS would be
enhanced with decreased background activity (Nitsche et al., 2007).
Administering the PAS protocol to 12 healthy subjects, Nitsche et al.
(2007) slowly stimulated the right ulnar nerve at the wrist at an intensity
300% above sensory threshold while a single TMS pulse was delivered
over the contralateral motor cortical region representing the right abduc-
tor digiti minimi muscle. This protocol was performed alone, following
anodal and cathodal tDCS, and simultaneously with anodal and cathodal
tDCS. When administered simultaneously with PAS, excitability-enhancing
(anodal) tDCS decreased the efficacy of PAS and excitability-diminishing
(cathodal) tDCS increased the efficacy of PAS. This same effect was
observed for prolonged administration of tDCS as well, but was not
observed when tDCS was administered before PAS. This suggests, in accor-
dance with theories of homeostatic plasticity, that tDCS has the potential
to modify the efficacy of PAS by modulating background activity in the
brain. For instance, decreased excitability of the cortex induced by cathodal
tDCS, when applied in combination with PAS, has the potential to increase
associative synaptic plasticity.
NEUROCHEMISTRY OF tDCS
As noted above, transcranial direct current results in polarity-specific changes
during and after application of tDCS. Whereas anodal stimulation depo-
larizes membrane potentials to subthreshold levels leading to increased
337Neurophysiological Effects of Transcranial Direct Current Stimulation

cortical excitability, cathodal stimulation hyperpolarizes membrane potentials
leading to increases in cortical inhibition. Effects on cortical excitability can
be immediate and short-lasting (up to 5 minutes following stimulation) and
they can also be longer lasting (up to 1 hour following stimulation). These
changes in cortical excitability are associated with changes of the underlying
cortical neuronal activity. But what do we know from a neurochemistry
standpoint about the effects of tDCS on neuronal activity?
Ion Channel Conductance and NMDA-ReceptorsSeveral pharmacological studies have examined the roles of various ion
channels and receptors in the modulation of cortical excitability by tDCS.
Liebetanz, Nitsche, Tergau, & Paulus (2002) found that administration of
the sodium channel blocker carbamazepine prior to tDCS eliminated the
excitatory effects of anodal stimulation. Furthermore, the N-methyl-D-
aspartate (NMDA)-receptor antagonist dextromethorphan eliminated the
long-lasting after-effects of both anodal and cathodal stimulation (Liebetanz
et al., 2002), suggesting that tDCS after-effects are associated with synaptic
effects. In a later pharmacological study in healthy human subjects, Nitsche,
Fricke et al. (2003) further examined the impact of carbamazepine, dextro-
methorphan, and the calcium channel blocker flunarizine on tDCS-elicited
motor cortical excitability changes. They found similar effects resulting
from blocking sodium channels and NMDA receptors, and further demon-
strated that blocking calcium channels led to elimination of the excitatory
effects of anodal stimulation (Nitsche, Fricke et al., 2003). Additionally,
D-cylcoserine, a partial NMDA agonist shown to improve cognitive func-
tions in humans, has also been found to prolong the cortical excitability
induced by anodal tDCS (Nitsche, Jaussi et al., 2004). Extending these find-
ings, a recent study using mouse M1 slices demonstrated that anodal tDCS
combined with repetitive low-frequency synaptic activation induces long-
term synaptic potentiation that is NMDA-receptor dependent and mediated
by secretion of brain-derived neurotrophic factor (BDNF) (Fritsch et al.,
2010). The combined results of these studies suggest that changes in cortical
excitability during tDCS depend on membrane polarization, which is
determined by the conductance of sodium and calcium channels.
Moreover, they suggest that NMDA-dependent mechanisms are central to
inducing the after-effects of tDCS. The above studies also suggest avenues
for prolonging the effects of tDCS on cortical excitability and plasticity
through the combination of tDCS with pharmacologic interventions.
338 Jay S. Reidler et al.

Neurotransmitters Involved: GABA, Glutamate, and DopamineWhile the above studies suggest that sodium and calcium channels are cen-
tral to the effects of tDCS, the evidence for the involvement of excitatory
neurotransmitters such as glutamate or inhibitory neurotransmitters such as
gamma-aminobutyric acid (GABA) is limited. In a magnetic resonance
(MR) spectroscopy study, Stagg et al. (2009) found that anodal tDCS is
related to decrease in GABA concentration and cathodal tDCS is related to
decrease in both glutamate and GABA (Stagg et al., 2009). This suggests
that tDCS affects activity of inhibitory interneurons, potentially explaining
the mechanism by which cortical excitability increases and decreases upon
stimulation. Nitsche et al. (2006) also found that dopaminergic mechanisms
may be involved in NMDA-induced after-effects, as D2 receptor blocking
by sulpiride eliminated the after-effects of cathodal tDCS, while enhance-
ment of the receptors using pergolide consolidated tDCS-generated
inhibition until the morning after stimulation (Nitsche et al., 2006).
Anodal tDCS has also been shown to manipulate cortical spreading
depression (CSD), which is influenced by changes in the concentrations of
ions and neurotransmitters that control cortical excitability like GABA and
glutamate. CSD, which is thought to underlie migraine aura, is a wave of
neuronal excitation followed by inhibition that spreads through the cortex
(at a rate of 2�5 mm/min) as a result of alterations in cortical ion homeo-
stasis. Using a rat model, Liebetanz et al. demonstrated that the propagation
velocity of CSD increases following the administration of anodal tDCS.
Cathodal and sham tDCS did not influence the CSD propagation velocity
(Liebetanz et al., 2006). Since anodal tDCS is known to increase cortical
excitability, this study supports the theory that CSD propagation velocity
reflects cortical excitability and suggests that anodal tDCS might increase
the likelihood of migraine attacks in migraine patients.
Changes to Oxyhemoglobin ConcentrationStudies of tDCS-induced cortical excitability have previously focused on
the motor cortex and visual cortex since the effects of stimulation in these
areas can be assessed by TMS motor evoked potentials and phosphene
thresholds. To examine the effects of tDCS on other areas in the brain such
as the prefrontal cortex, Merzagora et al. (2010) employed another tech-
nique called functional near-infrared spectroscopy (fNIRS), which allows
for a non-invasive and portable measure of regional cerebral blood flow
(rCBF) (Merzagora et al., 2010). fNIRS records cerebral concentrations of
339Neurophysiological Effects of Transcranial Direct Current Stimulation
oxyhemoglobin and deoxyhemoglobin by observing the absorption of
near-infrared light in particular regions of the brain and relating this to
rCBF. In a sham-controlled study, Merzagora et al. (2010) stimulated two
prefrontal locations for 10 minutes and found that oxyhemoglobin concen-
tration was significantly increased following anodal stimulation compared
to sham stimulation, suggesting that anodal stimulation increased rCBF in
the stimulated regions. fNIRS data showed that this effect lasted for 8�10
minutes following stimulation, and that cathodal stimulation only induced
a negligible effect on rCBF. This study potentially supports the use of
changes to oxyhemoglobin concentration via fNIRS as an additional
method for monitoring the neuromodulatory effects of tDCS.
Alterations to Membrane PhospholipidsFinally, one recent study suggests that tDCS may have some effects on
membrane phospholipid metabolism. Myoinositol is an essential com-
pound for the synthesis of inositol-containing phospholipids that has been
found to be altered in many physiological and pathological conditions.
Using proton magnetic resonance spectroscopy, Rango et al. (2008)
showed that the concentration of myoinositol was increased with anodal
tDCS of the right motor cortex compared to sham-tDCS (the effect was
not observed in a control visual cortical region) (Rango et al., 2008). This
study suggests that monitoring of the brain content of myoinositol may
serve to further monitor the effects of tDCS.
While much remains to be explored regarding the neurochemistry of
tDCS, studies to date have supported the understanding that tDCS exerts
its effects primarily by depolarizing or hyperpolarizing neuronal mem-
brane potentials, reinforcing these effects through NMDA-dependent
mechanisms and increasing cerebral blood flow to the stimulated region.
SAFETY CONSIDERATIONS FOR tDCS
Numerous studies verify that low-intensity transcranial stimulation is safe
for use in humans and that it is linked with only rare and relatively minor
adverse effects (Poreisz, Boros, Antal, & Paulus, 2007). tDCS does not
elevate the serum levels of molecular markers of neuronal injury such as
neuron-specific enolase (Nitsche & Paulus, 2001) or N-acetyl-aspartate
(Rango et al., 2008). Furthermore, both contrast-enhanced MRI and
EEG studies have found no pathological changes associated with appli-
cation of tDCS (Iyezr et al., 2005; Nitsche, Niehaus et al., 2004).
340 Jay S. Reidler et al.

Additionally, no instances of epileptic seizures caused by tDCS have been
observed in humans (Poreisz et al., 2007). In fact, pulsed transcranial stim-
ulation has been correlated with an antiepileptic effect in rats (Liebetanz
et al., 2006) and a previous tDCS study in patients with refractory
epilepsy did not show an increase in seizures or EEG-epileptiform dis-
charges (Fregni, Thome-Souza et al., 2006). The most common side
effects observed with tDCS are mild tingling (70.6%), moderate fatigue
(35.3%), sensations of light itching (30.4%), slight burning (21.6%), and
mild pain (15.7%) under the electrodes (Poreisz et al., 2007).
Less commonly, some subjects report headache (11.8%), trouble con-
centrating (10.8%), nausea (2.9%), and sleep disturbances (1.0%) (Poreisz
et al., 2007). Skin lesions in the form of burns following administration of
tDCS have been reported (Palm, 2008). Visual sensations associated with
turning the stimulation on or off have occurred in a small number of
cases, but this can be avoided by slowly changing the current level at the
start and end of stimulation. tDCS delivered at a level of 2 mA and
administered according to current stimulation guidelines (Nitsche, 2008)
has been shown to be safe for use in both healthy volunteers (Iyer et al.,
2005) and patients with neurological injury (Boggio, Nunes et al., 2007).
Using a rat model, researchers investigated the safety limits of extended
cathodal tDCS and found the charge density threshold to be two orders
of magnitude greater than the charge currently administered in humans
(Liebetanz et al., 2009). The safety of tDCS use in pregnant women and
children, however, has not yet been investigated.
CONCLUSIONS AND FUTURE DIRECTIONS
There is much left to be explored in understanding the neurophysiological
effects of tDCS. Studies from electrophysiology and TMS have shown
that tDCS can modulate cortical-excitability in a polarity-dependent fash-
ion. Generally, anodal stimulation increases cortical excitability, while
cathodal stimulation decreases it. Furthermore, these effects are dependent
on current density and stimulation duration. tDCS has been shown to
modulate activity in both the motor and visual cortices, and more
recently has been shown to directly influence excitability of the spinal
cord. Anodal tDCS has been shown to increase intracortical facilitation
and diminish intracortical inhibition, while cathodal tDCS has been
shown to have the reverse effect. Furthermore, tDCS appears to have sub-
stantial effects on transcallosal inhibition and may be a promising tool for
341Neurophysiological Effects of Transcranial Direct Current Stimulation

enhancing the effects of PAS. While the neurochemical mechanisms
underlying these effects are incompletely understood, neuropharmacology
studies suggest that immediate effects are due to modulation of neuronal
membrane potentials, thus increasing or decreasing the rate of action
potential firing. Long-term effects, lasting for minutes to hours beyond
the time of stimulation, likely involve NMDA-receptor dependent
mechanisms. It is critical that we integrate the results from these studies as
the neurophysiological effects and clinical applications of tDCS continue
to be explored.
Future studies should combine other brain imaging methods such as
functional magnetic resonance imaging (fMRI), positron emission tomog-
raphy (PET), electroencephalography (EEG) before, during, and follow-
ing the administration of tDCS. fMRI for instance has high spatial
resolution that can assist in more precisely examining regions of the brain.
PET can be utilized to monitor glucose or neurotransmitter uptake to
observe the neurochemical effects of tDCS. Awake animal models com-
bined with such imaging modalities might prove useful in probing the
physiological effects of tDCS. Furthermore, additional research into the
effects of tDCS on conditions such as chronic pain may shed light onto
the neurophysiological mechanisms underlying these effects (see Zaghi
et al., 2010, for recent review of the clinical applications of tDCS).
Precise and stable positioning of the tDCS device remains one limitation
of current tDCS research. Future engineering research should be targeted
at improving the stability, focality, and depth of stimulation that can be
administered by stimulation devices, as well as developing alternative stim-
ulation parameters (e.g., alternating current, simultaneous administration
of two tDCS devices), which would potentially enhance our ability to uti-
lize tDCS in future research and clinical practice (Miranda et al., 2006).
One interesting alternative that should be further explored is high-density
tDCS (HD-tDCS) using ring electrodes to produce a more focal stimula-
tion area (Datta et al., 2009). Finally, most research to date on the neuro-
physiological effects of tDCS has been conducted in healthy subjects,
though we have reason to suspect such effects may be altered in patients
with neuropsychiatric conditions who often exhibit differing baseline
brain activity (Fregni, Boggio, Valle et al., 2006; Siebner et al., 2004).
Future investigation should therefore examine whether the neurophysio-
logical effects of tDCS vary in populations with neuropsychiatric
conditions.
The key points from this chapter are summarized in Table 12.2.
342 Jay S. Reidler et al.

Table 12.2 Transcranial direct current stimulation: summary of key points
Growing interest in the clinical applications of tDCS underscores the importance
of elucidating the underlying neurophysiology of this brain stimulation
technique
Transcranial magnetic stimulation is a method of neurostimulation and
neuromodulation that has been central to the investigation of the
neurophysiological effects of tDCS
Low amplitude current applied at the scalp can penetrate to the level of the
cortex
Greater shunting to the scalp occurs with smaller electrode areas, although a
greater final cortical current density can be achieved
Because of limitations in cortical current density, tDCS does not induce action
potentials. The effects of tDCS on cortical neurons are transmitted as
electrotonic potentials only, which spread along the neuron, altering the
likelihood with which that neuron may reach an action potential
Larger current densities result in stronger effects of tDCS, while lower current
densities for short periods of time do not induce any significant changes
Greater tDCS duration and intensity lead to greater endurance of its effects
Direct current modulates the spontaneous neuronal activity in a polarity-
dependent fashion
Generally, anodal tDCS increases cortical excitability of the stimulated area,
while cathodal tDCS decreases cortical excitability
Soma of the neurons in layers V and VI are most susceptible to the modulating
effects of tDCS
Anodal tDCS of the motor cortex modifies excitability at the level of the spinal
cord
Although tDCS has the most activating effect on the underlying cortex, the
stimulation provokes sustained and widespread changes in other regions of the
brain as well as through intracortical inhibition and facilitation
tDCS affects transcallosal inhibition. Cathodal stimulation of the unaffected
hemisphere in stroke patients decreases transcallosal inhibition and significantly
improves performance of motor tasks controlled by the affected hemisphere
Transcranial magnetic stimulation can induce a short cortical silent period, or
refractory period, following stimulation. Future research should examine
whether tDCS produces similar effects
tDCS has the potential to modify the efficacy of paired-associative stimulation by
modulating background activity in the brain. For instance, decreased
excitability of the cortex induced by cathodal tDCS, when applied in
combination with paired-associative stimulation, has the potential to increase
associative synaptic plasticity
Changes to cortical excitability during tDCS depend on membrane polarization,
which is determined by the conductance of sodium and calcium channels.
After-effects of tDCS may be additionally dependent on NMDA-receptors
(Continued)
343Neurophysiological Effects of Transcranial Direct Current Stimulation

ACKNOWLEDGMENT
This publication was made possible with partial funding by grant number
R21 7R21DK081773 from the National Institute of Diabetes and
Digestive and Kidney Diseases (NIDDK) at the National Institutes of
Health. Its contents are solely the responsibility of the authors and do not
necessarily represent the official views of NIDDK.
REFERENCESAntal, A., Kincses, T. Z., Nitsche, M. A., & Paulus, W. (2003). Manipulation of phos-
phene thresholds by transcranial direct current stimulation in man. Experimental BrainResearch, 150(3), 375�378.
Ardolino, G., Bossi, B., Barbieri, S., & Priori, A. (2005). Non-synaptic mechanismsunderlie the after-effects of cathodal transcutaneous direct current stimulation of thehuman brain. Journal of Physiology, 568(Pt 2), 653�663.
Barker, A. T., Jalinous, R., & Freeston, I. L. (1985). Non-invasive magnetic stimulation ofhuman motor cortex. Lancet, 1(8437), 1106�1107.
Bindman, L. J., Lippold, O. C., & Redfearn, J. W. (1964). The action of brief polarizingcurrents on the cerebral cortex of the rat (1) during current flow and (2) in the pro-duction of long-lasting after-effects. Journal of Physiology, 172, 369�382.
Boggio, P. S., Bermpohl, F., Vergara, A. O., Muniz, A. L., Nahas, F. H., Leme, P. B., et al.(2007). Go-no-go task performance improvement after anodal transcranial DC
Table 12.2 (Continued)
Anodal stimulation is associated with decrease in GABA concentration and
cathodal tDCS is associated with decrease in both glutamate and GABA
Dopaminergic mechanisms may be involved in NMDA-induced after-effects
Oxyhemoglobin concentration significantly increases following anodal
stimulation compared to sham stimulation, suggesting that anodal stimulation
increases rCBF in the stimulated regions. The concentration of myoinositol
increases with anodal tDCS as well
Neurochemistry studies to date have served to reinforce the understanding that
tDCS exerts its effects primarily by depolarizing or hyperpolarizing neuronal
membrane potential, reinforcing these effects through NMDA-dependent
mechanisms and increasing cerebral blood flow to the stimulated region
Numerous studies verify that low-intensity transcranial stimulation is safe for use
in humans (but not pregnant women and children) and that it is linked with
only rare and relatively minor adverse effects
Future studies should examine the effects of tDCS using other imaging
modalities. Research should also aim to understand the mechanisms
underlying observed clinical effects, develop improved tDCS technologies and
alternative parameters for enhanced use in research and clinical practice, and
examine whether the neurophysiological effects of tDCS vary in populations
with neuropsychiatric conditions
344 Jay S. Reidler et al.
stimulation of the left dorsolateral prefrontal cortex in major depression. Journal ofAffective Disorders, 101(1�3), 91�98.
Boggio, P. S., Ferrucci, R., Rigonatti, S. P., Covre, P., Nitsche, M., Pascual-Leone, A.,et al. (2006). Effects of transcranial direct current stimulation on working memory inpatients with Parkinson’s disease. Journal of Neurological Sciences, 249(1), 31�38.
Boggio, P. S., Nunes, A., Rigonatti, S. P., Nitsche, M. A., Pascual-Leone, A., & Fregni, F.(2007). Repeated sessions of noninvasive brain DC stimulation is associated withmotor function improvement in stroke patients. Restorative Neurology and Neuroscience,25(2), 123�129.
Boggio, P. S., Sultani, N., Fecteau, S., Merabet, L., Mecca, T., Pascual-Leone, A., et al.(2008). Prefrontal cortex modulation using transcranial DC stimulation reduces alco-hol craving: a double-blind, sham-controlled study. Drug and Alcohol Dependency, 92(1�3), 55�60.
Boggio, P. S., Zaghi, S., & Fregni, F. (2009). Modulation of emotions associated withimages of human pain using anodal transcranial direct current stimulation (tDCS).Neuropsychologia, 47(1), 212�217.
Boggio, P. S., Zaghi, S., Lopes, M., & Fregni, F. (2008). Modulatory effects of anodal tran-scranial direct current stimulation on perception and pain thresholds in healthy volun-teers. European Journal of Neurology, 15(10), 1124�1130.
Boros, K., Poreisz, C., Munchau, A., Paulus, W., & Nitsche, M. A. (2008). Premotortranscranial direct current stimulation (tDCS) affects primary motor excitability inhumans. European Journal of Neuroscience, 27(5), 1292�1300.
Classen, J., Wolters, A., Stefan, K., Wycislo, M., Sandbrink, F., Schmidt, A., et al. (2004).Paired associative stimulation. Clinical Neurophysiology, 57(Suppl.), 563�569.
Datta, A., Bansal, V., Diaz, J., Patel, J., Reato, D., & Bikson, M. (2009). Gyri-precise headmodel of transcranial DC stimulation: Improved spatial focality using a ring electrodeversus conventional rectangular pad. Brain Stimulation, 2(4), 201�207.
Egner, T., & Sterman, M. B. (2006). Neurofeedback treatment of epilepsy: from basicrationale to practical application. Expert Reviews in Neurotherapy, 6(2), 247�257.
Fecteau, S., Pascual-Leone, A., Zald, D. H., Liguori, P., Theoret, H., Boggio, P. S., et al.(2007). Activation of prefrontal cortex by transcranial direct current stimulationreduces appetite for risk during ambiguous decision making. Journal of Neuroscience, 27(23), 6212�6218.
Floel, A., Rosser, N., Michka, O., Knecht, S., & Breitenstein, C. (2008). Noninvasivebrain stimulation improves language learning. Journal of Cognitive Neuroscience, 20(8),1415�1422.
Fregni, F., Boggio, P. S., Lima, M. C., Ferreira, M. J., Wagner, T., Rigonatti, S. P.,et al. (2006). A sham-controlled, phase II trial of transcranial direct current stim-ulation for the treatment of central pain in traumatic spinal cord injury. Pain, 122(1-2), 197�209.
Fregni, F., Boggio, P. S., Mansur, C. G., Wagner, T., Ferreira, M. J., Lima, M. C., et al.(2005). Transcranial direct current stimulation of the unaffected hemisphere in strokepatients. Neuroreport, 16(14), 1551�1555.
Fregni, F., Boggio, P. S., Nitsche, M., Bermpohl, F., Antal, A., Feredoes, E., et al. (2005).Anodal transcranial direct current stimulation of prefrontal cortex enhances workingmemory. Experimental Brain Research, 166(1), 23�30.
Fregni, F., Boggio, P. S., Valle, A. C., Otachi, P., Thut, G., Rigonatti, S. P., et al. (2006).Homeostatic effects of plasma valproate levels on corticospinal excitability changesinduced by 1Hz rTMS in patients with juvenile myoclonic epilepsy. ClinicalNeurophysiology, 117(6), 1217�1227.
Fregni, F., Gimenes, R., Valle, A. C., Ferreira, M. J., Rocha, R. R., Natalle, L., et al.(2006). A randomized, sham-controlled, proof of principle study of transcranial direct
345Neurophysiological Effects of Transcranial Direct Current Stimulation

current stimulation for the treatment of pain in fibromyalgia. Arthritis and Rheumatism,54(12), 3988�3998.
Fregni, F., Liguori, P., Fecteau, S., Nitsche, M. A., Pascual-Leone, A., & Boggio, P. S.(2008). Cortical stimulation of the prefrontal cortex with transcranial direct currentstimulation reduces cue-provoked smoking craving: a randomized, sham-controlledstudy. Journal of Clinical Psychiatry, 69(1), 32�40.
Fregni, F., Thome-Souza, S., Nitsche, M. A., Freedman, S. D., Valente, K. D., & Pascual-Leone, A. (2006). A controlled clinical trial of cathodal DC polarization in patientswith refractory epilepsy. Epilepsia, 47(2), 335�342.
Fritsch, B., Reis, J., Martinowich, K., Schambra, H. M., Ji, Y., Cohen, L. G., et al.(2010). Direct current stimulation promotes BDNF-dependent synaptic plasticity:potential implications for motor learning. Neuron, 66(2), 198�204.
Gevensleben, H., Holl, B., Albrecht, B., Schlamp, D., Kratz, O., Studer, P., et al. (2010).Neurofeedback training in children with ADHD: 6-month follow-up of a randomisedcontrolled trial. European Child and Adolescent Psychiatry (in press).
Goldensohn, E. S. (1998). Animal electricity from Bologna to Boston. Electroencephalographyand Clinical Neurophysiology, 106(2), 94�100.
Hallett, M. (1995). Transcranial magnetic stimulation. Negative effects. Advances inNeurology, 67, 107�113.
Ilmoniemi, R. J., Virtanen, J., Ruohonen, J., Karhu, J., Aronen, H. J., Naatanen, R.,et al. (1997). Neuronal responses to magnetic stimulation reveal cortical reactivity andconnectivity. Neuroreport, 8(16), 3537�3540.
Iyer, M. B., Mattu, U., Grafman, J., Lomarev, M., Sato, S., & Wassermann, E. M. (2005).Safety and cognitive effect of frontal DC brain polarization in healthy individuals.Neurology, 64(5), 872�875.
Jefferys, J. G., Deans, J., Bikson, M., & Fox, J. (2003). Effects of weak electric fields onthe activity of neurons and neuronal networks. Radiation Protection Dosimetry, 106(4),321�323.
Jo, J. M., Kim, Y. H., Ko, M. H., Ohn, S. H., Joen, B., & Lee, K. H. (2009). Enhancingthe working memory of stroke patients using tDCS. American Journal of PhysicalMedicine and Rehabilitation, 88(5), 404�409.
Kwon, Y. H., Ko, M. H., Ahn, S. H., Kim, Y. H., Song, J. C., Lee, C. H., et al. (2008).Primary motor cortex activation by transcranial direct current stimulation in thehuman brain. Neuroscience Letters, 435(1), 56�59.
Lakhan, S. E., & Callaway, E. (2010). Deep brain stimulation for obsessive-compulsive dis-order and treatment-resistant depression: systematic review. BMC Research Notes, 3, 60.
Lang, N., Siebner, H. R., Chadaide, Z., Boros, K., Nitsche, M. A., Rothwell, J. C., et al.(2007). Bidirectional modulation of primary visual cortex excitability: a combinedtDCS and rTMS study. Investigative Ophthalmology and Visual Science, 48(12),5782�5787.
Lang, N., Siebner, H. R., Ward, N. S., Lee, L., Nitsche, M. A., Paulus, W., et al. (2005).How does transcranial DC stimulation of the primary motor cortex alter regionalneuronal activity in the human brain? European Journal of Neuroscience, 22(2),495�504.
Lefaucheur, J. P. (2008). Principles of therapeutic use of transcranial and epidural corticalstimulation. Clinical Neurophysiology, 119(10), 2179�2184.
Liebetanz, D., Fregni, F., Monte-Silva, K. K., Oliveira, M. B., Amancio-dos-Santos, A.,Nitsche, M. A., et al. (2006). After-effects of transcranial direct current stimulation(tDCS) on cortical spreading depression. Neuroscience Letters, 398(1�2), 85�90.
Liebetanz, D., Koch, R., Mayenfels, S., Konig, F., Paulus, W., & Nitsche, M. A. (2009).Safety limits of cathodal transcranial direct current stimulation in rats. ClinicalNeurophysiology, 120(6), 1161�1167.
346 Jay S. Reidler et al.

Liebetanz, D., Nitsche, M. A., Tergau, F., & Paulus, W. (2002). Pharmacological approachto the mechanisms of transcranial DC-stimulation-induced after-effects of humanmotor cortex excitability. Brain, 125(Pt 10), 2238�2247.
Lima, M. C., & Fregni, F. (2008). Motor cortex stimulation for chronic pain: systematicreview and meta-analysis of the literature. Neurology, 70(24), 2329�2337.
Limousin, P., & Martinez-Torres, I. (2008). Deep brain stimulation for Parkinson’s disease.Neurotherapeutics, 5(2), 309�319.
Marshall, L., Molle, M., Hallschmid, M., & Born, J. (2004). Transcranial direct currentstimulation during sleep improves declarative memory. Journal of Neuroscience, 24(44),9985�9992.
Mayberg, H. S., Lozano, A. M., Voon, V., McNeely, H. E., Seminowicz, D., Hamani, C.,et al. (2005). Deep brain stimulation for treatment-resistant depression. Neuron, 45(5),651�660.
McDonnell, M. N., Orekhov, Y., & Ziemann, U. (2006). The role of GABA(B) receptorsin intracortical inhibition in the human motor cortex. Experimental Brain Research, 173(1), 86�93.
Merzagora, A. C., Foffani, G., Panyavin, I., Mordillo-Mateos, L., Aguilar, J., Onaral, B.,et al. (2010). Prefrontal hemodynamic changes produced by anodal direct currentstimulation. Neuroimage, 49(3), 2304�2310.
Miniussi, C., & Thut, G. (2010). Combining TMS and EEG offers new prospects in cog-nitive neuroscience. Brain Topography, 22(4), 249�256.
Miranda, P. C., Lomarev, M., & Hallett, M. (2006). Modeling the current distri-bution during transcranial direct current stimulation. Clinical Neurophysiology, 117(7),1623�1629.
Murphy, D. N., Boggio, P., & Fregni, F. (2009). Transcranial direct current stimulation asa therapeutic tool for the treatment of major depression: insights from past and recentclinical studies. Current Opinions in Psychiatry, 22(3), 306�311.
Nitsche, M. (2008). Transcranial direct current stimulation: State of the art 2008. BrainStimulation, 1(3), 206�223.
Nitsche, M. A., Fricke, K., Henschke, U., Schlitterlau, A., Liebetanz, D., Lang, N.,et al. (2003). Pharmacological modulation of cortical excitability shifts induced bytranscranial direct current stimulation in humans. Journal of Physiology, 553(Pt 1),293�301.
Nitsche, M. A., Jaussi, W., Liebetanz, D., Lang, N., Tergau, F., & Paulus, W. (2004).Consolidation of human motor cortical neuroplasticity by D-cycloserine.Neuropsychopharmacology, 29(8), 1573�1578.
Nitsche, M. A., Lampe, C., Antal, A., Liebetanz, D., Lang, N., Tergau, F., et al. (2006).Dopaminergic modulation of long-lasting direct current-induced cortical excita-bility changes in the human motor cortex. European Journal of Neuroscience, 23(6),1651�1657.
Nitsche, M. A., Liebetanz, D., Lang, N., Antal, A., Tergau, F., & Paulus, W. (2003). Safetycriteria for transcranial direct current stimulation (tDCS) in humans. ClinicalNeurophysiology, 114(11), 2220�2222, author reply 2222-2223.
Nitsche, M. A., Niehaus, L., Hoffmann, K. T., Hengst, S., Liebetanz, D., Paulus, W.,et al. (2004). MRI study of human brain exposed to weak direct current stimulationof the frontal cortex. Clinical Neurophysiology, 115(10), 2419�2423.
Nitsche, M. A., Nitsche, M. S., Klein, C. C., Tergau, F., Rothwell, J. C., & Paulus, W.(2003). Level of action of cathodal DC polarisation induced inhibition of the humanmotor cortex. Clinical Neurophysiology, 114(4), 600�604.
Nitsche, M. A., & Paulus, W. (2000). Excitability changes induced in the human motorcortex by weak transcranial direct current stimulation. Journal of Physiology, 527(Pt 3),633�639.
347Neurophysiological Effects of Transcranial Direct Current Stimulation

Nitsche, M. A., & Paulus, W. (2001). Sustained excitability elevations induced by transcra-nial DC motor cortex stimulation in humans. Neurology, 57(10), 1899�1901.
Nitsche, M. A., Roth, A., Kuo, M. F., Fischer, A. K., Liebetanz, D., Lang, N., et al.(2007). Timing-dependent modulation of associative plasticity by general networkexcitability in the human motor cortex. Journal of Neuroscience, 27(14), 3807�3812.
Nitsche, M. A., Seeber, A., Frommann, K., Klein, C. C., Rochford, C., Nitsche, M. S.,et al. (2005). Modulating parameters of excitability during and after transcranial directcurrent stimulation of the human motor cortex. Journal of Physiology, 568(Pt 1),291�303.
Nowak, D. A., Grefkes, C., Ameli, M., & Fink, G. R. (2009). Interhemispheric competi-tion after stroke: brain stimulation to enhance recovery of function of the affectedhand. Neurorehabilitation and Neural Repair, 23(7), 641�656.
Palm, U., Keeser, D., Schiller, C., Fintescu, Z., Reisinger, E., Padberg, F., & Nitsche, M.(2008). Skin lesions after treatment with transcranial direct current stimulation(tDCS). Brain Stimulation, 1, 386�387.
Paulus, W. (2004). Outlasting excitability shifts induced by direct current stimulation ofthe human brain. Clinical Neurophysiology, 57(Suppl), 708�714.
Petersen, N. T., Pyndt, H. S., & Nielsen, J. B. (2003). Investigating human motor controlby transcranial magnetic stimulation. Experimental Brain Research, 152(1), 1�16.
Poreisz, C., Boros, K., Antal, A., & Paulus, W. (2007). Safety aspects of transcranial directcurrent stimulation concerning healthy subjects and patients. Brain Research Bulletin,72(4�6), 208�214.
Priori, A. (2003). Brain polarization in humans: a reappraisal of an old tool for prolon-ged non-invasive modulation of brain excitability. Clinical Neurophysiology, 114(4),589�595.
Priori, A., Hallett, M., & Rothwell, J. C. (2009). Repetitive transcranial magnetic stimula-tion or transcranial direct current stimulation? Brain Stimulation, 2(4), 241�245.
Purpura, D. P., & McMurtry, J. G. (1965). Intracellular activities and evoked potentialchanges during polarization of motor cortex. Journal of Neurophysiology, 28, 166�185.
Radman, T., Datta, A., Ramos, R. L., Brumberg, J. C., & Bikson, M. (2009). One-dimensional representation of a neuron in a uniform electric field. ConferenceProceedings IEEE Engineering in Medicine and Biology Society, 2009, 6481�6484.
Radman, T., Ramos, R. L., Brumberg, J. C., & Bikson, M. (2009). Role of cortical celltype and morphology in sub- and suprathreshold uniform electric field stimulation.Brain Stimulation, 2(4), 215�228.
Rango, M., Cogiamanian, F., Marceglia, S., Barberis, B., Arighi, A., Biondetti, P., et al.(2008). Myoinositol content in the human brain is modified by transcranial direct cur-rent stimulation in a matter of minutes: A (1)H-MRS study. Magnetic Resonance inMedicine, 60(4), 782�789.
Roche, N., Lackmy, A., Achache, V., Bussel, B., & Katz, R. (2009). Impact of transcranialdirect current stimulation on spinal network excitability in humans. Journal ofPhysiology, 587(Pt, 23), 5653�5664.
Siebner, H. R., Lang, N., Rizzo, V., Nitsche, M. A., Paulus, W., Lemon, R. N., et al.(2004). Preconditioning of low-frequency repetitive transcranial magnetic stimulationwith transcranial direct current stimulation: evidence for homeostatic plasticity in thehuman motor cortex. Journal of Neuroscience, 24(13), 3379�3385.
Silva, G., Miksad, R., Freedman, S. D., Pascual-Leone, A., Jain, S., Gomes, D. L., et al.(2007). Treatment of cancer pain with noninvasive brain stimulation. Journal of PainSymptom Management, 34(4), 342�345.
Stagg, C. J., Best, J. G., Stephenson, M. C., O’Shea, J., Wylezinska, M., Kincses, Z. T.,et al. (2009). Polarity-sensitive modulation of cortical neurotransmitters by transcranialstimulation. Journal of Neuroscience, 29(16), 5202�5206.
348 Jay S. Reidler et al.

Stefan, K., Wycislo, M., Gentner, R., Schramm, A., Naumann, M., Reiners, K., et al.(2006). Temporary occlusion of associative motor cortical plasticity by prior dynamicmotor training. Cerebral Cortex, 16(3), 376�385.
Tehovnik, E. J. (1996). Electrical stimulation of neural tissue to evoke behavioralresponses. Journal of Neuroscience Methods, 65(1), 1�17.
Tergau, F., Wanschura, V., Canelo, M., Wischer, S., Wassermann, E. M., Ziemann, U.,et al. (1999). Complete suppression of voluntary motor drive during the silent periodafter transcranial magnetic stimulation. Experimental Brain Research, 124(4), 447�454.
Thut, G., Ives, J. R., Kampmann, F., Pastor, M. A., & Pascual-Leone, A. (2005). A newdevice and protocol for combining TMS and online recordings of EEG and evokedpotentials. Journal of Neuroscience Methods, 141(2), 207�217.
Uy, J., & Ridding, M. C. (2003). Increased cortical excitability induced by transcranialDC and peripheral nerve stimulation. Journal of Neuroscience Methods, 127(2),193�197.
Vines, B. W., Cerruti, C., & Schlaug, G. (2008). Dual-hemisphere tDCS facilitates greaterimprovements for healthy subjects’ non-dominant hand compared to uni-hemispherestimulation. BMC Neuroscience, 9(1), 103.
Wagner, T., Fregni, F., Fecteau, S., Grodzinsky, A., Zahn, M., & Pascual-Leone, A.(2007). Transcranial direct current stimulation: a computer-based human model study.Neuroimage, 35(3), 1113�1124.
Wagner, T., Valero-Cabre, A., & Pascual-Leone, A. (2007). Noninvasive human brainstimulation. Annual Review of Biomedical Engineering, 9, 527�565.
Wassermann, E. M., & Grafman, J. (2005). Recharging cognition with DC brain polariza-tion. Trends in Cognitive Science, 9(11), 503�505.
Williams, J. A., Pascual-Leone, A., & Fregni, F. (2010). Interhemispheric modulationinduced by cortical stimulation and motor training. Physical Therapy, 90(3), 398�410.
Wolters, A., Sandbrink, F., Schlottmann, A., Kunesch, E., Stefan, K., Cohen, L. G., et al.(2003). A temporally asymmetric Hebbian rule governing plasticity in the humanmotor cortex. Journal of Neurophysiology, 89(5), 2339�2345.
Zaghi, S., Acar, M., Hultgren, B., Boggio, P. S., & Fregni, F. (2010). Noninvasive brainstimulation with low-intensity electrical currents: putative mechanisms of action fordirect and alternating current stimulation. Neuroscientist, 16(3), 285�307.
Zaghi, S., Heine, N., & Fregni, F. (2009). Brain stimulation for the treatment of pain:A review of costs, clinical effects, and mechanisms of treatment for three different cen-tral neuromodulatory approaches. Journal of Pain Management, 2(3), 339�352.
Ziemann, U., Ilic, T. V., Pauli, C., Meintzschel, F., & Ruge, D. (2004). Learning modifiessubsequent induction of long-term potentiation-like and long-term depression-likeplasticity in human motor cortex. Journal of Neuroscience, 24(7), 1666�1672.
Ziemann, U., Lonnecker, S., Steinhoff, B. J., & Paulus, W. (1996). Effects of antiepilepticdrugs on motor cortex excitability in humans: a transcranial magnetic stimulationstudy. Annals of Neurology, 40(3), 367�378.
349Neurophysiological Effects of Transcranial Direct Current Stimulation

This page intentionally left blank

PARTFourFourMechanism of Changeand Long-TermConsolidation:Beginning Evidence

This page intentionally left blank

CHAPTER1313Functional NeuroimagingEvidence SupportingNeurofeedback in ADHDJohanne Lévesque1 and Mario Beauregard21Institut PsychoNeuro, Laval, Canada2Centre de Recherche en Neuropsychologie et Cognition (CERNEC), Departement de Psychologie,Universite de Montreal; Departement de Radiologie, Universite de Montreal; Centre de Recherche enSciences Neurologiques (CRSN), Universite de Montreal, and Centre de Recherche du Centre Hospitalier del’Universite de Montreal (CRCHUM), Canada
Contents
Introduction 353Biological Basis of ADHD 354
Neurogenetics 354Brain Abnormalities 358
Impact of Neurofeedback Training on the Neural Substrates of SelectiveAttention and Response Inhibition in Children with ADHD 361Putative Neural Mechanisms Underlying the Effects of Neurofeedback in ADHD 366Conclusion 368References 369
INTRODUCTION
Attention deficit hyperactivity disorder (ADHD) was first described more
than a century ago under the name “hyperkinesis disorder in childhood”
(Still, 1902). In the 1960s the National Institutes of Health adopted the
term “minimal brain dysfunction” to describe this disorder. Following
this renaming, the focus on “attention” led to the analysis of the brain
localization of attention deficits (Barkley, 1997; Mattes, 1980). This effort
was supported by new conceptualizations in the neurobiological bases of
attentional processes (Heilman, Pandya, & Geschwind, 1970; Heilman,
Watson, Bower, & Valenstein, 1983; Mesulam, 1990; Posner & Petersen,
1990). Based on these new insights, a large number of studies were per-
formed over the last decades to circumscribe the brain basis of ADHD.
353Neurofeedback and Neuromodulation Techniques and ApplicationsDOI: 10.1016/B978-0-12-382235-2.00013-5
© 2011 Elsevier Inc.All rights reserved.

ADHD is a frequent neurodevelopmental disorder of childhood,
which affects 3�7% of children worldwide, and frequently continues into
adulthood (Barkley, 1996). This disorder negatively affects academic per-
formance in childhood and leads to increased risk for antisocial disorders
and drug abuse in adulthood (Mannuzza, Klein, Bessler, Malloy, & Hynes,
1997). The ADHD syndrome is mainly characterized by deficits in selec-
tive attention and response inhibition (Barkley, 1997). These symptoms
reflect impairments in executive functions. The latter functions refer to
the dynamic regulatory capacities for the initiation and maintenance of
efficient attainment of goals (Lezak, 1990), as well as the inhibition of
behavioral responses that are inappropriate in the current context
(Shallice, 1988). This type of behavioral regulation is essential to success-
fully adapt one’s behavior to changing environmental demands. Executive
functions are closely related to prefrontal and striatal brain systems
(Godefroy, Lhullier, & Rousseaux, 1996; Leimkuhler & Mesulam, 1985;
Smith & Jonides, 1999). Of special importance and relevance to this chap-
ter, there is mounting evidence indicating that neurofeedback may be effi-
cacious in treating individuals with ADHD.
Aetiologically and clinically, ADHD is more a heterogeneous than a
homogenous syndrome. This has led to the idea that this disorder can be
caused by a multitude of factors (Steinhausen, 2009). In keeping with this
idea, a variety of factors have been proposed to explain the different
aspects of this neurobiological disorder. In the second section of this chap-
ter we cover these factors, which include genes and brain abnormalities
(measured with various neuroimaging techniques). In the following sec-
tion we review the functional neuroimaging findings supporting the view
that neurofeedback can significantly improve cognitive and executive
functions in ADHD individuals. In the fourth section we discuss putative
neural mechanisms underlying the effects of neurofeedback in ADHD.
Finally, in the last section, we provide a few concluding remarks and pro-
pose new opportunities for expanding the neuroscientific study of the
effects of neurofeedback in individuals with ADHD.
BIOLOGICAL BASIS OF ADHD
NeurogeneticsOver the past decades considerable progress has been made in understand-
ing the aetiology of ADHD because of the publication of several twin
studies. These twin studies are consistent in advocating large genetic
354 Johanne Lévesque and Mario Beauregard

influences (i.e., heritability ranging from 60% to 90%), non-shared envi-
ronmental influences that are small-to-moderate in magnitude (i.e., rang-
ing from 10% to 40%), and little-to-no shared environmental influences
(Waldman & Gizer, 2006). A polygenic transmission model seems likely
(Faraone & Doyle 2001; Morrison & Stewart 1974). Still, the genetic
architecture of ADHD is not currently clear. Indeed, it has proven diffi-
cult to identify the individual genes contributing to the genetic variance
of ADHD. Three approaches have been used in attempts to circumscribe
the genetic influences: hypothesis-driven candidate gene association stud-
ies, hypothesis-free genome-wide linkage analysis, and the genome-wide
association study methodology.
Candidate Gene Association MethodologyThe candidate gene association methodology is limited to hypothesis-
driven studies on candidate genes. Such an approach is largely condi-
tioned by the amount of existing knowledge regarding disease aetiology.
Since this knowledge is still limited for ADHD, candidate gene-based
studies are likely to miss at least part of the genetic variance. To date, such
studies cannot explain more than 3�5% of the total genetic components
of ADHD (Li, Sham, Owen, & He, 2006). These studies have mainly
concentrated on genes involved in catecholaminergic neurotransmission.
Genes associated with the dopaminergic system � in particular the D4
dopamine receptor gene (DRD4) and the human dopamine transporter
gene (DAT1/SLC6A3) � have been frequently investigated. The particu-
lar interest in this neurotransmission system comes from the effectiveness
of methylphenidate in treating ADHD symptoms (this psychostimulant
drug acts by blocking the dopamine transporter). The dopaminergic sys-
tem has also been investigated because of the association between ADHD,
executive functions, and fronto-striatal pathways (Swanson et al., 2007).
The DRD4 gene � encoding a receptor expressed primarily in the pre-
frontal cortex � is the strongest and most consistently replicated molecu-
lar genetics finding in ADHD. A meta-analysis of more than 30 studies
found that the DRD4 7-repeat (DRD4-7r) allele increases the risk for
ADHD, although this increase is only moderate with a pooled odds ratio
of 1.34 (Faraone, Doyle, Mick, & Biederman, 2001; Li et al., 2006).
According to Asghari and colleagues (1995), this allele seems to alter the
function of the encoded receptor by making it less sensitive to dopamine
than the alternative alleles. Despite mixed results across studies (for a
review, see Banaschewski, Becker, Scherag, Franke, & Coghill 2010), the
355Functional Neuroimaging Evidence Supporting Neurofeedback in ADHD

7-repeat allele might be associated with behavioral features rather than
cognitive deficits (Asghari et al., 1995). In fact, association of high reac-
tion time variability with the 7-repeat allele absence appears to be the
most consistent result and seems to be specific to ADHD (Kebir, Grizenk,
Sengupta, & Joober 2009). Regarding structural anatomical correlates,
Durston and colleagues (2005) suggested that variations in DRD4 influ-
ence prefrontal gray matter volume in a sample of subjects that included
individuals with ADHD as well as their unaffected siblings, and healthy
controls. Monuteaux and collaborators (2009) also reported findings in
adults with ADHD showing that 7-repeat allele carriers have a signifi-
cantly smaller mean volume in the superior frontal cortex and cerebellum
cortex when compared to subjects without this particular allele.
The dopamine transporter DAT1 is expressed primarily in the striatum
and the nucleus accumbens, and is a site of action of methylphenidate.
Consequently, the relationship between ADHD and variations in the
DAT1 gene has been largely investigated. A recent meta-analysis has
shown positive and negative associations between DAT1 and ADHD (Li
et al., 2006). Based on these contradictory findings, further studies of the
association of the DAT1 alleles and ADHD in large datasets are needed
before drawing any conclusion. Durston et al. (2005) reported that DAT1
variability seems to influence caudate nucleus volume. At the functional
level, the results of a neuroimaging study suggested that the DAT1 geno-
type affects activation in the striatum, and that the familial risk of ADHD
is related to this cerebral structure (Durston, Fossella, Mulder, Casey,
Ziermans et al., 2008).
Adrenergic neurotransmitter systems are hypothesized to mediate atten-
tional processes and certain dimensions of executive control (Arnsten,
2006). In this regard, there is growing evidence for involvement of genetic
variants of the adrenergic receptor alpha-2A gene (ADRA2A) in ADHD
(Anney et al., 2008; Cho et al., 2008; Deupree et al., 2006; Schmitz et al.,
2006; Wang et al., 2006). These variants seem to be more relevant for
inattentive than hyperactive/impulsive symptoms (Roman et al., 2002;
Schmitz et al., 2006). Cho et al. (2008) reported associations between var-
iants of the alpha-2C adrenergic receptor gene (ADRA2C) and ADHD in
their sample of Korean subjects while Guan and colleagues (2009) reported
an association of ADRA2C variants with ADHD combined type.
As for the serotoninergic system, serotonin dysregulation has been related
to impulsive behavior in children (Halperin et al., 1997). Consequently, this
neurotransmitter/neuromodulator has been hypothesized to be causally
356 Johanne Lévesque and Mario Beauregard

involved in ADHD (Oades et al. 2008) “knockout” gene studies in mice, in
which the behavioral effects of the deactivation of specific genes are exam-
ined, have further evidenced the potential implication of serotoninergic
genes (Gainetdinov et al., 1999). The main candidate genes studied within
the serotoninergic system are those coding for the serotonin transporter
(5-HTT/SLC6A4), the 1B and 2A serotonin receptors (HTR1B) and
(HTR2A), and the tryptophan hydroxylase (TPH2) genes. There are contra-
dictory findings for the potential association of the serotonin receptors with
ADHD. A meta-analysis supported an association between the HTR1B
gene and ADHD (Faraone et al., 2005). However, such an association was
not found in subsequent investigations (Brookes et al., 2006; Ickowicz et al.,
2007). Similarly, several groups have reported positive findings for HTR2A
(Guimaraes et al., 2007, Ribases et al., 2009), whilst others have failed to
find an association (Dorval et al., 2007; Romanos et al., 2008). In addition, a
meta-analysis has supported an association between ADHD and a 44-base-
pair insertion/deletion (5-HTTLPR) in the promoter region of the seroto-
nin transporter gene (5-HTT/SLC6A4). However, although there have
been further replications since this meta-analysis (Li, Kang, Zhang, Wang,
Zhou, et al., 2007; Kopeckova et al., 2008; Retz et al., 2008), several studies
have failed to replicate this finding (Brookes et al., 2006; Grevet et al., 2007;
Mick & Faraone, 2008; Wigg et al., 2006; Xu et al., 2008). Finally, Li and
colleagues (2003, 2006) have reported on ADHD associations for the trypto-
phan hydroxylase 2 gene (TPH2), which mediates the transformation of
tryptophan to 5-hydroxytryptophan, and these findings have been replicated
(Lasky-Su et al., 2008; Sheehan et al., 2005; Walitza et al., 2005).
Genome-Wide Linkage AnalysisGenome-wide, hypothesis-free linkage analysis has been performed in
ADHD using qualitative and quantitative definitions of the disease pheno-
type (Arcos-Burgos et al., 2004; Asherson et al., 2008; Bakker et al.,
2003; Hebebrand et al., 2006; Ogdie et al., 2006; Romanos et al., 2008;
Zhou, Dempfle et al., 2008), and recently also using ADHD endopheno-
types at the level of neuropsychological functioning (Doyle et al., 2008;
Rommelse et al., 2008). The linkage studies in ADHD have identified a
number of genetic loci potentially harbouring genes for ADHD, but very
little overlap was observed between studies, so far. However, a recent
meta-analysis of ADHD linkage studies confirmed one locus, on chromo-
some 16 (Zhou, Chen et al., 2008).
357Functional Neuroimaging Evidence Supporting Neurofeedback in ADHD

Genome-Wide Association Study MethodologyUsing the genome-wide association study methodology, it is now possible
to perform hypothesis-free analyses of the entire genome. Taken together,
results from the genome-wide association study performed in ADHD
have failed to show genome-wide significant association with ADHD
according to the thresholds currently used (Dudbridge & Gusnanto, 2008;
Peter, Yelensky, Altshuler, & Daly, 2008; van Steen & Lange, 2005).
Indeed, little overlap is observed between studies, except for the CDH13
gene (Lasky-Su et al., 2008; Lesch, Timmesfeld, Renner, Halperin, Roser
et al., 2008; Neale et al., 2008). Interestingly, this gene is thought to par-
ticipate in neuronal cell�cell communication during development and
maturation of the brain.
Brain AbnormalitiesStructural AnomaliesConsistent with the clinical picture of ADHD, anatomical magnetic res-
onance imaging (MRI) has identified abnormalities in brain regions playing
a key role in attention, behavioral inhibition or motor control (Seidman,
Valera & Makris, 2005; Valera, Faraone, Murray, & Seidman, 2007).
MRI investigations have reported that children with ADHD, com-
pared with non-ADHD children, show a slight reduction in total brain
volume (Castellanos et al., 2002), and that individuals with ADHD show
smaller prefrontal volumes (Aylward et al., 1996; Castellanos et al., 1994,
1996, 2001; Durston et al., 2004; Filipek et al., 1997; Garavan, Ross,
Murphy, Roche, & Stein, 2002; Hill et al., 2003; Kates et al., 2002;
Mataro, Garcia-Sanchez, Junque, Estevez-Gonzalez, & Pujol, 1997;
Mostofsky, Cooper, Kates, Denckla, & Kaufmann, 2002; Overmeyer
et al., 2001; Shaw et al., 2006; Sowell et al., 2003). Additionally, adults
with ADHD have a smaller anterior cingulate cortex (ACC) volume than
healthy controls (Duncan & Owen, 2000). About this cerebral structure,
two studies revealed volumetric decreases on the right ACC in treatment-
naıve children with ADHD relative to treated children with ADHD and
normal children (Pliszka et al., 2006; Semrud-Clikeman, Pliszka,
Lancaster, & Liotti, 2006). The ACC is thought to be centrally important
in cognition and motor control, and to be involved in processes underly-
ing the arousal/drive state of the organism (Dum & Strick, 1993; Paus,
2001). The dorsal part of the ACC (dACC) is known to play a role in
complex cognitive operations (Bush, Luu, & Posner, 2000) such as target
358 Johanne Lévesque and Mario Beauregard

detection, response selection, error detection, action monitoring and
reward-based decision-making (Bush et al., 2002; Carter et al., 1998,
2000; Gehring & Knight, 2000), all important aspects of executive func-
tions known to be impaired in children diagnosed with ADHD (Makris,
Biederman, Monuteaux, & Seidman, 2009).
A growing body of neuroimaging studies supports a role for the basal
ganglia in ADHD. Most investigations have demonstrated significantly
smaller total caudate or smaller caudate head, either on the left or right
side (Castellanos et al., 1994, 2002; Semrud-Clikeman et al., 1994). Studies
of children with ADHD have revealed that the globus pallidus is smaller on
the right (Castellanos et al., 1996; Overmeyer et al., 2001) or the left
(Aylward et al., 1996; Castellanos et al., 2001, 2002). Furthermore,
Castellanos et al. (2002) demonstrated that significant differences between
children with ADHD and controls in caudate volume attenuated by the
oldest age studied (19 years), thus showing a normalization of brain volume
over time. Bilateral caudate volumetric decrease has been shown in treat-
ment-naıve children with ADHD compared to treated children with
ADHD and controls (Semrud-Clikeman, Pliszka, Lancaster, & Liotti,
2006). Additionally, Seidman et al. (2006) demonstrated that the nucleus
accumbens is larger in adults with ADHD.
The cerebellum also has been demonstrated to be structurally altered in
ADHD. Cerebellar structural abnormalities can manifest with impairments
in executive functions since the cerebellum innervates frontal and parietal
association areas involved in higher cognitive processes (Timmann & Daum,
2007). Interestingly, volumetric reductions in lobules VIII, IX, and X of the
vermis have been noted in both ADHD boys (Berquin et al., 1998;
Castellanos et al., 1996; Mostofsky, Reiss, Lokhart, & Denck-La, 1998) and
girls (Castellanos et al., 2001; Hill et al., 2003). Bussing and colleagues
(2002) also found reductions in vermal lobules VI and VII. Furthermore,
Castellanos and collaborators (2002) found that once they adjusted for total
cerebral volume, only the cerebellar volume was smaller in 152 ADHD
adolescents compared to 139 matched control subjects. This measure also
correlated significantly and negatively with measures of attentional difficul-
ties. Durston et al. (2004) corroborated the finding of a smaller cerebellum
in a group of 30 ADHD children.
Volumetric differences have also been observed in the inferior parietal
lobule, a cortical region known to be associated with attentional processes.
Sowell and colleagues (2003) reported an increased size of cortex in the
inferior parietal lobule of children and adolescents with ADHD. On the
359Functional Neuroimaging Evidence Supporting Neurofeedback in ADHD

other hand, another study reported a decrease in cortical thickness of that
region in adults with ADHD (Makris et al., 2007). These results may
appear contradictory, but volume and cortical thickness are distinct mea-
sures and may not correlate with one another.
In other respects, there is some evidence from MRI structural investi-
gations that white matter abnormalities are present in children, adolescents
and adults with ADHD (Castellanos et al., 2002; Filipek et al., 1997;
Hynd, Semrud-Clikeman, Lorys, Novey & Eliopulos, 1990; Overmeyer
et al., 2001; Seidman et al., 2006). The studies involving ADHD children
and adolescents indicate a decrease in overall white matter volume
(Castellanos et al., 2002) whereas the studies conducted in adults with
ADHD reveal a tendency toward an overall increase in white matter vol-
ume (Seidman et al., 2006). It is noteworthy that these investigations,
instead of examining specific fiber pathways, considered the cerebral
white matter in its entirety.
To date there are only a few published MR studies that used diffusion
tensor imaging (DTI) in individuals with ADHD. In the first of these
studies, Ashtari et al. (2005) demonstrated that ADHD children had
decreased fractional anisotropy (FA, an index of white matter integrity) in
regions that have been implicated in the pathophysiology of ADHD, such
as the premotor cortex, striatum, cerebellum, and parieto-occipital areas.
These findings support the hypothesis that alterations in brain white mat-
ter integrity occur in ADHD. Decreased FA has also been reported in
ADHD children and adolescents in the anterior corona radiata, anterior
limb of the internal capsule, and superior region of the internal capsule
(Pavuluri et al., 2009). Reduced FA implies an impaired fiber density or
reduced myelination in these pathways. In adults with ADHD, decreased
FA has been found in fiber pathways such as the superior longitudinal fas-
cicle II and the cingulum bundle, both known to be affiliated with atten-
tion and executive functions (Makris et al., 2008).
Regional Brain DysfunctionDuring resting state, single photon emission computed tomography
(SPECT) and positron emission tomography (PET) studies carried out in
ADHD children, adolescents, or adults have shown decreased metabolism
in the striatum and various prefrontal areas involved in the control of
attentional processes (Amen & Carmichael, 1997; Kim, Lee, Shin, Cho, &
Lee, 2002; Lou, Henriksen, Bruhn, Borner, & Nielsen, 1989; Sieg,
Gaffney, Preston, & Hellings, 1995; Zametkin et al., 1990).
360 Johanne Lévesque and Mario Beauregard

Functional neuroimaging studies have demonstrated that differences in
cognitive control between individuals with and without ADHD are
related to differences in brain activation patterns (e.g., Bush et al., 1999;
Durston & Casey, 2006; Durston et al., 2003; Konrad et al., 2006; Rubia,
Overmeyer, Taylor, Brammer, Williams, et al., 1999; Vaidya et al., 1998).
These studies have shown reduced activation in prefrontal and striatal
regions during tasks that require subjects to inhibit prepotent tendencies
such as GO/NO-GO or Stroop paradigms (Booth et al., 2005; Bush
et al., 1999; Durston et al., 2003; Durston, Mulder, Casey, Ziermans, &
van Engeland, 2006; Konrad et al., 2006; Pliszka et al., 2006; Rubia
et al., 1999; Rubia, Smith, Brammer, Toone, & Tayler, 2005; Shafritz,
Marchione, Gore, Shaywitz, & Shaywitz, 2004; Schulz, Newcorn, Fan,
Tang, & Halperin 2005; Suskauer et al., 2008; Tamm, Menon, Ringel, &
Reiss, 2004; Vaidya et al., 1998). Other studies have used paradigms that
investigate other aspects of behavior, such as aspects of attention (Bush
et al., 2008; Konrad et al., 2006; Konrad, Neufang, Fink, & Herpertz-
Dahlmann, 2007; Stevens, Pearlson, & Kiehl, 2007; Tamm, Menon, &
Reiss, 2006), mental rotation paradigms (Silk et al., 2005) and motivated
behavior (Scheres, Miham, Knutson, & Castellanos, 2007; Strohle et al.,
2008). Again, deficits in striatal (Konrad et al., 2006; Scheres et al., 2007;
Shafritz et al., 2004; Silk et al., 2005; Strohle et al., 2008) and prefrontal
(Konrad et al., 2006; Silk et al., 2005) activation have been found, as well
as changes in activation in parietal areas (Konrad et al., 2006; Shafritz
et al., 2004; Silk et al., 2005; Stevens et al., 2007). These findings under-
score the importance of fronto-striatal networks in ADHD, as deficits in
these networks have been associated with various cognitive functions.
Additionally, a recent study using DTI has shown that reduced fronto-
striatal activation during a GO/NO-GO task was associated with reduced
white matter integrity in both children with ADHD and their affected
parents (Casey, Epstein, Buhle, Liston, Davidson, et al., 2007). These
findings suggest that disruption of fronto-striatal white matter tracts may
contribute to a familial form of the disorder.
IMPACT OF NEUROFEEDBACK TRAINING ON THE NEURALSUBSTRATES OF SELECTIVE ATTENTION AND RESPONSEINHIBITION IN CHILDREN WITH ADHD
The results of several clinical studies performed during the last three dec-
ades suggest that neurofeedback may be efficacious in treating individuals
361Functional Neuroimaging Evidence Supporting Neurofeedback in ADHD

with ADHD (Fuchs, Birbaumer, Lutzenberger, Gruzelier, & Kaiser, 2003;
Gevensleben et al., 2009; Kropotov et al., 2005; Linden, Habib, &
Radojevic, 1996; Lubar & Lubar, 1984; Lubar & Shouse, 1976; Lubar,
Swartwood, Swartwood, & O”Donnell, 1995; Monastra, Monastra, &
George, 2002; Rossiter, 2004; Rossiter & LaVaque, 1995; Shouse &
Lubar, 1979; Strehl, Leins, Goth, Klinger, Hinterberger, et al., 2006;
Tansey, 1984, 1985; Thompson & Thompson, 1998). In many of these
studies, the operant enhancement of sensorimotor rhythm (SMR)
(12�15 Hz) and/or beta 1 (15�20 Hz) EEG activity from the regions
overlying the Rolandic area, was trained concomitantly with suppression
of theta (4�7 Hz) activity. The basic assumption guiding this approach is
that SMR enhancement reduces problems of hyperactivity, whereas
increasing beta 1 activity and suppressing theta activity diminishes atten-
tion deficits (Lubar & Shouse, 1976). In line with this assumption, these
studies demonstrated that neurofeedback training (NFT) can significantly
reduce attention deficits and hyperactivity in children with ADHD.
Recently, we used fMRI to measure the effects of NFT � in ADHD
children � on the neural substrates of selective attention and response inhi-
bition (Beauregard & Levesque, 2006; Levesque, Beauregard, & Mensour,
et al., 2006). Brain activity was measured during a Counting Stroop task
(Experiment 1) and a GO/NO-GO task (Experiment 2). The Counting
Stroop task, which implicates selective attention and response inhibition,
exploits the conflict between a well-learned behavior (i.e., reading) and a
decision rule that requires this behavior to be inhibited. Converging evi-
dence from PETand fMRI indicate that the dorsal division of the ACC (or
ACcd, Brodmann area-BA-24bu-cu and 32u) plays an important role in the
various cognitive processes involved in the Stroop task (e.g., interference,
allocation of attentional resources, response selection) (Bush et al., 1998,
2000). In GO/NO-GO tasks, subjects are required to refrain from
responding to designated items within a series of stimuli. FMRI studies
have shown that several prefrontal areas (ACC, dorsolateral prefrontal cor-
tex, orbitofrontal cortex, ventrolateral prefrontal cortex) (Casey, Durston, &
Fossella, 2001; Garavan et al., 1999, 2002; Kiehl, Liddle, & Hopfinger,
2000; Liddle, Kiehl & Smith, 2001 Konishi, Nakajima, Uchida, Sekihara, &
Miyashita, 1998; Menon, Adleman, White, Glover, & Reiss, 2001; Rubia,
Smith, Brammer, & Taylor, 2003) and the striatum (Menon et al., 2001) are
crucially involved in response inhibition.
The study sample was composed of 20 ADHD children. These
ADHD children were randomly assigned to either an Experimental (EXP)
362 Johanne Lévesque and Mario Beauregard

group or a control (CON) group. Fifteen children diagnosed as ADHD
comprised the EXP group (4 girls and 11 boys, mean age: 10.2, range:
8�12) and five children also diagnosed as ADHD comprised the CON
group (5 boys, mean age: 10.2, range: 9�11). The EXP group received
NFT whereas the CON group received no treatment (the CON group
served specifically to measure the effect of passage of time). Subjects were
not taking any psychostimulant drug during the study (subjects in both
EXP and CON groups had been treated with methylphenidate before the
beginning of the study). Clinical assessment of the subjects included: (1)
psychiatric, medical, and neurologic evaluations by a board certified child
psychiatrist; (2) structured diagnostic interview with the Structured
Clinical Interview (Spitzer, Williams, Gibbon, & First, 1992) and an
ADHD symptom checklist from DSM-IV (1994). Neuropsychological
testing included the Digit Span subtest of the Wechsler Intelligence Scale
for Children�Revised (WISC�R) (Wechsler, 1981) to assess attention
span, and the Integrated Visual and Auditory Continuous Performance
Test (IVA) (Full Scale Attention Quotient and Full Scale Response
Control Quotient) to evaluate visual and auditory attention (Sandford &
Turner, 1995). The Conners Parent Rating Scale�Revised (CPRS�R),
was also used to obtain parental reports of subjects’ behavioral problems
regarding specifically inattention and hyperactivity (Conners et al., 1997).
The Digit Span, the IVA, and the CPRS-R were administered at
Time 1 (1 week before the beginning of the NFT) and Time 2 (1 week
after the end of the NFT). Before treatment the EXP and CON groups
did not differ cognitively or behaviourally in regard to these measures.
NFT was based on a protocol previously developed by Lubar and
Lubar (1984). It was conducted over a period of 131/2 weeks (40 ses-
sions, three training sessions per week). The training was divided into
two phases (20 sessions in each phase): in the first phase, subjects in
the EXP group were trained to enhance the amplitude of the SMR
(12�15 Hz) and decrease the amplitude of theta activity (4�7 Hz); in
the second phase, EXP subjects learned to inhibit the amplitude of
their theta waves (4�7 Hz) and increase the amplitude of their beta 1
waves (15�18 Hz). EEG was recorded from CZ, with reference placed
on the left earlobe and ground electrode on the right earlobe. The
pertinent frequencies were extracted from EEG recordings and fed
back using an audio-visual online feedback loop in the form of a video
game. Each session was subdivided into 2 min periods (that were grad-
ually increased up to 10 min). During the training sessions, subjects
363Functional Neuroimaging Evidence Supporting Neurofeedback in ADHD

were either attempting to maintain a state of relaxation, solve mathe-
matical problems or read texts.
The scores of the CON subjects on the three neuropsychological tests
were not significantly different at Time 2 than those at Time 1. For the
EXP group, however, the scores on the Digit Span (p , 0.05) and the
IVA (p , 0.005) significantly increased at Time 2, compared to Time 1.
Moreover, at Time 2 the scores on the Inattention (p , 0.0001) and
Hyperactivity (p , 0.05) components of the CPRS-R significantly
decreased relative to Time 1.
As for the Counting Stroop task (Experiment 1), at Time 1 the aver-
age accuracy scores (percentage of correct responses) were not statistically
different between the CON and EXP groups. At Time 2, the average
accuracy score of the CON subjects was comparable to that of Time 1.
For the EXP group, this score was significantly higher at Time 2 than
Time 1 (p , 0.05).
With respect to brain activation patterns in the CON group, at Time
1 the Counting Stroop task (Interference minus Neutral contrast) gener-
ated a significant locus of activation in the left superior parietal lobule
(Brodmann area [BA] 7) (p , 0.001). At Time 2, this contrast was associ-
ated with another locus of blood oxygenation level-dependent (BOLD)
activation in the left superior parietal lobule (BA 7) (p , 0.001). For the
EXP group, at Time 1 a significant locus of activation was noted in the
left superior parietal lobule (BA 7) (p , 0.001). At Time 2, significant
loci of activation were detected in the left superior parietal lobule (BA 7),
right ACcd (BA 32), left caudate nucleus, and left substantia nigra
(p , 0.001) (Figure 13.1).
In Experiment 2 (GO/NO-GO task), the average accuracy scores for
GO and NO-GO trials were not statistically different between both
groups of subjects at Time 1. For CON subjects, these scores were com-
parable at Time 1 and Time 2. For EXP subjects, however, the average
accuracy scores for GO (p , 0.05) and NO-GO trials (p , 0.0005) were
significantly higher at Time 2 than Time 1.
In regard to brain responses, at both Time 1 and Time 2 the GO/
NO-GO task (NO-GO minus GO contrast) did not produce any sig-
nificant locus of activation in CON subjects. As for the members of
the EXP group, the NO-GO minus GO contrast did not reveal any
significant locus of activation at Time 1. Nevertheless, at Time 2 sig-
nificant loci of activation were noted in these subjects in the right
ACcd (BA 24/32), right ventrolateral prefrontal cortex (BA 47), left
364 Johanne Lévesque and Mario Beauregard

thalamus, left caudate nucleus, and left substantia nigra (p , 0.001)
(Figure 13.2).
The post- vs. pre-treatment comparison of the average scores on the
Digit Span, the IVA, and the CPRS-R suggests that NFT led to a signifi-
cant decrease of inattention and hyperactivity in the EXP group.
Furthermore, this improvement was associated with better performance
on the Counting Stroop task and on the GO/NO-GO task. These find-
ings accord with those of previous studies showing that NFT can signifi-
cantly improve attention and response inhibition in ADHD children
(Fuchs et al., 2003; Kropotov et al., 2005; Linden et al., 1996; Lubar &
Lubar, 1984; Lubar & Shouse, 1976; Lubar et al., 1995; Monastra et al.,
2002; Rossiter, 2004; Rossiter & LaVaque, 1995; Shouse & Lubar, 1979;
Tansey, 1984, 1985; Thompson & Thompson, 1998). We posited that
these improvements were related to an enhancement, following NFT, of
neural activity in brain regions and networks involved in diverse atten-
tional processes (e.g., ACcd) and in suppression of inappropriate
Figure 13.1 (See Color Plate section) Statistical activation maps at Time 1 and Time 2produced by the Interference minus Neutral contrast. Images are sagittal sections forthe data averaged across subjects. At Time 1, significant loci of activation weredetected in the left superior parietal lobule for both the CON (a) and EXP (c) groups.At Time 2, activations were also noted in this cortical region for the CON (b) and EXP(f) groups. In addition, for the EXP group only, significant loci of activation weremeasured in the right ACcd (d), as well as the left caudate nucleus and left substantianigra (e). (Reproduced from Beauregard & Lévesque (2006) by permission of SpringerScience1 Business Media.)
365Functional Neuroimaging Evidence Supporting Neurofeedback in ADHD
Time 1 Time 2
(a)
(d)
4 3.53 2.5
Z score
2 1.51 0
(e) (f)
(b)
(c)
CON
EXP
X = –16 X = –12
X = –12 X = –23X = –3X = –36

behavioral responses (e.g., caudate nucleus, thalamus, ventrolateral pre-
frontal cortex) (Beauregard & Levesque, 2006; Levesque et al., 2006).
PUTATIVE NEURAL MECHANISMS UNDERLYING THEEFFECTS OF NEUROFEEDBACK IN ADHD
ADHD is currently hypothesized to originate from genetic and perinatal
environmental factors whose effects unfold across development. The
resulting pathophysiology is characterized by structural and functional
abnormalities in cortico-cortical and fronto-subcortical neural networks
presumably mediating attention, executive functions, and motor regula-
tion. Regarding this issue, Makris and colleagues (2009) proposed that
the attention network includes the cingulate gyrus, the lateral and medial
prefrontal cortices (middle and superior lateral frontal gyri), the lateral-
inferior parietal and temporo-occipito-parietal cortices (the inferior pari-
etal lobule including the angular and supramarginal gyri) and a few
thalamic nuclei (medial dorsal, reticular, and pulvinar). The main connect-
ing fiber pathways are three subcomponents of the superior longitudinal
fascicle (I, II, and III), the cingulum bundle, and the inferior longitudinal
fascicle. According to Makris et al. (2009), the executive functions net-
work involves prefrontal cortical and striatal areas, as well as cortical limbic
structures such as the ACC. The principal fiber tracts mediating the
Figure 13.2 (See Color Plate Section) Statistical activation maps measured at Time 2in the EXP group (NO-GO minus GO contrast). Significant loci of activation weremeasured in the right ACcd (a), left thalamus and left substantia nigra (b), left cau-date nucleus (c), and right ventrolateral prefrontal cortex (d). (Reproduced fromBeauregard & Lévesque (2006) by permission of Springer Science1 Business Media.)
366 Johanne Lévesque and Mario Beauregard
(a)
(d)
(b) (c)
X = –12X = –3X = 3
X = 21Z score
5 4 3 2 1 0

connections between these brain regions are the cingulum bundle and the
corticostriatal projections. As for motor regulation, Makris and colleagues
(2009) postulate that the network consists of parallel networks (cortico-
striatal, cortico-pallidal, fronto-cerebellar) mediating motor and cognitive
functions. In the cortico-striatal circuit, the caudate nucleus receives pro-
jections from the extrastriate, lateral parietal and lateral frontal areas, and
the temporal cortices. The cortico-pallidal projections are from premotor
cortex and from primary somatosensory and motor cortices. The fronto-
cerebellar circuit connects frontal cortical areas with the cerebellum. The
latter structure is topologically connected to distinct sensorimotor and
association regions by way of the pons via the feed-forward pathway, and
through the thalamus via the feedback pathway.
It is conceivable that the NFT administered in our study (Beauregard &
Levesque, 2006; Levesque et al., 2006) significantly improved activity in
the neural networks supporting attention, executive functions, and motor
regulation. In this study, subjects were trained to enhance the amplitude
of the SMR and Beta 1 activity. Lubar (1997) submitted that although
thalamic pacemakers generate different brain rhythms depending on which
cortical loops they activate, changes in cortical loops can modify the firing
rate of thalamic pacemakers and, hence, alter their intrinsic firing pattern.
In this view, the neurofeedback protocol used in our investigation might
have influenced central and frontal loops which, in turn, might have linked
dynamically through regional resonances to other brain regions including
the thalamus. Furthermore, it is likely that dopamine is critically affected
by this neurofeedback protocol.
Dopamine is known to exert a pivotal neuromodulatory effect in the
brain (Seamans & Yang, 2004). A wealth of evidence suggests that a dys-
function in dopaminergic transmission in fronto-striatal networks is impli-
cated in the pathophysiology of ADHD. First, ADHD symptoms can
be successfully treated with methylphenidate, a potent blocker of the
reuptake of dopamine which augments the availability of this neuromodu-
lator/neurotransmitter in the extraneuronal space (Dresel et al., 2000).
Second, molecular genetic data suggests an association between ADHD
and polymorphism of the dopamine transporter gene, as well as the dopa-
mine D4 receptor gene. Third, structural MRI studies of individuals with
ADHD have reported volumetric reductions in brain regions heavily
innervated by dopaminergic neurons (e.g., frontal lobes and striatum).
Fourth, SPECT and PET studies carried out in ADHD children, adoles-
cents or adults have found decreased metabolism in the same regions.
367Functional Neuroimaging Evidence Supporting Neurofeedback in ADHD

Fifth, as the nigrostriatal dopaminergic system is implicated in motor con-
trol whereas the mesocortical dopaminergic is involved in attention pro-
cesses (Nieoullon & Coquerel, 2003), it is probable that a hypofunction
of the dopaminergic pathways results in deficient attention, poor execu-
tive function, and impaired modulation of motor activity. Last, there are
also some data indicating that dopamine supports synaptic plasticity pro-
cesses such as long-term potentiation (Calabresi, Pisani, Mercuri, &
Bernardi, 1996). On this basis, we postulate that the neurofeedback proto-
col used in our study led to the neuromodulation by dopamine of neural
activity in fronto-striatal networks. Furthermore, given the association
between ADHD and polymorphism of the D4 receptor gene, we hypoth-
esize that this neuroplastic phenomenon implicated long-term potentia-
tion and D4 receptors.
CONCLUSION
The cognitive deficits that are the hallmarks of the ADHD syndrome
appear to result from dopaminergic dysregulation, as well as structural and
functional abnormalities in cortico-cortical and fronto-subcortical neural
networks mediating attention, executive functions, and motor regulation.
Our neuroimaging work in ADHD children suggests that NFT can
significantly improve cognitive function and neural activity in these
networks. We propose that a neuromodulatory action of dopamine is cen-
trally implicated in these improvements. SPECT and/or PET could be
used to test this hypothesis.
In recent years, a few structural MRI studies using morphometry have
shown that short periods of intensive learning (ranging from a few weeks
to a few months) can be associated with regional volume increases in the
gray matter (Ceccarelli et al., 2009; Draganski et al., 2006). The gray mat-
ter volume increases noted in these studies may be related to cellular
events such as sprouting of new synaptic connections and dendritic spine
growth. Other MRI studies using DTI demonstrated that learning can
also lead rapidly to microstructural white matter changes (i.e., increased
FA) (Johansen-Berg, 2007). These changes may reflect increased axon cal-
iber and myelination. In this context, morphometry and DTI could be
utilized to verify if a few months of neurofeedback training can lead to
grey matter and white matter changes in ADHD individuals. PET could
also be used to measure the impact of neurofeedback on various neuro-
transmitters, including dopamine.
368 Johanne Lévesque and Mario Beauregard

REFERENCESAmen, D. G., & Carmichael, B. D. (1997). High-resolution brain SPECT imaging in
ADHD. Annals of Clinical Psychiatry, 9, 81�86.Anney, R. J., Hawi, Z., Sheehan, K., Mulligan, A., Pinto, C., Brookes, K. J., et al.
(2008). Parent of origin effects in attention/deficit hyperactivity disorder (ADHD):Analysis of data from the international multicenter ADHD genetics (IMAGE) pro-gram. American Journal of Medical Genetics B Neuropsychiatry and Genetics, 147B,1495�1500.
Arcos-Burgos, M., Castellanos, F. X., Pineda, D., Lopera, F., Palacio, J. D., Palacio, L. G.,et al. (2004). Attention-deficit/hyperactivity disorder in a population isolate: Linkageto loci at 4q13.2, 5q33.3, 11q22, and 17p11. American Journal of Human Genetics, 75,998�1014.
Arnsten, A. F. (2006). Fundamentals of attention-deficit/hyperactivity disorder: Circuitsand pathways. Journal of Clinical Psychiatry, 67(Suppl 8), 7�12.
Asghari, V., Sanyal, S., Buchwaldt, S., Paterson, A., Jovanovic, V., & Van Tol, H. H.(1995). Modulation of intracellular cyclic AMP levels by different human dopamineD4 receptor variants. Journal of Neurochemistry, 65, 1157�1165.
Asherson, P., Zhou, K., Anney, R. J., Franke, B., Buitelaar, J., Ebstein, R., et al. (2008). Ahigh-density SNP linkage scan with 142 combined subtype ADHD sib pairs identifieslinkage regions on chromosomes 9 and 16. Molecular Psychiatry, 13, 514�521.
Ashtari, M., Kumra, S., Bhaskar, S. L., Clarke, T., Thaden, E., Cervellione, K. L., et al.(2005). Attention-deficit/hyperactivity disorder: a preliminary diffusion tensor imag-ing study. Biological Psychiatry, 57, 448�455.
Aylward, E. H., Reiss, A. L., Reader, M. J., Singer, H. S., Brown, J. E., & Denckla, M. B.(1996). Basal ganglia volumes in children with attention-deficit hyperactivity disorder.Journal of Child Neurology, 11, 112�115.
Bakker, S. C., van der Meulen, E. M., Buitelaar, J. K., Sandkuijl, L. A., Pauls, D. L.,Monsuur, A. J., et al. (2003). A whole-genome scan in 164 Dutch sib pairs with atten-tion-deficit/hyperactivity disorder: Suggestive evidence for linkage on chromosomes7p and 15q. American Journal of Human Genetics, 72, 1251�1260.
Banaschewski, T., Becker, K., Scherag, S., Franke, B., & Coghill., D. (2010). Moleculargenetics of attention-deficit/hyperactivity disorder: An overview. European Child andAdolescent Psychiatry, 19(3), 237�257.
Barkley, R. A. (1996). Attention Deficit Hyperactivity Disorder: A handbook for diagnosis andtreatment. New York: Guilford Press.
Barkley, R. A. (1997). Behavioral inhibition, sustained attention, and executive functions:Constructing a unifying theory of ADHD. Psychology Bulletin, 121, 65�94.
Beauregard, M., & Levesque, J. (2006). Functional magnetic resonance imaging investiga-tion of the effects of neurofeedback training on the neural bases of selective attentionand response inhibition in children with attention-deficit/hyperactivity disorder.Putative neural mechanisms underlying the effects of neurofeedback in ADHD.Applied Psychophysiology and Biofeedback, 31(1), 3�20.
Berquin, P. C., Giedd, J. N., Jacobsen, L. K., Hamburger, S. D., Krain, A. L., Rapoport,J. L., et al. (1998). Cerebellum in attention-deficit hyperactivity disorder: A morpho-metric MRI study. Neurology, 50, 1087�1093.
Booth, J. R., Burman, D. D., Meyer, J. R., Lei, Z., Trommer, B. L., Davenport, N. D.,et al. (2005). Larger deficits in brain networks for response inhibition than for visualselective attention in attention deficit hyperactivity disorder (ADHD). Journal of ChildPsychology and Psychiatry, 46, 94�111.
Brookes, K. J., Mill, J., Guindalini, C., Curran, S., Xu, X., Knight, J., et al. (2006).A common haplotype of the dopamine transporter gene associated with
369Functional Neuroimaging Evidence Supporting Neurofeedback in ADHD

attention-deficit/hyperactivity disorder and interacting with maternal use of alcoholduring pregnancy. Archives of General Psychiatry, 63, 74�81.
Bush, B., Biederman, J., Cohen, L. G., Sayer, J. M., Monuteaux, M. C., Mick, E., et al.(2002). Correlates of ADHD among children in pediatric and psychiatric clinics.Psychiatric Services, 53(9), 1103�1111.
Bush, G., Frazier, J. A., Rauch, S. L., Seidman, L. J., Whalen, P. J., Jenike, M. A., et al.(1999). Anterior cingulated cortex dysfunction in attention-deficit hyperactivity disor-der revealed by fMRI and the Counting Stroop. Biological Psychiatry, 45, 1542�1552.
Bush, G., Luu, P., & Posner, M. I. (2000). Cognitive and emotional influences in anteriorcingulate cortex. Trends in Cognitive Sciences, 4, 215�222.
Bush, G., Spencer, T. J., Holmes, J., Shin, L. M., Valera, E. M., Seidman, L. J., et al.(2008). Functional magnetic resonance imaging of methylphenidate and placebo inattention-deficit/hyperactivity disorder during the multi-source interference task.Archives of General Psychiatry, 65(1), 102�114.
Bush, G., Whalen, P. J., Rosen, B. R., Jenike, M. A., McInerney, S. C., & Rauch, S. L.(1998). The counting Stroop: An interference task specialized for functionalneuroimaging—validation study with functional MRI. Human Brain Mapping, 6,270�282.
Bussing, R., Grudnik, J., Mason, D., Wasiak, M., & Leonard, C. (2002). ADHD and con-duct disorder: An MRI study in a community sample. World Journal of BiologicalPsychiatry, 3, 216�220.
Calabresi, P., Pisani, A., Mercuri, N. B., & Bernardi, G. (1996). The corticostriatal projec-tion: From synaptic plasticity to dysfunctions of the basal ganglia. Trends inNeurosciences, 19, 19�24.
Carter, A. S., O’Donnell, D. A., Schultz, R. T., Scahill, L., Leckman, J. F., & Pauls,D. L. (2000). Social and emotional adjustment in children affected with Gilles dela Tourette’s syndrome: Associations with ADHD and family functioning. Attentiondeficit hyperactivity disorder. Journal of Child Psychology and Psychiatry, 41(2),215�223.
Carter, C. S., Braver, T. S., Barch, D. M., Botvinick, M. M., Noll, D., & Cohen, J. D.(1998). Anterior cingulate cortex, error detection, and the online monitoring of per-formance. Science, 280, 747�749.
Casey, B. J., Durston, S., & Fossella, J. A. (2001). Evidence for a mechanistic model ofcognitive control. Clinical Neuroscience Research, 1, 267�282.
Casey, B. J., Epstein, J. N., Buhle, J., Liston, C., Davidson, M. C., Tonev, S. T., et al.(2007). Frontostriatal connectivity and its role in cognitive control in parent-childdyads with ADHD. American Journal of Psychiatry, 164(11), 1729�1736.
Castellanos, F. X., Giedd, J. N., Berquin, P. C., Walter, J. M., Sharp, W., Tran, T., et al.(2001). Quantitative brain magnetic resonance imaging in girls with attention-deficit/hyperactivity disorder. Archives of General Psychiatry, 58, 289�295.
Castellanos, F., Giedd, J., Eckburg, P., Marsh, W., Vaituzis, C., Kaysen, D., et al. (1994).Quantitative morphology of the caudate nucleus in attention deficit hyperactivity dis-order. American Journal of Psychiatry, 151, 1791�1796.
Castellanos, F., Giedd, J., Marsh, W., Hamburger, S., Vaituzis, A., Dickstein, D., et al.(1996). Quantitative brain magnetic resonance imaging in attention deficit hyperactiv-ity disorder. Archives of General Psychiatry, 53, 607�616.
Castellanos, F. X., Lee, P. P., Sharp, W., Jeffries, N. O., Greenstein, D. K., Clasen, L. S.,et al. (2002). Developmental trajectories of brain volume abnormalities in children andadolescents with attention-deficit/hyperactivity disorder. JAMA, 288, 1740�1748.
Ceccarelli, A., Rocca, M. A., Pagani, E., Falini, A., Comi, G., & Filippi, M. (2009).Cognitive learning is associated with gray matter changes in healthy human indivi-duals: A tensor-based morphometry study. Neuroimage, 48(3), 585�589.
370 Johanne Lévesque and Mario Beauregard

Cho, S. C., Kim, J. W., Kim, B. N., Hwang, J. W., Shin, M. S., Park, M., et al. (2008).Association between the alpha-2C-adrenergic receptor gene and attention deficithyperactivity disorder in a Korean sample. Neuroscience Letters, 446, 108�111.
Conners, C. K., Wells, K. C., Parker, J. D. A., Sitarenios, G., Diamond, J. M., & Powell,J. W. (1997). A new self-report scale for the assessment of adolescent psychopathology:Factor structure, reliability, validity and diagnostic sensitivity. Journal of Abnormal ChildPsychology, 25, 487�497.
Deupree, J. D., Smith, S. D., Kratochvil, C. J., Bohac, D., Ellis, C. R., Polaha, J., et al.(2006). Possible involvement of alpha-2A adrenergic receptors in attention deficithyperactivity disorder:radioligand binding and polymorphism studies. American Journalof Medical Genetics B Neuropsychiatric Genetics, 141B, 877�884.
Dorval, K. M., Wigg, K. G., Crosbie, J., Tannock, R., Kennedy, J. L., Ickowicz, A., et al.(2007). Association of the glutamate receptor subunit gene GRIN2B with attention-deficit/hyperactivity disorder. Genes Brain and Behavior, 6, 444�452.
Doyle, A. E., Ferreira, M. A., Sklar, P. B., Lasky-Su, J., Petty, C., Fusillo, S. J., et al.(2008). Multivariate genomewide linkage scan of neurocognitive traits and ADHDsymptoms: Suggestive linkage to 3q13. American Journal of Medical Genetics BNeuropsychiatric Genetics, 147B, 1399�1411.
Draganski, B., Gaser, C., Kempermann, G., Kuhn, H. G., Winkler, J., Buchel, C., et al.(2006). Temporal and spatial dynamics of brain structure changes during extensivelearning. Journal of Neuroscience, 26(23), 6314�6317.
Dresel, S., Krause, J., Krause, K. H., LaFougere, C., Brinkbaumer, K., Kung, H. F., et al.(2000). Attention deficit hyperactivity disorder: Binding of [99mTc]TRODAT-1 tothe dopamine transporter before and after methylphenidate treatment. EuropeanJournal of Nuclear Medicine, 27, 1518�1524.
Dudbridge, F., & Gusnanto, A. (2008). Estimation of significance thresholds for genome-wide association scans. Genetic Epidemiology, 32(3), 227�234.
Dum, R., & Strick, P. (1993). Cingulate motor areas. In B. A. Vogt & M. Gabriel (Eds.),Neurobiology of cingulate cortex and limbic thalamus: A comprehensive handbook. Boston,MA: Birkhauser.
Duncan, J., & Owen, A. M. (2000). Common regions of the human frontal lobe recruitedby diverse cognitive demands. Trends in Neuroscience, 23, 475�483.
Durston, S., & Casey, B. J. (2006). What have we learned about cognitive developmentfrom neuroimaging? Neuropsychologia, 44(11), 2149�2157.
Durston, S., Fossella, J. A., Casey, B. J., Hulshoff Pol, H. E., Galvan, A., Schnack, H. G.,et al. (2005). Differential effects of DRD4 and DAT1genotype on fronto-striatal graymatter volumes in a sample of subjects with attention deficit hyperactivity disorder,their unaffected siblings, and controls. Molecular Psychiatry, 10, 678�685.
Durston, S., Fossella, J. A., Mulder, M. J., Casey, B. J., Ziermans, T. B., Vessaz, M. N.,et al. (2008). Dopamine transporter genotype conveys familial risk of attention-deficit/hyperactivity disorder through striatal activation. Journal of the AmericanAcademy of Child and Adolescent Psychiatry, 47, 61�67.
Durston, S., Hulshoff Pol, H. E., Schnack, H. G., Buitelaar, J. K., Steenhuis, M. P.,Minderaa, R. B., et al. (2004). Magnetic resonance imaging of boys with attention-deficit/hyperactivity disorder and their unaffected siblings. Journal of the AmericanAcademy of Child and Adolescent Psychiatry, 43, 332�340.
Durston, S., Mulder, M., Casey, B. J., Ziermans, T., & van Engeland, H. (2006).Activation in ventral prefrontal cortex is sensitive to genetic vulnerability for atten-tion-deficit hyperactivity disorder. Biological Psychiatry, 60(10), 1062�1070.
Durston, S., Tottenham, N. T., Thomas, K. M., Davidson, M. C., Eigsti, I. M., Yang, Y.,et al. (2003). Differential patterns of striatal activation in young children with andwithout ADHD. Biological Psychiatry, 53, 871�878.
371Functional Neuroimaging Evidence Supporting Neurofeedback in ADHD

Faraone, S. V., & Doyle, A. E. (2001). The nature and heritability of attention-deficit/hyperactivity disorder. Child and Adolescent Psychiatry Clinics of North America, 10(2),299�316, viii�ix.
Faraone, S. V., Doyle, A. E., Mick, E., & Biederman, J. (2001). Metaanalysis of the associ-ation between the 7-repeat allele of the dopamine D(4) receptor gene and attentiondeficit hyperactivity disorder. American Journal of Psychiatry, 158, 1052�1057.
Faraone, S. V., Perlis, R. H., Doyle, A. E., Smoller, J. W., Goralnick, J. J., Holmgren, M. A.,et al. (2005). Molecular genetics of attention deficit/hyperactivity disorder. BiologicalPsychiatry, 57, 1313�1323.
Filipek, P. A., Semrud-Clikeman, M., Steingard, R. J., Renshaw, P. F., Kennedy, D. N., &Biederman, J. (1997). Volumetric MRI analysis comparing subjects having attention-deficit hyperactivity disorder with normal controls. Neurology, 48, 589�601.
Fuchs, T., Birbaumer, N., Lutzenberger, W., Gruzelier, J. H., & Kaiser, J. (2003).Neurofeedback treatment for attention-deficit/hyperactivity disorder in children: Acomparison with methylphenidate. Applied Psychophysiology and Biofeedback, 28,1�12.
Gainetdinov, R. R., Wetsel, W. C., Jones, S. R., Levin, E. D., Jaber, M., & Caron, M. G.(1999). Role of serotonin in the paradoxical calming effect of psychostimulants onhyperactivity. Science, 283, 397�401.
Garavan, H., Ross, T. J., Murphy, K., Roche, R. A., & Stein, E. A. (2002). Dissociableexecutive functions in the dynamic control of behavior: Inhibition, error detection,and correction. Neuroimage, 17(4), 1820�1829.
Garavan, H., Ross, T. J., & Stein, E. A. (1999). Right hemispheric dominance of inhibi-tory control: An event-related functional MRI study. Proceedings of the NationalAcademy of Sciences of the U S A, 96, 8301�8306.
Gehring, W. J., & Knight, R. T. (2000). Prefrontal-cingulate interactions in action moni-toring. Nature Neuroscience, 3, 516�520.
Gevensleben, H., Holl, B., Albrecht, B., Vogel, C., Schlamp, D., Kratz, O., et al. (2009).Is neurofeedback an efficacious treatment for ADHD? A randomised controlled clini-cal trial. Journal of Child Psychology and Psychiatry, 50(7), 780�789.
Godefroy, O., Lhullier, C., & Rousseaux, M. (1996). Non-spatial attention disorders inpatients with frontal or posterior brain damage. Brain, 119, 191�202.
Grevet, E. H., Marques, F. Z., Salgado, C. A., Fischer, A. G., Kalil, K. L., Victor, M. M.,et al. (2007). Serotonin transporter gene polymorphism and the phenotypic hetero-geneity of adult ADHD. Journal of Neural Transmission, 114, 1631�1636.
Guan, L., Wang, B., Chen, Y., Yang, L., Li, J., Qian, Q., et al. (2009). A high-densitysingle-nucleotide polymorphism screen of 23 candidate genes in attention deficithyperactivity disorder: Suggesting multiple susceptibility genes among Chinese Hanpopulation. Molecular Psychiatry, 14, 546�554.
Guimaraes, A. P., Zeni, C., Polanczyk, G. V., Genro, J. P., Roman, T., Rohde, L. A.,et al. (2007). Serotonin genes and attention deficit/hyperactivity disorder in aBrazilian sample: Preferential transmission of the HTR2A 452His allele to affectedboys. American Journal of Medical Genetics B Neuropsychiatric Genetics, 144B, 69�73.
Halperin, J. M., Newcorn, J. H., Schwartz, S. T., Sharma, V., Siever, L. J., Koda, V. H.,et al. (1997). Age-related changes in the association between serotonergic functionand aggression in boys with ADHD. Biological Psychiatry, 41, 682�689.
Hebebrand, J., Dempfle, A., Saar, K., Thiele, H., Herpertz-Dahlmann, B., Linder, M.,et al. (2006). A genome-wide scan for attention-deficit/hyperactivity disorder in 155German sib-pairs. Molecular Psychiatry, 11, 196�205.
Heilman, K. M., Pandya, D. N., & Geschwind, N. (1970). Trimodal inattention followingparietal lobe ablations. Transactions of the American Neurological Association, 95,259�261.
372 Johanne Lévesque and Mario Beauregard

Heilman, K. M., Watson, R. T., Bower, D., & Valenstein, E. (1983). Right hemispheredominance for attention (in French). Revue Neurologie (Paris), 139, 15�17.
Hill, D. E., Yeo, R. A., Campbell, R. A., Hart, B., Vigil, J., & Brooks, W. (2003).Magnetic resonance imaging correlates of attention-deficit/hyperactivity disorder inchildren. Neuropsychology, 17, 496�506.
Hynd, G. W., Semrud-Clikeman, M. S., Lorys, A. R., Novey, E. S., & Eliopulos, D.(1990). Brain morphology in developmental dyslexia and attention deficit/hyperactiv-ity. Archives of Neurology, 47, 919�926.
Ickowicz, A., Feng, Y., Wigg, K., Quist, J., Pathare, T., Roberts, W., et al. (2007). Theserotonin receptor HTR1B: Gene polymorphisms in attention deficit hyperactivitydisorder. American Journal of Medical Genetics B Neuropsychiatric Genetics, 144B,121�125.
Johansen-Berg, H. (2007). Structural plasticity: Rewiring the brain. Current Biology, 17(4),R141�R144.
Kates, W. R., Frederikse, M., Mostofsky, S. H., Folley, B. S., Cooper, K., Mazur-Hopkins, P., et al. (2002). MRI parcellation of the frontal lobe in boys with attentiondeficit hyperactivity disorder or Tourette syndrome. Psychiatry Research, 116, 63�81.
Kebir, O., Grizenko., N., Sengupta, S., & Joober, R. (2009). Verbal but not performanceIQ is highly correlated to externalizing behavior in boys with ADHD carrying bothDRD4 and DAT1 risk genotypes. Progress in Neuro-Psychopharmacology and BiologicalPsychiatry, 33, 939�944.
Kiehl, K. A., Liddle, P. F., & Hopfinger, J. B. (2000). Error processing and the rostralanterior cingulate: An event-related fMRI study. Psychophysiology, 37, 216�223.
Kim, B. N., Lee, J. S., Shin, M. S., Cho, S. C., & Lee, D. S. (2002). Regional cerebralperfusion abnormalities in attention deficit/hyperactivity disorder. Statistical paramet-ric mapping analysis. European Archives of Psychiatry and Clinical Neuroscience, 252,219�225.
Konishi, S., Nakajima, K., Uchida, I., Sekihara, K., & Miyashita, Y. (1998). No-Go domi-nant brain activity in human inferior prefrontal cortex revealed by functional magneticresonance imaging. European Journal of Neuroscience, 10, 1209�1213.
Konrad, K., Neufang, S., Fink, G. R., & Herpertz-Dahlmann, B. (2007). Long-termeffects of methylphenidate on neural networks associated with executive attention inchildren with ADHD: Results from a longitudinal functional MRI study. Journal of theAmerican Academy of Child and Adolescent Psychiatry, 46(12), 1633�1641.
Konrad, K., Neufang, S., Hanisch, C., Fink, G. R., & Herpertz-Dahlmann, B. (2006).Dysfunctional attentional networks in children with attention deficit/hyperactivitydisorder: Evidence from an event-related functional magnetic resonance imagingstudy. Biological Psychiatry, 59(7), 643�651.
Kopeckova, M., Paclt, I., Petrasek, J., Pacltova, D., Malikova, M., & Zagatova, V. (2008).Some ADHD polymorphisms (in genes DAT1, DRD2, DRD3, DBH, 5-HTT) incase�control study of 100 subjects 6�10 age. Neuroendocrinology Letters, 29, 246�251.
Kropotov, J. D., Grin-Yatsenko, V. A., Ponomarev, V. A., Chutko, L. S., Yakovenko, E., &Nikishena, I. S. (2005). ERPs correlates of EEG relative beta training in ADHD chil-dren. International Journal of Psychophysiology, 55, 23�34.
Lasky-Su, J., Neale, B. M., Franke, B., Anney, R. J., Zhou, K., Maller, J. B., et al. (2008).Genome-wide association scan of quantitative traits for attention deficit hyperactivitydisorder identifies novel associations and confirms candidate gene associations.American Journal of Medical Genetics B Neuropsychiatric Genetics, 147B, 1345�1354.
Leimkuhler, M. E., & Mesulam, M. M. (1985). Reversible go-no go deficits in a case offrontal lobe tumor. Annals of Neurology, 18, 617�619.
Lesch, K. P., Timmesfeld, N., Renner, T. J., Halperin, R., Roser, C., Nguyen, T. T.,et al. (2008). Molecular genetics of adult ADHD: Converging evidence from
373Functional Neuroimaging Evidence Supporting Neurofeedback in ADHD

genome-wide association and extended pedigree linkage studies. Journal of NeuralTransmission, 115, 1573�1585.
Levesque, J., Beauregard, M., & Mensour, B. (2006). Effect of neurofeedback training onthe neural substrates of selective attention in children with attention-deficit/hyper-activity disorder: A functional magnetic resonance imaging study. Neuroscience Letters,394(3), 216�221.
Lezak, M. D. (1990). Neuropsychological assessment. In J. Frederiks (Ed.), Handbook ofclinical neurology: Vol. 1. Clinical neuropsychology (pp. 515�530). New York: Elsevier.
Li, D., Sham, P. C., Owen, M. J., & He, L. (2006). Meta-analysis shows significant associa-tion between dopamine system genes and attention deficit hyperactivity disorder(ADHD). Human Molecular Genetics, 15, 2276�2284.
Li, J., Kang, C., Zhang, H., Wang, Y., Zhou, R., Wang, B., et al. (2007). Monoamineoxidase A gene polymorphism predicts adolescent outcome of attention-deficit/hyperactivity disorder. American Journal of Medical Genetics B Neuropsychiatric Genetics,144B, 430�433.
Li, J., Wang, Y. F., Zhou, R. L., Yang, L., Zhang, H. B., & Wang, B. (2003). Associationbetween tryptophan hydroxylase gene polymorphisms and attention deficit hyperac-tivity disorder with or without learning disorder. Zhonghua Yi Xue Za Zhi, 83,2114�2118.
Liddle, P. F., Kiehl, K. A., & Smith, A. M. (2001). Event-related fMRI study of responseinhibition. Human Brain Mapping, 12, 100�109.
Linden, M., Habib, T., & Radojevic, V. (1996). A controlled study of the effects of EEGbiofeedback on cognition and behavior of children with attention deficit disorder andlearning disabilities. Biofeedback and Self Regulation, 21, 35�49.
Lou, H. C., Henriksen, L., Bruhn, P., Borner, H., & Nielsen, J. B. (1989). Striatal dys-function in attention deficit and hyperkinetic disorder. Archives of Neurology, 46,48�52.
Lubar, J. F. (1997). Neocortical dynamics: Implications for understanding the role ofneurofeedback and related techniques for the enhancement of attention. AppliedPsychophysiology Biofeedback, 22(2), 111�126.
Lubar, J. O., & Lubar, J. F. (1984). Electroencephalographic biofeedback of SMR and betafor treatment of attention deficit disorders in a clinical setting. Biofeedback and SelfRegulation, 9, 1�23.
Lubar, J. F., & Shouse, M. N. (1976). EEG and behavioral changes in a hyperkinetic childconcurrent with training of the sensorimotor rhythm (SMR): A preliminary report.Biofeedback and Self Regulation, 1, 293�306.
Lubar, J. F., Swartwood, M. O., Swartwood, J. N., & O’Donnell, P. H. (1995). Evaluationof the effectiveness of EEG neurofeedback training for ADHD in a clinical setting asmeasured by changes in T. O. V. A. scores, behavioral ratings, and WISC-R perfor-mance. Biofeedback and Self Regulation, 20, 83�99.
Makris, N., Biederman, J., Monuteaux, M. C., & Seidman, L. J. (2009). Towards concep-tualizing a neural systems-based anatomy of attention-deficit/hyperactivity disorder.Developmental Neuroscience, 31, 36�49.
Makris, N., Biederman, J., Valera, E. M., Bush, G., Kaiser, J., Kennedy, D. N., et al.(2007). Cortical thinning of the attention and executive function networks in adultswith attention-deficit/hyperactivity disorder. Cerebral Cortex, 17, 1364�1375.
Makris, N., Buka, S. L., Biederman, J., Papadimitriou, G. M., Hodge, S. M., Valera, E. M.,et al. (2008). Attention and executive systems abnormalities in adults with childhoodADHD: A DT-MRI study of connections. Cerebral Cortex, 18, 1210�1220.
Mannuzza, S., Klein, R. G., Bessler, A., Malloy, P., & Hynes, M. E. (1997). Educationaland occupational outcome of hyperactive boys grown up. Journal of the AmericanAcademy of Child and Adolescent Psychiatry, 36(9), 1222�1227.
374 Johanne Lévesque and Mario Beauregard

Mataro, M., Garcia-Sanchez, C., Junque, C., Estevez-Gonzalez, A., & Pujol, J. (1997).Magnetic resonance imaging measurement of the caudate nucleus in adolescents withattention deficit hyperactivity disorder and its relationship with neuropsychologicaland behavioural measures. Archives of Neurology, 54, 963�968.
Mattes, J. A. (1980). The role of frontal lobe dysfunctionin childhood hyperkinesis.Comprehensive Psychiatry, 21, 358�369.
Menon, V., Adleman, N. E., White, C. D., Glover, G. H., & Reiss, A. L. (2001). Error-related brain activation during a Go/NoGo response inhibition task. Human BrainMapping, 12, 131�143.
Mesulam, M. M. (1990). Large-scale neurocognitive networks and distributed processingfor attention, language, and memory. Annals of Neurology, 28, 597�613.
Mick, E., & Faraone, S. V . (2008). Genetics of attention deficit hyperactivity disorder.Child and Adolescent Psychiatry Clinics of North America, 17, 261�284, vii�viii.
Monastra, V. J., Monastra, D. M., & George, S. (2002). The effects of stimulant therapy,EEG biofeedback, and parenting style on the primary symptoms of attention deficit/hyperactivity disorder. Applied Psychophysiology and Biofeedback, 27, 231�249.
Monuteaux, M. C., Biederman, J., Doyle, A. E., Mick, E., & Faraone, S. V. (2009).Genetic risk for conduct disorder symptom subtypes in an ADHD sample: Specificityto aggressive symptoms. Journal of the American Academy of Child and AdolescentPsychiatry, 48, 757�764.
Morrison, J. R., & Stewart, M. A. (1974). Bilateral inheritance as evidence for polygeni-city in the hyperactive child syndrome. Journal of Nervous and Mental Disorders, 158(3),226�228.
Mostofsky, S. H., Cooper, K. L., Kates, W. R., Denckla, M. B., & Kaufmann, W. E.(2002). Smaller prefrontal and premotor volumes in boys with attention-deficit/hyperactivity disorder. Biological Psychiatry, 52, 785�794.
Mostofsky, S. H., Reiss, A. L., Lockhart, P., & Denckla, M. B. (1998). Evaluation of cere-bellar size in attention-deficit hyperactivity disorder. Journal of Child Neurology, 13,434�439.
Neale, B. M., Lasky-Su, J., Anney, R., Franke, B., Zhou, K., Maller, J. B., et al. (2008).Genome-wide association scan of attention deficit hyperactivity disorder. AmericanJournal of Medical Genetics B Neuropsychiatric Genetics, 147B, 1337�1344.
Nieoullon, A., & Coquerel, A. (2003). Dopamine: A key regulator to adapt action, emo-tion, motivation and cognition. Current Opinion in Neurology, 16(Suppl 2), S3�S9.
Oades, R. D., Lasky-Su, J., Christiansen, H., Faraone, S. V., Sonuga- Barke, E. J.,Banaschewski, T., et al. (2008). The influence of serotonin and other genes on impul-sive behavioral aggression and cognitive impulsivity in children with attention-deficit/hyperactivity disorder (ADHD): Findings from a family-based association test (FBAT)analysis. Behavior and Brain Functions, 4, 48.
Ogdie, M. N., Bakker, S. C., Fisher, S. E., Francks, C., Yang, M. H, Cantor, R. M., et al.(2006). Pooled genome-wide linkage data on 424 ADHD ASPs suggests geneticheterogeneity and a common risk locus at 5p13. Molecular Psychiatry, 11, 5�8.
Overmeyer, S., Bullmore, E. T., Suckling, J., Simmons, A., Williams, S. C., Santosh, P.,et al. (2001). Distributed grey and white matter deficits in hyperkinetic disorder MRIevidence for anatomical abnormality in an attentional network. Psychological Medicine,31, 1425�1435.
Pavuluri, M. N., Yang, S., Kamineni, K., Passarotti, A. M., Srinivasan, G., Harral, E. M.,et al. (2009). Diffusion tensor imaging study of white matter fiber tracts in pediatricbipolar disorder and attention-deficit/hyperactivity disorder. Biological Psychiatry, 65(7),586�593.
Paus, T. (2001). Primate anterior cingulate cortex: Where motor control, drive and cogni-tion interface. Nature Reviews Neuroscience, 22, 417�424.
375Functional Neuroimaging Evidence Supporting Neurofeedback in ADHD

Peter, I., Yelensky, R., Altshuler, D., & Daly, M. J. (2008). Estimation of the multiple test-ing burden for genome wide association studies of nearly all common variants. GeneticEpidemiology, 32, 381�385.
Pliszka, S. R., Glahn, D. C., Semrud-Clikeman, M., Franklin, C., Perez, R., 3rd, Xiong,J., et al. (2006). Neuroimaging of inhibitory control areas in children with attentiondeficit hyperactivity disorder who were treatment naive or in long-term treatment.American Journal of Psychiatry, 163, 1052�1060.
Posner, M. I., & Petersen, S. E. (1990). The attention system of the human brain. AnnualReview of Neuroscience, 13, 25�42.
Retz, W., Freitag, C. M., Retz-Junginger, P., Wenzler, D., Schneider, M., Kissling, C.,et al. (2008). A functional serotonin transporter promoter gene polymorphismincreases ADHD symptoms in delinquents: Interaction with adverse childhood envir-onment. Psychiatry Research, 158, 123�131.
Ribases, M., Ramos-Quiroga, J. A., Hervas, A., Bosch, R., Bielsa, A., Gastaminza, X.,et al. (2009). Exploration of 19 serotoninergic candidate genes in adults and childrenwith attention-deficit/hyperactivity disorder identifies association for 5HT2A. DDCand MAOB. Molecular Psychiatry, 14, 71�85.
Roman, T., Schmitz, M., Polanczyk, G. V., Eizirik, M., Rohde, L. A., & Hutz, M. H.(2002). Further evidence for the association between attention-deficit/hyperactivitydisorder and the dopamine-betahydroxylase gene. American Journal of Medical Genetics,114, 154�158.
Romanos, M., Freitag, C., Jacob, C., Craig, D. W., Dempfle, A., Nguyen, T. T., et al.(2008). Genome-wide linkage analysis of ADHD using high-density SNP arrays:Novel loci at 5q13.1 and 14q12. Molecular Psychiatry, 13, 522�530.
Rommelse, N., Altink, M. E., Martin, N. C., Buschgens, C. J., Faraone, S. V., Buitelaar,J. K., et al. (2008). Relationship between endophenotype and phenotype in ADHD.Behavior and Brain Functions, 4, 4.
Rossiter, T. (2004). The effectiveness of neurofeedback and stimulant drugs intreating AD/HD: Part II. Replication. Applied Psychophysiology and Biofeedback, 29,233�243.
Rossiter, T. R., & LaVaque, T. J. (1995). A comparison of EEG biofeedback and psycho-stimulants in treating attention deficit hyperactivity disorders. Journal of Neurotherapy,1, 48�59.
Rubia, K., Overmeyer, S., Taylor, E., Brammer, M., Williams, S. C., Simmons, A., et al.(1999). Hypofrontality in attention deficit hyperactivity disorder during higher-ordermotor control: A study with functional MRI. American Journal of Psychiatry, 156(6),891�896.
Rubia, K., Smith, A. B., Brammer, M. J., & Taylor, E. (2003). Right inferior prefrontalcortex mediates response inhibition while mesial prefrontal cortex is responsible forerror detection. Neuroimage, 20, 351�358.
Rubia, K., Smith, A. B., Brammer, M. J., Toone, B., & Taylor, E. (2005). Abnormal brainactivation during inhibition and error detection in medication-naive adolescents withADHD. American Journal of Psychiatry, 162(6), 1067�1075.
Sandford, J. A., & Turner, A. (1995). Manual for the intermediate visual and auditory continu-ous performance test. Richmond, VA: Brain Train 727 Twin Ridge Lane.
Scheres, A., Milham, M. P., Knutson, B., & Castellanos, F. X. (2007). Ventral striatalhyporesponsiveness during reward anticipation in attention-deficit/hyperactivity disor-der. Biological Psychiatry, 61(5), 720�724.
Schmitz, M., Denardin, D., Silva, T. L., Pianca, T., Roman, T., Hutz, M. H., et al.(2006). Association between alpha-2a-adrenergic receptor gene and ADHD inatten-tive type. Biological Psychiatry, 60, 1028�1033.
376 Johanne Lévesque and Mario Beauregard

Schulz, K. P., Newcorn, J. H., Fan, J., Tang, C. Y., & Halperin, J. M. (2005). Brain activa-tion gradients in ventrolateral prefrontal cortex related to persistence of ADHD in ado-lescent boys. Journal of American Academy of Child and Adolescent Psychiatry, 44(1), 47�54.
Seamans, J. K., & Yang, C. R. (2004). The principal features and mechanisms of dopa-mine modulation in the prefrontal cortex. Progress in Neurobiology, 74, 1�58.
Seidman, L. J., Valera, E. M., & Makris, N. (2005). Structural brain imaging of attention-deficit/hyperactivity disorder. Biological Psychiatry, 57(11), 1263�1272.
Seidman, L. J., Valera, E. M., Makris, N., Monuteaux., M. C., Boriel, D. L., Kelkar, K.,et al. (2006). Dorsolateral prefrontal and anterior cingulate cortex volumetric abnor-malities in adults with attention-deficit/hyperactivity disorder identified by magneticresonance imaging. Biological Psychiatry, 60, 1071�1080.
Semrud-Clikeman, M. S., Filipek, P. A., Biederman, J., Steingard, R., Kennedy, D.,Renshaw, P., et al. (1994). Attention-deficit hyperactivity disorder: Magnetic reson-ance imaging morphometric analysis of the corpus callosum. Journal of the AmericanAcademy of Child and Adolescent Psychiatry, 33, 875�881.
Semrud-Clikeman, M., Pliszka, S. R., Lancaster, J., & Liotti, M. (2006). Volumetric MRIdifferences in treatment-naive vs. chronically treated children with ADHD. Neurology,67, 1023�1027.
Shafritz, K. M., Marchione, K. E., Gore, J. C., Shaywitz, S. E., & Shaywitz, B. A. (2004).The effects of methylphenidate on neural systems of attention in attention deficithyperactivity disorder. American Journal of Psychiatry, 161(11), 1990�1997.
Shallice, T. (1988). From neuropsychology to mental structure. Cambridge: CambridgeUniversity Press.
Shaw, P., Lerch, J., Greenstein, D., Sharp, W., Clasen, L., Evans, A., et al. (2006).Longitudinal mapping of cortical thickness and clinical outcome in children and adoles-cents with attention-deficit/hyperactivity disorder. Archives of General Psychiatry, 63(5),540�549.
Sheehan, K., Lowe, N., Kirley, A., Mullins, C., Fitzgerald, M., Gill, M., et al. (2005).Tryptophan hydroxylase 2 (TPH2) gene variants associated with ADHD. MolecularPsychiatry, 10, 944�949.
Shouse, M. N., & Lubar, J. F. (1979). Operant conditioning of EEG rhythms and ritalin inthe treatment of hyperkinesis. Biofeedback and Self Regulation, 4, 299�312.
Sieg, K. G., Gaffney, G. R., Preston, D. F., & Hellings, J. A. (1995). SPECT brain imagingabnormalities in attention deficit hyperactivity disorder. Clinical Nuclear Medicine, 20,55�60.
Silk, T., Vance, A., Rinehart, N., Egan, G., O’Boyle, M., Bradshaw, J. L., et al. (2005).Fronto-parietal activation in attention-deficit hyperactivity disorder, combined type:Functional magnetic resonance imaging study. British Journal of Psychiatry, 187,282�283.
Smith, E. E., & Jonides, J. (1999). Storage and executive processes in the frontal lobes.Science, 283, 1657�1661.
Sowell, E. R., Thompson, P. M., Welcome, S. E., Henkenius, A. L., Toga, A. W., &Peterson, B. S. (2003). Cortical abnormalities in children and adolescents with atten-tion-deficit hyperactivity disorder. Lancet, 362, 1699�1707.
Spitzer, R. L., Williams, J. B., Gibbon, M., & First, M. B. (1992). The StructuredClinical Interview for DSM-III-R (SCID). I: History, rationale, and description.Archives of General Psychiatry, 49, 624�629.
Steinhausen, H-C. (2009). The heterogeneity of causes and courses of attention-deficit/hyperactivity disorder. Acta Psychiatrica Scandinavica, 120, 392�399.
Stevens, M. C., Pearlson, G. D., & Kiehl, K. A. (2007). An FMRI auditory oddball studyof combined-subtype attention deficit hyperactivity disorder. American Journal ofPsychiatry, 164(11), 1737�1749.
377Functional Neuroimaging Evidence Supporting Neurofeedback in ADHD

Still, G. (1902). The Goulstonian lectures on some abnormal physical conditions in chil-dren. Lecture 1. Lancet, i, 1008�1012 1077�1082, 1163�1168.
Strehl, U., Leins, U., Goth, G., Klinger, C., Hinterberger, T., & Birbaumer, N. (2006).Self-regulation of slow cortical potentials: A new treatment for children with atten-tion-deficit/hyperactivity disorder. Pediatrics, 118(5), e1530�e1540.
Strohle, A., Stoy, M., Wrase, J., Schwarzer, S., Schlagenhauf, F., & Huss, M. (2008).Reward anticipation and outcomes in adult males with attention-deficit/hyperactivitydisorder. Neuroimage, 39(3), 966�972.
Suskauer, S. J., Simmonds, D. J., Fotedar, S., Blankner, J. G., Pekar, J. J., Denckla, M. B.,et al. (2008). Functional magnetic resonance imaging evidence for abnormalities inresponse selection in attention deficit hyperactivity disorder: Differences in activationassociated with response inhibition but not habitual motor response. Journal ofCognitive Neuroscience, 20(3), 478�493.
Swanson, J. M., Hinshaw, S. P., Arnold, L., Gibbons, R. D., Marcus, S., Hur, K., et al.(2007). Secondary evaluations of MTA 36-month outcomes: Propensity score andgrowth mixture model analyses. Journal of the American Academy of Child and AdolescentPsychiatry, 46(8), 1015�1027.
Tamm, L., Menon, V., & Reiss, A. L. (2006). Parietal attentional system aberrations dur-ing target detection in adolescents with attention deficit hyperactivity disorder: Event-related fMRI evidence. American Journal of Psychiatry, 163(6), 1033�1043.
Tamm, L., Menon, V., Ringel, J., & Reiss, A. L. (2004). Event-related FMRI evidence offrontotemporal involvement in aberrant response inhibition and task switching inattention-deficit/hyperactivity disorder. Journal of the American Academy of Child andAdolescent Psychiatry, 43, 1430�1440.
Tansey, M. A. (1984). EEG sensorimotor rhythm biofeedback training: Some effectson the neurologic precursors of learning disabilities. International Journal ofPsychophysiology, 1, 163�177.
Tansey, M. A. (1985). Brainwave signatures � an index reflective of the brain’s functionalneuroanatomy: Further findings on the effect of EEG sensorimotor rhythm biofeed-back training on the neurologic precursors of learning disabilities. International Journalof Psychophysiology, 3, 85�99.
Thompson, L., & Thompson, M. (1998). Neurofeedback combined with training inmetacognitive strategies: Effectiveness in students with ADD. Applied Psychophysiologyand Biofeedback, 23, 243�263.
Timmann, D., & Daum, I. (2007). Cerebellar contributions to cognitive functions:A progress report after two decades of research. The Cerebellum, 6, 159�162.
Vaidya, C. J., Austin, G., Kirkorian, G., Ridlehuber, H. W., Desmond, J. E., Glover, G. H.,et al. (1998). Selective effects of methylphenidate in attention deficit hyperactivity disor-der: A functional magnetic resonance study. Proceedings of the National Academy of Sciencesof the U S A, 95, 14494�14499.
Valera, E. M., Faraone, S. V., Murray, K. E., & Seidman, L. J. (2007). Meta-analysis ofstructural imaging findings in attention-deficit/hyperactivity disorder. BiologicalPsychiatry, 61, 1361�1369.
van Steen, K., & Lange, C. (2005). PBAT: A comprehensive software package for genome-wide association analysis of complex family-based studies. Human Genomics, 2, 67�69.
Waldman, I. D., & Gizer, I. R. (2006). The genetics of attention deficit hyperactivity dis-order. Clinical Psychology Reviews, 26, 396�432.
Walitza, S., Renner, T. J., Dempfle, A., Konrad, K., Wewetzer, C., Halbach, A., et al.(2005). Transmission disequilibrium of polymorphic variants in the tryptophanhydroxylase-2 gene in attention-deficit/hyperactivity disorder. Molecular Psychiatry, 10,1126�1132.
378 Johanne Lévesque and Mario Beauregard

Wang, B., Wang, Y., Zhou, R., Li, J., Qian, Q., Yang, L., et al. (2006). Possible associationof the alpha-2A adrenergic receptor gene (ADRA2A) with symptoms of attention-deficit/hyperactivity disorder. American Journal of Medical Genetics B NeuropsychiatricGenetics, 141B, 130�134.
Wechsler, D. (1981). Manual for Wechsler adult intelligence scale � revised. San Antonio, TX:The Psychological Corporation.
Wigg, K. G., Takhar, A., Ickowicz, A, Tannock, R., Kennedy, J. L., Pathare, T., et al.(2006). Gene for the serotonin transporter and ADHD: No association with twofunctional polymorphisms. American Journal of Medical Genetics B NeuropsychiatricGenetics, 141B, 566�570.
Xu, X., Aysimi, E., Anney, R., Brookes, K., Franke, B., Zhou, K., et al. (2008). No asso-ciation between two polymorphisms of the serotonin transporter gene and combinedtype attention deficit hyperactivity disorder. American Journal of Medical Genetics BNeuropsychiatric Genetics, 147, 1306�1309.
Zametkin, A. J., Nordahl, T. E., Gross, M., King, A. C., Semple, W. E., Rumsey, J., et al.(1990). Cerebral glucose metabolism in adults with hyperactivity of childhood onset.New England Journal of Medicine, 323, 1361�1366.
Zhou, K., Chen, W., Buitelaar, J., Banaschewski, T., Oades, R. D., Franke, B., et al.(2008). Genetic heterogeneity in ADHD: DAT1 gene only affects probands withoutCD. American Journal of Medical Genetics B Neuropsychiatric Genetics, 147B, 1481�1487.
Zhou, K., Dempfle, A., Arcos-Burgos, M., Bakker, S. C., Banaschewski, T., Biederman, J.,et al. (2008). Meta-analysis of genome-wide linkage scans of attention deficit hyperactiv-ity disorder. American Journal of Medical Genetics B Neuropsychiatric Genetics, 147B,1392�1398.
379Functional Neuroimaging Evidence Supporting Neurofeedback in ADHD

This page intentionally left blank

CHAPTER1414The Immediate Effects of EEGNeurofeedback on CorticalExcitability and SynchronizationTomas Ros and John H. GruzelierDepartment of Psychology, Goldsmiths, University of London, London, UK
Contents
Introduction 381Methods 383
Participants 383Study Design 383Neurofeedback (NFB) 384Transcranial Magnetic Stimulation (TMS): Apparatus and Procedure 385
Results 387NFB Training Dynamic 388TMS Main Effects 389TMS�EEG Relationships 390
Discussion 395References 399
INTRODUCTION
In comparison with the much larger number of studies demonstrating
long-lasting clinical and behavioral effects of neurofeedback (NFB), very
few investigations have been carried out to date on the mechanisms and
neurophysiological substrates of EEG-based NFB other than EEG meas-
ures. Most NFB involves multiple sessions repeated on at least a weekly
basis, whose effects generally accumulate over time, reputedly as a result
of neuroplastic changes in the brain (for peak performance at least eight
sessions, for clinical application .20) (Doehnert, Brandeis, Straub,
Steinhausen, & Drechsler, 2008; Hanslmayr, Sauseng, Doppelmayr,
Schabus, & Klimesch, 2005; Levesque, Beauregard, & Mensour, 2006).
Over the years numerous studies have demonstrated behavioral as well as
381Neurofeedback and Neuromodulation Techniques and ApplicationsDOI: 10.1016/B978-0-12-382235-2.00014-7
© 2011 Elsevier Inc.All rights reserved.

neurophysiological alterations after long-term NFB training, such as
improvement in attention and cognitive performance and their accom-
panying EEG/ERP changes (Egner & Gruzelier, 2004; Gruzelier, Egner, &
Vernon, 2006). However, to date and to the best of the authors’ knowl-
edge, no work exists or provides evidence for a causal and more direct
temporal relationship between self-regulation of brain activity and con-
comitant short-term change in brain plasticity, or its mechanisms. This
may possibly be due to a belief that the putative modulatory effect(s) that
follow a discrete session of neurofeedback are too fine to be detected
immediately thereafter, or alternatively, occur at some later stage, for
example during sleep. However, as is common for all learning paradigms,
NFB training occurs within a temporally distinct period or “session”, and
if it is ever to claim the grail of inducing lasting neuroplastic changes (and
thus be taken seriously as a non-invasive tool for neuromodulation, such
as rTMS and tDCS) (Wagner, Valero-Cabre, & Pascual-Leone, 2007), a
stronger association is clearly warranted between a single training session
and the reputed plasticity, if any, it engenders. Accordingly, there has been
no demonstration to date of a chronologically direct neuroplastic effect
following NFB. That is, of a robust and durable change in neurophysio-
logical function immediately after discrete exposure to NFB. On the other
hand, a substantial corpus of transcranial magnetic stimulation (TMS)
literature purports significant and durable changes in brain plasticity
following brain stimulation techniques such as rTMS and tDCS (Wagner,
Valero-Cabre, & Pascual-Leone, 2007), hence similar investigations with
NFB may ultimately enable more direct comparisons of effect size with
other stimulation techniques.
Nowadays, the study of neuroplasticity in the intact human brain has
been made possible with the advent of TMS. Here, evidence of neuroplastic
change may be demonstrated non-invasively by an altered neurotransmission
of the corticomotor projection to the hand, a method that has been physio-
logically validated by invasive recordings of human and animal corticospinal
nerve impulses (Lazzaro, Ziemann, & Lemon, 2008). Although neuroplasti-
city appears to involve diverse cellular processes in the central nervous system
(Nelson & Turrigiano, 2008), in TMS methodology it is operationally
defined as a significant and lasting change in the motor evoked potential
(MEP), evoked by a magnetic pulse, whose amplitude is representative of the
strength of neurotransmission from motor cortex to muscle. A growing
body of evidence (Lazzaro, Ziemann, & Lemon, 2008) indicates that MEPs
from a single TMS pulse best reflect the overall responsiveness of the
382 Tomas Ros and John H. Gruzelier

corticospinal pathway, or corticospinal excitability (CSE), whereas those
originating from paired pulses (with interstimulus intervals of milliseconds)
enable the discrimination of intracortical mechanisms, such as short intra-
cortical inhibition (SICI) and facilitation (ICF), which are modulated by
transynaptic neurotransmission (Ziemann, 2004).
Our initial hypothesis was that NFB-induced alpha (8�12 Hz) rhythm
desynchronization, generally considered a marker of cortical activation
(Neuper, Wortz, & Pfurtscheller, 2006), would enhance both corticosp-
inal excitability and intracortical facilitation, while effecting a reduction in
intracortical inhibition. Conversely, low beta (“SMR”, 12�15 Hz) syn-
chronization, which has been associated with cortical deactivation (Oishi
et al., 2007), sleep spindles (Sterman, 1996), and GABAergic function
(Jensen et al., 2005), was expected to induce an opposite corticospinal
and intracortical pattern. Although endogenous oscillations have thus far
been implicated in many “on-going” functions such as binding and atten-
tion (Schroeder & Lakatos, 2009), explicit evidence is still scarce on their
role, if any, in neuroplasticity (Axmacher, Mormann, Fernandez, Elger, &
Fell, 2006). We therefore postulated that, in line with previous stimulation
research, the more pronounced as well as persistent the oscillatory patterns
would prove to be during NFB, the more substantial and long-lasting
(plastic) would turn out to be their after effects.
METHODS
ParticipantsTwenty-four healthy participants (12 women, age 31 6 5 years), all with
normal or corrected-to-normal visual acuity, participated in the experi-
ment. All were recruited via the participants’ database of the Department
of Psychology, University College London, and were naive to the neuro-
feedback protocols used in this study. Experimental procedures were
approved by the local ethics committee and in accordance with the
Declaration of Helsinki.
Study DesignSubjects were randomly allocated to two protocol groups for a single 30 min-
ute NFB session: alpha suppression (N5 12) or low beta enhancement
(N5 12). For the purpose of testing hypotheses concerning protocol-
specific effects on target EEG frequency components, subjects underwent
resting EEG recordings for 3 minutes immediately before and after their
383Immediate Effects of EEG Neurofeedback on Cortical Excitability and Synchronization

NFB training session. In order to test the hypotheses concerning the pro-
tocol-specific effects on corticospinal excitability (CSE), TMS motor
evoked potential (MEP) responses were collected before (pre ) and twice
after (post 1, post 2) each NFB session, consecutively at right and left hand
muscles.
Neurofeedback (NFB)Apparatus and EEG AnalysisEEG signals were recorded using a NeXus-10 DC-coupled EEG amplifier
using a 24-bit A�D converter (MindMedia, The Netherlands), and visual
NFB training was carried out with the accompanying Biotrace1 software
interface on an Intel DualCore computer with a 15-inch screen. The EEG
used for feedback was sampled at 256 Hz with Ag/Cl electrodes at the
right first dorsal interosseous muscle (FDI) cortical representation/“hot
spot” (approx. C3) referenced to the contralateral mastoid. The scalp area
was carefully scrubbed with NuPrep abrasive gel, followed by application
of Ten20 electrode paste. The ground electrode was placed on the right
arm. The signal was IIR bandpass filtered to extract alpha (8�12 Hz) and
low beta (12�15) amplitudes (μV peak-peak) respectively with an epoch
size of 0.5 seconds. In the same way EEG was co-registered at the left FDI
representation (approx. C4) referenced to its contralateral mastoid. IIR
digital filtered (Butterworth 3rd order) EEG amplitude data of each band
(delta (1�4 Hz), theta (4�7 Hz), alpha (8�12 Hz), low beta (12�15 Hz),
beta (15�25 Hz), high beta (25�40 Hz), low gamma (40�60 Hz), and
high gamma (60�120 Hz) were then exported at 32 samples/second and
voltage-threshold artifacted for ocular, head movement, and EMG con-
tamination. Outlying data points were rejected at .3 standard deviations
using histogram analysis. Moreover, the Fast Fourier Transform (FFT) of
raw (256 samples/sec) data was used in the calculation of mean frequency for
each band. Averages of all measures were computed offline for 3 minute
epochs, each defined as a training “period”. Periods 1 and 12 consisted of
feedback-free pre- and post-resting EEG measurements in the eyes-open
condition. Periods 2�11 consisted of feedback training.
Neurofeedback Training ProceduresThe ALPHA group aimed to suppress absolute alpha (8�12 Hz) amp-
litude, while the BETA group aimed to elevate absolute low beta ampli-
tude (12�15 Hz). Accordingly, reward thresholds were set to be either
30% of the time above or below the initial alpha or low beta mean
384 Tomas Ros and John H. Gruzelier
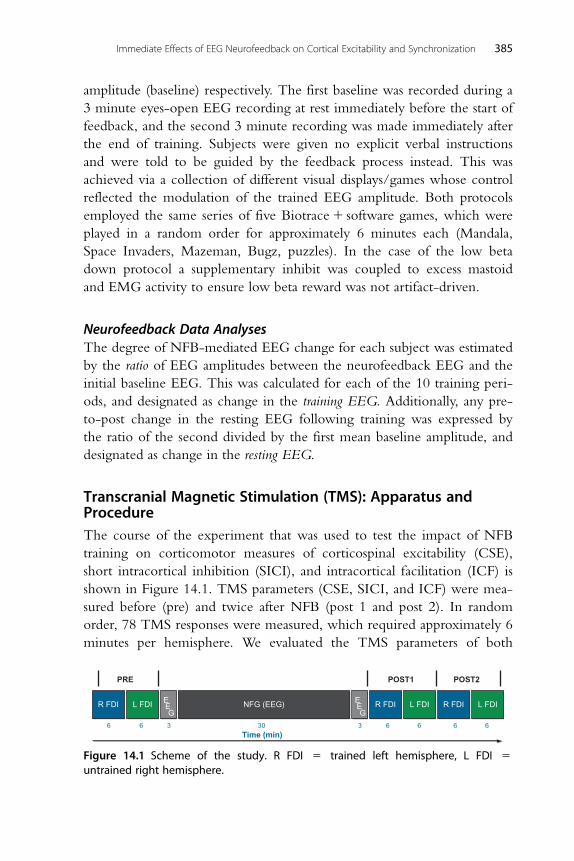
amplitude (baseline) respectively. The first baseline was recorded during a
3 minute eyes-open EEG recording at rest immediately before the start of
feedback, and the second 3 minute recording was made immediately after
the end of training. Subjects were given no explicit verbal instructions
and were told to be guided by the feedback process instead. This was
achieved via a collection of different visual displays/games whose control
reflected the modulation of the trained EEG amplitude. Both protocols
employed the same series of five Biotrace1 software games, which were
played in a random order for approximately 6 minutes each (Mandala,
Space Invaders, Mazeman, Bugz, puzzles). In the case of the low beta
down protocol a supplementary inhibit was coupled to excess mastoid
and EMG activity to ensure low beta reward was not artifact-driven.
Neurofeedback Data AnalysesThe degree of NFB-mediated EEG change for each subject was estimated
by the ratio of EEG amplitudes between the neurofeedback EEG and the
initial baseline EEG. This was calculated for each of the 10 training peri-
ods, and designated as change in the training EEG. Additionally, any pre-
to-post change in the resting EEG following training was expressed by
the ratio of the second divided by the first mean baseline amplitude, and
designated as change in the resting EEG.
Transcranial Magnetic Stimulation (TMS): Apparatus andProcedureThe course of the experiment that was used to test the impact of NFB
training on corticomotor measures of corticospinal excitability (CSE),
short intracortical inhibition (SICI), and intracortical facilitation (ICF) is
shown in Figure 14.1. TMS parameters (CSE, SICI, and ICF) were mea-
sured before (pre) and twice after NFB (post 1 and post 2). In random
order, 78 TMS responses were measured, which required approximately 6
minutes per hemisphere. We evaluated the TMS parameters of both
R FDI
PRE
Time (min)6 6 3 30 3 6 6 6 6
POST1 POST2
R FDIR FDIL FDI L FDI L FDIEEG
EEG
NFG (EEG)
Figure 14.1 Scheme of the study. R FDI 5 trained left hemisphere, L FDI 5untrained right hemisphere.
385Immediate Effects of EEG Neurofeedback on Cortical Excitability and Synchronization

hemispheres, first left (trained) and then right (untrained) hemisphere, to
investigate hemispheric effects of NFB. The post 1 measurement was per-
formed circa 3�15 minutes after NFB training, and post 2 after 15�27
minutes. Well-established standard TMS paradigms were used to measure
the corticospinal and intracortical parameters (Lazzaro, Ziemann, &
Lemon, 2008). All measurements were carried out with two monophasic
Magstim 200 magnetic stimulators (Magstim, Whitland, UK), which were
connected with a “Y-cable” to a 70 mm figure-of-eight coil. We deter-
mined the cortical representation of the first dorsal interosseous muscles
(FDI) for each hemisphere separately. The coil was placed flat on the skull
with the handle pointing backward and rotated about 45� away from the
midline. Resting motor threshold (RMT) intensity was defined as the low-
est stimulator output intensity capable of inducing motor evoked potentials
(MEPs) of at least 50 μV peak-to-peak amplitude in the FDI muscle in at
least half of 10 trials. Active motor threshold (AMT) was defined as the
intensity needed to evoke an MEP of about 200 mV during a 5�10% max-
imum voluntary contraction. Corticospinal excitability (CSE) was quanti-
fied by the amplitude of the motor evoked potential (MEP) elicited by a
single test TMS pulse. The test pulse intensity was set to yield an average
MEP amplitude of 1 mV at baseline (pre), and was kept constant through-
out the experiment. Short latency intracortical inhibition and intracortical
facilitation (SICI and ICF) were evaluated using the paired pulse protocol
developed by Kujirai et al. (1993). In random trials the test pulse was pre-
ceded by a subthreshold conditioning pulse (80% AMT) with an interstim-
ulus interval (ISI) of 2, 3, 10 or 12 ms. The test response was suppressed
(SICI) at ISI5 3 ms; whereas facilitation occurred at ISI5 10 and 12 ms
(ICF5mean of both time points). A run consisted of 78 stimuli given at
approximately 0.25 Hz, where 48 paired-pulse (12 for each ISI) and
30 single-pulse MEPs were recorded. Single-pulse MEP amplitudes were
normalized respectively as post 1 divided by pre, and post 2 divided by pre.
For SICI and ICF the amplitude of the conditioned response was expressed
as a percent of the amplitude of the test response alone. Ratios ,1 indicate
inhibition, whereas ratios .1 indicate facilitation.
Electromyographic Measures and AnalysisSurface electromyographic (EMG) recordings were made using a belly-
tendon montage with Ag/AgCl-plated surface electrodes (9 mm diame-
ter). Raw EMG signal was amplified and filtered using Digitimer D150
386 Tomas Ros and John H. Gruzelier

amplifiers (Digitimer Ltd, Welwyn Garden City, Herts, UK), with a time
constant of 3 ms and a low-pass filter of 3 kHz. Signals were recorded via
a CED 1401 laboratory interface (Cambridge Electronic Design Ltd,
Cambridge, UK) and stored on a PC for later analysis using a sampling
rate of 5 kHz.
Statistical AnalysesAll statistical procedures were two-tailed with significance set at α5 0.05.
Protocol group EEG differences were examined with a GROUP3
PERIODS (23 11) repeated measures ANOVA, from period 1 (baseline)
to period 11. Within-group EEG was assessed by a one-way ANOVAwith
PERIODS as a repeated measures factor; post hoc Dunnett’s test was used
to detect significant changes from the baseline rest period. TMS measures
of CSE, SICI, and ICF for each hemisphere were subjected to a
GROUP3TIME (23 3) repeated measures ANOVA; Greenhouse�Geisser correction was used where necessary. Subsequent to reliable main
effects, planned comparisons were conducted by Bonferroni corrected
t-tests for long-term (.20 min) changes after NFB (post 2 � pre). A
regression analysis was performed between normalized EEG (% baseline)
vs. normalized TMS parameters (% baseline), as well as between training
vs. resting EEG (% baseline). With regards to the weighted least squares
(WLS) regression analysis, the reciprocal variance of the relevant training
period amplitude (32 samples/sec) was used as each subject’s weighting fac-
tor. Statistical analyses and structural equation modelling (SEM) were
respectively carried out with SPSS 15.0 and Amos v7.0 (SPSS Inc.,
Chicago, IL, USA). For SEM we used maximum-likelihood estimation as
well as bootstrapping (2000 samples, with a 95% bias-corrected confidence
level). The final indirect model was also verified by an automatic specifica-
tion search in the software. Chi-square (CMIN) and baseline fit measures
(e.g. NFI) were used to estimate relative goodness-of-fit, along with parsi-
mony measures (e.g. PNFI).
RESULTS
One-Way ANOVAs did not disclose any statistically significant differences
(p ,0.05) between protocol groups neither for age nor baseline measures
of EEG band power (delta to high gamma), or TMS measures (RMT, sin-
gle-pulse MEP, 3 ms SICI, and ICF) in either the trained or untrained
hemispheres.
387Immediate Effects of EEG Neurofeedback on Cortical Excitability and Synchronization

NFB Training DynamicMean alpha and low beta amplitude during each 3 minute period of the
neurofeedback training session is depicted in Figure 14.2, for the ALPHA
and BETA groups respectively for each hemisphere. Period 1 denotes the
eyes-open, feedback-free, baseline at rest. Mean ALPHA-group amplitude
for the trained hemisphere exhibited a general decrease from baseline
(9.08) to period 11 (8.50), with a minimum at 15�18 minutes, or period
7 (7.93, t115 4.0, p5 0.002), in line with training direction, and largely
paralleled by the contralateral hemisphere. Paired t-test comparisons of
baseline with period means revealed a significant reduction (p ,0.05) for
all periods except periods 3, 9, and 11. For the BETA-group, whose aim
on the other hand was to increase low beta, mean amplitude became sta-
tistically higher than baseline (5.95), uniquely between 24 and 27 min-
utes, or period 10 (6.62, t11522.4, p5 0.034). No significant increases
were observed in the contralateral hemisphere.
Across periods, within-subject EEG amplitude correlations between
theta, alpha, low beta, and high beta EEG band pairs during training were
consistently positive at the p ,0.01 level, within a range of 0.5 , r ,0.9.
In other words, amplitude increases/decreases in all EEG bands ,25 Hz
covaried in parallel with each other. Furthermore, for the ALPHA group,
high gamma mean frequency (60�120 Hz) was inversely correlated with
alpha amplitude during training (r520.25, p ,0.01). No significant
online associations were detected between EEG bands and direct current
9.2 LH (trained)RH (untrained)
(a)
9.0
8.8
8.6
Mea
n al
pha
ampl
itude
(µV
)
8.4
8.2
8.0
7.8
1rest
2 3 4 5
*
* *
***
*
6
NFB training period
7 8 9 10 11
6.8 LH (trained)RH (untrained)
(b)
6.5
6.2
Mea
n lo
w b
eta
ampl
itude
(µV
)
6.0
5.8
1rest
2 3 4 5*
6
NFB training period
7 8 9 10 11
Figure 14.2 Time-course of the mean training EEG amplitudes for (a) ALPHA and (b)BETA groups, during a session of neurofeedback. Each session began with a 3-minbaseline at rest (period 1), followed by 30 min of EEG feedback training (periods2�11) on the left hemisphere (LH). * denote periods significantly different from base-line. Error bars represent SEM.
388 Tomas Ros and John H. Gruzelier

(DC) shifts, although the latter exhibited a negative correlation with
period number (r5 2 0.31, p ,0.01) in the ALPHA group.
TMS Main EffectsA GROUP 3 TIME (2 3 3) repeated measures ANOVA for the
trained hemisphere CSE revealed a main TIME effect of significance for
CSE (F(2,44)5 6.8, p , 0.01) and SICI (F(2,44)524.3, p5 0.03),
while insignificant for ICF (F(2,44)5 1.6, p5 0.2). Interaction effects
were not significant. No significant main effects were detected for the
untrained hemisphere. Figure 14.3(a) depicts the mean effect of alpha sup-
pression NFB training on corticospinal excitability (CSE) in the trained
hemisphere. Single-pulse MEP amplitudes were significantly increased at
post 2 compared to pre (130%, t11522.6, p5 0.025), or circa 20 min-
utes after termination of NFB training. For the untrained hemisphere a
similar albeit non-significant increase in MEP amplitudes was found
post 2 (135%, t11521.691, p5 0.12). Interestingly, no facilitatory effects
were found just after (,10 min) NFB in the trained hemisphere (post 1),
while an intermediate enhancement of 115% became manifest at around
10 minutes in the untrained hemisphere (Figure 14.3b, post 1, n.s.). A
reliable trained hemisphere within-subject correlation between testing
order (pre, post 1, post 2) and MEP amplitude was also detected
(r5 0.43, p , 0.01). As detailed in Figure 14.4(a), we observed a signifi-
cant and sustained decrease of intracortical inhibition (SICI 3 ms) at post
Am
plitu
de o
f ME
P (
mV
)
2.0 *
1.5
1.0
0.5
0.0Pre Pre5–10
Alpha(a) Beta
15–20 min 5–10 5–10 min
Am
plitu
de o
f ME
P (
mV
)
2.0
1.5
1.0
0.5
0.0Pre Pre5–10
Alpha(b) Beta
15–20 min 5–10 5–10 min
Figure 14.3 Mean corticospinal excitability (CSE) of (a) trained (left) hemisphere, and(b) untrained (right) hemisphere following the ALPHA and BETA protocols at timespost 1 and 2. Error bars represent SEM.
389Immediate Effects of EEG Neurofeedback on Cortical Excitability and Synchronization

1 and post 2 uniquely in the trained hemisphere (post 1: 174%, t115
23.5, p ,0.01; post 2: 165%, t11522.6, p5 0.023). No other intracor-
tical parameters were significantly altered following ALPHA protocol
training.
As can be seen in Figure 14.3 depicting corticospinal excitability, no
significant differences in CSE were found following low beta enhance-
ment, although an initial decrease followed by increase was seen in both
hemispheres at post 1 and post 2, respectively. No significant changes in
SICI were observed in the trained (Figure 14.4a) or untrained hemisphere
(Figure 14.4b).
TMS�EEG RelationshipsCorticospinal Excitability (CSE)Effective NFB training for each subject was defined by a training coeffi-
cient, or the Pearson correlation between the period number (1 to 11)
and its corresponding mean EEG amplitude (alpha and low beta ampli-
tude, for ALPHA and BETA groups respectively). This has previously
(Gruzelier & Egner, 2005) proven to be a good estimator of the temporal
consistency of either an increase or a decrease in the training EEG ampli-
tude from baseline, which can be expressed in the range of 21 (steady
decrease) and 11 (steady increase).
% o
f con
trol
ME
P
60 *
50
40
30
20
10
0Pre 5–10
Alpha(a)15–20 min Pre 5–10
Beta
15–20 min%
of c
ontr
ol M
EP
60
50
40
30
20
10
0Pre 5–10
Alpha(b)15–20 min Pre 5–10
Beta
15–20 min
Figure 14.4 Mean short intracortical inhibition (SICI) of (a) trained (left) hemisphere,and (b) untrained (right) hemisphere following the ALPHA and BETA protocols attimes post 1 and 2. Higher values signify lower SICI (disinhibition). Error bars repre-sent SEM.
390 Tomas Ros and John H. Gruzelier

As depicted in Figure 14.5a, a scatter plot of alpha training coefficient
vs. post 2 MEP amplitude for the ALPHA group revealed a significant
negative correlation (r520.59, p5 0.044), meaning that in general
greater temporal consistency of alpha decrease from baseline is associated
with greater increase in corticospinal excitability. Moreover, a parallel posi-
tive correlation was observed between high gamma mean frequency
(60�120 Hz) training coefficient and MEP post 2 (r5 0.62, p5 0.031).
No significant correlations were evident at post 1 (r520.32, n.s.). For
the BETA protocol (Figure 14.5b), the correlation between reliable low
beta synchronization and direction of MEP change was similarly negative
at post 1, albeit less robust (r520.53, p5 0.08; weighted least-squares
(WLS) regression r520.62, p5 0.03). This relationship was absent at
post 2 (r520.25, n.s.).
Regarding the relation between TMS changes and absolute EEG para-
meters, first, no reliable relationships were evident between MEP change
and absolute EEG amplitudes in any band, during any period of the
neurofeedback session. However, when the EEG amplitudes were nor-
malized as a percentage of their 3-min baseline value at rest (period 1),
strong associations appeared, signalling that a change in the EEG was
closely coupled to a change in MEP. Figure 14.6 illustrates the Pearson
cross-correlation value between the post 2 MEP amplitude (outcome vari-
able) and normalized alpha amplitude of each period (predictor variable)
during neurofeedback in the ALPHA group. As anticipated, we observed
mainly negative correlations between alpha power and MEP increase,
with a gradual trend of increasing significance from the beginning of the
session that reached a maximum at around the middle of the session,
(a)
60
–1.0 –0.5
Alpha training coefficient
r = –0.6
0.0 0.5 1.0
80
100
120
140
160
Mea
n M
EP
(%
T0) 180
200
220
(b)
40
–0.2 0.0
Low alpha training coefficient
0.2 0.5 0.8 1.0
60
80
100
120
140
160
Figure 14.5 Scatter plots of each subject’s (N 5 12) training coefficient vs. meansingle-pulse MEP change for (a) ALPHA group at post 2 and (b) BETA group at post 1.
391Immediate Effects of EEG Neurofeedback on Cortical Excitability and Synchronization

during periods 7 (r520.61, p5 0.35) and 8 (r520.63, p5 0.30), or
between 15 and 21 minutes of neurofeedback. Interestingly, period 7 also
coincided with the minimum alpha amplitude during training (see Figure
14.2a).
The EEG amplitude ratio of the post-neurofeedback resting baseline
and the pre-baseline (period 12/period 1) proved to be another successful
predictor of post 2 MEP change in all bands investigated below high beta
(delta: r520.64, p 5 0.03; theta: r520.7, p5 0.012; alpha: r520.71,
p5 0.01; low beta: r520.62, p5 0.03), suggesting that the more sup-
pressed the slower EEG amplitudes were after NFB training the greater
the enhancement of the MEP 20 minutes later. This also appeared to be
positively the case for resting change in the high gamma mean frequency
(r5 0.53, p5 0.07). Lastly, during periods 8, 9, and 10 correlations
remained significantly positive (r . 0.6, p , 0.05) and predicted resting
alpha amplitude change from training alpha amplitudes.
As seen in Figure 14.7, the overall implication is that a three-way sig-
nificant association was thus established between core changes in the
training EEG, the subsequent resting EEG, and corticospinal excitability.
Analogous analyses were performed on the BETA group for relation-
ships between single-pulse MEP and low beta amplitudes, disclosing a
0.2
0.0
–0.2
–0.4
–0.6p = 0.05
–0.8
2 3 4 5 6
NFB training period
Nor
mal
ized
ME
P -
alp
ha a
mpl
itude
cor
rela
tion
7
* *
8 9 10 11
Figure 14.6 Post 2 MEP (%pre) vs. alpha amplitude (%pre) correlations, for all ALPHAperiods.
392 Tomas Ros and John H. Gruzelier

significant association similar to that found with ALPHA between resting
low beta change and post 1 MEP (WLS r520.58, p5 0.050) as well as a
borderline correlation between training period 7 and post 1 MEP (WLS
r520.52, p5 0.08). Low beta amplitude during period 7 was in turn
also tightly correlated with its subsequent change at rest (WLS r5 0.67,
p5 0.02), mirroring closely but less reliably, the three-way relationship
reported for the ALPHA group. No significant associations were observed
between MEP and the remaining EEG bands in the BETA group (e.g.
resting alpha vs. MEP post 1: WLS r520.17, p5 0.60).
In summary, pre-to-post increases in corticomotor excitability were
positively (negatively) correlated with both the sustained time-course and
relative degree of desynchronization (synchronization) of alpha and low
beta rhythms.
SICI/ICFFor the ALPHA group, there was significant positive correlation
(r5 0.58, p5 0.050) between alpha training coefficient and 3 ms SICI (%
pre) change at post 1, suggesting that it was the weakest performers that
had the greatest reductions in SICI. However, relatively robust correla-
tions were discovered for the DC training coefficient and SICI post 1
(r520.6, p5 0.04), SICI post 2 (r520.53, p5 0.07), and ICF post 2
(r5 0.79, p, 0.01). Moreover ICF post 2 (but not post 1) change was
Train alpha (% T0) Rest alpha (% T0)
ME
P T
2 (%
T0)
rest
alp
ha (
% T
0)
Figure 14.7 Matrix plot of training alpha (period 8 %pre), resting alpha (period12 %pre), MEP (post 2 %pre) amplitudes. All correlations were significant at r . j0.6j,p ,0.05.
393Immediate Effects of EEG Neurofeedback on Cortical Excitability and Synchronization

inversely proportional with SICI at post 1 (r5 0.63, p5 0.03) and post 2
(r5 0.72, p ,0.01), suggesting that SICI decreases may have preceded
ICF increases. No significant links were apparent for the BETA group;
however, negative associations of marginal statistical significance were
observed between ICF at post 1 and the low beta training coefficient
(r520.51, p5 0.09) and resting (period 12) low beta amplitude
(r520.52, p5 0.08). Resting alpha amplitude (in the BETA group) was
uncorrelated (r5 0.14, p5 0.67).
Path AnalysisTo investigate the possible causal relationships between training EEG, rest-
ing EEG, and MEP amplitudes, we conducted a path analysis of the
three-way correlates linking these variables from our experimental data.
Figure 14.8 shows the Path Analysis results for ALPHA training during
period 7 and MEP at post 2, mirroring Figure 14.7. For ALPHA group
training periods 6, 7, 8, and 9, regression coefficients were consistently
higher (r . 0.5) in the Path Analysis for the two indirect pathways (dark
gray) of training EEG to resting EEG, and resting EEG to MEP, com-
pared to the direct pathway (light gray) of training EEG to MEP (r , 0.5)
as shown in Figure 14.8. Accordingly, a bootstrap test (see Methods for
Train EEG
Rest EEG
MEP–.28
–.53.65
e2
e1
Figure 14.8 Path Analysis of the hypothesized causal relationship between observedtraining EEG, subsequent resting EEG and corticospinal excitability (MEP) measures.Here, the indirect pathway (dark gray arrows) emerges as a better predictor of the train-ing EEG effect on MEP than the direct pathway (light gray arrow). ALPHA group stan-dardized regression coefficients are illustrated for normalized training alpha (period 7),resting alpha (second baseline), and single-pulse MEP amplitudes at post 2 in thetrained hemisphere. Unobserved residual (error) variables are denoted by e1 and e2.
394 Tomas Ros and John H. Gruzelier

details) revealed a statistically significant (p , 0.05) indirect effect of train-
ing EEG on MEP, mediated via the resting EEG change. Moreover, dele-
tion of the training EEG to MEP direct pathway resulted in a better-fit
(chi-square5 1.1, df5 1, p5 0.3) and greater parsimony (change in
PNFI5 0.31). We then applied this final model to the BETA group rela-
tionships described above (low beta amplitude period 6 vs. MEP post 1),
which turned out analogous to the ALPHA group, confirming a good-fit
mediation model (chi square5 0.4, df5 1, p5 0.5), with the indirect
effect having a marginal bootstrap significance of p5 0.08.
Overall, these modeling results suggest that the general NFB effect
may be better explained by its action on the resting/spontaneous EEG,
which is in turn a more direct reflection of cortical excitability.
DISCUSSION
In summary, sustained neurofeedback-mediated EEG changes in the
ALPHA group (Figure 14.2a) resulted in a statistically reliable (.20 min)
overall increase in corticospinal excitability (130%) (Figure 14.3a) and
decrease in short intracortical inhibition (174%) (Figure 14.4a), when
compared to the negligible longer-lasting changes in the BETA group
which showed less evidence of learning. Most importantly, correlation
analyses revealed robust relationships between the historical activity of
certain brain rhythms during neurofeedback and the resultant change in
corticospinal excitability. Specifically during neurofeedback, alpha
(8�12 Hz) desynchronization (Figure 14.5a) coupled with increased
mean frequencies of high gamma rhythms (60�120 Hz), was tightly cor-
related with long-term potentiation-like (.20 min) enhancement of sin-
gle-pulse motor evoked potentials. In contrast, neurofeedback involving
low beta (12�15 Hz) synchronization was inversely correlated with short-
term depression-like (.5 min) reductions of corticospinal excitability
(Figure 14.5b). Thirdly, in both groups, changes in resting EEG ampli-
tudes were predicted by the neurofeedback training EEG, and were also a
predictor of the later motor evoked potential amplitudes (Figure 14.7).
In this experiment, the longer-term neuroplastic effects following
alpha desynchronization are highly unlikely to be consequences of basic
changes in psychological arousal after neurofeedback, as the within-
subject motor evoked potential data denotes a significant positive correla-
tion between amplitude and elapsed time following training, while the
395Immediate Effects of EEG Neurofeedback on Cortical Excitability and Synchronization

reverse would be otherwise expected (moreover, the BETA group did not
demonstrate equivalent changes, discounting the likelihood of a placebo
effect). Bearing in mind that neuroplastic induction may have already
begun mid-session (see Figure 14.6, where correlations are highest around
20 min), such a progressive dynamic could also be suggestive of a time
course involving cellular cascades known to occur during early long-term
potentiation (Cooke & Bliss, 2006). In contrast, short-term potentiation
amplitudes are markedly extinguished by 15�20 min (Schulz &
Fitzgibbons, 1997). A reduction in alpha band power has commonly been
found to be associated with increased cortical excitability (Sauseng,
Klimesch, Gerloff, & Hummel, 2009), cortical metabolism (Oishi et al.,
2007), attention (Fries, Womelsdorf, Oostenveld, & Desimone, 2008),
and behavioral activation (Rougeul-Buser & Buser, 1997). Critically, in
the current study a negative correlation between low-end frequencies
(especially alpha) and high gamma mean frequencies during neurofeed-
back was also detected, as well as a positive correlation between the latter
and single-pulse MEP increase. This is supported by recent reports linking
high-frequency oscillations (HFO) or higher gamma activity with learning
(Ponomarenko, Li, Korotkova, Huston, & Haas, 2008) and attention
(Fries, Womelsdorf, Oostenveld, & Desimone, 2008), as well as with
increased BOLD activity (Niessing et al., 2005), neuronal depolarization
and firing rate (Grenier, Timofeev, & Steriade, 2001; Niessing et al.,
2005). Interestingly, the ALPHA group reduction in short intracortical
inhibition at post 1 and 2 may be attributed to a decrease in cortical
GABAergic transmission (Hallett, 2007). This could possibly be the sys-
tem’s intrinsic reaction in order to further facilitate plasticity, as previous
reports have found an antagonistic relationship between inhibitory and
excitatory transmission on motor plasticity and long-term potentiation
(Butefisch et al., 2000; Komaki et al., 2007). At present, however, we can
neither confirm nor rule out the release of endogenous neuromodulators
as an interacting mechanism for the observed effects. One potential candi-
date may be noradrenaline, which is released during attentive behavior
(Berridge & Waterhouse, 2003; Rougeul-Buser & Buser, 1997) and has
previously been reported to enhance long-term potentiation (Harley,
1987), desynchronize alpha rhythms (Rougeul-Buser & Buser, 1997), and
increase corticospinal excitability and decrease short intracortical inhibi-
tion concomitantly (Ziemann, 2004).
As low beta learning was less effective it is possible that it was associ-
ated with an inappropriate training approach in some subjects which was
396 Tomas Ros and John H. Gruzelier

perhaps more desynchronizing than synchronizing, and therefore con-
founded the group result; hence the slightly increased corticospinal excit-
ability observed later on. This is supported by the negative correlations
found between low beta training and MEP, which remain in line with
findings that low beta synchronization is associated with motor-
cortical deactivation (Oishi et al., 2007) and inhibition (Zhang, Chen,
Bressler, & Ding, 2008). The finding that electrical stimulation of sensori-
motor cortex at 10 Hz leads to long-term depression (Werk, Klein,
Nesbitt, & Chapman, 2006) may be related to the short-term depression-
like effect observed in this study at a slightly higher, albeit correlated, fre-
quency of 12�15 Hz. Moreover, it has recently been observed that longer
durations of 10 Hz repetitive TMS lead to long-term depression-like
effects (Jung, Shin, Jeong, & Shin, 2008).
It is tempting to compare the average effect sizes in this study with
those of existing non-invasive brain stimulation protocols used to induce
neuroplasticity. Repetitive magnetic (Ziemann et al., 2008) and direct
current (Nitsche & Paulus, 2001) stimulation investigations report average
corticospinal excitability increases of around 150%, which is comparable
to the range we observed following alpha desynchronization. Remarkably,
this may indicate that regardless of whether endogenous or exogenous
techniques are used, they appear to impact on a common neural substrate,
which is intrinsic to the brain. However, numerous exogenous protocols
induce after effects that last for periods up to an hour or more. Therefore
a question of scientific and therapeutic importance is, how long can
endogenously driven effects last?
Another intriguing question is whether the observed plasticity effects
are a direct consequence of longer-term changes to the dynamics of “rest-
ing” or spontaneous rhythms (Sauseng et al., 2009), and associated
thalamocortical networks (Steriade & Timofeev, 2003; Thut & Miniussi,
2009). This seems a tempting account in light of the significant three-way
correlations between amplitude changes in training EEG, subsequent rest-
ing EEG, and the motor evoked potential (Figure 14.7). Moreover, path
analysis and structural equation model results (Figure 14.8) point to an
indirect effect of neurofeedback (via the resting EEG) on the single-pulse
motor evoked potential. If ultimately confirmed, this would suggest that
the brain indeed “shapes itself ” (Rudrauf, Lutz, Cosmelli, Lachaux, & Le
Van Quyen, 2003), whereby past activities perpetually influence or bias
future (baseline) states of processing (Silvanto, Muggleton, & Walsh,
2008). In this case, the notion of a “background” or baseline brain state
397Immediate Effects of EEG Neurofeedback on Cortical Excitability and Synchronization

would cease to be informative, as it would be continually in flux and
shaped by past/present activity. We hope that future studies will elucidate
these complex activity-dependent relationships further.
The novel finding that short intracortical inhibition was positively cor-
related with slow shifts in DC potential are compatible with the estab-
lished view that slow cortical negativities are a marker of increased
excitability and/or cortical disinhibition (Niedermayer & Lopes Da Silva,
1999). As this was for the ALPHA group only, this relationship awaits rep-
lication, and supports the online/offline use of TMS full-band EEG co-
registration. The lack of relation of paired-pulse or DC measures with
oscillatory EEG in this study is especially noteworthy. The latter effect has
been documented previously and may suggest physiologically separate
mechanisms of action (Kotchoubey, Busch, Strehl, & Birbaumer, 1999).
We have to acknowledge that our recording conditions were suboptimal,
as we did not additionally short-circuit the skin (Vanhatalo, Voipio, &
Kaila, 2005); although random fluctuations of skin/sweat voltages would
be unlikely to account for this phenomenon. Overall our results remain
consistent with traditional evidence from both cellular and non-invasive
studies reporting that very high frequency stimulation usually induces syn-
aptic potentiation whereas lower frequencies may engender synaptic
depression (Cooke & Bliss, 2006). It is well-established that EEG activity
is generated by the summed electrical fluctuations of postsynaptic poten-
tials (Niedermayer & Lopes Da Silva, 1999), and so may potentially be a
close correlate of changes in synaptic transmission frequency or dendritic
activity (Williams, Wozny, & Mitchell, 2007). Higher frequencies could
reflect denser temporal incidence of EPSPs and hence greater influx of
calcium (a trigger of long-term potentiation) through voltage-gated ion
channels (Na1 , Ca21 ). Intracellularly, second messengers such as Cam
Kinase II have also been found to be sensitive to the frequency of calcium
oscillations (De Koninck, 1998). On the other hand, a recent study
observed that zero net-current extracellular high-frequency stimulation in
cultured neurons gave rise to an overall depolarization of the cell mem-
brane (Schoen & Fromherz, 2008), which could hypothetically lower
activation thresholds for voltage-gated ion channels. However, our data
did not reveal significant changes in the resting motor threshold (consid-
ered to reflect changes in membrane excitability), making a case for a
transynaptic effect more likely. On the whole, the activity-dependent rela-
tionships observed in this study, together with the cited works above,
vouch for the possible involvement of endogenous oscillations in the
398 Tomas Ros and John H. Gruzelier

mediation of synaptic plasticity (Steriade & Timofeev, 2003). Latest find-
ings that appear to support this role report neuroplasticity induction based
on slow-wave sleep, sleep spindle (Rosanova & Ulrich, 2005), and theta
(Huang, Edwards, Rounis, Bhatia, & Rothwell, 2005) endogenous
rhythms.
In light of the initial neurophysiological evidence presented in this
study, a repetitive alpha suppression protocol could theoretically be of sig-
nificant therapeutic value in clinical cases where the pathophysiology con-
sists of poor corticospinal activation and/or increased inhibition; in a
motor disorder such as stroke, for example. Moreover, as other methods
of neuromodulation are reported to facilitate motor learning by inducing
increases in cortical excitability (Ziemann et al., 2008), this particular pro-
tocol may be potentially useful in enhancing practice-dependent motor
performance in healthy subjects (Ros et al., 2009). Lastly, whilst addition-
ally supporting previous clinical applications of neurofeedback (Heinrich,
Gevensleben, & Strehl, 2007), a similar NFB approach aimed at cortical
activation may eventually prove to be appropriate for brain disorders exhi-
biting low cortical excitability or elevated slow-wave EEG power, such as
attention-deficit hyperactivity disorder (ADHD) (Lubar, 1991), traumatic
brain injury (Thatcher, 2000), and depression (Korb, Cook, Hunter, &
Leuchter, 2008).
In conclusion, our results provide a first basis for the “missing link”
between the historical long-term training effects of neurofeedback and
direct validation of neuroplastic change after an individual session of
training.
REFERENCESAxmacher, N., Mormann, F., Fernandez, G., Elger, C. E., & Fell, J. (2006). Memory for-
mation by neuronal synchronization. Brain Research Reviews, 52(1), 170�182.Berridge, C., & Waterhouse, B. (2003). The locus coeruleus-noradrenergic system:
Modulation of behavioral state and state-dependent cognitive processes. Brain ResearchReviews, 42, 33�84.
Butefisch, C. M., Davis, B. C., Wise, S. P., Sawaki, L., Kopylev, L., Classen, J., et al.(2000). Mechanisms of use-dependent plasticity in the human motor cortex.Proceedings of the National Academy of Sciences of the United States of America, 97(7),3661�3665.
Cooke, S. F., & Bliss, T. V. (2006). Plasticity in the human central nervous system. Brain,129(Pt 7), 1659�1673.
De Koninck, P. (1998). Sensitivity of CaM Kinase II to the Frequency of Ca21
Oscillations. Science, 279(5348), 227�230.
399Immediate Effects of EEG Neurofeedback on Cortical Excitability and Synchronization

Doehnert, M., Brandeis, D., Straub, M., Steinhausen, H., & Drechsler, R. (2008). Slowcortical potential neurofeedback in attention deficit hyperactivity disorder: is thereneurophysiological evidence for specific effects? Journal of Neurophysiology, 115(10),1445�1456.
Egner, T., & Gruzelier, J. H. (2004). EEG biofeedback of low beta band components: fre-quency-specific effects on variables of attention and event-related brain potentials.Clinical Neurophysiology, 115(1), 131�139.
Fries, P., Womelsdorf, T., Oostenveld, R., & Desimone, R. (2008). The effects of visualstimulation and selective visual attention on rhythmic neuronal synchronization inmacaque area V4. Journal of Neuroscience, 28(18), 4823�4835.
Grenier, F., Timofeev, I., & Steriade, M. (2001). Focal synchronization of ripples (80-200Hz) in neocortex and their neuronal correlates. Journal of Neurophysiology, 86(4),1884�1898.
Gruzelier, J., & Egner, T. (2005). Critical validation studies of neurofeedback. Child andAdolescent Psychiatric Clinics of North America, 14(1), 83�104, vi.
Gruzelier, J., Egner, T., & Vernon, D. (2006). Validating the efficacy of neurofeedback foroptimising performance. Progress in Brain Research, 159, 421�431.
Hallett, M. (2007). Transcranial magnetic stimulation: a primer. Neuron, 55(2), 187�199.Hanslmayr, S., Sauseng, P., Doppelmayr, M., Schabus, M., & Klimesch, W. (2005).
Increasing individual upper alpha power by neurofeedback improves cognitive perfor-mance in human subjects. Applied Psychophysiology and Biofeedback, 30(1), 1�10.
Harley, C. W. (1987). A role for norepinephrine in arousal, emotion and learning? Limbicmodulation by norepinephrine and the Kety hypothesis. Progress in Neuro-psychopharm-acology and Biological Psychiatry, 11(4), 419�458.
Heinrich, H., Gevensleben, H., & Strehl, U. (2007). Annotation: neurofeedback - trainyour brain to train behaviour. Journal of Child Psychology and Psychiatry, 48(1), 3�16.
Huang, Y., Edwards, M. J., Rounis, E., Bhatia, K. P., & Rothwell, J. C. (2005). Thetaburst stimulation of the human motor cortex. Neuron, 45(2), 201�206.
Jensen, O., Goel, P., Kopell, N., Pohja, M., Hari, R., Ermentrout, B., et al. (2005). Onthe human sensorimotor-cortex beta rhythm: sources and modeling. NeuroImage, 26(2), 347�355.
Jung, S. H., Shin, J. E., Jeong, Y., & Shin, H. (2008). Changes in motor cortical excitabil-ity induced by high-frequency repetitive transcranial magnetic stimulation of differentstimulation durations. Clinical Neurophysiology, 119(1), 71�79.
Komaki, A., Shahidi, S., Lashgari, R., Haghparast, A., Malakouti, S. M., Noorbakhsh, S.M., et al. (2007). Effects of GABAergic inhibition on neocortical long-term potentia-tion in the chronically prepared rat. Neuroscience Letters, 422(3), 181�186.
Korb, A. S., Cook, I. A., Hunter, A. M., & Leuchter, A. F. (2008). Brain electrical sourcedifferences between depressed subjects and healthy controls. Brain Topography, 21(2),138�146.
Kotchoubey, B., Busch, S., Strehl, U., & Birbaumer, N. (1999). Changes in EEG powerspectra during biofeedback of slow cortical potentials in epilepsy. AppliedPsychophysiology and Biofeedback, 24(4), 213�233.
Kujirai, T., Caramia, M. D., Rothwell, J. C., Day, B. L., Thompson, P. D., Ferbert, A.,et al. (1993). Corticocortical inhibition in human motor cortex. Journal of Physiology,471, 501�519.
Lazzaro, V. D., Ziemann, U., & Lemon, R. N (2008). State of the art: Physiology of tran-scranial motor cortex stimulation. Brain Stimulation, 1(4), 345�362.
Levesque, J., Beauregard, M., & Mensour, B. (2006). Effect of neurofeedback training onthe neural substrates of selective attention in children with attention-deficit/hyper-activity disorder: A functional magnetic resonance imaging study. Neuroscience Letters,394, 216�221.
400 Tomas Ros and John H. Gruzelier

Lubar, J. F. (1991). Discourse on the development of EEG diagnostics and biofeedback forattention-deficit/hyperactivity disorders. Biofeedback and Self-Regulation, 16(3),201�225.
Nelson, S. B., & Turrigiano, G. G. (2008). Strength through diversity. Neuron, 60(3),477�482.
Neuper, C., Wortz, M., & Pfurtscheller, G. (2006). ERD/ERS patterns reflecting sensori-motor activation and deactivation. Progress in Brain Research, 159, 211�222.
Niedermayer, E., & Lopes Da Silva, F. (1999). Electroencephalography: Basic principles, clinicalapplications and related fields (4th ed.) Baltimore, MD: Williams & Wilkins.
Niessing, J., Ebisch, B., Schmidt, K. E., Niessing, M., Singer, W., Galuske, R. A., et al.(2005). Hemodynamic signals correlate tightly with synchronized gamma oscillations.Science, 309(5736), 948�951.
Nitsche, M. A., & Paulus, W. (2001). Sustained excitability elevations induced by transcra-nial DC motor cortex stimulation in humans. Neurology, 57(10), 1899�1901.
Oishi, N., Mima, T., Ishii, K., Bushara, K. O., Hiraoka, T., Ueki, Y., et al. (2007). Neuralcorrelates of regional EEG power change. NeuroImage, 36(4), 1301�1312 doi:10.1016/j.neuroimage.2007.04.030
Ponomarenko, A. A., Li, J., Korotkova, T. M., Huston, J. P., & Haas, H. L. (2008).Frequency of network synchronization in the hippocampus marks learning. TheEuropean Journal of Neuroscience, 27(11), 3035�3042 doi: 10.1111/j.1460-9568.2008.06232.x
Ros, T., Moseley, M. J., Bloom, P. A., Benjamin, L., Parkinson, L. A., Gruzelier, J. H.,et al. (2009). Optimizing microsurgical skills with EEG neurofeedback. BMCNeuroscience, 10(1), 87 doi: 10.1186/1471-2202-10-87
Rosanova, M., & Ulrich, D. (2005). Pattern-specific associative long-term potentiationinduced by a sleep spindle-related spike train. Journal of Neuroscience, 25(41),9398�9405 doi: 10.1523/JNEUROSCI.2149-05.2005
Rougeul-Buser, A., & Buser, P. (1997). Rhythms in the alpha band in cats and their beha-vioural correlates. International Journal of Psychophysiology, 26(1�3), 191�203.
Rudrauf, D., Lutz, A., Cosmelli, D., Lachaux, J., & Le Van Quyen, M. (2003). Fromautopoiesis to neurophenomenology: Francisco Varela’s exploration of the biophysicsof being. Biological Research, 36(1), 27�65.
Sauseng, P., Klimesch, W., Gerloff, C., & Hummel, F. C. (2009). Spontaneous locallyrestricted EEG alpha activity determines cortical excitability in the motor cortex.Neuropsychologia, 47(1), 284�288.
Schoen, I., & Fromherz, P. (2008). Extracellular stimulation of mammalian neuronsthrough repetitive activation of Na1 channels by weak capacitive currents on a siliconchip. Journal of Neurophysiology, 100(1), 346�357.
Schroeder, C. E., & Lakatos, P. (2009). Low-frequency neuronal oscillations as instrumentsof sensory selection. Trends in Neurosciences, 32(1), 9�18.
Schulz, P. E., & Fitzgibbons, J. C. (1997). Differing mechanisms of expression for short-and long-term potentiation. Journal of Neurophysiology, 78(1), 321�334.
Silvanto, J., Muggleton, N., & Walsh, V. (2008). State-dependency in brain stimulationstudies of perception and cognition. Trends in Cognitive Sciences, 12(12), 447�454.
Steriade, M., & Timofeev, I. (2003). Neuronal plasticity in thalamocortical networks dur-ing sleep and waking oscillations. Neuron, 37(4), 563�576.
Sterman, M. B. (1996). Physiological origins and functional correlates of EEG rhythmicactivities: implications for self-regulation. Biofeedback and Self-Regulation, 21(1), 3�33.
Thatcher, R. W. (2000). EEG operant conditioning (biofeedback) and traumatic braininjury. Clinical EEG (electroencephalography), 31(1), 38�44.
Thut, G., & Miniussi, C. (2009). New insights into rhythmic brain activity from TMS-EEG studies. Trends in Cognitive Sciences, 13(4), 182�189.
401Immediate Effects of EEG Neurofeedback on Cortical Excitability and Synchronization

Vanhatalo, S., Voipio, J., & Kaila, K. (2005). Full-band EEG (FbEEG): an emerging stan-dard in electroencephalography. Clinical Neurophysiology, 116(1), 1�8.
Wagner, T., Valero-Cabre, A., & Pascual-Leone, A. (2007). Noninvasive human brainstimulation. Annual Review of Biomedical Engineering, 9, 527�565.
Werk, C. M., Klein, H. S., Nesbitt, C. E., & Chapman, C. (2006). Long-term depressionin the sensorimotor cortex induced by repeated delivery of 10 Hz trains in vivo.Neuroscience, 140(1), 13�20.
Williams, S. R., Wozny, C., & Mitchell, S. J. (2007). The back and forth of dendritic plas-ticity. Neuron, 56(6), 947�953.
Zhang, Y., Chen, Y., Bressler, S., & Ding, M. (2008). Response preparation and inhibi-tion: The role of the cortical sensorimotor beta rhythm. Neuroscience, 156(1),238�246.
Ziemann, U. (2004). TMS and drugs. Clinical Neurophysiology, 115(8), 1717�1729.Ziemann, U., Paulus, W., Nitsche, M. A., Pascual-Leone, A., Byblow, W. D., Berardelli,
A., et al. (2008). Consensus: Motor cortex plasticity protocols. Brain Stimulation, 1(3),164�182.
402 Tomas Ros and John H. Gruzelier

CHAPTER1515Enduring Effects ofNeurofeedback in ChildrenRobert Coben1, Martijn Arns2, and Mirjam E.J. Kouijzer31Neurorehabilitation and Neuropsychological Services, Massapequa Park, New York, USA2Research Institute Brainclinics, Nijmegen, and Utrecht University, Department of ExperimentalPsychology, Utrecht, The Netherlands3Behavioral Science Institute, Radboud University Nijmegen, Nijmegen, The Netherlands
Contents
Introduction 403Neurofeedback as a Treatment for Children with ADHD 405Long-Term Effects of Neurofeedback 406Neurofeedback as a Treatment for Children with ASD 408Enduring Behavioral and Neuropsychological Benefits of Neurofeedback in ASD 413Discussion 417Acknowledgment 419References 419
INTRODUCTION
The benefits of neurofeedback as a treatment for children with develop-
mental disorders have been demonstrated. Neurofeedback has shown effi-
cacy for a wide variety of developmental disorders such as autism, ADHD,
epilepsy, and dyslexia (Coben & Padolsky, 2007; Egner & Sterman, 2006;
Evans & Park, 1996; Hammond, 2007; Leins et al., 2007; Lubar, et al.,
2005). Further, to our knowledge there is no study that has reported any
detrimental side effects as a result of neurofeedback treatment.
Preliminary research suggests that neurofeedback is an effective therapy
for reducing core symptoms in children with both autism and ADHD
(Arns et al., 2009; Coben & Padolsky, 2007; Heinrich, Gevensleben,
Freisleder, Moll & Rothenberger, 2004; Jarusiewicz, 2002). Neuro-
feedback is a therapy that teaches clients to regulate their brain activity to
work in a new, more efficient way through the use of underlying operant
conditioning paradigms. This treatment involves providing a subject with
visual and/or auditory “feedback” for particular neural behaviors
403Neurofeedback and Neuromodulation Techniques and ApplicationsDOI: 10.1016/B978-0-12-382235-2.00015-9
© 2011 Elsevier Inc.All rights reserved.

(Monastra, Monastra, & George, 2002). Through conditioning the subject
is taught to inhibit EEG frequencies that are excessively generated and
augment frequencies that are deficient. With continuous training and
coaching, individuals are taught to maintain brainwave patterns concur-
rent with healthy neural functioning. Recently, Walker, Kozlowski, and
Lawson (2007) presented evidence demonstrating the ability of neurofeed-
back training to successfully train neural functioning to more normal
states as well as simultaneously demonstrating reductions in pathological
symptoms. For more in-depth information regarding neurofeedback the
interested reader is referred to Hammond (2007).
Neurofeedback was originally assessed as a useful therapy by Barry
Sterman in 1970 at the Neuropsychiatric Institute of UCLA (Sterman
et al., 1970). Later, Lubar and Shouse (1976) reported distinct positive
EEG and behavioral changes in a hyperkinetic child with ADHD after
training the sensorimotor EEG rhythm (SMR: 12�14 Hz). Since then
there has been an increasing quantity of published research indicating pos-
itive effects of neurofeedback with a variety of disorders, including
ADHD. Recently, Monastra et al. (2002) assessed more than 100 children
with ADHD, and found that neurofeedback was capable of significantly
reducing core symptoms of ADHD. Arns et al. (2009) performed a meta-
analysis encompassing over 15 studies and a total sample size of more than
1100 children, and concluded that neurofeedback is an effective form of
treatment for subjects with ADHD. Moreover, recent investigations have
found the results of neurofeedback training to be comparable to the clini-
cal gains achieved through medication in children (Fox, Tharp, & Fox,
2005). However, unlike medications, there has been no report of any
unwanted or negative side effects as a result of treating ADHD with
neurofeedback training.
The efficacy of neurofeedback for autistic children was initially assessed
in a study by Jarusiewicz (2002) in which she reported a 26% decrease in
autistic symptoms in an experimental group and a 3% reduction in a wait-
list control group. More recently, Coben & Padolsky (2007) found similar,
yet more impressive results, reporting a 40% decrease in core autistic
symptoms as a result of neurofeedback therapy. Similar to the findings in
regards to ADHD, to our knowledge there is no evidence of neurofeed-
back training producing any detrimental or unwanted side effects in chil-
dren with autism spectrum disorders (ASD).
In this chapter we discuss evidence for long-term effects of neurofeed-
back. Over the course of three series of studies we examined the efficacy
404 Robert Coben et al.

of neurofeedback training for children with autism as well as children
with ADHD. We hypothesized that neurofeedback creates effective as
well as enduring positive clinical changes in children with autism and
ADHD.
NEUROFEEDBACK AS A TREATMENT FORCHILDREN WITH ADHD
Recently the 8-year follow-up results from a very large NIMH sponsored
trial on different treatments for ADHD have been published [the NIMH
Collaborative Multisite Multimodal Treatment Study of Children with
Attention-Deficit/Hyperactivity Disorder (ADHD), abbreviated as MTA
(Molina et al., 2009)]. This study compared four different treatments in
579 children. These were initially randomly assigned to: (1) systemic med-
ication management; (2) multi-component behavior therapy; (3) a combi-
nation of (1) and (2); and (4) usual community care. The first results after
14 months initially showed that the medication and combined groups
showed the greatest improvements in ADHD and ODD symptoms.
However, half of these effects had dissipated 10 months after the treatment
was completed. More importantly, after 8 years follow-up, there were no
differences to be found between these four groups, indicating that the ini-
tial treatments to which the children were randomly assigned, did not pre-
dict functioning 6�8 years later. This multi-centre large-scale study hence
clearly demonstrates a lack of long-term effects for either stimulant
medication, multi-component behavior therapy or multimodal treatment
(Molina et al., 2009). Furthermore, in general, response rates to stimulant
medication in ADHD are estimated to be between 70 and 90% (see
Hermens, Rowe, Gordon, & Williams (2006) for an overview).
These results clearly show that at present there is no commonly
accepted treatment modality that has sufficient long-term efficacy for chil-
dren with ADHD, and there is a need for new treatments with better
long-term outcomes. In the next paragraphs we provide evidence that
neurofeedback may be as effective and have more enduring effects than
any of the presently commonly used treatment approaches for ADHD.
As noted above, in 1976 Lubar and Shouse were the first to report on
EEG and behavioral changes in a hyperkinetic child after training the
sensorimotor EEG rhythm (SMR: 12�14 Hz). In 2004, Heinrich et al.
were the first to report positive results after Slow Cortical Potential (SCP)
neurofeedback in the treatment of ADHD. SCP neurofeedback is different
405Enduring Effects of Neurofeedback in Children

from the above-mentioned neurofeedback approach in that changes in the
polarity of the EEG are rewarded (i.e. positivity vs. negativity in the
EEG), and a discrete reward scheme is used. Incidentally, both SCP neuro-
feedback and SMR neurofeedback approaches have been successfully used
in treating epilepsy as well [for an overview also see Egner & Sterman,
(2006)], and it has been suggested that both regulate cortical excitability
(Arns et al., 2009; Kleinnijenhuis, Arns, Spronk, Breteler & Duysens,
2008). Several studies have compared theta-beta training and SCP training
using both within-subject (Gevensleben et al., 2009b) and between-
subject (Leins et al., 2007) designs, and both neurofeedback approaches
showed comparable effects on different aspects of ADHD such as inatten-
tion, hyperactivity, and impulsivity. A recent meta-analysis investigating
the effects of neurofeedback used data from 15 published studies with a
total sample size of 1194 children with ADHD. Based on this study (Arns
et al., 2009) it was concluded that neurofeedback for the treatment of
ADHD met the evidence-based criteria for Level V: Efficacious and
Specific. This study also addressed some of the criticisms made in the past.
In this meta-analysis, long-term effects were not addressed at length.
Some studies have considered long-term effects of neurofeedback and
found that the skill to modulate EEG activity in the required direction is
still preserved over time [6 months: (Leins et al., 2007); and 2 years:
(Gani, Birbaumer & Strehl, 2008)]. Given the treatment potential already
mentioned, these long-term findings make neurofeedback a very interest-
ing and promising treatment for ADHD. In the following paragraphs we
will in a more quantitative way report on the long-term effects of
neurofeedback.
LONG-TERM EFFECTS OF NEUROFEEDBACK
Some of the earliest studies of neurofeedback with ADHD considered
long-term effects. Lubar (1991) reported follow-up results on the initial
case mentioned above (Lubar & Shouse, 1976) demonstrating that the
effects were sustained over time, and the child was still performing well
without medication. In the Monastra, Monastra, and George (2002) study,
all 100 ADHD children were medicated and 51 children also received
neurofeedback. Interestingly, when the medication was removed at the
end of treatment, only the subjects who had completed neurofeedback
were able to sustain their improvements. The qEEG measurements also
showed a significant decrease in cortical slowing of the individuals who
406 Robert Coben et al.

had completed neurofeedback, but not in the subjects who had only
received medication.
Several controlled studies that investigated the effects of neurofeedback
in ADHD reported follow-up results as well. Heinrich et al. (2004) per-
formed a 3-month follow-up for a SCP training group and found all cri-
terion measures improving further (Heinrich, personal communication:
unpublished results; Arns et al., 2009). Strehl and colleagues showed that
at 6-month follow-up scores in impulsivity, inattention, and hyperactivity
were improved even further as compared to the end of treatment (Leins
et al., 2007; Strehl et al., 2006). Furthermore, a 2-year follow-up for this
study (Gani et al., 2008) showed that all improvements in behavior and
attention turned out to be stable. Test results for attention and some of
the parents’ ratings once more improved significantly. In addition, EEG
self-regulation skills turned out to be preserved, indicating that these chil-
dren were still able to successfully regulate their brain activity.
In order to visualize these effects further we have plotted the effects
for inattention and hyperactivity in Figure 15.1. The weighted average is
an average of the scores of all three studies, and then weighted for the
number of subjects per study. This figure clearly shows that the effects of
neurofeedback improve further over time. Both measures are based on a
DSM-based questionnaire. For impulsivity there were too few data to
make a sensible comparison.
0Heinrich et al.,
2004Leins et al.,
2007Strehl et al.,
2006Weightedaverage
1
2
3
Inat
tent
ion
scor
e
4
5
6
7
8Long term effects of neurofeedback on inattention Long term effects of neurofeedback on hyperactivity
0Heinrich et al.,
2004Leins et al.,
2007Strehl et al.,
2006Weightedaverage
1
2
3
Hyp
erac
tivity
sco
re
4
5
6
7
8
Pre Post Follow-up
Figure 15.1 The effects of neurofeedback over time for three controlled studies forinattention (left) and hyperactivity (right). The study by Heinrich et al. performed3 months follow-up and the other two studies performed 6 months follow-up. Notethat the effects of neurofeedback tend to improve further over time (as opposed tothe effects of medication, which are not sustained when the medication is stopped).
407Enduring Effects of Neurofeedback in Children

In 2009 one of the largest multi-site randomized controlled trials on
neurofeedback in ADHD was published by Gevensleben (Gevensleben
et al., 2009b). This study incorporated data from more than 100 subjects.
Post-qEEG data from this sample showed that the neurofeedback-trained
group � but not the control group � showed reduced EEG theta power
(Gevensleben et al., 2009a), thereby demonstrating the specificity of this
intervention. The 6-month follow-up data from this study (Gevensleben
et al., 2010) showed that the beneficial effects that resulted from neuro-
feedback were maintained at follow-up.
Based on the totality of the limited data available, it may be concluded
that the clinical effects of neurofeedback remain stable over time, and may
improve further with time. This is in contrast to current treatments such
as medication management and multicomponent behavior therapy [(as
explained in the introduction based on the NIMH-MTA trial (Molina
et al., 2009)]. However, more large-scale, controlled studies with longer
follow-up will be required to solidify these conclusions.
Investigations have also been conducted in recent years on the long-
term enduring effects of neurofeedback for conditions other than ADHD.
For example, neurofeedback has been shown to be ameliorative in nature
for subjects with autism and the lasting effects of this treatment have been
increasingly examined.
NEUROFEEDBACK AS A TREATMENT FORCHILDREN WITH ASD
The first study of Kouijzer and colleagues (Kouijzer, de Moor, Gerrits,
Congedo, & van Schie, 2009) investigated the effects of neurofeedback in
children with autism. It included 14 children aged from 8 to 12 years
with a diagnosis of Pervasive Developmental Disorder � Not Otherwise
Specified (PDD-NOS). Excluded were children with an IQ score below
70, children using medication, and children with a history of severe brain
injury or co-morbidity such as ADHD or epilepsy. Participants were
divided into treatment and wait-list control group according to the order
of applying. The first seven participants who applied were assigned to the
treatment group; the control group included seven participants who were
recruited out of a larger group of children who applied later, and matched
participants in the treatment group on diagnosis, sex, and intelligence test
scores. During baseline (Time1), all participants were evaluated using
qEEG and a range of executive function tasks, and parents completed
408 Robert Coben et al.

behavior questionnaires (CCC and Auti-R). After neurofeedback training
(Time2), or a comparable time interval for the wait-list control group,
qEEGs and data on executive functions and social behavior were
re-collected. One year after ending treatment (Time3), follow-up data
including qEEGs, executive function tasks, and behavior questionnaires
were collected in the treatment group. Participants in the wait-list control
group did not participate in the follow-up, because they had started
neurofeedback training. Participants in the treatment group had neuro-
feedback training twice a week, until 40 sessions were completed. In each
session participants were rewarded when inhibiting theta power (4�8 Hz)
and increasing low beta power (12�15 Hz) at scalp location C4 according
to a protocol including seven 3-min intervals of neurofeedback training
separated by 1-min rest intervals.
After 40 sessions of neurofeedback, 70% of the participants in the
treatment group had effectively decreased theta power, ps , 0.05 and rs5
20.496 to 20.771, and increased low beta power, ps , 0.05 and
rs5 0.218 to 0.529. Repeated measures MANOVA on the executive
functions data collected at Time1 and Time2 revealed a significant inter-
action between treatment and control group, indicating improvement
of participants in the treatment group on tasks measuring attention skills,
F(1,11)5 8.437, p, 0.05, ηρ25 0.434, cognitive flexibility, F(1,11)5
5.602, p, 0.05, ηρ25 0.3373; set-shifting, F(1,11)5 5.081, p, 0.05,
ηρ25 0.316; concept generation/inhibition F(1,11)5 4.890, p, 0.05,
ηρ25 0.308 (verbal inhibition) and F(1,11)5 5.064, p, 0.05, ηρ25 0.315
(motor inhibition), and planning, F(1,11)5 7.198, p, 0.05, ηρ25 0.396.
Using repeated measures MANOVA to compare questionnaire data col-
lected at Time1 and Time2 revealed a significant interaction effect between
treatment and control group, indicating improvement in non-verbal com-
munication, F(1,12)5 5.505, p, 0.05, ηρ25 0.314, and general commu-
nication, F(1,12)5 5.379, p, 0.05, ηρ 2 5 0.310. Time2 Auti-R
questionnaire data evaluating changes in behavior over the last six months
showed significant improvement in social interactions, F(1,12)5 17.775,
p, 0.05, ηρ2 5 0.618, communication skills, F(1,12)5 29.054, p, 0.05,
ηρ25 0.725, and stereotyped and repetitive behavior, F(1,12)5 7.782,
p, 0.05, ηρ2 5 0.414 for the treatment group, but not for the control
group, ps. 0.05.
One-year follow-up data demonstrated enduring effects of neurofeed-
back treatment (Kouijzer, de Moor, Gerrits, Buitelaar, & van Schie,
2009). Repeated measures MANOVA on the executive function task
409Enduring Effects of Neurofeedback in Children

scores at Time2 and Time3 indicated maintenance of cognitive flexibility,
planning skills, and verbal inhibition, ps, 0.05, improvement of atten-
tion, F(1,6)5 16.248, p , 0.05, ηρ25 0.765, and marginally significant
improvement of motor inhibition, F(1,6)5 4.560, p5 0.086, ηρ250.477. No significant decreases in executive function skills were found
after one year. Repeated measures MANOVA comparing Time1 and
Time 3 data confirmed maintenance of these effects. Analysis revealed sig-
nificant increases of all executive functions that improved after neurofeed-
back treatment, i.e. attention skills, F(1,6)5 39.201, p, 0.05,
ηρ25 0.887, cognitive flexibility, F(1,6)5 27.802, p , 0.05, ηρ2 5 0.848
(set-shifting), and F(1,6)5 18.540, p , 0.05, ηρ25 0.788 (concept gener-
ation), inhibition, F(1,6)5 15.458, p , 0.05, ηρ25 0.756 (verbal inhibi-
tion) and F(1,6)5 10.696, p , 0.05, ηρ2 5 0.681 (motor inhibition), and
planning, F(1,6)5 21.420, p , 0.05, ηρ25 0.811. Figure 15.2 shows
Time1, Time2, and Time3 scores of the treatment group on tests for
attention, cognitive flexibility, inhibition, and planning.
Analysis of behavior questionnaires filled out by parents at Time2 and
Time3 showed no loss of non-verbal communication and general commu-
nication (CCC), ps. 0.05, social interactions, communication skills,
and stereotyped and repetitive behavior (Auti-R), ps . 0.05. Comparing
Time1 and Time3 behavior questionnaires (CCC) confirmed the
positive effect for non-verbal communication, F(1,6)5 7.125, p, 0.05,
ηρ25 0.543, but not for general communication, F(1,6)5 2.745,
0
20
40
60
80
100
120
Attention Cognitiveflexibility
Inhibition Planning
Sco
re
Time1
Time2
Time3
Figure 15.2 Time1, Time2, and Time3 data of the treatment group on executivefunction tasks.
410 Robert Coben et al.

p5 0.149, ηρ2 5 0.314. Figure 15.2 shows Time1, Time2, and Time3
questionnaire data (CCC) for general communication and non-verbal
communication of the treatment group. Detailed information about the
results of this study can be found in the original paper (Kouijzer, de Moor,
Gerrits, Buitelaar et al., 2009).In a second study of Kouijzer and colleagues (Kouijzer, van Schie, de
Moor, Gerrits, & Buitelaar, 2010) several methodological improvements
were implemented to better identify the effects of neurofeedback. A ran-
domized wait-list control group design was used, and the study was con-
ducted at the schools of the participants (N5 20). Participants were 8�12
years old and had diagnoses of autism, Asperger’s disorder or PDD-NOS.
Participants in the treatment group had 40 individual neurofeedback ses-
sions using an individualized treatment protocol based on an initial qEEG.
However, all treatment protocols included theta inhibition at fronto-
central scalp locations. Treatment response was evaluated by qEEG mea-
sures taken during rest and task conditions, a range of executive function
tasks, and social behavior questionnaires filled out by parents and teachers.
All data were collected before (Time1) and after treatment (Time2) and at
6 months follow-up (Time3).
Results of the study showed that 60% of participants decreased theta
power within 40 sessions of neurofeedback, ps, 0.05 and rs5 20.387
to 2 0.832. Additionally, repeated measures MANOVA on qEEG data
revealed a significant interaction between treatment and control group,
indicating a decrease in theta power in the treatment group in two out
of four qEEG conditions, i.e. eyes closed, F(1,14)5 4.883, p, 0.05,
ηρ25 0.259, and hand movement, F(1,14)5 7.856, p , 0.05, ηρ2 50.359. Repeated measures MANOVA on Time1 and Time2 executive
function data showed a significant interaction between treatment and con-
trol group for cognitive flexibility, indicating improvement in cognitive
flexibility in the treatment group compared to the control group,
120115110
Pro
blem
sco
re
1051009590
General communication
1816
Pro
blem
sco
re
1412108
Non-verbal communication
Time1Time2Time3
Figure 15.3 Time1, Time2, and Time3 data of the treatment group on socialbehavior.
411Enduring Effects of Neurofeedback in Children

F(1,18)5 4.652, p, 0.05, ηρ25 0.205. Repeated measures MANOVA
showed a significant interaction effect for social interactions and commu-
nication skills, indicating that parents of participants in the treatment
group reported significant improvement in social interactions and com-
munication skills, F(1,18)5 9.874, p, 0.05, ηρ25 0.367, whereas less or
no improvement was reported by parents of children in the control group.
However, teachers of participants in the treatment group did not report
any greater improvement in social behavior after neurofeedback treatment
compared to reports of teachers of participants in the control group,
F(1,18)5 0.341, p5 0.566, ηρ25 0.019.
Analysis of the 6-month follow-up data revealed enduring effects of
neurofeedback treatment. Repeated measures MANOVA was used to
compare the scores on executive function tasks at Time2 and Time3 and
showed no significant changes, F(1,18)5 0.186, p5 0.671, ηρ25 0.010,
suggesting that participants maintained the same levels of executive func-
tioning for at least 6 months. Repeated measures MANOVA comparing
Time1 and Time3 data confirmed the previously described effects by
revealing a significant increase of cognitive flexibility for the treatment
group but not for the control group, F(1,18)5 5.499, p, 0.05,
ηρ25 0.234. Figure 15.4 shows Time1, Time2, and Time3 scores of the
treatment and control group on cognitive flexibility.
Repeated measures MANOVA comparing the scores on behavioral
questionnaires at Time2 and Time3 showed no effects of group or time,
0
5
10
15
20
25
30
35
40
Treatment group Control group
Cognitive flexibility
Sec
onds
nee
ded
to fi
nish
task
Time1
Time2
Time3
Figure 15.4 Time1, Time2, and Time3 data of treatment and control group on cogni-tive flexibility.
412 Robert Coben et al.

F(1,18)5 1.099, p5 0.380, ηρ25 0.180, indicating maintenance of the
effects in social behavior that were reached 6 months earlier. Repeated
measures MANOVA comparing Time1 and Time3 questionnaire data
confirmed this effect by showing a significant interaction, suggesting
decreases in problem scores on behavior questionnaires for the treatment
group, but not for the control group, F(1,18)5 4.871, p , 0.05,
ηρ25 0.223. Figure 15.5 shows Time1, Time2, and Time3 questionnaire
data of social interactions and communication skills of treatment and con-
trol group. More detailed information about the results of this study can
be found in the original paper (Kouijzer, de Moor, Gerrits, Buitelaar
et al., 2009).
Both studies discussed above indicate maintenance of the effects in
executive functions and social behavior from 6 months to 1 year after
ending neurofeedback treatment.
ENDURING BEHAVIORAL AND NEUROPSYCHOLOGICALBENEFITS OF NEUROFEEDBACK IN ASD
A similar study with findings that can be considered complementary to
those of Kouijzer and colleagues was recently conducted by Coben at his
New York clinic. This study assessed 20 patients with ASD in order to
investigate long-term clinical effects of neurofeedback in terms of
0
1
2
3
4
5
6
7
Treatmentgroup
Control group Treatmentgroup
Control group
Social interactions Communication skills
Pro
blem
sco
re
Time1
Time2
Time3
Figure 15.5 Time1, Time2, and Time3 data of treatment and control group on socialbehavior.
413Enduring Effects of Neurofeedback in Children

behavioral and neuropsychological measures. The subject pool for this
study was predominately male (male 16; female 4) and all Caucasian. The
mean age was 9.53, with a range of 5�10. Most subjects (80%) were
medication-free, with only one subject taking more than two medica-
tions. Handedness was mostly right-handed (N5 16) with one left-
handed and three ambidextrous subjects.
Subjects were administered parent rating scales, including the Autism
Treatment Evaluation Checklist (ATEC; Rimland & Eldelson, 2000), the
Personality Inventory for Children (PIC-2; Lachar & Gruber, 2001), the
Behavior Rating Inventory of Executive Function (BREIF; Gioia,
Isquith, Guy & Kenworthy, 2000), and the Gilliam Asperger’s Disorder
Scale (GADS; Gilliam, 2001). Subjects were also administered neuropsy-
chological assessments covering domains of attention/executive function-
ing, language, and visuo-spatial processing. After baseline assessments
were collected all subjects underwent at least 40 sessions of neurofeedback
training, with an average of 64.5 completed sessions among all subjects.
Upon completion of therapy, subjects were re-evaluated and pre- and
post-treatment scores were compared for significance. After re-evaluation,
neurofeedback was withheld for 5�22 months (M5 10.1 months) while
no other treatments were administered. Following this break in treatment,
subjects were evaluated once again in the same fashion as previously
described. Their latter scores were then compared to scores obtained at
the end of active neurofeedback training (Time 2).
All statistical computations were performed in the statistical package
SPSS. Scores prior to treatment on parent rating scales were compared for
significance to scores obtained after treatment had ended. Analysis of pre-
and post-scores obtained from the ATEC revealed significant changes fol-
lowing neurofeedback training (two-sample t test, t5 11.302, d.f. 19,
p , 0.000). Likewise, changes in scores on the GADS prior to and fol-
lowing treatment were found to be significant (two-sample t test,
t5 8.332, d.f. 19, p , 0.000). Significant changes were also found to be
present following treatment among scores from the BRIEF (two-sample t
test, t5 5.370, d.f. 19, p, 0.000) as well as the PIC-2 (two-sample t test,
t5 6.320, d.f. 19, p , 0.000). Interestingly, when subjects were
re-assessed following a period of no neurofeedback training (range 5�22
months), no significant changes were found on any parent rating scale
administered (see Figure 15.6). This suggests that changes in parent ratings
that were improved by neurofeedback training remained stable during this
follow-up period.
414 Robert Coben et al.

Neuropsychological evaluations encompassing the domains of atten-
tion, executive functioning, language, and visuo-spatial processing were
also analyzed for significant differences. Significant changes from pre- to
post-treatment scores were found among all three domains assessed:
attention/executive functioning (two-sample t test, t525.297, d.f. 19,
p , 0.000), language (two-sample t test, t522.235, d.f. 10, p , 0.049)
and visuo-spatial processing (two-sample t test, t5 25.308, d.f. 18,
p , 0.000). Interestingly, significant therapeutic changes were also found
after subjects were re-evaluated after a lengthy (5�22 months) absence
from neurofeedback training. These occurred in the areas of attention
(two-sample t test, t523.021, d.f. 19, p , 0.007), language (two-sample
t test, t522.347, d.f. 10, p , 0.041) and visuo-spatial processing (two-
sample t test, t523.568, d.f. 18, p , 0.002) (see Figure 15.7). This
would suggest that neurofeedback training not only led to objective gains
in neuropsychological functioning, but that these enhancements in func-
tioning continued to improve over the follow-up period when no treat-
ment was being received.
The results of this present study were quite interesting. First, our find-
ings add to the wealth of studies that have shown that from pre- to
100
90
80
70
60
50
40
Pre
ATEC (x2) Brief GADS PIC2
Post Follow-up
Figure 15.6 Clinical improvements among subjects as assessed by the parents ratingscales of ATEC, BRIEF, GADS, and PIC-2 for pre-, post-treatment, and follow-upperiods.
415Enduring Effects of Neurofeedback in Children

post-treatment conditions, neurofeedback is an effective therapy for treat-
ing individuals with autistic spectrum disorders. Additionally, these results
show that this treatment was effective in limiting autistic behavioral defi-
cits as well as deficits of a more neuropsychological nature. Furthermore,
as our analysis shows, there were no significant increases in autistic pathol-
ogy when subjects were re-evaluated after neurofeedback was withheld.
This finding supports previously found evidence that neurofeedback is
capable of creating stable changes within autistic subjects that are not
likely to rapidly degrade when treatment ends (Coben & Padolsky, 2007;
Jarusiewicz, 2002).
Of potentially even greater interest, this study found that during the
period in which subjects were receiving no treatment, positive clinical
neuropsychological gains were still being manifested within the domains
of attention, executive functioning, language, and visuo-spatial processing.
Thus, even without continued treatment subjects apparently were con-
tinuing to improve in these realms. An important implication of this find-
ing is that neurofeedback may indeed change the autistic brain to work in
novel and more efficient ways, and these changes may continue to prog-
ress even after the treatment has ended. This finding helps further the
claim that neurofeedback creates specific neurophysiological changes
within the autistic brain (Coben, Sherlin, Hudspeth & McKeon, 2009
[study under review]). This is in stark contrast to other commonly admin-
istered treatments for autism. For example, Lovaas et al. (1973) performed
0Pre
–0.5
–1
–1.5
–2
–2.5
Attn/exec Lang Vis-perc
Pre Post Follow-up
Figure 15.7 Graph showing the clinical improvements among the domains ofattention/executive functioning, language, and visuo-spatial processing as assessedby neuropsychological evaluations at pre-, post-treatment and follow-up periods.
416 Robert Coben et al.

a study in which Applied Behavioral Analysis (ABA) was administered to
a group of children with autism. Upon completion of ABA training the
experimenters reported positive gains in terms of clinical improvements in
behavioral deficits. Subjects were then re-evaluated 1�4 years later, and
subjects who did not continuously receive ABA training had significantly
regressed. As our current findings demonstrate, there is no evidence of
regression among any of our subjects receiving neurofeedback training. In
terms of drug therapies there is no evidence to our knowledge that would
indicate that medications result in enduring clinical gains for subjects with
autism when medication is withheld. In fact, numerous studies indicate
that prolonged medication use has detrimental effects on autistic indivi-
duals (Anderson et al., 2009; Malone et al., 2002).
In terms of the limitations of the current study, the participants con-
sisted of a selected pool of subjects. Subjects were placed in groups by
choice of the experimenter rather than by random assignment. When
subjects are chosen in that manner there may be a degree of selection bias
associated. We would also recommend that this experiment be replicated
with more neuropsychological assessments and parent rating scales
included in order to more widely assess the effects of neurofeedback train-
ing. This type of investigation could broaden the present findings, and
help determine if there are other correlations or significant predictors we
might not have considered. Also, we would recommend a study with a
greater gap between the end of treatment and re-evaluation of subjects.
Doing this, we believe, would help to assess nature and extent of any pos-
itive clinical gains found in subjects when they are no longer receiving
treatment, as well as test more fully the limits of enduring effects of neuro-
feedback treatment.
DISCUSSION
The current chapter provided evidence that neurofeedback is a therapy
capable of creating enduring changes in children with both autism and
ADHD. This was found across all experiments reviewed. This coupling of
multiple studies converging upon a singular finding, namely the enduring
clinical effects of neurofeedback, serves to provide strong evidence that
neurofeedback is effective for children with developmental disorders.
Moreover, these findings provide evidence that neurofeedback is not only
effective in children with developmental disorders, but also is capable of
leading to long-lasting positive changes in these subjects.
417Enduring Effects of Neurofeedback in Children
A therapy that can lead to long-lasting effects for children with devel-
opmental disorders (and perhaps continuing improvement even after the
treatment is stopped) is an enormous asset for children with developmen-
tal disorders. Most contemporary treatments require prolonged and
lengthy treatment sessions. For example, ABA training can require up to
40 hours a week over several months to be effective (Howard et al.,
2005). Furthermore, drug therapies usually require years of medication in
order to maintain efficacy. In addition, some children require incremental
increases in dosages over a period of years for medication use to be clini-
cally viable. Our current results and those of others discussed in this chap-
ter indicate that neurofeedback therapy can reach clinical efficacy
relatively quickly, and positive gains can be retained for months after
treatment has stopped. Outside of the clinical implications, there are
ancillary benefits supporting the use of neurofeedback. For example, the
financial aspects of this treatment should be considered. Presently, the
United States alone spends upwards of $3.2 million for the care and treat-
ment for a single individual with autism, a figure that equates to $35 bil-
lion annually (Ganz, 2006). Similarly, the overall cost for treatment of
ADHD in the United States is $30 billion annually (Birnbaum et al.,
2000). A treatment such as neurofeedback with positive effects that can
endure over time has great potential to relieve some of the fiscal burdens
associated with these disorders.
Results of the studies reviewed in this chapter also provide evidence for
the safety of neurofeedback. All studies reported no instances of subjects
worsening or showing any side effects while undergoing this treatment over
an extended period of time. Moreover, there was no evidence of negative
side effects when neurofeedback was ceased. In fact, the opposite was found
across all studies. This, again, is contradictory to other interventions, most
notable drug therapies, which have documented adverse reactions within
this population and often have failed to demonstrate positive effects on pri-
mary symptoms (Kidd, 2002). For example, complaints of excessive weight
gain, drowsiness, and fatigue have been reported by children with ASD and
ADHD while taking Risperdal (risperidone) (McCraken et al., 2002); and
it has been reported that children taking risperidone at relatively high doses
may become susceptible to developing facial dystonia (Zuddas et al., 2000).
Likewise, research into the administration of fluoxetine has been found to
produce side effects such as restlessness, hyperactivity, agitation, decreased
appetite, and insomnia (Cook et al., 1992). Investigations into other con-
temporary treatments (i.e. diet and chelation therapies) have failed to yield
418 Robert Coben et al.

adequate evidence in regard to their safety or efficacy (Doja & Roberts,
2005; Harrison-Elder et al., 2006; McDougle et al., 2000). Recently,
Dr Susan Hyman and colleagues (2010) of the University of Rochester per-
formed the single largest randomized study on the effects of casein- and
whey-free diets as a treatment for autism. The results of this study found no
therapeutic benefits in withholding whey or casein proteins from an autistic
child’s diet.
We speculate that the enduring effects of neurofeedback in children
with developmental disorders are the result of this treatment’s ability to
change the brain in a therapeutic manner. Recently, Coben and collea-
gues reported specific neurophysiological changes in terms of coherence
within and between specific neural regions following neurofeedback treat-
ment for children with ASD (Coben, Sherlin, Hudspeth, & McKeon,
2009 [study under review]). We would argue that neurofeedback training
causes specific neurophysiological changes within the brain, which in turn
contribute to the long-lasting effects of this treatment, and this fosters the
continued growth and development of cognitive functions. Moreover, we
suggest that more research be conducted into the precise neural areas clin-
ically affected by neurofeedback in an effort to more fully understand the
efficacy of neurofeedback for children with developmental disorders.
In summary, results of the studies examined add to the growing wealth
of investigations into the efficacy of neurofeedback as a treatment for chil-
dren with developmental disorders. Moreover, these results have found
this treatment to be effective over an extended period of time. Consistent
with these results we recommend future studies be conducted that assess
the enduring effects of neurofeedback over even longer treatment spans.
ACKNOWLEDGMENT
We acknowledge Hartmut Heinrich for providing us with the unpub-
lished follow-up data from his study. We also acknowledge the support
from Ute Strehl in providing us with the data from her studies.
REFERENCESAnderson, G., Scahil, L., McCracken, J., McDougle, C., Aman, M., Tierney, E., et al.
(2009). Effects of short- and long-term Risperidone treatment on prolactin levels inchildren with autism. Journal of Biological Psychiatry, 61(4), 545�550.
Arns, M., de Ridder, S., Strehl, U., Breteler, M., & Coenen, A. (2009). Efficacy of neuro-feedback treatment in ADHD: The effects on inattention, impulsivity and
419Enduring Effects of Neurofeedback in Children

hyperactivity: A meta-analysis. Clinical EEG and Neuroscience: Official Journal of theEEG and Clinical Neuroscience Society (ENCS), 40(3), 180�189.
Birnbaum, H. G., Kessler, R. C., Lowe, S. W., Secnik, K., Greenberg, P. E., Leond, S. A.,et al. (2000). Cost of attention deficit-hyperactivity disorder (ADHD) in the US:Excess cost of persons with ADHD and their family members in 2000. Current MedicalResearch and Opinion, 21(2), 195�205.
Coben, R., & Padolsky, I. (2007). Assessment-guided neurofeedback for autistic spectrumdisorder. Journal of Neurotherapy, 11, 5�23.
Coben, R., Sherlin, L., Hudspeth, W. J., & McKeon, K. (2009). Connectivity guidedEEG biofeedback for autism spectrum disorder: Evidence of neurophysiologicalchanges. Journal of Autism and Developmental Disorders [under review]
Cook, E. H., Rowlett, R., Jaselskis, C., & Leventhal, B. L. (1992). Fluoxetine treatmentof children and adults with autistic disorder and mental retardation. Journal of AmericanAcademy of Child & Adolescent Psychiatry, 31, 739�745.
Doja, A., & Roberts, W. (2005). Immunizations and autism: A review of the literature.Canadian Journal of Neurological Sciences, 33, 341�346.
Egner, T., & Sterman, M. B. (2006). Neurofeedback treatment of epilepsy: From basicrationale to practical application. Expert Review of Neurotherapeutics, 6(2), 247�257.
Evans, J. R., & Park, N. S. (1996). Quantitative EEG abnormalities in a sample of dyslexicpersons. Journal of Neurotherapy, 2(1), 1�5.
Fox, D. J., Tharp, D. F., & Fox, L. C. (2005). Neurofeedback: An alternative and effica-cious treatment for attention deficit hyperactivity disorder. Journal of AppliedPsychophysiology and Biofeedback, 30(40), 364�373.
Gani, C., Birbaumer, N., & Strehl, U. (2008). Long term effects after feedback of slowcortical potentials and of theta-beta-amplitudes in children with attention deficit/hyperactivity disorder (ADHD). International Journal of Bioelectromagnetism, 10(4),209�232.
Ganz, M. (2006). The costs of autism. In S. Moldin & J. L. Rubenstein (Eds.),Understanding autism: From basic neuroscience to treatment (pp. 476�498). New York,NY: CRC Press.
Gevensleben, H., Holl, B., Albrecht, B., Schlamp, D., Kratz, O., Studer, P., et al. (2009a).Distinct EEG effects related to neurofeedback training in children with ADHD: Arandomized controlled trial. International Journal of Psychophysiology: Official Journal ofthe International Organization of Psychophysiology, 74(2), 149�157.
Gevensleben, H., Holl, B., Albrecht, B., Schlamp, D., Kratz, O., et al. (2010).Neurofeedback training in children with ADHD: 6-month follow-up of a randomisedcontrolled trial. European Child and Adolescent Psychiatry, doi 10.1007/s00787-010-0109-5
Gevensleben, H., Holl, B., Albrecht, B., Vogel, C., Schlamp, D., Kratz, O., et al. (2009b).Is neurofeedback an efficacious treatment for ADHD? A randomised controlled clini-cal trial. Journal of Child Psychology and Psychiatry, and Allied Disciplines, 50(7),780�789.
Gilliam, J. E. (2001). Gilliam Asperger’s Disorder Scale: Examiner’s manual Austin, TX: Pro-Ed.Gioia, G. A., Isquith, P. K., Guy, S. C., & Kenworthy, L. (2000). Behavior Rating Inventory
of Executive Function. Lutz, FL: Psychological Assessment Resources, Inc.Hammond, D. C. (2007). What is neurofeedback? Journal of Neurotherapy, 10(4), 25�36.Harrison-Elder, J., Shankar, M., Shuster, J., Theriaque, D., Burns, S., & Sherrill, L.
(2006). The gluten-free, casein-free diet in autism: Results of a preliminary doubleblind clinical trial. Journal of Autism and Developmental Disorders, 36, 413�420.
Hayman, S. et al. (2010) The gluten-free and casein-free (GFCF) diet. A double-blind,placebo controlled challenge study. Paper presented at the International Society forAutism Research 2010 conference, Philadelphia, PA.
420 Robert Coben et al.

Heinrich, H., Gevensleben, H., Freisleder, F. J., Moll, G. H., & Rothenberger, A. (2004).Training of slow cortical potentials in attention-deficit/hyperactivity disorder:Evidence for positive behavioral and neurophysiological effects. Biological Psychiatry, 55(7), 772�775.
Hermens, D. F., Rowe, D. L., Gordon, E., & Williams, L. M. (2006). Integrative neuro-science approach to predict ADHD stimulant response. Expert Review ofNeurotherapeutics, 6(5), 753�763.
Howard, J. S., Sparkman, C. R., Cohen, H. G., Green, G., & Stanislaw, H. (2005). Acomparison of intensive behavior analytic and eclectic treatments for young childrenwith autism. Research in Developmental Disabilities, 26, 359�383.
Jarusiewicz, B. (2002). Efficacy of neurofeedback for children in the autistic spectrum. Apilot study. Journal of Neurotherapy, 6(4), 39�49.
Kidd, P. M. (2002). Autism, an extreme challenge to integrative medicine. Part II:Medical Management. Alternative Medical Review, 7(6), 472�499.
Kleinnijenhuis, M., Arns, M. W., Spronk, D. B., Breteler, M. H. M., & Duysens, J. E. J.(2008). Comparison of discrete-trial based SMR and SCP training and the interrela-tionship between SCP and SMR networks: Implications for brain-computer interfacesand neurofeedback. Journal of Neurotherapy, 11(4), 19�35.
Kouijzer, M. E. J., de Moor, J. M. H., Gerrits, B. J. L., Buitelaar, J. K., & van Schie, H. T.(2009). Long-term effects of neurofeedback treatment in autism. Research in AutismSpectrum Disorders, 3, 496�501.
Kouijzer, M. E. J., de Moor, J. M. H., Gerrits, B. J. L., Congedo, M., & van Schie, H. T.(2009). Neurofeedback improves executive functioning in children with autism spec-trum disorders. Research in Autism Spectrum Disorders, 3, 145�162.
Kouijzer, M. E. J., van Schie, H. T., de Moor, J. M. H., Gerrits, B. J. L., & Buitelaar, J. K.(2010). Neurofeedback treatment in autism. Preliminary findings in behavioral, cognitive,and neurophysiological functioning. Research in Autism Spectrum Disorders, 4(3), 386�399.
Lachar, D., & Gruber, C. P. (2001). The Personality Inventory for Children (2nd ed.)Los Angeles, CA: Western Psychological Services.
Leins, U., Goth, G., Hinterberger, T., Klinger, C., Rumpf, N., & Strehl, U. (2007).Neurofeedback for children with ADHD: A comparison of SCP and theta/beta pro-tocols. Applied Psychophysiology and Biofeedback, 32(2), 73�88.
Lovaas, I., Koegel, R., Simmons, J. Q., & Long, J. S. (1973). Some generalization and fol-low-up measures on autistic children in behavior therapy. Journal of Applied BehaviorAnalysis, 6(1), 131�166.
Lubar, J. F. (1991). Discourse on the development of EEG diagnostics and biofeedbackfor attention-deficit/hyperactivity disorders. Applied Psychophysiology and Biofeedback,16(3), 201�225.
Lubar, J. F., & Shouse, M. N. (1976). EEG and behavioral changes in a hyperkinetic childconcurrent with training of the sensorimotor rhythm (SMR): A preliminary report.Biofeedback and Self-Regulation, 1(3), 293�306.
Lubar, J. F., Swartwood, M. O., Swatwood, J. N., & O’Donnell, P. H. (2005). Evaluationof the effectiveness of EEG neurofeedback training for ADHD in a clinical setting asmeasured by changes in TOVA scores, behavioral ratings, and WISC-R performance.Applied Psychophysiology and Biofeedback, 20, 83�99.
Malone, R. P., Maislin, G., Choudhury, M. S., Gifford, C., & Delaney, M. A. (2002).Risperidone treatment in children and adolescents with autism: Short- and long-termsafety and effectiveness. Journal of the American Academy of Child and AdolescentPsychiatry, 41(2), 140�147.
McCraken, J. T., McGough, J., Shah, B., Cronin, P., Hong, D., Aman, M. G., et al.(2002). Risperidone in children with autism and serious behavioral problems. NewEngland Journal of Medicine, 9, 3�14.
421Enduring Effects of Neurofeedback in Children

McDougle, C. J., Scahill, L., McCracken, J. T., Aman, M. G., Tierney, E., & Arnold, L. E.(2000). Research units on pediatric psychopharmacology (RUPP) autism network.Background and rationale for an initial controlled study of risperidone. Child andAdolescent Psychiatric Clinics of North America, 9(1), 201�224.
Molina, B. S., Hinshaw, S. P., Swanson, J. M., Arnold, L. E., Vitiello, B., Jensen, P. S.,et al. (2009). The MTA at 8 years: Prospective follow-up of children treated for com-bined-type ADHD in a multisite study. Journal of the American Academy of Child andAdolescent Psychiatry, 48(5), 484�500.
Monastra, V. J., Monastra, D. M., & George, S. (2002). The effects of stimulant therapy,EEG biofeedback, and parenting style on the primary symptoms of attention-deficit/hyperactivity disorder. Applied Psychophysiology and Biofeedback, 27(4), 231�249.
Rimland, B., & Eldelson, S.M. (2000). Autism treatment evolution checklist (ATEC).Retrieved May 12, 2010 from www.autismeval.com/ari-atec/report1.html.
Strehl, U., Leins, U., Goth, G., Klinger, C., Hinterberger, T., & Birbaumer, N. (2006).Self-regulation of slow cortical potentials: A new treatment for children with atten-tion-deficit/hyperactivity disorder. Pediatrics, 118(5), e1530�1540.
Sterman, M. B., Howe, R. D., & Macdonald, L. R. (1970). Facilitation of spindle-burstsleep by conditioning of electroencephalographic activity while awake. Science, 167,1146�1148.
Walker, J. E., Kozlowski, G. P., & Lawson, R. (2007). A modular activation/coherenceapproach to evaluating clinical/qEEG correlations and for guiding neurofeedbacktraining: modular insufficiencies, modular excesses, disconnections, and hyperconnec-tions. Journal of Neurotherapy, 11, 25�44.
Zuddas, A., Dimartino, A., Muglia, P., & Cianchetti, C. (2000). Long-term risperidonefor pervasive developmental disorder: Efficacy, tolerability, and discontinuation. Journalof Child Adolescent Psychopharmacology, 10(2), 79�90.
422 Robert Coben et al.
INDEX
AABA, see Applied behavior analysis
ACC, see Anterior cingulate cortex
ADHD, see Attention deficit hyperactivity
disorder
Adrenergic receptor, attention deficit
hyperactivity disorder genetics of
ADRA2C, 356
AJD, see Approximate Joint Diagonalization
ALS, see Amyotrophic lateral sclerosis
γ-Aminobutyric acid (GABA)
repetitive transcranial magnetic
stimulation mechanism studies,
274�275
transcranial direct current stimulation
effects, 339
Amyotrophic lateral sclerosis (ALS), slow
cortical potential feedback
studies, 221
Anterior cingulate cortex (ACC)
emotion regulation, 239�242
nociception studies, 245
tinnitus studies, 296
Antidepressant treatment response
index (ATR), quantitative
electroencephalography studies,
10�11
Applied behavior analysis (ABA), autism
spectrum disorder management,
156�158
Approximate Joint Diagonalization (AJD),
blind source separation, 37�38,
40
Arousal, see Vigilance
ASD, see Autism spectrum disorders
Asperger disorder, see Autism spectrum
disorders
Attention deficit hyperactivity disorder
(ADHD)
behavioral treatments, 129
brain disturbances
regional brain dysfunction, 360�361
structure, 128, 358�360
clinical features, 354
electroencephalography
averaged group data versus individual
client data, 93
beta activity, 87�88
historical perspective, 83�89
paroxysmal abnormalities, 84�85
phenotypes, 109�112, 128
theta activity, 85�87
treatment prediction, 88�89
vigilance/arousal
influences, 94
phenotype similarity, 113
regulation, 101�105
epidemiology, 128, 354
genetics
candidate genes, 355�357
genome-wide association study, 358
genome-wide linkage analysis, 357
independent component analysis of
event-related potentials in
response inhibition, 65�66
medication response rate, 82
neurofeedback
advantages, 418
historical perspective, 404
long-term effects in children,
406�408
mechanism studies
attention network, 366�367
dopamine, 367�368
functional magnetic resonance
imaging, 362�365
prospects for study, 368
MTA study, 405
observational studies, 130�132
randomized-controlled study
active neurofeedback, 135�136
Conner’s Parent/Teacher Rating
Scales-Revised outcomes,
137�138, 140�143
data analysis, 138�139
design, 133�134
423

Attention deficit hyperactivity disorder
(ADHD) (Continued)
diagnostic assessment, 137
exclusion criteria, 133
Integrated Visual and Auditory
Continuous Performance Test
outcomes, 138, 141
limitations, 147�148
neurofeedback learners versus
nonlearners, 144�145
outcome measures, 137�138
parent, teacher, and children
outcomes, 145�147
participants, 132�133
placebo neurofeedback, 136�137
session setup, 134�135
safety, 418�419
slow cortical potential feedback
studies, 219�220, 405�406
pharmacotherapy, 128�129
Auditory evoked potential, therapeutic
response studies, 10
Autism spectrum disorders (ASD)
applied behavior analysis, 156�158
chelation therapy, 165�167
classification, 153
clinical features, 154
diet-related treatments, 161�162
electroencephalography abnormalities, 155
epidemiology, 154�155
functional neuroimaging, 155
hyperbaric oxygen therapy, 167�168
neurofeedback
connectivity-guided neurofeedback
efficacy, 174�175
controlled group studies, 172�174
efficacy, 409�413
electroencephalography
frequency bands, 169
quantitative electroencephalography
evaluation, 170�171
historical perspective, 408�409
long-term effects in children, 413�417
prospects for study, 175�176
safety, 418�419
setup, 168
pharmacotherapy, 158�161
vitamin supplement and enzyme therapy,
162�165
BBDNF, see Brain-derived neurotrophic
factor
Biomarkers for Rapid Identification of
Treatment Response in Major
Depression (BRITE-MD), 10
Blind source separation (BSS)
clinical utility, 39�43
conditions for success, 37
decorrelation method, 34�37
overview, 26, 33�34
Brain�Computer Interface system,
see Functional magnetic
resonance imaging
Brain-derived neurotrophic factor (BDNF)
repetitive transcranial magnetic
stimulation mechanism studies,
275�277, 281�282
transcranial direct current stimulation
effects, 338
BRITE-MD, see Biomarkers for Rapid
Identification of Treatment
Response in Major Depression
BSS, see Blind source separation
CChelation, autism spectrum disorder
management, 165�167
Conner’s Parent/Teacher Rating Scales-
Revised, attention deficit
hyperactivity disorder
neurofeedback outcomes,
137�138, 140�143
Cortical spreading depression (CSD),
transcranial direct current
stimulation effects, 339
Corticospinal excitability, 390�393
CSD, see Cortical spreading depression
DDepression
electroconvulsive therapy, 259�260
electroencephalography
frontal asymmetry, 90�92
424 Index

historical perspective, 89�92
phenotypes, 109�112
treatment prediction, 93
vigilance
overview, 94
phenotype similarity, 113�114
regulation, 100�101
epidemiology, 259
repetitive transcranial magnetic
stimulation studies
advances
protocols, 277�278
technical progress, 278�279
treatment optimization, 279�282
historical perspective, 18, 260�261
mechanisms of action
genetics, 276�277
neuroimaging, 271�272
neurotransmitters and
neuroendocrinology, 273�275
neurotrophins, 275�276
protocols
characteristics, 261�262
combined frequency stimulation,
265�266
high-frequency stimulation,
262�263
location for stimulation, 246�248
low-frequency stimulation,
263�264
stimulation intensity, trains, and
sessions, 268�270
Di-mercaposuccinic acid (DMSA), autism
spectrum disorder chelation
therapy, 166
DLPFC, see Dorsolateral prefrontal cortex
DMSA, see Di-mercaposuccinic acid
Dopamine
attention deficit hyperactivity disorder
genetics
D4 receptor gene, 355�356
transporter, 356
neurofeedback training mechanism
studies, 367�368
repetitive transcranial magnetic
stimulation mechanism studies,
273�274
transcranial direct current stimulation
effects, 339
Dorsolateral prefrontal cortex (DLPFC),
repetitive transcranial magnetic
stimulation for depression,
266�268
EECT, see Electroconvulsive therapy
EEG, see Electroencephalography
Electroconvulsive therapy (ECT),
depression treatment, 259�260
Electroencephalography (EEG),
see also Event-related potential;
Quantitative
electroencephalography
attention deficit hyperactivity disorder
studies, see Attention deficit
hyperactivity disorder
autism spectrum disorder abnormalities,
155
blind source separation, see Blind source
separation
depression studies, see Depression
GO/NO-GO TASK, see GO/NO-GO
TASK
interpretation reliability, 4�5, 107�109
neural network reactivity, 50�52
neurofeedback effects on cortical
excitability and synchronization
corticospinal excitability, 390�393
neurofeedback
apparatus and
electroencephalography analysis,
384
data analysis, 385
training dynamic, 388�389
training protocol, 384�385
path analysis, 394�395
short intracortical inhibition and
facilitation, 383, 393�394
study design, 383�384
summary of findings, 395�399
transcranial magnetic stimulation
analysis of neuroplasticity
apparatus and technique, 385�386
425Index

Electroencephalography (EEG) (Continued)
electromyographic recording,
386�387
main effects, 389�390
overview, 382�383
statistical analysis, 387
phenotype, see Endophenotype
physical principles, 27�28
repetitive transcranial magnetic
stimulation treatment response
prediction in depression, 280
rhythm origins, 48
statistical correlation, 29�33
temporal resolution, 3
tinnitus studies, 295
vigilance studies, see Vigilance
volume conduction, 28�29
Electromyography (EMG), recording
in transcranial magnetic
stimulation analysis of
neuroplasticity, 386�387
EMG, see Electromyography
Emotion, functional magnetic
resonance imaging studies,
238�242
Endophenotype
attention deficit hyperactivity disorder
overview, 109�112
vigilance similarity, 113
definition, 50
depression
overview, 109�112
vigilance similarity, 113�114
electroencephalography pattern
overview, 105�107
heritability, 49
intermediate phenotypes, 7
neurofeedback protocol efficacy
prediction, phenotypes, and
behavioral patterns, 15
reliability of rating, 107�109
Epilepsy
electroencephalography phenotype,
107
epidemiology, 183
neurofeedback
case studies, 188�192, 195�198, 200
individual therapy using quantitative
electroencephalography findings,
187, 193�195
Low Energy Neurofeedback System,
198�200
prospects for study, 200�201
sensorimotor rhythm reinforcement,
186
slow cortical potential training,
184�185, 188, 217�218
theta inhibition, 186�187
ERP, see Event-related potential
Escitalopram, autism spectrum disorder
management, 161
Event-related potential (ERP), see also Slow
cortical potential
analytical techniques, 52
blind source separation, see Blind source
separation
clinical research guidelines, 49
decomposition into individual
components, 56�58
eyeblink artifact correction, 55�56
Human Brain Index reference
database, 53
neural network reactivity, 50�52
neurofeedback efficacy studies, 66�70
neuronal sources, 49
repetitive transcranial magnetic
stimulation mechanism studies,
272
transcranial direct current stimulation
effect index, 70�73
Eyeblink artifact, correction, 55�56
FFluoxetine, autism spectrum disorder
management, 159�160
fMRI, see Functional magnetic resonance
imaging
Functional magnetic resonance imaging
(fMRI)
attention deficit hyperactivity disorder
neurofeedback training
mechanism studies, 362�365
Brain�Computer Interface system
auditory system studies, 244
426 Index

emotion studies, 238�242
feedback generation, 237�238
language processing studies, 244
motor system studies, 243
neurofeedback studies
nociception, 245
psychopathy, 246
schizophrenia, 246�248
stroke rehabilitation, 245
tinnitus treatment, 246
preprocessing, 233�234
prospects, 248�249
signal acquisition, 232�233
signal analysis, 234�237
principles, 227�228
real-time imaging historical perspective,
228�232
repetitive transcranial magnetic
stimulation mechanism studies,
271�272, 282
GGABA, see γ-Aminobutyric acid
General Linear Model (GLM), functional
magnetic resonance imaging
signal analysis, 234�235
GFCF diet, see Gluten-free/casein-free diet
GLM, see General Linear Model
Gluten-free/casein-free (GFCF) diet,
autism spectrum disorder
management, 162
GO/NO-GO TASK
attention deficit hyperactivity disorder
studies, 361�362, 364�365
electroencephalography, 53�55
event-related potentials
decomposition into individual
components, 58�65
neurofeedback efficacy studies,
66�70
transcranial direct current stimulation
effect index, 71�72
HHBI, see Human Brain Index
HBOT, see Hyperbaric oxygen therapy
Herceptin, individual response, 82
Human Brain Index (HBI), reference
database, 53
Hyperbaric oxygen therapy (HBOT),
autism spectrum disorder
management, 167�168
IICA, see Independent component analysis
ICF, see Intracortical facilitation
Independent component analysis (ICA)
attention deficit hyperactivity
disorder response inhibition,
65�66
event-related potentials, 52, 56�59
Integrated Visual and Auditory Continuous
Performance Test (IVA),
attention deficit hyperactivity
disorder neurofeedback
outcomes, 138, 141
Inter-train interval (ITI), repetitive
transcranial magnetic stimulation,
269
Intracortical facilitation (ICF),
electroencephalography
neurofeedback effects on cortical
excitability and synchronization,
383, 393�394
ITI, see Inter-train interval
IVA, see Integrated Visual and Auditory
Continuous Performance Test
LLDAEP, see Loudness-dependent auditory
evoked response
LENS, see Low Energy Neurofeedback
System
Linear instantaneous time-invariant
mixing, electroencephalography,
28�29
Linear supposition principle,
electroencephalography, 27
Locked-in syndrome, slow cortical
potential feedback studies, 221
LORETA, see Low resolution
electromagnetic tomography
Loudness-dependent auditory evoked
response (LDAEP), antidepressant
response marker, 9
427Index

Low Energy Neurofeedback System
(LENS), epilepsy studies,
198�200
Low resolution electromagnetic
tomography (LORETA)
event-related potential decomposition
into individual components,
58�59, 62�63, 65
therapeutic response studies, 9
MMagnetic resonance imaging (MRI)
attention deficit hyperactivity
disorder brain structure studies,
358�360
functional imaging, see Functional
magnetic resonance imaging
Magnetoencephalography (MEG), tinnitus
studies, 295�296
Magno-electroencephalography
resonant therapy (MERT),
principles, 19
Mania, vigilance regulation, 101
MEG, see Magnetoencephalography
MERT, see Magno-electroencephalography
resonant therapy
N-Methyl-D-aspartate (NMDA),
transcranial direct current
stimulation effects on receptors,
338, 342
Methylcobalamin, autism spectrum
disorder management, 164�165
Methylphenidate, attention deficit
hyperactivity disorder
management, 129
Migraine, slow cortical potential feedback
studies, 220�221
Motor threshold (MT), repetitive
transcranial magnetic stimulation,
268�269
MRI, see Magnetic resonance imaging
MT, see Motor threshold
NNear-infrared spectroscopy (NIRS),
transcranial direct current
stimulation studies, 339�340
Neurofeedback,
see also Electroencephalography;
Quantitative
electroencephalography
electroencephalography neurofeedback
effects on cortical excitability and
synchronization
corticospinal excitability, 390�393
neurofeedback
apparatus and electroencephalography
analysis, 384
data analysis, 385
training dynamic, 388�389
training protocol, 384�385
path analysis, 394�395
short intracortical inhibition and
facilitation, 383, 393�394
study design, 383�384
summary of findings, 395�399
transcranial magnetic stimulation
analysis of neuroplasticity
apparatus and technique, 385�386
electromyographic recording,
386�387
main effects, 389�390
overview, 382�383
statistical analysis, 387
indications and efficacy, see Attention
deficit hyperactivity disorder;
Autism spectrum disorders;
Epilepsy; Schizophrenia
slow cortical potential feedback, see Slow
cortical potential
vigilance for neurofeedback protocol
efficacy prediction and arousal
changes, 12�14
NIRS, see Near-infrared spectroscopy
NMDA, see N-Methyl-D-aspartate
OOmega-3 fatty acids, autism spectrum
disorder management, 164
PPain, functional magnetic resonance
imaging studies of nociception,
245
428 Index
Paired-associative stimulation (PAS),
transcranial direct current
stimulation, 337
Paroxetine, autism spectrum disorder
management, 160�161
PAS, see Paired-associative stimulation
PCA, see Principal component analysis
Pearson product-moment correlation,
electroencephalography, 29
PET, see Positron emission tomography
Phase reset, quantitative
electroencephalography, 11
Phenotype, see Endophenotype
Positron emission tomography (PET)
repetitive transcranial magnetic
stimulation mechanism studies,
271, 273, 282
tinnitus studies, 294, 296, 303, 307
Principal component analysis (PCA),
event-related potentials, 52
Psychopathy, functional magnetic
resonance imaging
neurofeedback studies, 246
QqEEG, see Quantitative
electroencephalography
Quantitative electroencephalography
(qEEG)
brain tumor findings, 198
evoked potential/response studies, 9�12
historical perspective, 79�81
intermediate phenotypes, 7
neurofeedback protocol efficacy
prediction
anxiety disorder case study, 16�17
arousal changes, 12�14
neural connectivity analysis, 14
phenotypes and behavioral patterns,
15
z-score training, 14�15
psychiatric medication studies, 7�8
reliability, 5�6, 107�109
therapeutic response studies, 8�9
transcranial magnetic stimulation
guidance, 17�19
RRepetitive transcranial magnetic
stimulation (rTMS)
depression studies
advances
protocols, 277�278
technical progress, 278�279
treatment optimization, 279�282
historical perspective, 18, 260�261
mechanisms of action
genetics, 276�277
neuroimaging, 271�272
neurotransmitters and
neuroendocrinology, 273�275
neurotrophins, 275�276
protocols
characteristics, 261�262
combined frequency stimulation,
265�266
high-frequency stimulation,
262�263
location for stimulation, 246�248
low-frequency stimulation,
263�264
stimulation intensity, trains, and
sessions, 268�270
electroencephalography guidance,
18�19
historical perspective, 258�259
overview, 17�18
principles, 257�258
tinnitus studies
methodological considerations, 310�311
principles, 296�297
repeated session studies, 303�310
safety, 311
single session studies, 299�303
Risperidone, autism spectrum disorder
management, 159
rTMS, see Repetitive transcranial magnetic
stimulation
SSchizophrenia
auditory evoked potential therapeutic
response studies, 10
429Index

Schizophrenia (Continued)
functional magnetic resonance imaging
neurofeedback studies, 246�248
slow cortical potential feedback studies,
221
SCP, see Slow cortical potential
Secretin, autism spectrum disorder
management, 162�164
Sensorimotor rhythm (SMR),
reinforcement in epilepsy, 186
Sequenced Treatment Alternatives to
Relieve Depression (STARD),
11, 81
Serotonin
attention deficit hyperactivity disorder
genetics, 357
repetitive transcranial magnetic
stimulation mechanism studies,
274, 281
Sertraline, autism spectrum disorder
management, 160
Short intracortical inhibition (SICI),
electroencephalography
neurofeedback effects on cortical
excitability and synchronization,
383, 393�394
SICI, see Short intracortical inhibition
Single-photon emission computed
tomography (SPECT)
repetitive transcranial magnetic
stimulation mechanism studies,
271, 273
tinnitus studies, 295
Slow cortical potential (SCP)
artifacts, 210�211
diagnosis and evaluation utilization,
215�217
origins, 206�209
overview, 205�206
training
amplifiers, 209�210
attention deficit hyperactivity
disorder, 219�220, 405�406
electrode application, 211
epilepsy, 184�185, 188, 217�218
first session, 214�215
locked-in syndrome, 221
migraine, 220�221
prospects, 222
protocol, 211�214
schizophrenia, 221
SMR, see Sensorimotor rhythm
SPECT, see Single-photon emission
computed tomography
STARD, see Sequenced Treatment
Alternatives to Relieve
Depression
Stroke, functional magnetic resonance
imaging neurofeedback studies in
rehabilitation, 245
Support vector machine (SVM), functional
magnetic resonance imaging
signal analysis, 235, 241
SVM, see Support vector machine
TtDCS, see Transcranial direct current
stimulation
Tinnitus
clinical features, 293�294
functional magnetic resonance
imaging neurofeedback studies,
246
neuroimaging studies, 294�296
neuromodulation rationale for
investigation, diagnosis, and
treatment, 297�299
repetitive transcranial magnetic
stimulation
methodological considerations,
310�311
principles, 296�297
repeated session studies, 303�310
safety, 311
single session studies, 299�303
Transcranial direct current stimulation
(tDCS)
current density, 327�328
event-related potential as index of effect,
70�73
high-density stimulation, 342
history of study, 323
long-term effects, 320
neurochemical effects
430 Index

membrane phospholipid alterations,
340
N-methyl-D-aspartate receptor, 338
neurotransmitters, 339
oxyhemoglobin, 339�340
neurophysiological effects
cortical silent period, 336
intracortical inhibition and
facilitation, 334�335
paired-associative stimulation, 337
transcallosal inhibition, 335�336
parameter variables and effects, 333�334
principles, 321�322
prospects for study, 341�342
safety, 340�341
stimulation
anodal versus cathodal, 320, 329�331
duration, 328�329
site, 331�332
transcranial delivery of current,
326�327
transcranial magnetic stimulation for
measurement of effects, 324�326
Transcranial magnetic stimulation,
see also Repetitive transcranial
magnetic stimulation
electroencephalography neurofeedback
effects on cortical excitability and
synchronization
corticospinal excitability, 390�393
neurofeedback
apparatus and
electroencephalography analysis,
384
data analysis, 385
training dynamic, 388�389
training protocol, 384�385
path analysis, 394�395
short intracortical inhibition and
facilitation, 383, 393�394
study design, 383�384
summary of findings, 395�399
transcranial magnetic stimulation
analysis of neuroplasticity
apparatus and technique, 385�386
electromyographic recording,
386�387
main effects, 389�390
overview, 382�383
statistical analysis, 387
quantitative electroencephalography for
guidance, 17�19
transcranial direct current stimulation
effect measurement, 324�326
VVIGALL algorithm, see Vigilance
Vigilance
attention deficit hyperactivity disorder
electroencephalography studies
overview, 94
phenotype similarity, 113
regulation, 101�105
depression electroencephalography
studies
overview, 94
phenotype similarity, 113�114
regulation, 100�101
electroencephalography modeling
overview, 95�97
validation
autonomic nervous system
function, 97�98
switching between different
vigilance stages, 98
VIGALL algorithm, 95
mania regulation, 101
neurofeedback protocol efficacy
prediction and arousal changes,
12�14
YYerkes�Dodson Law, 50
431Index

Examples eyes-closed EEG
FP1FP2F7F3FZF4F8T3C3CZC4T4T5P3PZP4T6O1O2
S 1.0 2.0 3.0 4.0 5.0 9 17 25 33 0.3 0.5 0.8 1.0
Figure 2.5 From left to right: about 5.5 s of eyes-closed EEG recorded at the standard19 leads described by the 10�20 electrode placement system, the 193 19 correlationmatrix of EEG time-series, the power spectra (red plot: 1 Hz�32 Hz), autocorrelationfunction (blue plot: lag5 0�1 s) and Hurst exponent (green bars) of the 19 EEG sig-nals. The entries of the correlation matrix are color coded, with white coding correla-tion equal to zero and red (blue) coding correlation equal to 1 (21). The entries indiagonal are the autocorrelations, hence they all equal 1. Note that electrode T3is much less correlated to other electrodes as compared to the others. This is becauseit contains a considerable amount of muscle artifacts (as seen also from the high-frequency content of the power spectrum and the flat autocorrelation function),which does not distribute through the head to other electrodes. (Please refer toChapter 2, page 34).

20%
20%
20%
20%(a)
(d)
(g)
(e)
(f)
(b) (c)20%
20%
10%
20%
20%
20%
20%
10%
10%
Inion
FP1
EEG (Down recording); 128Hr SR; 1–44Hz band-pass
FP2F7F3FZF4F8T3C3CZC4T4T5P3PZP4T6O1O2
iEEG
EEG source components
s 14.75
±1
EEGsource
(N = 18)
iEEG(N = 8)
0
15.75 16.75
e1
e2
e3
e4
e5
e6
e7
e8
s
s
19.50 20.50 21.50 22.50 23.50 24.50 8 16 24 32 0.3 0.5 0.8 1.0
8 16 24 32 0.3 0.5 0.8 1.019.50 20.50 21.50 22.50 23.50 24.50
Inion
NasionVertex
10%
10%
Nasion
Preauricalpoint
F3
F1T3
A1
Pg1
Fp1Pz
Fp1
Pg1 Pg2
F7
A1 A2
F3
C3C2
C4
P4PzP3
O1O2
F2 F2 F8
T4T3
T5 T6
Fp2
O1
FzCz
P3
C3
T5
Figure 2.6 A tinnitus patient was implanted with two rows of eight extradural intra-cranial recording electrodes. Nineteen scalp electrodes (EEG) and the intracranialelectrodes (iEEG) were recorded simultaneously with a common reference positionedon the vertex. (a) Position of the 19 electrodes on the scalp (10�20 system). (b)Demonstration of the surgical procedure to insert the extradural electrodes. (c)Computerized tomography of the patient’s head showing the location of the electro-des (over the left secondary auditory cortex). (d) Example 9 seconds of the scalp EEGdata. (e) Example 7 seconds of the intracranial data. (g) Four of the 18 sources esti-mated from scalp EEG data only with time-course corresponding exactly to the extra-dural recording in (e). (g) Correlation matrix between the 18 sources estimated fromthe scalp EEG and the eight extradural recordings (iEEG). The first source in (f) isstrongly correlated with the iEEG, which can be seen also from the time-course. Thesource localization of the first source by sLORETA confirmed that the source is gener-ated by the secondary auditory cortex (data not shown here; see Van der Loo et al.,2007). (Please refer to Chapter 2, page 38).

FzFrontal slow: Fz
Slow alpha peak frequency: Fz
PzFrontal slow: Pz
ADHD
ADHD ‘Normal EEG’ControlControl ‘Normal EEG’
Slow alpha peak frequency: Pz
100
10
1
0.1
100
10
1
0.1
100
10
1
0.1
100
10
1
0.11 3 5 7 9 11 13 15 17
Frequency (Hz)19 21 23 25
APF-ADHD APF-Control APF-‘Normal EEG’
27 29 1 3 5 7 9 11 13 15 17Frequency (Hz)
19 21 23 25 27 29
Figure 4.2 This figure clearly shows that the sub-group with a slowed alpha peak fre-quency (bottom), present parietally, also show elevated “theta EEG power” at frontalsites. However, this is not true “frontal slow”, but simply the effect of the slowedalpha peak frequency. This demonstrates that a raised theta/beta ratio at least alsoincludes the slow APF sub-group, which neurophysiologically is a different group, asdemonstrated later with respect to treatment outcome to stimulant medication.(From Arns, Gunkelman, Breteler, & Spronk (2008); reproduced with permission.) (Pleaserefer to Chapter 4, page 86).

Absolute “theta” EEG power Relative “beta” EEG power
40%
35%
30%
25%
20%
15%
10%
5%
0%
Norm
al EEG
Fron
tal s
low
Slow A
PF
Figure 4.3 The averaged brain activity of 275 ADHD patients compared to amatched control group. The figure left shows the increased theta (p , 0.0001) andright the decreased relative beta power (p , 0.0001). Note the frontocentral localiza-tion. The graph on the right shows that when inspecting the individual data setsonly 25% of children with ADHD (red) indeed exhibit “real frontal slow” or frontaltheta. Finally, about the same percentage exhibit a slow APF pattern, which after fil-tering will show up as “theta” but in fact is alpha, as explained below. (Please refer toChapter 4, page 89).
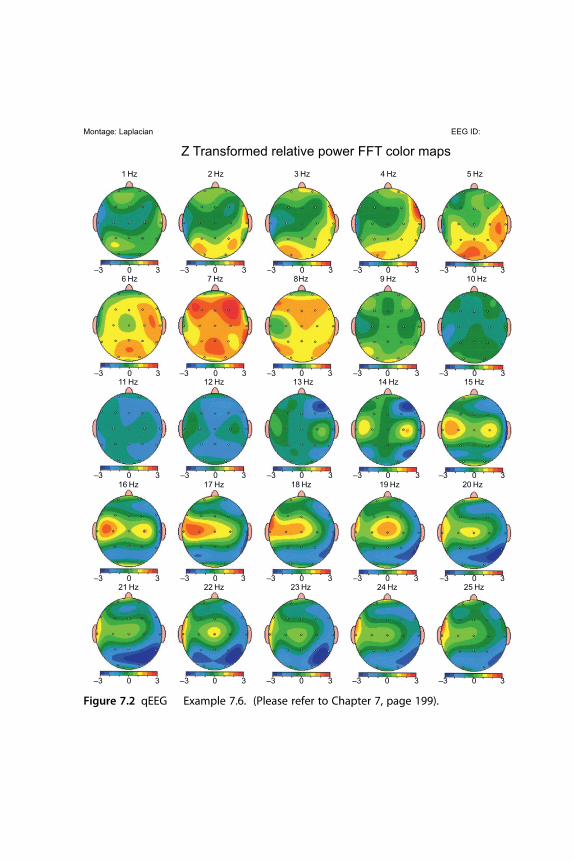
15 Hz
1 Hz
–3 30 –3 30 –3 30 –3 30 –3 30
–3 30 –3 30 –3 30 –3 30 –3 30
–3 30 –3 30 –3 30 –3 30 –3 30
–3 30 –3 30 –3 30 –3 30 –3 30
–3 30 –3 30 –3 30 –3 30 –3 30
2 Hz 3 Hz 4 Hz 5 Hz
6 Hz 7 Hz 8Hz 9 Hz 10 Hz
11 Hz 12 Hz 13 Hz 14 Hz
16 Hz 17 Hz 18 Hz 19 Hz 20 Hz
21 Hz 22 Hz 23 Hz 24 Hz 25 Hz
Montage: Laplacian
Z Transformed relative power FFT color mapsEEG ID:
Figure 7.2 qEEG � Example 7.6. (Please refer to Chapter 7, page 199).

Figure 8.1 Example of SCP feedback training screens for negativity (“Activation”,upper panel) and positivity (“Deactivation”, lower panel). (By kind permission ofneuroConn GmbH, Germany.) (Please refer to Chapter 8, page 212).
Figure 8.2 Example of SCP transfer training screen for negativity�activation task(left panel). Example of SCP visual feedback reward for successful activation ordeactivation (right panel). (By kind permission of neuroConn GmbH, Germany.)(Please refer to Chapter 8, page 213).

oMFCACC
ACC
ACC
PCC
oMFC
BA44/45
insula
arMFC
(a)
(b)
(c)
oMFC
arMFC
Visualcortex
PCC
min max0
Figure 9.2 Exemplary brain activation maps generated from a single subject wholebrain SVM classification showing discriminating voxels for: (a) happy vs. disgust clas-sification, (b) happy vs. sad classification, and (c) disgust vs. sad classification. Brainregions: oMFC, orbital medial frontal cortex; arMFC, anterior rostral MFC (based onAmodio & Frith, 2006); OFC, orbitofrontal cortex; ACC, anterior cingulate cortex; PCC,posterior cingulate cortex. (Please refer to Chapter 9, page 242).

Time 1 Time 2
(a)
(d)
4 3.53 2.5
Z score
2 1.51 0
(e) (f)
(b)
(c)
CON
EXP
X = –16 X = –12
X = –12 X = –23X = –3X = –36
Figure 13.1 Statistical activation maps at Time 1 and Time 2 produced by theInterference minus Neutral contrast. Images are sagittal sections for the data aver-aged across subjects. At Time 1, significant loci of activation were detected in the leftsuperior parietal lobule for both the CON (a) and EXP (c) groups. At Time 2, activa-tions were also noted in this cortical region for the CON (b) and EXP (f) groups. Inaddition, for the EXP group only, significant loci of activation were measured in theright ACcd (d), as well as the left caudate nucleus and left substantia nigra (e).(Reproduced from Beauregard & Lévesque (2006) by permission of SpringerScience1 Business Media.) (Please refer to Chapter 13, page 365).
(a)
(d)
(b) (c)
X = –12X = –3X = 3
X = 21Z score
5 4 3 2 1 0
Figure 13.2 Statistical activation maps measured at Time 2 in the EXP group (NO-GOminus GO contrast). Significant loci of activation were measured in the right ACcd(a), left thalamus and left substantia nigra (b), left caudate nucleus (c), and right ven-trolateral prefrontal cortex (d). (Reproduced from Beauregard & Lévesque (2006) by per-mission of Springer Science1 Business Media.) (Please refer to Chapter 13, page 366).