Embed Size (px)
Citation preview

AD-A174 575 NEUROELECTRIC PREDICTORS OF PERFORANCE ACCURACY(U) fEG i/lSYSTEMS LAB SAN FRANCISCO CA A S GEVINS 31 JUL 86AFOSR-TR-86-0675 AFOSR-85-836i
UNCLASSIFIED F/G 6/16 UL
L ,

Li
a I L
ilii
W WaE. - No
Ji.2 L.
RESOLUTI"d TEST CHART
Ln ~ AFOSR*TR- 90~-0675E GIl C!.9 SYTEMS
Ln LABDORA TORY
4 NEUROELECTRIC PREDICTORS OF PERFORMANCE ACCURACY
3 FINAL REPORT
Grant AFOSR-85-0361
5 30 September, 1985 -31 March, 1986
Approved f or Public release:dQ~stp 4 "nflimlited.
Prepared for: ,,9 is
Dr. A. R. FregiProject Contra~OfficerDirectorate of Life SciencesAir Force Office of Scientific ResearchBolling Air Force Base, D.C. 20332
C.I 0i i C'Alan S. Gevins. Director
- 1855 FOLSOM ST.. SUITE a10 1I N OV 28 "4
*SAN FRANCISCO, CA 94103 - O(415) 621-8343 z
1. A9 OCT R3 A nOn-PIP011 WbOrllory dedicated to research on thie higher cogliflve ktunCU ilS of fC hUman brainl

UNCLASSI FIEDSECURITY CLAS FCATIdP OF P415 PAGE
REPORT DOCUMENTATION PAGEIs. REPORT SECURITY CLASSIFICATION lb. RESTRICTIVE MARKINGS
UNCLASSIFIED________________________2a. SECURITY CLASSIFICATION AUTHORITY 3 DISTRIBUTION /AVAILABILITY OF REPORT
2b. DECLASSIFICATION / DOWNGRADING SCHEDULE APPROVED FOR PUBLIC RELEASE,DISTRIBUTION UNL IM ITED
S 4. PERFORMING ORGANIZATION REPORT NUMBER(S) S. MONITORING ORGANIZATION REPORT NUMBER(S)
AFOSR04 AFOSR-TR. 8 6 -0 6756a. NAME OF PERFORMING ORGANIZATION 6b. OFFICE SYMBOL 7a. NAME OF MONITORING ORGANIZATION
EEG SYSTEMS LABORATORY DIRECTORATE OF LIFE SCIENCES, AFOSRE.6r ADDRESS (Ot, State, and ZIP Code) 7b. ADDRESS (City, State, and ZIP Code)
S1855 FOLSOM STREET, RM.. 610 BUILDING 410SAN FRANCISCO, CA 94103 BOLLING AFB, D.C. 20332
Ba. NAME OF FUNDING / SPONSORING Sb. OFFICE SYMBOL 9. PROCUREMENT INSTRUMENT IDENTIFICATION NUMBERORGANIZATION IOf appkiable)AFOSR I NL AFOSR-85-0361
Bc. ADDRESS (City, Stat., And ZIP Codep) 10. 5URCE OF FUNDING NUMBERSBUILDING 410 PROGRAM PROJECT TASK WORK UNIT
BLIGABD..232ELEMENT NO. NO. NO. ACCESSION NO.
11. TITLE (nclude Securiy a wlsicatran) 6 1 2 3 3A
NEUROELECTRIC PREDICTORS OF PERFORMANCE ACCURACY
12. PERSONAL AUTHOR(S) GEVI NS, A .S.
13a. TYPE OF REPORT 11 3b. TIME COVERED 14. DATE OF REPORT (Year, Alonth, Day) S. PAGE COUNTFINAL IFROMB~ T 1 8673'I 2
16. L SUPPLEMENTARY NOTATION CO-AUTHORS: MORGAN, N.H., BRESSLER, S.L., CUTILLO, B.A., WHITE, R.M.,ILLES, J.., GREER, D.S. & DOYLE, J.C.
17. COSATI CODES 18. SUBJECT TERMS (Continue on reverse if necessary and identify by block number)YFIELD GROUP SUB-ROUP PERFORMANCE ACCURACY PREDICTION, NEUROELECTRIC EVENT-
058 RELATED COVARIANCES, PREPARATORY NEURAL NETWORKS
S 19. ABSTRACT (Continue on reverse if necessary and identify by block number)
We have been advancing the measurement of neuroelectric substrates of human cognitivefunctions in relation to quality of performance. During the past year we analyzed
~ the data of healthy volunteers performing tasks that manipulated basic cognitive andvisuomotor functions, such as those critical for flying high performance aircraft.We report the existence of complex "preparatory neural networks" that may be pre-requisite to accurate performance.
S 20. DISTRIBUTION/I AVAILABILITY OF ABSTRACT 21. ABSTRACT SECURITY CLASSIFICATIONWUNCLASSIFIED/UNLIMITED 0 SAME AS RPT. Q3OTIC USERS UNCLASSIFIED
22a. NAME OF RESPONSIBLE INDIVIDUAL 22b. (TELEPHONE (Include Area Code) 22 . OFFICE SYMBOLA. FREGLEY (202) 767-5024 A1RN
DO FORM 1473,84 MAR 83 APR edition may be used until exhausted. SECIRfITY CLASSIFICATION OF -HIS PAGEAll other editions are obsolete.
UNCLASSI F IED
* -3-
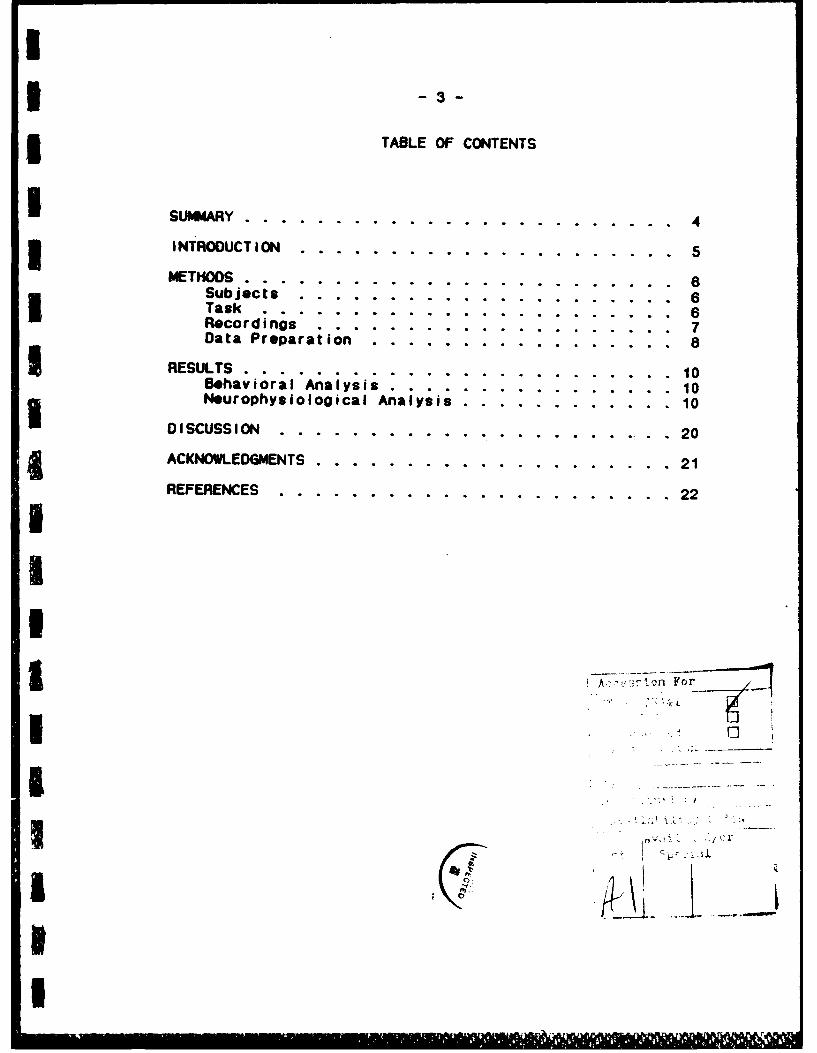
5 TABLE OF CONTENTS
ISUMMARY .. .. ...................... 4
IINTRODUCT ION. .. .................... 5METHODS .. .. .......................
Subjects. .. .................... 6Task. .. ...................... 6Recordings. .. ................... 7Data Preparation. .. ................ 8
I ~ ~~RESULTS. .......................... 1Behavioral Analysi.... ............. 10Neurophysiological Analysii.'*... .... ........ 10
DISCUSSION .. ...................... 20
ACKNOWLEDGMENTS. .. ........ ........... 21
REFERENCES .. ...................... 22
I A' IOIIFor
Inv

I
1i -4-
i SUMMARY
We have been advancing the measurement of neuroelectricsubstrates of human cognitive functions in relation to quality ofperformance. During the past year we analyzed data from healthyI volunteers who performed tasks that manipulated basic cognitiveand visuomotor functions, such as those critical for flying highperformance aircraft. We report the existence of complex"preparatory neural networks" that may be prerequisite toaccurate performance.
2 - Brain electrical patterns of seven right-handed adults were foundto be different preceding accurate and inaccurate performance.Activity overlying the left frontal cortex and the motor andparietal cortices contralateral to the performing handcharacterized subsequently accurate left- or right-handperformance. Additionally, strong activity overlyingsupplementary motor and premotor cortices preceded left-handperformance. Group patterns significantly distinguishedsubsequently accurate or inaccurate performance by individuals.
r These measurements suggest that brief, spatLally distributed
j neural activity patterns, or 9lreparatory sets, "tv recorded fromdistinct cognitive. somesthetic-motor. and integrative motorareas of the human brain may be essential precursors of accuratevisuomotor performance.
These precursors of performance accuracy were not present in evenhighly enhanced conventional averaged evoked potentials. Ourfindings suggest that important functional relations betweenareas of the human brain may be characterized by measuring thesimilarity of wave shape and timing between appropriatelypreprocessed low-frequency brain waves recorded from differentchannels at the scalp. Work is underway to verify the actualsources in the brain these scalp-recorded patterns.
I

3
-5-
3 INTRODUCTION
Preparatory set for human visuomotor performance, defined as astate of readiness to receive a stimulus or make a response(Evarts et al.. 1984) has been studied by a variety ofdisciplines. Temporal properties of preparatory sets have beenmeasured in information-processing studies, but such studies havenot focused on the underlying neural systems (Posner, 1978).Spatial properties of preparatory sets have been measured incerebral blood flow studies, revealing increased metabolicactivity for sensory-specific focus of attention in superiorprefrontal, midfrontal and anterior parietal cortices (Roland,1982). These studies, however, have been limited by the temporalresolution (1 minute or longer) of blood flow measurementtechniques. Clinical neuropsychological studies have demonstratedthat behaviors requiring preparatory sets rely on intact lateralfrontal regions (Luria, 1966; Milner and Petrides, 1984; Stussand Benson, 1986; Teuber. 1964), but variability in size andlocation of lesions has limited the spatial specificity of suchstudies in localizing normal function. And although scalp-recorded brain electrical and magnetic recordings provide bothspatial and temporal information on neural activity underlyingpreparatory sets, studies of the Contingent Negative Variation(CNV), an event-related brain potential component thought to berelated to preparatory set, have often yielded controversial orambiguous results (reviewed in Gevins and Cutillo, in press;Rohrbaugh et al., 1980; Tecce. 1972).
By recording from an increased number of electrodes, and by usingseveral signal enhancing procedures, we have measured therapidly changing spatial patterns of mass neuroelectric activityassociated with preparation and execution of precise right- andleft-hand finger pressures in response to visual numeric stimuli.During the prestimulus period, we found differences betweenpatterns associated with subsequently accurate and inaccurateperformance. The results suggest, therefore, that a spatiallyspecific, multi-component neural preparatory set, composed of aninvariant left frontal component and hand-specific contralateralcentral and parietal components, may be essential for accurateperformance of certain types of difficult visuomotor tasks.
pefrac ye

3 METHODS
Seven healthy, right-handed male adults were recruited from theconinunity. They were each informed of the risks and benefits ofthe study and paid for participation.
The subjects were required to exert rapid. precisely gradedpressures (forces from 0.1 to o.g kg), followed by iowediaterelease, with right- and left-hand index fingers in response tovisual numeric stimuli (numbers 1 to 9). Each stimulus wasI.presented I second after a cue. The cue was the letter *V" thatlasted 0.3 sec and was slanted at a fixed angle (30 degrees) tothe right or left to indicate the required response hand. Thedirection of the slant was determined randomly for successivetrials. The cue, stimulus and feedback about performance werepresented on a Videographics-Il CRT monitor located 70 cm from3 the subject, and were controlled for duration and visual angle.
Eighty percent of the trials were response trials. In thesetrials, the stimulus was slanted in the same direction as thecue, and the-subject was to respond quickly with finger pressureof the indicated hand, with a force corresponding to the stimulusnumber on a linear scale from I to 9 (Table 1).
3In order to help subjects calibrate their responses, the pressureproduced was displayed after completion of each response. Thisfeedback indicating exact response pressure to a tenth of astimulus unit was presented as a two-digit number 1 second afterthe peak of response. The feedback number was underlined toindicate a "win" when the response error was less than the recentperformance level, which was updated on-line after each trial asI the average error from the preceding 5 trials for each handseparately. This criterion made it harder for the subject to winthe monetary bonus (5 cents) paid for "win" trials as performanceimproved. Together with rest breaks, possible systematic changesin arousal level were thus minimized. Monetary penalties (10cents) were deducted for responding to miscued "catch" trialsdescribed below.
In a random 20% of the trials, the stimulus was slanted oppositeto the cue and the subject was to make no response. Thesemiscued "catch" trials ensured that subjects attended to the cuss
Each subject performed between 900 and 1000 trials over a periodI of 5 to B hours, with frequent rest breaks. Subjects practiced
LQL I

* - 7-
5 the task learning the motor control and the conditions of rewardand penalty, in a pretesting session that continued until theperformance level approached a stable asymptote.I
3 Table I
*RIGHT/LEFT INDEX FINGER -PRESSURE TASKCUE STIMULUS RESPONSE FEEDBACK
GET READY REQUIRED PRODUCE NOW ACCURATE?FOR LEFT OR RIGHT RESPONSE PRESSURE
RESPONSE PRESSURE
V RIGHT HAND 2.54 UNITS
ULEFT HAND
&.3 UNITSI I I I I0 1 1.5 2 3
Electrodes were placed according to an expanded version of theTen-Twenty Electrode System in which additional coronal rows ofelectrodes were interposed between the original rows. Theanterior midline parietal electrode was used as reference. Brainpotentials from 26 scalp electrodes, vertical and horizontal eyemovement potentials, and flexor digitori muscle potentials ofboth hands were recorded onto magnetic tape at 128 Hz from 0.75sec before the cue to I second after feedback. The band pass hada 6 decibel/octave rolloff below .1 Hz and 24 decibel/octaverolloff above 50 Hz. The rolloff below .1 Hz was gradual enoughto allow sensitivity to ultra-low frequency brain potentialU components.
!

981a Prerfation:
The Laplacian operator, a spatial pattern enhancement technique,was applied to the brain potentials at every time point to reducethe blur distortion that results as potentials are transmittedfrom the brain to scalp (Hjorth, 1975; 1980). This operationremoved the effect of the reference channel. Peripheral channelswere not transformed because application of the Laplacianoperator to an electrode requires surrounding electrodes, whichare absent for channels at the edge of a recording array.Sixteen channels remained: left and right frontal (F3, F4),midline frontal (Fz), left and right antero-central (aC3, aC4),midline antero-central (aCz), left and right central (C3, C4),midline central (Cz), left and right antero-parietal (aPI, aP2),midline antero-parietal (reference; aPz), left and right parietal(P3, P4), midline parietal (Pz), and midline antero-occipital(aOz).
Two independent raters edited the data for artifacts by visualinspection of brain, eye movement and muscle potential polygraphchannels. Trials with artifacts due to eye movement, head orelectrode movement, or scalp muscle contamination wereeliminated, as were trials with slow, bimodal, or delayedresponses, or with flexor digitorum activity between the cue andthe stimulus. Remaining trials (80%) were then sorted forresponse accuracy, and the two sets of trials were balancedaccording to a number of criteria in order to eliminate theconfounding of inaccuracy per se with possible performancevariations due to transitory and longer-lasting changes inarousal and learning. Accurate and inaccurate performance datasets consisted of trials in which the error (deviation fromrequired pressure) for each subject was less and greater,respectively, than his mean error over the entire recordingsession.
Classifying performance separately for each individualcompensated for between-subject performance differences. Hence,each data set contained trials from each subject. Outlying trialson the distribution of recent performance level were eliminatedto ensure that accurate and inaccurate data sets did not differfrom each other in this variable. This correction eliminated thepossibility that inaccuracy would be confounded by performancevariations due to transitory changes in arousal. Furthermore,accurate and inaccurate trials were evenly distributed throughoutthe recording session in order to eliminate confounds due tolearning and tonic arousal.
To quantitate the electrical activity of the brain, we measuredthe covariance (similarity of waveshape) between different pairsof electrodes over brief segments (187 or 375 msec) of event-related (cue, stimulus, response, feedback) waveforms averagedfrom the seven subjects. This approach is based on the hypothesisthat when areas of the brain are functionally related, there is aconsistent pattern of waveshape similarity between their

-9-
macropotentials (Livanov, 1977; Freeman, 1975, in press; Gevinset al., 1981, 1983, 1985; Gevins, In press a). Covariancesbetween each of the 120 combinations of the 16 Laplacian-transformed channels were computed from enhanced and filteredaverage waveforms. Enhanced averages were formed from sets oftrials selected as follows: for each channel, sets of single-trial data samples in a 250-msec interval centered 750 msec afterthe cue were submitted to a mathematical pattern classificationprogram. The program attempted to discriminate the event-relatedtrials from a "noise" data set with statistical propertiessimilar to the ongoing EEG in corresponding channels. In eachinterval significantly distinguished channels (p.05) weretabulated for each person. The enhanced averages were formedfrom those trials in which a majority of the tabulated channelswere significantly classified (Gevins et al.. 1986). Covariancefor each electrode pair was determined by computing thecrosscovariance function between their waveform segments, laggingone channel with respect to the other from 0 to 125 msec. Thevalue of covariance was the maximum absolute value of thatfunction.
Covariances were analyzed to determine whether they weresignificantly different from noise values; we could then comparethe levels of significance of each electrode pair under differentexperimental conditions. The maximum absolute value ofcovariance was converted to a significance (after square roottransformation) by comparison with a noise median and an estimate
of noise variance using a Tukey Biweight Scale estimate. Thesestatistics were determined from sample distributions of thesquare root of zero-lag covariances between intervals centeredaround samples with the minimum energy envelope derived from theHilbert transform. Duncan's correction procedure was applied tocontrol for the 120 comparisons within each interval. Detailedsignal-processing methods and analyses of stimulus-, response-,and feedback-related patterns are reported elsewhere (Gevins etal., In prep a, b).
S

* -10-
3= RESULTS
Behavioral Analylis:
For right- and left-hand accurate performance, mean error(deviation from the required pressure) was .35 (range =.24 to.52) and .39 (range =.28 to .51), respectively. For right- andleft-hand inaccurate performance, mean error was 1.62 (range=1.18 to 1.96) and 1.66 (range= 1.40 to 2.18), respectively.
Mean reaction time, averaged across all subjects, was consistentamong hand and accuracy conditions (610-618 msec).
~Neuro02bX!i~oIicaI Analylis:
To validate the covariance analysis in a known case, theprocedure described above was applied to waveforms time-registered to the onset of the finger pressure response (Deeckeet al., 1985; Goldberg, 1985; Ingvar and Philipson 1977; Pieperet al., 1980; Foit et al., 1980; Roland et al., 1980). The mostsignificant left- and right-hand covariances occurred betweenelectrodes overlying cortical regions involved in motor execution(Figure 1) . The major peak in the Laplacian waveform during theresponse was centered 62 msec after response onset and was about190 msec wide; therefore a 4 to 7 Hz bandpass filter and acovariance interval of 187 msec were used. (Given the highsignal strength of overt movement and the resulting large numberof significant response-related covariances, only the topstandard deviation of significant covariances could be shown inFigure 1 without creating an overly complex display.)
JConsidering all significant covariances, left-sided covarianceswere significantly greater than the comparable right-sided onesby the Student's t-test at p((.O001 (t=18.5) for the right-handreuponse. Significant right-sided covariances were significantlygreater than the left at p((.0001 (t=21.5) for the left-handresponse. The right antero-central electrode site did not appearin the left-hand pattern in Figure 1 because its significance wasslightly below the one standard deviation cutoff.
The patterns of covariance in Figure 1 presented much morespatially discrete information than did their correspondingamplitude maps. Amplitude maps were made by determining theaverage amplitude of the Laplacian waveform for each electrodesite over the same interval used to calculate covariances, andinterpolating between sites. Amplitude is represented on a colorscale with red representing the maximum and violet the minimum,and is presented on the same diagrams as the covariance patternsfor ease of comparison. In the 187-msec interval centered on thepeak of the response (62 msec after response onset), right- and
U

I-11-
U
4i
Fig. 1. View of the most significant between-channel covariancepatterns (colored lines), looking down at the top of the head,from the wave at the peak of the response, superimposed oncolored maps of that wave's amplitude. The motor-related wavewas measured during a 187-msec interval centered on the peak ofleft-hand (A) and right-hand (B) index finger pressures fromseven right-handed men. The thickness of a covariance line isproportional to the negative log of its significance (from .05 to.00005). A violet line indicates a positive covariance (motor-related waves with the same polarity), while a blue lineindicates a negative covariance (motor-related waves withopposite polarities). The color scale at the left, representingwave amplitude, covers the range from the minimal to maximalvalues of the two maps. All covariances involve the siteoverlying supplementary and premotor cortices. There is a stronglateralization of frontal, central and antero-parietalcovariances over the hemisphere contralateral to the respondinghand, consistent with the lateralization of the amplitude maps.
II

-12-
left-hand covariance patterns were near mirror-images. In bothpatterns, all covariances involved the midline antero-centralsite overlying the premotor and supplementary motor cortices.Covariances between this site and the left frontal, antero-central, central and antero-parietal sites for right handresponses, and between corresponding right hemisphere sites(except right antero-central) for the left hand, were allconsistent with known motor-related cortical areas.
The procedure was then applied to the cue-to-stimulus period toIstudy preparatory sets. A delta (up to 3 Hz) lowpass filter and a
covariance interval width of 375 msec were used to study thelow-frequency CNV component (Figure 2). Comparison by theStudent's t-test of mean squared amplitude, measured on eachLaplacian waveform (over the same 500 to 875 msec post-cueinterval as was used for the covariance) between subsequentlyaccurate and inaccurate conditions of each hand was notsignificant (p)0.05).
Similarity between the sets of CNV amplitudes, or betweencovariance maps, was measured with an estimate of the correlationand its confidence-interval. For the small number of repeatedmeasures, a normal distribution could not be confirmed.Therefore, robust, resistant estimates were calculated using adistribution-independent "bootstrap" Monte Carlo procedure(Efron, 1982), that generates an ensemble of correlation valuesfrom randomly selected choices of the repeated measures. When thedistributions of CNV amplitudes from subsequently accurate andinaccurate conditions were compared by this procedure, thecorrelations were 0.84 +/- 0.16 preceding right hand performance,and 0.83 +/- 0.14 preceding left hand performance. These resultsindicate that discriminating between subsequently accurate andinaccurate waveforms based on the mean squared amplitude of theaveraged event-related CNV waveforms is not possible.
During this same period, however, well-defined between-channelcovariance patterns related to subsequent accuracy' werediscovered. They first appeared in the interval centered 500 msecafter the cue and became well-differentiated between accurate andinaccurate conditions in the 500 to 875 msec interval (centered313 msec before stimulus onset) spanning the late component ofthe CNV. The lack of muscle potential and eye movement signals inthese intervals confirm that these patterns were neural in origin(Figure 3).
Covariance patterns during the period between the cue and
stimulus (Figure 4) were distinct from those related to overtfinger responses. During the interval from 500 msec to 875 msecafter the cue onset, covariance patterns associated withsubsequently accurate right-hand performance involvedpredominantly left hemisphere sites, particularly left frontal,central, parietal, and antero-parietal sites. These 4 sites werethe most prominent in that the numbers of significant covariancesin which they were involved each exceeded one half of the maximum
i

3 -13 -
CIE TO 'fi PARE FOR A CUE TO PREPARE FOR ALEFT Sim FINGER RESPONSE LEFT mxx MISR REINS-7
ACCURATE TRIASI M" TE TfALS
0.1 M 0.1
WV 0 P
0.cmTEL 1 01 I t 0.5 - I5 1 12
DTA PS. nJL. an SY1D6 LMWT0WV DELTA MANIM 2-JL-. XEG MTE1S AMOAORY
(a) ()
Fi. 2.Apiue rtecningn eaievaito Ccomputed I duOn hE cu-o-tmuu peid Amltue bLT PEAEtweenAfitred (belo 3OM REz),S evn-eae Ialca wav IM EOmS,
avrae Iro seemujcsmrentsgiiatl ifrnoAILR RIL F&the comarso oflf-cuae()wt etiacrt B
codiios or ritacre (C0ihrgtiacrt D3 condi t ions
IOSCa_.

- 14-
a (a)
-sam ST
t~su i i,~
I *
6 Lk ---04 0 i-.-:j _ _ 0 I
-- OI W & I 0 .W?) r
-t II '
Fig 3. Avrgdetcl an oiotleemvmn inl
* 0,1 u 07 1 I Ii
P PE@PUL SRO.614T IR5MA 454-11 LWIR LSMIDLW a.JLL- YIrlM L*OAATCR'
I -II I
I
_ during the cue-to-stimulus period for right- and left-hand trials
from the seven subjects (A). Averaged muscle potential signals
from right flexor digitori during the cue-to-stimulus period
(arbitrary units) (0). Muscle potentials during overt movements
were many times larger (Q). (Averaged muscle potential signals
from left flexor dioitori showed the same relation.) Since thereI is no evidence of eye or muscle movements during either right- or
left-hand preparation, the covariance patterns in Fig. 4 are not
duo to over t movements.
!.!S

I
II
II
Fig. 4. View of the significant (p(0.05) between-channelcontingent negative variation (CNV) covariance patterns, lookingdown at the top of the head, superimposed on maps of CNVamplitude. Measurements are from an interval 500 to 875 msecafter the cue for subsequently accurate and inaccurate left-hand(A) and right-hand (B) visuomotor task performance by sevenright-handed men. The thickness of a covariance line isproportional to its significance (from .05 to .005). A violetline Indicates the covariance is positive while a blue lineindicates that the covariance is negative. Covariances involvingleft frontal and appropriately contralateral central and parietalelectrode sites are prominent in patterns for subsequentlyaccurate performance of both hands. The magnitude and number ofcoviriances are greater preceding subsequently inaccurate left-hand performance and are more widely distributed compared withthe left-hand accurate pattern. For the right-hand, fewer andweaker covariances characterize subsequently inaccurateperformance. The amplitude maps are highly similar for the fourconditions, and do not indicate any of the specific differencesevident in the covariance patterns.
UUIiII

Iu
Figure 4(A)
UI -IT-
IIUIUINIUIII
Figure 4(B)
IUUI

- 18 -
number at any site (9 for the antero-parietal site). The othersites in the pattern were involved in one third, or less, of thatmaximum. The same criterion was used to judge which sites wereprominent in the left-hand pattern. All 24 significantcovariances involved sites on the left side and 18 (75%) wereexclusively on the left side. The covariance pattern precedingsubsequently accurate left-hand performance for this intervalinvolved predominantly right-sided sites. Of 18 significantcovariances in this pattern, 13 (72%) involved right hemisphericsites. The right-sided central, parietal and antero-parietalsites were most prominent, compared to corresponding prominentcontralateral sites for the right-hand accurate pattern. Theleft frontal site was prominent preceding both left- and right-hand performance. The midline central and antero-central siteswere prominent in the left-hand pattern, but were not among themost prominent in the right-hand pattern.
Only two significant covariances were related to subsequentlyinaccurate right-hand performance in this interval, namely, leftparietal and antero-parietal to left frontal. In contrast, thesubsequently inaccurate covariance pattern for the left hand was
0more bilateral and complex than the subsequently accuratepattern. In addition to the cue-to-stimulus period, the post-stimulus and post-feedback periods also showed differences
related to accuracy, but the response period did not (Gevins etal., In prep. a.b).
The signal strength of pre-stimulus covariances was much smallerthan those during overt responses, that is, the scale ofsignificance was three orders of magnitude smaller. The smallernumber of pre-stimulus covariances allowed all significantcovariances to be shown in Figure 4. Comparison by the Student'st-test of the sets of subsequently accurate and inaccuratecovariances was significant at p(.001 for both left- (t=5.57) andright-hand (t=7.70) comparisons. The "bootstrap" correlationbetween covariance patterns preceding subsequently accurate andinaccurate performance from channel pairs that were significantfor either condition was 0.57 +/-0.09 for the right hand, and0.10 +1-0.14 for the left hand. The t-test and "bootstrap"correlation results, taken together, suggest that the left-handaccurate and inaccurate conditions differ both in scale and inpattern, while the right-hand results differ only in scale.Unlike the between-channel covariance patterns, the CNV amplitudemaps were highly similar for both accuracy conditions and hands,and were not useful in determining what areas would covary.
Using statistical pattern classification procedures, covariancesshown in Figure 4 were considered as possible variables todistinguish subsequent performance accuracy. The classifier wasa nonlinear, adaptive, two-layered decision network (Gevins, In
I press b; Gevins and Morgan, In press; Gevins et al., 1981, 1983,1985) that decided from CNV-interval between-channel covariancesof each trial whether subsequent performance was accurate orinaccurate. This algorithm produced, by a recursive procedure,
I

-19-
classification equations consisting of weighted combinations ofthe decisions of discriminant functions, which themselvesconsisted of weighted combinations of a subset of the covariancevalues of Figure 4. Cross-validation of the equations wasperformed by testing equations on data that were not used toderive them. Significance was determined according to thebinomial distribution. (Details of the application of patternclassification procedures to the analysis of brain signals arepresented in Gevins, in press b, and Gevins and Morgan, inpress). These conservative procedures notwithstanding, we mustcaution that the degree of generalization of these results to thepopulation at large is unknown and can only be determined byadditional studies with new subjects.
When the trials of each of the 7 subjects were classified byequations developed on the trials of the other 6 subjects, theoverall discrimination was 59% (p0O.01) for right hand and 57%(p(O.01) for left-hand performance. Discrimination of subsequentright-hand performance accuracy was above 57% for 6 subjects andwas 50% for the seventh. For left-hand performance,discrimination for 3 subjects ranged from 56% to 67%, and was 53%or below for 4 subjects (who had fewer trials overall). Average
* classification of each fifth of the trials from the 4 subjectswith lowest left-hand discrimination, using equations from theother four fifths, was 61% (p(O.O01). This suggests that the 4subjects had similar covariance patterns preceding left-handperformance, which were different from the other 3 subjects. Thegreater uniformity for right- over left-hand discriminationsuggests that there are similar covariance patterns among thestrongly right-handed subjects preceding accurate and inaccurateright-hand performance, and a divergence of patterns precedingleft-hand performance. While there were differences inIdiscriminative power between individuals, overall the grouppreparation patterns were clearly effective in deciding anindividual's subsequent performance accuracy. For the onesubject with the most trials, average classification of 68%(p(.001) for subsequent right- and 62% (p(.01) for subsequentleft-hand performance was achieved by testing a separate equationon each fifth of his trials, formed from the other four fifths.
ioI

I
* - 20-
DISCUSSION
Although the origin of these event-related between-channelcovariance patterns of preparatory sets is not known, our resultssuggest that preparation for accurate performance in a visuomotortask involves several brain components (Ruchkin et al., 1986): acognitive component manifested by invariant activity at the leftfrontal covariance site, a hand-specific somesthetic-motorcomponent manifested by the contralateral central and parietalsites, and an integrative motor component manifested by activityat the midline central and antero-central sites. The lastcomponent was strong in the pattern preceding accurate left-handperformance and weaker in that preceding accurate right-handperformance. For both hands, preparatory covariance patternswere different from those accompanying actual response execution.Covariance patterns preceding inaccurate performance by each handdiffered markedly. The relative tack of significant covariancespreceding inaccurate right-hand performance may be interpreted asevidence for a weakened preparatory set. By contrast, thecomplex, anatomically diffuse but strong patterns in the left-hand condition suggest that inaccurate performance by thenondominant hand of strongly right-handed subjects may resultfrom erroneous, possibly confounded, preparatory sets.
Our evidence for distributed, coordinated, preparatory componentsof human visuomotor performance is consistent with previousstudies of this aspect of behavior. The involvement of the leftfrontal site is consistent with evidence that preparatory sets inhumans are synthesized and integrated in left dorsolateralprefrontal cortices (Fuster, 1984; reviewed in Goldman-Rakic,1984; Luria, 1966; Milner and Petrides, 1984; Stuss and Benson,1986; Teuber, 1964). The finding of an appropriately lateralizedparieto-central somesthetic-motor component is consistent withdata that show neuronal firing patterns in the motor cor'tex ofnonhuman primates, and localized potentials in the somestheticcortex of humans, preceding motor responses (Evirts et al., 1984;Mountcastle, 1978; Lee et al., 1986). Finally, a midlineantero-central integrative motor component is consistent withinvolvement of premotor and supplementary motor regions ininitiating existing motor schemes and establishing new ones(Roland, 1982, 1985a, 1985b).
Our results demonstrate that the human brain, unlike a fixed-program computer, dynamically "programs" its distributed,specialized subsystems in anticipation of the need to process acertain type of information and take a certain type of action.When these preparatory sets are incomplete or incorrect,subsequent performance is likely to be inaccurate. The fact thatclassification of performance accuracy improved when equationswere formed and tested on the same subjects suggests thatsingle-subject equations formed from large numbers of normative
U
I* - 21-
trials may make covariance patterns useful for on-line predictionof subsequent behavior.
IACKNOWLEDGMENTS
In addition to the Life Sciences Directorate of the Air ForceOffice of Scientific Research. the technical developments whichproduced these results were supported by the Air Force School ofAerospace Medicine, the National Science Foundation, the NationalInstitutes of Neurological Diseases and Strokes, and the Officeof Naval Research. In addition to the authors listed on thetitle page, programming was performed by Robert S. Tannehill andGerald M. Zeitlin.
I
I
I
IIU !II ' ¥ ,~,:

£ -22-
REFERENCES
Deecke, L.. Kornhuber, H.H.. Lang, W., Lang, M. & Schreiber. Hl.(1985) Timing funct ion of the frontal cortex in sequential motor3 and learning tasks. Human~ N~ty~etQ12QY, 1 (3), 143-154.
Efron, B. (1982) Ibp Jackn ito, the Boo tstrae, ang Other86amQijog eJliol. SIAM: Philadelphia.
Evarts, E.V., Shinoda, Y. & Wise, S.P. (1984) No2YUrgYsiological622roaches to Higher Brain Functions. Wiley: New York.
Foit, A., Larsen, B., Hattori, S., Skinhoj, E. & Lassen, N.A.(1980) Cortical activation during somatosensory stimulation andvoluntary movement in man: A regional cerebral blood flow study.EE Clin. Neur22bH1i2!- §2 426-436.
Freeman, W. (1975) ftag 6gligo inL th@ L4@Qyg 5X1m New York:Academic Press.
Freeman, W. (in press) Analytic techniques used in the searchfor the physiological basis of the EEG. In A.S. Gevins and A.Remond (Eds.), MAd 21 6011s O21 tlain EletrIical andMagoQi±ig 5igLoaa. b902 ! QI C119L2209p204!QgLA1tY godClinical Neuroghysiology. (Vol. 1). Elsevier: Amsterdam.
Fuster, J.M. (1984) Behavioral electrophysiology of theprefrontal cortex. ITrD~j in Neurosciences, Z (11), 408-414.
Gevins, A.S. (in press, a) Correlation analysis. In A.S. Gevinsand A. Remond (Eds.), Methods g of nl ysis of @Liin Electricaland Magotlig gigoil. diDOQI 21 E1291L22092AQLAt2bY Ati9CliniTcal NeuO2YQ2Y (Vol. 1). Elsevier: Amsterdam.
Gevins, A.S. (in press, b) Statistical pattern recognition. InA.S. Gevins and A. Remond (Eds.). L~~to 21 L~gj1i o Q §ia1I 12gctical 09 fgogjjg 9-gss bnD4§ook ofC!22L922f0!Qb12IbY Rog Clinigal NuR~L2012212Y. (Vol. 1).
Elsevier: Amsterdam.
Govins, A.S. & Cutillo, B.C. (in press) jjg~als of Cgonit ion, InF. Lopes da Silva, S. Van Leeuwen and A. Remond (Eds.),6221iat22 2f Co~y2 60allf-2 19 C99. dandboo OfC129LQ9Q92b112aL12t lo Cj ini cal NEur2hblogy09 (Vol. 2).Elsevier: Amsterdam.
Gevins, A.S. & Morgan, N.H. (1988) Classifier-directed signalI ~processing in brain research. ~ Ia~ nf,~177-186.
IA

-23
Gevins, A.S.. Doyle, J., Cutillo. B., Schaffer, R., Tannehill,R., Ghannam. J.. Gilcrease. V. & Yeager,C. (1981) Electricalpotentials in human brain during cognition: New method reveals
dynamic patterns of correlation of human brain electricalpotentials during cognition. Science, 213, 918-922.
Gevins, A.S., Schaffer, R.E., Doyle, J.C., Cutillo, B.A.,Tannehill, R.S. & Bressler, S.L. (1983) Shadows of thought:Rapidly changing, asymmetric brain-potential patterns of a briefvisuomotor task. Science, 2Q, 97-99.
Gevins, A.S., Doyle, J.C., Cutillo, B.A., Schaffer, R.E..Tannehill, R.S., Bressler, S.L. & Zeitlin, G. (1985)Neurocognitive pattern analysis of a visuomotor task: Low-frequency evoked correlations. y¥2gYshgjgQ1Y, 22, 32-43.
Gevins. A.S., Morgan, N., Bressler, S., Doyle, J. & Cutillo, B.C.(1986) Improved event-related potential estimation usingstatistical pattern classification. EEG Clin. Neurophysiol., 64,177-186.
Gevins, A.S., Bressler, S.L., Morgan, N.H., Cutillo, B.A., White,R.M., Greer, D.S., Illes, J. & Doyle, J.C. (in prep, a), Event-related covariances during a bimanual visuomotor task, Part I:Methods and analysis of stimulus- and response-registered data.
BGevins, A.S., Bressler, S.L., Morgan, N.H., Cutillo, B.A., White,R.M., Greer, D.S., Illes, J. & Doyle, J.C. (in prep, b), Event-related covariances during a bimanual visuomotor task, Part I1:Cue and feedback.
Goldberg, G. (1985) Supplementary motor area structure andfunction: Review and hypotheses. 2ehavioral aQQ @ta 5i encel.§, 567.
Goldman-Rakic, P.S. (1984) The frontal lobes: Uncharteredprovinces of the brain. Trends in Neurosciences, Z, 419.
Hjorth, B. (1975) An on-line transformation of EEG scalppotentials into orthogonal source derivations. g§ Clin.L42LgbXl.ig.. 2, 526-530.
Hjorth, B. (1980) Source derivation simplifies topographical EEGinterpretation. Ame. 1J.C I- ogj. 2Q, 121-132.
Ingvar, D.H. and Philipson, L. (1977) Distribution of cerebralblood flow in the dominant hemisphere during motor ideation andmotor performance. Ann. Ng2LQI., 2. 230-237.
Lee, B.I., Luders, H., Lesser, R.P., Dinner, D.S. & Morris, H.H.(1986) Cortical potentials related to voluntary and passivefinger movements recorded from subdural electrodes in humans.gO- I~4g!g., Q, 32-37.
I
* -24-
Livanov, M.N. (1977) 5galia. 0Qfgifljzation of Cerebral Processes.I Wiley: New York.
JR.1Luria. A.R. (1966) UiabfL grticaI Function iny Man. BasicI Books: Now York.
Milner, B. & Petrides, M. (1984) Behavioral effects of frontallobe lesions in man. Trends in Neurosciences, 7. 43.
Mountcastle, V.B. (1978) Brain mechanisms for directedattention. 1.8 5gg M2. Z, 14-28.
Pieper, C.F., Goldring, S.. Jenny, A.S. & McMahon, J.P. (1980)Comparative study of cerebral cortical potentials associated withvoluntary movement in monkeys and man. CE jn N~L~bi...~,266.
Posner. M. (1978) CbhrOnmIric C2QUt1dri Q1~ jIQ MidI Erlbaum: New Jersey.
Rohrbaugh. J.W., Syndulko, K., Sanquist, T.F. & Lindsley. D.B.(1980) Synthesis of the contingent negative variation brainpotential from arm contingent stimulus and motor elements.5geg ?Q§ 1185-1188.
Roland. P.E., Larsen, B., Lassen. N.A. &Skinhoj, E. (1980)Supplementary motor area and other cortical areas in organizationof voluntary movements in man. 1. QUNLQ011y12Q1., 43, 118-136.
Roland, P.E. (1982) Cortical regulation of selective attention inman: A regional cerebral blood flow study. J. NeurQ~bX!jiOj.., 53,1219.
Roland, P.E. (1985a) Cortical organization of voluntary behaviorin man. Human NeUroU021i og, 216.
Roland, P.E. (1985b) In L. Sokoloff (Ed.). Brain j.nggjg andOLain ~FyO21iQn. Raven: New York.
Ruchkin, D., Sutton, S. & Mahaffey, D. (1986) Terminal CNV inthe absence of motor response. EN MO NQU 'L'.Q.L.. §2, 445.
Stuss, D.T. & Benson, D.F. (1986) The Frontal Lobes. Raven: NewYo rk.
Tocce, J.J. (1972) Contingent negative variation (CNV) andpsychological processes in man. Pl~gbhgi. QyuH., 77. 73.
Teuber, H.-L. (1964) In J.M. Warren and K. Akert (Eds.). Ihe
ErQDIa! OLADYI&L C2L129 209 kbl!J.QL. McGraw-Hill: New York.