Embed Size (px)
Citation preview
UNIVERSIDADE DE LISBOA
FACULDADE DE CIÊNCIAS
DEPARTAMENTO DE BIOLOGIA ANIMAL
Neurobiological effects of long chain n-3 polyunsaturated
fatty acids
Joana Paiva Martinho
Mestrado em Biologia Humana e Ambiente
Dissertação orientada por:
Professora Doutora Ana Maria de Lima Viegas G. Crespo Faculdade de Ciências da Universidade de Lisboa
Professor Doutor José António Mestre Prates Faculdade de Medicina Veterinária da Universidade de Lisboa
2016
This thesis was conducted in Faculdade de Medicina Veterinária da Universidade de Lisboa (FMV) and had the cooperation of Universidade de Almería (Almeria, Spain) and Instituto Português do Mar e Atmosfera (IPMA).
This thesis was integrated in the project “Metabolic fate and health properties of structured triacylglycerols rich in n-3 long chain polyunsaturated fatty acids, eicosapentaenoic (EPA, 20:5n-3) and docosahexaenoic (DHA, 22:6n-3)" (AGL2011-25807), between FMV-ULisboa, IPMA and Universidade de Almería.
The references on this thesis were written under the rules of journal Frontiers in Aging
Neuroscience.
i
Agradecimentos
Esta tese não existiria sem o contributo de várias pessoas que ao longo de todo o ano me ajudaram e incentivaram. A elas presto o meu agradecimento e dedico este trabalho:
Ao Professor Prates, que me deu a possibilidade de integrar este projecto e me orientou, estando sempre disponível para ajudar em todas as fases. Obrigada por esta oportunidade e por ter acreditado em mim para este projecto.
A toda a equipa da FMV, que de alguma forma contribuiu para este projecto, em particular a Susana, a Paula e a Marta, que me receberam com um enorme carinho e à vontade, criando um bom ambiente de trabalho, além da disponibilidade que tiveram para me ajudar, esclarecer dúvidas e dar conselhos valiosos.
Um especial agradecimento à Susana que, além de tudo, foi incansável na ajuda que me deu com a estatística e a metodologia, sempre com paciência e boa disposição (mesmo saltando refeições e fora de horas). Um obrigado não é suficiente para agradecer todo o apoio que me deu, mas uma parte desta tese existe graças a si.
À Eva, que também me recebeu com carinho e me ajudou na etapa inicial. Não vou esquecer os dias agitados que passámos a fazer os testes de comportamento. Foi intenso, mas foi um bom esforço. Obrigada por tudo.
À equipa do IPMA, em especial à Júlia Ferreira que fez parte das análises dos ácidos gordos e que me ajudou com as restantes, orientando-me no laboratório e ensinando-me cuidados a ter e que nunca esquecerei.
À Doutora Narcisa Bandarra, pela disponibilidade em me receber e aconselhar, além do contributo enorme que deu a este projecto, que não existiria sem si.
À equipa da Universidade de Almería, que concebeu as dietas.
À equipa do Laboratório Joaquim Chaves, que analisou o plasma e as catecolaminas.
À FCUL, que foi a base da minha educação na licenciatura e mestrado: a todos os professores que me formaram, me transmitiram conhecimentos essenciais e estimularam a minha paixão pela ciência, em especial pelo comportamento e as neurociências.
À Professora Deodália, que me ajudou durante o mestrado, esclareceu dúvidas e me deu conselhos valiosos para toda a vida.
Um especial agradecimento à Professora Ana Crespo, que me despertou a paixão pela nutrição nas aulas de mestrado e que aceitou orientar-me nesta tese. Obrigada por toda a disponibilidade e atenção e por também ter acreditado em mim neste projecto.
A toda a minha família, que foi parte essencial no meu desenvolvimento enquanto pessoa. Em particular aos meus avós paternos e maternos e à minha tia Isabel, que me estimularam a estudar e me deram a possibilidade de continuar a fazê-lo e chegar até aqui.
Aos meus pais, que são sem dúvida os melhores do mundo. Deram-me uma infância fantástica e estimulante e incentivaram sempre o meu gosto pelo conhecimento (e pelos livros), além de me darem todas as possibilidades para continuar a estudar sem parar. Obrigada também pela paciência ao longo dos dias difíceis de trabalho e de escrita da tese (onde me transformei numa eremita). Não teria sido possível concluir sem o vosso apoio.

ii
À minha irmã Raquel, que adoro e que também me ajudou em todas as fases, aturou as noitadas de escrita e a rabugice, e tornou tudo muito mais fácil. Obrigada pela paciência em ouvir-me, a ler a tese, a ajudar-me a organizar as ideias e, principalmente, a aliviar o stress, fazendo-me rir e manter a boa disposição.
A todos os meus amigos que acompanharam o meu percurso até aqui: à Margarida, à Joana e à Maria João, que mesmo num ramo diferente continuam a fazer parte da minha vida; à Catarina, Cláudia, Laura, Manuela, Mariana, Marta, Sara, Simone, Tiago: percorremos este caminho juntos, passámos pelas mesmas dificuldades e partilhámos bons momentos. O vosso apoio tornou tudo melhor, obrigada por tudo!
iii
Resumo
Os ácidos gordos polinsaturados, conhecidos por PUFA (do inglês, polyunsaturated fatty acids), contêm duas ou mais ligações duplas de carbono e incluem os ácidos gordos essenciais, ómega-6 (n-6) e ómega-3 (n-3). O ómega-6 deriva do ácido linoleico (LA, 18:2n-6) e origina o ácido araquidónico (AA) como metabolito final. O ómega-3 deriva do ácido linolénico (ALA, 18:3n-3) e tem como metabolitos principais o ácido eicosapentaenóico (EPA, 20:5n-3) e ácido docosahexaenóico (DHA, 22:6n-3), que são ácidos gordos de cadeia longa (LC-PUFA, do inglês, long-chain polyunsaturated fatty acids).
Os metabolitos do n-6 e do n-3 são originados através de uma cascata de reacções de dessaturação, alongamento e oxidação, com enzimas específicas. O n-6 produz também alguns eicosanóides com propriedades pró-inflamatórias e pró-trombóticas: lipoxinas (LXs), prostaglandinas (PGs), thromboxanos (TXs) e leucotrienos (LTs), que são contrabalançados pelos eicosanóides anti-inflamatórios do n-3.
Os PUFA são considerados ácidos gordos essenciais porque não conseguem ser sintetizados de novo pelo nosso organismo e precisam de ser obtidos através da dieta. As melhores fontes de ácidos gordos são o peixe gordo e os seus óleos, os óleos vegetais, como óleo nozes, chia, canola e linhaça e também óleo ou extracto de algas marinhas. Os PUFA podem também ser encontrados em suplementos alimentares e no leite materno.
O rácio de ingestão n-6/n-3 é considerado um factor de promoção da saúde humana, sendo os níveis baixos deste rácio recomendados para se obterem os efeitos protectores destes ácidos gordos, nomeadamente ao nível das suas propriedades anti-inflamatórias, cardiovasculares e neurobiológicas. Na dieta ocidental moderna existe um consumo excessivo de n-6 relativamente ao n-3, o que origina uma desregulação do metabolismo normal destes ácidos gordos, onde o n-6 compete com o n-3 pelas mesmas enzimas e leva ao aumento dos eicosanóides pró-inflamatórias do n-6. Há, no entanto, estudos recentes que colocam em causa o papel do rácio n-6/n-3 e reforçam a ideia do consumo de EPA e DHA em maior quantidade, ao invés de n-3 sob a forma de ALA. Actualmente é recomendado o consumo de 1g/ dia de n-3 PUFa, sob a forma de EPA+DHA, para se obterem efeitos benéficos no sistema cardiovascular.
O consumo de óleo de peixe, rico em EPA e DHA, tem sido associado a efeitos protectores no sistema nervoso central, promovendo o desenvolvimento dos circuitos corticais e afectando o funcionamento de neurotransmissores (serotonina, adrenalina, noradrenalina e dopamina), tendo consequentemente um impacto positivo na progressão de patologias neurológicas do foro inflamatório e também comportamental, como a depressão, ansiedade, stress e perturbações de humor. Condições como a depressão, a ansiedade e o stress têm um impacto negativo na sociedade, podendo levar a situações fatais. Assim, é necessário avaliar o impacto dos ácidos gordos de cadeia longa na prevenção destes distúrbios.
A maior parte dos estudos sobre EPA e DHA foca-se na toma conjunta destes ácidos gordos e, por isso, não clarificam o papel individual de cada um destes compostos sobre a saúde. O objectivo principal deste trabalho é, portanto, explorar os efeitos benéficos da toma de EPA e DHA, comparando a sua acção isolada com a sua acção conjunta, na promoção de comportamentos activos, opostos aos encontrados em situações de depressão e outros distúrbios comportamentais.
Para este trabalho foram usados 32 ratos Wistar como modelo de estudo, distribuídos aleatoriamente por 4 dietas diferentes (com 8 animais por grupo) e ricas em ácidos gordos de diferentes origens, de forma a avaliar qual destes compostos tem um efeito benéfico maior sobre
iv
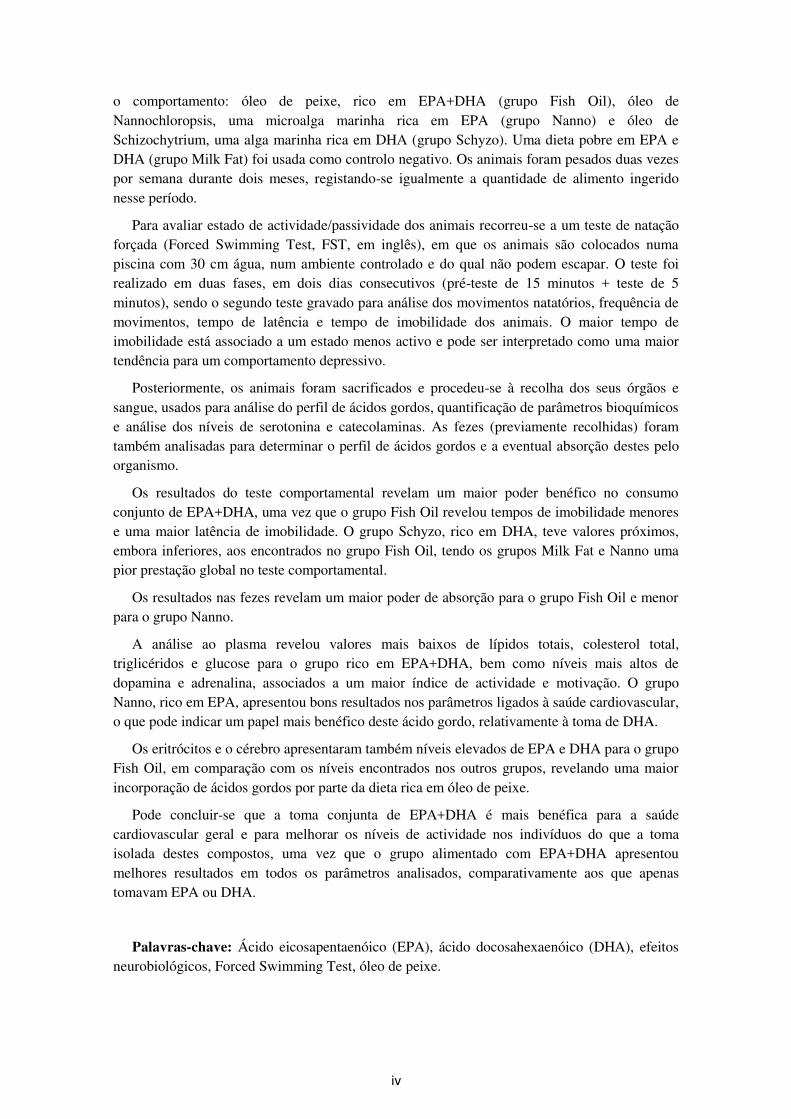
o comportamento: óleo de peixe, rico em EPA+DHA (grupo Fish Oil), óleo de Nannochloropsis, uma microalga marinha rica em EPA (grupo Nanno) e óleo de Schizochytrium, uma alga marinha rica em DHA (grupo Schyzo). Uma dieta pobre em EPA e DHA (grupo Milk Fat) foi usada como controlo negativo. Os animais foram pesados duas vezes por semana durante dois meses, registando-se igualmente a quantidade de alimento ingerido nesse período.
Para avaliar estado de actividade/passividade dos animais recorreu-se a um teste de natação forçada (Forced Swimming Test, FST, em inglês), em que os animais são colocados numa piscina com 30 cm água, num ambiente controlado e do qual não podem escapar. O teste foi realizado em duas fases, em dois dias consecutivos (pré-teste de 15 minutos + teste de 5 minutos), sendo o segundo teste gravado para análise dos movimentos natatórios, frequência de movimentos, tempo de latência e tempo de imobilidade dos animais. O maior tempo de imobilidade está associado a um estado menos activo e pode ser interpretado como uma maior tendência para um comportamento depressivo.
Posteriormente, os animais foram sacrificados e procedeu-se à recolha dos seus órgãos e sangue, usados para análise do perfil de ácidos gordos, quantificação de parâmetros bioquímicos e análise dos níveis de serotonina e catecolaminas. As fezes (previamente recolhidas) foram também analisadas para determinar o perfil de ácidos gordos e a eventual absorção destes pelo organismo.
Os resultados do teste comportamental revelam um maior poder benéfico no consumo conjunto de EPA+DHA, uma vez que o grupo Fish Oil revelou tempos de imobilidade menores e uma maior latência de imobilidade. O grupo Schyzo, rico em DHA, teve valores próximos, embora inferiores, aos encontrados no grupo Fish Oil, tendo os grupos Milk Fat e Nanno uma pior prestação global no teste comportamental.
Os resultados nas fezes revelam um maior poder de absorção para o grupo Fish Oil e menor para o grupo Nanno.
A análise ao plasma revelou valores mais baixos de lípidos totais, colesterol total, triglicéridos e glucose para o grupo rico em EPA+DHA, bem como níveis mais altos de dopamina e adrenalina, associados a um maior índice de actividade e motivação. O grupo Nanno, rico em EPA, apresentou bons resultados nos parâmetros ligados à saúde cardiovascular, o que pode indicar um papel mais benéfico deste ácido gordo, relativamente à toma de DHA.
Os eritrócitos e o cérebro apresentaram também níveis elevados de EPA e DHA para o grupo Fish Oil, em comparação com os níveis encontrados nos outros grupos, revelando uma maior incorporação de ácidos gordos por parte da dieta rica em óleo de peixe.
Pode concluir-se que a toma conjunta de EPA+DHA é mais benéfica para a saúde cardiovascular geral e para melhorar os níveis de actividade nos indivíduos do que a toma isolada destes compostos, uma vez que o grupo alimentado com EPA+DHA apresentou melhores resultados em todos os parâmetros analisados, comparativamente aos que apenas tomavam EPA ou DHA.
Palavras-chave: Ácido eicosapentaenóico (EPA), ácido docosahexaenóico (DHA), efeitos neurobiológicos, Forced Swimming Test, óleo de peixe.
v
Abstract
Polyunsaturated fatty acids include the essential omega-6 (n-6) and omega-3 (n-3) fatty acids, which are not synthesised by our body and must be obtained through diet. The most abundant sources of PUFA are fish, plant and algae oils. Omega-3 has an important anti-inflammatory power and is known for its benefit effect on the prevention of cardiovascular diseases. The main n-3 metabolites are eicosapentaenoic acid (EPA, 20:5n-3) and docosahexaenoic acid (DHA, 22:6,n-3), the long-chain PUFA (LC-PUFA), mainly found in fish oil and known to have a protective role regulating brain development and neurotransmitter functioning. Therefore, LC-PUFA are implied for the prevention of neurodegenerative and neurological conditions, as well as behavioural disturbances like depression and anxiety-related disorders. However, there is a lack of information about the individual role of these fatty acids on these stated conditions.
The purpose of this work was to test and compare the effects of EPA and DHA, in form of isolated and combined diet, on the promotion of active behaviours, favourable in neurologic disorders. An experimental design was made using 32 Wistar rats, divided into 4 different diets to assess the specific effects of each fatty acid: Milk Fat, the negative control diet without EPA or DHA added; Fish Oil, the positive control diet, rich in EPA+DHA; Nanno group, rich in EPA; Schyzo group, rich in DHA. A behavioural Forced Swimming Test (FST) was performed to evaluate the active/passive state in rats. The animals were later euthanized, with their blood and organs removed for biochemical analysis. Fatty acid profile in faeces, erythrocytes and brain, as well as biochemical markers, serotonin and catecholamines levels were determined.
Behavioural FST revealed benefit effects of the EPA+DHA intake, rather than individual fatty acid intake, since Fish Oil group presented a better overall performance. Both Milk Fat and Nanno groups presented the worse results in FST, with higher immobile levels, low latency times and higher frequencies. Schyzo group has more similar results to Fish Oil group than Nanno group, which might indicate a better role of individual DHA, contrarily to individual EPA, on promoting active behaviours. Plasma metabolites, as well as dopamine and epinephrine levels, also presented better results in Fish Oil group, with Nanno group having similar results as Fish Oil regarding plasma metabolites related with cardiovascular health.
It can be concluded that an EPA+DHA diet is more adequate for the promotion of global health, as well as increasing active behaviours, which can be benefit for neurologic conditions.
Key words: Eicosapentaenoic acid (EPA), docosahexaenoic acid (DHA), fish oil, Forced Swimming Test, neurobiological effects.
vi
Contents
Agradecimentos .............................................................................................................................. i
Resumo ..........................................................................................................................................iii
Abstract ......................................................................................................................................... v
List of tables ................................................................................................................................ viii
List of figures ................................................................................................................................ ix
List of abbreviations and symbols ..................................................................................................x
Introduction ................................................................................................................................... 1
1. Scientific background and objectives .................................................................................... 2
1.1. Fatty acid general characterization ................................................................................ 2
1.1.1. Saturated fatty acids .............................................................................................. 2
1.1.2. Monounsaturated fatty acids ................................................................................. 3
1.1.3. Polyunsaturated fatty acids .................................................................................... 3
1.2. Biosynthesis and biological effects of PUFA ................................................................ 3
1.2.1. Omega-6 PUFA ..................................................................................................... 3
1.2.2. Omega-3 PUFA ..................................................................................................... 4
1.2.3. PUFA synthesis ..................................................................................................... 4
1.2.4. Biological effects of n-6 and n-3 ........................................................................... 6
1.3. Neurobiological effects of LC-PUFA ........................................................................... 7
1.3.1. Neurotransmitters and LC-PUFA interaction ........................................................ 7
1.3.2. Role of EPA .......................................................................................................... 8
1.3.3. Role of DHA ......................................................................................................... 8
1.3.4. Combined EPA and DHA role .............................................................................. 9
1.4. Behavioural tests ........................................................................................................... 9
1.4.1. Forced Swimming Test ....................................................................................... 10
1.5. Objectives .................................................................................................................... 11
2. Materials and methods ........................................................................................................ 12
2.1. Animals sampling and experimental design ................................................................ 12
2.2. Diets ............................................................................................................................ 13
2.3. Forced Swimming Test ............................................................................................... 17
2.4. Behavioural test analysis ............................................................................................. 19
2.5. Determination of plasma metabolites .......................................................................... 19
2.6. Determination of fatty acids ........................................................................................ 19
2.7. Determination of serotonin and catecholamines ......................................................... 20
vii
2.8. Statistical analysis ....................................................................................................... 21
3. Results and discussion ......................................................................................................... 22
3.1. Growth parameters ...................................................................................................... 22
3.2. Forced Swimming Test ............................................................................................... 23
3.3. Plasma biochemical metabolites ................................................................................. 25
3.4. Fatty acid profile in faeces .......................................................................................... 27
3.5. Fatty acid profile in erythrocytes................................................................................. 30
3.6. Fatty acid profile in brain ............................................................................................ 32
3.7. Serotonin and catecholamines in serum ...................................................................... 34
3.8. Integrative discussion .................................................................................................. 35
Conclusion and future perspectives ............................................................................................. 36
References ................................................................................................................................... 37
viii
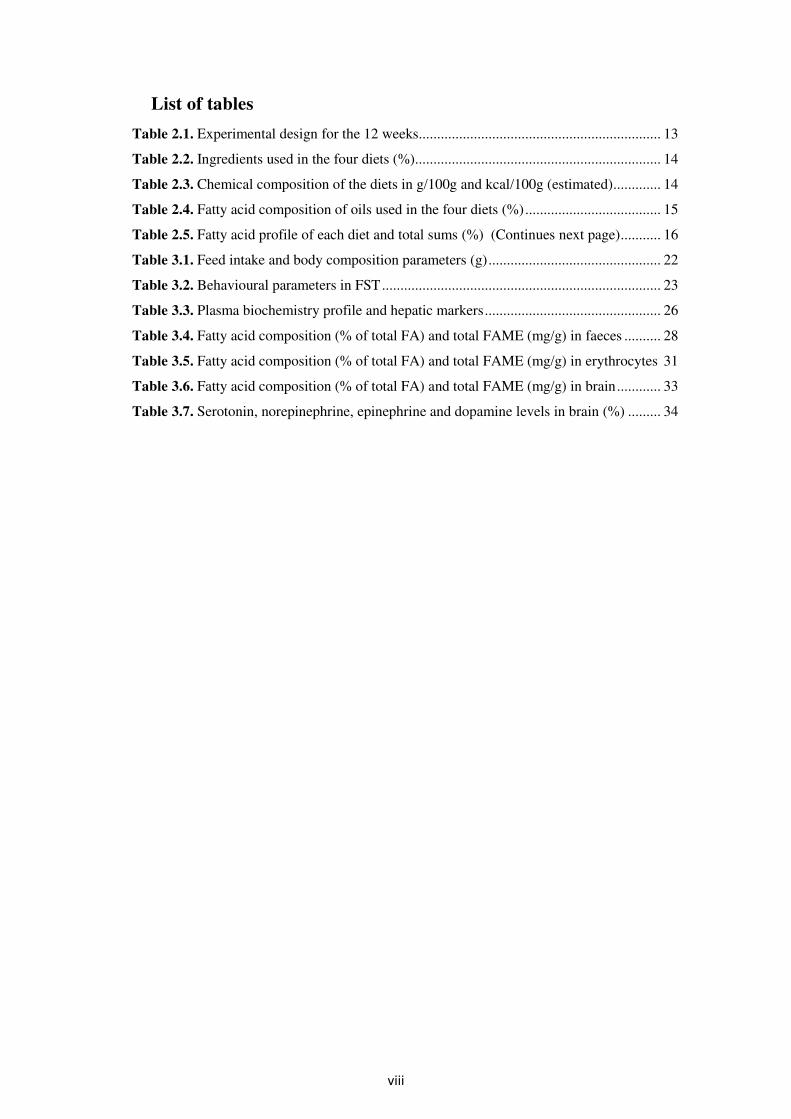
List of tables
Table 2.1. Experimental design for the 12 weeks.................................................................. 13
Table 2.2. Ingredients used in the four diets (%)................................................................... 14
Table 2.3. Chemical composition of the diets in g/100g and kcal/100g (estimated) ............. 14
Table 2.4. Fatty acid composition of oils used in the four diets (%) ..................................... 15
Table 2.5. Fatty acid profile of each diet and total sums (%) (Continues next page) ........... 16
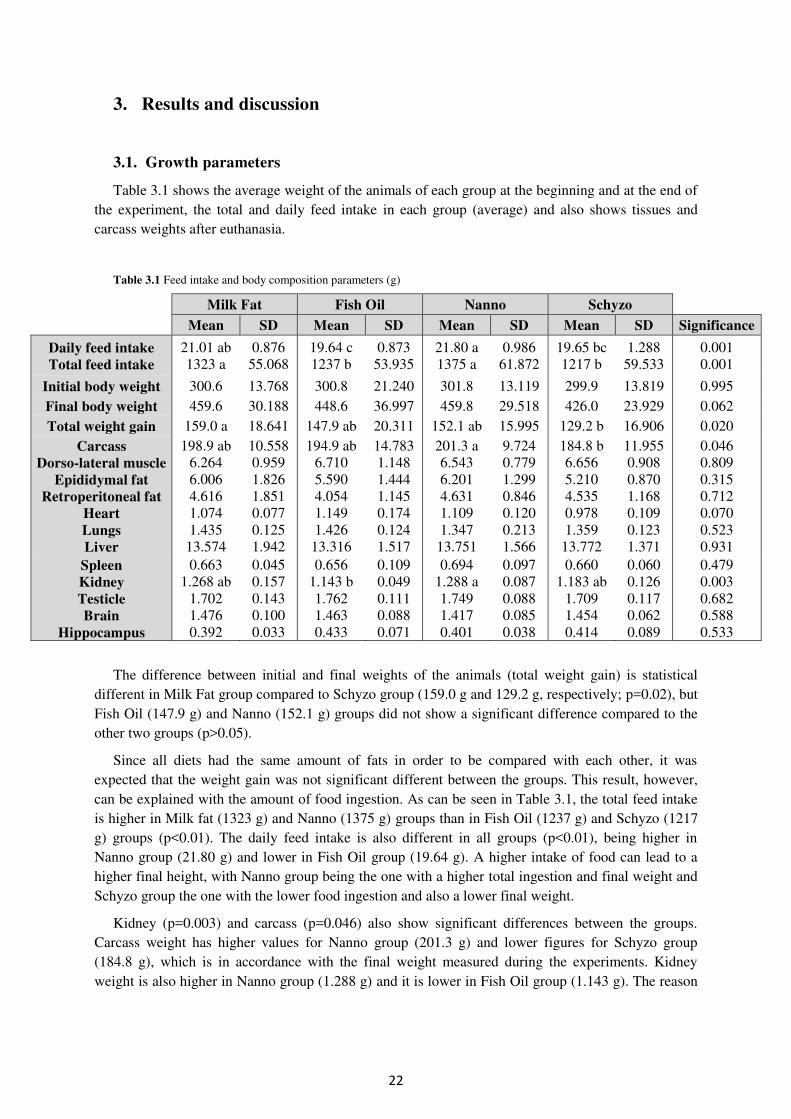
Table 3.1. Feed intake and body composition parameters (g) ............................................... 22
Table 3.2. Behavioural parameters in FST ............................................................................ 23
Table 3.3. Plasma biochemistry profile and hepatic markers ................................................ 26
Table 3.4. Fatty acid composition (% of total FA) and total FAME (mg/g) in faeces .......... 28
Table 3.5. Fatty acid composition (% of total FA) and total FAME (mg/g) in erythrocytes 31
Table 3.6. Fatty acid composition (% of total FA) and total FAME (mg/g) in brain ............ 33
Table 3.7. Serotonin, norepinephrine, epinephrine and dopamine levels in brain (%) ......... 34
ix
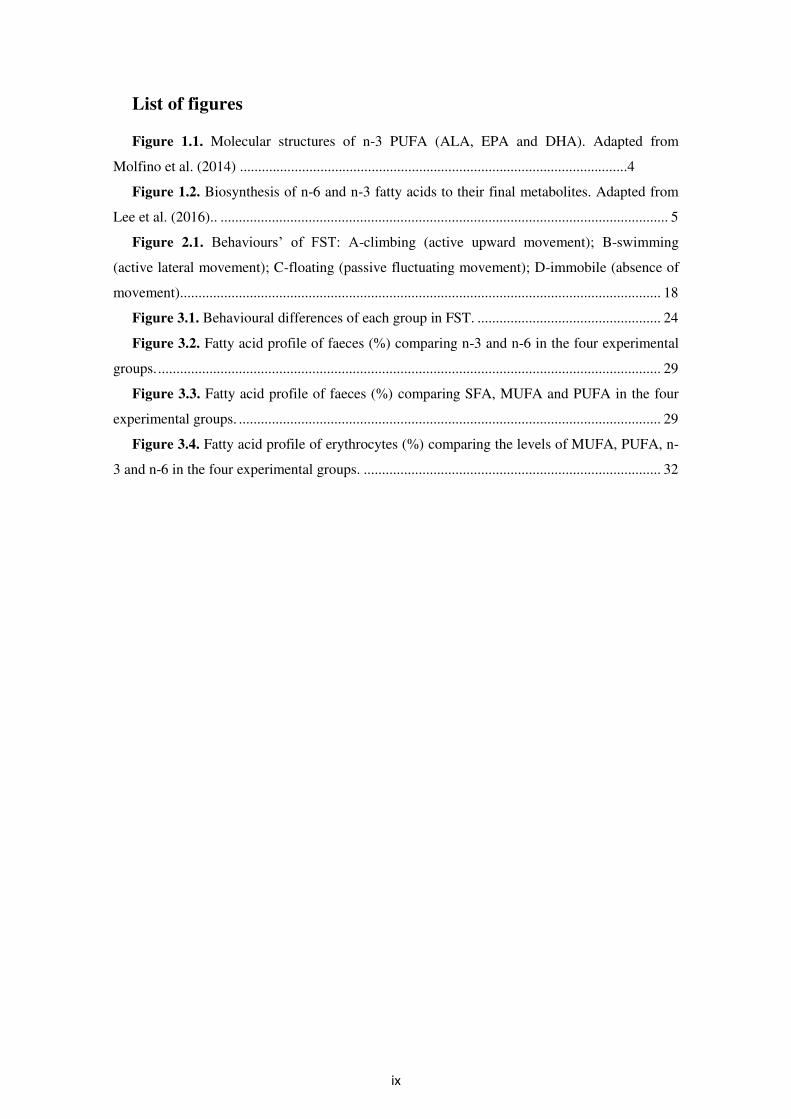
List of figures
Figure 1.1. Molecular structures of n-3 PUFA (ALA, EPA and DHA). Adapted from
Molfino et al. (2014) ..........................................................................................................4
Figure 1.2. Biosynthesis of n-6 and n-3 fatty acids to their final metabolites. Adapted from
Lee et al. (2016).. .......................................................................................................................... 5
Figure 2.1. Behaviours’ of FST: A-climbing (active upward movement); B-swimming
(active lateral movement); C-floating (passive fluctuating movement); D-immobile (absence of
movement). .................................................................................................................................. 18
Figure 3.1. Behavioural differences of each group in FST. .................................................. 24
Figure 3.2. Fatty acid profile of faeces (%) comparing n-3 and n-6 in the four experimental
groups. ......................................................................................................................................... 29
Figure 3.3. Fatty acid profile of faeces (%) comparing SFA, MUFA and PUFA in the four
experimental groups. ................................................................................................................... 29
Figure 3.4. Fatty acid profile of erythrocytes (%) comparing the levels of MUFA, PUFA, n-
3 and n-6 in the four experimental groups. ................................................................................. 32
x
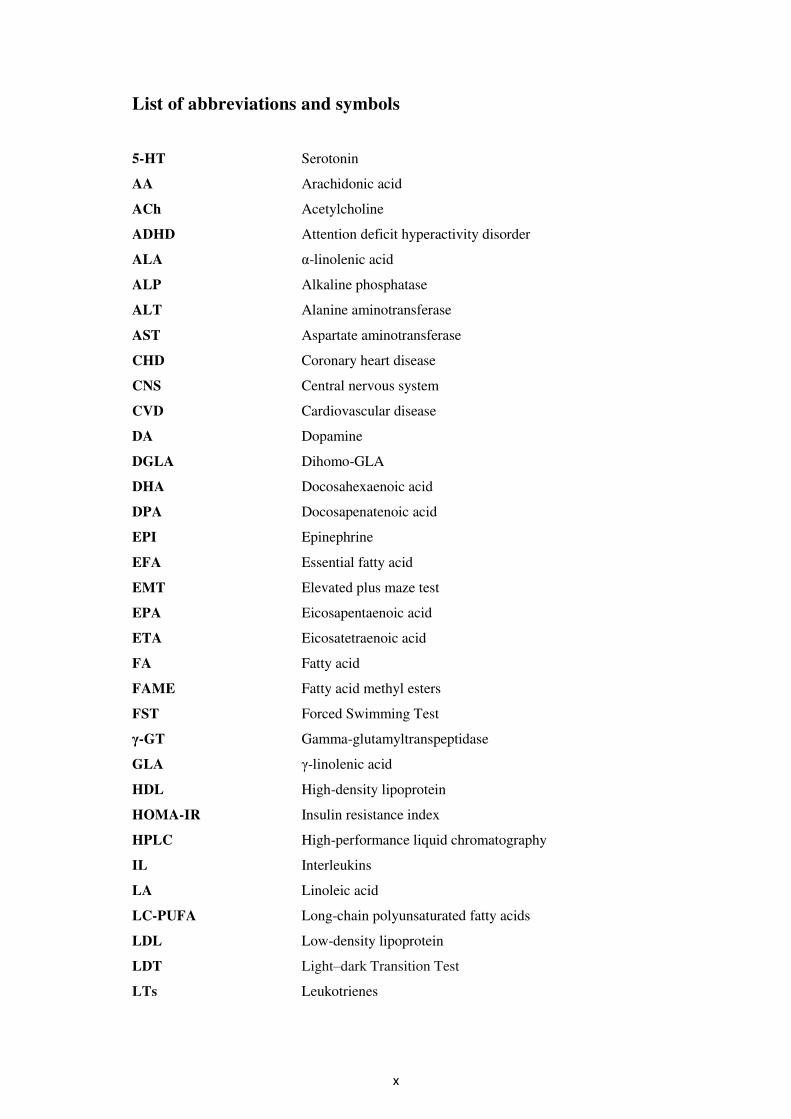
List of abbreviations and symbols
5-HT Serotonin
AA Arachidonic acid
ACh Acetylcholine
ADHD Attention deficit hyperactivity disorder
ALA α-linolenic acid
ALP Alkaline phosphatase
ALT Alanine aminotransferase
AST Aspartate aminotransferase
CHD Coronary heart disease
CNS Central nervous system
CVD Cardiovascular disease
DA Dopamine
DGLA Dihomo-GLA
DHA Docosahexaenoic acid
DPA Docosapenatenoic acid
EPI Epinephrine
EFA Essential fatty acid
EMT Elevated plus maze test
EPA Eicosapentaenoic acid
ETA Eicosatetraenoic acid
FA Fatty acid
FAME Fatty acid methyl esters
FST Forced Swimming Test
γ-GT Gamma-glutamyltranspeptidase
GLA γ-linolenic acid
HDL High-density lipoprotein
HOMA-IR Insulin resistance index
HPLC High-performance liquid chromatography
IL Interleukins
LA Linoleic acid
LC-PUFA Long-chain polyunsaturated fatty acids
LDL Low-density lipoprotein
LDT Light–dark Transition Test
LTs Leukotrienes
xi
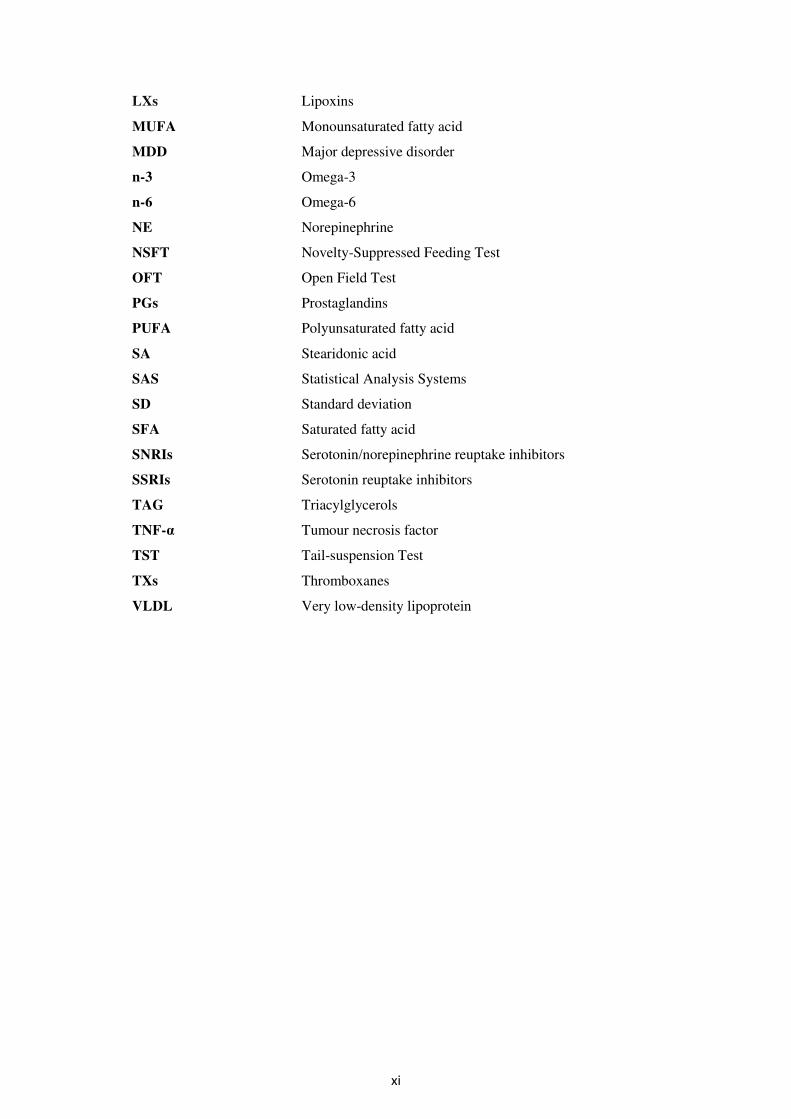
LXs Lipoxins
MUFA Monounsaturated fatty acid
MDD Major depressive disorder
n-3 Omega-3
n-6 Omega-6
NE Norepinephrine
NSFT Novelty-Suppressed Feeding Test
OFT Open Field Test
PGs Prostaglandins
PUFA Polyunsaturated fatty acid
SA Stearidonic acid
SAS Statistical Analysis Systems
SD Standard deviation
SFA Saturated fatty acid
SNRIs Serotonin/norepinephrine reuptake inhibitors
SSRIs Serotonin reuptake inhibitors
TAG Triacylglycerols
TNF-α Tumour necrosis factor
TST Tail-suspension Test
TXs Thromboxanes
VLDL Very low-density lipoprotein
1
Introduction
Neurologic disorders are a major concern of modern times as they are growing, mainly due to an increase in the average life expectancy (Klenk et al., 2016), sedentarization (van Alphen et al., 2016), poor lifestyle choices, diet and lack of physical health (Jelinek et al., 2013; van Reedt Dortland et al, 2013), maternal malnutrition (Morgese and Trabace, 2016), social environment and other socio-economic factors (Das et al., 2015; Payne et al., 2014; Hofmann and Asnaani, 2010). Diet seems to be a key factor on the development of mental disorders since central nervous system (CNS) is highly enriched in fatty acids, particularly long-chain polyunsaturated fatty acids (LC-PUFA), which are essential in foetal and neonatal brain development (Crupi et al., 2013).
Omega-3 fatty acids are pointed as the most beneficial fatty acids in retarding neurologic disorders, which include Alzheimer, Parkinson’s and Huntington’s disease, multiple sclerosis, schizophrenia, cognitive decline and brain ageing, major depression, acute stress and anxiety like behaviours (Cutuli et al., 2014; Molfino et al., 2014; Dyall and Michael-Titus, 2008; Ferraz et al., 2011). From these conditions, major depression, acute stress and anxiety present more life-threatening risks and are the fastest growing, affecting people worldwide and of all ages (Iorfino et al., 2016; Avenevoli et al., 2015; Kessler and Bromet, 2013). Therefore, prevention and treatment of these disorders is a major concern and a priority.
Within the n-3 PUFA, eicosapentaenoic acid (EPA) and docosahexaenoic acid (DHA) are the precursors whose properties are pointed as most benefit on retarding and treating the neurologic conditions stated above (Bozzatello et al, 2016; Dyall, 2015), but is not clear yet if the benefits associated to EPA and DHA are specific of one of the precursors or come as the combination and interaction of both fatty acids (Song et al., 2016; Russell and Bürgin-Maunder, 2012).
It is important to clarify the particular role of individual EPA, individual DHA and the combined EPA+DHA formula on the promotion of more active behaviours in rats. Hence, this thesis proposes to study the individual and combined effects of the LC-PUFA on rats’ behaviour.
First, a general characterization of the most important fatty acid and their biological role will be presented. Second, particular effects of n-6 and n-3 will be described, included their synthesis and metabolic interaction. Last, the neurobiological effects of LC-PUFA will be detailed, with emphasis on EPA and DHA role on the promotion of active behaviours in rats and the different behavioural methods that can be used to evaluate the activity state.
The protective and benefit effects of the fatty acids will be assessed by administrating three different diets, with fatty acids from different origins (fish oil and microalgae), in an experimental rat model, submitted to a behavioural stress test (Forced Swimming Test, FST) that will also evaluate the animals’ active/passive state. Biochemical and biological parameters associated with activity and rats’ normal function will also be measured. Finally, the different parameters will be analysed and compared in order to determine the outcome result of the different diets and which LC-PUFA form is more benefit for the animals’ behaviour.
2
1. Scientific background and objectives
1.1. Fatty acid general characterization
A fatty acid (FA) is a carboxylic acid with a long unbranched aliphatic tail chain which can be either saturated, monounsaturated or polyunsaturated. Therefore, according to its saturated state and structural and functional groups present, a fatty acid can be classified as saturated fatty acid (SFA), monounsaturated fatty acid (MUFA) or polyunsaturated fatty acid (PUFA) (Crupi et al., 2013).
Fatty acid in the form of triacylglycerols (TAG) are a principal source of energy (25-35% of total energy intake in humans) (Kremmyda et al., 2011) and are also fundamental mediators of multiple signalling pathways and part of the structure and function of cell membranes (Orsavova et al., 2015). On the other hand, some FA can be responsible for the expression of pro-inflammatory cytokines, as interleukins (IL) and tumour necrosis factor (TNF-α), with negative effects for the human body (Kremmyda et al., 2011). The potential health effect of a specific fatty acid depends both on its structure and administration form (Bandarra et al, 2016; Hunter, 2001). The level of saturation in a fatty acid gives it unique properties with distinctive functions and interactions in all living beings. The more saturated a fatty acid is the more benefit effects it has, being long-chain polyunsaturated fatty acids (LC-PUFA) considered the most benefit for lipid metabolism in humans (Grosso et al., 2014; Molfino et al., 2014; Dyall and Michael-Titus, 2008).
Fatty acids can have a cis- or trans- configuration, based on the configuration of the double bonds, being the trans- form a result of hydrogenation process from the food industry to create more stable solid fats from liquid oils (Orsavova et al., 2015; Estadella et al., 2013). Trans-fats, however, are considered unhealthy, since they raise LDL cholesterol, lower HDL cholesterol, promote thrombogenesis through the eicosanoid synthesis pathway, promote insulin resistance and are associated with systemic inflammation and endothelial dysfunction (Hinrichsen, 2016; Imran and Nadeem, 2015; Qi Sun et al, 2007).
1.1.1. Saturated fatty acids
Saturated fatty acids are long-chain carboxylic acids that usually have 12 to 24 carbon atoms with no double bond, instead SFA are saturated with hydrogen (Crupi et al., 2013). Palmitic acid (16:0) is the most common saturated fatty acid and it’s usually found in palm oil, one of the most important edible oils globally (Hinrichsen, 2016). Other food sources for SFA include coconut oil (Orsavova et al., 2015), processed meat, milk, butter and other dairy products (O’Sullivan et al., 2013), salmon, egg yolks and chocolate (de Souza et al., 2015).
Saturated fatty acids were commonly associated to cardiovascular diseases (CVD), dyslipidemia, chronic inflammation, insulin resistance (Estadella et al., 2013), obesity and morphologic alterations (Campos-Silva et al, 2015), atherogenic potential and increased cholesterol levels (Mensink et al., 2003; Hunter, 2001). However, other studies questioned these adverse effects, as no clear correlation was found between SFA and these negative effects (Siri-Tarino et al., 2015; de Souza et al., 2015; O’Sullivan et al., 2013; Huth and Park 2012; Micha and Mozaffarian, 2010).
3
1.1.2. Monounsaturated fatty acids
Monounsaturated fatty acids contain only a single double bond. An example of a common monounsaturated fatty acid is oleic acid (18:1n-9), that accounts for more than 92% of all MUFA consumed (Joris and Mensink, 2016). Oleic acid is mainly found in olive, rapeseed and sunflower oils, but MUFA are also generally found in red meat, whole fat milk products, nuts, avocados and canola oil (Lewinska et al., 2015; Orsavova et al., 2015).
The effects of MUFA are less study than SFA and PUFA, therefore its positive role on cardiovascular disease (CVD) and coronary heart disease (CHD) is not very clear yet, though no harmful effects of MUFA-rich diets are known (Joris and Mensink, 2016). One study points out the beneficial effects of MUFA consumption along with fish oil, rich long-chain PUFA, on cardiovascular diseases, as MUFA can potentiate those benefit effects of fish oil (Kondreddy et al., 2016). Other studies state that oleic acid rich in MUFA appears to lower LDL cholesterol (low-density lipoprotein) level (Hunter, 2001) and also protected against oxidative modification of high-density lipoprotein cholesterol (HDL) (Lewinska et al., 2015), but those effects are considered less beneficial when compared to PUFA role (Joris and Mensink, 2016).
1.1.3. Polyunsaturated fatty acids
Polyunsaturated fatty acids contain two or more carbon-to-carbon double bonds in a hydrophobic hydrocarbon chain, not saturated with hydrogen atoms (Grosso et al., 2014). There are two main classes of PUFA, n-3 (formerly known as omega 3 fatty acid) and n-6 (formerly known as omega-6 fatty acids), which differ in the position of their final carbon bond and the fatty acid from which they are synthesized (Crupi et al., 2013). Omega-3 and omega-6 are considered essential fatty acids (EFA) since they play an important role in maintaining homeostatic conditions and also because mammalian cells lack the desaturase enzymes required for the production of EFA, therefore these EFA must be obtained through diet (Grosso et al., 2014).
The main sources of PUFA vary greatly among countries, mostly depending on food availability and cultural influences, but they are usually found in vegetable oils (soy, linseed, rapeseed, canola, walnuts, corn, sunflower, pumpkin) (Lewinska et al., 2015), fish oil (codfish, salmon, tuna, sardines), fish flesh and liver and also seafood and marine algae (Crupi et al., 2013; Wibrand et al., 2013). All PUFA are present in human breast milk, which explains why breast-fed children are healthier compared to bottle-fed (Das, 2003).
1.2. Biosynthesis and biological effects of PUFA
1.2.1. Omega-6 PUFA
The n-6 series derive from linoleic acid (LA, 18:2 n-6) with the double bond at the sixth carbon atom from the end of the carbon chain. Omega-6 PUFA can be converted into arachidonic acid (AA, 20:4 n-6) and then metabolized into the omega-6 eicosanoids: lipoxins (LXs), prostaglandins (PGs), thromboxanes (TXs) and leukotrienes(LTs) (Grosso et al., 2014).
4
1.2.2. Omega-3 PUFA
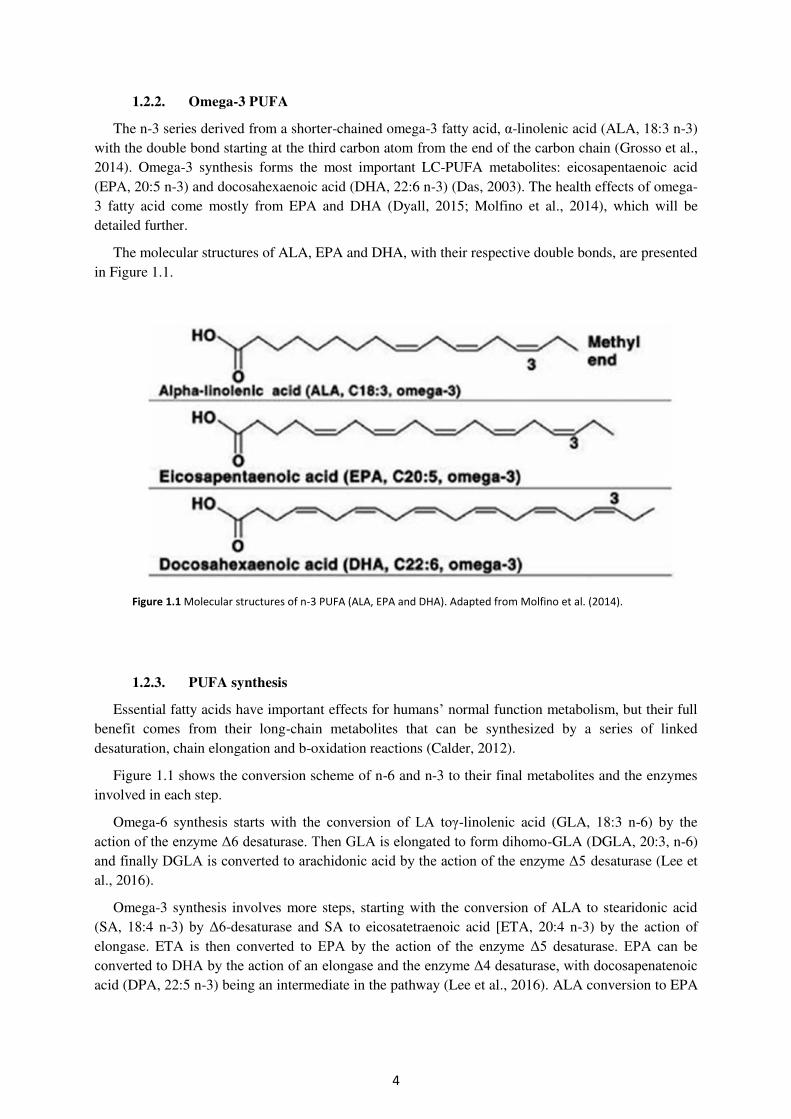
The n-3 series derived from a shorter-chained omega-3 fatty acid, α-linolenic acid (ALA, 18:3 n-3) with the double bond starting at the third carbon atom from the end of the carbon chain (Grosso et al., 2014). Omega-3 synthesis forms the most important LC-PUFA metabolites: eicosapentaenoic acid (EPA, 20:5 n-3) and docosahexaenoic acid (DHA, 22:6 n-3) (Das, 2003). The health effects of omega-3 fatty acid come mostly from EPA and DHA (Dyall, 2015; Molfino et al., 2014), which will be detailed further.
The molecular structures of ALA, EPA and DHA, with their respective double bonds, are presented in Figure 1.1.
Figure 1.1 Molecular structures of n-3 PUFA (ALA, EPA and DHA). Adapted from Molfino et al. (2014).
1.2.3. PUFA synthesis
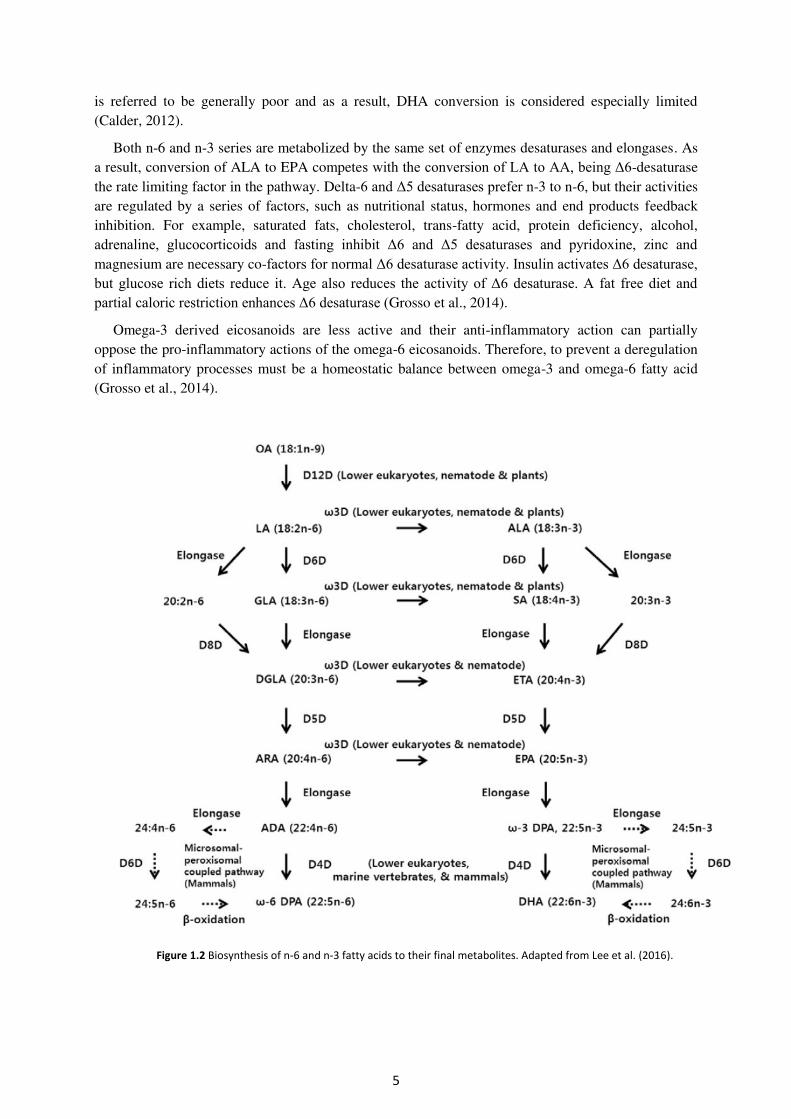
Essential fatty acids have important effects for humans’ normal function metabolism, but their full benefit comes from their long-chain metabolites that can be synthesized by a series of linked desaturation, chain elongation and b-oxidation reactions (Calder, 2012).
Figure 1.1 shows the conversion scheme of n-6 and n-3 to their final metabolites and the enzymes involved in each step.
Omega-6 synthesis starts with the conversion of LA toγ-linolenic acid (GLA, 18:3 n-6) by the action of the enzyme Δ6 desaturase. Then GLA is elongated to form dihomo-GLA (DGLA, 20:3, n-6) and finally DGLA is converted to arachidonic acid by the action of the enzyme Δ5 desaturase (Lee et al., 2016).
Omega-3 synthesis involves more steps, starting with the conversion of ALA to stearidonic acid (SA, 18:4 n-3) by Δ6-desaturase and SA to eicosatetraenoic acid [ETA, 20:4 n-3) by the action of elongase. ETA is then converted to EPA by the action of the enzyme Δ5 desaturase. EPA can be converted to DHA by the action of an elongase and the enzyme Δ4 desaturase, with docosapenatenoic acid (DPA, 22:5 n-3) being an intermediate in the pathway (Lee et al., 2016). ALA conversion to EPA
5
is referred to be generally poor and as a result, DHA conversion is considered especially limited (Calder, 2012).
Both n-6 and n-3 series are metabolized by the same set of enzymes desaturases and elongases. As a result, conversion of ALA to EPA competes with the conversion of LA to AA, being Δ6-desaturase the rate limiting factor in the pathway. Delta-6 and Δ5 desaturases prefer n-3 to n-6, but their activities are regulated by a series of factors, such as nutritional status, hormones and end products feedback inhibition. For example, saturated fats, cholesterol, trans-fatty acid, protein deficiency, alcohol, adrenaline, glucocorticoids and fasting inhibit Δ6 and Δ5 desaturases and pyridoxine, zinc and magnesium are necessary co-factors for normal Δ6 desaturase activity. Insulin activates Δ6 desaturase, but glucose rich diets reduce it. Age also reduces the activity of Δ6 desaturase. A fat free diet and partial caloric restriction enhances Δ6 desaturase (Grosso et al., 2014).
Omega-3 derived eicosanoids are less active and their anti-inflammatory action can partially oppose the pro-inflammatory actions of the omega-6 eicosanoids. Therefore, to prevent a deregulation of inflammatory processes must be a homeostatic balance between omega-3 and omega-6 fatty acid (Grosso et al., 2014).
Figure 1.2 Biosynthesis of n-6 and n-3 fatty acids to their final metabolites. Adapted from Lee et al. (2016).
6
1.2.4. Biological effects of n-6 and n-3
Since EPA competes with AA for enzymatic conversion, the increase of omega-6 fatty acid will lead to a higher production of pro-inflammatory eicosanoids that cannot be neutralized by the anti-inflammatory effects of n-3 PUFA, which can be harmful to human body (Simopoulos, 2008). Lowering the ingestion of n-6 PUFA will increase de bioavailability of n-3 PUFA and, therefore, increase the concentration of EPA and DHA, which have benefit anti-inflammatory properties (Taha et al., 2014).
During human evolution, omega-3 fatty acids were found in all foods consumed: meat, wild plants, eggs, fish, nuts and berries and n6/n3 ratio was ranging between 1/1 and 2/1 (Simopoulos, 2008). In the last 150-100 years there has been a change in human diet and lifestyle, with a crescent adoption of western foods and industrialized products that altered ratio of n6/n3 fatty acid consumption in many countries around the world (Simopoulos, 2006). Modern western diet has been estimated to have a 15/1 to 20/1 n6/n3 ratio, which means the present diet is richer in omega-6 fatty acid in a proportion considered “unhealthy” for the human organism (Crupi et al., 2013).
Some of the n-6 eicosanoids, such as prostaglandins, thromboxanes, leukotrienes, hydroxyl fatty acids and lipoxins, are biologically active in very small quantities and, when formed in large amounts, they can have a pro-inflammatory and pro-thrombotic action, which increases blood viscosity, cause vasospasm and vasoconstriction and decreases bleeding time (Simopoulos, 2008). Therefore, an increase in n-6 eicosanoids can lead to the formation of thrombus, atheromas and to allergic and inflammatory disorders, potentiating pathological processes and chronic conditions, such as diabetes, cancer, obesity, autoimmune diseases and rheumatoid arthritis (Simopoulos, 2006). Pro-thrombotic and pro-inflamatory eicosanoids can also lead to CVD events, elevated blood lipids and blood pressure levels (Khandelwal et al., 2013) and have a negative role on endothelial function, oxidative stress (Yang et al., 2016) and even depression disorders (Husted and Bouzinova, 2016).
The ratio of omega-6 to omega-3 EFA is an important determinant of health, because both omega-6 and omega-3 fatty acids influence gene expression. Since many chronic diseases begin in uterus or early in infancy, proper dietary intake of PUFA even prior to pregnancy may be important, as shown for folate deficiency in the development of neural tube defects (Simopoulos, 2006).
Long-chain PUFA are an important constituent of the cell membranes and confer on membranes properties of fluidity. Thus, the ratio between omega-6 to omega-3 fatty acid is important to avoid imbalance of membrane fluidity (Das, 2003). The double bonds in the structure of n-3 PUFA result in conformations that prevent dense packing of phospholipids, thereby increasing membrane fluidity, which in turn affects receptor numbers and functioning, as well as serotonin neurotransmitter levels on the brain (Park et al., 2012). It is suggested that these changes in neurotransmitter levels may affect the central nervous system and modify higher brain functions (Kodas et al., 2004; Zimmer et al., 2000). Hence, PUFA metabolites may have an important role on neurologic diseases and behaviour modulation.
However, a study from Griffin (2008) suggests that the n-6/n-3 ratio has no value as health risk. Instead, it can be used as a health indicator, but not determinant or prompter of disease. Griffin (2008) also states that the major contributors for the promotion of health are the n-3 metabolites, EPA and DHA, and the absolute amount of dietary PUFA are of relevance to the efficiency of the conversion of ALA to EPA and EPA to DHA. Therefore, a decrease in LA consumption and an increase in ALA consumption will promote the endogenous synthesis of LC-PUFA and increase health.
There are some problems associated to n-6/n-3 ratio, reported by Griffin (2008): the ratio by itself makes no distinction between ALA and EPA and DHA metabolites; both ALA and LA have benefit
7
effect for the prevention of CVD and the ratio only counts for the final n-6 metabolites. Hence, it is important to evaluate the benefits of LC-PUFA regarding its amount in diet, instead of their relative proportion.
Current guidelines regarding PUFA consumption recommend the intake of 1g/day of n-3, in the form of EPA+DHA, for secondary prevention of heart disease, treatment of post-myocardium infarction and prevention of sudden cardiac death and other cardiovascular dysfunctions (Russo, 2009).
1.3. Neurobiological effects of LC-PUFA
Dietary LC-PUFA have been positively associated with a variety of neurodegenerative diseases and neurological disorders, since PUFA are part of the membranes of neuronal cells and synapses (Dyall, 2015), promote neurogenesis, neuroplasticity and CNS development (Tang et al., 2016; Crupi et al., 2013) and are implied in cortical circuit maturation (McNamara et al., 2015). Also, its deficiency leads to impaired neuronal function, affecting neurotransmission action (Logan, 2003; Chalon et al., 1998).
1.3.1. Neurotransmitters and LC-PUFA interaction
The brain neurotransmitters, serotonin (5-HT) and catecholamines (epinephrine, EPI; norepinephrine, NE; dopamine, DA), are biogenic amines that transmit information between nerve cells or neurons and effector cells, integrating the overall coordination of human body functions (Ji et al., 2014). If these neurotransmitters are defected, the normal function of the nervous system is affected, resulting in neurologic problems, essentially at the level of emotion control, neural plasticity, memory (Ferraz et al., 2011) and stress management (Giles et al., 2015).
All catecholamines derive from L-tyrosine and contain a catechol (3,4-dihydroxyphenyl) nucleus and an amine group. Dopamine controls mood and emotion and modulate the “behavioural reactivity” of the organism, therefore reduced dopaminergic activity leads to decreased motivation, loss of interest, reduced activity levels (Berke and Hyman, 2000).
Serotonin is synthesized from amino acid tryptophan and acts via two receptors, with an important role controlling energy intake and obesity, and also improving memory, learning and cognitive function (Yu et al., 2012). Serotonin is also implied on major depressive disorder (MDD) (Wang et al., 2016; Weissman et al., 2016).
Major depressive disorder is a complex and debilitating illness characterized by depressed mood, anhedonia, irritability, concentration difficulties, and abnormalities in appetite and sleep (Wang et al., 2016). Depression is potentially fatal since it can lead to life threatening decisions, like suicide. The current therapy for depression involves selective serotonin reuptake inhibitors (SSRIs) and serotonin/norepinephrine reuptake inhibitors (SNRIs), despite the possible dopamine role on emotion control (Dutta et al., 2014).
A study from Kodas et al. (2004) reported that serotoninergic neurotransmission is affected by n-3 PUFA in a rat model. McNamara et al. (2010) found a correlation between higher levels of PUFA consumption and higher expression of serotonin in midbrain. Vines et al. (2012) found that adult rats supplemented with DHA and EPA, exhibited increased concentrations of serotonin in the frontal cortex and hippocampus. Guixà-González et al. (2015) found a link between dopamine receptors and DHA intake. Bondi et al. (2014) found that n-3 PUFA deficiency decreases dopamine availability,
8
affecting behaviour. Sublette et al. (2014) also found a relation between omega-3 PUFA intake and dopamine, suggesting that n-6/n-3 balance may impact depression pathophysiology through effects on the dopaminergic system. Zimmer et al. (2000) also reported the effects of n-3 PUFA on dopamine neurotransmission.
Fish oil is rich in EPA and DHA and, given the relation between these fatty acids and neurotransmission, fish oil intake may promote a decrease in the incidence of depressive disorders (Carabelli et al., 2015; Tang et al., 2015; Grosso et al., 2014), stress and anxiety behaviours (Mizunoya et al., 2013; Ferraz et al., 2011). It can also promote brain development, cognitive function and improve memory and learning processes (Dyall, 2015; Pérez et al., 2013; Das, 2003).
EPA and DHA comprise 30% of the fatty acids present in fish oil, but there are variations in the proportions of the individual EPA and DHA in different fish oils. For example, cod liver oil is richer in EPA, whereas tuna oil is richer in DHA (Calder, 2012). Is not clear yet if the benefits associated to the consumption of fish oil are specific of one of the precursors (EPA or DHA) or come as the combination and interaction of both fatty acids (EPA+DHA) (Song et al., 2016; Russell and Bürgin-Maunder, 2012), since the current studies only focus on one of the fatty acids and do not evaluate in a comparative way the role of the three possible forms. Besides, those studies often present contradictory results (as it will be stated next), which increase the need to clarify the role of LC-PUFA metabolites.
1.3.2. Role of EPA
Eicosapentaenoic acid intake alone has been associated to a reduced risk of all-cause mortality (Inoue et al., 2015). In a comparative trial, it was seen that a supplementation rich in EPA promoted a better cognitive performance than a supplementation rich in DHA, indicating a more effective role of EPA in enhancing neurocognitive functioning (Bauer et al., 2014). In an opposite way, prior studies reported EPA to increase the severity of depression (Adams et al, 1996), but in more recent studies, EPA was reported to have a useful role in schizophrenia (Das, 2003) and benefit effects in mood disorders (Song et al., 2016; Dyall, 2015).
1.3.3. Role of DHA
Docosahexaenoic acid is essential for the growth and functional development of the brain in infants and is also required for maintenance of normal brain function in adults (Salemet al., 2015; Bradbury, 2011).
Current evidence suggests that consumption of DHA may enhance cognitive performance relating to learning, cognitive development, memory and speed of performing cognitive tasks, by increasing hippocampal acetylcholine (Ach) levels in brain (Stonehouse, 2014; Minami et al., 1997), whereas decreases in DHA levels in the brain are associated with deficits in synaptic circuits’ maturation and functional plasticity (Haghighi et al., 2015), cognitive decline during aging and with the onset of sporadic Alzheimer disease (Dyall, 2015; Horrocks and Yeo, 1999). DHA can also reverse age-related impairment on brain and restore some neurochemical abnormalities to normality (Das, 2003).
According to Pusceddu et al. (2016), DHA seems to be more of benefit in both memory and cognition than EPA, or their combination, as observed in adulthood, possibly due to the phospholipids degradation occurring at this last stage of life.
9
The role of DHA in depressive-like disorders, however, is less clear. Studies from Levant (2013) and Bradbury (2011) found evidences of a benefit DHA role on major depression, whereas Song et al. (2016) didn’t found an association between DHA and reduced depressive scores.
1.3.4. Combined EPA and DHA role
The majority of the LC-PUFA benefits already stated were reported to be associated with an EPA+DHA diet. However, the exact role of each fatty acid in neuroimmune modulation and neurogenesis, the interaction between EPA and DHA and the best EPA/DHA ratio for improving brain disorders remain contorverse. It is also unknown whether EPA, as a DHA precursor, acts directly or via DHA (Song et al., 2016; Dyall and Michael-Titus, 2008). However, there are evidences supporting both independent and shared effects of EPA and DHA that need to be deeper study (Dyall, 2015).
An EPA+DHA diet has been reported to be involved in eye-hand coordination (Dunstan et al., 2008), to reduce biochemical disorders and oxidative stress in brain (Saada et al., 2014), have a protective role in Alzheimer's disease (Boudrault et al, 2009), multiple sclerosis (Jelinek et al., 2013), Huntington’s and Parkinson’s disease (Dyall and Michael-Titus, 2008). However, the main evidence for EPA+DHA diet has been observed in mood disorders and in the treatment of conditions characterized by a high level of impulsivity, aggression and personality disorders, mainly due to the action of the monoamine and catecholamines systems, previously described. In patients with attention deficit hyperactivity disorder (ADHD), small-to-modest effects of LC-PUFA have also been found (Bozzatello et al., 2016; Appleton et al., 2010).
Since the majority of studies reporting EPA and DHA effects are related with depressive state, stress and anxiety, it is important to distinguish the specific role of each PUFA metabolites in promoting more active and mood-benefit behaviours.
1.4. Behavioural tests
There are several behavioural tests to measure the level of activity, or the active/passive state, in rats. Those tests can be performed in multiple experimental sets, including testing the effects of a specific diet in modulating behaviour.
Open Field Test (OFT) is performed essentially to assess the locomotor activity and exploratory behaviour of rats and is used as an operational index of anxiety-relevant behaviours (Wu et al., 2016; Appleton et al., 2015);
Anxiety-like behaviours and exploratory movements can also be assessed by Elevated plus Maze Test (EPM) (Appleton et al., 2015; Mizunoya et al., 2013);
Tail-suspension Test (TST) is used to score movements of agitation and immobility (Steru et al., 1985).
Light–dark Transition Test (LDT) scores the time spent on dark or light areas to assess anxiolytic behaviours in mice (Mizunoya et al., 2013);
The Novelty-Suppressed Feeding Test (NSFT) is a behavioural test used to assess anxiety-like behaviour (Venna et al., 2009);
Depression-like behaviour, behavioural despair and activity state in the animals are majorly assessed by a Forced Swimming Test (FST) (Das et al., 2015; Arbabi et al., 2014), that can also be
10
used to evaluate the effects of the administration of different diets, antidepressant drugs and new compounds on rats (Can et al., 2012), therefore being the best suited test to apply in this experiment.
1.4.1. Forced Swimming Test
One way of measuring the state of activity in laboratory animals is the Forced Swimming Test (FST). This is the most commonly used test in neurobiology and genetic research and allows scoring active/passive behaviours in rats. Besides, is the least stressful test for the animals compared to the other behavioural tests (Mizunoya et al., 2013).
Rats are placed in an inescapable transparent tank that is filled with water and their escape related mobility behaviour is measured. The rat FST is usually conducted in two sessions: a 15-min pre-test session on day 1 and a 5-min test session on day 2. The ‘‘behavioural despair’’ is defined as an animal’s reaction to the inability to escape from a stressful environment (Huang et al., 2008), which induces a characteristic behaviour of immobility in the second FST. The development of immobility is usually facilitated by the 15 minute pre-test, where rats are initially highly active, vigorously swimming in circles, trying to climb the wall or diving to the bottom. After 2-3 min test, activity begins to slow and the animals tend to produce a characteristic behaviour called floating, in which the rat makes only those movements necessary to keep its head above water, progressing for immobility behaviour. The immobility increased when the rats were subjected to the 5-min test session of forced swimming 24 hours later. (Lakhwani et al., 2007). The “behavioural despair” is, thus, learned helplessness and can be modulated by antidepressant agents (Wibrand et al., 2013).
The forced swimming test is straight forward to conduct reliably since it requires minimal specialized equipment, is a relatively short and low cost behavioural test that and it’s not necessary to prior training the rats .It is the most adequate test for comparison between different strains of rats or different exposures of the same strain to different environments, drugs or diets. The FST has also proven to be useful in basic research related to the neurobiology and genetics of mood disorders, since the behaviours measured can differentiate between serotonin and norepinephrine acting compounds (Can et al., 2012).
11
1.5. Objectives
The underlying hypothesis of this work was that EPA and DHA have different behavioural effects and, therefore, it would be possible to improve animals’ active behaviours differentially, in order to achieve a tailor-made therapy for activity-related disorders.
Hence, the main goal of this work was to evaluate, in a comparative way, the potential benefit of dietary LC-PUFA intake in modelling animals’ behaviour. The role of individual EPA, individual DHA and the combined form EPA+DHA was discriminated and compared to determine which diet and type of fatty acid is more beneficial to increase active behaviours in Wistar rats. EPA was provided by a diet based on Nannochloropsis microalgae extract; DHA come from a Schizochytrium algae extract; the combined EPA+DHA form was provided by fish oil. A diet without EPA or DHA was used as a negative control for active behaviours.
The specific objectives were to assess the active/passive state of the animal through a behavioural FST and complement the results with the measure of biological and growth parameters, biochemical analysis of plasma and fatty acids present in faeces, erythrocytes and brain, as well as determinate the serotonin and catecholamines levels in red blood cells. The biological and growth parameters show if there are any differences among the animals of each group and will also be compared with reference values to determine the effects of diet on those parameters. Biochemical analysis of plasma evaluates several parameters related to normal function of organs, and rat’s organism in general, to see any differences caused by the experimental diets. The fatty acid profile on faeces was measured to determine the loss of fatty acid through faeces, compared to the amount given by the diet. The fatty acid profile in erythrocytes and brain was used as a systemic indicator of the absorption of fatty acid in the rats’ organism. Finally, serotonin and catecholamines levels were measured to detect if the different diets induce differences in the neurotransmitters’ function.
12
2. Materials and methods
2.1. Animals sampling and experimental design
All procedures involving animals were conducted in accordance with ethical guidelines and with approval from the Ethics Commission of CIISA/FMV and the Animal Care Committee of the National Veterinary Authority (Direcção Geral da Alimentação e Veterinária, Portugal), following the appropriate European Union guidelines (N. 86/609/EEC/2010/63/EU Directive). The experimental assay and euthanasia procedures were performed by project members certified for animal handling (category C by FELASA). In order to minimize animal suffering, the minimum number of animals and duration of observations were employed to gain reliable data.
Thirty-two male Wistar rats, randomly divided into four dietary groups, with eight animals per group, were used in this study. Rats were eight weeks old and weighted an average of 260g when purchased. They were allowed 14 days to acclimatize to the laboratory conditions prior to the experiment and were fed with a commercial standard diet during that time. The average weight of the animals after the acclimatize period was 300g.
At the beginning of experimental procedures, the animals were housed one per cage, in standard cages (33×23×12cm) under a 14/10 hour light/dark cycle schedule, with the light cycle according to natural daylight. They were kept under standard animal house conditions, in a controlled temperature room of 20°C-24°C, in a certified animal house in Faculty of Veterinary of Lisbon University. They were fed with the experimental diets after the two weeks acclimatize period and were given ad libitum
access to food and water, except during weights and behavioural tests.
The animals were weighed twice a week on a digital scale and food intake was calculated by the difference between the weight of the remaining food on the pellets and the weight of the food added prior. The behavioural tests were carried out nine weeks after the beginning of experiment, which lasted for 10 weeks (excluding adaptation period).
At the end of the experimental period, rats were fasted for 12hours, weighted before and after the fasting period, and euthanized by guillotine decapitation under anaesthesia with isoflurane, in certified ethical conditions that minimized animal suffering.
Organs and blood were collected after euthanasia. The carcass, kidney, lungs, heart, testicle and spleen were weighted and stored in vacuum at -80°C. Muscle, fats, liver, brain and hippocampus were put into a cryotube and after a bath in liquid nitrogen were stored at -80°C.
Blood was collected into two 4 ml Sarstedt tubes with Li-heparin and centrifuged at 1500 xg, 4°C, for 15 min. One of the tubes was stored at -80°C for future biochemical analysis and the other was used to separate red blood cells, following the procedure:
1. Blood was placed into an eppendorf, washed 3x with sterile saline solution and centrifuged again in the same conditions already stated;
2. After centrifugation, the supernatant was discarded; the eppendorf was washed again in the same conditions and centrifuged for the third time;
3. After a second supernatant exclusion, the red blood cells were collected with a Pasteur pipette, stored in a cryotube bathed in liquid nitrogen and freeze at -80°C.
All diets were collected after the experimental period and stored in vacuum bags at -80°C to determine their nutritional value (see 2.6. FAME determination). Faeces were also collected and stored
13
in vacuum bags at -80°C to further analyse their fatty acid composition (see 2.6. FAME determination).
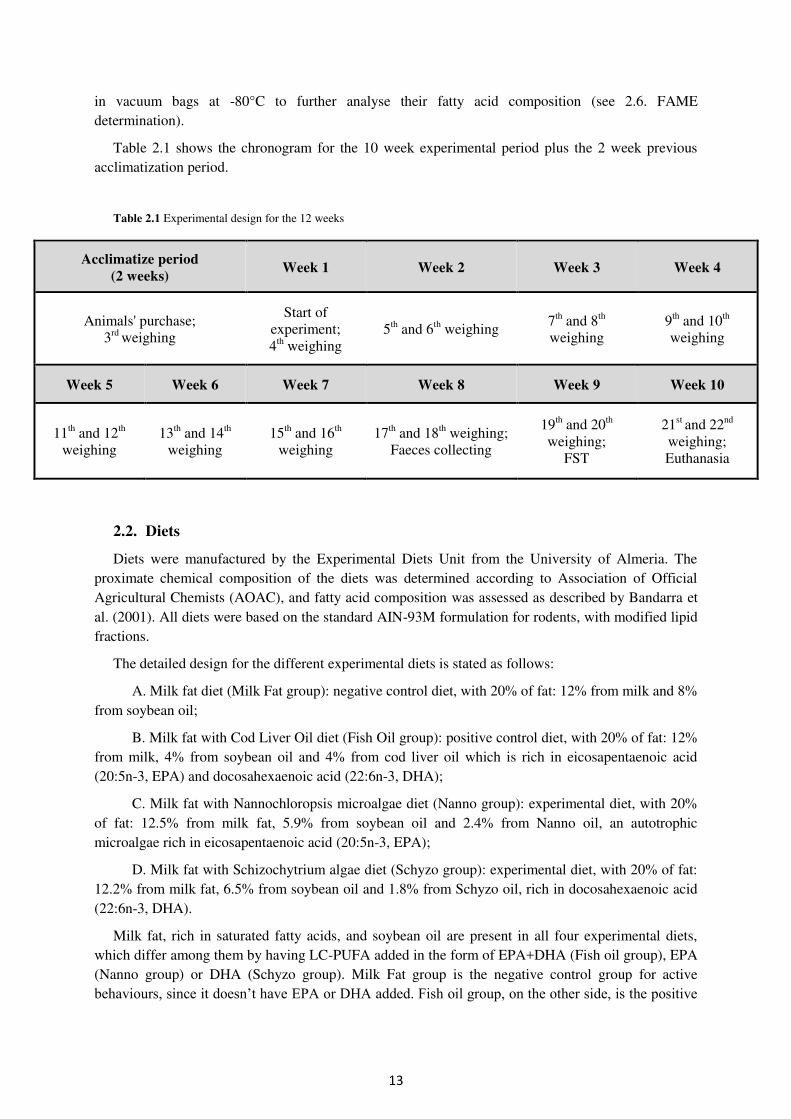
Table 2.1 shows the chronogram for the 10 week experimental period plus the 2 week previous acclimatization period.
Table 2.1 Experimental design for the 12 weeks
Acclimatize period
(2 weeks) Week 1 Week 2 Week 3 Week 4
Animals' purchase; 3rd weighing
Start of experiment; 4th weighing
5th and 6th weighing 7th and 8th weighing
9th and 10th weighing
Week 5 Week 6 Week 7 Week 8 Week 9 Week 10
11th and 12th
weighing 13th and 14th
weighing 15th and 16th
weighing 17th and 18th weighing;
Faeces collecting
19th and 20th weighing;
FST
21st and 22nd weighing; Euthanasia
2.2. Diets
Diets were manufactured by the Experimental Diets Unit from the University of Almeria. The proximate chemical composition of the diets was determined according to Association of Official Agricultural Chemists (AOAC), and fatty acid composition was assessed as described by Bandarra et al. (2001). All diets were based on the standard AIN-93M formulation for rodents, with modified lipid fractions.
The detailed design for the different experimental diets is stated as follows:
A. Milk fat diet (Milk Fat group): negative control diet, with 20% of fat: 12% from milk and 8% from soybean oil;
B. Milk fat with Cod Liver Oil diet (Fish Oil group): positive control diet, with 20% of fat: 12% from milk, 4% from soybean oil and 4% from cod liver oil which is rich in eicosapentaenoic acid (20:5n-3, EPA) and docosahexaenoic acid (22:6n-3, DHA);
C. Milk fat with Nannochloropsis microalgae diet (Nanno group): experimental diet, with 20% of fat: 12.5% from milk fat, 5.9% from soybean oil and 2.4% from Nanno oil, an autotrophic microalgae rich in eicosapentaenoic acid (20:5n-3, EPA);
D. Milk fat with Schizochytrium algae diet (Schyzo group): experimental diet, with 20% of fat: 12.2% from milk fat, 6.5% from soybean oil and 1.8% from Schyzo oil, rich in docosahexaenoic acid (22:6n-3, DHA).
Milk fat, rich in saturated fatty acids, and soybean oil are present in all four experimental diets, which differ among them by having LC-PUFA added in the form of EPA+DHA (Fish oil group), EPA (Nanno group) or DHA (Schyzo group). Milk Fat group is the negative control group for active behaviours, since it doesn’t have EPA or DHA added. Fish oil group, on the other side, is the positive
14
control group for active behaviours, since it has both EPA and DHA added. Nanno and Schyzo groups are the experimental groups in test to evaluate EPA and DHA isolated properties.
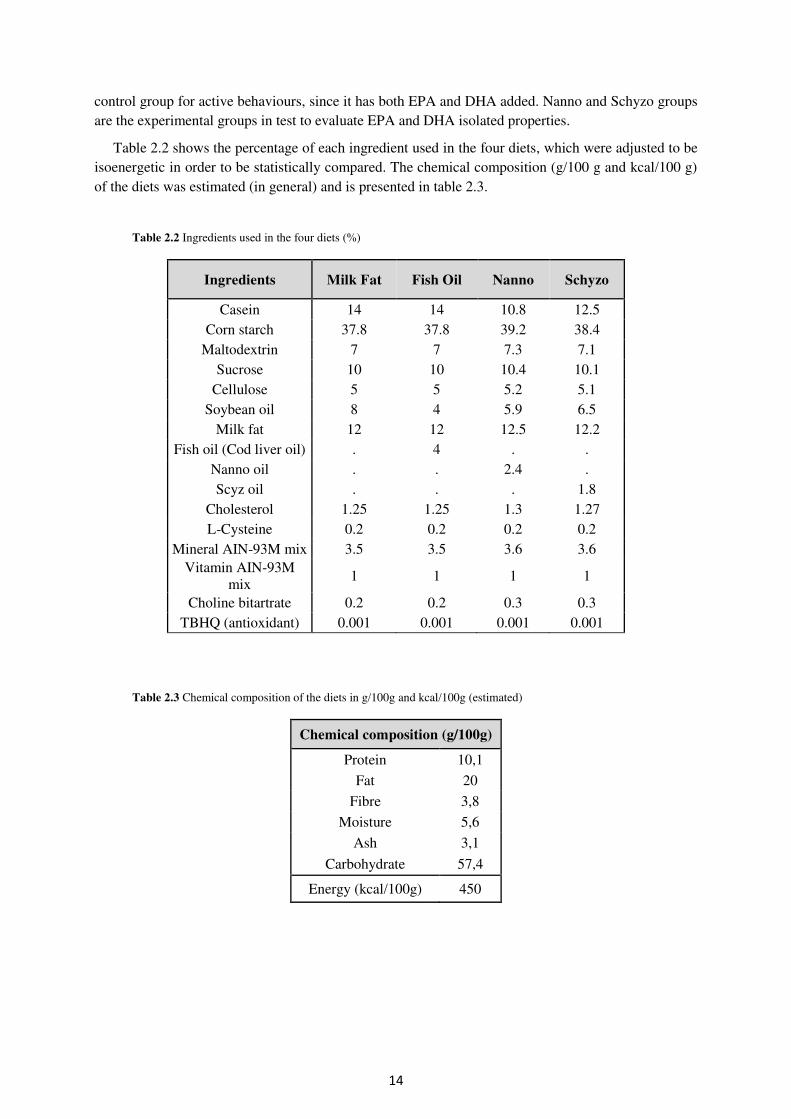
Table 2.2 shows the percentage of each ingredient used in the four diets, which were adjusted to be isoenergetic in order to be statistically compared. The chemical composition (g/100 g and kcal/100 g) of the diets was estimated (in general) and is presented in table 2.3.
Table 2.2 Ingredients used in the four diets (%)
Ingredients Milk Fat Fish Oil Nanno Schyzo
Casein 14 14 10.8 12.5 Corn starch 37.8 37.8 39.2 38.4
Maltodextrin 7 7 7.3 7.1 Sucrose 10 10 10.4 10.1
Cellulose 5 5 5.2 5.1 Soybean oil 8 4 5.9 6.5
Milk fat 12 12 12.5 12.2 Fish oil (Cod liver oil) . 4 . .
Nanno oil . . 2.4 . Scyz oil . . . 1.8
Cholesterol 1.25 1.25 1.3 1.27 L-Cysteine 0.2 0.2 0.2 0.2
Mineral AIN-93M mix 3.5 3.5 3.6 3.6 Vitamin AIN-93M
mix 1 1 1 1
Choline bitartrate 0.2 0.2 0.3 0.3 TBHQ (antioxidant) 0.001 0.001 0.001 0.001
Table 2.3 Chemical composition of the diets in g/100g and kcal/100g (estimated)
Chemical composition (g/100g)
Protein 10,1
Fat 20
Fibre 3,8
Moisture 5,6
Ash 3,1
Carbohydrate 57,4
Energy (kcal/100g) 450
15
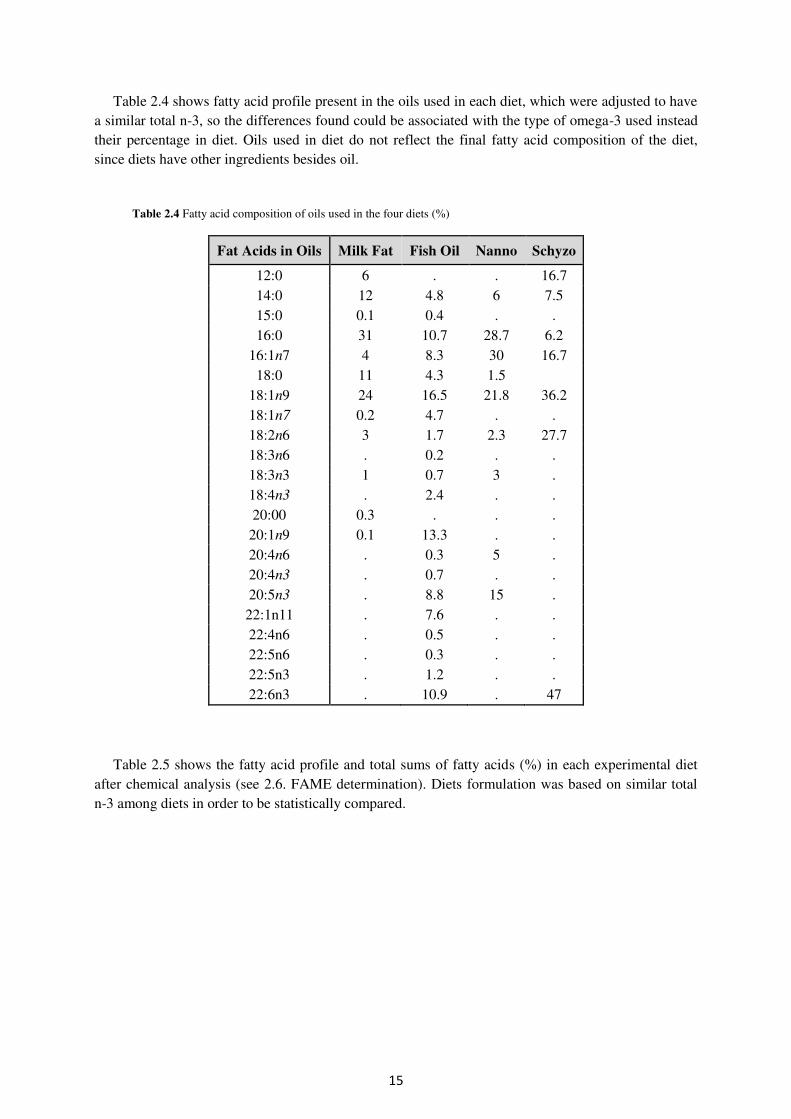
Table 2.4 shows fatty acid profile present in the oils used in each diet, which were adjusted to have a similar total n-3, so the differences found could be associated with the type of omega-3 used instead their percentage in diet. Oils used in diet do not reflect the final fatty acid composition of the diet, since diets have other ingredients besides oil.
Table 2.4 Fatty acid composition of oils used in the four diets (%)
Fat Acids in Oils Milk Fat Fish Oil Nanno Schyzo
12:0 6 . . 16.7 14:0 12 4.8 6 7.5 15:0 0.1 0.4 . . 16:0 31 10.7 28.7 6.2
16:1n7 4 8.3 30 16.7 18:0 11 4.3 1.5
18:1n9 24 16.5 21.8 36.2 18:1n7 0.2 4.7 . . 18:2n6 3 1.7 2.3 27.7 18:3n6 . 0.2 . . 18:3n3 1 0.7 3 . 18:4n3 . 2.4 . . 20:00 0.3 . . . 20:1n9 0.1 13.3 . . 20:4n6 . 0.3 5 . 20:4n3 . 0.7 . . 20:5n3 . 8.8 15 . 22:1n11 . 7.6 . . 22:4n6 . 0.5 . . 22:5n6 . 0.3 . . 22:5n3 . 1.2 . . 22:6n3 . 10.9 . 47
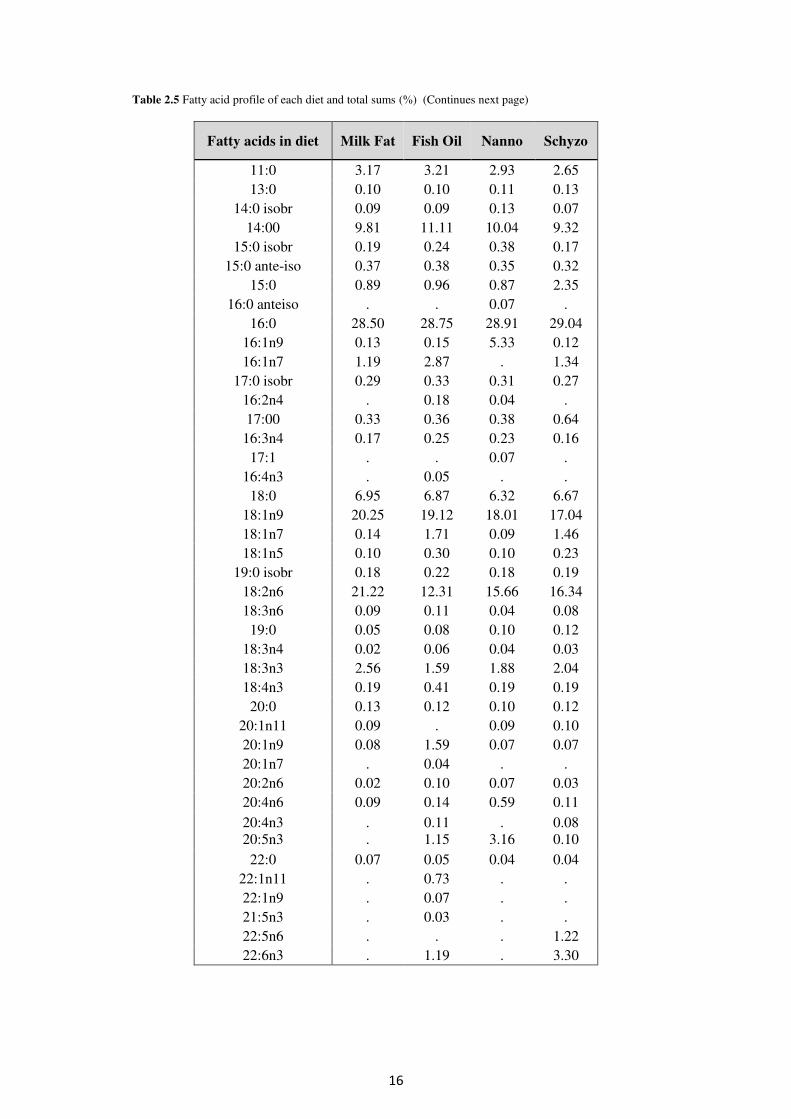
Table 2.5 shows the fatty acid profile and total sums of fatty acids (%) in each experimental diet after chemical analysis (see 2.6. FAME determination). Diets formulation was based on similar total n-3 among diets in order to be statistically compared.
16
Table 2.5 Fatty acid profile of each diet and total sums (%) (Continues next page)
Fatty acids in diet Milk Fat Fish Oil Nanno Schyzo
11:0 3.17 3.21 2.93 2.65 13:0 0.10 0.10 0.11 0.13
14:0 isobr 0.09 0.09 0.13 0.07 14:00 9.81 11.11 10.04 9.32
15:0 isobr 0.19 0.24 0.38 0.17 15:0 ante-iso 0.37 0.38 0.35 0.32
15:0 0.89 0.96 0.87 2.35 16:0 anteiso . . 0.07 .
16:0 28.50 28.75 28.91 29.04 16:1n9 0.13 0.15 5.33 0.12 16:1n7 1.19 2.87 . 1.34
17:0 isobr 0.29 0.33 0.31 0.27 16:2n4 . 0.18 0.04 . 17:00 0.33 0.36 0.38 0.64
16:3n4 0.17 0.25 0.23 0.16 17:1 . . 0.07 .
16:4n3 . 0.05 . . 18:0 6.95 6.87 6.32 6.67
18:1n9 20.25 19.12 18.01 17.04 18:1n7 0.14 1.71 0.09 1.46 18:1n5 0.10 0.30 0.10 0.23
19:0 isobr 0.18 0.22 0.18 0.19 18:2n6 21.22 12.31 15.66 16.34 18:3n6 0.09 0.11 0.04 0.08
19:0 0.05 0.08 0.10 0.12 18:3n4 0.02 0.06 0.04 0.03 18:3n3 2.56 1.59 1.88 2.04 18:4n3 0.19 0.41 0.19 0.19
20:0 0.13 0.12 0.10 0.12 20:1n11 0.09 . 0.09 0.10 20:1n9 0.08 1.59 0.07 0.07 20:1n7 . 0.04 . . 20:2n6 0.02 0.10 0.07 0.03 20:4n6 0.09 0.14 0.59 0.11 20:4n3 20:5n3
.
. 0.11 1.15
. 3.16
0.08 0.10
22:0 0.07 0.05 0.04 0.04 22:1n11 . 0.73 . . 22:1n9 . 0.07 . . 21:5n3 . 0.03 . . 22:5n6 . . . 1.22 22:6n3 . 1.19 . 3.30
17
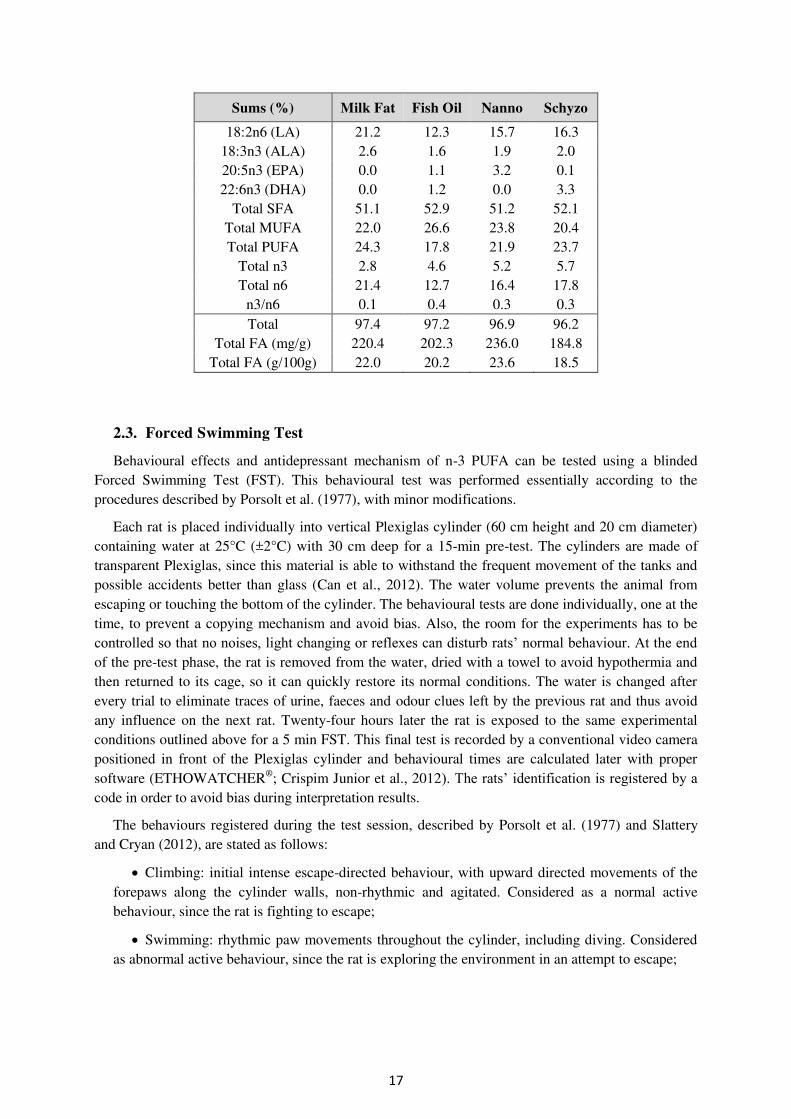
Sums (%) Milk Fat Fish Oil Nanno Schyzo
18:2n6 (LA) 21.2 12.3 15.7 16.3 18:3n3 (ALA) 2.6 1.6 1.9 2.0 20:5n3 (EPA) 0.0 1.1 3.2 0.1 22:6n3 (DHA) 0.0 1.2 0.0 3.3
Total SFA 51.1 52.9 51.2 52.1 Total MUFA 22.0 26.6 23.8 20.4 Total PUFA 24.3 17.8 21.9 23.7
Total n3 2.8 4.6 5.2 5.7 Total n6 21.4 12.7 16.4 17.8
n3/n6 0.1 0.4 0.3 0.3 Total 97.4 97.2 96.9 96.2
Total FA (mg/g) 220.4 202.3 236.0 184.8 Total FA (g/100g) 22.0 20.2 23.6 18.5
2.3. Forced Swimming Test
Behavioural effects and antidepressant mechanism of n-3 PUFA can be tested using a blinded Forced Swimming Test (FST). This behavioural test was performed essentially according to the procedures described by Porsolt et al. (1977), with minor modifications.
Each rat is placed individually into vertical Plexiglas cylinder (60 cm height and 20 cm diameter) containing water at 25°C (±2°C) with 30 cm deep for a 15-min pre-test. The cylinders are made of transparent Plexiglas, since this material is able to withstand the frequent movement of the tanks and possible accidents better than glass (Can et al., 2012). The water volume prevents the animal from escaping or touching the bottom of the cylinder. The behavioural tests are done individually, one at the time, to prevent a copying mechanism and avoid bias. Also, the room for the experiments has to be controlled so that no noises, light changing or reflexes can disturb rats’ normal behaviour. At the end of the pre-test phase, the rat is removed from the water, dried with a towel to avoid hypothermia and then returned to its cage, so it can quickly restore its normal conditions. The water is changed after every trial to eliminate traces of urine, faeces and odour clues left by the previous rat and thus avoid any influence on the next rat. Twenty-four hours later the rat is exposed to the same experimental conditions outlined above for a 5 min FST. This final test is recorded by a conventional video camera positioned in front of the Plexiglas cylinder and behavioural times are calculated later with proper software (ETHOWATCHER®; Crispim Junior et al., 2012). The rats’ identification is registered by a code in order to avoid bias during interpretation results.
The behaviours registered during the test session, described by Porsolt et al. (1977) and Slattery and Cryan (2012), are stated as follows:
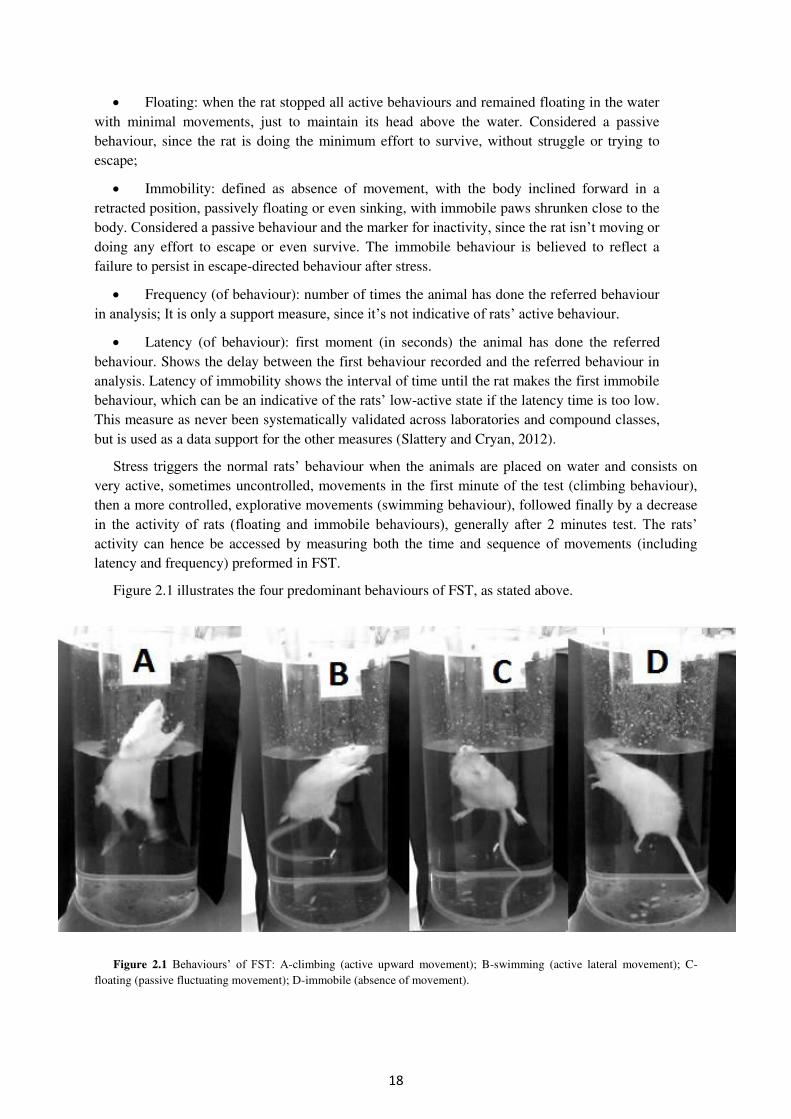
Climbing: initial intense escape-directed behaviour, with upward directed movements of the forepaws along the cylinder walls, non-rhythmic and agitated. Considered as a normal active behaviour, since the rat is fighting to escape;
Swimming: rhythmic paw movements throughout the cylinder, including diving. Considered as abnormal active behaviour, since the rat is exploring the environment in an attempt to escape;
18
Floating: when the rat stopped all active behaviours and remained floating in the water with minimal movements, just to maintain its head above the water. Considered a passive behaviour, since the rat is doing the minimum effort to survive, without struggle or trying to escape;
Immobility: defined as absence of movement, with the body inclined forward in a retracted position, passively floating or even sinking, with immobile paws shrunken close to the body. Considered a passive behaviour and the marker for inactivity, since the rat isn’t moving or doing any effort to escape or even survive. The immobile behaviour is believed to reflect a failure to persist in escape-directed behaviour after stress.
Frequency (of behaviour): number of times the animal has done the referred behaviour in analysis; It is only a support measure, since it’s not indicative of rats’ active behaviour.
Latency (of behaviour): first moment (in seconds) the animal has done the referred behaviour. Shows the delay between the first behaviour recorded and the referred behaviour in analysis. Latency of immobility shows the interval of time until the rat makes the first immobile behaviour, which can be an indicative of the rats’ low-active state if the latency time is too low. This measure as never been systematically validated across laboratories and compound classes, but is used as a data support for the other measures (Slattery and Cryan, 2012).
Stress triggers the normal rats’ behaviour when the animals are placed on water and consists on very active, sometimes uncontrolled, movements in the first minute of the test (climbing behaviour), then a more controlled, explorative movements (swimming behaviour), followed finally by a decrease in the activity of rats (floating and immobile behaviours), generally after 2 minutes test. The rats’ activity can hence be accessed by measuring both the time and sequence of movements (including latency and frequency) preformed in FST.
Figure 2.1 illustrates the four predominant behaviours of FST, as stated above.
Figure 2.1 Behaviours’ of FST: A-climbing (active upward movement); B-swimming (active lateral movement); C-floating (passive fluctuating movement); D-immobile (absence of movement).
19
2.4. Behavioural test analysis
All behaviours were analysed with ETHOWATCHER® software, a certified analytical system (Crispim Junior et al., 2012) and a tool for behavioural and video-tracking analysis in laboratory animals that allows ‘real-time’ behavioural scoring directly from the ongoing events in the environment, from analogue video files or off-line behavioural recordings from digital video files. The same digital video file may be processed for automated extraction of activity-related parameters (location, distance travelled, angle, moving speed, approximate object area, track graph) and object (animal) tracking using digital image processing techniques. The software provides time-segmented reports on duration, frequency and latency for each behavioural unit as well as the time-referenced sequence of recorded behaviours, and on the activity related-indexes. These reports are synchronized by the same time source (the frame unit number in the video file).
All videos had 310 seconds, but the first ten seconds were discarded to minimize bias and confounding variables (related to shock-adaptation period) and only the remaining 300 seconds were analysed. The video analysis was observed frame by frame to precisely score the time spent in each behaviour. Frequency was measured at each 5 seconds interval of the 300 seconds test session and only the predominant behaviour in those 5 seconds was recorded. Latency was automatically determined by the program.
2.5. Determination of plasma metabolites
The plasma concentrations of total cholesterol, high-density lipoprotein cholesterol (HDL), low-density lipoprotein cholesterol (LDL), cholesterol triglycerides, glucose, creatinine, urea, aspartate aminotransferase (AST), alanine aminotransferase (ALT), alkaline phosphatise (ALP) and gamma-glutamyl transpeptidase (γ-GT or GGT) were analyzed in serum using commercial diagnostic test kits from Roche Diagnostics (Mannheim, Germany) in a Modular Hitachi Analytical System (Roche Diagnostics). Very low-density lipoprotein cholesterol (V-LDL) and total lipids were calculated according to the formulas by Friedewald et al. (1972) and Covaci et al. (2006), respectively.
Insulin levels were measured in plasma using a commercial ELISA kit (10-1250-01, 161 Mercodia, Uppsala, Sweden). The degree of insulin resistance was calculated by the homeostasis model assessment using the insulin resistance index (HOMA-IR) (Matthews et al., 1985):
Fasting serum glucose (mmol/l) X fasting serum insulin (mU/L)/22.5
Low HOMA-IR values indicate high insulin sensitivity, whereas a high HOMA-IR value indicates high insulin resistance.
2.6. Determination of fatty acids
The fatty acid composition of the food, faeces, erythrocytes and brain were analysed. Fatty acid methyl esters (FAME) were prepared according to the method of Bandarra et al. (2001), with minor modifications.
Samples were lyophilized (260°C and 2.0 hPa) to a constant weight. FAME were obtained by adding 5 mL of acetyl chloride and anhydrous methanol mixture in a 1:19 proportion, swirling for 1 minute in a vortex and placing the contents in a 80°C bath for 1 hour. The acetyl chloride and anhydrous methanol mixture produces an exothermic reaction, so the regents were carefully added in an ice tray, placed in a hood.
20
After the bath and a 30 min cooling time, it was added 1 ml of ultra-pure H2O mili-Q and 2 ml of n-heptane to the tubes containing the mixture, that were then centrifuged at 3000 xg for 3 min. The n-heptane layer was then collected with a Pasteur pipette and filtered with anhydrous sodium sulphate into vial tubes.
FAME were concentrated to a final volume of 200 μL in n-heptane, and 2 μL of the sample was injected on a DB-Wax capillary column (30 m × 0.32 mm internal diameter × 0.25 μm film thickness; J&W Scientific, Folsom, CA, USA) in a Varian CP-3800 gas chromatograph (Varian, Palo Alto, CA, USA) equipped with a flame ionization detector (Varian). The injector and detector temperatures were set at 250°C. The adequate separation of FAME was achieved over a 40 minute period, with 5 minutes at 180°C, followed by an increase of 4°C/min until 220°C, and keeping the sample at this temperature for 25 minutes.
The quantification of total fatty acid was based on the internal standard technique, using the heneicosanoic acid (21:0). Authentic standards were used for fatty acid identification. Total and individual fatty acids were expressed as percentage of the total fatty acid.
2.7. Determination of serotonin and catecholamines
Plasma serotonin levels were determined using a commercial kit from ClinRep (GmbH Labortechnik, Munich, Germany) by high-performance liquid chromatography (HPLC) with electrochemical detection, following the procedure:
200 μL of plasma are placed in a flask sample preparation and subsequently marked with the internal standard. Then adds a precipitation reagent and the sample mixture is briefly vortexed. To remove the precipitant (sample matrix), the sample is centrifuged. An aliquot of the supernatant can then be injected into the HPLC system.
For the chromatographic separation is used a special reverse phase column. The analytes are measured by an electrochemical detector and are quantitatively evaluated using the internal standard method.
HPCL conditions for serotonin analysis are defined as follows:
Flow rate: 1.0 mL / min
Injection volume: 20 μL
Injection interval: 10 min Column heater at 30 °C
Column pressure at 200 bar, maximum value.
Detector: 450 mV
Catecholamines levels were determined using a commercial Bio-Rad kit (p-Catecholamines by HPLC reagent kit, 100 tests; 195-5880) by HPLC with electrochemical detection and employing alumina extraction, following the conditions:
Sample volume: 50 μL
Temperature: 35 °C
Detector: 0.55 V
Flow rate: 0.7 ml/min
Duration of chromatography: 19.5 min Peaks: 1-norepinephrine; 2-epinephrine; 3-dopamine
21
2.8. Statistical analysis
Statistical analyses were carried out with the Statistical Analysis Systems (SAS) software package, version 9.3 (SAS Institute, Cary, NC, USA). All data were checked for normal distribution and variance homogeneity and reported as means ± standard deviation (SD), after outlier removal with the outlier formula:
(Q1 – 1.5*IQR ; Q3 + 1.5*IQR)
The mean scores were analysed by one-way analysis of variance (ANOVA) for all biological and biochemical parameters in test and also for all the behaviours measured. This analysis was followed by a Tukey’s multiple comparisons test and value of p<0.05 was considered to be statistically significant.
22
3. Results and discussion
3.1. Growth parameters
Table 3.1 shows the average weight of the animals of each group at the beginning and at the end of the experiment, the total and daily feed intake in each group (average) and also shows tissues and carcass weights after euthanasia.
Table 3.1 Feed intake and body composition parameters (g)
Milk Fat Fish Oil Nanno Schyzo Mean SD Mean SD Mean SD Mean SD Significance
Daily feed intake
Total feed intake
21.01 ab 1323 a
0.876 55.068
19.64 c 1237 b
0.873 53.935
21.80 a 1375 a
0.986 61.872
19.65 bc 1217 b
1.288 59.533
0.001 0.001
Initial body weight 300.6 13.768 300.8 21.240 301.8 13.119 299.9 13.819 0.995 Final body weight 459.6 30.188 448.6 36.997 459.8 29.518 426.0 23.929 0.062 Total weight gain 159.0 a 18.641 147.9 ab 20.311 152.1 ab 15.995 129.2 b 16.906 0.020
Carcass
Dorso-lateral muscle
Epididymal fat
Retroperitoneal fat
Heart
Lungs
Liver
198.9 ab 6.264 6.006 4.616 1.074 1.435 13.574
10.558 0.959 1.826 1.851 0.077 0.125 1.942
194.9 ab 6.710 5.590 4.054 1.149 1.426 13.316
14.783 1.148 1.444 1.145 0.174 0.124 1.517
201.3 a 6.543 6.201 4.631 1.109 1.347
13.751
9.724 0.779 1.299 0.846 0.120 0.213 1.566
184.8 b 6.656 5.210 4.535 0.978 1.359
13.772
11.955 0.908 0.870 1.168 0.109 0.123 1.371
0.046 0.809 0.315 0.712 0.070 0.523 0.931
Spleen
Kidney
Testicle
Brain
Hippocampus
0.663 1.268 ab
1.702 1.476 0.392
0.045 0.157 0.143 0.100 0.033
0.656 1.143 b 1.762 1.463 0.433
0.109 0.049 0.111 0.088 0.071
0.694 1.288 a 1.749 1.417 0.401
0.097 0.087 0.088 0.085 0.038
0.660 1.183 ab
1.709 1.454 0.414
0.060 0.126 0.117 0.062 0.089
0.479 0.003 0.682 0.588 0.533
The difference between initial and final weights of the animals (total weight gain) is statistical different in Milk Fat group compared to Schyzo group (159.0 g and 129.2 g, respectively; p=0.02), but Fish Oil (147.9 g) and Nanno (152.1 g) groups did not show a significant difference compared to the other two groups (p>0.05).
Since all diets had the same amount of fats in order to be compared with each other, it was expected that the weight gain was not significant different between the groups. This result, however, can be explained with the amount of food ingestion. As can be seen in Table 3.1, the total feed intake is higher in Milk fat (1323 g) and Nanno (1375 g) groups than in Fish Oil (1237 g) and Schyzo (1217 g) groups (p<0.01). The daily feed intake is also different in all groups (p<0.01), being higher in Nanno group (21.80 g) and lower in Fish Oil group (19.64 g). A higher intake of food can lead to a higher final height, with Nanno group being the one with a higher total ingestion and final weight and Schyzo group the one with the lower food ingestion and also a lower final weight.
Kidney (p=0.003) and carcass (p=0.046) also show significant differences between the groups. Carcass weight has higher values for Nanno group (201.3 g) and lower figures for Schyzo group (184.8 g), which is in accordance with the final weight measured during the experiments. Kidney weight is also higher in Nanno group (1.288 g) and it is lower in Fish Oil group (1.143 g). The reason
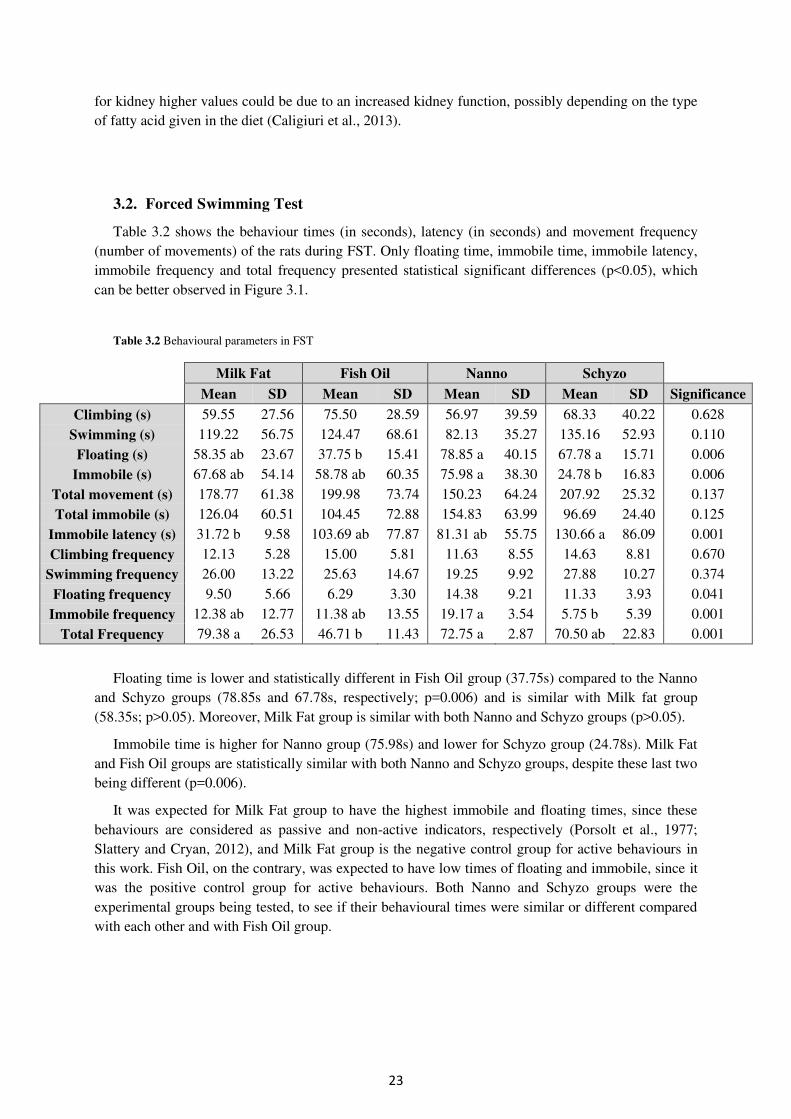
23
for kidney higher values could be due to an increased kidney function, possibly depending on the type of fatty acid given in the diet (Caligiuri et al., 2013).
3.2. Forced Swimming Test
Table 3.2 shows the behaviour times (in seconds), latency (in seconds) and movement frequency (number of movements) of the rats during FST. Only floating time, immobile time, immobile latency, immobile frequency and total frequency presented statistical significant differences (p<0.05), which can be better observed in Figure 3.1.
Table 3.2 Behavioural parameters in FST
Milk Fat Fish Oil Nanno Schyzo
Mean SD Mean SD Mean SD Mean SD Significance
Climbing (s) 59.55 27.56 75.50 28.59 56.97 39.59 68.33 40.22 0.628 Swimming (s) 119.22 56.75 124.47 68.61 82.13 35.27 135.16 52.93 0.110
Floating (s) 58.35 ab 23.67 37.75 b 15.41 78.85 a 40.15 67.78 a 15.71 0.006 Immobile (s) 67.68 ab 54.14 58.78 ab 60.35 75.98 a 38.30 24.78 b 16.83 0.006
Total movement (s) 178.77 61.38 199.98 73.74 150.23 64.24 207.92 25.32 0.137 Total immobile (s) 126.04 60.51 104.45 72.88 154.83 63.99 96.69 24.40 0.125
Immobile latency (s) 31.72 b 9.58 103.69 ab 77.87 81.31 ab 55.75 130.66 a 86.09 0.001 Climbing frequency 12.13 5.28 15.00 5.81 11.63 8.55 14.63 8.81 0.670
Swimming frequency 26.00 13.22 25.63 14.67 19.25 9.92 27.88 10.27 0.374 Floating frequency 9.50 5.66 6.29 3.30 14.38 9.21 11.33 3.93 0.041
Immobile frequency 12.38 ab 12.77 11.38 ab 13.55 19.17 a 3.54 5.75 b 5.39 0.001 Total Frequency 79.38 a 26.53 46.71 b 11.43 72.75 a 2.87 70.50 ab 22.83 0.001
Floating time is lower and statistically different in Fish Oil group (37.75s) compared to the Nanno and Schyzo groups (78.85s and 67.78s, respectively; p=0.006) and is similar with Milk fat group (58.35s; p>0.05). Moreover, Milk Fat group is similar with both Nanno and Schyzo groups (p>0.05).
Immobile time is higher for Nanno group (75.98s) and lower for Schyzo group (24.78s). Milk Fat and Fish Oil groups are statistically similar with both Nanno and Schyzo groups, despite these last two being different (p=0.006).
It was expected for Milk Fat group to have the highest immobile and floating times, since these behaviours are considered as passive and non-active indicators, respectively (Porsolt et al., 1977; Slattery and Cryan, 2012), and Milk Fat group is the negative control group for active behaviours in this work. Fish Oil, on the contrary, was expected to have low times of floating and immobile, since it was the positive control group for active behaviours. Both Nanno and Schyzo groups were the experimental groups being tested, to see if their behavioural times were similar or different compared with each other and with Fish Oil group.
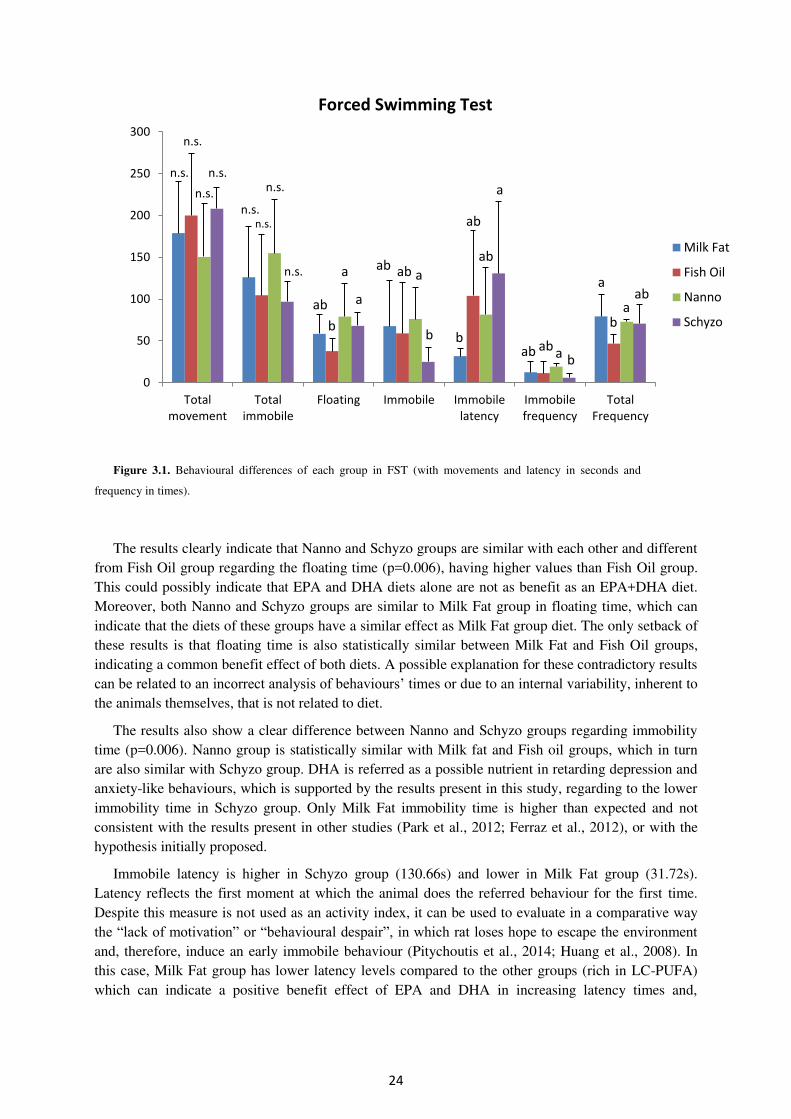
24
Forced Swimming Test
Figure 3.1. Behavioural differences of each group in FST (with movements and latency in seconds and
frequency in times).
The results clearly indicate that Nanno and Schyzo groups are similar with each other and different from Fish Oil group regarding the floating time (p=0.006), having higher values than Fish Oil group. This could possibly indicate that EPA and DHA diets alone are not as benefit as an EPA+DHA diet. Moreover, both Nanno and Schyzo groups are similar to Milk Fat group in floating time, which can indicate that the diets of these groups have a similar effect as Milk Fat group diet. The only setback of these results is that floating time is also statistically similar between Milk Fat and Fish Oil groups, indicating a common benefit effect of both diets. A possible explanation for these contradictory results can be related to an incorrect analysis of behaviours’ times or due to an internal variability, inherent to the animals themselves, that is not related to diet.
The results also show a clear difference between Nanno and Schyzo groups regarding immobility time (p=0.006). Nanno group is statistically similar with Milk fat and Fish oil groups, which in turn are also similar with Schyzo group. DHA is referred as a possible nutrient in retarding depression and anxiety-like behaviours, which is supported by the results present in this study, regarding to the lower immobility time in Schyzo group. Only Milk Fat immobility time is higher than expected and not consistent with the results present in other studies (Park et al., 2012; Ferraz et al., 2012), or with the hypothesis initially proposed.
Immobile latency is higher in Schyzo group (130.66s) and lower in Milk Fat group (31.72s). Latency reflects the first moment at which the animal does the referred behaviour for the first time. Despite this measure is not used as an activity index, it can be used to evaluate in a comparative way the “lack of motivation” or “behavioural despair”, in which rat loses hope to escape the environment and, therefore, induce an early immobile behaviour (Pitychoutis et al., 2014; Huang et al., 2008). In this case, Milk Fat group has lower latency levels compared to the other groups (rich in LC-PUFA) which can indicate a positive benefit effect of EPA and DHA in increasing latency times and,
0
50
100
150
200
250
300
Total
movement
Total
immobile
Floating Immobile Immobile
latency
Immobile
frequency
Total
Frequency
Milk Fat
Fish Oil
Nanno
Schyzo
n.s.
n.s.
n.s.
n.s.
n.s. n.s.
n.s.
n.s.
ab
ab ab
ab
ab
ab ab
ab
a
a
a
a
a
a
a
b b b
b
b
25
therefore, reducing immobile times (by doing immobility later, it gives less time to be immobile, compared to the other behaviours).
Immobile frequency presents higher values for Nanno group (19.17) and lower for Schyzo group (5.75). Milk Fat (12.38) and Fish Oil (11.38) are both statistically similar with Nanno and Schyzo (p>0.05), despite this two are different (p=0.001).
Total frequency is higher and similar between Milk Fat (79.38), Nanno (72.75) and Schyzo (70.50) groups (p>0.05). Fish Oil presents the lowest frequency times (46.71) and it’s only similar with Schyzo group (p>0.05).
Behavioural frequency is not a measure for activity state, but it can show how many times the animal alternate between the different behaviours. Regarding immobile frequency, higher values means the animal often preformed immobile behaviour, which could possible indicate a higher tendency for the animal to be less active. A higher total frequency is not directly related with more activity, only tells that the animal alternate more between the behaviours, but the sequence of behaviours performed could tell if the animal is actually tending to more active or passive behaviours. Comparing total frequency with total movement, it can be seen that higher frequencies occur in groups with lower movement times (Milk Fat and Nanno groups) and lower frequencies occur in groups with higher movement times (Fish Oil e Schyzo groups). Nevertheless, further studies need to be done in order to found valid correlations between frequency and active/passive state.
3.3. Plasma biochemical metabolites
The plasma biochemistry profile is presented in Table 3.3. HDL, creatinine and total proteins did not present a statistical difference among the groups (p=0.327; p=0.061; p=0.187 respectively) and the values are in accordance with the averages given by Kaneko et al. (2008) (mean ± standard deviation for creatinine: 1.59±0.79 mg/dl; total proteins: 75.2±2.7 g/dl; HDL: no reference values).
Kaneko et al. (2008) is the reference chosen for comparisons of biochemical parameters in this work.
Total lipids levels are statistically different between Milk Fat group and the other three groups (p=0.001), despite all diets had the same amount of lipids in their constitution. Milk Fat presents the higher values for total lipids (395 mg/dl) and Fish oil the lowest (320 mg/dl). Nanno and Schyzo group are statistically similar (327 mg/dl and 340 mg/dl, respectively; p>0.05) but Nanno group is also statistically similar with Fish Oil. A diet rich in EPA+DHA form seems to lower total lipids levels in plasma, and a diet rich in EPA tends to present similar results as the EPA+DHA diet, contrary to a DHA diet, so the benefit effects may be due to EPA action.
Total cholesterol levels are statistically similar between Fish Oil (50.4 mg/dl) and Nanno (54.5 mg/dl) groups (p>0.05), Nanno having the lowest values, but is different in Milk fat (67.3 mg/dl) and Schyzo group (61.9 mg/dl) (p=0.001). According to Kaneko et al. (2008) the reference values for cholesterol in rats are 28.3±13.7 mg/dl. The results in this study are higher than the reference, which was expected since all diets had milk fat, rich in cholesterol. Some studies refer the potential effect for EPA and DHA to reduce cholesterol levels (Werman et al., 2003; Boudrault et al., 2009; Noori et al., 2011), so it would be expected Nanno and Schyzo groups to have lowered cholesterol, which did not happened. This can be due to the fact that diets given to those groups only had EPA or DHA, instead of the combined form EPA+DHA. This hypothesis is in accordance with the results presented in this work, since Fish oil group had a diet rich in both EPA+DHA form and was the one with lower levels of total cholesterol.
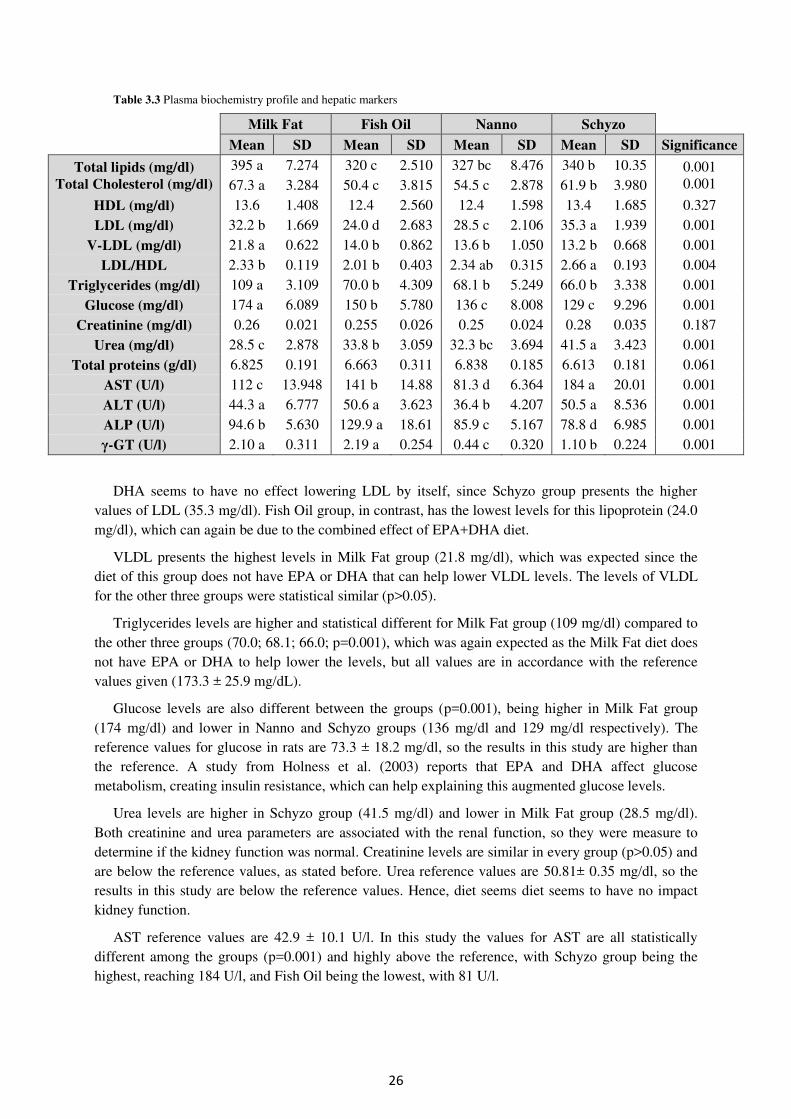
26
Table 3.3 Plasma biochemistry profile and hepatic markers
Milk Fat Fish Oil Nanno Schyzo
Mean SD Mean SD Mean SD Mean SD Significance
Total lipids (mg/dl)
Total Cholesterol (mg/dl)
395 a 7.274 320 c 2.510 327 bc 8.476 340 b 10.35 0.001 0.001 67.3 a 3.284 50.4 c 3.815 54.5 c 2.878 61.9 b 3.980
HDL (mg/dl) 13.6 1.408 12.4 2.560 12.4 1.598 13.4 1.685 0.327 LDL (mg/dl) 32.2 b 1.669 24.0 d 2.683 28.5 c 2.106 35.3 a 1.939 0.001
V-LDL (mg/dl) 21.8 a 0.622 14.0 b 0.862 13.6 b 1.050 13.2 b 0.668 0.001 LDL/HDL 2.33 b 0.119 2.01 b 0.403 2.34 ab 0.315 2.66 a 0.193 0.004
Triglycerides (mg/dl) 109 a 3.109 70.0 b 4.309 68.1 b 5.249 66.0 b 3.338 0.001 Glucose (mg/dl) 174 a 6.089 150 b 5.780 136 c 8.008 129 c 9.296 0.001
Creatinine (mg/dl) 0.26 0.021 0.255 0.026 0.25 0.024 0.28 0.035 0.187 Urea (mg/dl) 28.5 c 2.878 33.8 b 3.059 32.3 bc 3.694 41.5 a 3.423 0.001
Total proteins (g/dl) 6.825 0.191 6.663 0.311 6.838 0.185 6.613 0.181 0.061 AST (U/l) 112 c 13.948 141 b 14.88 81.3 d 6.364 184 a 20.01 0.001 ALT (U/l) 44.3 a 6.777 50.6 a 3.623 36.4 b 4.207 50.5 a 8.536 0.001 ALP (U/l) 94.6 b 5.630 129.9 a 18.61 85.9 c 5.167 78.8 d 6.985 0.001 γ-GT (U/l) 2.10 a 0.311 2.19 a 0.254 0.44 c 0.320 1.10 b 0.224 0.001
DHA seems to have no effect lowering LDL by itself, since Schyzo group presents the higher values of LDL (35.3 mg/dl). Fish Oil group, in contrast, has the lowest levels for this lipoprotein (24.0 mg/dl), which can again be due to the combined effect of EPA+DHA diet.
VLDL presents the highest levels in Milk Fat group (21.8 mg/dl), which was expected since the diet of this group does not have EPA or DHA that can help lower VLDL levels. The levels of VLDL for the other three groups were statistical similar (p>0.05).
Triglycerides levels are higher and statistical different for Milk Fat group (109 mg/dl) compared to the other three groups (70.0; 68.1; 66.0; p=0.001), which was again expected as the Milk Fat diet does not have EPA or DHA to help lower the levels, but all values are in accordance with the reference values given (173.3 ± 25.9 mg/dL).
Glucose levels are also different between the groups (p=0.001), being higher in Milk Fat group (174 mg/dl) and lower in Nanno and Schyzo groups (136 mg/dl and 129 mg/dl respectively). The reference values for glucose in rats are 73.3 ± 18.2 mg/dl, so the results in this study are higher than the reference. A study from Holness et al. (2003) reports that EPA and DHA affect glucose metabolism, creating insulin resistance, which can help explaining this augmented glucose levels.
Urea levels are higher in Schyzo group (41.5 mg/dl) and lower in Milk Fat group (28.5 mg/dl). Both creatinine and urea parameters are associated with the renal function, so they were measure to determine if the kidney function was normal. Creatinine levels are similar in every group (p>0.05) and are below the reference values, as stated before. Urea reference values are 50.81± 0.35 mg/dl, so the results in this study are below the reference values. Hence, diet seems diet seems to have no impact kidney function.
AST reference values are 42.9 ± 10.1 U/l. In this study the values for AST are all statistically different among the groups (p=0.001) and highly above the reference, with Schyzo group being the highest, reaching 184 U/l, and Fish Oil being the lowest, with 81 U/l.
27
Nanno group values for ALT are the lowest and different from the other three groups (36.4 U/l; p=0.001) but all the values are in accordance with the reference given (35.1 ± 13.3 U/l).
Diet seems to have no effect on ALP levels, since they are statistically different in every group (Milk Fat=94.6 U/l; Fish Oil=129.9 U/l; Nanno=85.9 U/l; Schyzo=78.8 U/l; p=0.001) and are in accordance with the reference values (133 U/l).
The levels of γ-GT are similar between Milk Fat and Fish Oil group (2.10 U/l and 2.19 U/l respectively; p>0.05) and are higher than Schyzo (1.10 U/l) and Nanno (0.44 U/l) groups. No reference values from Kaneko et al. (2008) were given for γ-GT.
The total protein level and the hepatic biomarkers (AST, ALT, ALP and γ-GT) were measured to determine if algae-rich diets (of Nanno and Schyzo groups) could be toxic and affected the hepatic function in rats. Since only AST levels differ from the reference values, it can be assumed that diets did not affect normal hepatic function in this study.
3.4. Fatty acid profile in faeces
Table 3.4 presents the fatty acid profile of the animals’ faeces in each group, showing differences in almost every fatty acid (p<0.05). Finding fatty acids in faeces means that the body did not retain those fatty acids, instead they were expelled as they were not fully needed in the amount given or not properly absorbed by the organism.
Total FAME levels are higher in Fish Oil (126 mg/g) group and lower in Nanno group (64.2 mg/g), which means Nanno group had a higher absorption of fatty acid in the organism. Nannochloropsis, the algae used in Nanno group diet, was reported to be efficiently incorporated into the blood, liver, and brain lipids of rats (Werman et al., 2003) so reduced levels of total FAME in faeces for this group are in accordance with the expected.
EPA (C20:5 n3) percentage is statistical different in Fish oil group compared to Nanno group (p<0.01), being higher in Nanno (5.45%) and residual in Fish oil (0.08%). Having more EPA on diet is concordant with having more EPA in faeces, as it happened in this study. Milk fat or Schyzo groups do not have EPA in faeces, since the diets of these groups also do not have EPA added. DHA (C22:6 n3) was not detected in the faeces of any group, which was expected since DHA is highly retain by the body (Wurtman, 2014; Bradbury, 2011).
Figure 3.2 shows the differences between the levels of n-3 and n-6 in the faeces of all groups.
Omega-3 is higher in Nanno group and the levels are statistically different from the other three groups (6.20%; p=0.001). It was expected the levels of n-3 were higher in Schyzo group, since the diet of this group had a higher percentage of total n-3. This can be explained as the levels of n-3 given to Schyzo group were only in DHA form, not ALA form, and DHA is not readily released by the body (Bradbury, 2011). Omega-6 is also higher in Nanno group (4.05%) and lower in Fish Oil group (1.59%). The higher percentage on n-6 in Nanno group faeces can indicate a poor absorption of n-6 by Nanno group animals’ organism, but can be also due the higher amount of AA given in diet (5% compared with 0.3% given to Fish Oil group).
The levels of saturated fatty acid (SFA), monounsaturated fatty acid (MUFA), polyunsaturated fatty acid (PUFA) are different in all groups (p=0.001), as shown in Figure 3.3.
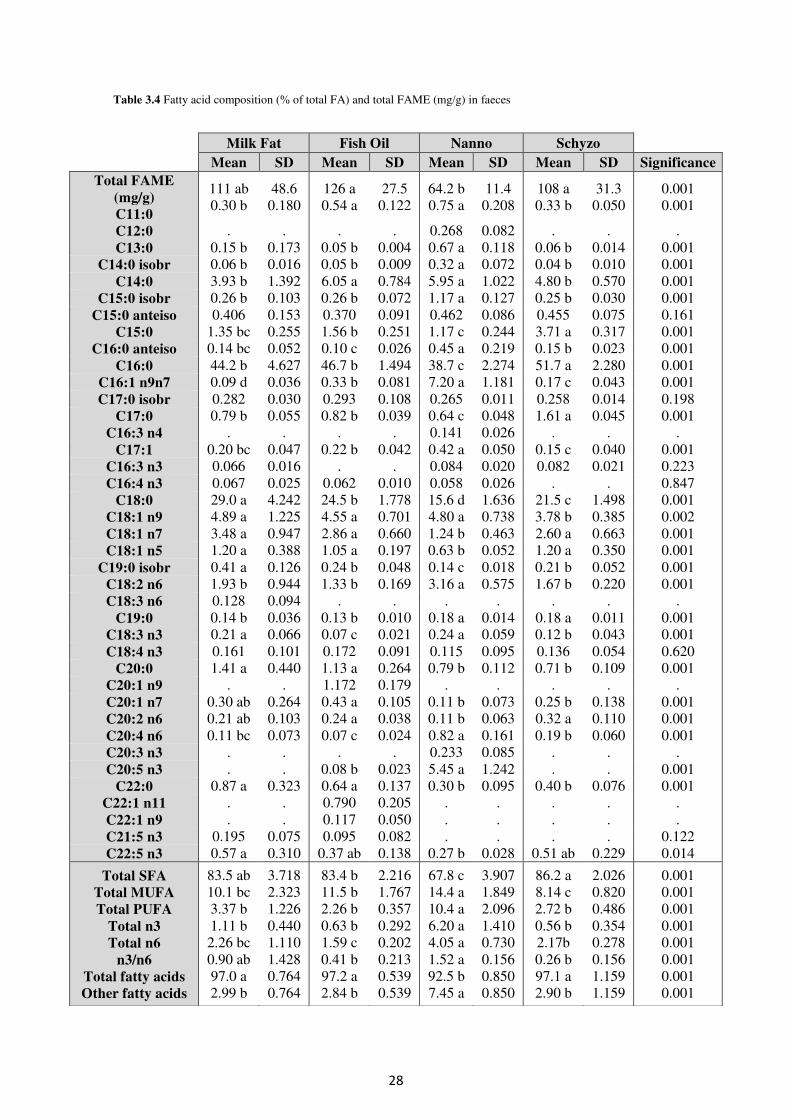
28
Table 3.4 Fatty acid composition (% of total FA) and total FAME (mg/g) in faeces
Milk Fat Fish Oil Nanno Schyzo
Mean SD Mean SD Mean SD Mean SD Significance
Total FAME
(mg/g)
C11:0
111 ab 0.30 b
48.6 0.180
126 a 0.54 a
27.5 0.122
64.2 b 0.75 a
11.4 0.208
108 a 0.33 b
31.3 0.050
0.001 0.001
C12:0 . . . . 0.268 0.082 . . . C13:0 0.15 b 0.173 0.05 b 0.004 0.67 a 0.118 0.06 b 0.014 0.001
C14:0 isobr 0.06 b 0.016 0.05 b 0.009 0.32 a 0.072 0.04 b 0.010 0.001 C14:0 3.93 b 1.392 6.05 a 0.784 5.95 a 1.022 4.80 b 0.570 0.001
C15:0 isobr 0.26 b 0.103 0.26 b 0.072 1.17 a 0.127 0.25 b 0.030 0.001 C15:0 anteiso 0.406 0.153 0.370 0.091 0.462 0.086 0.455 0.075 0.161
C15:0 1.35 bc 0.255 1.56 b 0.251 1.17 c 0.244 3.71 a 0.317 0.001 C16:0 anteiso 0.14 bc 0.052 0.10 c 0.026 0.45 a 0.219 0.15 b 0.023 0.001
C16:0 44.2 b 4.627 46.7 b 1.494 38.7 c 2.274 51.7 a 2.280 0.001 C16:1 n9n7 0.09 d 0.036 0.33 b 0.081 7.20 a 1.181 0.17 c 0.043 0.001 C17:0 isobr 0.282 0.030 0.293 0.108 0.265 0.011 0.258 0.014 0.198
C17:0 0.79 b 0.055 0.82 b 0.039 0.64 c 0.048 1.61 a 0.045 0.001 C16:3 n4 . . . . 0.141 0.026 . . .
C17:1 0.20 bc 0.047 0.22 b 0.042 0.42 a 0.050 0.15 c 0.040 0.001 C16:3 n3 0.066 0.016 . . 0.084 0.020 0.082 0.021 0.223 C16:4 n3 0.067 0.025 0.062 0.010 0.058 0.026 . . 0.847
C18:0 29.0 a 4.242 24.5 b 1.778 15.6 d 1.636 21.5 c 1.498 0.001 C18:1 n9 4.89 a 1.225 4.55 a 0.701 4.80 a 0.738 3.78 b 0.385 0.002 C18:1 n7 3.48 a 0.947 2.86 a 0.660 1.24 b 0.463 2.60 a 0.663 0.001 C18:1 n5 1.20 a 0.388 1.05 a 0.197 0.63 b 0.052 1.20 a 0.350 0.001
C19:0 isobr 0.41 a 0.126 0.24 b 0.048 0.14 c 0.018 0.21 b 0.052 0.001 C18:2 n6 1.93 b 0.944 1.33 b 0.169 3.16 a 0.575 1.67 b 0.220 0.001 C18:3 n6 0.128 0.094 . . . . . . .
C19:0 0.14 b 0.036 0.13 b 0.010 0.18 a 0.014 0.18 a 0.011 0.001 C18:3 n3 0.21 a 0.066 0.07 c 0.021 0.24 a 0.059 0.12 b 0.043 0.001 C18:4 n3 0.161 0.101 0.172 0.091 0.115 0.095 0.136 0.054 0.620
C20:0 1.41 a 0.440 1.13 a 0.264 0.79 b 0.112 0.71 b 0.109 0.001 C20:1 n9 . . 1.172 0.179 . . . . . C20:1 n7 0.30 ab 0.264 0.43 a 0.105 0.11 b 0.073 0.25 b 0.138 0.001 C20:2 n6
C20:4 n6
0.21 ab 0.11 bc
0.103 0.073
0.24 a 0.07 c
0.038 0.024
0.11 b 0.82 a
0.063 0.161
0.32 a 0.19 b
0.110 0.060
0.001 0.001
C20:3 n3 . . . . 0.233 0.085 . . . C20:5 n3 . . 0.08 b 0.023 5.45 a 1.242 . . 0.001
C22:0 0.87 a 0.323 0.64 a 0.137 0.30 b 0.095 0.40 b 0.076 0.001 C22:1 n11 . . 0.790 0.205 . . . . . C22:1 n9 . . 0.117 0.050 . . . . . C21:5 n3 0.195 0.075 0.095 0.082 . . . . 0.122 C22:5 n3 0.57 a 0.310 0.37 ab 0.138 0.27 b 0.028 0.51 ab 0.229 0.014
Total SFA
Total MUFA
Total PUFA
Total n3
Total n6
n3/n6
Total fatty acids
Other fatty acids
83.5 ab 10.1 bc 3.37 b 1.11 b 2.26 bc 0.90 ab 97.0 a 2.99 b
3.718 2.323 1.226 0.440 1.110 1.428 0.764 0.764
83.4 b 11.5 b 2.26 b 0.63 b 1.59 c 0.41 b 97.2 a 2.84 b
2.216 1.767 0.357 0.292 0.202 0.213 0.539 0.539
67.8 c 14.4 a 10.4 a 6.20 a 4.05 a 1.52 a 92.5 b 7.45 a
3.907 1.849 2.096 1.410 0.730 0.156 0.850 0.850
86.2 a 8.14 c 2.72 b 0.56 b 2.17b 0.26 b 97.1 a 2.90 b
2.026 0.820 0.486 0.354 0.278 0.156 1.159 1.159
0.001 0.001 0.001 0.001 0.001 0.001 0.001 0.001
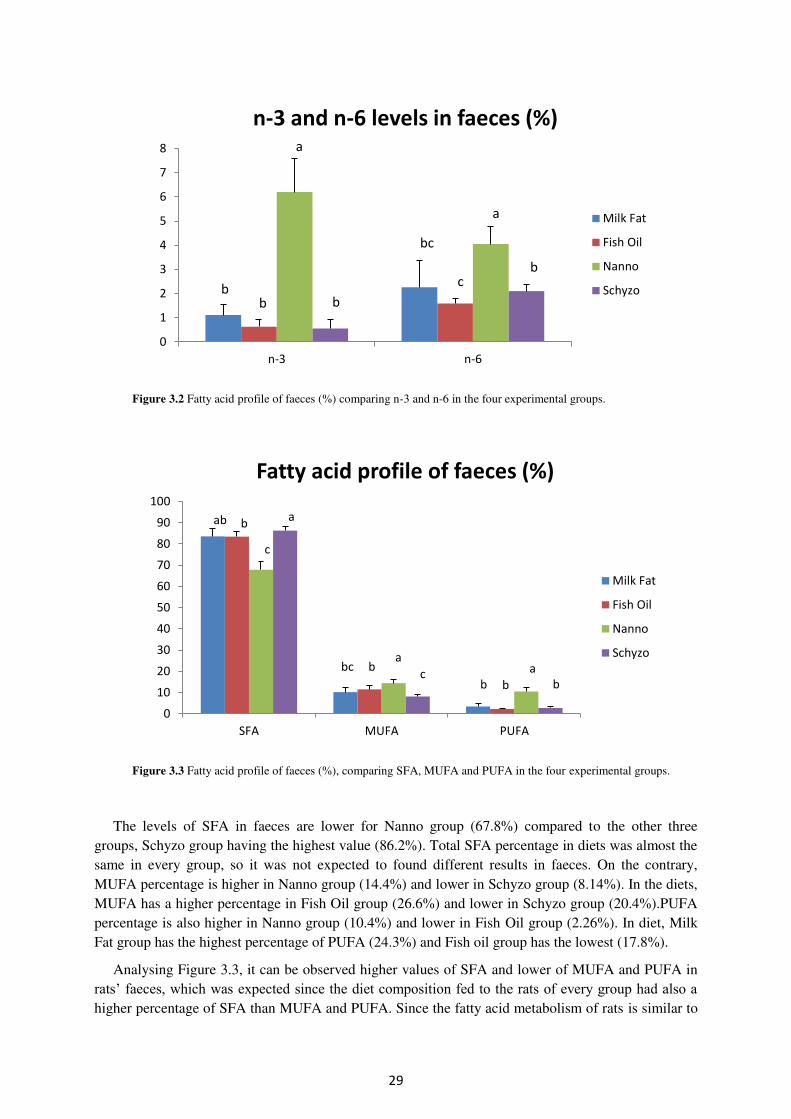
29
Figure 3.2 Fatty acid profile of faeces (%) comparing n-3 and n-6 in the four experimental groups.
Figure 3.3 Fatty acid profile of faeces (%), comparing SFA, MUFA and PUFA in the four experimental groups.
The levels of SFA in faeces are lower for Nanno group (67.8%) compared to the other three groups, Schyzo group having the highest value (86.2%). Total SFA percentage in diets was almost the same in every group, so it was not expected to found different results in faeces. On the contrary, MUFA percentage is higher in Nanno group (14.4%) and lower in Schyzo group (8.14%). In the diets, MUFA has a higher percentage in Fish Oil group (26.6%) and lower in Schyzo group (20.4%).PUFA percentage is also higher in Nanno group (10.4%) and lower in Fish Oil group (2.26%). In diet, Milk Fat group has the highest percentage of PUFA (24.3%) and Fish oil group has the lowest (17.8%).
Analysing Figure 3.3, it can be observed higher values of SFA and lower of MUFA and PUFA in rats’ faeces, which was expected since the diet composition fed to the rats of every group had also a higher percentage of SFA than MUFA and PUFA. Since the fatty acid metabolism of rats is similar to
0
1
2
3
4
5
6
7
8
n-3 n-6
n-3 and n-6 levels in faeces (%)
Milk Fat
Fish Oil
Nanno
Schyzo
a
b b b
bc
b c
a
0
10
20
30
40
50
60
70
80
90
100
SFA MUFA PUFA
Fatty acid profile of faeces (%)
Milk Fat
Fish Oil
Nanno
Schyzo
ab b
c
a
bc b a
c b b b
a
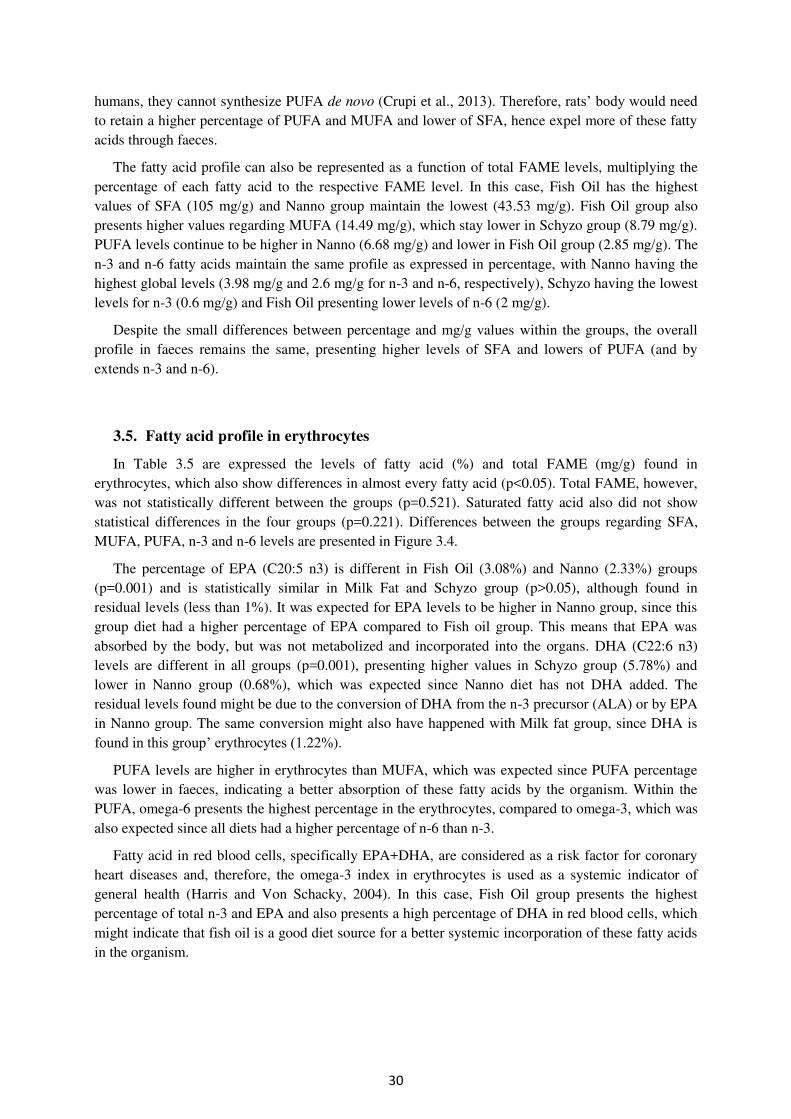
30
humans, they cannot synthesize PUFA de novo (Crupi et al., 2013). Therefore, rats’ body would need to retain a higher percentage of PUFA and MUFA and lower of SFA, hence expel more of these fatty acids through faeces.
The fatty acid profile can also be represented as a function of total FAME levels, multiplying the percentage of each fatty acid to the respective FAME level. In this case, Fish Oil has the highest values of SFA (105 mg/g) and Nanno group maintain the lowest (43.53 mg/g). Fish Oil group also presents higher values regarding MUFA (14.49 mg/g), which stay lower in Schyzo group (8.79 mg/g). PUFA levels continue to be higher in Nanno (6.68 mg/g) and lower in Fish Oil group (2.85 mg/g). The n-3 and n-6 fatty acids maintain the same profile as expressed in percentage, with Nanno having the highest global levels (3.98 mg/g and 2.6 mg/g for n-3 and n-6, respectively), Schyzo having the lowest levels for n-3 (0.6 mg/g) and Fish Oil presenting lower levels of n-6 (2 mg/g).
Despite the small differences between percentage and mg/g values within the groups, the overall profile in faeces remains the same, presenting higher levels of SFA and lowers of PUFA (and by extends n-3 and n-6).
3.5. Fatty acid profile in erythrocytes
In Table 3.5 are expressed the levels of fatty acid (%) and total FAME (mg/g) found in erythrocytes, which also show differences in almost every fatty acid (p<0.05). Total FAME, however, was not statistically different between the groups (p=0.521). Saturated fatty acid also did not show statistical differences in the four groups (p=0.221). Differences between the groups regarding SFA, MUFA, PUFA, n-3 and n-6 levels are presented in Figure 3.4.
The percentage of EPA (C20:5 n3) is different in Fish Oil (3.08%) and Nanno (2.33%) groups (p=0.001) and is statistically similar in Milk Fat and Schyzo group (p>0.05), although found in residual levels (less than 1%). It was expected for EPA levels to be higher in Nanno group, since this group diet had a higher percentage of EPA compared to Fish oil group. This means that EPA was absorbed by the body, but was not metabolized and incorporated into the organs. DHA (C22:6 n3) levels are different in all groups (p=0.001), presenting higher values in Schyzo group (5.78%) and lower in Nanno group (0.68%), which was expected since Nanno diet has not DHA added. The residual levels found might be due to the conversion of DHA from the n-3 precursor (ALA) or by EPA in Nanno group. The same conversion might also have happened with Milk fat group, since DHA is found in this group’ erythrocytes (1.22%).
PUFA levels are higher in erythrocytes than MUFA, which was expected since PUFA percentage was lower in faeces, indicating a better absorption of these fatty acids by the organism. Within the PUFA, omega-6 presents the highest percentage in the erythrocytes, compared to omega-3, which was also expected since all diets had a higher percentage of n-6 than n-3.
Fatty acid in red blood cells, specifically EPA+DHA, are considered as a risk factor for coronary heart diseases and, therefore, the omega-3 index in erythrocytes is used as a systemic indicator of general health (Harris and Von Schacky, 2004). In this case, Fish Oil group presents the highest percentage of total n-3 and EPA and also presents a high percentage of DHA in red blood cells, which might indicate that fish oil is a good diet source for a better systemic incorporation of these fatty acids in the organism.
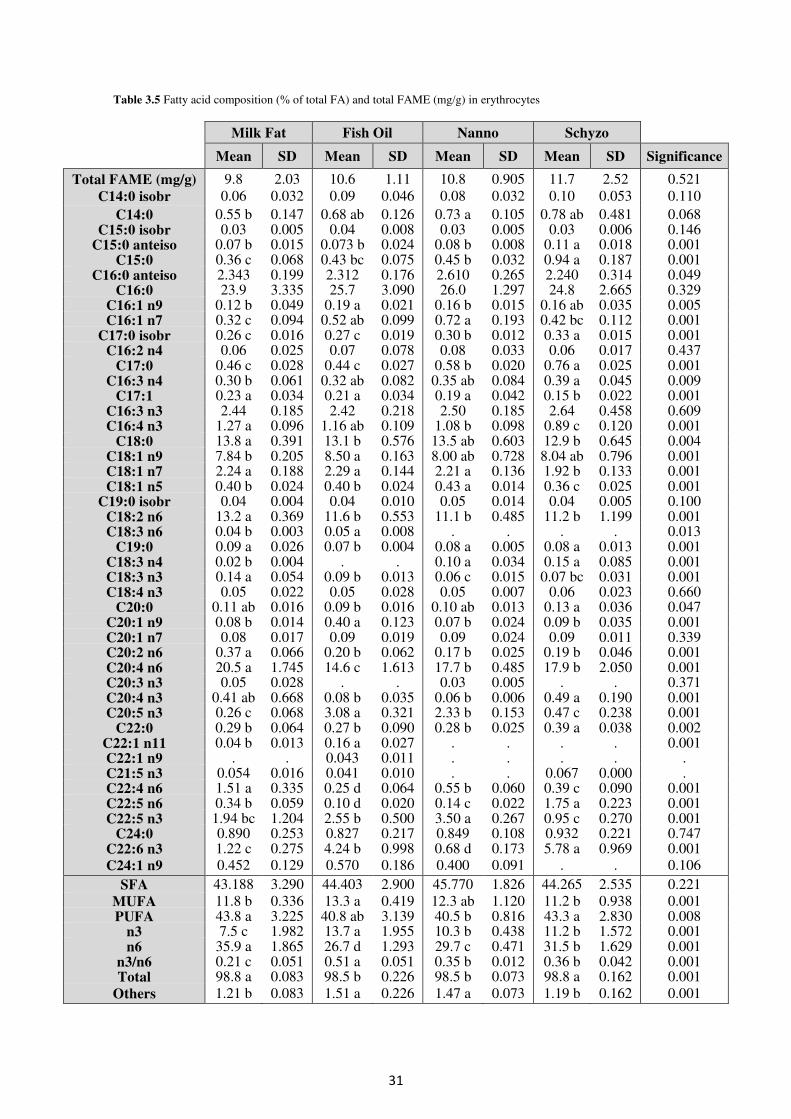
31
Table 3.5 Fatty acid composition (% of total FA) and total FAME (mg/g) in erythrocytes
Milk Fat Fish Oil Nanno Schyzo
Mean SD Mean SD Mean SD Mean SD Significance
Total FAME (mg/g)
C14:0 isobr
9.8 0.06
2.03 0.032
10.6 0.09
1.11 0.046
10.8 0.08
0.905 0.032
11.7 0.10
2.52 0.053
0.521 0.110
C14:0 0.55 b 0.147 0.68 ab 0.126 0.73 a 0.105 0.78 ab 0.481 0.068 C15:0 isobr 0.03 0.005 0.04 0.008 0.03 0.005 0.03 0.006 0.146
C15:0 anteiso 0.07 b 0.015 0.073 b 0.024 0.08 b 0.008 0.11 a 0.018 0.001 C15:0 0.36 c 0.068 0.43 bc 0.075 0.45 b 0.032 0.94 a 0.187 0.001
C16:0 anteiso 2.343 0.199 2.312 0.176 2.610 0.265 2.240 0.314 0.049 C16:0 23.9 3.335 25.7 3.090 26.0 1.297 24.8 2.665 0.329
C16:1 n9 0.12 b 0.049 0.19 a 0.021 0.16 b 0.015 0.16 ab 0.035 0.005 C16:1 n7 0.32 c 0.094 0.52 ab 0.099 0.72 a 0.193 0.42 bc 0.112 0.001
C17:0 isobr 0.26 c 0.016 0.27 c 0.019 0.30 b 0.012 0.33 a 0.015 0.001 C16:2 n4 0.06 0.025 0.07 0.078 0.08 0.033 0.06 0.017 0.437
C17:0 0.46 c 0.028 0.44 c 0.027 0.58 b 0.020 0.76 a 0.025 0.001 C16:3 n4 0.30 b 0.061 0.32 ab 0.082 0.35 ab 0.084 0.39 a 0.045 0.009
C17:1 0.23 a 0.034 0.21 a 0.034 0.19 a 0.042 0.15 b 0.022 0.001 C16:3 n3 2.44 0.185 2.42 0.218 2.50 0.185 2.64 0.458 0.609 C16:4 n3 1.27 a 0.096 1.16 ab 0.109 1.08 b 0.098 0.89 c 0.120 0.001
C18:0 13.8 a 0.391 13.1 b 0.576 13.5 ab 0.603 12.9 b 0.645 0.004 C18:1 n9 7.84 b 0.205 8.50 a 0.163 8.00 ab 0.728 8.04 ab 0.796 0.001 C18:1 n7 2.24 a 0.188 2.29 a 0.144 2.21 a 0.136 1.92 b 0.133 0.001 C18:1 n5 0.40 b 0.024 0.40 b 0.024 0.43 a 0.014 0.36 c 0.025 0.001
C19:0 isobr 0.04 0.004 0.04 0.010 0.05 0.014 0.04 0.005 0.100 C18:2 n6 13.2 a 0.369 11.6 b 0.553 11.1 b 0.485 11.2 b 1.199 0.001 C18:3 n6 0.04 b 0.003 0.05 a 0.008 . . . . 0.013
C19:0 0.09 a 0.026 0.07 b 0.004 0.08 a 0.005 0.08 a 0.013 0.001 C18:3 n4 0.02 b 0.004 . . 0.10 a 0.034 0.15 a 0.085 0.001 C18:3 n3 0.14 a 0.054 0.09 b 0.013 0.06 c 0.015 0.07 bc 0.031 0.001 C18:4 n3 0.05 0.022 0.05 0.028 0.05 0.007 0.06 0.023 0.660
C20:0 0.11 ab 0.016 0.09 b 0.016 0.10 ab 0.013 0.13 a 0.036 0.047 C20:1 n9 0.08 b 0.014 0.40 a 0.123 0.07 b 0.024 0.09 b 0.035 0.001 C20:1 n7 0.08 0.017 0.09 0.019 0.09 0.024 0.09 0.011 0.339 C20:2 n6 0.37 a 0.066 0.20 b 0.062 0.17 b 0.025 0.19 b 0.046 0.001 C20:4 n6 20.5 a 1.745 14.6 c 1.613 17.7 b 0.485 17.9 b 2.050 0.001 C20:3 n3 0.05 0.028 . . 0.03 0.005 . . 0.371 C20:4 n3 0.41 ab 0.668 0.08 b 0.035 0.06 b 0.006 0.49 a 0.190 0.001 C20:5 n3 0.26 c 0.068 3.08 a 0.321 2.33 b 0.153 0.47 c 0.238 0.001
C22:0 0.29 b 0.064 0.27 b 0.090 0.28 b 0.025 0.39 a 0.038 0.002 C22:1 n11 0.04 b 0.013 0.16 a 0.027 . . . . 0.001 C22:1 n9 . . 0.043 0.011 . . . . . C21:5 n3 0.054 0.016 0.041 0.010 . . 0.067 0.000 . C22:4 n6 1.51 a 0.335 0.25 d 0.064 0.55 b 0.060 0.39 c 0.090 0.001 C22:5 n6 0.34 b 0.059 0.10 d 0.020 0.14 c 0.022 1.75 a 0.223 0.001 C22:5 n3 1.94 bc 1.204 2.55 b 0.500 3.50 a 0.267 0.95 c 0.270 0.001
C24:0 0.890 0.253 0.827 0.217 0.849 0.108 0.932 0.221 0.747 C22:6 n3 1.22 c 0.275 4.24 b 0.998 0.68 d 0.173 5.78 a 0.969 0.001 C24:1 n9 0.452 0.129 0.570 0.186 0.400 0.091 . . 0.106
SFA 43.188 3.290 44.403 2.900 45.770 1.826 44.265 2.535 0.221 MUFA 11.8 b 0.336 13.3 a 0.419 12.3 ab 1.120 11.2 b 0.938 0.001 PUFA 43.8 a 3.225 40.8 ab 3.139 40.5 b 0.816 43.3 a 2.830 0.008
n3 7.5 c 1.982 13.7 a 1.955 10.3 b 0.438 11.2 b 1.572 0.001 n6 35.9 a 1.865 26.7 d 1.293 29.7 c 0.471 31.5 b 1.629 0.001
n3/n6 0.21 c 0.051 0.51 a 0.051 0.35 b 0.012 0.36 b 0.042 0.001 Total 98.8 a 0.083 98.5 b 0.226 98.5 b 0.073 98.8 a 0.162 0.001
Others 1.21 b 0.083 1.51 a 0.226 1.47 a 0.073 1.19 b 0.162 0.001
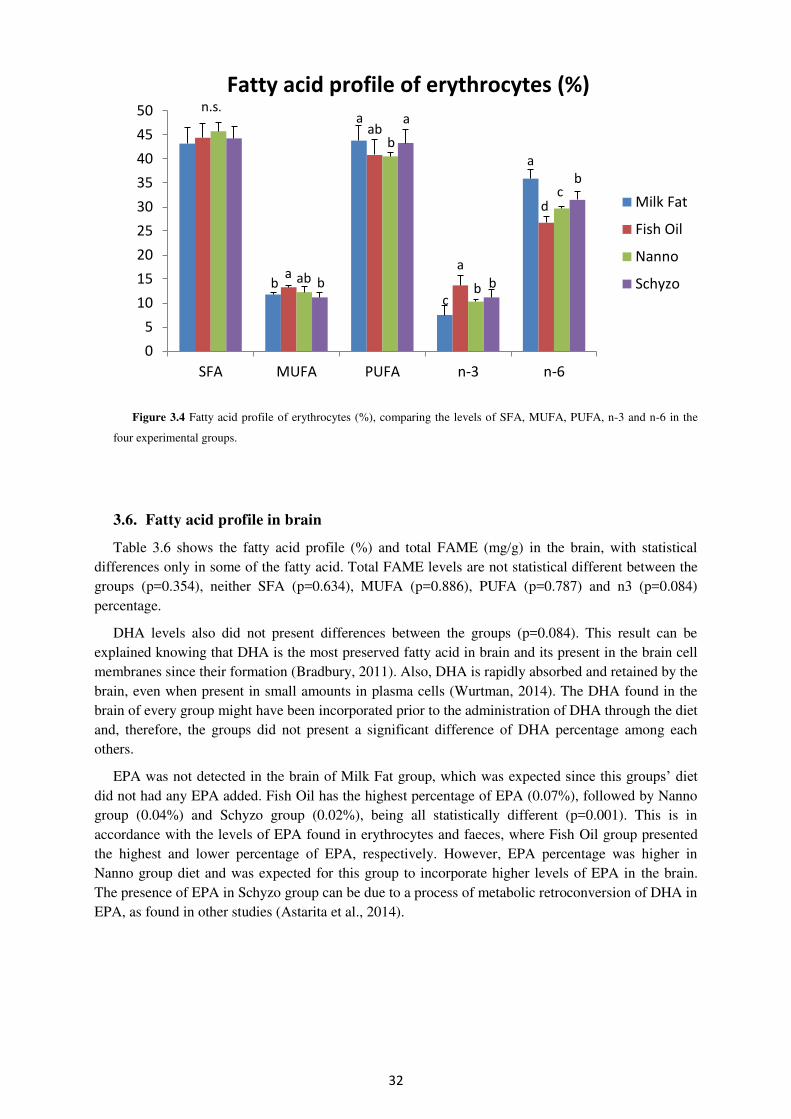
32
Figure 3.4 Fatty acid profile of erythrocytes (%), comparing the levels of SFA, MUFA, PUFA, n-3 and n-6 in the
four experimental groups.
3.6. Fatty acid profile in brain
Table 3.6 shows the fatty acid profile (%) and total FAME (mg/g) in the brain, with statistical differences only in some of the fatty acid. Total FAME levels are not statistical different between the groups (p=0.354), neither SFA (p=0.634), MUFA (p=0.886), PUFA (p=0.787) and n3 (p=0.084) percentage.
DHA levels also did not present differences between the groups (p=0.084). This result can be explained knowing that DHA is the most preserved fatty acid in brain and its present in the brain cell membranes since their formation (Bradbury, 2011). Also, DHA is rapidly absorbed and retained by the brain, even when present in small amounts in plasma cells (Wurtman, 2014). The DHA found in the brain of every group might have been incorporated prior to the administration of DHA through the diet and, therefore, the groups did not present a significant difference of DHA percentage among each others.
EPA was not detected in the brain of Milk Fat group, which was expected since this groups’ diet did not had any EPA added. Fish Oil has the highest percentage of EPA (0.07%), followed by Nanno group (0.04%) and Schyzo group (0.02%), being all statistically different (p=0.001). This is in accordance with the levels of EPA found in erythrocytes and faeces, where Fish Oil group presented the highest and lower percentage of EPA, respectively. However, EPA percentage was higher in Nanno group diet and was expected for this group to incorporate higher levels of EPA in the brain. The presence of EPA in Schyzo group can be due to a process of metabolic retroconversion of DHA in EPA, as found in other studies (Astarita et al., 2014).
0
5
10
15
20
25
30
35
40
45
50
SFA MUFA PUFA n-3 n-6
Milk Fat
Fish Oil
Nanno
Schyzoa
b ab b
a ab
b
a
a
c b b
a
d c
b
n.s.
Fatty acid profile of erythrocytes (%)
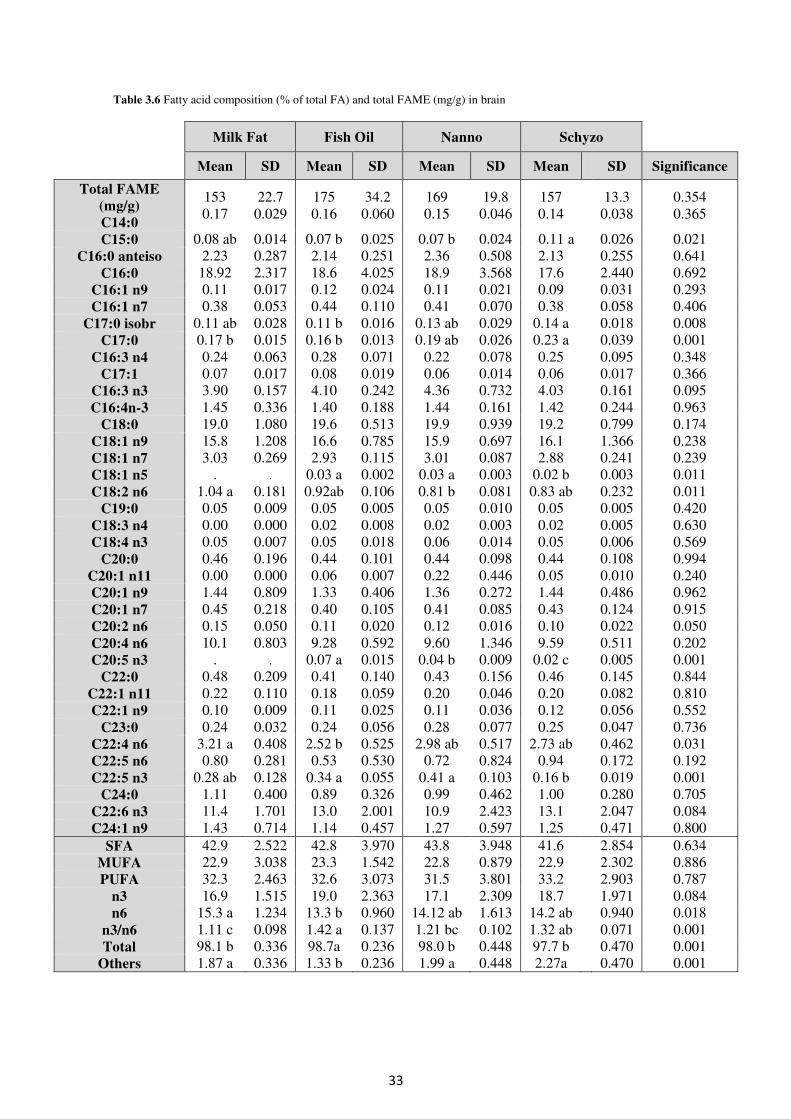
33
Table 3.6 Fatty acid composition (% of total FA) and total FAME (mg/g) in brain
Milk Fat Fish Oil Nanno Schyzo
Mean SD Mean SD Mean SD Mean SD Significance
Total FAME
(mg/g)
C14:0
153 0.17
22.7 0.029
175 0.16
34.2 0.060
169 0.15
19.8 0.046
157 0.14
13.3
0.038 0.354 0.365
C15:0 0.08 ab 0.014 0.07 b 0.025 0.07 b 0.024 0.11 a 0.026 0.021 C16:0 anteiso 2.23 0.287 2.14 0.251 2.36 0.508 2.13 0.255 0.641
C16:0 18.92 2.317 18.6 4.025 18.9 3.568 17.6 2.440 0.692 C16:1 n9 0.11 0.017 0.12 0.024 0.11 0.021 0.09 0.031 0.293 C16:1 n7 0.38 0.053 0.44 0.110 0.41 0.070 0.38 0.058 0.406
C17:0 isobr 0.11 ab 0.028 0.11 b 0.016 0.13 ab 0.029 0.14 a 0.018 0.008 C17:0 0.17 b 0.015 0.16 b 0.013 0.19 ab 0.026 0.23 a 0.039 0.001
C16:3 n4 0.24 0.063 0.28 0.071 0.22 0.078 0.25 0.095 0.348 C17:1 0.07 0.017 0.08 0.019 0.06 0.014 0.06 0.017 0.366
C16:3 n3 3.90 0.157 4.10 0.242 4.36 0.732 4.03 0.161 0.095 C16:4n-3 1.45 0.336 1.40 0.188 1.44 0.161 1.42 0.244 0.963
C18:0 19.0 1.080 19.6 0.513 19.9 0.939 19.2 0.799 0.174 C18:1 n9 15.8 1.208 16.6 0.785 15.9 0.697 16.1 1.366 0.238 C18:1 n7 3.03 0.269 2.93 0.115 3.01 0.087 2.88 0.241 0.239 C18:1 n5 . . 0.03 a 0.002 0.03 a 0.003 0.02 b 0.003 0.011 C18:2 n6 1.04 a 0.181 0.92ab 0.106 0.81 b 0.081 0.83 ab 0.232 0.011
C19:0 0.05 0.009 0.05 0.005 0.05 0.010 0.05 0.005 0.420 C18:3 n4 0.00 0.000 0.02 0.008 0.02 0.003 0.02 0.005 0.630 C18:4 n3 0.05 0.007 0.05 0.018 0.06 0.014 0.05 0.006 0.569
C20:0 0.46 0.196 0.44 0.101 0.44 0.098 0.44 0.108 0.994 C20:1 n11 0.00 0.000 0.06 0.007 0.22 0.446 0.05 0.010 0.240 C20:1 n9 1.44 0.809 1.33 0.406 1.36 0.272 1.44 0.486 0.962 C20:1 n7 0.45 0.218 0.40 0.105 0.41 0.085 0.43 0.124 0.915 C20:2 n6 0.15 0.050 0.11 0.020 0.12 0.016 0.10 0.022 0.050 C20:4 n6 10.1 0.803 9.28 0.592 9.60 1.346 9.59 0.511 0.202 C20:5 n3 . . 0.07 a 0.015 0.04 b 0.009 0.02 c 0.005 0.001
C22:0 0.48 0.209 0.41 0.140 0.43 0.156 0.46 0.145 0.844 C22:1 n11 0.22 0.110 0.18 0.059 0.20 0.046 0.20 0.082 0.810 C22:1 n9 0.10 0.009 0.11 0.025 0.11 0.036 0.12 0.056 0.552
C23:0 0.24 0.032 0.24 0.056 0.28 0.077 0.25 0.047 0.736 C22:4 n6 3.21 a 0.408 2.52 b 0.525 2.98 ab 0.517 2.73 ab 0.462 0.031 C22:5 n6 0.80 0.281 0.53 0.530 0.72 0.824 0.94 0.172 0.192 C22:5 n3 0.28 ab 0.128 0.34 a 0.055 0.41 a 0.103 0.16 b 0.019 0.001
C24:0 1.11 0.400 0.89 0.326 0.99 0.462 1.00 0.280 0.705 C22:6 n3 11.4 1.701 13.0 2.001 10.9 2.423 13.1 2.047 0.084 C24:1 n9 1.43 0.714 1.14 0.457 1.27 0.597 1.25 0.471 0.800
SFA 42.9 2.522 42.8 3.970 43.8 3.948 41.6 2.854 0.634 MUFA 22.9 3.038 23.3 1.542 22.8 0.879 22.9 2.302 0.886 PUFA 32.3 2.463 32.6 3.073 31.5 3.801 33.2 2.903 0.787
n3 16.9 1.515 19.0 2.363 17.1 2.309 18.7 1.971 0.084 n6 15.3 a 1.234 13.3 b 0.960 14.12 ab 1.613 14.2 ab 0.940 0.018
n3/n6 1.11 c 0.098 1.42 a 0.137 1.21 bc 0.102 1.32 ab 0.071 0.001 Total 98.1 b 0.336 98.7a 0.236 98.0 b 0.448 97.7 b 0.470 0.001
Others 1.87 a 0.336 1.33 b 0.236 1.99 a 0.448 2.27a 0.470 0.001
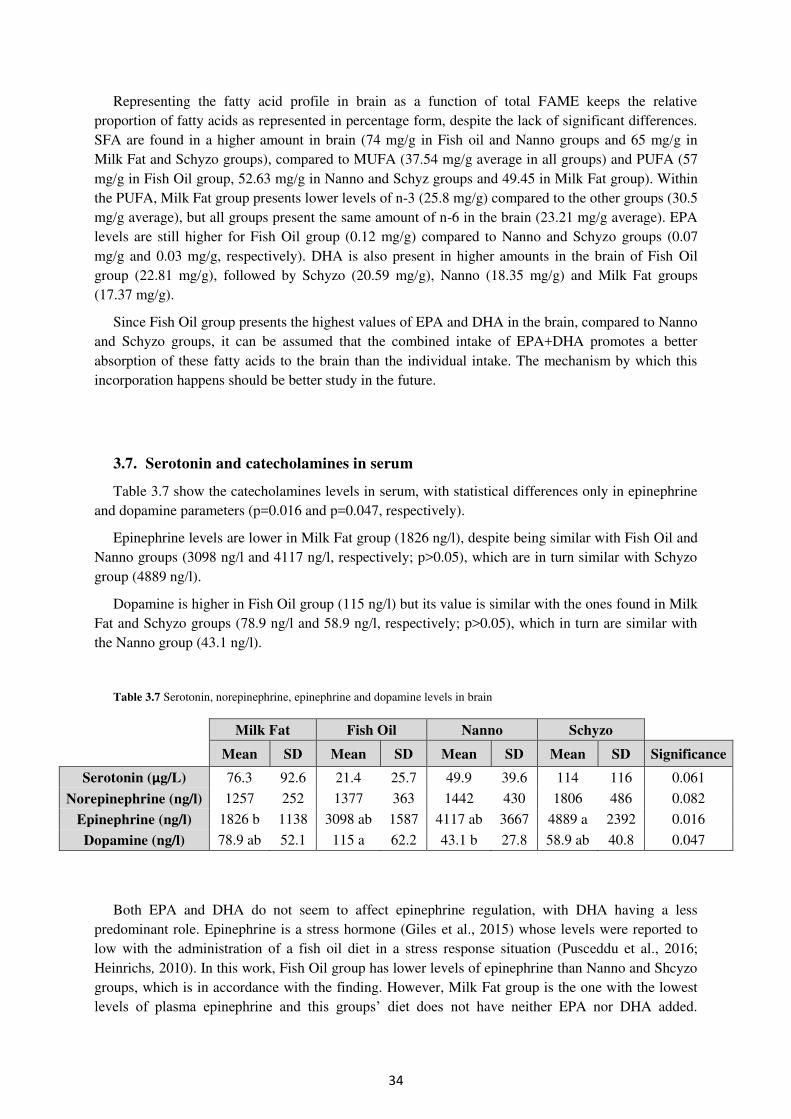
34
Representing the fatty acid profile in brain as a function of total FAME keeps the relative proportion of fatty acids as represented in percentage form, despite the lack of significant differences. SFA are found in a higher amount in brain (74 mg/g in Fish oil and Nanno groups and 65 mg/g in Milk Fat and Schyzo groups), compared to MUFA (37.54 mg/g average in all groups) and PUFA (57 mg/g in Fish Oil group, 52.63 mg/g in Nanno and Schyz groups and 49.45 in Milk Fat group). Within the PUFA, Milk Fat group presents lower levels of n-3 (25.8 mg/g) compared to the other groups (30.5 mg/g average), but all groups present the same amount of n-6 in the brain (23.21 mg/g average). EPA levels are still higher for Fish Oil group (0.12 mg/g) compared to Nanno and Schyzo groups (0.07 mg/g and 0.03 mg/g, respectively). DHA is also present in higher amounts in the brain of Fish Oil group (22.81 mg/g), followed by Schyzo (20.59 mg/g), Nanno (18.35 mg/g) and Milk Fat groups (17.37 mg/g).
Since Fish Oil group presents the highest values of EPA and DHA in the brain, compared to Nanno and Schyzo groups, it can be assumed that the combined intake of EPA+DHA promotes a better absorption of these fatty acids to the brain than the individual intake. The mechanism by which this incorporation happens should be better study in the future.
3.7. Serotonin and catecholamines in serum
Table 3.7 show the catecholamines levels in serum, with statistical differences only in epinephrine and dopamine parameters (p=0.016 and p=0.047, respectively).
Epinephrine levels are lower in Milk Fat group (1826 ng/l), despite being similar with Fish Oil and Nanno groups (3098 ng/l and 4117 ng/l, respectively; p>0.05), which are in turn similar with Schyzo group (4889 ng/l).
Dopamine is higher in Fish Oil group (115 ng/l) but its value is similar with the ones found in Milk Fat and Schyzo groups (78.9 ng/l and 58.9 ng/l, respectively; p>0.05), which in turn are similar with the Nanno group (43.1 ng/l).
Table 3.7 Serotonin, norepinephrine, epinephrine and dopamine levels in brain
Milk Fat Fish Oil Nanno Schyzo
Mean SD Mean SD Mean SD Mean SD Significance
Serotonin (μg/L) 76.3 92.6 21.4 25.7 49.9 39.6 114 116 0.061
Norepinephrine (ng/l) 1257 252 1377 363 1442 430 1806 486 0.082
Epinephrine (ng/l) 1826 b 1138 3098 ab 1587 4117 ab 3667 4889 a 2392 0.016
Dopamine (ng/l) 78.9 ab 52.1 115 a 62.2 43.1 b 27.8 58.9 ab 40.8 0.047
Both EPA and DHA do not seem to affect epinephrine regulation, with DHA having a less predominant role. Epinephrine is a stress hormone (Giles et al., 2015) whose levels were reported to low with the administration of a fish oil diet in a stress response situation (Pusceddu et al., 2016; Heinrichs, 2010). In this work, Fish Oil group has lower levels of epinephrine than Nanno and Shcyzo groups, which is in accordance with the finding. However, Milk Fat group is the one with the lowest levels of plasma epinephrine and this groups’ diet does not have neither EPA nor DHA added.
35
Furthermore, its levels are similar with both Fish Oil and Nanno groups’, which can lead to the assumption that neither EPA nor DHA affect the epinephrine system, and can even worse it, contradicting the other studies results.
In this study, dopamine was measured to determine the level of motivation of the animals, being higher values related to higher motivation. Various studies report the role of LC-PUFA on dopamine regulation, being lower levels of dopamine in the system related with PUFA deficiency (Husted and Bouzinova, 2016; Morgese and Trabace, 2016; Pusceddu et al., 2016). In this study, the lowest levels of dopamine in plasma are found in Nanno and Schyzo groups. Fish Oil group, however, presents the highest levels of dopamine, which is in accordance with the other results found. Therefore, it can be assumed that an EPA and DHA alone have a lower impact on regulating dopaminergic system than an EPA+DHA diet.
3.8. Integrative discussion
Behavioural FST revealed the potential benefit effect of EPA+DHA intake, rather than individual fatty acid intake, since Fish Oil group presented a better overall performance. These results can be due to the highest levels of LC-PUFA found in erythrocytes and brain, which might indicate that fish oil is a good diet source for a better systemic incorporation of fatty acids in the organism.
Both Milk Fat and Nanno presented the worse results in FST, with high immobile levels, low latency and higher frequencies. Schyzo group has more similar results to Fish Oil group than Nanno group, which might indicate a better role of individual DHA, contrarily to individual EPA. However, Milk Fat group results were often similar with the other groups. The presence of DHA in Milk Fat group’ brain, in similar levels as the other groups, can help explain these similar behavioural results. Nevertheless, DHA alone is not the key factor in positive behaviours, since Schyzo group performance is lower than the Fish Oil group.
EPA lack-of-effect in Nanno group can also be explained, since the levels found in faeces are high and in brain they are lower than expected. This means EPA was not properly absorbed and metabolized, therefore, its action leads to lower overall effects and must be better clarified. A diet rich in Nannochloropsis oil instead of algae crude fibers, as it was administered in this work, can possible increase de bioavailability of EPA and increase the absorption by rats’ organism, which may influence the animals’ performance in all parameters measured.
Regarding biochemical values in plasma, a diet rich in EPA+DHA form seems to lower total lipids levels better than individual intake of these fatty acids. However, EPA tends to present similar results as the EPA+DHA diet, contrary to a DHA diet, so the benefit effects may be due to EPA action. More studies need to be done in order to clarify this relation. Total cholesterol levels can also be lowered with an EPA+DHA diet, but individual intakes of these fatty acids are less effective.
Dopamine and epinephrine levels were also better for Fish Oil group, reinforcing the behavioural results found and also the benefit power of fish oil diet.
36
Conclusion and future perspectives
The underlying hypothesis of this work was that EPA and DHA would have different behavioural effects when ingested individually and in combined form. EPA diet alone had a better cardiovascular and health impact, but poor behavioural modulation. DHA diet alone presented better behavioural effects than EPA. Fish oil diet (rich in both fatty acids) revealed the best overall results regarding behaviour, plasma biomarkers and dopamine levels. Therefore, an EPA+DHA diet seems to be more adequate for the promotion of whole organism health and also helps increasing active behaviours, which can be benefit for neurologic conditions, as depression or other mood disorders.
This work highlighted the role of EPA and DHA in active/passive behaviour and overall health in rats. However, there were some limitations that did not allow a better delve into this role and that can be improved in future studies.
A better adjustment of the diets is needed, regarding the chemical composition and fatty acid quantities, in order to be the most similar as possible between the different groups, with only one variation (in this case the specific amount of EPA, DHA or EPA+DHA). Increasing the doses or the experimental time might help having clear results regarding individual role of the different fatty acids. Also, start feeding the animals with a specific diet early in their lives, instead of feeding a standard diet (which has all essential nutritional compounds), might help reducing the postnatal intake of EPA and DHA and, therefore, reduce the postnatal incorporation of undesirable fatty acids in specific groups.
A way to access the specific effects of EPA and DHA, not included in this study, is through other mechanisms, as endocannabinoid system or analyzing other serum markers. Another way is to use different behavioural tests and cross the information obtained to corroborate the results or perform the test with recourse of inhibition/simulation drugs. The use of transgenic rats, made specific in accordance with the proposed objectives, might also help reducing confounding variablesrelated to internal variability, inherent to the animals themselves.
37
References
Adams, P. B., Lawson, S., Sanigorski, A. and Sinclair, A. I. (1996). Arachidonic Acid to Eicosapentaenoic Acid Ratio in Blood Correlates Positively with Clinical Symptoms of Depression. Lipids 31, S-157-S-161
Appleton, K. M., Rogers, P. J. and Ness, A. R. (2010). Updated systematic review and meta-analysis of the effects of n-3 long-chain polyunsaturated fatty acids on depressed mood. Am J Clin
Nutr. 91:757–70. doi: 10.3945/ajcn.2009.28313
Appleton, K. M., Grippo, A. J., Beltz, T. G. and Johnson, A. K. (2015). Consumption of a high n-3 polyunsaturated fatty acid diet during gradual mild physiological stress in rats. Prostaglandins Leukot
Essent Fatty Acids. 95: 11–18. doi:10.1016/j.plefa.2014.11.010.
Arbabi, L., Baharuldin, M. T. H., Moklas, M. A M., Fakurazi, S., Muhammad, S. I. (2014). Antidepressant-like effects of omega-3 fatty acids in postpartum model of depression in rats. Behavioural Brain Research 271. 65–71. http://dx.doi.org/10.1016/j.bbr.2014.05.036
Astarita, G., McKenzie, J. H., Wang, B., Strassburg, K., Doneanu, A., et al. (2014). A Protective Lipidomic Biosignature Associated with a Balanced Omega-6/Omega-3 Ratio in fat-1 Transgenic Mice. PLoS ONE. 9(4): e96221. doi:10.1371/journal.pone.0096221
Avenevoli, S., Swendsen, J., He, J. P., Burstein, M. and Merikangas, K. (2015). Major Depression in the National Comorbidity Survey- Adolescent Supplement: Prevalence, Correlates, and Treatment. J Am Acad Child Adolesc Psychiatry. 54(1): 37–44.e2. doi:10.1016/j.jaac.2014.10.010.
Bandarra, N. M., Batista, I., Nunes, M. L., Empis JM. (2001). Seasonal variation in the chemical composition of horse-mackerel (Trachurus trachurus). Eur Food Res Technol. 212:535
Bandarra, N. M., Lopes, P. A., Martins, S. V., Ferreira, J., Alfaia, C. M., Rolo, E. A., et al. (2016). Docosahexaenoic acid at the sn-2 position of structured triacylglycerols improved n-3 polyunsaturated fatty acid assimilation in tissues of hamsters. Nutrition Research. 452–463
Bauer, I., Hughes, M., Rowsell, R., Cockerell, R., Pipingas, A., Crewther, S., et al. (2014). Omega-3 supplementation improves cognition and modifies brain activation in young adults. Hum.
Psychopharmacol Clin Exp. 29: 133–144. DOI: 10.1002/hup.2379
Berke, J.D. and Hyman, S. E. (2000). Addiction, Dopamine, and the Molecular Mechanisms of Memory. Neuron, Vol. 25, 515–532
Bondi, C. O., Taha, A. Y., Tock, J. L., Totah, N. K., Cheon, Y., Torres, G. E., et al. (2014). Adolescent behavior and dopamine availability are uniquely sensitive to dietary omega-3 fatty acid deficiency. Biol Psychiatry. 75(1): doi:10.1016/j.biopsych. 2013.06.007.
Boudrault, C., Bazinet, R. P. and Ma, D. W. L. (2009). Experimental models and mechanisms underlying the protective effects of n-3 polyunsaturated fatty acids in Alzheimer's disease. Journal of
Nutritional Biochemistry 20. 1–10. doi:10.1016/j.jnutbio.2008.05.016
Bozzatello, P., Brignolo, E., De Grandi, E. and Bellino, S. (2016). Supplementation with Omega-3 Fatty Acids in Psychiatric Disorders: A Review of Literature Data. J. Clin. Med. 2016, 5, 67; doi:10.3390/jcm5080067
Bradbury, J. (2011). Docosahexaenoic Acid (DHA): An Ancient Nutrient for the Modern Human Brain. Nutrients. 3, 529-554; doi:10.3390/nu3050529
38
Calder, P. C. (2012). Mechanisms of Action of (n-3) Fatty Acids. The Journal of Nutrition. Supplement: Heart Healthy Omega-3s for Food—Stearidonic Acid (SDA) as a Sustainable Choice. doi:10.3945/jn.111.155259.
Caligiuri, S. P. B., Love, K., Winter, T., Gauthier, J., Taylor, C. J., Blydt-Hansen, T., et al. (2013). Dietary Linoleic Acid and a-Linolenic Acid Differentially Affect Renal Oxylipins and Phospholipid Fatty Acids in Diet-Induced Obese Rats. J. Nutr. 143: 1421– 1431. doi:10.3945/jn.113.177360
Campos-Silva, P., Furriel, A., Costa, W. S., Sampaio, F. J. B., Gregório, B. M. (2015). Metabolic and testicular effects of the long-term administration of different high-fat diets in adult rats. ibju. Vol. 41 (3): 569-575. doi: 10.1590/S1677-5538.IBJU.2014.0244
Can, A., Dao, D. T., Arad, M., Terrillion, C. E., Piantadosi, S. C. and Gould, T. D. (2012). The Mouse Forced Swim Test. J. Vis. Exp. (59), e3638, DOI:10.3791/3638
Carabelli, B., Delattre, A. M., Pudell, C., Mori, M. A., Suchecki, D., Machado, R. B., et al. (2015). The Antidepressant-Like Effect of Fish Oil: Possible Role of Ventral Hippocampal 5-HT1A Post-synaptic Receptor Mol Neurobiol. 52:206–215. DOI 10.1007/s12035-014-8849-8
Chalon, S., Delion-Vancassel, S., Belzung, C., Guilloteau, D., Leguisquet, A. M., Besnard, J. C., et al. (1998). Dietary Fish Oil Affects Monoaminergic Neurotransmission and Behavior in Rats. The
Journal of Nutrition. 128: 2512–2519
Covaci, A., Voorspoels, S., Thomsen, C., van Bavel, B., Neels, H. (2006). Evaluation of total lipids using enzymatic methods for the normalization of persistent organic pollutant levels in serum. Sci
Total Environ. 366:361–6
Crispim Junior, C. F., Pederiva, C. N., Bose, R. C., Garcia, V. A., Lino-de-Oliveira and C., Marino-Neto, J. (2012). ETHOWATCHER: validation of a tool for behavioral and video-tracking analysis in laboratory animals. Computers in Biology and Medicine. 42 257–264. doi:10.1016/j.compbiomed.2011.12.002
Crupi, R., Marino, A. and Cuzzocrea, S. (2013). n-3 Fatty Acids: Role in Neurogenesis and Neuroplasticity. Current Medicinal Chemistry. 20, 2953-2963
Cutuli, D., De Bartolo, P., Caporali, P., Laricchiuta, D., Foti, F., Ronci, M., et al. (2014). n-3 polyunsaturated fatty acids supplementation enhances hippocampal functionality in aged mice. Frontiers in Aging Neuroscience. doi: 10.3389/ fnagi.2014.00220
Das, U. N. (2003). Long-Chain Polyunsaturated Fatty Acids in the Growth and Development of the Brain and Memory. Nutrition. 19:62– 65. PII S0899-9007(02)00852-3
Das, S. K., Barhwal, K., Hota, S. K., Thakur, M. K. and Srivastava, R. B. (2015). Disrupting monotony during social isolation stress prevents early development of anxiety and depression like traits in male rats. BMC Neuroscience. DOI 10.1186/ s12868-015-0141
de Souza, R. J., Mente, A., Maroleanu, A., Cozma, A. I., Ha, V., Kishibe, T., et al. (2015). Intake of saturated and trans unsaturated fatty acids and risk of all cause mortality, cardiovascular disease, and type 2 diabetes:systematic review and meta-analysis of observational studies. BMJ. 351:h3978. doi: 10.1136/bmj.h3978
Dunstan, J. A., Simmer, K., Dixon, G. and Prescott, S. L. (2008). Cognitive assessment of children at age 2(1/2) years after maternal fish oil supplementation in pregnancy: a randomised controlled trial. Arch Dis Child Fetal Neonatal Ed. 93(1):F45-50. 10.1136/adc.2006.099085
39
Dutta, A. K., Santra, S., Sharma, H., Voshavar, C., Xu, L., et al. (2014) Pharmacological and Behavioral Characterization of D-473, an Orally Active Triple Reuptake Inhibitor Targeting Dopamine, Serotonin and Norepinephrine Transporters. PLoS ONE. 9(11): e113420. doi:10.1371/journal.pone.0113420
Dyall, S. C. and Michael-Titus, A. T. (2008). Neurological Benefits of Omega-3 Fatty Acids. Neuromol Med. 10:219–235. DOI 10.1007/s12017-008-8036-z
Dyall, S. C. (2015) Long-chain omega-3 fatty acids and the brain: a review of the independent and shared effects of EPA, DPA and DHA. Front. Aging Neurosci. 7:52. doi: 10.3389/fnagi.2015.00052
Estadella, D., Nascimento, C. M. P. O., Oyama, L. M., Ribeiro, E. B., Dâmaso, A. R. and de Piano, A. (2013). Lipotoxicity: Effects of Dietary Saturated and Transfatty Acids. Mediators of Inflammation
Volume 2013, Article ID 137579, 13 pages. http://dx.doi.org/10.1155/2013/ 137579
Ferraz, A. C., Delattre, A. M., Almendra, R. G., Sonagli, M., Borges, C., Araujo, P., et al. (2011). Chronic ω-3 fatty acids supplementation promotes beneficial effects on anxiety, cognitive and depressive-like behaviors in rats subjected to a restraint stress protocol. Behavioural Brain Research
219. 116–122
Friedewald, W. T., Levy, R.I., Fredrickson, D. S. (1972). Estimation of the concentration of low-density lipoprotein cholesterol in plasma, without use of the preparative ultracentrifuge. ClinChem. 18:499–502
Giles, G. E., Mahoney, C. R., Urry, H. L., Brunyé, T. T., Taylor, H. A. and Kanarek, R. B. (2015). Omega-3 fatty acids and stress-induced changes to mood and cognition in healthy individuals. Pharmacology, Biochemistry and Behavior. 132. 10–19. http://dx.doi.org/10.1016/j.pbb.2015. 02.018
Griffin, B. A. (2008). How relevant is the ratio of dietary n-6 to n-3 polyunsaturated fatty acids to cardiovascular disease risk? Evidence from the OPTILIP study. Current Opinion in Lipidology. 19:57-62
Grosso, G., Galvano, F., Marventano, S., Malaguarnera, M., Bucolo, C., Drago, F., et al. (2014). Omega-3 Fatty Acids and Depression: Scientific Evidence and Biological Mechanisms. Oxidative
Medicine and Cellular Longevity Volume 2014, Article ID 313570, 16 pages. http://dx.doi.org/10.1155/2014/313570
Guixà-González, R., Javanainen, M., Gómez-Soler, M., Cordobilla, B., Domingo, J C., Ferran Sanz, F., et al. (2016). Membrane omega-3 fatty acids modulate the oligomerisation kinetics of adenosine A2A and dopamine D2 receptors Scientific Reports. 6:19839. DOI: 10.1038/srep19839
Haghighi, F., Galfalvy, H., Chen, S., Huang, Y., Cooper, T. B., Burke, A. K., et al. (2015). DNA methylation perturbations in genes involved in polyunsaturated fatty acid biosynthesis associated with depression and suicide risk. Front. Neurol. 6:92. doi: 10.3389/ fneur.2015.00092
Harris, W. S. and Von Schacky, C. (2004). The Omega-3 Index: a new risk factor for death from coronary heart disease? Preventive Medicine. 212-220. doi: 10.1016/j.ypmed.2004. 02.030
Heinrichs, S. C. (2010). Dietary x-3 fatty acid supplementation for optimizing neuronal structure and function Mol. Nutr. Food Res, 54, 447–456 DOI 10.1002/mnfr.200900201
Hinrichsen, N. (2016). Commercially available alternatives to palm oil. Lipid Technology. Vol. 28, No. 3–4. DOI 10.1002/lite.201600018
Hofmann, S. G. and Asnaani, A. (2010). Cultural Aspects in Social Anxiety and Social Anxiety Disorder. Depress Anxiety. 27(12): 1117–1127. doi:10.1002/da.20759.
40
Holness, M. J., Greenwood, G. K., Smith, N. D. and Sugden, M. C. (2003). Diabetogenic Impact of Long-Chain ω-3 Fatty Acids on Pancreatic ß-Cell Function and the Regulation of Endogenous Glucose Production. Endocrinology 144(9):3958–3968. doi: 10.1210/en.2003-0479
Horrocks, L. A. and Yeo, Y. K. (1999). Health benefits of docosahexaenoic acid (DHA). Pharmacol Res. 40(3):211-25.
Huang, S. Y., Yang, H. T., Chiu, C., Pariante, C. M., Su, K. P. (2008). Omega-3 fatty acids on the forced-swimming test. Journal of Psychiatric Research 42. 58–63. doi:10.1016/ j.jpsychires.2006.09.004
Hunter, J. E. (2001). Studies on Effects of Dietary Fatty Acids as Related to Their Position on Triglycerides. Paper no. L8772 in Lipids 36, 655–668
Husted, K. S. and Bouzinova, E. V. (2016). The importance of n-6/n-3 fatty acids ratio in the major depressive disorder. Medicina 52. 139–147. http://dx.doi.org/ 10.1016/j.medici.2016. 05.003
Huth, P. J. and Park, K. M. (2012). Influence of Dairy Product and Milk Fat Consumption on Cardiovascular Disease Risk: A Review of the Evidence. Adv. Nutr. 3: 266–285, 2012; doi:10.3945/an.112.002030
Imran, M. and Nadeem, M. (2015). Triacylglycerol composition, physicochemical characteristics and oxidative stability of interesterified canola oil and fully hydrogenated cottonseed oil blends. Lipids
in Health and Disease. 14:138. DOI 10.1186/s12944-015-0140-0
Inoue, T., Okano, K., Tsuruta, Y., Tsuruta, Yu., Tsuchiya, K., Akiba, T., et al. (2015). Eicosapentaenoic Acid (EPA) Decreases the All-Cause Mortality in Hemodialysis Patients. Intern
Med. 54: 3133-3137. DOI: 10.2169/internalmedicine.54.4931
Iorfino, F., Hickie, I. B., Lee, R. S. C., Lagopoulos, J. and Hermens, D. F. (2016). The underlying neurobiology of key functional domains in young people with mood and anxiety disorders: a systematic review. BMC Psychiatry. 16:156. DOI 10.1186/s12888-016-0852-3
Jelinek, G. A., Hadgkiss, E. J., Weiland, T. J., Pereira, N. G., Marck, C. H. and van der Meer, D. M. (2013). Association of fish consumption and omega 3 supplementation with quality of life, disability and disease activity in an international cohort of people with multiple sclerosis. International
Journal of Neuroscience. 123(11): 792–801. DOI: 10.3109/00207454.2013.803104
Ji, X. W., Wu, C. L., Wang, X. C., Liu, J., Bi, J. Z. and Wang, D. Y. (2014). Monoamine neurotransmitters and fibroblast growth factor-2 in the brains of rats with post-stroke depression. Experimental and Therapeutic Medicine 8: 159-164. DOI: 10.3892/etm.2014.1674
Joris, P. J. and Mensink, R. P. (2016). Role of cis-Monounsaturated Fatty Acids in the Prevention of Coronary Heart Disease. Curr Atheroscler Rep. 18: 38. DOI 10.1007/ s11883-016-0597
Kaneko, J. J., Harvey, J. W., Bruss, M. L. (2008). Clinical Biochemistry of Domestic Animals, 6th Edition , Elsevier Inc.
Kessler, R. C. and Bromet, E. J. (2013). The epidemiology of depression across cultures. Annu Rev
Public Health. 34: 119–138. doi:10.1146/annurev-publhealth-031912-114409.
Khandelwal, S., Kelly, L., Malik, R., Prabhakaran, D. and Reddy, S. (2013). Impact of omega-6 fatty acids on cardiovascular outcomes: A review. J Preventive Cardiol. 2(3): 325–336.
Klenk, J., Keil, U., Jaensch, A., Christiansen, M. C. and Nagel, G. (2016). Changes in life expectancy 1950–2010: contributions from age- and disease- specific mortality in selected countries. Population Health Metrics. 14:20. DOI 10.1186/s12963-016-0089
41
Kodas, E., Galineau, L., Bodard, S., Vancassel, S., Guilloteau, D., Besnard, J. C. and Chalon, S. (2004). Serotoninergic neurotransmission is affected by n-3 polyunsaturated fatty acids in the rat. Journal of Neurochemistry. 89, 695–702. doi:10.1111/j.1471-4159.2004.02401
Kondreddy, V. K. R., Anikisetty, M., Naidu, K. A. (2016). Medium-chain triglycerides and monounsaturated fatty acids potentiate the beneficial effects of fish oil on selected cardiovascular risk factors in rats. J Nutr Biochem. 28:91-102. doi: 10.1016/ j.jnutbio.2015.10.005
Kremmyda, L. S., Tvrzicka, E., Stankova, B. and Zak, A. (2011). Fatty acids as biocompounds: their role in human metabolism, health and disease – A Review. Part 2: fatty acid physiplogical roles and applications in human health and disease. Biomed Pap Med Fac Univ Palacky Olomouc Czech
Repub. 155(3):195–218. DOI 10.5507/bp.2011.052
Lakhwani, L., Tongia, S. K., Pal, V. S., Agrawal, R. P., Nyati, P. and Phadnis, P. (2007). Omega-3 Ffattu acids have antidepressant activity in forced swimming test in wistar rats. Acta Poloniae
Pharmaceutica - Drug Research. Vol. 64 No. 3 pp. 271-276
Lee, J. M., Lee, H., Kang, S. B. and Park, W. J. (2016). Fatty Acid Desaturases, Polyunsaturated Fatty Acid Regulation, and Biotechnological Advances. Nutrients. 8, 23. DOI 10.3390/nu8010023
Levant, B. (2013). N-3 (Omega-3) Polyunsaturated Fatty Acids in the Pathophysiology and Treatment of Depression: Pre-clinical Evidence. CNS Neurol Disord Drug Targets. 12(4): 450–459
Lewinska, A., Zebrowski, J., Duda, M., Gorka, A, and Wnuk, M. (2015). Fatty Acid Profile and Biological Activities of Linseed and Rapeseed Oils. Molecules. 20, 22872–22880; doi:10.3390/ molecules201219887
Logan, A. C. (2003). Neurobehavioral Aspects of Omega-3 Fatty Acids: Possible Mechanisms and Therapeutic Value in Major Depression. Altern Med Ver. 8(4):410-425
Matthews, D. R., Hosker, J. P., Rudenski, A. S., Naylor, B. A., Treacher, D. F., Turner RC. (1985). Homeostasis model assessment: insulin resistance and beta-cell function from fasting plasma glucose and insulin concentrations in man. Diabetologia. 28:412–9
McNamara, R. K., Jandacek, R., Rider, T., Tso, P., Cole-Strauss and A., Lipton, J. W. (2010) Omega-3 fatty acid deficiency increases constitutive pro-inflammatory cytokine production in rats: relationship with central serotonin turnover. Prostaglandins Leukot Essent Fatty Acids. 83:185-191.
McNamara, R. K., Vannest, J. J., Valentine, C. J. (2015). Role of perinatal long-chain omega-3 fatty acids in cortical circuit maturation: Mechanisms and implications for psychopathology. World J
Psychiatr. 5(1): 15-34. DOI: 10.5498/wjp.v5.i1.15
Mensink, R. P., Zock, P. L., Kester, A. D. M. and Katan, M. B. (2003). Effects of dietary fatty acids and carbohydrates on the ratio of serum total to HDL cholesterol and on serum lipids and apolipoproteins: a meta-analysis of 60 controlled trials. Am J Clin Nutr. 77:1146–55.
Micha, R. and Mozaffarian, D. (2010). Saturated Fat and Cardiometabolic Risk Factors, Coronary Heart Disease, Stroke, and Diabetes: a Fresh Look at the Evidence. Lipids. 45:893–905. DOI 10.1007/s11745-010-3393-4
Minami, M., Kimura, S., Endo, T., Hamaue, N., Hirafuji, M., Togashi, H., et al. (1997). Dietary docosahexanoic acid increases cerebral acetylcholine levels and improves passive avoidance performance in stroke-prone spontaneously hypertensive rats. Pharmacol Biochem Behav. 58(4):1123-9.
42
Mizunoya, W., Ohnuki, K., Baba, K., Miyahara, H., Shimizu, N., Tabata, K., et al. (2013). Effect of dietary fat type on anxiety-like and depression-like behavior in mice. Springer Plus. 2:165. http://www.springerplus.com/content/2/1/165
Molfino, A., Gioia, G., Fanelli, F. R. and Muscaritoli, M. (2014). The Role for Dietary Omega-3 Fatty Acids Supplementation in Older Adults. Nutrients. 6, 4058-4072; doi:10.3390/nu6104058
Morgese, M. G. and Trabace, L. (2016). Maternal Malnutrition in the Etiopathogenesis of Psychiatric Diseases: Role of Polyunsaturated Fatty Acids. Brain Sci., 6, 24; doi:10.3390/ brainsci6030024
Noori, N., Dukkipati, R., Kovesdy, C. P., Sim, J. J., Feroze, U., Murali, S. B., et al., (2011). Dietary Omega-3 Fatty Acid, Ratio of Omega-6 to Omega-3 Intake, Inflammation, and Survival in Long-term Hemodialysis Patients. Am J Kidney Dis. 58(2): 248–256. doi:10.1053/j.ajkd.2011.03.017.
Orsavova, J., Misurcova, L., Ambrozova, J. V., Vicha, R. and Mlcek, J. (2015). Fatty Acids Composition of Vegetable Oils and Its Contribution to Dietary Energy Intake and Dependence of Cardiovascular Mortality on Dietary Intake of Fatty Acids. Int. J. Mol. Sci. 16, 12871-12890; doi:10.3390/ijms160612871
O’Sullivan, T. A., Hafekost, K., Mitrou, F. and Lawrence, D. (2013). Food Sources of Saturated Fat and the Association With Mortality: A Meta-Analysis. AmJ Public Health.103:e31–e42. doi:10.2105/AJPH.2013.301492
Park, Y., Moon, H. J. and Kim, S. H. (2012). N-3 polyunsaturated fatty acid consumption produces neurobiological effects associated with prevention of depression in rats after the forced swimming test . Journal of Nutritional Biochemistry 23. 924–928
Payne, C., Hedberg, E. C., Kozloski, M., Dale, W., and McClintock, M.K. (2014). Using and interpreting mental health measures in the National Social Life, Health, and Aging Project. Journals of
Gerontology, Series B: Psychological Sciences and Social Sciences, 69(8), S99–S116, doi:10.1093/geronb/gbu100
Pérez, M. A., Terreros, G. and Dagnino-Subiabre, A. (2013). Long-term ω-3 fatty acid supplementation induces anti-stress effects and improves learning in rats. Behavioral and Brain
Functions. 9:25. http://www.behavioralandbrainfunctions.com/content/ 9/1/25
Porsolt, R. D., Le Pichon, M., Jalfre, M. (1977). Depression: a new animal model sensitive to antidepressant treatments. Nature. 266(5604):730-2.
Pitychoutis, P. M., Sanoudou, D., Papandreou, M., Nasias, D., Kouskou, M., Tomlinson, C. R., et al. (2014).Forced swim test induces divergent global transcriptomic alterations in the hippocampus of high versus low novelty-seeker rats. Human Genomics. 8:4
Pusceddu, M. M., Kelly, P., Stanton, C., Cryan, J. F. and Dinan, T. G. (2016). N-3 Polyunsaturated Fatty Acids Through the Lifespan: Implication for Psychopathology. Int J
Neuropsychopharmacol. pii: pyw078. doi:10.1093/ijnp/pyw078. [in press]
Russell, F. D. and Bürgin-Maunder, C. S. (2012). Distinguishing Health Benefits of Eicosapentaenoic and Docosahexaenoic Acids. Marine Drugs. 10, 2535-2559; doi:10.3390/ md10112535
Russo, G. L. (2009). Dietary n S 6 and n S 3 polyunsaturated fatty acids: From biochemistry to clinical implications in cardiovascular prevention. Biochemical pharmacology. 77. 937–946. doi:10.1016/j.bcp.2008.10.020
43
Saada, H. N., Said, U. Z., Mahdy, E. M., Elmezayen, H. E., and Shedid, S. M. (2014). Fish oil omega-3 fatty acids reduce the severity of radiation-induced oxidative stress in the rat brain. International Journal of Radiation. 90:12. http://dx.doi.org/10.3109/ 09553002.2014.934928
Salem, N., Vandal, M. and Calon, F. (2015). The benefit of docosahexaenoic acid for the adult brain in aging and dementia. Prostaglandins, Leukotrienes and Essential Fatty Acids 92. 15–22. http://dx.doi.org/10.1016/j.plefa.2014.10.003
Simopoulos, A. P. (2006). Evolutionary aspects of diet, the omega-6/omega-3 ratio and genetic variation: nutritional implications for chronic diseases. Biomedicine & Pharmacotherapy. 60. 502–507. DOI: 10.1016/j.biopha.2006.07.080
Simopoulos, A. P. (2008). The omega-6/omega-3 fatty acid ratio, genetic variation, and cardiovascular disease. Asia Pac J Clin Nutr 2008;17 (S1):131-134
Siri-Tarino, P. W., Chiu, S., Bergeron, N. and Krauss, R. M. (2015). Saturated Fats Versus Polyunsaturated Fats Versus Carbohydrates for Cardiovascular Disease Prevention and Treatment. Annu Rev Nutr. 35: 517–543. doi:10.1146/annurev-nutr-071714-034449
Slattery, D. A. and Cryan, J. F. (2012). Using the rat forced swim test to assess antidepressant-like activity in rodents. Nature protocols. Vol.7, No.6. doi:10.1038/nprot. 2012.044
Song, C., Shieh, C. H., Wu, Y. S., Kalueff, A., Gaikwad, S. and Su, K. P. (2016). The role of omega-3 polyunsaturated fatty acids eicosapentaenoic and docosahexaenoic acids in the treatment of major depression and Alzheimer's disease: Acting separately or synergistically? Progress in Lipid Research 62. 41–54
Sublette, M. E., Galfalvy, H. C., Hibbeln, J. R., Keilp, J. G., Malone, K. M., Oquendo, M. A., et al. (2014). Polyunsaturated Fatty Acid Associations with Dopaminergic Indices in Major Depressive Disorder. Int J Neuropsychopharmacol. 17(3): 383–391. doi:10.1017/ S1461145713001399.
Steru, L., Chermat, R., Thierry, B. and Simon, P. (1985). The tail suspension test: a new method for screening antidepressants in mice. Psychopharmacology. 85(3): 367-70.
Stonehouse, W. (2014). Does Consumption of LC Omega-3 PUFA Enhance Cognitive Performance in Healthy School-Aged Children and throughout Adulthood? Evidence from Clinical Trials. Nutrients. 6, 2730-2758; doi:10.3390/nu6072730
Sun, Q., Ma, J., Campos, H., Hankinson, S. E., Manson, J. E., Stampfer, M. J., et al. (2007). A Prospective Study of Trans Fatty Acids in Erythrocytes and Risk of Coronary Heart Disease. Circulation. 115 (14):1858-65. DOI: 10.1161/CIRCULATIONAHA.106. 679985
Taha, A. Y., Cheon, Y., Faurot, K. F., MacIntosh, B., Majchrzak-Hong, S. F., Mann, J. D., et al. (2014). Dietary omega-6 fatty acid lowering increases bioavailability of omega-3 polyunsaturated fatty acids in human plasma lipid pools. Prostaglandins Leukot Essent Fatty Acids. 90(5): 151–157. doi:10.1016/j.plefa.2014.02.003
Tang, M., Jiang, P., Li, H., Liu, Y., Cai, H., Dang, R., et al. (2015). Fish oil supplementation alleviates depressant-like behaviors and modulates lipid profiles in rats exposed to chronic unpredictable mild stress. BMC Complementary and Alternative Medicine. 15:239. DOI 10.1186/s12906-015-0778-1
Tang, M., Zhang, M., Cai, H., Li, H., Jiang, P., Dang, R., et al. (2016). Maternal diet of polyunsaturated fatty acid altered the cell proliferation in the dentate gyrus of hippocampus and
44
influenced glutamatergic and serotoninergic systems of neonatal female rats. Lipids in Health and
Disease. 15:71. DOI 10.1186/s12944-016-0236-1
van Alphen, H. J. M., Volkers, K. M., Blankevoort, C. G., Scherder, E. J. A., Hortobágyi, T. and van Heuvelen, M. J. G. (2016). Older Adults with Dementia Are Sedentary for Most of the Day. PLoS
ONE. 11(3): e0152457. doi:10.1371/journal.pone. 0152457
van Reedt Dortland, A. K.B., Vreeburg, S. A., Giltay, E. J., Licht, C. M.M., Vogelzangs, N., van Veen, T., et al. (2013). The impact of stress systems and lifestyle on dyslipidemia and obesity in anxiety and depression. Psychoneuroendocrinology. 38, 209—218
Venna, V. R., Deplanque, D., Allet, C., Belarbi, K., Hamdane, M. and Bordet, R. (2009). PUFA induce antidepressant-like effects in parallel to structural and molecular changes in the hippocampus. Psychoneuroendocrinology. 34, 199-211. doi:10.1016/j.psyneuen.2008.08.025
Vines, A., Delattre, A. M., Lima, M. M. S., Rodrigues, L. S., Suchecki, D., Machado, R. B., et al. (2012). The role of 5-HT1A receptors in fish oil-mediated increased BDNF expression in the rat hippocampus and cortex: A possible antidepressant mechanism. Neuropharmacology 62. 184e191. doi:10.1016/ j.neuropharm.2011.06.017
Wang, L., Zhou, C., Zhu, D., Wang, X., Fang, L., Zhong, J., et al. (2016). Serotonin-1A receptor alterations in depression: a meta-analysis of molecular imaging studies. BMC Psychiatry. 16:319. DOI 10.1186/s12888-016-1025-0
Weissmann, D., van der Laan, S., Underwood, M. D., Salvetat, N., Cavarec, L., Vincent, L., et al. (2016). Region-specific alterations of A-to-I RNA editing of serotonin 2c receptor in the cortex of suicides with major depression. Transl Psychiatry. 6, e878; doi:10.1038/tp.2016.121
Werman, M. J., Sukenik, A., and Mokady, S. (2003) Effects of the Marine Unicellular Alga Nannochloropsis sp. to Reduce the Plasma and Liver Cholesterol Levels in Male Rats Fed on Diets with Cholesterol. Bioscience, Biotechnology, and Biochemistry. 67:10, 2266-2268, DOI: 10.1271/bbb.67.2266
Wibrand, K., Berge, K., Messaoudi, M., Duffaud, A., Panja, D., Bramham, C. R., et al (2013). Enhanced cognitive function and antidepressant-like effects after krill oil supplementation in rats. Lipids in Health and Disease. 12:6. http://www.lipidworld.com/content/12/1/6
Wu, H., Feng, J., Lv, W., Huang, Q., Fu, M., Cai, M., et al. (2016). Developmental Neurotoxic Effects of Percutaneous Drug Delivery: Behavior and Neurochemical Studies in C57BL/6 Mice. PLoS
ONE. 11(9): e0162570. doi:10.1371/journal.pone.0162570
Wurtman, R. J. (2014). A Nutrient Combination that Can Affect Synapse Formation. Nutrients. 6, 1701-1710; doi:10.3390/nu6041701
Yang, L.G., Song, Z.X., Yin, H., Wang, Y. Y., Shu, G. F., Lu, H. X., et al. (2016). Low n-6/n-3 PUFA Ratio Improves Lipid Metabolism, Inflammation, Oxidative Stress and Endothelial Function in Rats Using Plant Oils as n-3 Fatty Acid Source. Lipids. 51: 49. doi:10.1007/s11745-015-4091
Yu, Y., Wu, Y., Patch, C., Wu, Z., Szabo, A., Li, D., et al. (2013). DHA prevents altered 5-HT1A, 5-HT2A, CB1 and GABAA receptor binding densities in the brain of male rats fed a high-saturated-fat diet. Journal of Nutritional Biochemistry. 24 1349–1358. doi: 10.1016/j.jnutbio.2012.11.002
Zimmer, L., Delpal, S., Guilloteau, D., Aïoun, J., Durand, G., Chalon, S. (2000). Chronic n-3 polyunsaturated fatty acid deficiency alters dopamine vesicle density in the rat frontal cortex. Neuroscience Letters 284. 25-28. PII: S0304-3940(00)00950-2