Embed Size (px)
Citation preview

Neural Synchronization and Consciousness
Lawrence M. Ward Department of Psychology,
The Brain Research Centre, and Peter Wall Institute for Advanced Studies
University of British Columbia Professeur Etranger Invité, College de France
Funded by

Main points Synchronized neural network associated with perceptual consciousness Network augmented when consciousness changes Brain-wide rhythm of neural activity associated with consciousness arises from interaction of theta and gamma frequency brain oscillations. Evidence:
Previous studies Current analyses of synchronization between oscillations of activity, within and across frequency bands, in various brain loci, inferred from EEG data collected during an experiment in binocular rivalry.

Why study the neuroscience of consciousness? Consciousness is a fundamental aspect of human life. Understanding its neural correlates (NCC) is important for our knowledge of what it is to be human. Vital to understanding and dealing with syndromes like vegetative state, brain death, autism, and so forth. Will demystifying consciousness “ruin” it?

Karen Ann Quinlan’s Brain at Autopsy (see Kinney et al 1994)
Thalamus-massive loss Cortex-little loss
Karen Ann Quinlan – one face of vegetative state
Drug/alcohol reaction; permanent vegetative state for 14 years

Owen et al, 8 Sept 2006, Science
She is vegetative. Is she conscious? fMRI reveals “normal” activity – she could be locked in
Massive cortical deficiency (hydranencephaly) Cerebrospinal fluid

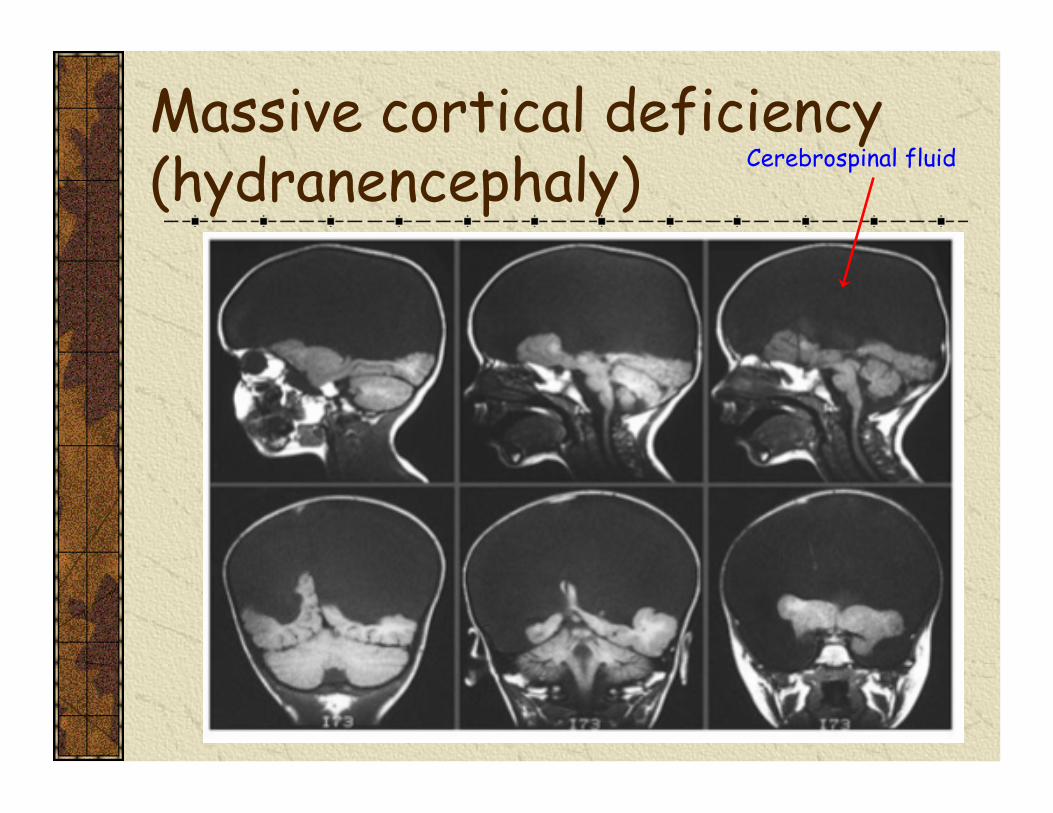
Conscious? (one study says yes)
Merker, BBS, 2006
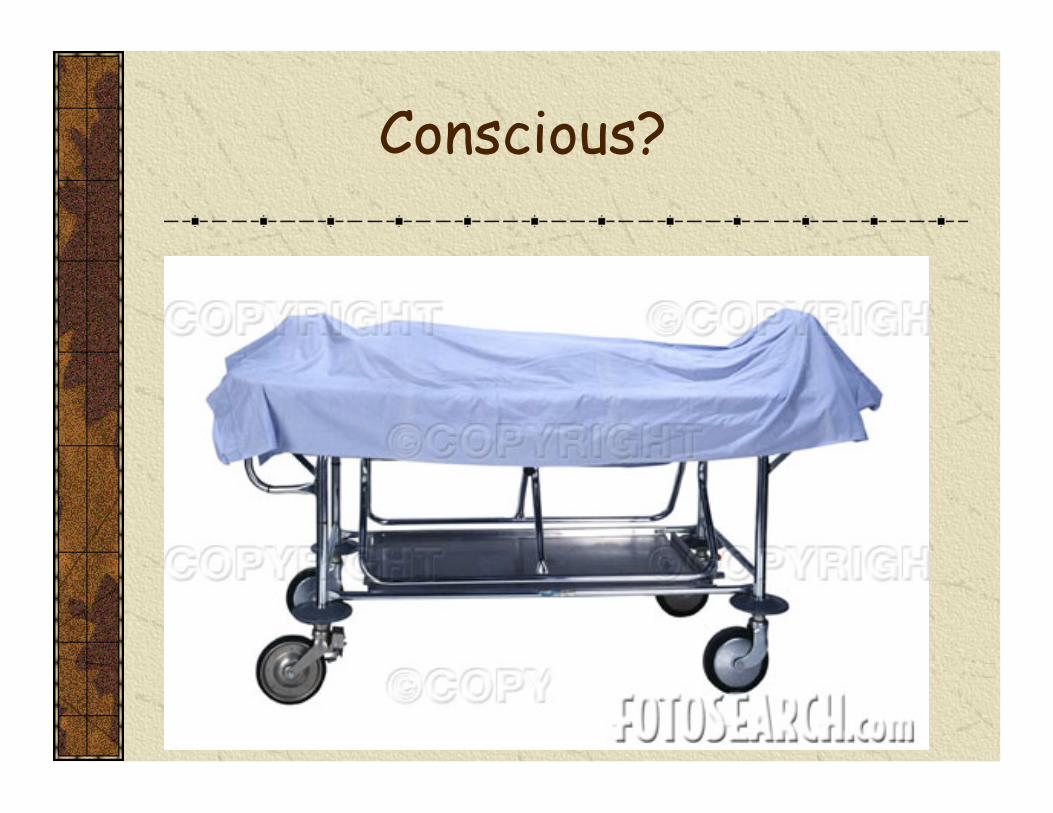
Conscious?

2
0
11 10 9 8 7 6 5 4 3 2 1 0
mg
per
100g
per
min
Healthy control Brain death Vegetative state
mg
per
100g
per
min
11 10 9 8 7 6 5 4 3 2 1 0
mg
per
100g
per
min
From Laureys, 2005, Nat Rev: Neuroscience
Brain death is “easy,” vegetative state is difficult
1
0
Glucose metabolism

Normal awake Surgical anesthesia Deep sleep
Vegetative state 1
Vegetative state 2
Recovered vegetative 2
After Laureys, 2005, TiCS
Glucose metabolism
But, we need to know more……
PET/metabolism useful in confirming brain death (need other tests too)
fMRI is helping (recent news stories) but activation not sufficient – consciousness likely depends on networks of active areas communicating (Changeux/Deheane?)
So….

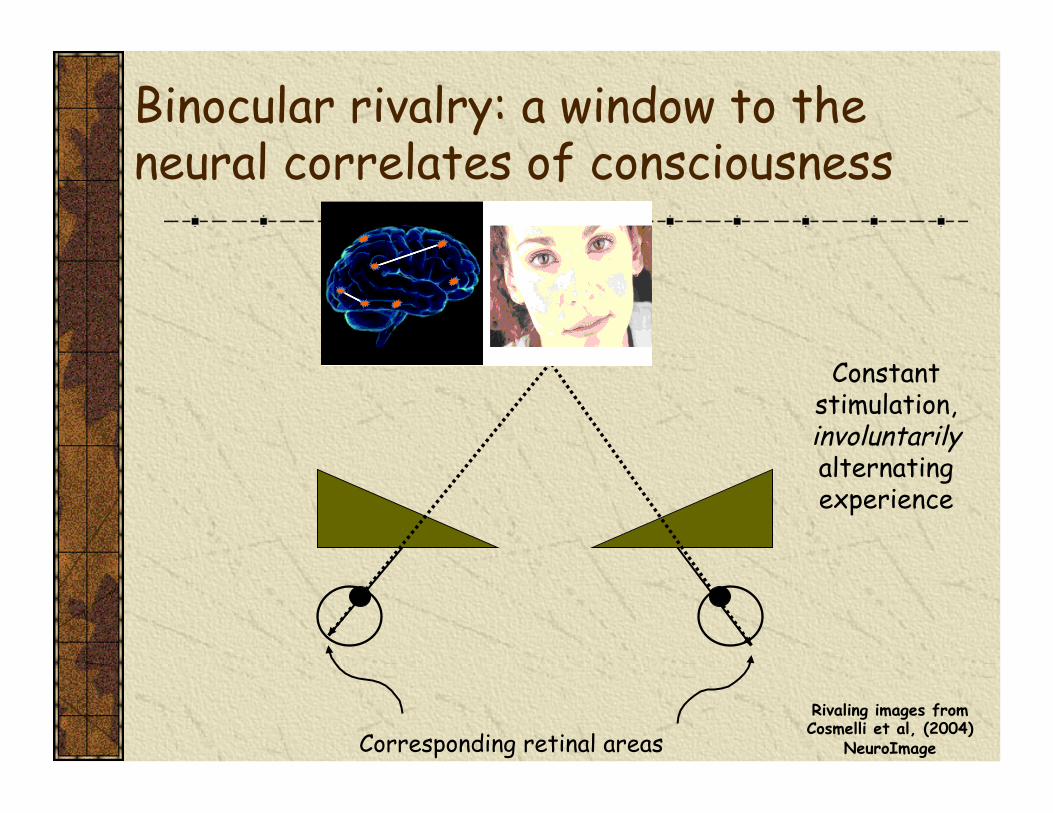
Binocular rivalry: a window to the neural correlates of consciousness
Corresponding retinal areas
Stimuli
Apparent locus of fused object Prisms
Eyes
Constant stimulation, involuntarily alternating experience
Rivaling images from Cosmelli et al, (2004)
NeuroImage

Neural synchrony occurs when neural activity, spiking or dendritic currents,
in disparate locations, rise(s) and fall(s) in a
fixed relationship
Gray & Singer’s cats
Ward etal’s humans
Varela et al, 2001

Neural synchrony and binocular rivalry (BR) Logothetis & Schall, 1989: single neuron
activity in monkey STS specific to seen image during BR
Fries et al 1997: demonstrated increased gamma-band (30-50 Hz) neural synchrony for seen vs suppressed drifting grating in cat early visual cortex
Tononi, Edelman et al 1997-1998: more scalp-wide MEG-sensor coherence at driven frequency of seen grating in humans
Cosmelli et al 2004: 5 Hz synchrony between diverse areas when 5 Hz driving stimulus seen by humans
Doesburg Kitajo & Ward 2005: endogenous gamma-band synchrony between diverse electrodes at change in awareness in humans
Binocular rivalry: a window to the neural correlates of consciousness
Corresponding retinal areas
Constant stimulation, involuntarily alternating experience
Rivaling images from Cosmelli et al, (2004)
NeuroImage

BR experiment: Rhythms of consciousness
(Doesburg, Green, McDonald & Ward, PLoS One, 2009)
64-channel EEG recorded at 500 Hz while 9 subjects viewed rivaling stimuli in 4-min blocks
Subjects ran for 2-6 hours depending on rivalry patterns Subjects pressed indicated button for butterfly or for maple leaves with fingers of
right hand when only that image seen; neither button for fragmented or blended image

Behavioral rivalry data
Analyzed only artifact-free epochs where stable percept followed button press for 700 ms or more
3281 such epochs (1805 left eye; 1476 right eye )
Gamma distibution

Gamma band activity (35-45 Hz) Gamma-band activity at
scalp fronto-central; more prominent on right side
Analyzed time windows indicated by solid rectangles relative to that indicated by dashed line (baseline)
Windows chosen based on previous work, esp. -220-280 ms re Doesburg et al, 2005, and gamma-power relationships.
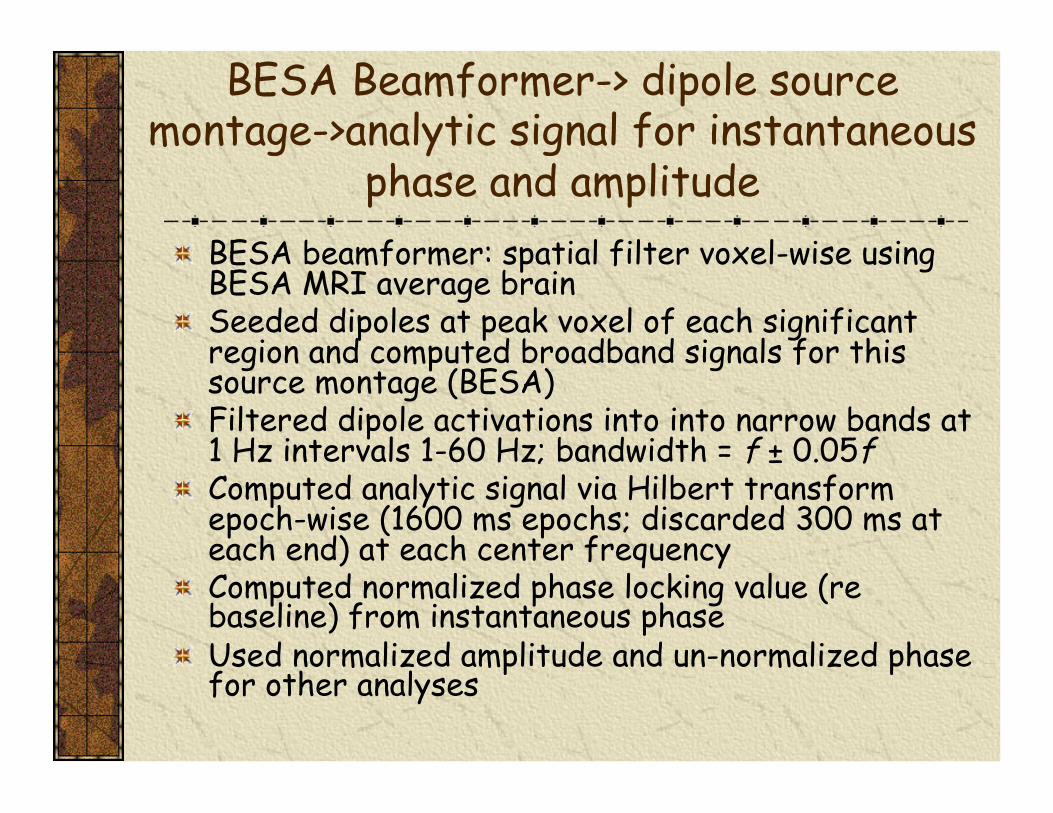
BESA Beamformer-> dipole source montage->analytic signal for instantaneous
phase and amplitude BESA beamformer: spatial filter voxel-wise using
BESA MRI average brain Seeded dipoles at peak voxel of each significant
region and computed broadband signals for this source montage (BESA)
Filtered dipole activations into into narrow bands at 1 Hz intervals 1-60 Hz; bandwidth = f ± 0.05f
Computed analytic signal via Hilbert transform epoch-wise (1600 ms epochs; discarded 300 ms at each end) at each center frequency
Computed normalized phase locking value (re baseline) from instantaneous phase
Used normalized amplitude and un-normalized phase for other analyses

amplitude phase
Step.2 instantaneous phase and amplitude
C3 O1 Fz
stimulus
(sec) (sec)
(sec)
EEG synchronization analysis: calculation of phase locking value (PLV)
Step.1 Obtain filtered signals f(t) via bandpass filtering at chosen frequencies
(sec)
10Hz
20Hz
30Hz
40Hz
stimulus
(sec)
(µV)
stimulus C3 O1 Fz
Cz
Pz
Fz F4 F3
C4
P4 P3
F7 F8
T6 T5
T3 T4
O1 O2
Fp1 Fp2
●
●
●
C3
€
where ˜ f (t) is Hilbert transform of f (t),
Broadband activity (PreC, PreCG, SFG)
PreC, PreCG, SFG
30 Hz (PreC, PreCG, SFG)
30 Hz (PreC, PreCG, SFG)
30 Hz (PreC, PreCG, SFG) PreC, PreCG, SFG

Analytic signal via Hilbert transform
Ward & Doesburg, 2009, in Handy (Ed) Brain Signal Analysis
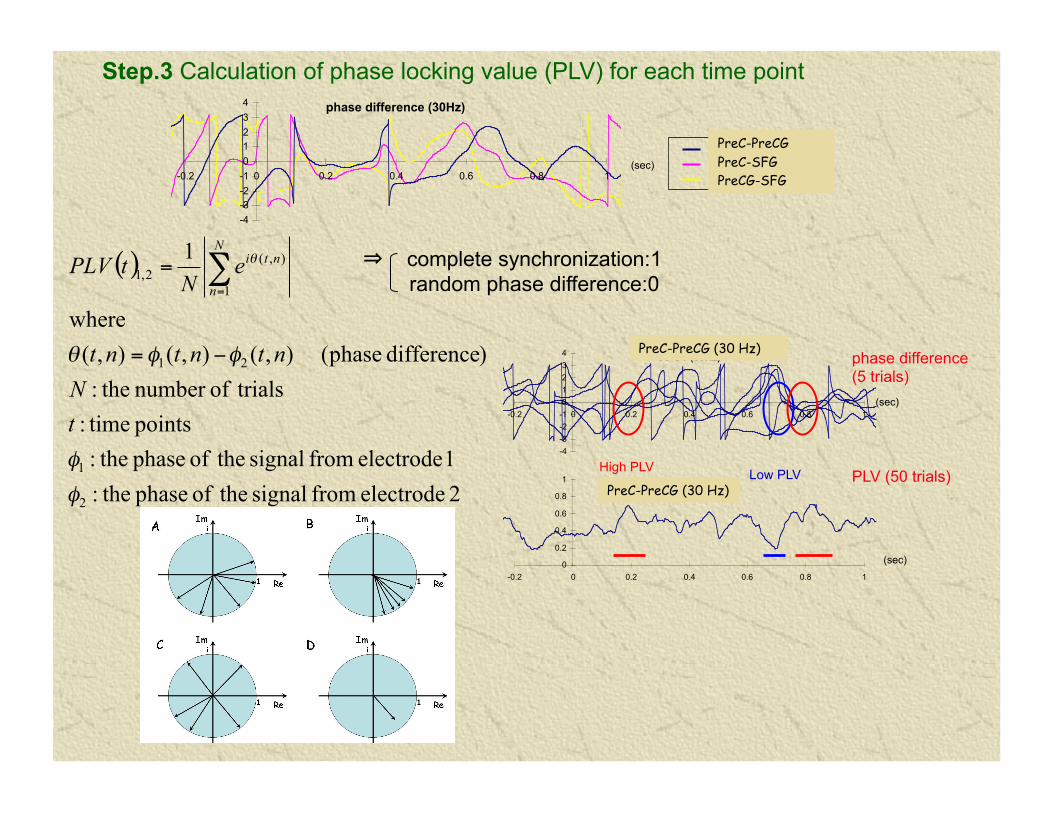
⇒ complete synchronization:1 random phase difference:0
( )
2 electrode from signal theof phase the:1 electrode from signal theof phase the:
points time: trialsofnumber the:
)difference phase( ),(),(),(where
1
2
1
21
1
),(2,1
φ
φ
φφθ
θ
tN
ntntnt
eN
tPLVN
n
nti
−=
= ∑=
Step.3 Calculation of phase locking value (PLV) for each time point
C3-O1 C3-Fz O1-Fz
(sec)
phase difference (30Hz)
-4
-3
-2
-1
0
1
2
3
4
-0.2 0 0.2 0.4 0.6 0.8 1
C3-O1 (30Hz)
-4
-3
-2
-1
0
1
2
3
4
-0.2 0 0.2 0.4 0.6 0.8 1
C3-O1 (30Hz)
0
0.2
0.4
0.6
0.8
1
-0.2 0 0.2 0.4 0.6 0.8 1
phase difference (5 trials)
(sec)
PLV (50 trials)
(sec)
High PLV Low PLV
PreC-PreCG PreC-SFG PreCG-SFG
PreC-PreCG (30 Hz)
PreC-PreCG (30 Hz)

C3-O1 (30Hz)
-6
-4
-2
0
2
4
6
-0.2 0 0.2 0.4 0.6 0.8 1
(400ms) period baseline in the PLV ofdeviation standard the:(400ms) period baseline in the PLV ofmean the:
Bsd
Bmean
PLVPLV
Step.4 standardization of PLV Standardized PLV
(sec)
( )Bsd
Bmean
PLVPLVPLVtPLVz −
=)(
To reduce the effect of volume conduction of stable sources and compare between electrode pairs at different distances
C3-O1 (30Hz)
-6
-4
-2
0
2
4
6
-0.2 0 0.2 0.4 0.6 0.8 1
Step.5 statistical test using surrogate data
Standardized PLV and surrogate PLV PLV (original)
±95 percentle PLVsurrogate
Median PLVsurrogate
(sec)
significant PLV increase
(Hz) 60
50
40
30
20
10
C3-O1
-0.2 0 0.2 0.4 0.6 0.8 1 (sec)
100 99 98
3-97 2 1 0
sync
desync
Note: Amplitude and long-range PLVz must change together for spurious synchronization to be indicated (Doesburg, Roggeveen, Kitajo, Ward, Cerebral Cortex, 2007)

Gamma-band consciousness network biSFG, biDLPFC, RPreC
and RPreCG active with some inter-regional synchrony at 540-600 ms constitute a consciousness maintenance network
RITG (visual pattern) and LPreCG (RH response) also active at 220-280 ms ⇒ switch of percept
Widespread synchrony in this network during perceptual switch

Rhythms of consciousness
Bursts of inter-regional synchrony roughly every 167-250 ms ⇒ 4-6 Hz rhythm
Bursts of intra-regional synchrony (local power) roughly every 167 ms ⇒ 6 Hz rhythm
Consistent with other consciousness results, e.g. attention blink strongest at T1-T2 interval of 225 ms ⇒ 4.4 Hz
Cross-frequency theta-gamma coupling?

Theta phase-gamma amplitude coupling Jagged red lines are gamma
amplitude Smooth black curves are one
theta cycle (theta phase) Thick black line is mean of
surrogates; thin lines are 2.5th and 97.5th percentiles of surrogates
Clearly gamma amplitude waxes and wanes with theta phase in most areas shown (does not in RDLPFC, biPreCG)
Gamma maximum not at theta trough as it is for 80-150 Hz gamma (Canolty et al, 2006)
Theta-gamma relationship differs in biSFG from the others by Π radians

Theta phase – gamma PLV coupling
Here jagged red lines are gamma PLV
Again, significant modulation of gamma PLV by theta phase
Again, different modulations in different pairs
Ten of 15 pairs modulated by at least one area’s theta phase, five by both (see Table 2 in paper)

Theta-theta phase coupling Here jagged red lines
are theta phase in y-axis area
Significant theta phase locking between all areas modeled
Implies phase-locked theta rhythm everywhere but not all same phase
Perceptual awareness, mediated by gamma synchrony, follows a theta rhythm

Take this home
Synchronized frontal-parietal gamma-band network associated with ongoing perceptual awareness
Change in perceptual awareness associated with augmented, more synchronized network
Gamma-band synchronization linked to theta cycle, the rhythm of consciousness

To come 25 May
4. le mardi 25 mai 2010 à 17 heures: The role of the thalamus in human consciousness