Embed Size (px)
Citation preview

Missouri University of Science and Technology Missouri University of Science and Technology
Scholars' Mine Scholars' Mine
Computer Science Faculty Research & Creative Works Computer Science
01 Jan 1994
Neural Network Diagnosis of Malignant Melanoma from Color Neural Network Diagnosis of Malignant Melanoma from Color
Images Images
Fikret Erçal Missouri University of Science and Technology, [email protected]
Hsi-Chieh Lee
William V. Stoecker Missouri University of Science and Technology, [email protected]
Randy Hays Moss Missouri University of Science and Technology, [email protected]
et. al. For a complete list of authors, see https://scholarsmine.mst.edu/comsci_facwork/157
Follow this and additional works at: https://scholarsmine.mst.edu/comsci_facwork
Part of the Computer Sciences Commons, and the Electrical and Computer Engineering Commons
Recommended Citation Recommended Citation F. Erçal et al., "Neural Network Diagnosis of Malignant Melanoma from Color Images," IEEE Transactions on Biomedical Engineering, Institute of Electrical and Electronics Engineers (IEEE), Jan 1994. The definitive version is available at https://doi.org/10.1109/10.312091
This Article - Journal is brought to you for free and open access by Scholars' Mine. It has been accepted for inclusion in Computer Science Faculty Research & Creative Works by an authorized administrator of Scholars' Mine. This work is protected by U. S. Copyright Law. Unauthorized use including reproduction for redistribution requires the permission of the copyright holder. For more information, please contact [email protected].
IEEE TRANSACTIONS ON BIOMEDICAL ENGINEERING. VOL. 41, NO. 9, SEYIEMBER 1994 837
Neural Network Diagnosis of Malignant Melanoma From Color Images
Fikret Ercal, Senior Member, IEEE Anurag Chawla, William V. Stoecker, Hsi-Chieh Lee, and Randy H. Moss, Senior Member, IEEE
Absh-act-Malignant melanoma is the deadliest form of all skin cancers. Approximately 32,000 new cases of malignant melanoma were diagnosed in 1991 in the United States, with approximately 80% of patients expected to survive five years [l]. Fortunately, if detected early, even malignant melanoma may be treated successfully. Thus, in recent years, there has been rising interest in the automated detection and diagnosis of skin cancer, par- ticularly malignant melanoma [2]. In this paper, we present a novel neural network approach for the automated separation of melanoma from three benign categories of tumors which exhibit melanoma-like characteristics. Our approach uses discriminant features, based on tumor shape and relative tumor color, that are supplied to an artificial neural network for classification of tumor images as malignant or benign. With this approach, for reasonably balanced trainindtesting sets, we are able to obtain above 80% correct classification of the malignant and benign tumors on real skin tumor images.
I. INTRODUCTION
ERMATOLOGY imaging researchers believe that diag- D nosis of skin tumors can be automated based on certain physical features and color information that are character- istic of the different categories of skin cancer. Diagnosis of malignant melanoma is a difficult task since other skin lesions can have similar physical characteristics. In many cases, dermatologists must perform a biopsy (a laboratory medical procedure) to ascertain whether a tumor is malignant or benign. Since this is a procedure that involves some expense and morbidity, particularly in patients with multiple atypical moles, alternative early detection techniques are being sought for rapid, convenient skin cancer screening. In this study, we use color images of skin tumors, image processing techniques, and an artificial neural network to distinguish melanoma from three benign pigmented tumors: dysplastic nevi, intradermal nevi and seborrheic keratoses. We first define those features that are expected to distinguish melanoma from the three other types of skin tumors, and then train an artificial neural network
Manuscript received February 12, 1993: revised April 19, 1994. This work was supported in part by the National Science Foundation under SBIR Phase I1 award number IS14521284 and the Intelligent Systems Center of the University of Missouri-Rolla.
F. Ercal is with the Department of Computer Science and the Intelligent Systems Center, University of Missouri-Rolla. Rolla, MO 65401 USA.
A. Chawla, W. V. Stoecker and H.-C. Lee are with the Department of Computer Science. University of Missouri-Rolla, Rolla, MO 65401 USA.
R. H. Moss is with the Department of Electrical Engineering and the Intelligent Systems Center, University of Missouri-Rolla. Rolla, MO 65401 USA.
IEEE Log Number 9403245.
with these features in an attempt to classify the tumor type as melanoma or not.
The characteristics of malignant melanoma and the three categories of benign tumors which are difficult to distinguish from melanoma are outlined below. These descriptions are brief and inherently inaccurate. They apply only to the most typical members of a diagnostic group.
Malignant Melanoma: Malignant melanoma is named after the cell from which it presumably arises, the melanocyte. Melanocytes are the skin cells which produce the dark protec- tive pigment called melanin, a natural sunscreen. Melanoma cells usually continue to produce melanin, which accounts for the cancers appearing in mixed shades of tan, brown and black (variegated coloring). Melanoma has a tendency to metastasize (spread), hence early detection and treatment are essential.
Friedman et al. have enumerated the mnemonic “ABCD” to describe early malignant melanoma [ 3 ] :
Asymmetry-One half of the tumor does not match the other half. Border Irregularity-The edges are ragged, notched, blurred. Color-Pigmentation is not uniform. Shades of tan, brown, and black are present. Dashes of red, white and blue add to the mottled appearance. Diameter-Greater than 6 mm and growing.
Dysplastic Nevi (dys nevi): Moles, or nevi, are tan or brown spots on the skin that result from a clustering of melanocytes. Certain unusual moles called dysplastic nevi are likely to undergo changes leading to melanoma. Scientists believe that individuals with dysplastic nevi, especially those from families with multiple cases of melanoma, represent one group of people that is more likely to develop melanoma. It is important to remember that, although the dysplastic nevus is the kind of mole most likely to undergo malignant changes, most dysplastic nevi do not become malignant.
The National Cancer Institute [4] has outlined the following characteristics for the detection of dysplastic nevi, lesions that may occur in both familial and nonfamilial settings, and are associated with a higher risk of malignant melanoma:
1) Color-Mixture of tan, brown, black and redpink. 2) Shape-Irregular borders that may include notches. May
fade into surrounding skin and include a flat portion level with the skin.
3) Surface-Smooth, slightly scaly, or have a rough pebbly appearance.
OOL8-9294/94$04.00 0 1994 IEEE

838 IEEE TRANSACTIONS ON BIOMEDICAL ENGINEERING, VOL. 41, NO. 9, SEPTEMBER 1994
4) Size-Often larger than 5 mm and sometimes larger than
Intradermal Nevi (Idn): These are benign tumors. Idn are most common in children and young adults and may be tan, brown, flesh or pink. These are commonly called moles and may be hairy. Dermatologists agree upon the following characteristics of Idn (modified from [4]):
10 mm.
1) Color-Flesh-colored, pink, may be tan or brown. 2) Shape-Round or oval, may fade gradually into the
surrounding skin. 3) Surface-Often smooth, sometimes papillomatous, and
raised. Skin markings are present when examined with a hand lens.
4) Size-Usually less than 6 mm in diameter. Seborrheic Keratoses (sk): These are benign tumors found
in older persons, with patients usually older than forty. They are benign growths of the epidermis (outer layer of the skin) with the following clinical characteristics (modified from [4]):
1) Color-Tan to brown, may be fleshy or pink, darker in persons with darker skin.
2) Shape-Borders often oval or round but may be ir- regular, often sharply demarcated but in fair persons gradually fading into surrounding skin.
3) Surface-Rough, verrucous, sometimes with keratin plugs. Skin markings are almost always enhanced, even if the surface is not rough. The raised surface and frequently sharp border lead to the appellation “stuck- on.” The tan to yellowish color combined with the stuck-on appearance is sometimes called “tallow-drop.’’
4) Size-3-30 mm or more, usually 5-15 mm. 5 ) Location-Seborrheic keratoses are usually located on
These descriptions indicate that melanoma and the above categories of benign tumors differ slightly in their physical characteristics and colors. If any automated approach is to suc- ceed in diagnosing melanoma, a collection of these features, rather than a single feature, needs to be used in order to obtain a satisfactory classification of the tumor images belonging to one of these categories. Indeed, this fact is also reflected by Figs. 1 and 2, obtained after processing and examining 326 digital images of skin growths of the above-mentioned categories ( 1 36 melanomas, 47 dysplastic nevi, 87 intradermal nevi and 56 seborrheic keratoses). These figures show some statistical data on the distribution of percentages of tumors within each class, with respect to irregularity and asymmetry indices (to be explained later). Fig. 1 shows that there is a strong correlation between irregularity index and the diagnosis of melanoma. To substantiate our observations, we also tried to obtain a statistical correlation value between these features and the diagnosis of melanoma. Among many measures to compute the strength of association between variables, the Pearson correlation [5] is one of the most widely used. The Pearson correlation coefficient varies between -1 and +l. A Pearson correlation of 0 indicates that neither of two variables can be predicted from the other by using a linear equation. A correlation of 1 indicates that one variable can be predicted perfectly by a positive linear function of the
the face, neck and trunk.
e 40
t- r
g 30 5 c - 8 20 L a a
10
0 11, 1.1) [1.1, 1.2) [1.2, 1.3) [1.3, 1.4) [1.4, +)
Irregularity Index [min, max)
0 idn sk m dys.nevi me1
Fig, 1. Percentages of tumors having different irregularity indices.
,=a 40
p 35
30
”ij 25 c
2 20
; 15 C
m a 10
5
n
[O, 4) ’ [4, 8) 7[6, 12) ’[12, 16)’[16, 20)720, +) Percent Asymmetry [min, max)
10 idn sk m dys. nevi me1
Fig. 2. Percentages of tumors having different asymmetry indices.
other, and vice versa. And a value of -1 indicates the same, except that the function has a negative sign for the slope of the line [ 5 ] . We obtained the Pearson’s correlation matrix for irregularity index, asymmetry index and their correlation with melanoma. Correlation values as high as 0.416 and 0.389 were found between melanoma and irregularity, and melanoma and asymmetry, respectively. Correlation between asymmetry and melanoma is reflected in Fig. 2. Our results also indicated a strong correlation between asymmetry and irregularity.
We also note that these indices alone are not sufficient in making a precise diagnosis for melanoma since many benign tumors have irregularity and asymmetry indices which are as high as those for melanoma. A combination of a number of pertinent features, rather than a few features, is needed for diagnostic decisions.
When diagnosing skin cancer, dermatologists base their clin- ical diagnostic decisions on experience, as well as on complex inferences and extensive pathophysiological knowledge. Such experience cannot be condensed into a small set of relations, and this limits the performance of algorithmic approaches of many clinical tasks. The breadth of clinical knowledge is an obstacle to the creation of symbolic knowledge bases comprehensive enough to cope with diverse exceptions which occur in practice. Experience-based learning is the property
ERCAL et al.: NEURAL NETWORK DIAGNOSIS OF MALIGNANT MELANOMA 839
of artificial neural networks which makes them ideal for diagnostic applications, such as the one above. Using the indices described above, as well as color information, a neural network should be able to learn and gain experience about the malignant melanoma diagnosis problem. The ability to select pertinent features for a particular problem on their own is an edge which neural networks possess over expert systems when solving such diagnosis problems. They are limited, of course, to those features that experimenters select.
In the following section, we give a brief introduction to artificial neural networks as pattern classifiers and explain the traininghesting approach for classification. In Section 111, we describe our approach to diagnosing melanoma and the selection and derivation of the features used for this purpose. Experimental results and discussion are given in Section IV.
11. ARTIFICIAL NEURAL NETWORKS As PATTERN CLASSIFIERS
In recent years, neural networks have been used as pat- tern classifiers in medical diagnosis [6], [7], speech [8] and pattem recognition [9], and artificial intelligence applications. This trend has been accelerated by the availability of high- speed computers with large amounts of processing power and memory. There is an increasing interest in the use of neural networks to solve a variety of problems in many areas of medicine and engineering. Adaptive nonparametric neural-net classifiers work well for many real-world problems. These classifiers frequently provide reduced error rates when compared to more conventional statistical approaches and are a powerful and flexible means for mapping a fixed number of inputs into a set of discrete classes. These characteristics make artificial neural networks a strong candidate for diagnostic problems where a set of symptoms is mapped to a set of pos- sible diagnostic classes. In our research, we are motivated by the desire to classify skin tumors as malignant or nonmalignant from color photographic slides of the tumors, and to further explore how we can add learning to this diagnostic process in order to automatically classify skin tumors correctly.
In our application, it is necessary to classify digital images of tumors into a small number of fixed categories. Feedfor- ward neural networks are ideally suited for this purpose. The type of network that best fits our diagnosis application is a multilayered feedforward neural network trained using the generalized delta rule (backpropagation training algorithm). Backpropagation neural networks fall into the group of hy- perplane classifiers [lo]. Nodes in this network typically form a weighted sum of the inputs and pass this sum through a sigmoidal nonlinearity. Other nonlinearities, including high- order polynomials of the inputs, can also be used. In this study, the hyperbolic tangent function is used to map the sum of the weighted inputs to the output of a neuron. The network is trained with supervision using a gradient-descent training technique, called backpropagation, which minimizes the squared error between actual outputs of the network and the desired outputs. The backpropagation classifier has been successfully used for many pattem recognition applications including speech recognition [8], bone fracture healing assess- ment [ 1 11, and handwriting recognition [ 121. In our system,
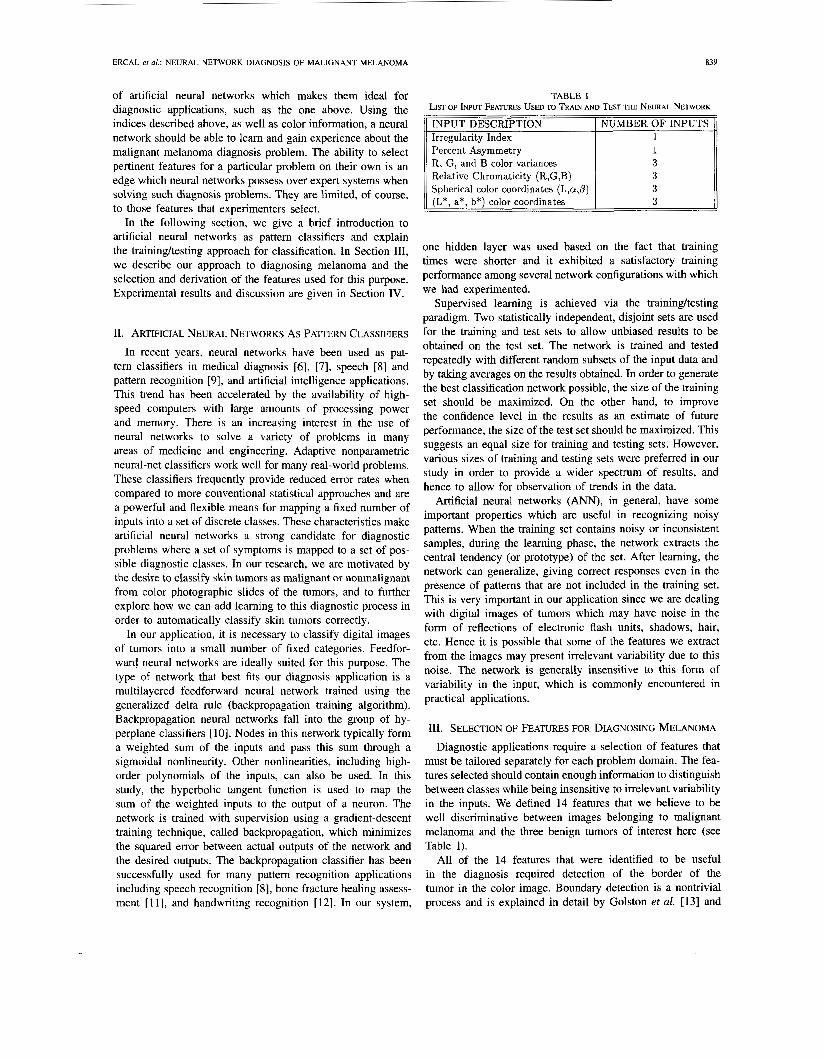
TABLE I LIST OF h U T FEATURES USED TO TRAIN AND TEST THE NEURAL NETWORK
INPUT DESCRIPTION 1 NUMBER OF INPUTS Irregularity Index 1 Percent Asymmetry R, G, and B color variances Relative Chromaticity (R,G ,B) Spherical color coordinates (L,cy,p) (L*, a*, b*) color coordinates 3
one hidden layer was used based on the fact that training times were shorter and it exhibited a satisfactory training performance among several network configurations with which we had experimented.
Supervised learning is achieved via the trainingtesting paradigm. Two statistically independent, disjoint sets are used for the training and test sets to allow unbiased results to be obtained on the test set. The network is trained and tested repeatedly with different random subsets of the input data and by taking averages on the results obtained. In order to generate the best classification network possible, the size of the training set should be maximized. On the other hand, to improve the confidence level in the results as an estimate of future performance, the size of the test set should be maximized. This suggests an equal size for training and testing sets. However, various sizes of training and testing sets were preferred in our study in order to provide a wider spectrum of results, and hence to allow for observation of trends in the data.
Artificial neural networks (ANN), in general, have some important properties which are useful in recognizing noisy pattems. When the training set contains noisy or inconsistent samples, during the learning phase, the network extracts the central tendency (or prototype) of the set. After learning, the network can generalize, giving correct responses even in the presence of pattems that are not included in the training set. This is very important in our application since we are dealing with digital images of tumors which may have noise in the form of reflections of electronic flash units, shadows, hair, etc. Hence it is possible that some of the features we extract from the images may present irrelevant variability due to this noise. The network is generally insensitive to this form of variability in the input, which is commonly encountered in practical applications.
111. SELECTION OF FEATURES FOR DIAGNOSING MELANOMA
Diagnostic applications require a selection of features that must be tailored separately for each problem domain. The fea- tures selected should contain enough information to distinguish between classes while being insensitive to irrelevant variability in the inputs. We defined 14 features that we believe to be well discriminative between images belonging to malignant melanoma and the three benign tumors of interest here (see Table I).
All of the 14 features that were identified to be useful in the diagnosis required detection of the border of the tumor in the color image. Boundary detection is a nontrivial process and is explained in detail by Golston et al. [13] and

840 IEEE TRANSACTIONS ON BIOMEDICAL ENGINEERING, VOL. 41, NO. 9, SEPTEMBER 1994
Ercal et al. [141. Since automated boundary identification at present is successful in determining borders accurately on only 80% of tumors [14], boundaries are identified manually by a dermatologist for this study, as erroneous boundaries can cause errors by including background skin within the tumor border or by causing omission of some tumor area. After the boundary of the tumor area is determined, the next step is to compute the indices corresponding to each feature needed for diagnosis. This section provides a brief description of the selected features, as well as the methodology used to extract them from the color skin images.
Malignant melanoma is characterized partially by the irregularity in its tumor border. For this study, we measured irregularity by an index I = & where, P = perimeter of the tumor in pixels and A = area of the tumor in pixels. The irregularity index for a circle is one (perfectly regular). Irregularity indices obtained after processing and examining 326 digital images belonging to the four tumor categories used in this study are shown in Fig. 1. Most melanomas have a high irregularity index, i.e., they have an irregular shape. However, there is a significant percentage of other tumors with high irregularity indices. Hence, this feature alone is not sufficient to discriminate melanoma from benign types of tumors.
Asymmetry is another characteristic of malignant melanoma. Asymmetry is computed by first finding the principal axis of inertia of the 2-D tumor shape in the tumor image [15]. This axis will be the axis of symmetry of the tumor if the shape is perfectly symmetrical. Since tumors are not perfectly symmetrical, percent asymmetry is computed by overlapping the two halves of the tumor along the principal axis of inertia and dividing the nonoverlapping area differences of the two halves by the total area of the tumor. Asymmetry indices obtained after processing 326 digital images in the four tumor categories used in this study are shown in Fig. 2. We found that 88% of the melanomas in our database of images have an asymmetry percentage above 8%, whereas this figure is 47%, 62%, and 55% for the intradermal nevi, seborrheic keratoses, and dysplastic nevi, respectively.
Color: One of the most predictive features in identification of malignant melanoma is variegated coloring (VC) [l], [16]. Dermatologists define variegated coloring as the swirling together of tan, brown, red and black, giving the tumor a varied coloring. Such variegation in color implies a high variance in red (R), green (G) and blue (B) color components. Therefore, out of the 12 color features to be used, three of them are selected to be the variances in the R, G and B color planes. Since dysplastic nevi may also turn into melanoma, they also have high variances in these planes, but the other benign tumors have lower variances in the RGB planes (they do not exhibit variegated coloring). Pearson correlation with the diagnosis of melanoma for these three variances (R, G and B) was obtained on the same set of 326 digital images mentioned earlier, and found to be 0.473, 0.304, and 0.13 1, respectively.
In addition to variances, relative chromaticity of tumors (in the RGB planes) are also added to the feature list, since these features are important in discriminating melanoma from sebor- rheic keratoses and intradermal nevi. The relative chromaticity
Irregularity Index:
Percent Asymmetry:
of a color is defined as the normalized value of that color in the tumor area subtracted from the normalized value for the color in the background. For example, the relative chromaticity of red is defined as
- T b g Rred = rt + bt + gt T b g + bbg + g b g
where rt , gt and bt denote tumor RGB components and r b g , Qbg and bbg denote background RGB components. The selection of this feature is motivated by the relative color concept, useful in differentiating between different tumor colors [16]. The idea of this concept is to measure the color of the tumor relative to the color of the surrounding skin. The relative color was defined as the color difference vector, i.e., difference in the color space between the tumor and the background, or normal flesh. Reasons behind the development of a relative color concept are stated by Umbaugh [16] as follows: 1) to equalize any variations caused by lighting, photography/printing or digitization process, 2) to equalize variations in normal skin color between individuals, and 3) the human visual system works on a relative color system. For the 326-image database described earlier, Pearson correlation coefficients for these relative color features were found to be small (0.022, -0.073, and 0.035 for R, G, and B, respectively) when the measurements were taken in the presence of dysplastic nevi images. In the absence of dysplastic nevi images (326 - 47 = 279 images), correlation coefficients turned out to be higher, yielding the values 0.193, -0.261, and -0.107, respectively. This indicated that relative color features provide less discriminating power between melanoma and dysplastic nevi.
Previous studies in diagnosing melanoma [16] with an expert system indicate that spherical color space coordinates give better diagnosis results than the RGB, CIE (Commission International de 1'Eclairage) or IHS (Intensity/Hue/Saturation) color spaces. Therefore, we also added these indices into our set of input features. The equations to transform from (R, G, B) to spherical coordinates are given by [ 161
L = JR2 + G2 + B2; Angle a = cosp1 . [:I- L x (sin(Ang1e " 1 a ) ) '
Angle /3 = c0s-l
This transformation splits the color space into a 2-D color space, represented by two angles, Angle (Y and Angle p; and a 1-D intensity (brightness) space, represented by the vector length L. To compute L, Angle a and Angle p for each tumor image, we found L, Angle a and Angle p for each of the pixels in the tumor and took an average of them.
From the viewpoint of color clustering, it is desired that the image be represented by color features which constitute a space possessing uniform characteristics, such as the (L* , a*, b*) color coordinate system [ 171. Since seborrheic keratoses and intradermal nevi are lighter in color than melanoma and dysplastic nevi, they have distinct values in this color space. Dermatology imaging researchers also believe that this space may be useful in distinguishing melanoma from dysplastic nevi due to small differences in lightness, hue and

ERCAL et al.: NEURAL NETWORK DIAGNOSIS OF MALIGNANT MELANOMA 84 1
chroma between dysplastic nevi and melanoma (according to dermatologists, dysplastic nevi are brighter and have less blue, i.e., relatively more red components). In our research, lightness, hue and chroma are computed for each point in the tumor using the formulas given by Celenk [17], and then an average is taken for all the pixels in the tumor. Magnitude of the Pearson correlation coefficients for the last six color features given above were all between 0.1 and 0.4 for the 326- image database described earlier. Among all the correlation coefficients, variance in red, with a value of 0.473, had the highest correlation with melanoma.
Iv. DIAGNOSIS OF MALIGNANT TUMORS USING A NEURAL NETWORK
For the research reported here, discriminant features ex- plained above were extracted from 326 digital images of skin cancer: 136 melanoma, 47 dysplastic nevi, 87 intradermal nevi and 56 seborrheic keratoses images. All images were 512 x 512-pixel color images with 24 bits per pixel (8 bits for each of the R, G and B planes). Color photographic slides were obtained from New York University, Department of Dermatology, and from Dr. Stoecker’s private practice. Both Kodachrome and Ektachrome photographs were used. Images were digitized using a Gould DeAnza IP 8400 image processing system, and a monochrome NEC TI-23A CCD video camera with red, green and blue color filters. A macro lens was used in photographing the slides lit with a daylight- balanced fluorescent light box (Aristo DA-IO) so that the 35 mm slides filled the field of view of the camera. Some images were later digitized with a Solbourne Series 51600 SUN-compatible file server and an Androx ICs 4008A image processing board, using the same camera, filters and light box as before.
A. Neural Network Implementation
A feedforward artificial neural network with 14 inputs (see Table I) and one output (indicating whether the tumor is malignant melanoma or not) was used and trained using the backpropagation rule. Commercial neural network software, called Neuralworks, was used on a SUN SparcstatiordlO platform.
One major characteristic of backpropagation classifiers is long training times. Training times are typically longer when complex decision regions are required and when networks have more hidden layers. In this study, only one hidden layer was used, based on the fact that it performed reasonably well among several network configurations with which we had experimented and also produced results fast. In the first of the two experiments conducted. a neural network configuration with 14 input neurons, 7 hidden neurons and 1 output neuron gave the best diagnostic results within a reasonable time. In Experiment 2, optimum results were obtained with a neural network configuration having 8 input and 4 hidden neurons, and 1 output neuron. For each run, all weights were randomly initialized between 0 and 1 . In fewer than 5% of the runs, the network did not converge within an hour, in which case the training was repeated by reinitializing the weights
and randomizing the input order of the training set once again. This process was repeated until the network converged. Typical training times varied between 40 and 60 min on the Sparcstation in a time-sharing environment. Training of the network was continued with several epochs of the training set until the root mean squared error of the output was below 0.1. Testing was done and the success rates for the correct diagnosis of melanoma as melanoma and nonmelanoma as nonmelanoma were recorded. Results were obtained for train- ingltesting percentages of 20180, 40160 and 60140.
B. Experimental Design and Test Results
The experiments were designed to test the effectiveness of the input features in discriminating the melanoma images from the others. Two sets of experiments were conducted and each set was repeated; once with dysplastic nevi included and another time with dysplastic nevi excluded, resulting in a total of four experiments. Those experiments with dysplastic nevi included used a total of 240 images (120 melanomas, 40 dysplastic nevi, 40 intradermal nevi and 40 seborrheic keratoses), while those with dysplastic nevi excluded used 216 images (108 melanomas, 54 intradermal nevi and 54 seborrheic keratoses) for training plus testing. ANN theory and practice suggests that, in a diagnostic application, the network should be trained with a balanced mixture of inputs from each diagnostic class [18]. Since, in our experiments, the primary focus for training was to be able to distinguish melanoma from benign tumors, 50% of the training and testing images were obtained from the melanoma category. The remaining 50% of the images were evenly divided among the images of other benign tumor categories. Varying numbers were used for each class in order to maximally utilize the images available in the database for training and testing while, at the same time, keeping a good balance of different types of tumor images. When X% of images was used for training, the remaining images (100-X%) were used for testing. Each class of tumors contributed the same percentage of its total number to the training and test sets; i.e., melanoma images always formed 50% of the both sets. Experiments differed from one another by the set of input features used. The first set of experiments was conducted with the 14 input features originally described, and tested the effectiveness of these features in the diagnosis of melanoma. The second set of experiments was designed to test the effects of the use of different film types in the diagnosis process. In these experiments, to offset the effects of the different films used, the spherical color space coordinates and ( L * , a* , b*) color coordinates were removed from the input set, leaving only those color features related to the relative color concept (color variances and the relative color). Hence, only eight input features were used in this phase. For all experiments, results were obtained for trainingltesting per- centages of 20180, 40160 and 60140, and each experiment was repeated with five different, randomly-selected traininghesting groups. Mean, maximum (max), minimum (min) and standard deviation (STD) values for the results of each experiment for each pair of trainingltesting percentages are reported in the Tables 11, 111 and IV. Evaluation of the results is done in three

842
Exp. No.
IEEE TRANSACTIONS ON BIOMEDICAL ENGINEERING, VOL. 41, NO. 9, SEPTEMBER 1994
Melanoma success rates for different trainingltesting percentages 20180 1 40160 60140
Mean I Max I Min I STD 11 Mean I Max 1 Min I STD 11 Mean I Max Min I STD
TABLE I1 NEURAL NETWORK DIAGNOSTIC RESULTS: OVERALL SUCCESS RATES
Exp. No.
Overall success rates for different trainingltesting percentages
Mean I Max [ Min I STD 11 Mean I Max 1 Min 1 STD ( 1 Mean 1 Max 1 Min 1 STD
Non-melanoma success rates for different trainingltesting percentages
Mean I Max I Min I STD 11 Mean I Max I Min I STD 11 Mean I Max I Min 1 STD 20180 II 40160 60140
different categories: overall success rates (Table II), percentage of correct positive diagnosis (Table 111) and percentage of correct negative diagnosis (Table IV). To illustrate how these percentages are calculated, consider the following example: There are a total of 240 images used in Experiment 1; 120 melanomas, 40 dysplastic nevi, 40 intradermal nevi and 40 seborrheic keratoses. For the 20/80 case, 20% of the images are used for training and the remaining 80% are used for testing, giving a total of 48 images for the training set and 192 images for the testing set. In the testing set, there will be (80% x 120) = 96 melanomas, and (192-96) = 96 nonmelanomas (always 50% of the testing set is melanomas and the remaining 50% is nonmelanomas). If 81 out of 96 melanomas are correctly diagnosed, then the percentage of true positives (the melanoma success rate) is 81/96 = 84.4% and the number of false negatives (melanomas diagnosed as benign lesions) can be calculated as (96 - 84.4% x 96) = 15. If 74 out of 96 nonmelanomas are correctly diagnosed as nonmelanomas, then the percentage of true negatives (the nonmelanoma success rate) is 74/96 = 77.1% and the number of false positives (benign lesions diagnosed as melanomas) can be calculated as (96 - 77.1% x 96) = 22. The overall success rate in this case turns out to be (81+74)/192 = 80.7%.
Summaries of the experiments are given in the following sections.
Experiments 1A and IB: Experiment 1A was conducted with all four classes: melanoma, intradermal nevi, dysplastic nevi and seborrheic keratoses, while dysplastic nevi images were removed from Experiment 1B. A total of 240 and 216 images were used altogether for training plus testing for Experiments 1A and 1B, respectively, with 14 input features supplied per image.
In Experiment lA, for the 60% training percentage, a maximum success rate of 95.8% was obtained for melanomas, while the mean success rate was close to 80%. Mean success rate for correct negative diagnosis (nonmelanoma) was 86.3%. When all the four categories were considered, mean success rate approached 83%. The relatively higher number of false negatives is believed to be due to the fact that dysplastic nevi are precursors of melanoma and they possess the same var- iegation of coloring as melanomas. This fact is substantiated by Experiment 1B in which the experiment above is repeated after removing the dysplastic nevi images from the training and testing sets. In Experiment lB, the results improve appreciably (first column in the second row of Table 111) for melanoma with average successful diagnosis rate not below 82.1% for any

ERCAL et al.: NEURAL NETWORK DIAGNOSIS OF MALIGNANT MELANOMA 843
traininghesting combination, peaking at 90.7% for the 60% training percentage. When we compare the first two rows of the Table IV, we do not observe a similar behavior in the results for the benign (nonmelanoma) categories. A mixed set of results is obtained for this case. These observations support our original hypothesis that dysplastic nevi are precursors of melanoma and they possess the same variegation of coloring as melanomas. Hence, elimination of the dysplastic nevi images from the training set made the classification job easier for the network and the number of false negatives was reduced considerably. As a result, the overall performance (the second row in Table 11) was improved considerably in all columns of the table.
Experiments 2A and 2B: The same procedure used for Ex- periment 1 was repeated for this set of experiments except that 8 input features were used instead of 14. The goal was to test the effect of the types of film used. In our image database, the majority of melanoma and dysplastic nevi slides were Ektachrome, while a majority of the seborrheic keratoses and intradermal nevi slides were Kodachrome. To offset the effect of the different film types used, absolute color components in the input, namely the spherical color space coordinates and (L* , U*, b*) color coordinates, were removed from the input set, leaving only those color features related to the relative color concept (color variances and the relative color). Hence, only eight input features were used in this phase. Obviously, elimination of all of the absolute color information from the input is expected to cause the success rate to go down due to the degradation of the discriminant features in the input. However, we should not expect a significant change from the previous results, which would otherwise be interpreted as being due to the film type. Comparing the results of Experiment 1A with Experiment 2A and the results of Experiment 1B with Experiment 2B, we can see from Table I1 that the change in the mean overall success rates is never more than 4%. However, from Table 111, the mean melanoma success varied by almost 7% in one case. From Table IV, the mean nonmelanoma success varied by no more than 2.6%, in any case. Apparently, the use of absolute color features decreases the number of false negatives, but makes much less of a difference in the number of false positives. This may be due to the importance of absolute color information in the diagnostic process, particularly from the viewpoint of color clustering (shades of tan, brown and black, and dashes of red, white and blue are signs of malignancy), and to the importance of the information contained in the lightness vector of the spherical transform. It is not clear, however, if the absolute color information which is adding to the diagnostic accuracy is from the tumor colors themselves, or if it is partially due to the subtle color balance differences of the different film types. Part of our future research efforts will be directed toward careful testing and understanding of the role played by both absolute color features and relative color features and their importance in the diagnostic process.
V. CONCLUSION
A fast and effective method to separate malignant melanoma from benign tumors is becoming increasingly needed due to
the fact that the incidence of malignant melanoma has risen dramatically in recent years and early detection can save thousands of lives each year. In this study, we attempted to diagnose melanoma from color skin images using an artificial neural network. For this purpose, a set of features to distinguish melanoma from three other types of benign tumors was defined and methods to measure these features from digitized color slides were described. Overall, diagnostic results were found to be very promising, and as high as 86% accuracy in detecting malignant melanoma was achieved using training data sets of reasonable size (see Experiment 1B). As a result of this study, the following results are confirmed experimentally: a) Color characteristics of tumors play a crucial role in the diagnosis process, b) tumor asymmetry and border irregularity are two important diagnostic features for distinguishing malignant melanoma from benign tumors such as seborrheic keratoses, dysplastic nevi and intradermal nevi, and c) malignant melanoma and dysplastic nevi images exhibit some similarities, and therefore testing for tumor malignancy in the absence of dysplastic nevi images gives better diagnostic results. The last result, c), is confirmed by the decrease in false negatives in the second part, b), of each experiment. The definition and understanding of the concept of dysplastic nevi have, since the initiation of this study, been revised. Dysplastic nevi are not a single diagnostic classifica- tion but rather a varied set. Some dysplastic nevi probably represent early melanomas and others represent stable but atypical compound or intradermal nevi. In particular, patients with the dysplastic nevus syndrome have many atypical but stable lesions. The real challenge is to discriminate lesions which pose a threat to the patient from those that do not. In this study, we used dermatopathologist biopsy results to determine diagnostic classes. Long term follow-up along with biopsy reports could provide more meaningful data, as even panels of dermatopathologists may disagree on biopsy results, particularly regarding pigmented lesions such as dysplastic nevi and melanomas. Our results showing poor separation of some dysplastic nevi from malignant melanomas are consistent with this finding of dysplastic nevi representing an overlap of diagnostic categories. Further study will be needed for better understanding of this concept.
Since the slides used in this study were obtained from various sources and photographed with varying magnifications, we could only roughly estimate tumor size from the images. Including these manual estimates of size in the feature set did not improve diagnostic accuracy. Tumor size, or diameter (the D of ABCD), was accordingly omitted from our key feature list. Texture features [ 191 may be useful in diagnoses, but rapid and accurate texture analysis techniques do not yet exist for application to skin tumors.
Could results obtained in this study apply if a neural network were to be used for routine screenings for malignant melanoma? In actual screenings of patients for melanoma, the prior probability for malignant melanoma varies with factors such as the prevalence of malignant melanoma in a given population and who in the population attends the screening. The melanoma prevalence varies, but is much lower than our experimental prevalence of 50%. For a screening population
844 IEEE TRANSACTIONS ON BIOMEDICAL ENGINEERING, VOL. 41, NO. 9. SEPTEMBER 1994
with an expected lower melanoma prevalence, for the same accuracy as displayed in this set, specificity in melanoma diagnosis could be very high, while sensitivity would be similar to the accuracy for the melanoma set found here (86% for Experiment IB).
Our technique is based on digitized photographs. Future research will help determine whether accuracy in diagnosis of digitized photographs is comparable to accuracy of in vivo direct cutaneous video digitization. Actual in vivo diagnosis is performed using tactile and stereo sensory perception to obtain information about texture and elevation. Contribution of these features to diagnosis remains to be studied.
ACKNOWLEDGMENT
The Allied Signal Computer Laboratory in the Electrical Engineering Department at the University of Missouri-Rolla was used for computation. We gratefully acknowledge the technical assistance of Kathy Whyte, Rob P. McLean and Sam Mehmert of the Electrical Engineering Department, and Madhav Moganti of the Computer Science Department, at the University of Missouri-Rolla, and Inder P. S. Dhillon, M.D. and William Slue of the New York University Medical Center Skin and Cancer Hospital.
REFERENCES
R. J. Friedman, D. S. Rigel, M. K. Silverman, A. W. Kopf and K. A. Vossaert, “Malignant melanoma in the 1990’s: The continued importance of early detection and the role of physician examination and self- examination of the skin,” Ca-A J. Clinicians, vol. 41, pp. 201-226, July/Aug. 1991. W. V. Stoecker and R. H. Moss, “Editorial: Digital imaging in derma- tology,” Computerized Med. Imag. Graphics. vol. 16(3), pp. 145-150, May-June 1992. R. J. Friedman, D. S. Rigel, A. W. Kopf, “Early detection of malignant melanoma: The role of physician examination and self-examination of the skin,” Ca-A Cancer J. Clinicians, vol. 35(3), pp. 13C151, 1985. National Cancer Institute, What You Need to Know Abour Dysplastic Nevi, NIH Publication 91-3133, Reprinted Oct. 1990. L. Wilkinson, SYSTAT: The System For Statistics. Evanston, IL: SYS- TAT, Inc., 1990, p. 50. M. L. Astion and P. Wilding, “Application of neural networks to the interpretation of laboratory data in cancer diagnosis,” Clinical Chemistry, vol. 38, no. 1, pp. 34-38, 1991. R. Poli, S. Cagnoni, R. Livi, G. Coppini and G. Valli, “A neural network expert system for diagnosing and treating hypertension,” IEEE Comput. Mag., vol. 24, no. 3, pp. 64-71, Mar. 1991. R. P. Lippmann, “Review of neural networks for speech recognition,” Neural Comp., vol. ](I) , pp. 1-38, 1989. T. Kohonen, G. Bama and R. Chrisly, “Statistical pattern recognition with neural networks: Benchmarking studies,” in Proc. IEEE Annu. Int. Cont Neural Networks, San Diego, CA. vol. I, pp. 61-68. July 1988. R. P. Lippman, “Pattern classification using neural networks,” IEEE Commun. Mag., vol. 27, no. 11 , pp. 47-64, Nov. 1989. J. J. Kaufman, A. Chiabrera, M. Hatem, N. Z . Hakim, M. Figueiredo, P. Nasser, S. Lattuga, A. A. Pilla and R. S. Siffert, “A neural network approach for bone fracture healing assessment,’’ IEEE Eng. Med. Biologji Mag., vol. 9, pp. 23-30, Sept. 1990. G. L. Martin and J. A. Pittman, “Recognizing handprinted letters and digits,” in Proc. IEEE Con$ Neural Inform. Processing Syst.. San Mateo, CA, pp. 405414, Nov. 1990. J. E. Golston, R. H. Moss and W. V. Stoecker, “Boundary detection in skin tumor images: An overall approach and a radial search algorithm,” Pattern Recognition, vol. 23, no. 1 I , pp. 1235-1247, 1990. F. Ercal, M. Moganti, W. V. Stoecker and R. H. Moss, “Boundary detection and color segmentation in skin tumor images,” IEEE Trans. Med. Imag., vol. 12, no. 3, pp. 624-627. Sept. 1993. W. V. Stoecker, W. W. Li and R. H. Moss, “Automatic detection of asymmetry in skin tumors,’’ Comput. Med. Imag. and Graphics, vol. 16(3), pp. 191-197, 1992.
S. E. Umbaugh, “Computer vision in medicine: Color metrics and image segmentation methods for skin cancer diagnosis,” Ph.D. dissertation, Elect. Eng. Dep., Univ. Missouri-Rolla, Rolla, MO: UMI Dissertation Services, Ann Arbor, MI, 1990. M. Celenk, “A color clustering technique for image segmentation,” Compur. Vision, Graphics and Image Processing, vol. 52, pp. 145-170, 1990. J. A. Freeman and D. M. Skapura, Neural Networks: Algorithms, Applications, And Programming Techniques. Reading, MA: Addison- Wesley, 1991, p. 103. W. V. Stoecker, C. S. Chiang and R. H. Moss, “Texture in skin images: Comparison of three methods to determine smoothness,” Computerized Med. /mag. Graphics, vol. 16(3), pp. 179-190, 1992.
Fikret Ercal (S’85-M’88-SM’94) received the B.S. (with highest honors) and M.S. degrees in elecmcal engineering from the Technical University of Istan- bul, and the Ph.D. degree in computer science from Ohio State University in 1988 He was a scholar of the Turkish Scientific and Technical Research Council during 197 1 -I 988
Between 1988-1990, he was an Assistant Profes- sor at Bilkent University, Turkey. He is currently an Assistant Professor at the University of Missouri- Rolla, Computer Science Department and jointly a
Research Investigator at the University of Missoun-Rolla Intelligent Systems Center, where he conducts interdisciplinary research. His research interests are parallel computing, neural networks, fuzzy logic and medical imaging
Dr. Ercal is a member of Phi Kappa Phi
Anurag Chawla received the B.S. degree in computer science from the Regional Eng. College, Kuruskhetra in 1991 and the M.S. degree from the University of Missouri-Rolla in 1993.
He worked as a Research Assistant during 1990-1991. His research interests lie in automated diagnosis using neural networks and parallel computer architectures.
William V. Stoecker received the B.S. degree in mathematics from Caltech in 1968, the M.S. de- gree in systems science from UCLA in 1970, and the M.D. degree from the University of Missouri- Columbia in 1977.
He is a practicing Dermatologist, Clinical As- sistant Professor of Internal Medicine-Dermatology at the University of Missouri-Columbia where he is also Director of Dermatology Informatics, and Adjunct Assistant Professor of Computer Science at the University of Missouri-Rolla. He is Chairman
of the American Academy of Dermatology Task Force on Computer Data Base Development, which has developed diagnostic and therapeutic software for dermatologists. He is Vice-chairman of the Sulzberger Institute for Dermatologic Education. He is President of Stoecker and Associates which develops medical computer vision systems. His interests include artificial intelligence in medicine. computer vision in medicine and diagnostic problems in dermatology.
ERCAL er al.: NEURAL NETWORK DIAGNOSIS OF MALIGNANT MELANOMA 845
Hsi-Chieh Lee was bom in Kinmen, Taiwan, in 1967. He received the B.S. degree in mathematics from the National Taiwan University, Taipei, in 1989 and the M.S. degree in computer science from the University of Missouri-Rolla in May 1994.
Between 1989 and 1991, he worked for Meditech Research and Development Corporation, as a Net- work System Engineer and a Research and Devel- opment Leader. He has been a Graduate Research Assistant in the Departments of Electrical Engi- neering and Computer Science at the University of
Missouri-Rolla since 1993. He is interested in parallel computing, neural networks, and fuzzy logic.
Randy H. Moss (M’SGSM’92) received the B.S.E.E. and M.S.E.E. degrees in electncal engineering from the University of Arkansas where he was a National Ment Scholar and the Ph.D. degree from the Universitv of Illinois. where he was a NSF Graduate Fellow.
He is currently a Professor of Electncal Engineenng at the University of Missoun-Rolla. His research interests are in the areas of image processing, pattern recognition and computer vision. He is especially interested in medical and industnal
applications of machine vision techniques. He serves as an Associate Editor of Pattern Recognition and Computerized Medical Imaging and Graphics.
Dr Moss IS a member of Sigma Xi, the Pattern Recognitlon Society, Eta Kappa Nu, Tau Beta Pi and Phi Kappa Phi